Embed Size (px)
Citation preview

FRENCH COMMERCIAL REAL ESTATE CURRENT MARKET AND OUTLOOK
22TH APRIL 2015

1. OFFICE MARKETS IN ILE DE FRANCE

3
STOCK: ZOOM ON PARIS ET INNER SUBURDS
Paris Centre West 8.6 M sq m
Rest of Paris 8.1 M sq m
Total Paris 16.7 M sq m
La Défense 3.3 M sq m
Western Crescent 8.7 M sq m
Inner Rim 6.4 M sq m
Total Paris + Inner Rim
+ Western Crescent
+ La Défense
35.2 M sq m
Total Ile-de-France 55.5 M sq m
Source : ORIE / CBRE

4
OFFICE MARKET DYNAMICS IN PARIS REGION

5
TAKE UP Q1 2015 – PARIS REGION
,500,000 sq m
1,000,000 sq m
1,500,000 sq m
2,000,000 sq m
2,500,000 sq m
3,000,000 sq m
00 01 02 03 04 05 06 07 08 09 10 11 12 13 14 15
Q1 Q2 Q3 Q4
Q1 2014 : 508,900 sq m - 662 deals
Q1 2015 : 372,500 sq m - 665 deals
Source : CBRE / Immostat / ORIE
6
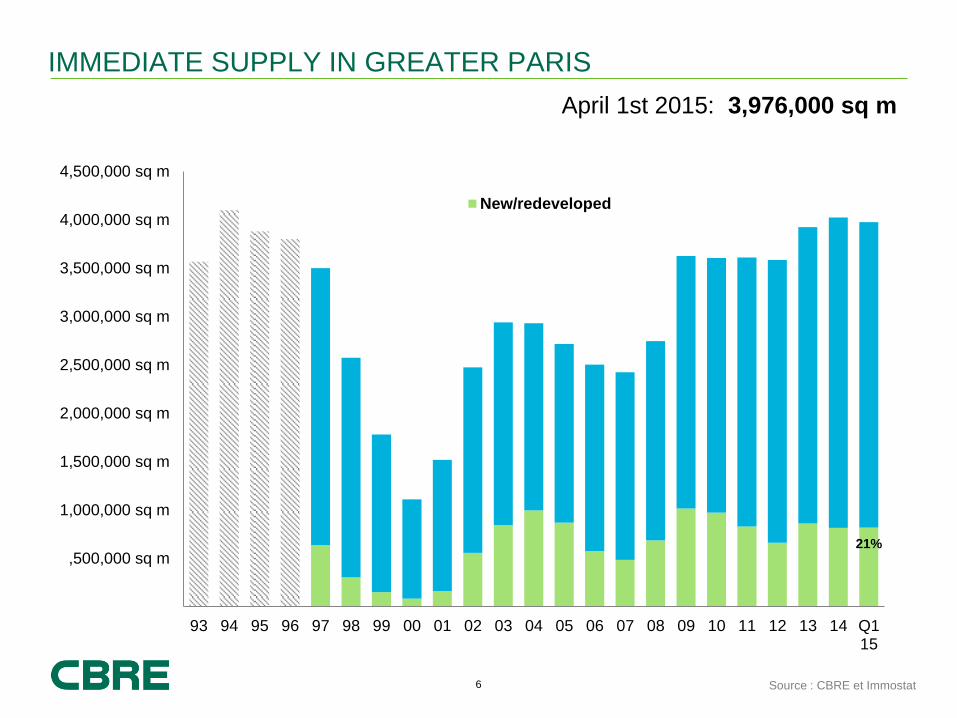
IMMEDIATE SUPPLY IN GREATER PARIS
21% ,500,000 sq m
1,000,000 sq m
1,500,000 sq m
2,000,000 sq m
2,500,000 sq m
3,000,000 sq m
3,500,000 sq m
4,000,000 sq m
4,500,000 sq m
93 94 95 96 97 98 99 00 01 02 03 04 05 06 07 08 09 10 11 12 13 14 Q115
New/redeveloped
April 1st 2015: 3,976,000 sq m
Source : CBRE et Immostat
7
5.2 %
5.7 %
9.6 %
10.9 %
11.5 %
11.7 %
14.8 %
3.8 %
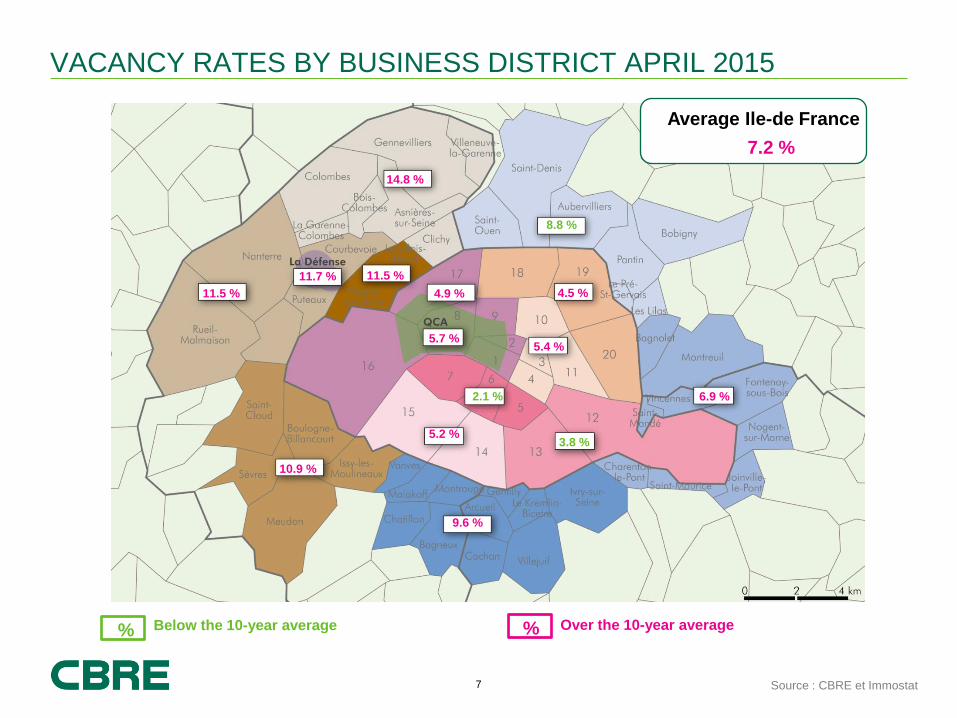
% Below the 10-year average Over the 10-year average
%
Average Ile-de France
7.2 %
8.8 %
4.5 %
5.4 %
6.9 % 2.1 %
4.9 %
11.5 %
VACANCY RATES BY BUSINESS DISTRICT APRIL 2015
Source : CBRE et Immostat

8
TRENDS IN AVERAGE PRIME RENTS
549 503
762
691
625
698 750
716
664
734 771 707
687
695
305
432
455 486
478
401
502
441 442
498 495
351
457
610
497
430 456
422
462
430 438
459 456
248
239
360
297 300
316
298 301
297 296 297
0
100
200
300
400
500
600
700
800
900
93 94 95 96 97 98 99 00 01 02 03 04 05 06 07 08 09 10 11 12 13 14 Q115
Paris CBD La Défense
Western Crescent Average weighted Ile-de-France
Methodological note: before 2001, average prime rents correspond to the highest transaction value registered on top-of-the-range buildings, except atypical transaction.
Since 2001, prime rents correspond to the weighted average of the 10 highest transactions in terms of rental values, registered during the 6 preceding months and concerning surfaces
over or equal to 500 sq m
HEADLINE RENTAL VALUES IN CURRENT € NET/SQ. M PA, AT PERIOD END
Source : CBRE

2. INVESTMENT MARKET

10
€0 bn
€5 bn
€10 bn
€15 bn
€20 bn
€25 bn
€30 bn
2000 2001 2002 2003 2004 2005 2006 2007 2008 2009 2010 2011 2012 2013 2014 2015
Q1 Q2
FRANCE - COMMERCIAL REAL ESTATE VOLUMES INVESTED
Ma
rch
é d
e l’In
ve
stisse
me
nt e
n F
ran
ce
Sources : CBRE et Immostat
2014: €24.1 B
Q1 2014: €4.0 B / Q1 2015: €4.3 B
+10% YoY

11
DEAL SIZE
Q1 2014
Sources : CBRE et Immostat
38 opérations
18 opérations
21 opérations
250 opérations
Q1 2015
Average deal size Q1 2014: €230.3 M / Nb of transactions: 131 Average deal size Q1 2015: €53.1 M / Nb of transactions : 82
+10% in volume/ - 37 % in nb of transactions YoY
€100 -200 M€
96 deals 15.6%
21 deals 17.1%
6 deals 10.7%
6 deals 18.8%
2 deals 37.8%
> €200 M
46 deals 8.4%
14 deals 9.8%
9 deals 16.2%
5 deals 15.7%
8 deals 49.9%
€25–50 M €50-100 M < €25 M
12
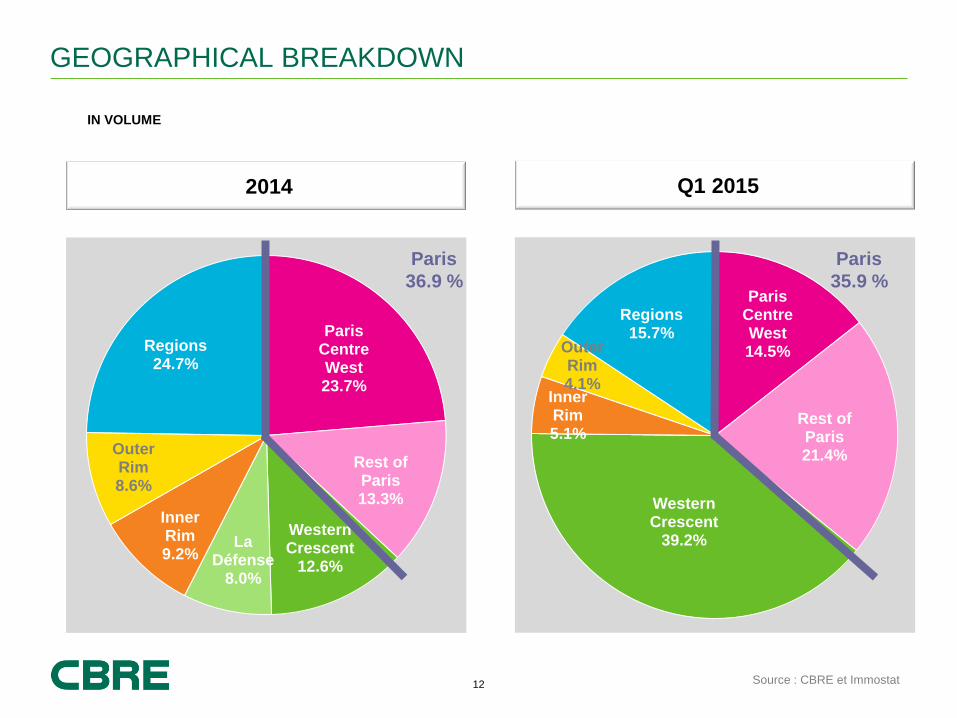
GEOGRAPHICAL BREAKDOWN
Paris Centre West 23.7%
Rest of Paris 13.3%
Western Crescent
12.6%
La Défense
8.0%
Inner Rim 9.2%
Outer Rim 8.6%
Regions 24.7%
Source : CBRE et Immostat
Q1 2015 2014
Paris
36.9 % Paris
Centre West 14.5%
Rest of Paris 21.4%
Western Crescent
39.2%
Inner Rim 5.1%
Outer Rim 4.1%
Regions 15.7%
Paris
35.9 %
IN VOLUME

13
TYPE OF PRODUCTS
Q1 2015 2014
Source: CBRE et Immostat
76.6%
2.9%
20.5%
65.6% 7.6%
26.8%
VOLUME (EXCLUDING MULTI-PURPOSE AND MULTI-ASSET PORTFOLIOS)
Industrial / logistics Retail Offices

14
2,000 sq m
4,000 sq m
6,000 sq m
8,000 sq m
10,000 sq m
12,000 sq m
14,000 sq m
16,000 sq m
18,000 sq m
20,000 sq m
22,000 sq m
05 06 07 08 09 10 11 12 13 14 Q1 2015
Av. des Champs Elysées Avenue Montaigne
Rue St Honoré Rue de Rennes/bd St Germain (Rive Gauche)
Rue des Francs Bourgeois (Le Marais)
TREND IN PRIME RENTS ON THE MAIN SHOPPING STREETS IN PARIS
+ 130%
+ 275%
+ 78%
+ 140%
Change 2005-Q1 2015
+ 203%
(ITZA IN € NET/SQ M PA)

15
RETAIL INVESTMENT VOLUMES
0%
5%
10%
15%
20%
25%
30%
€0 bn
€1 bn
€2 bn
€3 bn
€4 bn
€5 bn
€6 bn
€7 bn
03 04 05 06 07 08 09 10 11 12 13 14 Q1 15
French Investment
Foreign investment
Share of retail in Frenchdirect RE investments
Sources : CBRE et Immostat

16
FRANCE LOGISTIC TAKE UP ET RENTAL VALUES
,500,000 sq m
1,000,000 sq m
1,500,000 sq m
2,000,000 sq m
2,500,000 sq m
3,000,000 sq m
08 09 10 11 12 13 14 15
Q1 Q2 Q3 Q4
Annual average:
2,526,900 sq m
* Nord-Pas de Calais, Ile-de-France, Rhône-Alpes, PACA regions
Sources: CBRE et Immostat
714,400 sq m
+44%
1Q1 2015: 714,400 sq m
81% located on the North-South route*
Headline rents A Class
€30 / €60 net/sq m pa

17
Sources : CBRE et Immostat
LOGISTICS/INDUSTRIAL INVESTMENT VOLUMES
€0 bn
€1 bn
€2 bn
€3 bn
€4 bn
2004 2005 2006 2007 2008 2009 2010 2011 2012 2013 2014 1T 2015
Industrial spaces Logistics

18
BREAKDOWN BY STRATEGY
TRANSACTIONS > €50 M, IN VOLUME
Source : CBRE et Immostat
Q1 2015 2014
66.6%
26.2%
7.2%
67.8%
16.3%
15.9%
« Core + » « Value added / opportunistic» « Core »

19
BREAKDOWN BY NATIONALITY
0%
10%
20%
30%
40%
50%
60%
70%
2000 2001 2002 2003 2004 2005 2006 2007 2008 2009 2010 2011 2012 2013 2014 Q12015
Source : CBRE
IN VOLUME
French 44,3%
Middle East 11.3%
German 7.4%
North-American 18.4%
British 4.0 % Asian 5.4%

20
COMPARED CHANGE IN YIELDS
0%
1%
2%
3%
4%
5%
6%
7%
8%
9%
93 94 95 96 97 98 99 00 01 02 03 04 05 06 07 08 09 10 11 12 13 14 Q115
Prime office yields* Paris CBD
OAT TEC 10
Euribor 3 months
3,75 %
0,02%
0,46 %
Negative real risk premium
Explosion of financing costs
Real estate risk
premium above
Floor to financing costs
Sources : CBRE, Banque de France - Comité de normalisation
obligataire
• Well located, leased in line with general market practice
As references do not systematically exist for each category, some
values are estimates provided by market specialists
(Capital Markets, Valuation, Research)

21
PRIME* YIELDS
Q1 2014 Q1 2015 Outlook
PARIS CBD Offices 4.15 % - 4.75 % 3.75 % - 4.25 %
La Defense Offices 5.90 % - 7.00 % 5.25 % - 6.50 %
Regions Offices 5.70 % - 8.00 % 5.40 % - 8.00 %
Logistics classe A 7.00 % - 8.00 % 6.75 % - 8.00 %
Light industrial 8.25 % - 12.00 % 8.00 % - 12.00 % =
Industrial Parks 8.00 % - 10.00 % 7.50 % - 10.00 % =
Regional Shopping
Centres 4.50 % - 7.75 % 4.00 % - 6.25 % =
City centre retail – top
locations 3.90 % - 6.75 % 3.00 % - 6.00%
Retail Parks 5.50 % - 9.50 % 5.25 % - 9.25 % =
* Well located, leased in line with general market practice
As references do not systematically exist for each category, some values are estimates
provided by market specialists (Capital Markets, Valuation, Research)
Source : CBRE

22
€,0 M
€,200 M
€,400 M
€,600 M
€,800 M
€1,000 M
€1,200 M
€1,400 M
2000 2001 2002 2003 2004 2005 2006 2007 2008 2009 2010 2011 2012 2013 2014 2015
Marseille Toulouse Lille Lyon
REGIONS – OFFICE INVESTMENT VOLUMES
Ma
rch
é d
e l’In
ve
stisse
me
nt e
n F
ran
ce
Sources : CBRE et Immostat

23
100,000 sq m
200,000 sq m
300,000 sq m
400,000 sq m
500,000 sq m
600,000 sq m
700,000 sq m
800,000 sq m
900,000 sq m
2004 2005 2006 2007 2008 2009 2010 2011 2012 2013 2014
Marseille Toulouse Lille Lyon
REGIONS – OFFICE TAKE UP
Ma
rch
é d
e l’In
ve
stisse
me
nt e
n F
ran
ce
Sources : CBRE et Immostat

24
5.50%
5.40%
5.75%
6.00%
4%
5%
6%
7%
8%
9%
10%
2002 2003 2004 2005 2006 2007 2008 2009 2010 2011 2012 2013 2014 Q12015
Lyon Lille Marseille Toulouse
PRIME* OFFICE YIELDS IN REGIONS
Sources: CBRE, Banque de France - Comité de
normalisation obligataire
AT PERIOD END
* Well located, leased in line with general market practice
As references do not systematically exist for each category, some
values are estimates provided by market specialists (Capital Markets,
Valuation, Research)

T +33 (0)1 53 64 34 88
F +33 (0)1 53 64 40 00
For more information regarding this presentation please contact: AURELIE LEMOINE
Head of Research
www.cbre.fr
@CBREFrance