Embed Size (px)
Citation preview
1
AGELLAN COMMERCIAL REAL ESTATE INVESTMENT TRUST
MANAGEMENT’S DISCUSSION AND ANALYSIS OF RESULTS OF OPERATIONS AND FINANCIAL CONDITION FOR THE
THREE MONTH PERIOD AND YEAR ENDED DECEMBER 31, 2017
2
Contents
PART I ................................................................................................................................................................................. 3
FORWARD-LOOKING INFORMATION ......................................................................................................................... 3
NON‐IFRS FINANCIAL MEASURES .............................................................................................................................. 4
PART II ................................................................................................................................................................................ 6
OVERVIEW .................................................................................................................................................................. 6
BUSINESS OVERVIEW AND STRATEGIC DIRECTION .................................................................................................... 7
DECLARATION OF TRUST ............................................................................................................................................ 8
FINANCIAL AND OPERATIONAL HIGHLIGHTS ............................................................................................................. 9
SUMMARY OF SIGNIFICANT EVENTS........................................................................................................................ 10
PART III ............................................................................................................................................................................. 13
RESULTS OF OPERATIONS ........................................................................................................................................ 13
RECONCILIATION OF NET INCOME TO FUNDS FROM OPERATIONS ........................................................................ 20
PORTFOLIO PROFILE ................................................................................................................................................. 21
INVESTMENT PROPERTIES ....................................................................................................................................... 25
PART IV ............................................................................................................................................................................. 27
LIQUIDITY AND CAPITAL RESOURCES ....................................................................................................................... 27
CAPITALIZATION AND DEBT PROFILE ....................................................................................................................... 28
DISTRIBUTIONS AND ADJUSTED CASH FLOW FROM OPERATIONS .......................................................................... 32
ADJUSTED FUNDS FROM OPERATIONS .................................................................................................................... 35
PART V .............................................................................................................................................................................. 36
SELECTED QUARTERLY INFORMATION .................................................................................................................... 36
PART VI ............................................................................................................................................................................. 37
RELATED PARTY TRANSACTIONS .............................................................................................................................. 37
PART VII ............................................................................................................................................................................ 39
SIGNIFICANT ACCOUNTING POLICIES AND ESTIMATES ........................................................................................... 39
PART VIII ........................................................................................................................................................................... 40
RISKS AND UNCERTAINTIES...................................................................................................................................... 40
PART IX ............................................................................................................................................................................. 50
CONTROLS AND PROCEDURES ................................................................................................................................. 50
PART X .............................................................................................................................................................................. 52
SUBSEQUENT EVENTS .............................................................................................................................................. 52
PART XI ............................................................................................................................................................................. 52
FINANCIAL OUTLOOK AND MARKET GUIDANCE ...................................................................................................... 52
Part XII .............................................................................................................................................................................. 52
OUTSTANDING UNITS .............................................................................................................................................. 52
3
This Management’s Discussion and Analysis (“MD&A”) is prepared as of March 5, 2018 and outlines Agellan Commercial
Real Estate Investment Trust’s (the “REIT”) operating strategies, risk profile considerations, business outlook and
analysis of financial performance and financial condition for the three month period and year ended December 31,
2017. This MD&A provides a comparison to the REIT’s financial results for the three month period and year ended
December 31, 2016 and should be read in conjunction with the REIT’s audited consolidated financial statements and
accompanying notes for the year ended December 31, 2017, together with the REIT’s audited consolidated financial
statements and management’s discussion and analysis for the year ended December 31, 2016.
This MD&A is based on financial statements prepared in accordance with International Financial Reporting Standards
(“IFRS”). All dollar amounts (except per unit amounts) are in thousands of Canadian dollars (“CAD”), unless otherwise
stated.
Additional information about the REIT can be found in its Annual Information Form dated March 28, 2017 (the “AIF”),
which is available on SEDAR at www.sedar.com.
PART I
FORWARD-LOOKING INFORMATION Certain information in this MD&A may constitute “forward-looking information” under applicable Canadian securities
legislation. This information includes, but is not limited to, statements made in “Business Overview and Strategic
Direction”, “Summary of Significant Events”, “Liquidity and Capital Resources” and “Financial Outlook and Market
Guidance” and other statements concerning management’s expectations regarding objectives, plans, goals, strategies,
future growth, results of operations, performance and business prospects and opportunities of the REIT. When used in
this MD&A, words including, but not limited to, ‘‘plans’’, ‘‘expects’’, ‘‘scheduled’’, ‘‘estimates’’, ‘‘intends’’,
‘‘anticipates’’, “predicts”, ‘‘projects’’, ‘‘believes’’ or variations of such words and phrases or statements to the effect
that certain actions, events or results ‘‘may’’, ‘‘will’’, ‘‘could’’, ‘‘would’’, “should”, ‘‘might’’, ‘‘occur’’, ‘‘be achieved’’ or
‘‘continue’’ and similar expressions identify forward-looking information.
Forward-looking information is necessarily based on a number of estimates and assumptions that are inherently subject
to significant business, economic and competitive risks, uncertainties and contingencies, many of which are beyond the
REIT’s control, which could cause actual results to differ materially from those that are disclosed in or implied by such
forward-looking information. As such, management can give no assurance that actual results will be consistent with
the forward-looking information. While such assumptions are considered reasonable by management of the REIT based
on the information currently available, any of these assumptions could prove to be inaccurate and, as a result, the
forward-looking information based on those assumptions could be incorrect. These assumptions include, but are not
limited to: the REIT’s future growth potential; results of operations; future prospects for additional investment
opportunities in Canada and the United States, including access to debt and equity capital at acceptable costs, the
ability to obtain necessary approvals and to minimize any unexpected costs or liabilities, environmental or otherwise,
relating to any acquisitions or dispositions; demographic and industry trends remaining unchanged, including
occupancy levels, lease renewals, the exercise of any early termination rights, rental increases and retailer competition;
future levels of the REIT’s indebtedness remaining at acceptable levels, including its credit rating; tax laws as currently
in effect remaining unchanged, including applicable specified investment flow-through rules; and current economic
conditions remaining unchanged, including interest rates and applicable foreign exchange rates. Readers, therefore,
should not place undue reliance on any such forward-looking information, as forward-looking information involves
significant risks and uncertainties and should not be read as guarantees of future performance or results, and will not
necessarily be accurate indications of whether or not the times at or by which such performance or results will be
4
achieved. A number of factors could cause actual results to differ materially from the results discussed in the forward-
looking information, including, but not limited to, those presented in Part VIII – “Risks and Uncertainties” of this MD&A.
All forward-looking information is provided as of the date of this MD&A and speaks only as of the date on which such
statements are made. Except as expressly required by applicable law, the REIT assumes no obligation to update or
revise any forward-looking information, whether as a result of new information, the occurrence of future events or
otherwise. All forward-looking information in this MD&A are qualified by these cautionary statements.
NON‐IFRS FINANCIAL MEASURES Certain terms used in this MD&A are not recognized terms under IFRS, and therefore these terms should not be
construed as alternatives to IFRS measures, such as net income or cash flow from operating activities. These terms are
used by management to measure, compare and explain the operating results and financial performance of the REIT.
Management believes that these terms are relevant measures in comparing the REIT’s performance to industry data
and the REIT’s ability to earn and distribute cash to holders of the REIT’s units (“Units”). These terms are defined below
and Funds from Operations, Adjusted Funds from Operations, Adjusted Cash Flow from Operations, and Cash Revenue
are reconciled to the consolidated financial statements of the REIT for the three month period and year ended
December 31, 2017 in Part III – “Results of Operations” and Part IV – “Liquidity and Capital Resources”. Such terms do
not have standardized meanings prescribed by IFRS and may not be comparable to similarly titled measures presented
by other publicly traded entities.
The following discussion describes the terms management uses in evaluating its operating results that are not
recognized under IFRS.
Funds from Operations (“FFO”)
FFO is a widely used supplemental non-IFRS financial measure of a real estate investment trust’s operating
performance. Management believes this to be a useful measure of operating performance for investors because it
adjusts for items included in net income that are not recurring, as well as non-cash items. The REIT presents its FFO
calculations in accordance with the Real Estate Property Association of Canada (“REALPAC”) White Paper on FFO &
AFFO for IFRS issued in February 2017.
FFO is also used in calculating certain ratios, including the REIT’s “Interest Coverage Ratio”, which is a supplemental
non-IFRS financial measure defined as FFO plus finance costs (excluding finance costs adjusted for in the calculation of
FFO) divided by the REIT’s interest expense from mortgages payable and its credit facility. Interest Coverage Ratio is
an important metric used to assess the REIT’s ability to meet its obligation to pay interest on its debt. In addition, the
REIT is required to meet specific interest coverage covenants under certain of its credit and mortgage agreements.
FFO is calculated by adjusting net income for non-cash and non-recurring items, including fair value adjustments to
investment properties and financial instruments, deferred income taxes, property taxes accounted for under
International Financial Reporting Interpretations Committee Interpretation 21 Levies (“IFRIC 21”), losses on sales of
investment properties, effects of puttable instruments classified as financial liabilities and non-controlling interests in
respect of the aforementioned adjustments.
Adjusted Funds from Operations (“AFFO”)
AFFO is a supplemental non-IFRS financial measure of the REIT’s cash generating activities. Management considers
AFFO to be a useful measure of cash available for distributions to unitholders of the REIT (“Unitholders”) because it
adjusts cash flow from (used in) operating activities for additional non-recurring and non-cash items not taken into
5
consideration in the calculation of cash flow from (used in) operating activities. The REIT does not calculate AFFO in
accordance with REALPAC White Paper on FFO & AFFO for IFRS issued in February 2017.
AFFO is calculated by adjusting cash flow from (used in) operating activities for certain items, including changes in non-
cash working capital, funds received from restricted cash to subsidize interest payments on assumed over-market debt,
interest on the REIT’s loan facility and mortgages payable net of capitalized interest on developments, amounts
expensed in conjunction with Unit-based compensation (including Units expected to be issued in respect of any
incentive fee payment to Agellan Capital Partners Inc. (“ACPI”) payable pursuant to the asset management agreement
dated January 25, 2013 between the REIT and ACPI (the “External Management Agreement”)), non-recurring costs that
impact operating cash flow, a normalized reserve for capital and tenant expenditures as determined by the REIT
currently based on cash revenue (defined below), and non-controlling interests in respect of the aforementioned
adjustments.
In the REIT’s previous Management’s Discussion & Analysis, AFFO was calculated by adjusting FFO for certain items,
including straight-lining of contractual rental income, amortization of any net premium or discount on long-term debt
assumed from vendors of properties at rates of interest greater than or less than fair value, funds received from
restricted cash to subsidize interest payments on assumed over-market debt, amortization of financing fees incurred
on contracting long-term debt, amounts expensed in conjunction with Unit-based compensation (including Units
expected to be issued in respect of any incentive fee payment to ACPI payable pursuant to the External Management
Agreement), non-recurring costs that impact operating cash flow, a normalized reserve for capital and tenant
expenditures as determined by the REIT, and non-controlling interests in respect of the aforementioned adjustments.
However, as the REIT intends AFFO to be used as a measure of cash generating activities, in an effort to more closely
adhere to CSA Staff Notice 52-306 – Non-GAAP Financial Measures, the REIT has eliminated the reconciliation and
calculation of FFO to AFFO. This difference has ultimately not changed the calculation of AFFO in prior periods and is
simply a change in presentation.
Adjusted Cash Flow from Operations (“ACFO”)
ACFO is a supplemental non-IFRS financial measure of the REIT’s cash generating activities. The REIT calculates ACFO in
accordance with the REALPAC’s White Paper on ACFO for IFRS issued in February 2017 (the “White Paper”), except that
the REIT adjusts ACFO for the working capital impact of IFRIC 21. Please see “Part III – Results of Operations –
Application of IFRIC 21” for further details of IFRIC 21. The purpose of the White Paper is to provide reporting issuers
and investors with greater guidance on the definitions of ACFO and to help promote more consistent disclosure from
reporting issuers. ACFO is intended to be used as a sustainable economic cash flow metric.
Prior to the issuance of the White Paper, there was no industry standard to calculate a sustainable, economic cash flow
metric. The REIT continues to report AFFO as a supplemental non-IFRS financial measure of the REIT’s cash generating
activities, however, the REIT’s method of calculating AFFO may differ from that of other real estate entities and,
accordingly, may not be comparable to such amounts reported by other issuers.
The REIT’s “Payout Ratio” is a supplemental non-IFRS financial measure defined as distributions divided by ACFO, which
conveys the percentage of distributions made by the REIT from its cash available for distribution. As well, the REIT’s
“Cash Payout Ratio” is a supplemental non-IFRS financial measure defined as distributions less the value of the Units
issued under the REIT’s distribution reinvestment plan (“DRIP”) divided by ACFO. The Cash Payout Ratio adjusts the
Payout Ratio for any non-cash distributions that are made. Previously, the REIT calculated its Payout Ratio and Cash
Payout Ratio as distributions divided by AFFO and distributions less the value of the Units issued under the REIT’s DRIP
divided by AFFO, respectively. This MD&A presents all current and comparative Payout Ratios and Cash Payout Ratios
in accordance with the new definition.
6
Net Operating Income (“NOI”)
NOI is a supplemental non-IFRS financial measure and is defined by the REIT as total property and property-related
revenue less property operating and property tax expenses and excludes the impact of IFRIC 21 as it relates to the
timing of liability recognition of certain U.S. property taxes. Management believes that NOI is an important measure
of the income generated from the income producing real estate portfolio and is used by the REIT in evaluating the
performance of the properties, as well as a key input in determined the value of the portfolio.
NOI is further disaggregated into “Same Stores”, which is a supplemental non-IFRS financial measure defined as the
properties that were owned and operated by the REIT throughout both the current and comparative periods,
“Acquisitions”, which is a supplemental non-IFRS financial measure defined as the properties acquired by the REIT after
the beginning of the comparable period and prior to the end of the current period, and “Dispositions”, which is a
supplemental non-IFRS financial measure defined as the properties disposed of by the REIT after the beginning of the
comparable period and prior to the end of the current period. These measures are used to assess the period-over-
period performance of the same asset base having consistent leasable area in both the current and comparable periods.
Gross Book Value (“GBV”)
GBV is a supplemental non-IFRS measure and is defined by the REIT as the book value of the REIT’s total assets. The
REIT uses GBV to determine certain ratios, including “Debt to Gross Book Value”, which is a supplemental non-IFRS
financial measure that the REIT is required to comply with under certain credit and mortgage agreements and the REIT’s
DOT (as defined below).
Cash Revenue (“Cash Revenue”)
Cash Revenue is a supplemental non-IFRS measure and is defined by the REIT as total property and property-related
revenue plus amortization of lease incentives less straight line rent adjustment. The REIT uses Cash Revenue to
determine the normalized reserve for capital and tenant expenditures used in the calculation of AFFO and ACFO. The
REIT’s current normalized reserve for capital and tenant expenditures is 7% of Cash Revenue.
PART II
OVERVIEW The REIT is an unincorporated, open-ended real estate investment trust governed by an Amended and Restated
Declaration of Trust dated November 13, 2017 (the “DOT”) under the laws of the Province of Ontario. The REIT’s Units
are listed and publicly traded on the Toronto Stock Exchange (“TSX”) under the symbol “ACR.UN”. As at the close of
business on December 31, 2017, there were 32,863,428 Units issued and outstanding and 871,080 exchangeable Class
B LP Units (as defined below) issued and outstanding.
The REIT was created for the purpose of acquiring and owning industrial, office and retail properties in major urban
markets in the United States and Canada. As of the date of this MD&A, the REIT has an interest in 45 properties located
in the United States and Canada.
The objectives of the REIT are to: (i) provide investors with stable, predictable and growing cash distributions on a tax–
efficient basis; (ii) enhance the value of the REIT’s assets and maximize long-term Unitholder value through active
management; and (iii) expand the asset base of the REIT and increase the REIT’s AFFO and ACFO per Unit, including
through accretive acquisitions.
7
BUSINESS OVERVIEW AND STRATEGIC DIRECTION The REIT invests in income producing properties in the United States and Canada in the industrial, office and retail asset
classes. As of the date of this MD&A, the REIT’s portfolio contains approximately 6.7 million square feet (“sqft”) of gross
leasable area (“GLA”) in 44 wholly-owned properties. The properties are located in Texas (17 properties), Illinois (9
properties), Georgia (9 properties), Ontario (3 properties), Ohio (2 properties) and each of Indiana, North Carolina,
Florida and Michigan (1 property each). The REIT also has a non-controlling interest in one industrial property located
in Tampa, Florida.
While the REIT believes investment in a commercial real estate platform that is diversified with respect to both asset
class and geography has the potential to deliver attractive risk-adjusted returns, the REIT’s investment strategy is
focused on increasing its real estate holdings in the United States. The REIT believes that acquiring additional industrial
assets located in the United States will be in the best interests of the REIT and its Unitholders as valuations, financing
and operating fundamentals in the United States are currently more attractive than in Canada.
The REIT intends to utilize a flexible, opportunity-driven growth strategy and take advantage of its agile framework to
source attractive relative valuations in various asset classes and geographic locations. While it is expected that any
acquisitions by the REIT would be immediately accretive, the REIT may also consider and complete acquisitions that
improve the overall quality of its portfolio and/or will be accretive over the longer term. In addition, the REIT intends
to be opportunistic in selling assets in its current portfolio and executing a capital recycling strategy, pursuant to which
the REIT expects to divest some of its current assets and reinvest into targeted growth markets in order to benefit from
capitalization rate spreads as well as improve the overall quality of the portfolio’s assets.
Notwithstanding the REIT’s investment strategy, the REIT may nonetheless acquire certain properties in Canada from
time to time if a particular Canadian acquisition opportunity is determined by the REIT to be in the best interests of the
REIT and its Unitholders.
The REIT continues to focus on optimizing real estate values of its existing portfolio through active management with
an emphasis on retaining existing tenants, increasing occupancy and extending the weighted average remaining lease
term of the portfolio and capitalizing on select development opportunities.
Consistent with the REIT’s past practices and in the normal course of business, the REIT is engaged in discussions, and
has in place various agreements, with respect to possible acquisitions of new properties and dispositions of existing
properties in its portfolio. However, there can be no assurance that these discussions or agreements will result in
acquisitions or dispositions or, if they do, what the final terms or timing of such acquisitions or dispositions would be.
The REIT expects to continue current discussions and actively pursue acquisition, investment and disposition
opportunities.
8
DECLARATION OF TRUST The investment guidelines of the REIT are outlined in the DOT, a copy of which is available on SEDAR at www.sedar.com
and is also available upon request to all Unitholders. Some of the main investment guidelines and operating policies
contained in the DOT are summarized starting on page 51 of the AIF, and include in part, the following:
Investment Guidelines
1. Investing in and operating income-producing commercial real estate located in Canada and the United States;
2. Investing in joint venture arrangements with respect to real estate; and
3. Investing in mortgages and mortgage bonds and similar instruments secured by real estate.
Operating Policies
1. The REIT’s maximum portfolio debt capacity may not exceed 60% of its GBV, or 65% of its GBV when including
convertible debentures;
2. The REIT may not guarantee any third-party debt outside its existing structure and potential joint venture
partner structures, except under certain specific conditions and upon satisfying certain prescribed criteria; and
3. The REIT must obtain an appraisal, engineering survey and environmental phase I site assessment for each
property that it intends to acquire.
Further information regarding the DOT can also be located starting on page 54 of the AIF. At December 31, 2017, the
REIT was in compliance with all investment guidelines and operating policies stipulated in the DOT.
9
FINANCIAL AND OPERATIONAL HIGHLIGHTS
FINANCIAL AND OPERATIONAL HIGHLIGHTS December 31, 2017 December 31, 2016 December 31, 2015
Summary of Operational Information
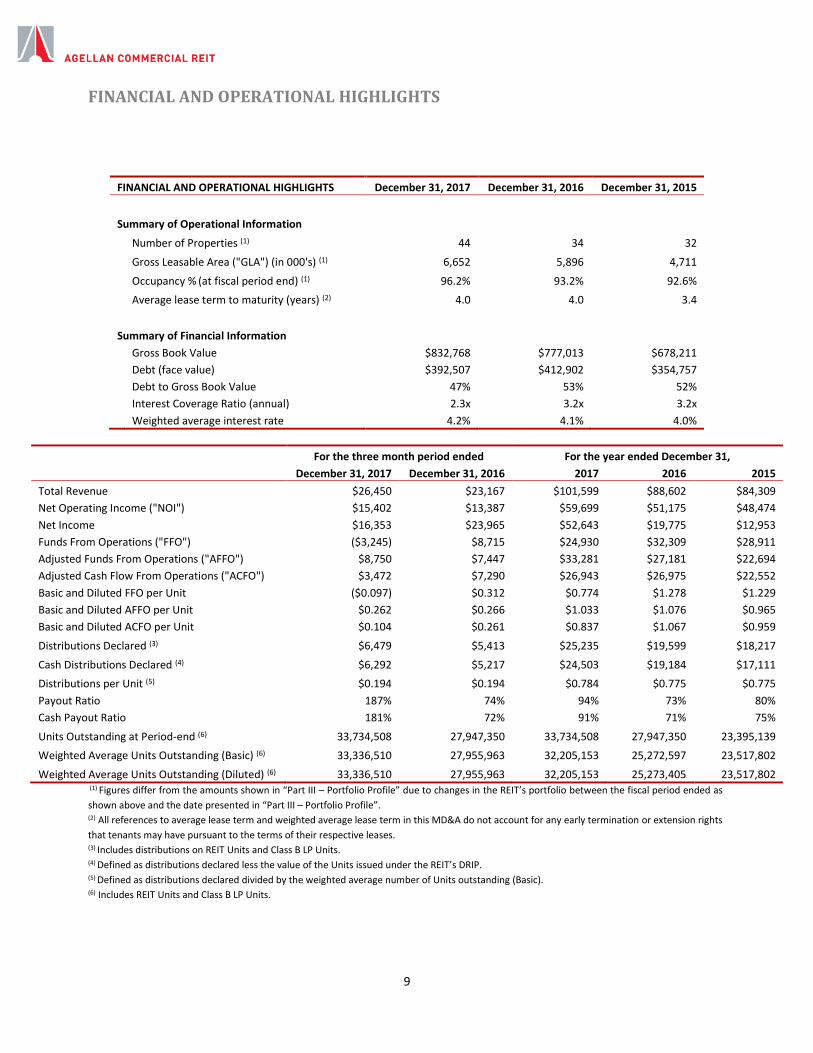
Number of Properties (1) 44 34 32
Gross Leasable Area ("GLA") (in 000's) (1) 6,652 5,896 4,711
Occupancy % (at fiscal period end) (1) 96.2% 93.2% 92.6%
Average lease term to maturity (years) (2) 4.0 4.0 3.4
Summary of Financial Information
Gross Book Value $832,768 $777,013 $678,211
Debt (face value) $392,507 $412,902 $354,757
Debt to Gross Book Value 47% 53% 52%
Interest Coverage Ratio (annual) 2.3x 3.2x 3.2x
Weighted average interest rate 4.2% 4.1% 4.0%
For the three month period ended For the year ended December 31,
December 31, 2017 December 31, 2016 2017 2016 2015
Total Revenue $26,450 $23,167 $101,599 $88,602 $84,309
Net Operating Income ("NOI") $15,402 $13,387 $59,699 $51,175 $48,474
Net Income $16,353 $23,965 $52,643 $19,775 $12,953
Funds From Operations ("FFO") ($3,245) $8,715 $24,930 $32,309 $28,911
Adjusted Funds From Operations ("AFFO") $8,750 $7,447 $33,281 $27,181 $22,694
Adjusted Cash Flow From Operations ("ACFO") $3,472 $7,290 $26,943 $26,975 $22,552
Basic and Diluted FFO per Unit ($0.097) $0.312 $0.774 $1.278 $1.229
Basic and Diluted AFFO per Unit $0.262 $0.266 $1.033 $1.076 $0.965
Basic and Diluted ACFO per Unit $0.104 $0.261 $0.837 $1.067 $0.959
Distributions Declared (3) $6,479 $5,413 $25,235 $19,599 $18,217
Cash Distributions Declared (4) $6,292 $5,217 $24,503 $19,184 $17,111
Distributions per Unit (5) $0.194 $0.194 $0.784 $0.775 $0.775
Payout Ratio 187% 74% 94% 73% 80%
Cash Payout Ratio 181% 72% 91% 71% 75%
Units Outstanding at Period-end (6) 33,734,508 27,947,350 33,734,508 27,947,350 23,395,139
Weighted Average Units Outstanding (Basic) (6) 33,336,510 27,955,963 32,205,153 25,272,597 23,517,802
Weighted Average Units Outstanding (Diluted) (6) 33,336,510 27,955,963 32,205,153 25,273,405 23,517,802 (1) Figures differ from the amounts shown in “Part III – Portfolio Profile” due to changes in the REIT’s portfolio between the fiscal period ended as
shown above and the date presented in “Part III – Portfolio Profile”. (2) All references to average lease term and weighted average lease term in this MD&A do not account for any early termination or extension rights
that tenants may have pursuant to the terms of their respective leases. (3) Includes distributions on REIT Units and Class B LP Units.
(4) Defined as distributions declared less the value of the Units issued under the REIT’s DRIP. (5) Defined as distributions declared divided by the weighted average number of Units outstanding (Basic). (6) Includes REIT Units and Class B LP Units.
10
SUMMARY OF SIGNIFICANT EVENTS
Financial Highlights
For the three month period ended December 31, 2017, the REIT achieved net income of $16,353, compared to net income of
$23,965 for the three month period ended December 31, 2016. This represents a decrease in net income of $0.366 per Unit.
For the three month period ended December 31, 2017, the REIT’s FFO and ACFO per Unit was negatively impacted by non-
reoccurring expenses related to the Proxy Matter and the Asset Acquisition and Internalization, each of which are discussed
further in this MD&A. For the three month period ended December 31, 2017 FFO per Unit was a negative $0.097 and ACFO per
Unit was $0.104 compared to $0.312 and $0.261, respectively, for the three month period ended December 31, 2016. Excluding
costs associated with the Proxy Matter and Asset Acquisition and Internalization, FFO and ACFO per Unit for the three month
period ended December 31, 2017 would have been $0.312 and $0.260, respectively. Please refer to “Part I – Non-IFRS Financial
Measures” for further details on non-IFRS financial measures.
For the three month period ended December 31, 2017, the REIT achieved AFFO per Unit of $0.262 compared to $0.266 for the
three month period ended December 31, 2016. This represents a 1.5% decrease in AFFO per Unit. Please refer to “Part I – Non-
IFRS Financial Measures” for further details on non-IFRS financial measures.
For the year ended December 31, 2017, the REIT achieved net income of $52,643 compared to net income of $19,775 for the
year ended December 31, 2016. This represents an increase in net income of $0.853 per Unit.
For the year ended December 31, 2017, the REIT achieved FFO per Unit and ACFO per Unit of $0.774 and $0.837, respectively,
compared to $1.278 and $1.067, respectively, for the year ended December 31, 2016. These decreases are primarily the result
of non-reoccurring expenses related to the Proxy Matter and the Asset Acquisition and Internalization, each of which are
discussed further in this MD&A. Excluding these costs, FFO per Unit and ACFO per Unit for the year ended December 31, 2017
would have been $1.208 and $1.009, respectively. Please refer to “Part I – Non-IFRS Financial Measures” for further details on
non-IFRS financial measures.
For the year ended December 31, 2017, the REIT achieved AFFO per Unit of $1.033 compared to $1.076 for the year ended
December 31, 2016. This represents a 4.0% decrease in AFFO per Unit. Please refer to “Part I – Non-IFRS Financial Measures”
for further details on non-IFRS financial measures.
The REIT’s Payout Ratios for the three month period and year ended December 31, 2017 were 187% and 94%, respectively. The
REIT’s Payout Ratio was significantly impacted by non-reoccurring expenses related to the Proxy Matter and the Asset Acquisition
and Internalization, each of which are discussed further in this MD&A. Excluding these costs the REIT’s Payout Ratio for the three
month period and year ended December 31, 2017 would have been 75% and 78%, respectively. Please refer to “Part I – Non-IFRS
Financial Measures” for further details on non-IFRS financial measures.
Operational Highlights
As at January 1, 2018, the overall occupancy rate of the REIT’s portfolio was 95.7%, representing a slight decrease from the
October 1, 2017 occupancy rate of 95.9%. This decrease was primarily the result of approximately 43,000 sqft of newly developed
retail space being placed in service as of January 1, 2017. As at January 1, 2018 the retail space is approximately 7% occupied
and the committed occupancy is approximately 53% with occupancy beginning throughout the first half of 2018.
On each of January 11, 2017 and January 31, 2017, the REIT received full building permits for the development of the retail and
parking facility and car dealership to be constructed at the REIT’s Consumers Road complex in Toronto, Ontario. The building
permits are conditional on the REIT performing certain work described in the previously executed site plan and plan of subdivision.
On February 27, 2017, the REIT closed a public offering of 4,807,000 Units at a price of $11.45 per Unit for aggregate gross
proceeds of approximately $55,040, which included 437,000 Units issued pursuant to of the exercise in full of the underwriters’
over-allotment option. The REIT used the net proceeds from the offering to repay approximately US$9.0 million of outstanding
mortgage debt as well as certain indebtedness owing under the REIT's existing credit facilities with the remainder to be used to
fund future acquisitions and for general business purposes.
11
On March 31, 2017, the REIT repaid US$9.0 million of outstanding mortgage debt secured by the REIT’s Houston office properties
with certain of the net proceeds from the February 27, 2017 public offering of Units. In conjunction with the repayment, the REIT
extended the mortgage maturity dates to November 12, 2019.
On April 18, 2017, the REIT made an indirect investment in a 410,000 sqft multi-tenanted distribution centre located in Tampa,
Florida. The total purchase price of the property was approximately US$15.2 million (before closing costs) and was financed, in
part, by a US$7.8 million first mortgage, which matures on May 1, 2027 and bears interest at a fixed rate of 4.40% per annum.
The REIT purchased its 9% non-controlling interest through a strategic partnership with a private Canadian-based investor. The
property was purchased by the partnership at a capitalization rate of 9.2%. The REIT expects to make further investments in
other properties through this partnership, which is focussed on acquiring quality value-add industrial properties located in the
U.S. that can generate superior cash flow and returns.
On April 25, 2017, the REIT acquired an industrial distribution facility located in Flint, Michigan. The facility comprises
approximately 400,000 sqft of GLA and was acquired for an aggregate purchase price of approximately US$16.0 million (before
closing costs), representing a capitalization rate of approximately 12%. The facility is fully leased to General Motors LLC and was
financed by drawing down funds under the REIT’s credit facility.
On June 27, 2017, the REIT acquired eight industrial properties located throughout suburban Chicago, Illinois. The properties are
comprised of approximately 314,000 sqft of GLA and were acquired for an aggregate purchase price of approximately US$28.0
million (before closing costs), representing a capitalization rate of approximately 7.7%. The REIT financed the acquisition of the
properties by drawing on its operating credit facility and obtaining a first mortgage.
On July 28, 2017, the REIT received an occupancy permit from the City of Toronto and Porsche Cars Canada Ltd. took occupancy
of the newly constructed premises at the REIT’s Consumers Road complex. The REIT is required to complete certain development
work in accordance with the lease agreement with the tenant.
On September 18, 2017, the REIT entered into an asset purchase agreement with ACPI to acquire substantially all of the assets of
the REIT’s external manager and internalize the REIT’s asset management function (the “Asset Acquisition and Internalization”).
On September 28, 2017 the REIT disposed of its interest in 165 Yorkland LP, a limited partnership established by the REIT to
own a car dealership and corporate head office at its Consumers Road complex pursuant to a lease agreement with Porsche
Cars Canada Ltd. The REIT disposed of its partnership interest for approximately $42,276 before transaction costs, working
capital adjustments and holdbacks. Certain proceeds from the disposition were used to repay the REIT’s construction facility in
respect of the project and the remaining proceeds will be used by the REIT to complete the development of a retail and parking
facility servicing the REIT’s Consumers Road complex. On November 13, 2017, the REIT closed the Asset Acquisition and Internalization pursuant to an amended asset purchase
agreement in respect thereof dated the same date. Upon closing of the Asset Acquisition and Internalization, a Canadian
operating limited partnership of the REIT acquired all requisite assets of ACPI to internalize the REIT’s asset management function
and all executives and other employees of ACPI became employees of the REIT or its subsidiaries. Please see “Part VI - Related
Party Transactions – Acquisitions” for further details of the transaction.
Also on November 13, 2017, the REIT announced that it had entered into a settlement agreement with ELAD Canada Inc. and
Sandpiper Group in respect of the Proxy Matter. As part of the settlement agreement, Sandpiper Group withdrew its previously
announced Unitholder meeting requisition and the REIT appointed Renzo Barazzuol, Dov Meyer, and Aida Tammer to the board
of trustees of the REIT (the “Board”). Please see “Part III – Results of Operations – General and Administrative Expenses” and
“Part VI – Related Party Transactions – Proxy Matter” for further details of the settlement agreement.
Subsequent Events
Subsequent to year end, on January 9, 2018 the REIT entered into an agreement to purchase a 58,000 square foot multi-tenant
industrial property located in Laurel Maryland. The property is currently 92% occupied by 6 tenants with a weighted average
lease term of 4.6 years. The acquisition is expected to close towards the end of the first quarter of 2018 for U.S. $5,280,
representing a capitalization rate of 8.1%. The REIT anticipates financing the transaction with funds from its credit facility.

12
Subsequent to year end, on February 28, 2018 the REIT extended the maturity of the REIT’s credit facility and increased the
maximum funds available thereunder. The credit facility now matures on January 25, 2020 and the maximum availability
thereunder has been increased from $120.0 million to $140.0 million.
13
PART III
RESULTS OF OPERATIONS
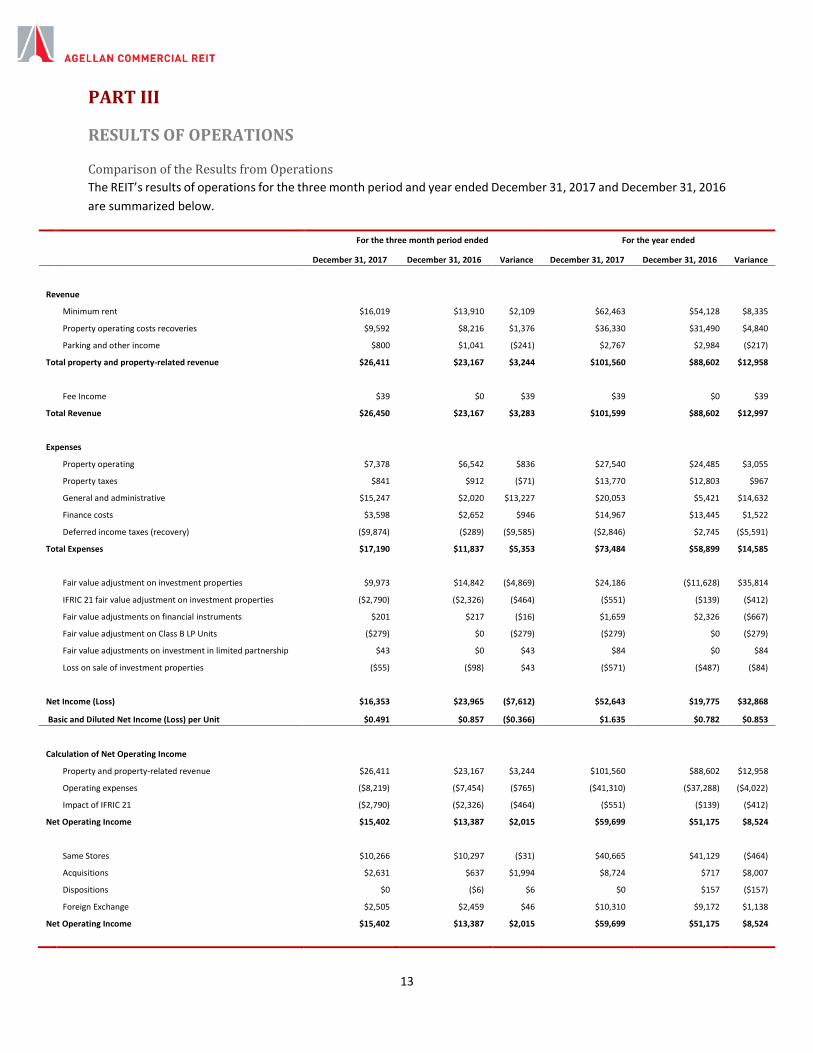
Comparison of the Results from Operations
The REIT’s results of operations for the three month period and year ended December 31, 2017 and December 31, 2016
are summarized below.
For the three month period ended For the year ended
December 31, 2017 December 31, 2016 Variance December 31, 2017 December 31, 2016 Variance
Revenue
Minimum rent $16,019 $13,910 $2,109 $62,463 $54,128 $8,335
Property operating costs recoveries $9,592 $8,216 $1,376 $36,330 $31,490 $4,840
Parking and other income $800 $1,041 ($241) $2,767 $2,984 ($217)
Total property and property-related revenue $26,411 $23,167 $3,244 $101,560 $88,602 $12,958
Fee Income $39 $0 $39 $39 $0 $39
Total Revenue $26,450 $23,167 $3,283 $101,599 $88,602 $12,997
Expenses
Property operating $7,378 $6,542 $836 $27,540 $24,485 $3,055
Property taxes $841 $912 ($71) $13,770 $12,803 $967
General and administrative $15,247 $2,020 $13,227 $20,053 $5,421 $14,632
Finance costs $3,598 $2,652 $946 $14,967 $13,445 $1,522
Deferred income taxes (recovery) ($9,874) ($289) ($9,585) ($2,846) $2,745 ($5,591)
Total Expenses $17,190 $11,837 $5,353 $73,484 $58,899 $14,585
Fair value adjustment on investment properties $9,973 $14,842 ($4,869) $24,186 ($11,628) $35,814
IFRIC 21 fair value adjustment on investment properties ($2,790) ($2,326) ($464) ($551) ($139) ($412)
Fair value adjustments on financial instruments $201 $217 ($16) $1,659 $2,326 ($667)
Fair value adjustment on Class B LP Units ($279) $0 ($279) ($279) $0 ($279)
Fair value adjustments on investment in limited partnership $43 $0 $43 $84 $0 $84
Loss on sale of investment properties ($55) ($98) $43 ($571) ($487) ($84)
Net Income (Loss) $16,353 $23,965 ($7,612) $52,643 $19,775 $32,868
Basic and Diluted Net Income (Loss) per Unit $0.491 $0.857 ($0.366) $1.635 $0.782 $0.853
Calculation of Net Operating Income
Property and property-related revenue $26,411 $23,167 $3,244 $101,560 $88,602 $12,958
Operating expenses ($8,219) ($7,454) ($765) ($41,310) ($37,288) ($4,022)
Impact of IFRIC 21 ($2,790) ($2,326) ($464) ($551) ($139) ($412)
Net Operating Income $15,402 $13,387 $2,015 $59,699 $51,175 $8,524
Same Stores $10,266 $10,297 ($31) $40,665 $41,129 ($464)
Acquisitions $2,631 $637 $1,994 $8,724 $717 $8,007
Dispositions $0 ($6) $6 $0 $157 ($157)
Foreign Exchange $2,505 $2,459 $46 $10,310 $9,172 $1,138
Net Operating Income $15,402 $13,387 $2,015 $59,699 $51,175 $8,524
14
Property and Property-Related Revenue
For the three month period and year ended December 31, 2017, property and property-related revenue increased
$3,244 and $12,958, respectively, when compared to the three month period and year ended December 31, 2016.
The increases in property and property-related revenue for the three month period and year ended December 31, 2017
were primarily due to the net impact of the REIT’s acquisitions and dispositions made during 2016 and 2017. On May
3, 2016, the REIT disposed of 195-215 Rue Bellehumeur. During the three month period ended December 31, 2016, the
REIT acquired 3 properties (2100 & 2200 Norcross Parkway, 5801 & 5901 Goshen Springs and 6100 McIntosh Road).
During the three month period ended June 30, 2017 the REIT acquired 4405 Continental Drive and eight industrial
properties located in suburban Chicago. In addition, the REIT experienced increases in property and property-related
revenue due to increased occupancy at the REIT’s Consumers Road complex and the REIT’s industrial property located
in Plainfield, Indiana. These increases in property and property-related revenue over the comparable period in 2016
were partially offset by the impact of vacancies at four of the REIT’s office properties located in Houston, Naperville
and Ottawa.
During the year ended December 31, 2017, the REIT received two months’ rent from the newly constructed car
dealership at the REIT’s Consumers Road complex prior to its ultimate disposition. This revenue amounted to
approximately $404 for the months of August and September.
Fee Income
On November 13, 2017 the REIT completed the Asset Acquisition and Internalization and acquired the asset and
property management agreements for three properties not wholly-owned by the REIT. Between November 13, 2017
and December 31, 2017, the REIT earned approximately $39 in asset management and property management fees
under these contracts.
Property Operating and Tax Expenses
Property operating expenses are comprised of amounts recoverable from tenants (including property taxes, repairs
and maintenance, utilities and insurance) as well as non-recoverable expenses (including certain property operating
costs). The REIT absorbs recoverable costs to the extent of vacancies that cannot be recovered through the “gross-up”
provision of leases.
Property operating expenses for the three month period and year ended December 31, 2017 increased $836 and
$3,055, respectively, as compared to the comparable periods during 2016. The increase is primarily a result of the net
impact of the REIT’s acquisitions and dispositions made during 2016 and 2017. Please see “Property and Property-
Related Revenue” above for further discussion on acquisitions and dispositions made during 2016 and 2017.
Property taxes for the three month period and year ended December 31, 2017 decreased $71 and increased $967,
respectively, from the three month period and year ended December 31, 2016, respectively. After giving effect to IFRIC
21 (discussed below), property taxes increased $393 over the three month period ended December 31, and increased
$1,379 over the year ended December 31. Decreases in the REIT’s property taxes were primarily a result of successful
property tax appeals in the United States during the year ended December 31, 2017. These decreases have been offset
due to the net impact of the REIT’s acquisitions and dispositions made during 2016 and 2017. Please see “Property and
Property-Related Revenue” above for further discussion on acquisitions and dispositions made during 2016.
General and Administrative Expenses
General and administrative expenses consist of legal fees, audit fees, trustee fees, regulatory reporting costs, transfer
agent fees, insurance costs, salaries, benefits and management and incentive compensation for the REIT.
Included in general and administrative expenses during the three month period ended December 31, 2017 were costs
incurred in respect of the Asset Acquisition and Internalization as well as costs related to a potential proxy contest and
15
the related settlement agreement with ELAD Canada Inc. and Sandpiper Group (the “Proxy Matter”). As a result, the
REIT’s general and administrative expenses for the three month period and year ended December 31, 2017 were
$15,247 and $20,053, respectively, which were $13,227 and $14,632 greater than for the three month period and year
ended December 31, 2017, respectively.
On November 13, 2017 the REIT announced it had entered into a settlement agreement with ELAD Canada Inc. and
Sandpiper Group in respect of a potential proxy contest. The REIT incurred expenses of $4,788 and $5,115 for the three
month period and year ended December 31, 2017 in relation to the Proxy Matter. Included in such expenses are legal
and advisory costs incurred directly by the REIT and $2,987 reimbursement of costs incurred by ELAD Canada Inc. and
Sandpiper Group. ELAD Canada Inc. received $1,102 of the reimbursement and Sandpiper Group received $1,885 of
the reimbursement. Individuals affiliated with ELAD Canada Inc. and Sandpiper Group are related parties of the REIT
by virtue of their positions as trustees of the REIT (“Trustees”).
Also on November 13, 2017, the REIT completed the Asset Acquisition and Internalization. The acquisition was
completed by issuing 871,080 exchangeable Class B limited partnership units of a subsidiary of the REIT (the “Class B
LP Units”) and up to $3,000 of contingent cash payments based on the REIT achieving certain performance thresholds
for calendar years 2018 and 2019. Expensed as part of general and administrative costs was approximately $8,865
relating to the acquisition of the External Management Agreement and transaction costs. Approximately $1,679 was
allocated to third party management contracts and furniture and fixtures acquired by the REIT. This amount was
capitalized as other assets. No amounts were recorded in respect of contingent cash payments for the year ended
December 31, 2018.
Immediately following the completion of the Asset Acquisition and Internalization, the External Management
Agreement was terminated. The REIT will not have any further liability under the External Management Agreement
except for an incentive fee in respect of fiscal year 2017 that would have been payable under the External Management
Agreement. For the year ended December 31, 2017, the REIT incurred asset management fees totalling $2,832
compared to $2,639 for the year ended December 31, 2016. For the three month period ended December 31, 2017,
the REIT incurred asset management fees of approximately $377 compared to $685 for the three month period ended
December 31, 2016. Employee salaries and bonuses incurred by the REIT for the three month period ended December
31, 2017 were approximately $462, including a 2017 bonus accrual of $231 for REIT employees.
Additional increases in general administrative costs relate to forfeited transaction costs, higher professional fees, such
as legal fees, tax and accounting fees, travel expenses, trustee fees due to additional Trustees elected to the Board on
June 12, 2017, and corporate marketing costs during the three month period and year ended December 31, 2017.
During the three month period ended March 31, 2017, the REIT closed a public offering of 4,807,000 Units and, as a
result, incurred $104 of additional listing fees payable to the TSX, which are expensed in general and administrative
costs during the year ended December 31, 2017. Comparatively, on August 4, 2016, the REIT closed a public offering
4,485,000 Units and, as a result, incurred $88 of TSX listing fees, which were expensed in general and administrative
costs.
Finance Costs
Finance costs for the three month period and year ended December 31, 2017 were $3,598, and $14,967, respectively.
Finance costs increased $946 and $1,522, compared to the three month period and year ended December 31, 2016,
respectively.
Interest on mortgages payable increased during the three month period and year ended December 31, 2017, primarily
related to the financing of the acquisition of two properties in Atlanta, Georgia, one property in Sarasota, Florida, one
16
property in Flint, Michigan, and eight properties in Chicago, Illinois. The increase in interest on mortgages payable from
these acquisitions for the three month period and year ended December 31, 2017 was $710 and $3,136, respectively.
Also, on March 31, 2017, the REIT refinanced three mortgages secured by the REIT’s Houston office assets whereby the
REIT repaid US$9.0 million of outstanding mortgage debt secured by the REIT’s Houston office properties. In
conjunction with the repayment, the REIT extended the mortgage maturity dates to November 12, 2019. As a result,
the REIT expensed approximately $209 of financing fees relating to the original mortgages. Additional financing fees
incurred on mortgages relating to the aforementioned acquisitions also increased financing costs for the three month
period and year ended December 31, 2017.
The increases in finance costs were partially offset by the mark-to-market premium recorded on the acquisition of 6100
McIntosh Road, which increased the amortization of the mark-to-market premium during the three month period and
year ended December 31, 2017.
The realized loss on foreign currency exchange hedges increased $619 during the three month period ended December
31, 2017. However, this amount decreased $273 for the year ended December 31, 2017 due to the increase in the
exercise price of the REIT’s foreign currency hedges over actual exchange rates. During the year ended December 31,
2016, the REIT entered into currency hedges to minimize the impact of changes in the USD/CAD exchange rate between
the time the REIT entered into a definitive agreement in respect of and the closing of the REIT’s acquisition of a
distribution centre in Sarasota, Florida. The realized gain recognized as a result of these foreign exchange hedges for
the three month period ended December 31, 2016 was approximately $1,015.
During the three month period and year ended December 31, 2017, $336 and $1,469 of interest was capitalized to
investment properties relating to development activities, respectively. During the three month period and year ended
December 31, 2016, $250 and $657 of interest was capitalized to investment properties relating to development
activities, respectively.
Income Taxes
The REIT is a mutual fund trust and a real estate investment trust pursuant to the Income Tax Act (Canada) (the “Tax
Act”) and, accordingly, is not taxable on its income earned on its Canadian properties to the extent that the income is
distributed to its Unitholders and meets various other tests required by the Tax Act. Please see “Part VIII – Risks and
Uncertainties – Tax Related Risk Factors Canadian Tax Risks” for further details. However, this does not extend to the
REIT’s U.S. properties, which are held by U.S. subsidiaries that are taxable legal entities, please see “Part VIII – Risks and
Uncertainties – U.S. Tax Risks”.
For the three month period and year ended December 31, 2017, deferred income tax recovery was $9,874 and $2,846,
respectively, compared to a deferred income tax recovery of $289 for the three month period ended December 31,
2016 and deferred income tax expense of $2,745 for the year ended December 31, 2016.
The increases in the REIT’s deferred tax expense for the three month period and year ended December 31, 2017 relate
mainly to changes in U.S. tax legislation enacted on December 22, 2017, and differences in the fair market value of the
REIT’s properties in the United States and undepreciated value of the REIT’s properties in the United States for income
tax purposes. Please refer to “Investment Properties” below for further details on the REIT’s investment properties.
On December 22, 2017, the U.S. enacted Public Law 115-97, “An Act to provide for reconciliation pursuant to titles II
and V of the concurrent resolution on the budget for fiscal year 2018” (informally titled the “Tax Cuts and Jobs Act”).
There were a number of significant changes including the decrease in the U.S. corporate income tax rate from 35% to
21%, limits the deduction for net interest expense, shifts the United States toward a modified territorial tax system,
17
changes the rules governing the use of net operating loss carryforwards, and imposes new taxes to combat erosion of
the U.S. federal income tax base.
The REIT is in the process of assessing the full impact of the Tax Cuts and Jobs Act on its U.S. tax position, and for the
year ended December 31, 2017, the REIT has re-measured the deferred taxes to reflect the reduced rate of 21%
effective January 1, 2018 which will apply in future years when these deferred taxes are settled or realized. The REIT
has also analyzed the REIT's alternative minimum tax (“AMT”) utilization in the future years since the existing AMT
credits could be now refundable if not used to offset actual tax liability. Management expects that the REIT's AMT
credits are likely to be utilized in the next year and has therefore continued to record them as a deferred asset as of
December 31, 2017. The REIT will continue gathering and analyzing the information, and report the impact of the Tax
Cuts and Jobs Act effective for future periods.
Recognized in general and administrative costs are corporate taxes of approximately $79 and $257 for the three month
period and year ended December 31, 2017, respectively. For the three month period and year ended December 31,
2016 corporate taxes of $399 and $576 were recorded, respectively. Current income taxes primarily relate to
alternative minimum tax requirements which apply when the REIT’s U.S. subsidiary applies net operating loss carry
forwards from prior years as well as withholding taxes on distributions made from the REIT’s U.S. holding company to
the REIT to the extent the REIT’s U.S. holding company has taxable profits. Alternative minimum taxes will offset future
income taxes payable by the REIT’s U.S. subsidiary to the extent the REIT’s U.S. subsidiary utilizes all of its accumulated
net operating losses and generates taxable income.
As at December 31, 2017, the REIT’s U.S. subsidiary had accumulated net operating losses and deferred interest
deductions available for carry forward for U.S. income tax purposes of $3,250 compared to $1,210 as at December 31,
2016. The net operating losses will expire between 2034 and 2037. The deferred interest deductions and the
deductible temporary differences do not generally expire under current tax legislation.
Fair Value Adjustments on Investment Properties
Under IFRS, the REIT has elected to use the fair value model to account for its investment properties. Under the fair
value model, investment properties are carried on the REIT’s consolidated balance sheet at fair value. During the three
month period and year ended December 31, 2017, the REIT recognized a fair value gain of $9,973 and $24,186,
respectively, on investment properties. During the three month period and year ended December 31, 2016, the REIT
recognized a fair value gain of $14,842 and a fair value loss of $11,628, respectively, on investment properties.
The fair value gains for the three month period and year ended December 31, 2017 were primarily attributable to value
created at the REIT’s Consumers Road complex through the development of 42,000 sqft of retail space and the
development and disposition of a car dealership. Please refer to “Investment Properties” below for further details on
the REIT’s investment properties.
Application of IFRIC 21
In accordance with IFRIC 21, the REIT has determined that the liability to pay United States property taxes should be
recognized in full at a point in time, when the obligating event as stated in the applicable legislation occurs. The impact
of the REIT’s adoption of IFRIC 21 was to recognize the annual United States property tax accrual and corresponding
expense in full on January 1, 2017, with an offsetting adjustment to the fair value of investment properties.
For the three month period and year ended December 31, 2017, property tax expense was less than the prorated
annual expense by approximately $2,790 and $511, respectively. Comparatively, for the three month period and year
ended December 31, 2016, property tax expense was less than the prorated annual expense by approximately $2,326
and $139, respectively. Please see “Property Operating and Tax Expenses” below for further discussion.
18
Fair Value Adjustments on Other Financial Instruments
The REIT is exposed to changes in interest rates on its variable rate debt and changes in the CAD/USD exchange rate on
its USD cash flows. Interest rate swap agreements are used by the REIT to effectively fix the interest rate on certain
variable rate loans and foreign exchange forward contracts are used to effectively fix the currency exchange rate on
certain USD cash flows. For these derivative instruments, an asset or liability is recognized and measured initially at
fair value. The asset or liability is re-measured to fair value at each reporting date and at each settlement date. Changes
in the fair value of the asset or liability are recognized as an unrealized gain or loss on change in fair value of the
derivative instrument. The fair value movements are non-cash in nature and represent the present value of the
difference between current rates and contracted rates over the term of the agreements.
Fair value adjustments on financial instruments were in aggregate unrealized gains of $201 and $1,659 for the three
month period and year ended December 31, 2017, respectively, compared to unrealized gains of $217 and $2,326 for
the three month period and year ended December 31, 2016, respectively.
The REIT had unrealized gains of $355 and $621 for the three month period and year ended December 31, 2017,
respectively, on the interest rate swap agreements. For the three month period and year ended December 31, 2016,
the REIT had unrealized gains of $645 and $670, respectively.
The REIT had an unrealized loss of $154 and an unrealized gain of $1,038 on its foreign currency forward agreements
for the three month period and year ended December 31, 2017, respectively. For the three month period and year
ended December 31, 2017, the REIT had an unrealized loss of $428 and an unrealized gain of $1,656, respectively.
Impact of Foreign Exchange Rates
The REIT has operations in both Canada and the United States and generates revenues and incurs expenses in CAD and
USD, respectively.
The REIT’s statement of income and comprehensive income are primarily impacted by the CAD/USD exchange rate
through property and property-related revenue, property operating expenses, and property tax expenses recognized
by the REIT’s U.S. assets, finance costs from the REIT’s USD denominated mortgages and USD drawings on the REIT’s
credit facility, certain general and administrative expenses, and deferred income taxes. The REIT’s statement of
financial position is primarily impacted by the CAD/USD exchange rate through the translation of the value of the REIT’s
U.S. investment properties and the translation of the REIT’s USD denominated mortgages and USD drawings on the
credit facility.
Revenues and expenses incurred in USD impacting the REITs consolidated statements of income and comprehensive
income are translated to CAD using average exchange rates for the respective period. For items impacting the REIT’s
consolidated statements of financial position, period end rates are used for currency translation purposes. The
following table provides the CAD/USD average exchange rates for the three month period and year ended December
31, 2017 and December 31, 2016 as well as the period end exchange rates for each of the aforementioned periods.
Exchange Rate Three Month Period Ended Year to Date Period Ended
December 31, 2017 December 31, 2016 December 31, 2017 December 31, 2016
Average 1.2713 1.3341 1.2986 1.3248
Period End 1.2545 1.3427 1.2545 1.3427
In general, the REIT’s operational results benefit from a weaker CAD and are adversely affected by a stronger CAD as
net income from the REIT’s U.S. properties, USD denominated financings and USD general and administrative expenses
are translated into CAD. Conversely, in a period of net losses, any weakening of the CAD has the effect of increasing
19
the losses. The impact of foreign exchange in any period is driven by the movement of foreign exchange rates, the
proportion of earnings generated from foreign properties and the impact of any foreign exchange hedging activities.
The REIT has entered into foreign currency forward contracts to exchange a fixed amount of USD for CAD on a monthly
basis in order to reduce the REIT’s exposure to fluctuations in the CAD/USD foreign exchange rate. As of December 31,
2017, the REIT’s last foreign currency forward matures on December 31, 2019 and the total notional value of the REIT’s
forward contracts was US$12,587, which have a weighted average forward exchange rate of 1.29 CAD/1.00 USD.
During the three month period ended December 31, 2017 the average CAD/USD foreign exchange rate was
approximately 5% less than the average foreign exchange rate for the three month period ended December 31, 2016.
The average CAD/USD foreign exchange rate for the year ended December 31, 2017 was approximately 2% less than
the average foreign exchange rate for the year ended December 31, 2016.
Net Operating Income
NOI increased by $2,015 when comparing the three month period ended December 31, 2017 to the three month period
ended December 31, 2016 and increased $8,524 when comparing the year ended December 31, 2017 to the year ended
December 31, 2016.
Increases in net operating income were primarily the result of the net impact of the REIT’s acquisitions and dispositions
made during 2016 and 2017. Please see “Property and Property-Related Revenue” above for further discussion on
acquisitions and dispositions made during 2016.
Other increases were the result of new leases at the REIT’s Consumers Road complex, including two months’ rent from
the recently developed car dealership, and the REIT’s industrial property in Plainfield, Illinois and were offset by
vacancies at four of the REIT’s office properties located in Houston, Naperville and Ottawa.
20
RECONCILIATION OF NET INCOME TO FUNDS FROM OPERATIONS
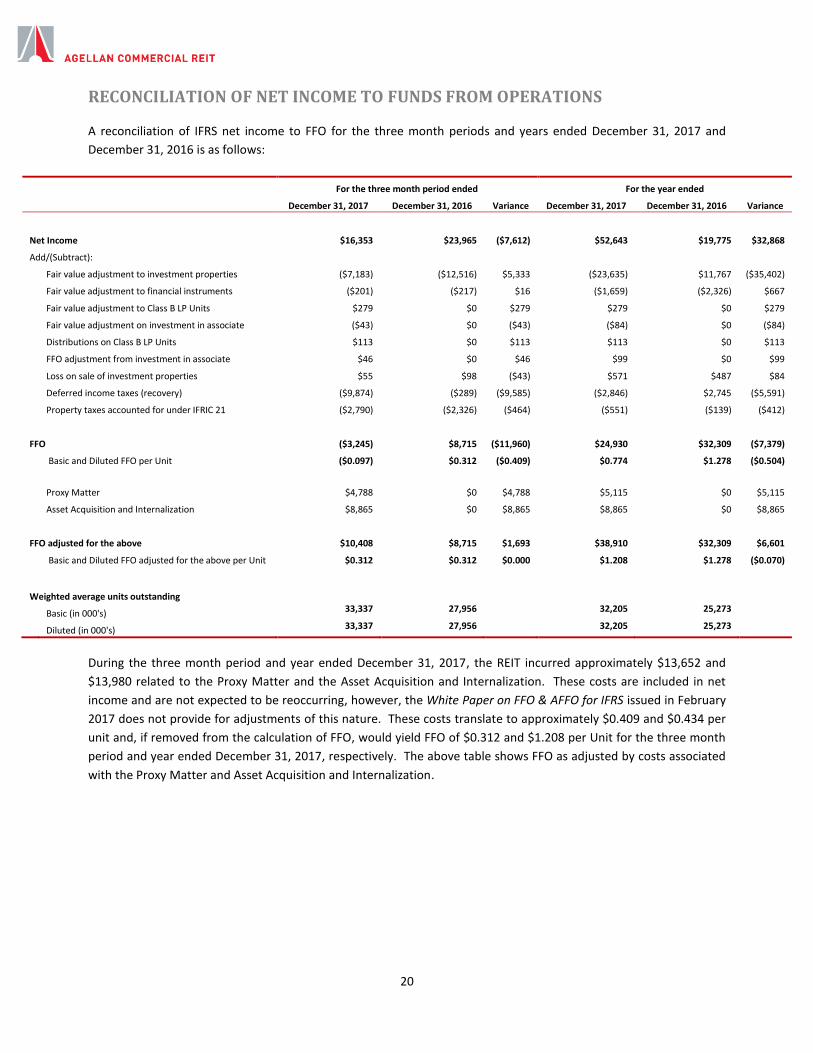
A reconciliation of IFRS net income to FFO for the three month periods and years ended December 31, 2017 and
December 31, 2016 is as follows:
For the three month period ended For the year ended
December 31, 2017 December 31, 2016 Variance December 31, 2017 December 31, 2016 Variance
Net Income $16,353 $23,965 ($7,612) $52,643 $19,775 $32,868
Add/(Subtract):
Fair value adjustment to investment properties ($7,183) ($12,516) $5,333 ($23,635) $11,767 ($35,402)
Fair value adjustment to financial instruments ($201) ($217) $16 ($1,659) ($2,326) $667
Fair value adjustment to Class B LP Units $279 $0 $279 $279 $0 $279
Fair value adjustment on investment in associate ($43) $0 ($43) ($84) $0 ($84)
Distributions on Class B LP Units $113 $0 $113 $113 $0 $113
FFO adjustment from investment in associate $46 $0 $46 $99 $0 $99
Loss on sale of investment properties $55 $98 ($43) $571 $487 $84
Deferred income taxes (recovery) ($9,874) ($289) ($9,585) ($2,846) $2,745 ($5,591)
Property taxes accounted for under IFRIC 21 ($2,790) ($2,326) ($464) ($551) ($139) ($412)
FFO ($3,245) $8,715 ($11,960) $24,930 $32,309 ($7,379)
Basic and Diluted FFO per Unit ($0.097) $0.312 ($0.409) $0.774 $1.278 ($0.504)
Proxy Matter $4,788 $0 $4,788 $5,115 $0 $5,115
Asset Acquisition and Internalization $8,865 $0 $8,865 $8,865 $0 $8,865
FFO adjusted for the above $10,408 $8,715 $1,693 $38,910 $32,309 $6,601
Basic and Diluted FFO adjusted for the above per Unit $0.312 $0.312 $0.000 $1.208 $1.278 ($0.070)
Weighted average units outstanding
Basic (in 000's) 33,337 27,956 32,205 25,273
Diluted (in 000's) 33,337 27,956 32,205 25,273
During the three month period and year ended December 31, 2017, the REIT incurred approximately $13,652 and
$13,980 related to the Proxy Matter and the Asset Acquisition and Internalization. These costs are included in net
income and are not expected to be reoccurring, however, the White Paper on FFO & AFFO for IFRS issued in February
2017 does not provide for adjustments of this nature. These costs translate to approximately $0.409 and $0.434 per
unit and, if removed from the calculation of FFO, would yield FFO of $0.312 and $1.208 per Unit for the three month
period and year ended December 31, 2017, respectively. The above table shows FFO as adjusted by costs associated
with the Proxy Matter and Asset Acquisition and Internalization.
21
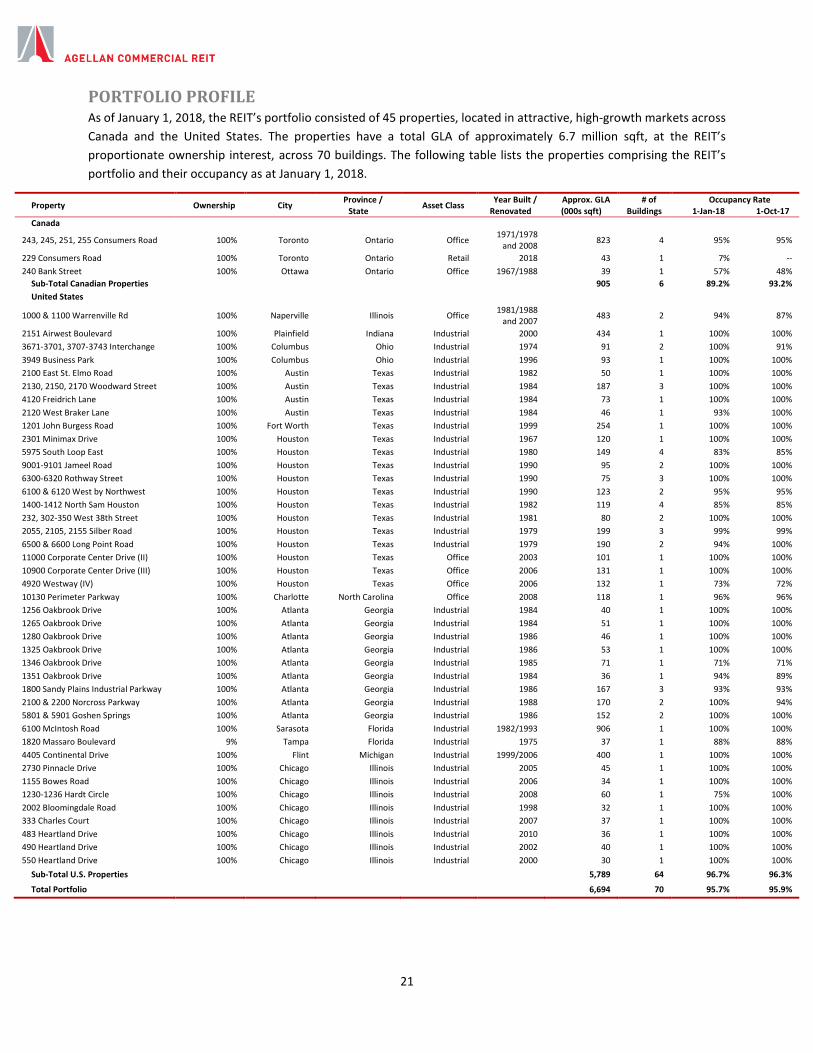
PORTFOLIO PROFILE As of January 1, 2018, the REIT’s portfolio consisted of 45 properties, located in attractive, high-growth markets across
Canada and the United States. The properties have a total GLA of approximately 6.7 million sqft, at the REIT’s
proportionate ownership interest, across 70 buildings. The following table lists the properties comprising the REIT’s
portfolio and their occupancy as at January 1, 2018.
Property Ownership City Province /
State Asset Class
Year Built / Renovated
Approx. GLA (000s sqft)
# of Buildings
Occupancy Rate 1-Jan-18 1-Oct-17
Canada
243, 245, 251, 255 Consumers Road 100% Toronto Ontario Office 1971/1978
and 2008 823 4 95% 95%
229 Consumers Road 100% Toronto Ontario Retail 2018 43 1 7% --
240 Bank Street 100% Ottawa Ontario Office 1967/1988 39 1 57% 48%
Sub-Total Canadian Properties 905 6 89.2% 93.2%
United States
1000 & 1100 Warrenville Rd 100% Naperville Illinois Office 1981/1988
and 2007 483 2 94% 87%
2151 Airwest Boulevard 100% Plainfield Indiana Industrial 2000 434 1 100% 100%
3671-3701, 3707-3743 Interchange 100% Columbus Ohio Industrial 1974 91 2 100% 91%
3949 Business Park 100% Columbus Ohio Industrial 1996 93 1 100% 100%
2100 East St. Elmo Road 100% Austin Texas Industrial 1982 50 1 100% 100%
2130, 2150, 2170 Woodward Street 100% Austin Texas Industrial 1984 187 3 100% 100%
4120 Freidrich Lane 100% Austin Texas Industrial 1984 73 1 100% 100%
2120 West Braker Lane 100% Austin Texas Industrial 1984 46 1 93% 100%
1201 John Burgess Road 100% Fort Worth Texas Industrial 1999 254 1 100% 100%
2301 Minimax Drive 100% Houston Texas Industrial 1967 120 1 100% 100%
5975 South Loop East 100% Houston Texas Industrial 1980 149 4 83% 85%
9001-9101 Jameel Road 100% Houston Texas Industrial 1990 95 2 100% 100%
6300-6320 Rothway Street 100% Houston Texas Industrial 1990 75 3 100% 100%
6100 & 6120 West by Northwest 100% Houston Texas Industrial 1990 123 2 95% 95%
1400-1412 North Sam Houston 100% Houston Texas Industrial 1982 119 4 85% 85%
232, 302-350 West 38th Street 100% Houston Texas Industrial 1981 80 2 100% 100%
2055, 2105, 2155 Silber Road 100% Houston Texas Industrial 1979 199 3 99% 99%
6500 & 6600 Long Point Road 100% Houston Texas Industrial 1979 190 2 94% 100%
11000 Corporate Center Drive (II) 100% Houston Texas Office 2003 101 1 100% 100%
10900 Corporate Center Drive (III) 100% Houston Texas Office 2006 131 1 100% 100%
4920 Westway (IV) 100% Houston Texas Office 2006 132 1 73% 72%
10130 Perimeter Parkway 100% Charlotte North Carolina Office 2008 118 1 96% 96%
1256 Oakbrook Drive 100% Atlanta Georgia Industrial 1984 40 1 100% 100%
1265 Oakbrook Drive 100% Atlanta Georgia Industrial 1984 51 1 100% 100%
1280 Oakbrook Drive 100% Atlanta Georgia Industrial 1986 46 1 100% 100%
1325 Oakbrook Drive 100% Atlanta Georgia Industrial 1986 53 1 100% 100%
1346 Oakbrook Drive 100% Atlanta Georgia Industrial 1985 71 1 71% 71%
1351 Oakbrook Drive 100% Atlanta Georgia Industrial 1984 36 1 94% 89%
1800 Sandy Plains Industrial Parkway 100% Atlanta Georgia Industrial 1986 167 3 93% 93%
2100 & 2200 Norcross Parkway 100% Atlanta Georgia Industrial 1988 170 2 100% 94%
5801 & 5901 Goshen Springs 100% Atlanta Georgia Industrial 1986 152 2 100% 100%
6100 McIntosh Road 100% Sarasota Florida Industrial 1982/1993 906 1 100% 100%
1820 Massaro Boulevard 9% Tampa Florida Industrial 1975 37 1 88% 88%
4405 Continental Drive 100% Flint Michigan Industrial 1999/2006 400 1 100% 100%
2730 Pinnacle Drive 100% Chicago Illinois Industrial 2005 45 1 100% 100%
1155 Bowes Road 100% Chicago Illinois Industrial 2006 34 1 100% 100%
1230-1236 Hardt Circle 100% Chicago Illinois Industrial 2008 60 1 75% 100%
2002 Bloomingdale Road 100% Chicago Illinois Industrial 1998 32 1 100% 100%
333 Charles Court 100% Chicago Illinois Industrial 2007 37 1 100% 100%
483 Heartland Drive 100% Chicago Illinois Industrial 2010 36 1 100% 100%
490 Heartland Drive 100% Chicago Illinois Industrial 2002 40 1 100% 100%
550 Heartland Drive 100% Chicago Illinois Industrial 2000 30 1 100% 100%
Sub-Total U.S. Properties 5,789 64 96.7% 96.3%
Total Portfolio 6,694 70 95.7% 95.9%
22
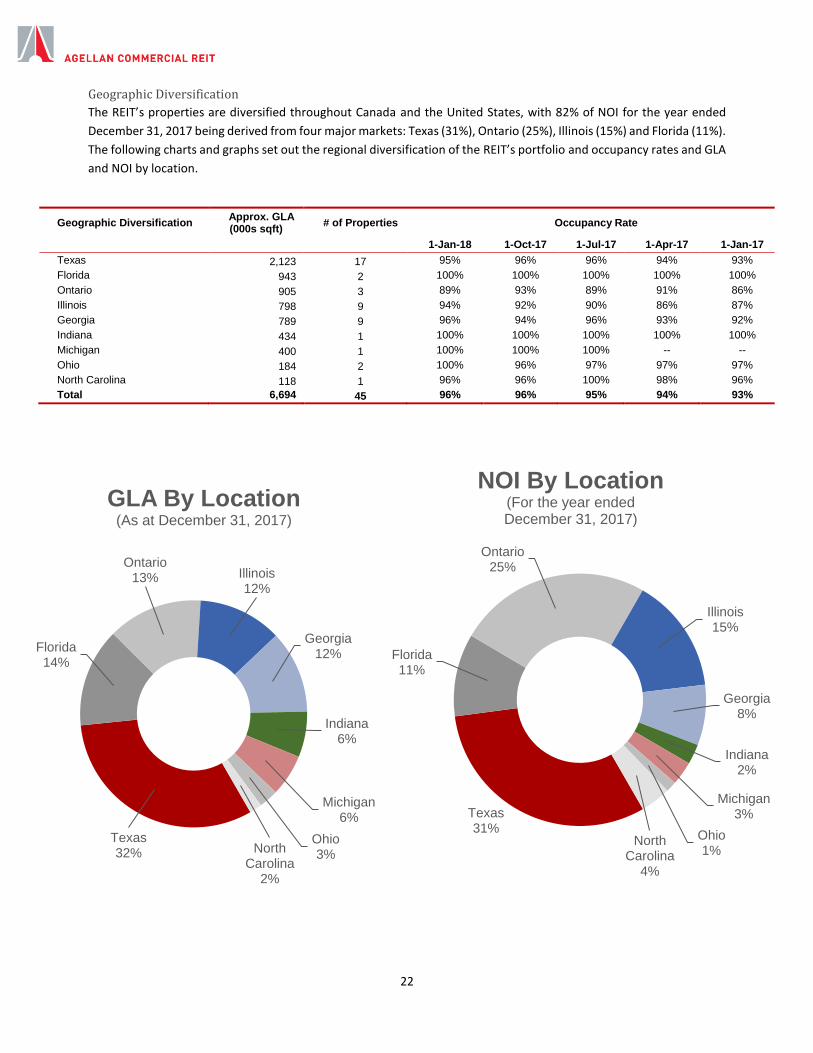
Geographic Diversification
The REIT’s properties are diversified throughout Canada and the United States, with 82% of NOI for the year ended
December 31, 2017 being derived from four major markets: Texas (31%), Ontario (25%), Illinois (15%) and Florida (11%).
The following charts and graphs set out the regional diversification of the REIT’s portfolio and occupancy rates and GLA
and NOI by location.
Geographic Diversification Approx. GLA (000s sqft)
# of Properties Occupancy Rate
1-Jan-18 1-Oct-17 1-Jul-17 1-Apr-17 1-Jan-17
Texas 2,123 17 95% 96% 96% 94% 93%
Florida 943 2 100% 100% 100% 100% 100%
Ontario 905 3 89% 93% 89% 91% 86%
Illinois 798 9 94% 92% 90% 86% 87%
Georgia 789 9 96% 94% 96% 93% 92%
Indiana 434 1 100% 100% 100% 100% 100%
Michigan 400 1 100% 100% 100% -- --
Ohio 184 2 100% 96% 97% 97% 97%
North Carolina 118 1 96% 96% 100% 98% 96%
Total 6,694 45 96% 96% 95% 94% 93%
Texas32%
Florida14%
Ontario13% Illinois
12%
Georgia12%
Indiana6%
Michigan6%
Ohio3%North
Carolina2%
GLA By Location(As at December 31, 2017)
Texas31%
Florida11%
Ontario25%
Illinois15%
Georgia8%
Indiana2%
Michigan3%
Ohio1%
North Carolina
4%
NOI By Location(For the year ended December 31, 2017)
23
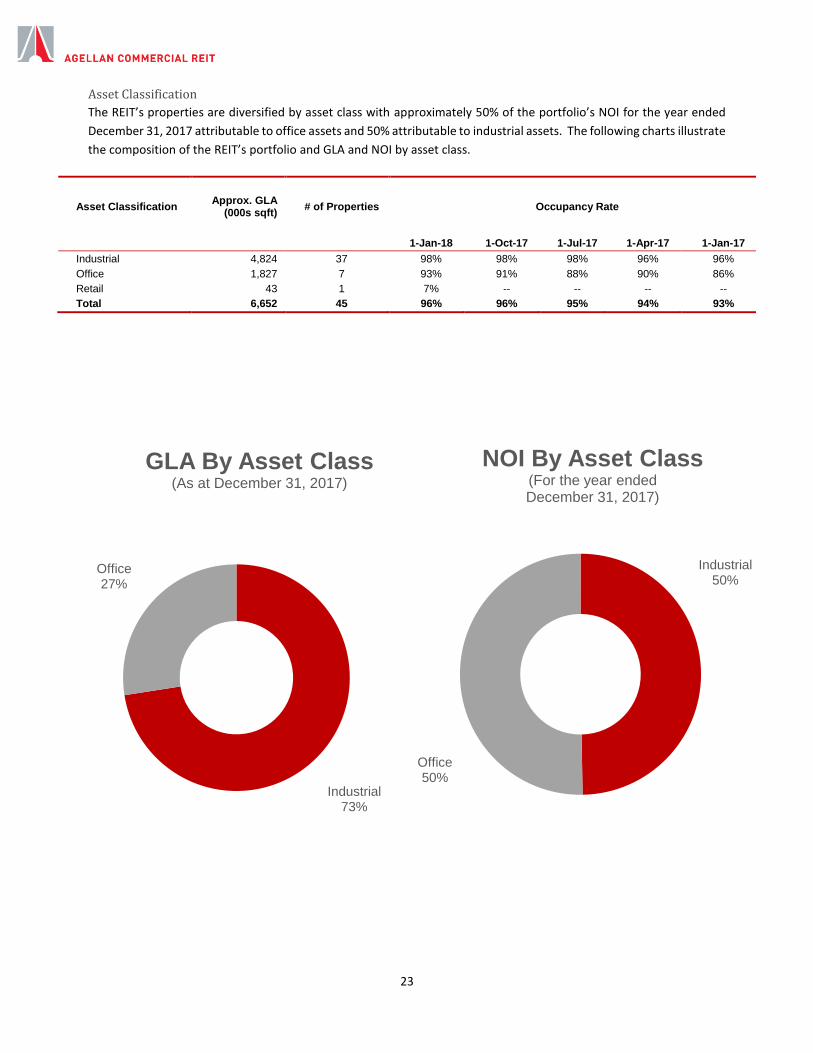
Asset Classification
The REIT’s properties are diversified by asset class with approximately 50% of the portfolio’s NOI for the year ended
December 31, 2017 attributable to office assets and 50% attributable to industrial assets. The following charts illustrate
the composition of the REIT’s portfolio and GLA and NOI by asset class.
Asset Classification Approx. GLA
(000s sqft) # of Properties Occupancy Rate
1-Jan-18 1-Oct-17 1-Jul-17 1-Apr-17 1-Jan-17
Industrial 4,824 37 98% 98% 98% 96% 96%
Office 1,827 7 93% 91% 88% 90% 86%
Retail 43 1 7% -- -- -- --
Total 6,652 45 96% 96% 95% 94% 93%
Industrial73%
Office27%
GLA By Asset Class(As at December 31, 2017)
Industrial50%
Office50%
NOI By Asset Class(For the year ended December 31, 2017)
24
Tenant Mix
The REIT’s tenant base is diversified, consisting of a mix of single- and multi-tenant properties and comprising small
local tenants and large national tenants. The ten largest tenants in the REIT’s portfolio accounted for approximately
41% of in-place base rental revenue for the year ended December 31, 2017 and comprised approximately 33% of GLA
as of December 31, 2017.
The following table summarizes the REIT’s 10 largest tenants by percentage of in-place base rent for the year ended
December 31, 2017:
Tenant Credit Rating (1) Tenant
Since Property
% of In-Place
Base Rent % of GLA
Remaining Ave
Lease Term (years) (2)
Health Care Service Corp A+/A2/--/A- 2006 1000 & 1100 Warrenville Road 9% 4% 4.5
Shoppers Drug Mart BBB/--/BBB/-- 1995 243/251/255 Consumers Road 8% 4% 2.5
United Natural Foods Inc. - 2007 6100 McIntosh Road 5% 7% 4.6
Allstate Insurance Co. AA-/Aa3/--/A+ 2007 4920 Westway (IV) 3% 1% 6.4
Supervalu B+/B1/--/B 2001 1201 John Burgess Road 3% 4% 7.7
National Oilwell Varco BBB+/Baa1/--/-- 2006 11000 Corporate Center Drive (II) 3% 1% 2.7
General Motors, LLC BBB/Baa3/BBB/BBB 2016 4405 Continental Drive 3% 6% 3.7
Access USA - 2011 6100 McIntosh Road 2% 2% 1.7
Life Technologies BBB/Baa2/--/BBB 2006 2130 - 2170 Woodward Street 2% 2% 2.5
IBM Canada A+/A1/--/A+ 1989 245 Consumers Road 2% 2% 7.3
Total/Weighted Average 40% 33% 4.2
(1) S&P/Moody’s/DBRS/Fitch; credit rating based on the parent organization. (2) All references to average lease term and weighted average lease term in this MD&A do not account for any early termination or extension rights that
tenants may have pursuant to the terms of their respective leases.
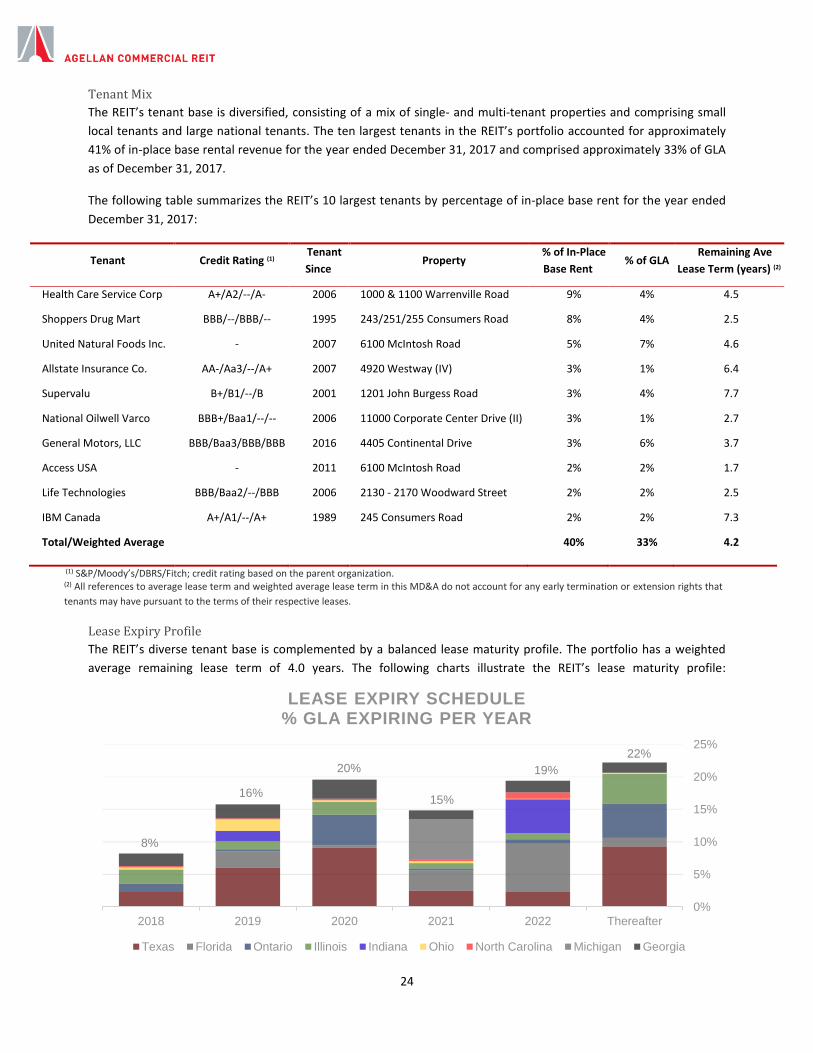
Lease Expiry Profile
The REIT’s diverse tenant base is complemented by a balanced lease maturity profile. The portfolio has a weighted
average remaining lease term of 4.0 years. The following charts illustrate the REIT’s lease maturity profile:
8%
16%
20%
15%
19%
22%
2018 2019 2020 2021 2022 Thereafter
0%
5%
10%
15%
20%
25%
LEASE EXPIRY SCHEDULE% GLA EXPIRING PER YEAR
Texas Florida Ontario Illinois Indiana Ohio North Carolina Michigan Georgia
25
Lease Expiry (Square Footage in 000's)
Current Vacancy 2018 2019 2020 2021 2022 Thereafter TOTAL Weighted
Average Lease Term (years) (1)
By Asset Class
Industrial 118 341 890 813 919 1,063 680 4,824 3.6
Office 129 185 120 441 32 180 740 1,827 4.9
Retail 39 - - - - - 3 43 10.0
Total 286 526 1,011 1,254 951 1,243 1,423 6,694 4.0
By Location
Texas 101 147 384 582 160 153 596 2,123 3.8
Florida 5 - 163 23 200 468 84 943 4.1
Ontario 97 81 22 303 19 44 339 905 4.7
Illinois 45 141 79 126 52 61 293 798 4.9
Georgia 34 124 139 189 87 114 101 789 3.0
Indiana - - 101 - - 333 - 434 4.0
Michigan - - - - 400 - - 400 3.7
Ohio - 19 113 18 19 5 10 184 2.1
North Carolina 5 14 9 14 13 64 - 118 3.5
Total 286 526 1,011 1,254 951 1,243 1,423 6,694 4.0
(1) All references to average lease term and weighted average lease term in this MD&A do not account for any early termination or extension rights that
tenants may have pursuant to the terms of their respective leases.
INVESTMENT PROPERTIES The fair value of the REIT’s investment properties as at December 31, 2017 was $808,875, representing a weighted
average discount and terminal capitalization rate of 8.29% and 7.66%, respectively. The increase of $49,381 in book
value from December 31, 2016 to December 31, 2017 is primarily due to the acquisition of nine industrial properties
during the three month period ended June 30, 2017. Additional increases relate to costs capitalized in relation to the
ongoing development at the REIT’s Consumers Road complex and costs capitalized with respect to lease transactions
at the REIT’s Toronto, Naperville and Houston office properties. During the year ended December 31, 2017, the REIT
capitalized approximately $22,655 to investment properties relating to development at the REIT’s Consumers Road
complex.
Increases in investment properties were partially offset by the decrease in the value of the USD between December 31,
2016 and December 31, 2017. The USD decreased approximately 7.0% and reduced the value of investment properties
approximately $40,085 during the year ended December 31, 2017. Additionally, on September 29, 2017, the REIT
disposed of a portion of the REIT’s Consumers Road complex in Toronto, Ontario. The transaction involved the
disposition of the REIT’s partnership interest in 165 Yorkland LP, a limited partnership established by the REIT to own a
car dealership and corporate head office leased to Porsche Cars Canada Ltd. This disposition reduced the value of the
REIT’s investment properties by approximately $39,585.
The fair value adjustment to the REIT’s income producing properties for the year ended December 31, 2017 was an
increase of $24,186. The fair value adjustment increased primarily due to increases in market rents identified at the
REIT’s Toronto office property and Atlanta industrial properties, fair value increases resulting from the REIT’s
development activities and cap rate compression in certain U.S. markets during the year ended December 31, 2017.
These increases were partially offset by reductions in the discounted cash flow assumptions resulting from changes to
the lease up of anticipated vacancies, and the cost to lease up those vacancies, primarily at the REIT’s Naperville and
Houston office properties.
During the three month period ended December 31, 2017 the REIT substantially completed the development of a
parking garage, which includes approximately 42,000 sqft of retail GLA, at the REIT’s Consumers Road complex
26
increasing the value of the REIT’s investment properties for the three month period ended December 31, 2017. The
REIT placed the newly developed asset in service beginning on January 1, 2018.
Changes to investment properties for the year ended December 31, 2017 and the year ended December 31, 2016 were
as follows:
December 31, 2017 December 31, 2016
Balance, Beginning of Period $759,494 $662,296
Acquisition of investment properties 58,995 90,307
Additions - capital expenditures 25,528 32,338
Additions - leasing costs 18,821 6,883
Increase in straight-line rent 1,521 631
Fair value adjustment 24,186 (11,628)
Disposition of investment properties (39,585) (8,929)
Difference on translation of U.S. operations (40,085) (12,404)
Balance, End of Period $808,875 $759,494
The fair value of the REIT’s investment properties in Canada and the United States is as follows:
December 31, 2017 December 31, 2016
Canada $222,634 $213,491
United States 586,241 546,003
Total $808,875 $759,494
The REIT determined the fair value of each investment property using a combination of valuations made by
independent external appraisers having appropriate professional qualifications and internal management valuations
primarily using a discounted cash flow method. The discounted cash flow method discounts the REIT’s expected future
cash flows, generally over a term of 10 years, including a terminal value based on the application of a capitalization rate
to estimated year 11 cash flows.
The key valuation assumptions for the REIT’s investment properties are set out in the following table:
KEY VALUATION ASSUMPTIONS December 31, 2017
Canada United States
Discount rates - range 7.25% - 7.25% 7.00% - 12.00%
Discount rate - weighted average 7.25% 8.64%
Terminal capitalization rates - range 7.00% - 7.00% 6.50% - 11.50%
Terminal capitalization rate - weighted average 7.00% 7.88%
KEY VALUATION ASSUMPTIONS December 31, 2016
Canada United States
Discount rates - range 7.50% - 7.50% 7.50% - 9.50%
Discount rate - weighted average 7.50% 8.69%
Terminal capitalization rates - range 7.00% - 7.25% 7.00% - 8.75%
Terminal capitalization rate - weighted average 7.24% 7.97%
27
The discounted cash flows reflect rental income from current leases and assumptions about rental income from future
leases reflecting market conditions at the reporting date, less future cash outflows in respect of such leases.
The REIT regularly obtains external appraisals to supplement internal management valuations and to support fair
market value. The aggregate appraised value of properties externally appraised during the year ended December 31,
2017, including appraisals obtained in conjunction with acquisitions, were as follows:
Three Month Period Ending Appraised Value (in CAD on the Value Date)
Approximate Percentage of the REIT’s Investment Properties (as at December 31, 2017)
March 31, 2017 $14,120 1.7% June 30, 2017 $91,231 11.3% September 30, 2017 $54,288 6.7% December 31, 2017 $235,490 29.1%
The aggregate appraised value of the properties externally appraised during the year ended December 31, 2016,
including appraisals obtained in conjunction with acquisitions during 2016, totalled $353,067, representing
approximately 46.5% of the value of the REIT’s investment properties as at December 31, 2016.
PART IV
LIQUIDITY AND CAPITAL RESOURCES The REIT expects to be able to meet all of its obligations as they become due and have sufficient liquidity from the
following sources: (i) cash flow from operating activities; (ii) financing availability through the REIT’s revolving credit
facility (described in further detail below) and conventional mortgage debt secured by income producing properties;
and (iii) the ability to issue equity and convertible/unsecured debentures.
The following table details changes in cash during the three month periods and years ended December 31, 2017 and December 31, 2016:
LIQUIDITY AND CAPITAL RESOURCES For the three month
period ended December 31, 2017
For the three month period ended
December 31, 2016
For the year ended December 31, 2017
For the year ended December 31, 2016
Cash provided by/used in
Operating activities $12,495 $14,363 $59,056 $47,871
Financing activities ($6,250) $20,793 $11,656 $30,695
Investing activities ($9,896) ($39,366) ($68,354) ($79,389)
Effect of exchange rates on cash ($1,765) $529 ($585) ($569)
Increase in cash and cash equivalents during the period ($5,416) ($3,681) $1,773 ($1,392)
Cash and cash equivalents, beginning of period $14,935 $11,427 $7,746 $9,138
Cash and cash equivalents, end of period $9,519 $7,746 $9,519 $7,746
Cash flow activity for the three month period and year ended December 31, 2017 from operating activities relate
primarily to the collection of rent and payment of property operating, property tax and general and administrative
expenses.
28
Cash flows from financing activities primarily relate to the servicing of mortgages and the REIT’s operating and
construction facility, proceeds from equity issuances in public and private placements and distributions paid by the REIT
to Unitholders and holders of Class B LP Units.
Cash flows from investing activities primarily relate to property acquisitions and dispositions made by the REIT and
additions to the properties though capital expenditures and tenant inducements.
Financing activities during the three month period ended December 31, 2017 relate primarily to the drawdowns under
and repayments of the REIT’s credit facility, the servicing of mortgages payable and the payment of distributions.
Financing activities during the year ended December 31, 2017 relate primarily to the net funds received by the public
offering-related issuance of Units by the REIT on February 27, 2017. These funds were used to temporarily reduce the
outstanding amount owing under the REIT’s credit facility during the six month period ended June 30, 2017, which was
subsequently redrawn to repay approximately US$9 million of mortgages payable and acquire nine industrial properties
in the U.S. during the nine month period ended September 30, 2017. In addition, financing activities during the year
ended December 31, 2017 relate to draws under the REIT’s credit facility to fund capital costs of the development at
the REIT’s Consumers Road complex, repayment of the construction facility on the disposition of 165 Yorkland LP and
funds received from a mortgage secured by the REIT’s industrial property in Flint, Michigan.
Investing activities during the three month period ended December 31, 2017 primarily relate to capital expenditures
for leasing incentives, building improvements and costs relating to the developments at the REIT’s Consumers Road
complex. Investing activities during the year ended December 31, 2017 relate primarily to the acquisition of nine
industrial properties in the U.S. During the year ended December 31, 2017, investing activities were impacted by the
funds received from the disposition of 165 Yorkland LP as well as capital expenditures relating to leasing incentives,
building improvements and costs relating to the developments at the REIT’s Consumers Road complex.
CAPITALIZATION AND DEBT PROFILE
The REIT’s existing mortgages payable are secured by charges on certain investment properties. As at December 31,
2017, these mortgages carried a weighted average interest rate of 4.46% per annum. Included in existing mortgages
payable at December 31, 2017 are USD denominated mortgages of 298,696 (US$238,100).
CAPITALIZATION AND DEBT PROFILE December 31, 2017
Indebtedness
Existing mortgages payable $300,707
Revolving credit facility $91,800
Mark-to-market premium on existing mortgages $1,444
Unamortized financing fees ($1,932)
Unitholders' Equity
Unitholders' Equity $373,925
Total Capitalization (at book value) $765,944
29
Future principal repayments and interest payments on the existing mortgages payable as at December 31, 2017 were
as follows:
Scheduled Principal Payment
Debt Maturing
During the Period
Total Mortgage Payable
Scheduled Interest Payment
Total Debt Service
Weighted Average Annual Interest Rate
of Debt Maturing
2018 5,931 63,840 69,771 11,984 81,755 5.34%
2019 5,419 42,435 47,854 9,886 57,740 3.97%
2020 3,841 40,541 44,382 6,726 51,108 3.89%
2021 3,793 - 3,793 6,278 10,071 -
2022 3,235 46,473 49,708 4,663 54,371 5.31%
Thereafter 4,405 80,794 85,199 5,458 90,657 3.93%
Face Value $ 26,624 $ 274,083 $ 300,707 $ 44,995 $ 345,702
Unamortized market-to-market premium 1,444
Unamortized financing fees (1,726)
Book Value $ 300,425
As at December 31, 2017, the REIT had a revolving credit facility secured by a charge on REIT’s Consumers Road
complex. Subject to certain covenants, the maximum amount available to the REIT under this facility was $120,000.
Amounts can be drawn under the facility in both USD and CAD. The facility bears interest at bankers' acceptance /
LIBOR rate plus 2.00% per annum or prime / U.S. base rate plus 1.00% per annum. As at December 31, 2017, the amount
drawn on the facility was $91,800. As at December 31, 2017, no amounts were drawn in USD.
On September 29, 2017 the REIT repaid the then outstanding balance of $32,005 on its non-revolving construction
facility secured by a charge on the REIT’s Consumers Road complex. The REIT repaid the construction facility in
conjunction with the disposition of 165 Yorkland LP.
Financing fees of $1,560 were incurred to obtain the revolving credit facility and non-revolving construction facility and
are being amortized over the remaining term. As at December 31, 2017, the unamortized financing fees totaled $206.
The interest rate on $60,000 drawn on the facilities has been effectively fixed at 3.42% per annum after giving effect to
an interest rate swap agreement.
On February 28, 2018 the REIT extended the maturity of its credit facility and increased the maximum amount
available thereunder. The credit facility now matures on January 25, 2020 and the maximum availability thereunder
has been increased to $140,000.
30
Ratios / Covenants
Pursuant to the DOT, the REIT may not incur or assume any indebtedness if, after giving effect to the incurring or
assumption of such indebtedness, the total indebtedness of the REIT would be more than 60% of the GBV (or 65% of
the GBV including convertible debentures) of its assets. The REIT’s overall borrowing policy is to obtain secured
mortgage financing on a primarily fixed rate basis, with a term to maturity that is appropriate having regard to the lease
maturity profile for each property and which allows the REIT to (i) achieve and maintain staggered debt maturities to
lessen exposure to interest rate fluctuations and refinancing risk in any particular period and (ii) fix the rates and extend
loan terms as long as possible when borrowing conditions are favourable. The following summarizes the status of these
key ratios as at December 31, 2017:
RATIOS/COVENANTS December 31, 2017
Gross Book Value $832,768 Debt (Face Value) $392,507 Debt to Gross Book Value 47% Amount of debt at fixed rates $358,696 Interest coverage (year ended December 31, 2017) 2.35x
Weighted average interest rate per annum 4.2%
During the year ended December 31, 2017 the REIT’s interest coverage ratio was impacted by costs totalling $13,980
related to the Asset Acquisition and Internalization and Proxy Matter. Excluding these costs, the REIT’s interest
coverage ratio would have been 3.15x.
Interest rates and debt maturities are reviewed regularly by the Trustees to ensure the appropriate debt management
strategies are implemented. The REIT intends to finance its ongoing operations primarily with a combination of fixed
rate secured debt with staggered maturities and floating rate secured short-term, construction and/or revolving debt.
The fixed rate debt is expected to be comprised primarily of first charge mortgages. The REIT’s capacity to incur
additional debt without issuing new equity or breaching its targeted and mandated leverage ratios discussed above is
as follows:
Debt to Gross Book Value Acquisition Capacity
55% $146,500
60% $269,000
65% $426,000
The REIT does not retain a material amount of operating cash flow to finance its capital requirements, including loan
principal repayments, acquisitions, redevelopments and portfolio capital expenditures. Capital requirements for loan
principal repayments, acquisitions and redevelopment are generally sourced by financing for each project through
mortgages and/or the revolving credit facility. For the three month period and year ended December 31, 2017, the
REIT’s Payout Ratio was 187% and 94%, respectively. During the three month period and year ended December 31,
2017, the REIT’s Payout Ratio was determined based on ACFO, which was negatively impacted due to costs related to
the Proxy Matter and the Asset Acquisition and Internalization. Included in ACFO for the three month period and year
ended December 31, 2017, were costs related to these matters totalling $5,210 and $5,537, respectively, and are not
expected to be reoccurring, however, the White Paper does not provide for adjustments of this nature. Excluding these
costs from ACFO, the REIT’s Payout Ratio would be 75% and 78% for the three month period and year ended December
31, 2017, respectively.
31
The REIT’s calculation of ACFO also includes a normalized reserve for capital and tenant expenditures as compared to
the actual capital and tenant expenditures incurred during the period. The normalized reserve represents the REIT’s
estimate of normalized, long-term, capital and tenant expenditures, based on a number of relevant factors, including
historical expenditures, management’s expectations and plans for the REIT’s properties and the REIT’s strategic
direction, and is subject to change. During the three month period and year ended December 31, 2017 the normalized
reserve totalled $1,861 and $7,165, respectively. Actual capital and tenant expenditures, after adjusting for capitalized
costs relating to the developments ongoing at the REIT’s Consumers Road complex were $5,309 and $24,010 for the
three month period and year ended December 31, 2017, respectively. Increases over the reserve for the three month
period and year ended December 31, 2017 relate primarily to leasing achievements at the REIT’s office properties in
Toronto, Ontario, Houston, Texas and Naperville, Illinois. The normalized reserve of capital and tenant expenditures is
estimated based on a percentage of Cash Revenue earned by the REIT. Due to the REIT’s lease expiry profile and near-
term leasing expectations at the REIT’s office properties, the REIT expects that leasing costs will exceed the reserve in
the near term due to capital commitments generally required in the office asset class relating to tenant incentives. The
REIT regularly reviews the expectation of future capital and tenant expenditures and believes that, due to the REIT’s
lease rollover profile and its current investment strategy focusing on the industrial property asset class, which typically
requires less capital and tenant expenses than the office asset class, the normalized reserve appropriately reflects
normalized, long-term, capital and tenant expenditures.
No off-balance sheet arrangements exist.
A reconciliation of revenue to Cash Revenue for the three month period and year ended December 31, 2017 is provided
below:
For the three month period ended For the year to date period ended
December 31, 2017 December 31, 2016 Variance December 31, 2017 December 31, 2016 Variance
Total property and property-related revenue $26,411 $23,167 $3,244 $101,560 $88,602 $12,958
Add: Rent amortization of tenant incentives $295 $408 ($113) $2,316 $1,565 $751
Less: Straight-line rent ($122) ($196) $74 ($1,521) ($631) ($890)
Cash Revenue $26,584 $23,379 $3,205 $102,355 $89,536 $12,819
Commitments and Contingencies
During the year ended December 31, 2014, the REIT entered into a lease agreement with Porsche Cars Canada Ltd. to
construct, under a build to suit agreement, and lease a newly constructed dealership and corporate head office
consisting of approximately 62,000 sqft, on existing lands at the REIT’s Consumers Road complex. The REIT contributed
approximately 3.3 acres of land (which was previously used for parking at the site) to the development. On July 28,
2017, Porsche Cars Canada Ltd. took occupancy of the premises and will lease the dealership for a term of 20 years (not
including renewal options).
In conjunction with the construction of the dealership noted above, the REIT is constructing a retail and parking facility
that will address the reduction of surface parking due to the newly constructed dealership and bring additional retail
amenities to the Consumers Road complex and the surrounding area.
On January 11, 2017 and January 31, 2017, the REIT received full building permits for the development of the retail and
parking facility, as well as the car dealership.
Currently, the REIT has two letters of credit outstanding in favour of the City of Toronto, which total $4,800, and relate
to the development.
32
On July 27, 2016, the REIT entered into agreements with certain arm’s-length private purchasers to sell the REIT’s
partnership interest in 165 Yorkland LP, a limited partnership created by the REIT to own a car dealership and corporate
head office at the Consumers Road complex pursuant to the aforementioned lease agreement with Porsche Cars
Canada. The sale price of the transaction, which closed on September 28, 2017, was approximately $42,276 before
transaction costs, working capital adjustments and holdbacks.
During the three month period ended December 31, 2017 the REIT substantially completed the development of the
parking garage and retail facility and placed the asset into service as of January 1, 2018.
In the normal course of operations, the REIT enters into leases with respect to its portfolio of investment properties,
which requires the REIT to expend resources for tenant incentives, leasing commissions and capital expenditures.
DISTRIBUTIONS AND ADJUSTED CASH FLOW FROM OPERATIONS
Distributions
The REIT has adopted a distribution policy pursuant to which the REIT intends to make cash distributions to Unitholders
on a monthly basis. The Payout Ratio for the three month period and year ended December 31, 2017 was 187% and
94%, respectively, compared to 74% and 73% for the three month period and year ended December 31, 2016,
respectively.
During the three month period and year ended December 31, 2017, the REIT’s Payout Ratio was determined based on
ACFO, which was negatively impacted due to costs related to the Proxy Matter and the Asset Acquisition and
Internalization. Included in ACFO for the three month period and year ended December 31, 2017, were costs related
to these matters totalling $5,210 and $5,537, respectively , and are not expected to be reoccurring, however, the White
Paper does not provide for adjustments of this nature. Excluding these costs from ACFO the REIT’s Payout Ratio would
be 75% and 78% for the three month period and year ended December 31, 2017, respectively.
Aggregate distributions per Unit for the three month period and year ended December 31, 2017 were $0.194 and
$0.784 per unit, respectively, which, for the year ended December 31, 2017, differs from the annualized distribution of
$0.775 per annum as purchasers of Units under the February 27, 2017 public offering participated in distributions
beginning in February 2017. For each month during the year ended December 31, 2017, the REIT distributed $0.06458
per Unit consistent with the annualized distribution of $0.775. On November 28, 2017 the REIT announced it would
increase its annualized distribution rate from $0.775 per Unit to $0.810 per Unit, representing an approximate 4.5%
increase. The increase was effective beginning with the January 2018 distribution.
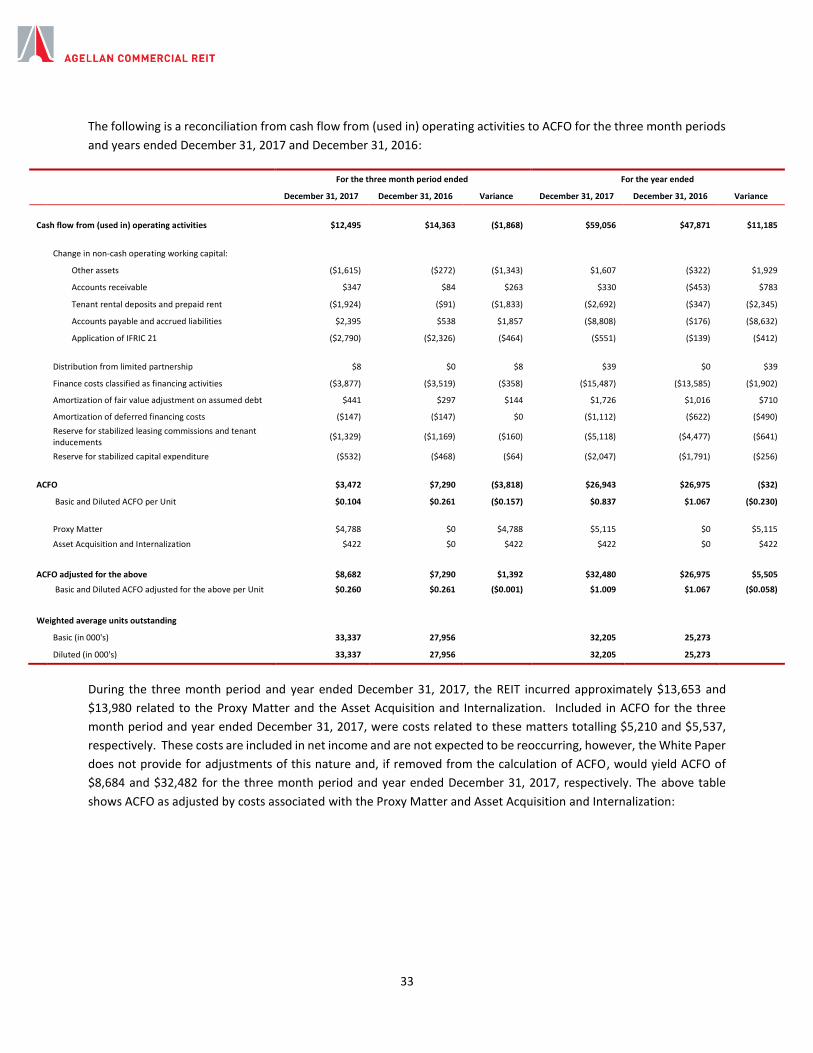
33
The following is a reconciliation from cash flow from (used in) operating activities to ACFO for the three month periods
and years ended December 31, 2017 and December 31, 2016:
For the three month period ended For the year ended
December 31, 2017 December 31, 2016 Variance December 31, 2017 December 31, 2016 Variance
Cash flow from (used in) operating activities $12,495 $14,363 ($1,868) $59,056 $47,871 $11,185 Change in non-cash operating working capital:
Other assets ($1,615) ($272) ($1,343) $1,607 ($322) $1,929
Accounts receivable $347 $84 $263 $330 ($453) $783
Tenant rental deposits and prepaid rent ($1,924) ($91) ($1,833) ($2,692) ($347) ($2,345)
Accounts payable and accrued liabilities $2,395 $538 $1,857 ($8,808) ($176) ($8,632)
Application of IFRIC 21 ($2,790) ($2,326) ($464) ($551) ($139) ($412) Distribution from limited partnership $8 $0 $8 $39 $0 $39
Finance costs classified as financing activities ($3,877) ($3,519) ($358) ($15,487) ($13,585) ($1,902)
Amortization of fair value adjustment on assumed debt $441 $297 $144 $1,726 $1,016 $710
Amortization of deferred financing costs ($147) ($147) $0 ($1,112) ($622) ($490)
Reserve for stabilized leasing commissions and tenant inducements
($1,329) ($1,169) ($160) ($5,118) ($4,477) ($641)
Reserve for stabilized capital expenditure ($532) ($468) ($64) ($2,047) ($1,791) ($256)
ACFO $3,472 $7,290 ($3,818) $26,943 $26,975 ($32)
Basic and Diluted ACFO per Unit $0.104 $0.261 ($0.157) $0.837 $1.067 ($0.230)
Proxy Matter $4,788 $0 $4,788 $5,115 $0 $5,115
Asset Acquisition and Internalization $422 $0 $422 $422 $0 $422
ACFO adjusted for the above $8,682 $7,290 $1,392 $32,480 $26,975 $5,505
Basic and Diluted ACFO adjusted for the above per Unit $0.260 $0.261 ($0.001) $1.009 $1.067 ($0.058)
Weighted average units outstanding
Basic (in 000's) 33,337 27,956 32,205 25,273
Diluted (in 000's) 33,337 27,956 32,205 25,273
During the three month period and year ended December 31, 2017, the REIT incurred approximately $13,653 and
$13,980 related to the Proxy Matter and the Asset Acquisition and Internalization. Included in ACFO for the three
month period and year ended December 31, 2017, were costs related to these matters totalling $5,210 and $5,537,
respectively. These costs are included in net income and are not expected to be reoccurring, however, the White Paper
does not provide for adjustments of this nature and, if removed from the calculation of ACFO, would yield ACFO of
$8,684 and $32,482 for the three month period and year ended December 31, 2017, respectively. The above table
shows ACFO as adjusted by costs associated with the Proxy Matter and Asset Acquisition and Internalization:
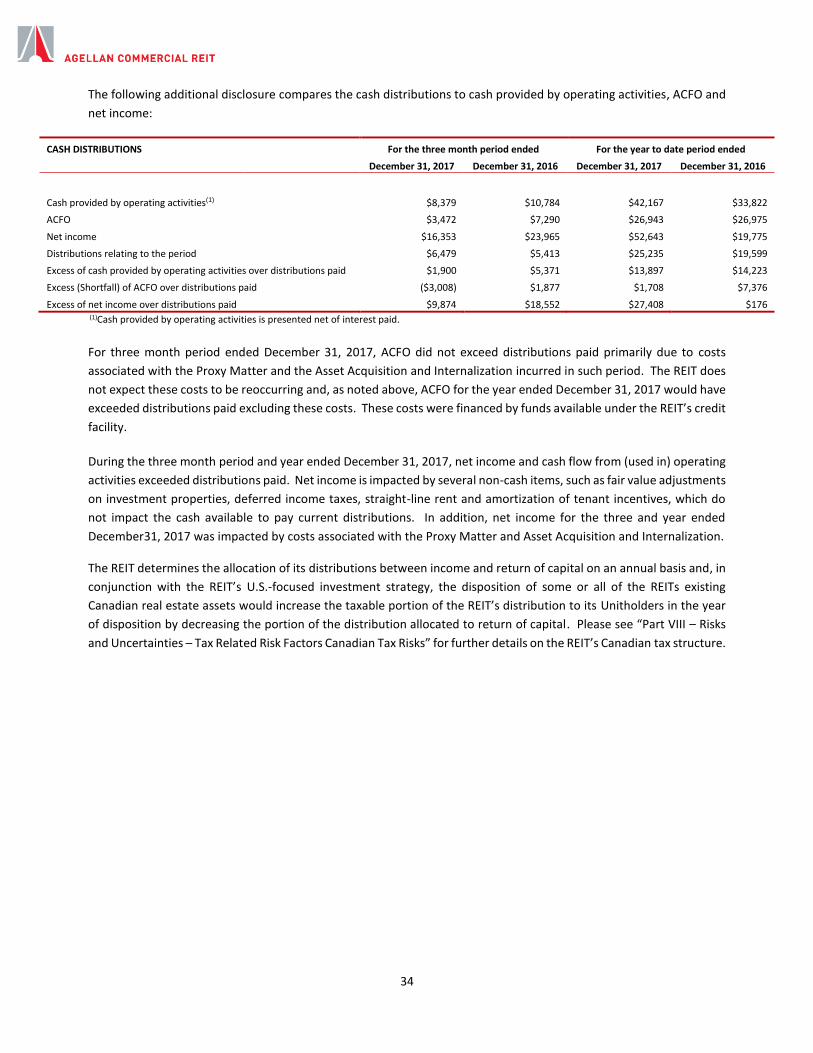
34
The following additional disclosure compares the cash distributions to cash provided by operating activities, ACFO and
net income:
CASH DISTRIBUTIONS For the three month period ended For the year to date period ended
December 31, 2017 December 31, 2016 December 31, 2017 December 31, 2016
Cash provided by operating activities(1) $8,379 $10,784 $42,167 $33,822
ACFO $3,472 $7,290 $26,943 $26,975
Net income $16,353 $23,965 $52,643 $19,775
Distributions relating to the period $6,479 $5,413 $25,235 $19,599
Excess of cash provided by operating activities over distributions paid $1,900 $5,371 $13,897 $14,223
Excess (Shortfall) of ACFO over distributions paid ($3,008) $1,877 $1,708 $7,376
Excess of net income over distributions paid $9,874 $18,552 $27,408 $176 (1)Cash provided by operating activities is presented net of interest paid.
For three month period ended December 31, 2017, ACFO did not exceed distributions paid primarily due to costs
associated with the Proxy Matter and the Asset Acquisition and Internalization incurred in such period. The REIT does
not expect these costs to be reoccurring and, as noted above, ACFO for the year ended December 31, 2017 would have
exceeded distributions paid excluding these costs. These costs were financed by funds available under the REIT’s credit
facility.
During the three month period and year ended December 31, 2017, net income and cash flow from (used in) operating
activities exceeded distributions paid. Net income is impacted by several non-cash items, such as fair value adjustments
on investment properties, deferred income taxes, straight-line rent and amortization of tenant incentives, which do
not impact the cash available to pay current distributions. In addition, net income for the three and year ended
December31, 2017 was impacted by costs associated with the Proxy Matter and Asset Acquisition and Internalization.
The REIT determines the allocation of its distributions between income and return of capital on an annual basis and, in
conjunction with the REIT’s U.S.-focused investment strategy, the disposition of some or all of the REITs existing
Canadian real estate assets would increase the taxable portion of the REIT’s distribution to its Unitholders in the year
of disposition by decreasing the portion of the distribution allocated to return of capital. Please see “Part VIII – Risks
and Uncertainties – Tax Related Risk Factors Canadian Tax Risks” for further details on the REIT’s Canadian tax structure.
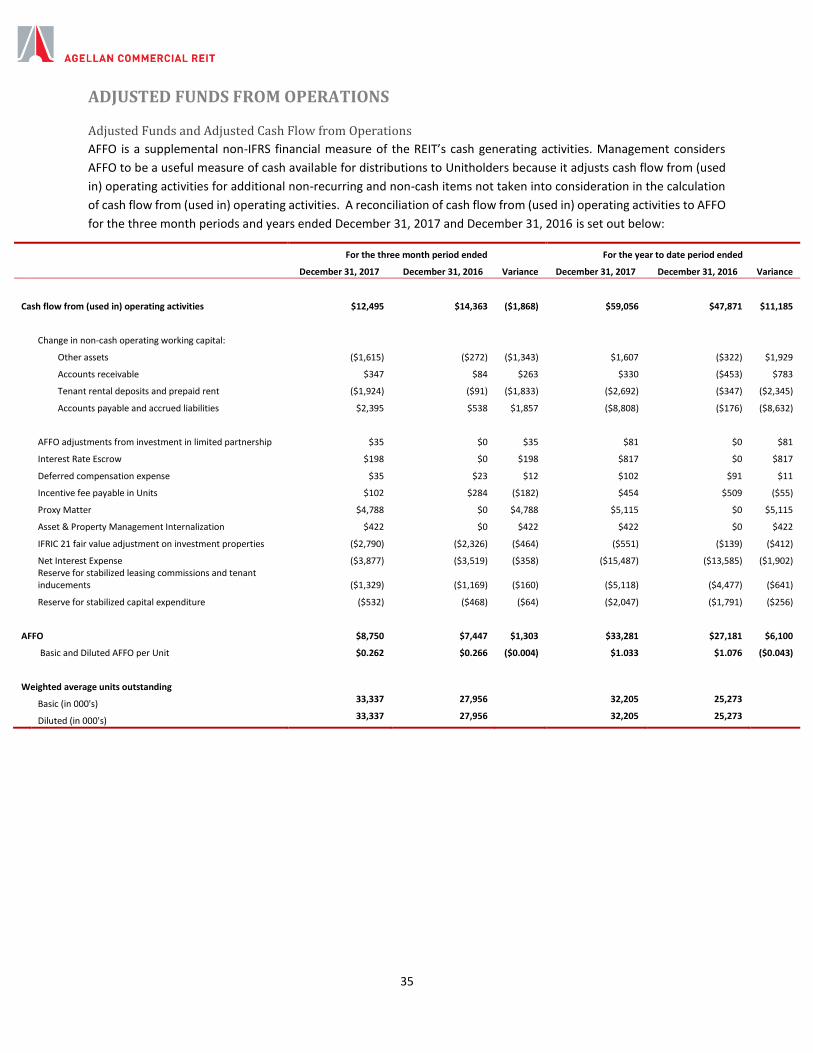
35
ADJUSTED FUNDS FROM OPERATIONS
Adjusted Funds and Adjusted Cash Flow from Operations
AFFO is a supplemental non-IFRS financial measure of the REIT’s cash generating activities. Management considers
AFFO to be a useful measure of cash available for distributions to Unitholders because it adjusts cash flow from (used
in) operating activities for additional non-recurring and non-cash items not taken into consideration in the calculation
of cash flow from (used in) operating activities. A reconciliation of cash flow from (used in) operating activities to AFFO
for the three month periods and years ended December 31, 2017 and December 31, 2016 is set out below:
For the three month period ended For the year to date period ended
December 31, 2017 December 31, 2016 Variance December 31, 2017 December 31, 2016 Variance
Cash flow from (used in) operating activities $12,495 $14,363 ($1,868) $59,056 $47,871 $11,185
Change in non-cash operating working capital:
Other assets ($1,615) ($272) ($1,343) $1,607 ($322) $1,929
Accounts receivable $347 $84 $263 $330 ($453) $783
Tenant rental deposits and prepaid rent ($1,924) ($91) ($1,833) ($2,692) ($347) ($2,345)
Accounts payable and accrued liabilities $2,395 $538 $1,857 ($8,808) ($176) ($8,632)
AFFO adjustments from investment in limited partnership $35 $0 $35 $81 $0 $81
Interest Rate Escrow $198 $0 $198 $817 $0 $817
Deferred compensation expense $35 $23 $12 $102 $91 $11
Incentive fee payable in Units $102 $284 ($182) $454 $509 ($55)
Proxy Matter $4,788 $0 $4,788 $5,115 $0 $5,115
Asset & Property Management Internalization $422 $0 $422 $422 $0 $422
IFRIC 21 fair value adjustment on investment properties ($2,790) ($2,326) ($464) ($551) ($139) ($412)
Net Interest Expense ($3,877) ($3,519) ($358) ($15,487) ($13,585) ($1,902)
Reserve for stabilized leasing commissions and tenant inducements ($1,329) ($1,169) ($160) ($5,118) ($4,477) ($641)
Reserve for stabilized capital expenditure ($532) ($468) ($64) ($2,047) ($1,791) ($256)
AFFO $8,750 $7,447 $1,303 $33,281 $27,181 $6,100
Basic and Diluted AFFO per Unit $0.262 $0.266 ($0.004) $1.033 $1.076 ($0.043)
Weighted average units outstanding
Basic (in 000's) 33,337 27,956 32,205 25,273
Diluted (in 000's) 33,337 27,956 32,205 25,273
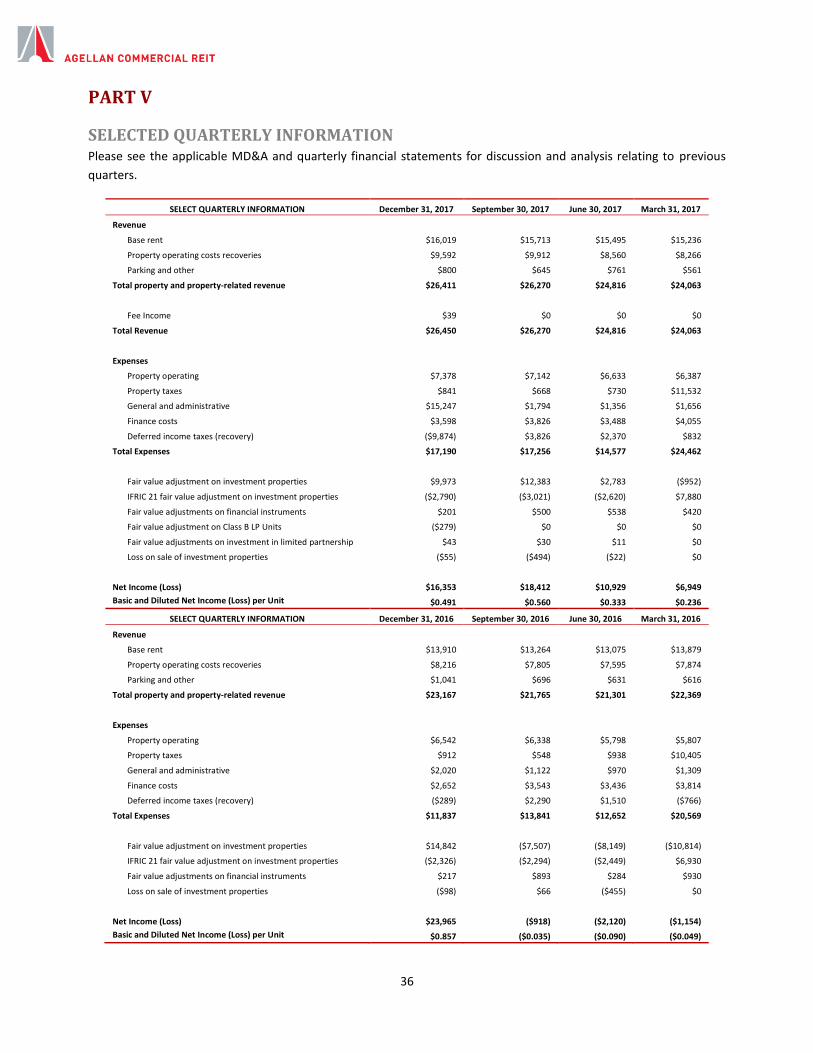
36
PART V
SELECTED QUARTERLY INFORMATION Please see the applicable MD&A and quarterly financial statements for discussion and analysis relating to previous
quarters.
SELECT QUARTERLY INFORMATION December 31, 2017 September 30, 2017 June 30, 2017 March 31, 2017
Revenue
Base rent $16,019 $15,713 $15,495 $15,236
Property operating costs recoveries $9,592 $9,912 $8,560 $8,266
Parking and other $800 $645 $761 $561
Total property and property-related revenue $26,411 $26,270 $24,816 $24,063
Fee Income $39 $0 $0 $0
Total Revenue $26,450 $26,270 $24,816 $24,063
Expenses
Property operating $7,378 $7,142 $6,633 $6,387
Property taxes $841 $668 $730 $11,532
General and administrative $15,247 $1,794 $1,356 $1,656
Finance costs $3,598 $3,826 $3,488 $4,055
Deferred income taxes (recovery) ($9,874) $3,826 $2,370 $832
Total Expenses $17,190 $17,256 $14,577 $24,462
Fair value adjustment on investment properties $9,973 $12,383 $2,783 ($952)
IFRIC 21 fair value adjustment on investment properties ($2,790) ($3,021) ($2,620) $7,880
Fair value adjustments on financial instruments $201 $500 $538 $420
Fair value adjustment on Class B LP Units ($279) $0 $0 $0
Fair value adjustments on investment in limited partnership $43 $30 $11 $0
Loss on sale of investment properties ($55) ($494) ($22) $0
Net Income (Loss) $16,353 $18,412 $10,929 $6,949
Basic and Diluted Net Income (Loss) per Unit $0.491 $0.560 $0.333 $0.236
SELECT QUARTERLY INFORMATION December 31, 2016 September 30, 2016 June 30, 2016 March 31, 2016
Revenue
Base rent $13,910 $13,264 $13,075 $13,879
Property operating costs recoveries $8,216 $7,805 $7,595 $7,874
Parking and other $1,041 $696 $631 $616
Total property and property-related revenue $23,167 $21,765 $21,301 $22,369
Expenses
Property operating $6,542 $6,338 $5,798 $5,807
Property taxes $912 $548 $938 $10,405
General and administrative $2,020 $1,122 $970 $1,309
Finance costs $2,652 $3,543 $3,436 $3,814
Deferred income taxes (recovery) ($289) $2,290 $1,510 ($766)
Total Expenses $11,837 $13,841 $12,652 $20,569
Fair value adjustment on investment properties $14,842 ($7,507) ($8,149) ($10,814)
IFRIC 21 fair value adjustment on investment properties ($2,326) ($2,294) ($2,449) $6,930
Fair value adjustments on financial instruments $217 $893 $284 $930
Loss on sale of investment properties ($98) $66 ($455) $0
Net Income (Loss) $23,965 ($918) ($2,120) ($1,154)
Basic and Diluted Net Income (Loss) per Unit $0.857 ($0.035) ($0.090) ($0.049)
37
PART VI
RELATED PARTY TRANSACTIONS Prior to the Asset Acquisition and Internalization related parties included ACPI and its principals, who are related due
to their ownership of Units, as well as due to certain common ownership interest in ACPI and the REIT. As discussed
below the REIT entered into an asset purchase agreement with ACPI to acquire all requisite assets of ACPI to internalize
its asset management function. The fees in respect of asset management and property management services discussed
below were incurred during the period up to November 13, 2017, being the date of the Asset Acquisition and
Internalization.
Asset Management Services
The REIT engaged ACPI or its related parties to perform asset management services for a fee of 0.4% of the REIT’s GBV,
as defined in the External Management Agreement. The cost of these services were $377 and $2,832 for the three
month period and year ended December 31, 2017, respectively. The cost of these services for the three month period
and year ended December 31, 2016 was $685, and $2,639, respectively. These costs were charged to general and
administrative expenses. As at December 31, 2017, $112 remains payable to ACPI or its related parties for these
services. The REIT has also reimbursed ACPI for certain costs incurred for general and administrative as well as
property-related expenses totalling $4 and $132 for the three month period and year ended December 31, 2017,
respectively. For the three month period and year ended December 31, 2016, the REIT reimbursed ACPI for certain
general and administrative as well as property related expenses totalling $18 and $85, respectively.
In conjunction with the Asset Acquisition and Internalization, ACPI will be paid an incentive fee for 2017 based on the
terms of the External Management Agreement. ACPI shall be paid an amount equal to the product of (a) 15% of any
excess AFFO per Unit as derived by the REIT for each fiscal year greater than 103% of forecast AFFO per Unit and (b)
the weighted average number of issued and outstanding Units over the applicable fiscal year. This incentive fee will be
measured and paid in Units, unless payment in Units triggers a taxable event for ACPI, in which case, a portion of the
incentive fee may be paid in cash with the approval of the Trustees. The incentive fee target will increase annually by
50% of the increase in the Canadian and United States consumer price indices (weighted by the GBV of the REIT’s
properties located in each jurisdiction). For the three month period and year ended December 31, 2017, $262 and $614,
respectively, was accrued and recognized in general and administrative expenses. For the three month period and year
ended December 31, 2016, $464 and $689, respectively, was accrued and recognized for the incentive fee. In
accordance with the External Management Agreement, the incentive fee will be measured and paid in Units, unless
payment in Units triggers a taxable event for ACPI, in which case, a portion of the incentive fee may be paid in cash
upon the approval of the Trustees. For the year ended December 31, 2017, the Trustees have approved payment of
$160 in cash.
Property Management Services
The REIT engaged ACPI or its related parties to perform property management services for certain of the REIT’s
properties for fees defined in the REIT’s property management agreements. The costs of these services aggregate to
$23 for the three month period ended December 31, 2017 and $504 for the year ended December 31, 2017. For the
three month period and year ended December 31, 2016, these fees were $138 and $563, respectively. As at December
31, 2017, $23 remains payable to ACPI or its related parties for these services.
Acquisitions
On April 25, 2017, the REIT acquired an industrial distribution facility located in Flint, Michigan. The facility comprises
approximately 400,000 sqft of GLA and was acquired for an aggregate purchase price of approximately US$16.0 million
(before closing costs). The property was previously managed by ACPI and certain principals of ACPI had an interest in
the property prior to acquisition by the REIT.
38
On September 18, 2017, the REIT entered into an asset purchase agreement with ACPI to internalize the REIT’s asset
management function (the “Asset Purchase Agreement”).
On November 13, 2017, the REIT entered into an amendment to the Asset Purchase Agreement and proceeded to close
the Asset Acquisition and Internalization. On closing, Agellan Management Limited Partnership (“Management LP”), a
wholly-owned subsidiary of the REIT, acquired all requisite assets of ACPI to internalize the REIT’s asset management
function and all executives and other employees of ACPI became employees of Management LP. The aggregate
consideration payable to ACPI on closing of the Asset Acquisition and Internalization was comprised an upfront $10,000
payment satisfied by 871,080 exchangeable Class B LP Units based on the volume weighted average closing price of the
REIT Units for the five trading days ending on the trading day prior to September 18, 2017. Such Class B LP Units will be
exchangeable on a one-for-one basis for units of the REIT. Up to an additional $3,000 of contingent cash payments may
be payable to ACPI depending on whether the REIT achieves certain performance thresholds for calendar years 2018
and 2019. ACPI is an “insider” of the REIT for the purposes of applicable securities laws.
Proxy Matter
On September 19, 2017, the REIT received a unitholder requisition from Sandpiper Group requesting that the REIT call
a special meeting of the REIT’s unitholders for the purpose of reconstituting the Board with five new trustees and
seeking an advisory vote of unitholders in respect of the Asset Acquisition and Internalization.
On November 13, 2017 the REIT announced it had entered into a settlement agreement with ELAD Canada Inc. and
Sandpiper Group. In relation to the Proxy Matter, the REIT incurred expenses of $4,788 and $5,115 for the three month
period and year ended December 31, 2017, respectively. Included in such expenses are legal and advisory costs
incurred directly by the REIT and a $2,987 reimbursement of costs incurred by ELAD Canada Inc. and Sandpiper Group.
ELAD Canada Inc. received $1,102 of the reimbursement and Sandpiper Group received $1,885 of the reimbursement.
Individuals affiliated with ELAD Canada Inc. and Sandpiper Group are related parties of the REIT by virtue of their
positions as Trustees.
Deferred Unit Incentive Plan
The REIT has a deferred unit incentive plan which provides plan members with the right to receive Units, which are
puttable. The REIT estimates the fair value of the deferred Units on issuance, and amortizes this Unit based
compensation expense over the vesting period. The awards are fair valued on the basis of the Unit price at each
reporting period and the change in fair value of the amortized Unit based compensation expense is recognized as Unit
based compensation expense.
All members of the Board are required to receive 50% of their respective annual retainer and meeting fees for the fiscal
year in the form of deferred Units. Trustees may further elect to take up to 100% of their compensation in deferred
Units. Deferred Units issued to Trustees in lieu of their annual retainer and meeting fees vest immediately. However,
in no event shall the exercise of the Trustees’ deferred Units in lieu of their annual retainer and meeting fees occur
prior to the third anniversary of the grant date, except in the event where their services have been terminated.
For the three month period and year ended December 31, 2017, 1,254 and 7,984 deferred Units, respectively, were
granted for services rendered. In addition, 366 and 1,379 income deferred Units were granted for the three month
period and year ended December 31, 2017 through distributions to Trustees in respect of such deferred Units and
income deferred Units.
39
PART VII
SIGNIFICANT ACCOUNTING POLICIES AND ESTIMATES A summary of significant accounting policies and estimates is described in notes 1 and 2 of the REIT’s consolidated
financial statements for the years ended December 31, 2017 and December 31, 2016. There are no material changes
to the REIT’s significant accounting policies or estimates as of December 31, 2017 that have not been disclosed herein
or in notes 1 and 2 of the REIT’s consolidated financial statements for the years ended December 31, 2017 and
December 31, 2016.
The preparation of financial statements requires management to make estimates and assumptions that affect the
reported amounts of assets and liabilities and disclosure of contingent assets and liabilities at the date of the financial
statements and the reported amounts of revenue and expenses during the year. Actual reports could differ from those
estimates. The significant areas of estimation are outlined in the notes to the REIT’s consolidated financial statements
for the years ended December 31, 2017 and December 31, 2016.
Fair Value of Investment Properties
The significant estimates used when determining the fair value of investment properties are capitalization rates and
discount rates. The capitalization rates and discount rates applied are reflective of the characteristics of the property,
location and market of each investment property. Management determines fair value internally utilizing internal
financial information, external market data, and capitalization rates provided by industry experts and third party
appraisals.
The REIT determines the fair value of each investment property internally using the discounted cash flow method. The
discounted cash flow method discounts the expected future cash flows, generally over a 10 year term, including a
terminal value based on the application of a capitalization rate to estimated year 11 cash flows. The discounted cash
flows reflect rental income from current leases and assumptions about rental income from future leases reflecting
market conditions at the reporting date, less future cash outflows in respect of such leases.
The key valuation assumptions for the REIT’s investment properties are set out in the following table:
KEY VALUATION ASSUMPTIONS December 31, 2017
Canada United States
Discount rates - range 7.25% - 7.25% 7.00% - 12.00%
Discount rate - weighted average 7.25% 8.64%
Terminal capitalization rates - range 7.00% - 7.00% 6.5% - 11.5%
Terminal capitalization rate - weighted average 7.00% 7.88%
As at December 31, 2017, changes in the terminal capitalization rates and discount rates would result in a change to
the fair value of the REIT’s investment properties as set out in the following table:
Weighted average discount rate: 25-basis points increase $ (14,222) 25-basis points decrease 14,558
Weighted average terminal capitalization rate: 25-basis points increase (14,882) 25-basis points decrease 15,909
40
PART VIII
RISKS AND UNCERTAINTIES The REIT faces a variety of significant and diverse risks, many of which are inherent in the business conducted by the
REIT and the tenants of the properties. Described below are certain risks that could materially affect the REIT. Other
risks and uncertainties that the REIT does not presently consider to be material, or of which the REIT is not presently
aware, may become important factors that affect the REIT’s future financial condition and results of operations. The
occurrence of any of the risks discussed below could materially and adversely affect the business, prospects, financial
condition, and results of operations or cash flow of the REIT.
Any capitalized terms used below and not defined herein have the meanings attributed to such terms in the REIT’s
annual information form for the year ended December 31, 2016, which is available on SEDAR at www.sedar.com.
Risk Factors Related to the Real Estate Industry and the Business of the REIT
Real Property Ownership and Tenant Risks
Real estate ownership is generally subject to numerous factors and risks, including changes in general economic
conditions (such as the availability, terms and cost of mortgage financings and other types of credit), local economic
conditions (such as an oversupply of properties or a reduction in demand for real estate in the area), the attractiveness
of properties to potential tenants or purchasers, competition with other landlords with similar available space, and the
ability of the owner to provide adequate maintenance at competitive costs.
The REIT’s properties (the “Properties”) generate income through rent payments made by tenants. Upon the expiry or
termination of any lease, there can be no assurance that the lease will be renewed or the tenant replaced for a number
of reasons. Furthermore, the terms of any subsequent lease may be less favourable than the existing lease, including
the addition of restricted covenants. The REIT is also party to certain leases which provide the tenant with the right to
terminate prior to expiry of the lease. The REIT’s cash flows and financial position would be materially adversely
affected if its tenants were to become unable to meet their obligations under their leases or if a significant number of
tenants exercised early termination options or if a significant amount of available space in the Properties was not able
to be leased on economically favourable lease terms. In the event of default by a tenant, the REIT may experience
delays or limitations in enforcing its rights as lessor and incur substantial costs in protecting its investment. In addition,
restrictive covenants may narrow the field of potential tenants at a property and could contribute to difficulties in
leasing space to new tenants. Furthermore, at any time, a tenant may seek the protection of bankruptcy, insolvency or
similar laws which could result in the rejection and termination of the lease of the tenant and, thereby, cause a
reduction in the REIT’s cash flows, financial condition and results of operations and its ability to make distributions to
Unitholders.
Liquidity
An investment in real estate is relatively illiquid. Such illiquidity will tend to limit the REIT’s ability to vary its portfolio
promptly in response to changing economic or investment conditions. In recessionary times it may be difficult to
dispose of certain types of real estate. The costs of holding real estate are considerable and during an economic
recession the REIT may be faced with ongoing expenditures with a declining prospect of incoming receipts. In such
circumstances, it may be necessary for the REIT to dispose of properties at lower prices in order to generate sufficient
cash for operations and make distributions to Unitholders. The REITs operating line availability is also subject to certain
conditions relating to the financial performance of the properties securing the facility.
Financing Risks
As of December 31, 2017, the REIT had outstanding indebtedness at face value of $392,507. Although a portion of the
cash flow generated by the Properties will be devoted to servicing the REIT’s debt, there can be no assurance that the
41
REIT will continue to generate sufficient cash flow from operations to meet required interest and principal payments.
If the REIT is unable to meet interest or principal payments, it could be required to seek renegotiation of such payments
or obtain additional equity, debt or other financing. The failure of the REIT to make or renegotiate interest or principal
payments or obtain additional equity, debt or other financing could adversely impact the REIT’s financial condition and
results of operations and decrease the amount of cash available for distribution to Unitholders.
The REIT will be subject to the risks associated with debt financing, including the risk that the mortgages and banking
facilities secured by the Properties will not be able to be refinanced or that the terms of such refinancing will not be as
favourable as the terms of existing indebtedness, which may reduce AFFO. To the extent the REIT incurs variable rate
indebtedness, this will result in fluctuations in the REIT’s cost of borrowing as interest rates change. To the extent that
interest rates rise, the REIT’s operating results and financial condition could be adversely affected and decrease the
amount of cash available for distribution to Unitholders.
The REIT’s credit facilities contain covenants that require it to maintain certain financial ratios on a consolidated basis.
If the REIT does not maintain such ratios, its ability to make distributions to Unitholders will be limited.
Tax-Related Risk Factors Canadian Tax Risks
Non-Resident Ownership — The REIT intends to comply with the requirements under the Tax Act at all relevant times
such that it maintains its status as a “unit trust” and a “mutual fund trust” for purposes of the Tax Act. Under the Tax
Act, a trust may lose its status as a mutual fund trust if it can reasonably be considered that the trust was established
or is maintained primarily for the benefit of non-resident persons, except in limited circumstances. Accordingly, non-
residents may not be the beneficial owners of more than 49% of the Units (determined on a basic or a fully diluted
basis). The Trustees also have various powers that can be used for the purpose of monitoring and controlling the extent
of non-resident ownership of the Units.
The restrictions on the issuance of Units by the REIT to non-residents may negatively affect the REIT’s ability to raise
financing for future acquisitions or operations. In addition, the non-resident ownership restrictions may negatively
impact the liquidity of the Units and the market price at which Units can be sold.
REIT Exception — Although, as of the date hereof, management believes that the REIT has met the requirements of the
REIT Exception throughout 2017, there can be no assurance that the REIT will be able to qualify for the REIT Exception
such that the REIT and the Unitholders will not be subject to the SIFT Rules in 2017 or in future years. A disposition
by the REIT of a portion of its real estate assets in a year may result in the REIT failing to meet the requirements of the
REIT Exemption for the year of the disposition and future years. If the REIT does not meet the conditions for the REIT
Exemption for a year, it may be subject to SIFT tax on its “non-portfolio earnings” distributed during that year.
In the event that the SIFT Rules apply to the REIT, the impact to Unitholders will depend on the status of the Unitholders
and, in part, on the amount of income distributed which would not be deductible by the REIT in computing its income
in a particular year and what portions of the REIT’s distributions to Unitholders constitute “non-portfolio earnings”,
other income and returns of capital.
The SIFT Rules may adversely affect the marketability of the Units, the amount of cash available for distributions to
Unitholders and the after-tax return to investors.
Foreign Accrual Property Income — Foreign Accrual Property Income (“FAPI”) earned by Agellan Commercial REIT U.S.,
Inc. (“Agellan U.S.”) must be included in computing Agellan Commercial REIT Holdings Inc.’s (“Agellan Canada”) income
for the taxation year of Agellan Canada in which the taxation year of Agellan U.S. ends, subject to a deduction for
grossed-up “foreign accrual tax” as computed in accordance with the Tax Act. The deduction for grossed- up “foreign
accrual tax” may not fully offset the FAPI realized by Agellan U.S., thereby increasing Agellan Canada’s Canadian tax
liability and reducing cash available for distribution to Unitholders. In addition, as FAPI generally must be computed in
accordance with Part I of the Tax Act as though the affiliate were a resident of Canada (subject to the detailed rules
42
contained in the Tax Act), income or transactions that are not taxable to Agellan U.S. under the Code may still give rise
to FAPI for purposes of the Tax Act and, accordingly, may result in a Canadian tax liability of Agellan Canada, thereby
reducing cash available for distribution to Unitholders.
Change of Law — There can be no assurance that Canadian federal income tax laws, the judicial interpretation thereof,
the terms of the tax treaty between Canada and the United States, or the administrative and assessing practices and
policies of the CRA and the Department of Finance (Canada) will not be changed in a manner that adversely affects the
REIT or Unitholders. Any such change may increase the amount of tax payable by the REIT or its affiliates or may
otherwise adversely affect Unitholders by reducing the amount available to pay distributions to Unitholders or changing
the tax treatment applicable to Unitholders in respect of such distributions. Should the REIT cease to qualify as a mutual
fund trust under the Tax Act, the consequences may be material and adverse.
Non-Residents of Canada — The Tax Act may impose additional withholding or other taxes on distributions made by
the REIT to Unitholders who are non-resident for purposes of the Tax Act. These taxes and any reduction thereof under
an applicable tax treaty between Canada and another country may change from time to time.
Limit on Activities
To maintain its status as a “mutual fund trust” under the Tax Act, the REIT cannot carry on most active business activities
and is limited in the types of investments it may make. The DOT contains restrictions to this effect.
U.S. Tax Risks
U.S. Internal Revenue Service Challenge — The U.S. Internal Revenue Service (“IRS”) may challenge certain tax positions
taken by the REIT, Agellan Canada, and Agellan U.S., including the position that the interest on the Agellan U.S. Notes
is deductible or not subject to withholding . If such a challenge were sustained, interest payments on the Agellan U.S.
Notes would be recharacterized as non-deductible distributions with respect to Agellan U.S.’s equity and could be
subject to U.S. withholding taxes.
Even if the Agellan U.S. Notes are properly characterized as debt, there is a risk that amounts payable by Agellan U.S.
under the Agellan U.S. Notes may be found to be in excess of those payable at arm’s length. In such event, the excess
over the arm’s length amount could be re-characterized as non-deductible distributions on equity. The inability of
Agellan U.S. to deduct all or a portion of the interest paid on the Agellan U.S. Notes could materially increase its taxable
income and thus its U.S. federal income tax. In addition, the re-characterization of interest payments as distributions
on equity could cause such payments to be subject to U.S. federal withholding tax. These changes would adversely
affect the financial position and cash flow of Agellan U.S. and would reduce its after-tax income available for
distribution.
Section 385 of the Code — U.S. Treasury Regulations under Section 385 of the Code impose additional limitations on
intercompany debt incurred by Agellan U.S. These regulations treat related party debt as equity for U.S. federal income
tax purposes in certain circumstances, including, for example, in certain circumstances in which a debtor corporation
makes a distribution exceeding certain current and accumulated earnings and profits. The Code Section 385 regulations
generally apply only to related party debt issued by U.S. corporations after April 4, 2016. However, the regulations may
also recharacterize as equity certain related party debt refinanced or otherwise deemed reissued after April 4, 2016,
subject to complex exceptions. If any portion of the Agellan U.S. Notes were so recharacterized, then the otherwise
deductible interest paid on such portion could be recharacterized as a non-deductible distribution subject to U.S.
federal withholding tax. Such withholding tax, as well as the loss of the deduction by Agellan U.S., would increase
Agellan U.S.’s U.S. federal income tax liability. A material increase in such U.S. federal income tax liability could
materially and adversely affect the business, prospects, financial condition, results of operations or cash flow of the
REIT and its ability to make distributions to Unitholders.
43
Dispositions of Real Property — Agellan U.S. will be subject to tax under the Code on its disposition of real property,
whether such property is sold directly or indirectly through the sale of securities of an underlying entity. In addition,
Agellan Canada generally will be subject to tax under the Code on a disposition or deemed disposition of stock of Agellan
U.S. if Agellan U.S. is a “United States real property holding corporation”. U.S. taxes paid in connection with such
dispositions will reduce the after-tax proceeds received by the REIT on such sales.
Section 163(j) of the Code — For taxable years beginning after December 31, 2017, Section 163(j) of the Code, as
amended by the Tax Cuts and Jobs Act, limits the deductibility of net interest expense paid or accrued on debt properly
allocable to a trade or business to 30% of “adjusted taxable income,” subject to certain exceptions. Any interest expense
in excess of the limitation is carried forward and may be deducted in a subsequent year, subject to the 30% limitation.
Adjusted taxable income is determined without regard to certain deductions, including those for net interest expense,
net operating loss carryforwards and, for taxable years beginning before January 1, 2022, depreciation, amortization,
and depletion. Provided the taxpayer makes a timely election, the 30% limitation does not apply to a trade or business
involving real property development, redevelopment, construction, reconstruction, acquisition, conversion, rental,
operation, management, leasing, or brokerage, as defined for U.S. federal income tax purposes. If this election is made,
depreciable real property held by the relevant trade or business must be depreciated under an alternative depreciation
system under the Code, which system is generally over a longer period of time than the generally applicable system of
depreciation under the Code. If Agellan U.S. (or another applicable U.S. affiliate) does not make the election or if the
election is determined not to be available with respect to all or certain of our U.S. business activities, then the new
interest deduction limitation could result in an increase in Agellan U.S.’s U.S. federal income tax liability. A material
increase in such U.S. federal income tax liability could materially and adversely affect the business, prospects, financial
condition, results of operations or cash flow of the REIT and its ability to make distributions to Unitholders.
Tax Cuts and Jobs Act - On December 22, 2017, the U.S. enacted the Tax Cuts and Jobs Act. Among a number of
significant changes to the Code, the Tax Cuts and Jobs Act reduces the marginal U.S. corporate income tax rate from
35% to 21%, limits the deduction for net interest expense, shifts the United States toward a modified territorial tax
system, changes the rules governing the use of net operating loss carryforwards, and imposes new taxes to combat
erosion of the U.S. federal income tax base.
The REIT has been in the process of reviewing the impact of the new legislation on the REIT’s U.S. tax position. For the
year ended December 31, 2017, the REIT has re-measured the REIT’s deferred taxes to reflect the reduced federal
corporate tax rate of 21% effective January 1, 2018 which will apply in future years when these deferred taxes are
settled or realized. The REIT has also analyzed the REIT’s AMT utilization in the future years since the existing AMT
credits could be now refundable if not used to offset actual tax liability., It is estimated that the REIT’s AMT credits are
likely to be utilized in next year based on the REIT’s 2018 income forecast. Accordingly, the REIT kept the AMT credits
as a deferred asset as of December 31, 2017.
The REIT will continue to evaluate the impact of the Tax Cuts and Jobs Act on its business. There can be no assurance
(i) that the U.S. federal income tax liability of Agellan U.S. or its affiliates will not increase (including as a result of a
reduction in the ordinary course of the amortization or depreciation basis of Agellan Commercial REIT U.S. L.P.’s (the
“Partnership”) property (without sufficient additional capital expenditures to replace such basis) or due to additional
limitations on Agellan U.S. ability to claim a deduction for U.S. federal income tax purposes for interest paid on the
Agellan U.S. Notes, and (ii) that the laws, the judicial interpretation thereof, the terms of the tax treaty between the
United States and Canada, or the administrative and assessing practices and policies of the IRS and the U.S. Treasury
Department will not change, possibly on a retroactive basis, in a manner that adversely affects the REIT or Unitholders.
Any increase in the amount of U.S. federal income tax payable by Agellan U.S. or its affiliates could adversely affect
Unitholders by reducing the amount available to pay distributions to Unitholders.
44
Development Risk
Development risk arises from the possibility that completed developments will not be leased or that costs of
development will exceed original estimates, resulting in an uneconomic return from the leasing of such space. The
REIT’s construction commitments are subject to those risks usually attributable to construction projects, which include:
(i) construction or other unforeseen delays, including municipal approvals; (ii) cost overruns; (iii) the failure of tenants
to occupy and pay rent in accordance with lease agreements, some of which are conditional; (iv) the inability to achieve
projected rental rates or anticipated timing of leasing activity; and (v) an increase in interest rates during the life of the
development or redevelopment.
Current Economic Environment
Continued concerns about the uncertainty over whether the economy will be adversely affected by inflation, deflation
or stagflation, and the systemic impact of increased unemployment, volatile energy prices, geopolitical issues, the
availability and cost of credit, and the mortgage market in the United States have contributed to increased market
volatility and weakened business and consumer confidence. This difficult operating environment could adversely affect
the REIT’s ability to generate revenues, thereby reducing its operating income and earnings. If these economic
conditions continue, the REIT’s tenants may be unable to meet their rental payments and other obligations due to the
REIT, which could have a material adverse effect on the REIT.
Geographic Concentration
The Properties are located in the United States and Canada, primarily in Texas and Georgia and a significant portion of
the REIT’s NOI is derived from Texas, Georgia, Ontario and the Chicago metropolitan statistical area. As a result, the
REIT’s performance is particularly sensitive to economic changes in Texas, Georgia, Ontario, Florida and Chicago. The
market value of the Properties, the income generated by the REIT and the REIT’s performance are particularly sensitive
to changes in the economic condition and regulatory environment of Texas, Georgia, Ontario and Chicago. Adverse
changes in the economic condition or regulatory environment of Texas, Georgia, Ontario or Chicago may have a
material adverse effect on the REIT’s business, cash flows, financial condition and results of operations and ability to
make distributions to Unitholders.
Tenant Concentration
The REIT derives a significant portion of its in-place base rental revenue from its ten largest tenants. Consequently,
revenues are dependent on the ability of those tenants to meet rent obligations and the REIT’s ability to collect rent
from them. If such tenants default on or cease to satisfy their payment obligations, it could adversely impact the REIT’s
financial condition and results of operations and decrease the amount of cash available for distribution to Unitholders.
Access to Capital
The real estate industry is highly capital intensive. The REIT will require access to capital to maintain its properties, as
well as to fund its growth strategy and certain capital expenditures from time to time. Although the credit facility is
available for acquisitions, there can be no assurances that the REIT will otherwise have access to sufficient capital or
access to capital on terms favourable to the REIT for future property acquisitions, financing or refinancing of properties,
funding operating expenses or other purposes. Failure by the REIT to access required capital could adversely impact
the REIT’s financial condition and results of operations and decrease the amount of cash available for distribution to
Unitholders.
Acquisitions
The REIT’s business plan includes, among other things, growth through identifying suitable acquisition opportunities,
pursuing such opportunities, consummating acquisitions and leasing such properties. If the REIT is unable to manage
its growth effectively, it could adversely impact the REIT’s financial position and results of operation and decrease the
amount of cash available for distributions to Unitholders. There can be no assurance as to the pace of growth through
45
property acquisitions or that the REIT will be able to acquire assets on an accretive basis and, as such, there can be no
assurance that distributions to Unitholders will increase in the future.
Competition
The REIT competes with other investors, managers and owners of properties in seeking tenants and for the purchase
and development of desirable real estate properties. Some of the industrial, office and retail properties of the REIT’s
competitors are newer, better located or better capitalized than the Properties. Certain of these competitors may have
greater financial and other resources and greater operating flexibility than the REIT. The existence of competing
managers and owners could have a material adverse effect on the REIT’s ability to lease space and on the rents the REIT
is able to charge, and could materially adversely affect revenues and the REIT’s ability to meet its obligations.
Foreign Currency Fluctuation
A portion of the REIT’s operations are conducted in the United States and the financial position and results for these
operations are denominated in USD. The REIT’s functional and reporting currency is the CAD. Accordingly, the revenues
and expenses of the United States operations are translated at average rates of exchange in effect during the period.
Assets and liabilities are translated at the exchange rates in effect at the balance sheet date. As a result, the REIT’s
consolidated financial position is subject to foreign currency fluctuation risk on the United States operations, which
could adversely impact its operating results and its cash flows. In addition, because the distributions to Unitholders are
denominated in CAD, the cash available for distribution to Unitholders could be adversely impacted. Although the REIT
has entered into currency hedging arrangements in respect of its foreign currency cash flows, there are no assurances
that the full amount of the foreign currency exposure will be hedged at any time.
Capital Expenditures and Fixed Costs
Certain significant expenditures, including property taxes, maintenance costs, mortgage payments, insurance costs and
related charges, must be made throughout the period of ownership of real property, regardless of whether the property
is producing sufficient income to pay such expenses. This may include expenditures to fulfill mandatory requirements
for energy efficiency. In order to retain desirable rentable space and to generate adequate revenue over the long term,
the REIT must maintain or, in some cases, improve each property’s condition to meet market demand. Maintaining a
rental property in accordance with market standards can entail significant costs, which the REIT may not be able to
pass on to its tenants. Numerous factors, including the age of the relevant building structure, the material and
substances used at the time of construction or currently unknown building code violations could result in substantial
unbudgeted costs for refurbishment or modernization.
If the actual costs of maintaining or upgrading a property exceed the REIT’s estimates, or if hidden defects are
discovered during maintenance or upgrading which are not covered by insurance or contractual warranties, or if the
REIT is not permitted to raise rents due to legal constraints, the REIT will incur additional and unexpected costs. If
competing properties of a similar type are built in the area where one of the Properties is located or similar properties
located in the vicinity of one of the Properties are substantially refurbished, the NOI derived from and the value of such
property could be reduced. Any failure by the REIT to undertake appropriate maintenance and refurbishment work in
response to the factors described above could materially adversely affect the rental income that the REIT earns from
such properties; for example, such a failure could entitle tenants to withhold or reduce rental payments or even to
terminate existing leases. Any such event could have a material adverse effect on the REIT’s cash flows, financial
condition and results of operations and its ability to make distributions to Unitholders.
Derivative Risks
The REIT invests in and uses derivative instruments, including futures, forwards, options and swaps, to manage its
currency exchange and interest rate risks inherent in its operations. There can be no assurance that the REIT’s hedging
activities will be effective. Further, these activities, although intended to mitigate price volatility, expose the REIT to
other risks. The REIT is subject to the credit risk that its counterparty (whether a clearing corporation in the case of
46
exchange traded instruments or another third party in the case of over-the-counter instruments) may be unable to
meet its obligations. In addition, there is a risk of loss by the REIT of margin deposits in the event of the bankruptcy of
the dealer with whom the REIT has an open position in an option or futures or forward contract. In the absence of
actively quoted market prices and pricing information from external sources, the valuation of these contracts involves
judgment and use of estimates. As a result, changes in the underlying assumptions or use of alternative valuation
methods could affect the reported fair value of these contracts. The ability of the REIT to close out its positions may
also be affected by exchange-imposed daily trading limits on options and futures contracts. If the REIT is unable to close
out a position, it will be unable to realize its profit or limit its losses until such time as the option becomes exercisable
or expires or the futures or forward contract terminates, as the case may be. The inability to close out options, futures
and forward positions could also have a material adverse effect on the REIT’s ability to use derivative instruments to
effectively hedge its currency exchange and interest rate risks.
Environmental Matters
Environmental legislation and regulations have become increasingly important in recent years. As a current or previous
owner of interests in real property in the United States and Canada, the REIT is subject to various United States and
Canadian federal, state, provincial and municipal laws relating to environmental matters. Such laws provide that the
REIT could be, or become, liable for environmental harm, damage or costs, including with respect to the release of
hazardous, toxic or other regulated substances into the environment, and the removal or other remediation of
hazardous, toxic or other regulated substances that may be present at or under its properties. Further, liability may be
incurred by the REIT with respect to the release of such substances from or to the Properties. These laws often impose
liability regardless of whether the property owner knew of, or was responsible for, the presence of such substances.
Those laws also govern the maintenance and removal of asbestos containing materials in the event of damage,
demolition or renovation of a property and also govern emissions of and exposure to asbestos fibres in the air. Certain
of the Properties contain or might contain asbestos containing materials. The costs of investigation, removal and
remediation of such substances or properties, if any, may be substantial and could adversely affect the REIT’s financial
condition and result of operations but is not estimable. The presence of contamination or the failure to remediate
contamination may also adversely affect the REIT’s ability to sell such property, realize the full value of such property
or borrow using such property as collateral security, and could potentially result in claims against the REIT by public or
private parties.
The Properties may contain ground contamination, hazardous substances, and/or other residual pollution and
environmental risks. Buildings and their fixtures might contain asbestos or other hazardous substances such as
polychlorinated biphenyl, dichlordiphenyltrichlorethan, pentachlorphenol or lindane above the allowable or
recommended thresholds, or other environmental risks could be associated with the buildings. The REIT bears the risk
of cost-intensive assessment, remediation or removal of such ground contamination, hazardous substances or other
residual pollution. The discovery of any such residual pollution on the sites and/or in the buildings, particularly in
connection with the lease or sale of properties or borrowing using the real estate as security, could trigger claims for
rent reductions or termination of leases for cause, for damages and other breach of warranty claims against the REIT.
The remediation of any pollution and the related additional measures the REIT would have to undertake could have a
materially adverse effect on the REIT and could involve considerable additional costs. The REIT is also exposed to the
risk that recourse against the polluter or the previous owners of the properties might not be possible. Moreover, the
existence or even the mere suspicion of the existence of ground contamination, hazardous materials or other residual
pollution can materially adversely affect the value of a property and the REIT’s ability to lease or sell such a property.
The REIT’s operating policy is to obtain a Phase I environmental site assessment, conducted by an independent and
experienced environmental consultant, prior to acquiring a property and to have Phase II environmental site
assessment work completed where recommended in a Phase I environmental site assessment. Despite obtaining such
environmental site assessments, the REIT may become subject to liability for undetected contamination or other
47
environmental conditions at its properties, which could negatively impact the REIT’s financial condition and results of
operations and decrease the amount of cash available for distribution.
The REIT intends to make the necessary capital and operating expenditures to comply with environmental laws and
address any material environmental issues and such costs relating to environmental matters may have a material
adverse effect on the REIT’s business, financial condition or results of operation and decrease the amount of cash
available for distribution. However, environmental laws can change and the REIT may become subject to even more
stringent environmental laws in the future, with increased enforcement of laws by the government. Compliance with
more stringent environmental laws, which may be more rigorously enforced, the identification of currently unknown
environmental issues or an increase in the costs required to address a currently known condition may have an adverse
effect on the REIT’s financial condition and results of operation and decrease the amount of cash available for
distribution to Unitholders.
Natural Disasters
Certain of the Properties are located in Texas and Florida, where buildings have sustained storm damage in the past.
While the REIT has insurance to cover a substantial portion of the cost of natural disasters, the REIT’s insurance includes
deductible amounts and certain items may not be covered by insurance. Future natural disasters may significantly affect
the REIT’s operations and properties and, more specifically, may cause the REIT to experience reduced rental revenue
(including from increased vacancy), incur clean-up costs or otherwise incur costs in connection with such events. Any
of these events may have a material adverse effect on the REIT’s business, cash flows, financial condition and results
of operations and ability to make distributions to Unitholders.
Regulation
The REIT is subject to laws and regulations governing the ownership and leasing of real property, employment
standards, environmental matters, taxes and other matters. It is possible that future changes in applicable federal,
provincial, state, local or common laws or regulations or changes in their enforcement or regulatory interpretation
could result in changes in the legal requirements affecting the REIT (including with retroactive effect). Any changes in
the laws to which the REIT is subject could materially adversely affect the rights and title to the properties. It is not
possible to predict whether there will be any further changes in the regulatory regimes to which the REIT is subject or
the effect of any such change on its investments.
Reliance on the Partnership
The REIT is dependent for a certain portion of NOI on the business of the Partnership. The cash distributions to
Unitholders are dependent on the ability of the Partnership to pay distributions in respect of the units of the
Partnership. The ability of the Partnership to pay distributions or make other payments or advances to the REIT may be
subject to contractual restrictions contained in any instruments governing the indebtedness of the Partnership. The
ability of the Partnership to pay distributions or make other payments or advances is also dependent on the ability of
its subsidiaries to pay distributions or make other payments or advances to the Partnership.
Potential Conflicts of Interest
The Trustees will, from time to time, in their individual capacities, deal with parties with whom the REIT may be dealing,
or may be seeking investments similar to those desired by the REIT. The interest of these persons could conflict with
those of the REIT. The DOT contains conflict of interest provisions requiring the Trustees to disclose their interests in
certain contracts and transactions and to refrain from voting on those matters.
Conflicts may exist due to the fact that a Trustee of the REIT is affiliated with ACPI. The REIT and ACPI have entered into
certain arrangements. The REIT may become involved in transactions that conflict with the interests of the foregoing.
48
General Insured and Uninsured Risks
The REIT carries general liability, umbrella liability and/or excess liability insurance with limits which are typically
obtained for similar real estate portfolios in the United States and Canada. For the property risks, the REIT carries “All
Risks” property insurance, including, but not limited to, flood, earthquake and loss of rental income insurance (with at
least a 12-month indemnity period). The REIT also carries boiler and machinery insurance covering all boilers, pressure
vessels, HVAC systems and equipment breakdown. There are, however, certain types of risks (generally of a
catastrophic nature such as from war or nuclear accident) which are uninsurable under any insurance policy.
Furthermore there are other risks that are not economically viable to insure at this time. The REIT carries insurance for
earthquake risks, subject to certain policy limits, deductibles and self-insurance arrangements. Should an uninsured or
underinsured loss occur, the REIT could lose its investment in, and anticipated profits and cash flows from, one or more
properties, but it would continue to be obligated to repay any recourse mortgage indebtedness on such properties.
Reliance on Key Personnel
The management and governance of the REIT depends on the services of certain key personnel, including the REIT’s
management team and the Trustees. The loss of the services of any key personnel could have an adverse effect on the
REIT and adversely impact the REIT’s financial condition and results of operations and decrease the amount of cash
available for distribution. The REIT does not have “key man” insurance.
Litigation
The REIT’s operations are subject to a wide variety of laws and regulations across all of its operating jurisdictions and
the REIT may face risks associated with legal and regulatory changes and litigation. In the normal course of operations,
the REIT may become involved in various legal actions, including claims relating to personal injury, property damage,
property taxes, land rights, and contractual and other commercial disputes. Further, the REIT has operations in the U.S.
which may, as a result of the prevalence of litigation in the U.S., be more susceptible to legal action than the REIT’s
Canadian operations. The final outcome with respect to outstanding, pending or future actions cannot be predicted
with certainty, and the resolution of such actions may have an adverse effect on the REIT’s cash flows, operating results
and financial condition.
Cyber Security Risk
Cyber security has become an increasingly problematic issue for issuers and businesses in Canada and around the world,
including the REIT. Cyberattacks against large organizations are increasing in sophistication and are often focused on
financial fraud, compromising sensitive data for inappropriate use or disrupting business operations. A cyber incident
is considered to be any adverse event that threatens the confidentiality, integrity or availability of the REIT’s
information resources. More specifically, a cyber-incident is an intentional attack or unintentional event that can
include gaining unauthorized access to information systems to disrupt operations, corrupt data or steal confidential
information. As the REIT’s reliance on technology has increased, so have the risks posed to its systems. The REIT’s
primary risks that could directly materialize from the occurrence of a cyber incident include operational interruption,
damage to its reputation, damage to its business relationships with its tenants, disclosure of confidential information
regarding its tenants, employees and third parties with whom the REIT interacts, and may result in negative
consequences, including remediation costs, loss of revenue, additional regulatory scrutiny and litigation. The REIT has
implemented processes, procedures and controls to help mitigate these risks, but these measures, as well as its
increased awareness of the risk of a cyber incident, do not guarantee that its financial results will not be negatively
impacted by such an incident.
49
Risk Factors Related to the Units
Cash Distributions are Not Guaranteed
There can be no assurance regarding the amount of income to be generated by the Properties. The ability of the REIT
to make cash distributions to Unitholders, and the actual amount distributed, is dependent on the operations and
assets of the REIT, and is subject to various factors including financial performance, obligations under applicable credit
facilities, fluctuations in working capital, the sustainability of income derived from the tenants of the Properties and
any capital expenditure requirements. Unlike fixed-income securities, there is no obligation of the REIT to distribute to
Unitholders any fixed amount, and reductions in, or suspensions of, cash distributions to Unitholders may occur that
would reduce yield based on the prevailing market price of the Units. The market value of the Units will deteriorate if
the REIT is unable to meet its distribution targets in the future, and that deterioration may be significant. In addition,
the composition of cash distributions to Unitholders for tax purposes may change over time and may affect the after-
tax return for investors.
Restrictions on Redemptions
The entitlement of Unitholders to receive cash upon the redemption of their Units is subject to the following limitations:
(i) the total amount payable by the REIT in respect of such Units and all other Units tendered for redemption in the
same calendar month must not exceed $50,000 (provided that such limitation may be waived at the discretion of the
Trustees); (ii) at the time such Units are tendered for redemption, the outstanding Units must be listed for trading on
a stock exchange or traded or quoted on another market which the Trustees consider, in their sole discretion, provides
fair market value prices for the Units; (iii) the trading of Units is not suspended or halted on any stock exchange on
which the Units are listed (or, if not listed on a stock exchange, on any market on which the Units are quoted for trading)
on the Redemption Date for more than five trading days during the ten day trading period commencing immediately
after the Redemption Date; and (iv) the redemption of the Units must not result in the delisting of the Units on the
principal stock exchange on which the Units are listed.
Nature of Investment
A holder of a Unit of the REIT does not hold a share of a body corporate. As holders of Units of the REIT, the Unitholders
do not have statutory rights normally associated with ownership of shares of a corporation including, for example, the
right to bring “oppression” or “derivative” actions. The rights of Unitholders are based primarily on the DOT. There is
no statute governing the affairs of the REIT equivalent to the OBCA or the CBCA which sets out the rights and
entitlements of shareholders of corporations in various circumstances. As well, the REIT may not be a recognized entity
under certain existing insolvency legislation such as the Bankruptcy and Insolvency Act (Canada) and the Companies
Creditors’ Arrangement Act (Canada), and thus the treatment of Unitholders upon an insolvency is uncertain.
Availability of Cash Flow
AFFO may exceed actual cash available to the REIT from time to time because of items such as principal repayments,
leasing costs and capital expenditures in excess of stipulated reserves identified by the REIT in its calculation of AFFO
and redemptions of Units, if any. The REIT may be required to use part of its debt capacity or to reduce distributions to
Unitholders in order to accommodate such items. Credit facility terms may prohibit payments or distributions to
Unitholders by the REIT in default circumstances.
Dilution
The number of Units the REIT is authorized to issue is unlimited. The REIT may, in its sole discretion, issue additional
Units from time to time (including pursuant to any employee incentive compensation plan that may be introduced in
the future), and the interests of the holders of Units may be diluted thereby.
50
Public Market Fluctuations
The REIT cannot predict at what price the Units will trade and there can be no assurance that an active trading market
will be sustained. A publicly-traded real estate investment trust will not necessarily trade at values determined solely
by reference to the underlying value of its real estate assets. Consequently, Units may trade at a price that is greater
or less than the REIT’s net asset value. One of the factors that may influence the market price of the Units is the annual
yield on the Units. Accordingly, an increase in market interest rates may lead purchasers of Units to expect a higher
annual yield which could adversely affect the market price of the Units. In addition, the market price for the Units may
be affected by changes in general market conditions, fluctuations in the markets for equity securities, demand for real
estate investment trusts and real estate related investments and numerous other factors beyond the control of the
REIT.
PART IX
CONTROLS AND PROCEDURES
Disclosure Controls and Procedures
The REIT’s Chief Executive Officer and Chief Financial Officer have designed, or caused to be designed under their
supervision, the REIT’s disclosure controls and procedures to provide reasonable assurance that (i) material information
relating to the REIT, including its consolidated subsidiaries, is made known to them by others within those entities,
particularly during the period in which the annual filings are being prepared, and (ii) material information required to
be disclosed in the annual filings, interim fillings or other reports filed or submitted by the REIT under securities
legislation is recorded, processed, summarized and reported on a timely basis and within the time period specified by
securities legislation.
As required by National Instrument 52-109 – Certification of Disclosure in Issuers’ Annual and Interim Filings (“NI 52-
109”), adopted by the Canadian Securities Administrators, the REIT’s Chief Executive Officer and Chief Financial Officer
have caused the effectiveness of the REIT’s disclosure controls and procedures to be evaluated under their supervision.
Based on that evaluation, they have concluded that the design and operation of the system of disclosure controls and
procedures were effective as at December 31, 2017.
Internal Controls over Financial Reporting
The REIT’s Chief Executive Officer and Chief Financial Officer have designed, or caused to be designed under their
supervision, the REIT’s internal control over financial reporting using the framework established in accordance with
the COSO Internal Control - Independent Framework (2013) published by the Committee of Sponsoring Organizations
of the Treadway Commission to provide reasonable assurance regarding the reliability of financial reporting and the
preparation of financial statements for external purposes in accordance with IFRS.
As required by NI 52-109, the REIT’s Chief Executive Officer and Chief Financial Officer have caused the effectiveness
of the internal controls over financial reporting to be evaluated under their supervision. Based on that evaluation, they
have concluded that the design and operation of the REIT’s internal controls over financial reporting were effective as
at December 31, 2017.
Inherent Limitation
Internal controls over financial reporting cannot provide absolute assurance of achieving financial reporting objectives
because of their inherent limitations. Internal control over financial reporting is a process that involves human diligence
and compliance and is subject to lapses in judgment and breakdowns resulting from human failures. Internal control
over financial reporting also can be circumvented by collusions or improper management override. Because of such
limitations, there is risk that material misstatements may not be prevented or detected on a timely basis by internal

51
control over financial reporting. However, these inherent limitations are known features of the financial reporting
process. Therefore, it is possible to design into the process safeguards to reduce, though not eliminate, this risk.
52
PART X
SUBSEQUENT EVENTS On January 9, 2018, the REIT entered into a purchase and sale agreement to purchase a 58,000 square foot multi-tenant
industrial property located in Laurel, Maryland. The property is currently 92% occupied by 6 tenants with a weighted average
lease term of 4.6 years. The acquisition is expected to close towards the end of the first quarter of 2018 for U.S. $5,280,
representing a capitalization rate of 8.1%. The REIT anticipates financing the transaction with proceeds from its credit facility.
On January 22, 2018, and February 16, 2018 the REIT declared monthly distributions for the months ended January 31, 2018
and February 28, 2018 of $0.0675 per Unit, consistent with an annual distribution rate of $0.81 per Unit.
On February 28, 2018, the REIT extended the maturity of its credit facility and increased the maximum funds available
thereunder. The credit facility now matures on January 25, 2020 and the maximum availability thereunder has been increased
from $120.0 million to $140.0 million.
PART XI
FINANCIAL OUTLOOK AND MARKET GUIDANCE Management believes that the main fundamentals of the REIT are the health of its balance sheet and the stability and
diversity of its portfolio, and that these fundamentals are required in order to meet external expectations.
In order to achieve its 2018 objectives, the REIT will focus on:
Increasing occupancy in the portfolio;
Maximizing NOI;
Acquiring assets on an accretive basis;
Improving operational productivity;
Executing on development opportunities within the portfolio; and
Executing its recycling of capital strategy.
Apart from the sometimes significant difference between vendor and purchaser pricing, the current market for
acquisitions is favourable for the REIT’s expansion plans. In the near term, the REIT intends to focus on acquisitions in
the United States where valuations, financing and operating fundamentals are currently more attractive than in Canada.
The REIT will pursue acquisitions, with a focus on properties within markets that the REIT currently operates. The REIT
will also target external growth in markets that offer high quality commercial real estate at compelling relative
valuations. The REIT will utilize a flexible, opportunity driven growth strategy and take advantage of its agile framework
to source attractive relative valuations in various asset classes and geographic locations. While it is expected that any
acquisitions by the REIT would be immediately accretive, the REIT may also consider and complete acquisitions that
improve the overall quality of its portfolio and/or will be accretive over the longer term.
Part XII
OUTSTANDING UNITS As of the close of business on March 5, 2018, there were 32,894,526 Units issued and outstanding and 871,080
exchangeable Class B LP Units issued and outstanding.