Embed Size (px)
Citation preview

The Contribution of the Commercial Real Estate Sector to the Canadian Economy
Prepared by:


The Contribution of the Commercial Real Estate Sector to the Canadian Economy
Prepared for:
Real Property Association of Canada (REALpac)
and
NAIOP Research Foundation
Prepared by:Altus Group Economic Consulting
September 2012

2
© 2012 Real Property Association of Canada (REALpac) and the NAIOP Research Foundation.
About REALpacREALpac is Canada’s premier industry association for investment real property leaders. Our mission is to col-lectively influence public policy, to educate government and the public, and to ensure stable and beneficial real estate capital and property markets in Canada.
REALpac Members currently own in excess of $180 Billion CAD in real estate assets located in the major centres across Canada. Membership is comprised of the largest owners, developers and managers of com-mercial real estate in Canada including real estate investment trusts, publicly traded and large private companies, banks, brokerages, crown corporations, investment dealers, life companies, lenders, and pension funds. Assets include retail, office, industrial, hotel, multi-residential (apartments) and seniors housing.REALpac operates in several areas including advocacy, research, financial best practices, standard setting, publishing, conferences and networking events. Visit us at www.realpac.ca.
About NAIOPNAIOP represents commercial real estate developers, owners and investors of office, industrial, retail and mixed-use properties. It provides strong advocacy, education and business opportunities, and connects its members through a powerful North American network. For more information, visit www.naiop.org.
The NAIOP Research Foundation was established in 2000 as a 501(c)(3) organization to support the work of individuals and organizations engaged in real estate development, investment and operations. The Foundation’s core purpose is to provide these individuals and organizations with the highest level of research information on how real properties, especially office, industrial and mixed-use properties, impact and benefit communities throughout North America. The initial funding for the Research Foundation was underwritten by NAIOP and its Founding Governors with an endowment fund established to fund future research. For more information, visit www.naioprf.org.

3
About Altus Group LimitedAltus leads the global real estate industry in offering professional real estate advisory services, data solutions and intelligence about an organization’s assets, generating a wealth of knowledge and insight. With a staff of over 1,700, Altus has a network of over 60 offices in 14 countries worldwide, including Canada, the United Kingdom, Australia, Asia and the United States. We operate five interrelated Business Units, bringing years of experience and a broad range of expertise together into one comprehensive platform: Research, Valuation and Advisory; Cost Consulting and Project Management; Realty Tax Consulting, Geomatics and ARGUS Software. Altus clients include banks, financial institutions, governments, pension funds, asset and fund managers, developers and landlords and companies engaged in the oil and gas industry. Visit us at www.altusgroup.com.
About Altus Group Economic Consulting Altus Group Economic Consulting was formed in February 2007 when Clayton Research Associates Limited (est. in 1972) joined in Altus Group. Altus Group Economic Consulting is a group of urban and real estate economists and provides strategic advice and information to both private and public sector clients across Canada. The division specializes in real estate market analysis, land use planning issues, property investment and financing, and building products and technology analysis. Altus Group Economic Consulting has gained a reputation for astute and independent advice and analysis, based on extensive in-house expertise, a unique information base, leading edge analytical techniques and extensive contacts throughout Canada.

4
Section continued
PageSection Number
Executive Summary ................................................................................................................7
Introduction .............................................................................................................................11Research Methodology ...................................................................................................12
Macroeconomic Context and Sector Overview ...............................................14Economic Benefits Measured by This Report ..................................................14The Commercial Real Estate Sector ......................................................................15Sector Overview ..................................................................................................................16
Total Capital Investment in Construction ............................................................... 16Capital Investment in New Construction and Renovation ................................ 19Trends in CRE Sector Capital Investment in Canada, 2007-2011 .............. 21Capital Investment by Type of Cost.......................................................................... 23On-going Operations ..................................................................................................... 24Overall Output of the CRE Sector in 2011 ........................................................... 26
Economic Benefits of the Commercial Real Estate Sector in Canada ...................................................................................................................27
Economic Activity .............................................................................................................28GDP ...........................................................................................................................................29Jobs ...........................................................................................................................................30Personal Income ................................................................................................................31Corporate Profits ................................................................................................................33Personal Taxes ....................................................................................................................34Corporate Taxes ..................................................................................................................35Other Economic Benefits .............................................................................................36
Economic Benefits of the Commercial Real Estate Sector by Region ...................................................................................................................37
Sector Overview By Region .........................................................................................37Capital Investment in Non-Residential Buildings ............................................... 37Capital Investment in CRE Sector Buildings ........................................................ 39
Economic Benefits ...........................................................................................................41Economic Activity .......................................................................................................... 41GDP .................................................................................................................................... 42Jobs .................................................................................................................................... 43Personal Income ........................................................................................................... 44Corporate Profits ............................................................................................................ 45Personal Taxes ................................................................................................................ 46Corporate Taxes .............................................................................................................. 47
Table of Contents

5
PageSection Number
Conclusion ..................................................................................................................................48
Glossary ........................................................................................................................................49
Appendix A: Detailed Tables for Construction Spending on Non-Residential Buildings ............................................................................................52
Appendix B: Economic Benefits of the Commercial Real Estate Sector in Canada ...................................................................................................................60
Appendix C: Economic Benefits of the Commercial Real Estate Sector by Region ...................................................................................................................62
Appendix D: Description of the Input-Output Model ...............................................................69
Table of Contents

6
About this ReportAll monetary values have been expressed in Canadian Dollars (CAD) in this report.
It is important to remember that this report relies solely on secondary information sources. While every effort has been made to ensure the accuracy of the data, Altus Group cannot guarantee the complete accuracy of the information used in this report from these secondary sources.
DisclaimerThis project and report is intended to provide information and insight to industry practitioners and does not constitute advice or recommendations. The information that may be contained herein has been obtained by or compiled for REALpac and the NAIOP Research Foundation from sources believed to be reliable, but no representation or warranty, express or implied, is made by REALpac and the NAIOP Research Foundation, their directors, officers, and staff or any other person as to its accuracy, completeness or correctness. Opinions, estimates, conclusions, or other information expressed or contained herein constitute the author’s judgment as of the publication date, are subject to change without notice and are provided in good faith but without representation or warranty as aforesaid.
Neither REALpac or the NAIOP Research Foundation, nor their directors, officers, and staff or any other person assume responsibility for the use of, effect of, or appropriateness of the language, wording, or infor-mation contained in this publication or any typographical or printing errors or omissions. REALpac, the NAIOP Research Foundation, and Altus Group, as well as their directors, officers, and staff or any other person assume no liability for damage or loss arising from the use of information contained herein. REALpac and the NAIOP Research Foundation are not providing investment, environmental, legal, or tax advice. Readers are urged to consult their own professional advisors for further confirmation and information.
CopyrightBoth REALpac and the NAIOP Research Foundation are the owners of all copyright in this publication. All rights reserved. No part of this document may be reproduced, transmitted or otherwise used in whole or in part in any form or by any means, without permission from the publisher(s). Further, no person shall use this publication, in whole or in part, in any form or by any means, to create any precedent for resale or license for remuneration.
Contact InformationWe welcome your feedback. Please direct any questions, comments, or suggestions to:
Julia St. MichaelManager, Research & Environmental ProgramsReal Property Association of Canada (REALpac)T: 416-642-2700 x 237F: 416-642-2727E: [email protected]
Elizabeth A. SherrodManaging Editor, Development MagazineDirector of Research | NAIOPT: 703-904-7100F: 703-674-1482E: [email protected]

7
Executive Summary
The commercial real estate sector (CRE Sector) plays an important role in Canada’s economy and standard of living. Development and construction of commercial real estate buildings, and subsequently their daily operations, creates directly thousands of jobs and adds tremendous value to the Canadian gross domestic product (GDP). In addition, the sector provides workspace for millions of Canadians and places for Canadians to shop, eat and play.
The Real Property Association of Canada (REALpac) and the NAIOP Research Foundation approached Altus Group to prepare this study to quantify the contribution of the commercial real estate sector to the Canadian economy.
Capital investment in the CRE Sector totalled some $21.6 billion* in 2011, accounting for about half of the total spending in Canada on non-residential construction. Some $14.9 billion was spent on new buildings, the rest ($6.7 billion) accounted for capital improve-ments, renovations and the upgrading of existing buildings.
The on-going operations of CRE Sector buildings also generated $3.5 billion in building management fees and almost the same amount for commercial brokerage fees from sales of commercial properties in 2011.
Taken together, the CRE Sector makes a substantial contribution to the Canadian economy, producing $63.3 billion in annual economic activity. These activities add to the economy in various ways by:
• Supporting 340,000 jobs, many of which are high-paying profes-sional jobs;
• Generating $18.1 billion in personal income, related to labour income and other sources of income;
• Generating $12.5 billion in corporate profits earned by many small and medium companies, and some of the largest pension funds and insurance companies in Canada;
• Contributing $7.2 billion in personal and corporate income tax rev-enues for the federal and provincial governments; and ultimately
• Accounting for $32.4 billion in total net contribution to Canada’s GDP.
The CRE Sector also generates an array of other benefits to the national economy such as the promotion of economic development and accommodation of employment growth. In addition, properties owned by the CRE Sector provide substantial revenue to municipali-ties and school boards across Canada through realty taxes.
* All monetary values have been expressed in Canadian Dollars (CAD) throughout this report.

8
Key Economic Benefits
0 10 20 30 40 50 60 70
8.03.5
8.13.5
14.26.8
33.114.9
63.328.5
Economic Activity Generated
Brokerage
Building Management
Improvements
New Construction
Total
$ Billion 2011
Total Economic Activity
Direct Economic Activity
0 10 20 30 40 50
4.21.7
4.21.6
7.83.8
16.26.6
32.413.8
Contribution to National GDP
Brokerage
Building Management
Improvements
New Construction
Total
$ Billion 2011
Total Contribution to GDP
Direct Contribution to GDP

9
0 50 100 150 200 250 300 350 400
35.612.9
36.613.0
92.049.5
175.377.2
339.4152.6
Employment Generated
Brokerage
Building Management
Improvements
New Construction
Total
Full-time Equivalent Jobs (000s)
Total Jobs Generated
Direct Jobs Generated
0 4 8 12 16 20
1.80.6
1.80.6
4.82.7
9.84.5
18.18.5
Personal Income Generated
Brokerage
Building Management
Improvements
New Construction
Total
$ Billion 2011
Total Personal Income
Direct Personal Income

10
Key Economic Benefits continued
0 3 6 9 12 15
2.31.0
2.30.9
2.50.9
5.31.6
12.54.4
Corporate Profits Generated
Brokerage
Building Management
Improvements
New Construction
Total
$ Billion 2011
Total Corporate Profits
Direct Corporate Profits
0 2 4 6 8 10
2.60.9
4.92.1
7.23.0
Taxes Generated
Corporate
Personal
Total
$ Billion 2011
Total Taxes
Direct Taxes

11
The CRE Sector is crucial to Canada’s economy and standard of living. The planning, design, development and construction of commercial real estate buildings, and subsequently their daily operations, generates significant amounts of economic activity. In addition, the sector provides workspaces for millions of Canadians and places for Canadians to shop, eat and play.
While millions of Canadians come and go daily from buildings con-structed and operated by the CRE Sector, its fundamental value to our communities, the Canadian economy and our social framework can sometimes be overlooked.
Gaining an understanding of the magnitude of the economic contribution of an important national asset, such as our stock of commercial real estate buildings, is of importance to multiple stakeholders. Policy makers at the federal and provincial levels of government, as well as municipal planners and politicians, can make smarter decisions with better data and an improved perspective on the sector as a whole. Investors, tenants and the multitude of com-panies in Canada within this important sector will be better able to see how their businesses and decisions affect this sector and how they are interconnected.
To fill this knowledge gap, REALpac and the NAIOP Research Foundation approached Altus Group Economic Consulting (Altus Group) to prepare this study. The main purpose of this report is to quantify the contribution of the CRE Sector to the Canadian economy. This project is jointly funded by REALpac and the NAIOP Research Foundation, with additional sponsorship from Altus Group.
This report takes a comprehensive approach to assessing the eco-nomic contribution associated with key activities in the life cycle of a building, including:
• The construction of new buildings (or major additions) including the planning and site development, hard costs (actual construc-tion activity, such as materials and equipment) and soft costs (architecture and design, finance, consulting activities);
• Improvements to buildings, which is the construction spending on an on-going basis for capital improvements to buildings and tenant improvements (the construction associated with accom-modating the requirements of new tenants); and
• The on-going operations of the building, including building management (maintenance, leasing) and brokerage.
Introduction
Key Terms
The Commercial Real Estate Sector (CRE Sector) builds and operates private industrial, office and retail/entertainment build-ings. The CRE Sector does not include government owned build-ings or institutional facilities.
Gross Domestic Product (GDP) is the total unduplicated value of all goods and services produced in Canada in one calendar year. This metric is used to measure the total size of the Canadian economy.
Please refer to the Glossary for further details about key terms and definitions.

12
Introduction continued
This report contains another three main sections as follows:
• The second section provides macroeconomic context to the economic impact analysis, outlines the economic indicators mea-sured in this analysis, and offers an overview of the sector;
• The third section presents the estimated economic benefits gener-ated nationally by the CRE Sector in Canada, including economic activity, Gross Domestic Product (GDP), employment, income, government tax revenues and other benefits; and
• The fourth section discusses the distribution of economic benefits by region, including Atlantic Canada, Quebec, Ontario, Manitoba/Saskatchewan, Alberta and British Columbia.
In addition, an appendix is provided with detailed tables and infor-mation on the methodology used in the report.
Research Methodology
The data in this report are derived from several sources, as listed below:
• Statistics Canada: Data on capital expenditures (building improve-ment and construction), investment in non-residential building construction, building permits, the input-output model, and activ-ities related to real estate brokerage and management are sourced from Canada’s national statistical agency, Statistics Canada;
• Altus Group: Construction spending estimates of hard and soft costs, site development costs and tenant improvement spending are modeled by Altus Group and derived from the Altus Group Cost Guide. Data are also collected from Altus InSite, Altus Group’s online database of commercial real estate buildings in Canada; and
• Secondary Sources: The analysis also uses data from Canada Mortgage and Housing Corporation (CMHC), Canadian Real Estate Association (CREA), Canada Revenue Agency (CRA) and the finance ministry/department of each of the ten provinces.
The methodology employed in this study has two major components:
1. Estimations of Direct Activity: The estimates of economic activ-ity within the various components of the industry draw heavily on data from Statistics Canada and other sources as described above. Where direct data are not available, estimates are calculated, based on appropriate indirect sources of information; and

13
2. Analysis of Spinoff Activity: In addition to the direct activity (esti-mated in 1. above), it is important to consider two more rounds of spinoff economic activity, including the indirect (suppliers of goods and services to the CRE Sector) and induced (expenditure of income earned by the CRE Sector) rounds of activity. The analysis uses economic multipliers, which are derived from the Statistics Canada’s Interprovincial Input-Output Model of the Canadian Economy. These multipliers are applied to the direct activity (estimated in 1. above) to determine total economic activ-ity. The input-output approach is the most appropriate approach to use in undertaking a study such as this as it very carefully maps and tracks the detailed interrelatedness between all sectors of the economy. In this way, the model is able to track the impact from spending on construction and building operations back to all aspects of the value chain.
A more detailed discussion of the Statistics Canada Input-Output model can be found in Appendix D.
Key Terms
A multiplier is a quantitative measure created by a particular input-output based economic model. It is an analytical answer to a hypothetical question about how certain expenditures are expected to affect the economy.

14
This section provides an overview of economic indicators used in this report to measure the CRE Sector’s contribution to the Canadian economy and illustrates recent trends in the sector.
Economic Benefits Measured by This Report
This report analyzes economic benefits of the CRE Sector in Canada. The various benefits are generated by three major compo-nents of the sector:
• The initial development and construction of commercial proper-ties: The planning, design, site development and construction of properties such as industrial buildings, office buildings and shop-ping centres, contribute directly to the Canadian economy and generate substantial “spinoff” benefits;
• Improvements to buildings: Improvements, including construction spending on an on-going basis for capital improvements to struc-tures and tenant improvements (the construction associated with building interior space for new tenants), generate a substantial economic contribution annually; and
• The on-going operations of commercial properties: A large number of CRE Sector properties are managed by professional companies that specialize in property management. Their primary activities include daily maintenance and operations, leasing, collecting rents, budgeting and maintaining records. These activities generate billions of dollars in economic activity each year. In addition, com-mercial properties, valued in billions of dollars, exchange hands each year and generate value-add activities within brokerage and other professional services firms.
To quantify the economic benefits of the CRE Sector, this report focuses on several economic parameters, including:
• Economic activity: The volume of goods and services consumed in the economy related to the development, construction and on-going operation of the CRE Sector;
• Contribution to GDP: The value-added component of the eco-nomic activities, a measure of the contribution of the activities to Canada’s gross domestic product;
• Jobs: The number of jobs generated from activities of the CRE Sector, including direct and spinoff jobs;
• Income: The amount of income generated through the various economic activities, including wages, other labour earnings, mixed income, and corporate profits; and
• Government tax revenues: Federal and provincial tax revenues, primarily personal and corporate income taxes, and other payroll deductions.
Macroeconomic Context and Sector Overview

15
The Commercial Real Estate Sector
In general, the CRE Sector includes three components, as described below:
• Industrial: This category is composed of factories, warehouses, distribution centres, agricultural buildings, railway shops, aircraft hangers, maintenance garages, equipment storage and workshops. This category includes a wide range of properties, including tra-ditional industrial properties, such as food processing plants and automobile parts factories, as well as advanced manufacturing facilities, such as pharmaceutical production units and IT equip-ment plants. During recent years, warehouses and distribution centres have become an important part of this sector;
• Office: This category is composed of downtown office towers, suburban offices, corporate campuses and other office buildings owned by the private sector. Office towers and business parks are home to Canada’s largest corporations and play a vital role in eco-nomic development; and
• Retail and entertainment: This category is composed of shopping centers, theatres, performance arts and cultural centres, restau-rants and bars, and automotive dealerships. Each day, millions of Canadians shop, eat and play at these facilities. These activities significantly contribute to the Canadian economy and are impor-tant in defining the country’s standard of living.
In addition, many companies and professionals are involved in the on-going operation of the CRE Sector, such as building management and commercial brokerage services. These organizations generate significant economic contribution to the Canadian economy through activities described as:
• Building management: Providing services in planning and manag-ing CRE buildings, and ensuring services, such as security, health and safety, and maintenance of the building, meet a satisfactory level. Building managers also collect rents and search new tenants on behalf of building owners; and
• Commercial brokerage services: Providing a connection between buyers and sellers, and lessors and lessees of commercial proper-ties, and facilitating transactions of CRE buildings.
Key Terms
Included in the category “non-residential real estate” are all of the CRE Sector building types as well as government buildings and institutional buildings.

16
Macroeconomic Context and Sector Overview continued
Sector Overview
CRE Sector buildings are a significant component of Canada’s non-residential building stock. Canada’s non-residential building stock includes CRE Sector buildings along with government and institu-tional buildings. This section sets out recent trends within Canada’s non-residential building stock.
Total Capital Investment in Construction
Capital investment in non-residential buildings includes all new construction (hard and soft costs including site development) and improvements (renovations).
Key Points
•The CRE Sector accounts for 49 percent of the non-residential investment in Canada, which totalled $44.3 billion in 2011.
0
12
24
36
48
60
40
44
48
52
56
60
20.418.3
38.7
22.5 21.5
44.0
20.0
42.8
19.723.0
40.0
21.6 22.7
44.3
22.8
Trends in Non-Residential* Capital Investment in Canada, Total Spending, 2007-2011
*Includes government-owned assets, institutional and commercial buildings that are not included in the CRE Sector.Source: Altus Group Economic Consulting based on data from Statistics Canada
201120102007 20092008
CRE Sector InvestmentOther Non-Residential Real Estate Investment*TotalCRE Sector % of Total
$ Bi
llion
(bar
s)
% (l
ine)
Figure 1

17
As shown in Figure 1, above, the volume of capital investment in non-residential building construction across Canada has struggled over the last five years. Specific trends to note:
• After a modest decline during and immediately after the recession, total capital investment in non-residential building construction in Canada totalled some $44.3 billion in 2011, just surpassing the pre-recession high in 2008;
• Capital investment by the CRE Sector, which includes industrial buildings, non-government office buildings and retail/entertain-ment facilities, totalled $21.6 billion in 2011, accounting for half of the total investment on non-residential construction; and
• The share of CRE Sector investment of total spending in 2011 (49 percent) was somewhat lower than the share recorded before the 2009 recession (53 percent in 2007 and 51 percent in 2008).
Key Points
•Ontario receives by far the largest amount of capital investment in Canada, accounting for 41 percent ($18.2 billion) of the investment in all non-residential buildings and 36 percent ($7.6 billion) of the investment in CRE-only buildings.
0
4
8
12
16
20
24
18.2
5.1
2.5
8.6
2.3
7.7
Total Investment* in Non-Residential Buildings by Region, 2011
Investment % of Canada
*Includes both new construction and renovation.Source: Altus Group Economic Consulting based on data from Statistics Canada
AtlanticCanada
QuebecAlbertaBritish Columbia
$ Bi
llion
201
1
OntarioManitoba & Saskatchewan
17
5
41
6
20
11
Figure 2

18
Macroeconomic Context and Sector Overview continued
By province, Ontario accounted for the largest share of non-residential building construction, totalling $18.2 billion in 2011, representing some 41 percent of Canada’s total, as seen in Figure 2.
Figure 3, below, shows that Ontario’s share of the CRE Sector is smaller than its share of non-residential building construction. The province accounted for about 36 percent of total construction invest-ment in the CRE Sector, which is still by far, the largest market in Canada. Refer to Appendix A-1 for further details on total investment in non-residential buildings in each region.
0
2
4
6
8
10
CRE Sector Capital Investment by Region, 2011
Investment % of Canada
Source: Altus Group Economic Consulting based on data from Statistics Canada
AtlanticCanada
QuebecAlbertaBritish Columbia
$ Bi
llion
201
1
OntarioManitoba & Saskatchewan
20
5
36
6
23
11
2.5
5.0
1.3
7.6
4.2
1.0
Figure 3

19
Capital Investment in New Construction and Renovation
Capital investment in non-residential building construction for new construction and renovation has been substantial over the five-year period under review. As shown in Figure 4 and Figure 5, below, investment in new building construction was approximately $30.7 billion in 2011, while a further $13.7 billion was invested into building renovations and improvements in the same year. These two values combined ($21.6 billion), can also be seen in Figure 1, representing the total capital investment by the CRE Sector in 2011.
Other notable trends include:
• Over the last several years, renovation investment in the non resi-dential construction sector has been growing while the investment in new construction modestly declined; and
• Consistent with the overall trends in the non-residential construc-tion sector, investment in new CRE Sector buildings declined some $0.65 billion from its recent peak in 2008 to $14.9 billion in 2011, while spending on renovation increased by $1.9 billion during the same period, to $6.7 billion in 2011.
For further details on capital investment in new construction and renovations in each region, refer to tables in Appendix A-2 and A-3.
Key Points
•Capital investment in new CRE Sector buildings was $14.9 bil-lion in 2011 and investment in renovations was $6.7 billion in the same year.
Key Terms
Capital investment in new construction consists of spending on the construction of new buildings and major additions to existing buildings. The three components of new construction include site development, hard costs and soft costs.
Site development is a category of construction activity that reflects improvements made to the site, such as grading and drainage, before a building can be constructed.
Hard costs are a category of construction costs that reflects the outlays for the building construction phase such as materials and equipment.
Soft costs are a category of construction costs that reflects the professional services, and administrative and management processes required to support the construction project.
Capital investment in renovations consists of spending on the alteration and improvements of existing non-residential buildings. The two components of renovations are tenant improvements and other capital upgrades.
Tenant improvements are a category of construction costs that reflects improvements made to the interior of a building to meet the needs of a specific tenant.
Other capital upgrades are a category of construction costs that includes regular renovation spending, which is necessary to ensure the daily function of the CRE building.

20
Macroeconomic Context and Sector Overview continued
0
4
8
12
16
20
40
44
48
52
56
60
4.8 4.7
9.5
5.7 5.8
11.5
6.2
12.9
6.47.0
13.3
6.7 6.9
13.7
6.7
Trends in Non-Residential* Capital Investment in Canada, Renovation, 2007-2011
*Includes government-owned assets, institutional and commercial buildings that are not included in the CRE Sector.Source: Altus Group Economic Consulting based on data from Statistics Canada
201120102007 20092008
$ Bi
llion
(bar
s)
% (l
ine)
CRE Sector InvestmentOther Non-Residential Real Estate Investment*TotalCRE Sector % of Total
Figure 5
0
10
20
30
40
50
40
44
48
52
56
60
15.513.6
29.2
16.8 15.7
32.5
13.8
29.8
13.316.0
29.3
14.9 15.8
30.7
16.0
Trends in Non-Residential* Capital Investment in Canada, New Construction, 2007-2011
*Includes government-owned assets, institutional and commercial buildings that are not included in the CRE Sector.Source: Altus Group Economic Consulting based on data from Statistics Canada
201120102007 20092008
$ Bi
llion
(bar
s)
% (l
ine)
CRE Sector InvestmentOther Non-Residential Real Estate Investment*TotalCRE Sector % of Total
Figure 4

21
Trends in CRE Sector Capital Investment in Canada, 2007-2011
Over the last five years, capital investment in CRE Sector buildings has been relatively stable, as seen in Figure 6.
In total, capital investment in CRE Sector buildings averaged about $21 billion per year during the 2007-2011 period. Capital investment in the sector declined during the 2009-2010 period, pri-marily due to the decline in new building construction, but recovered strongly in 2011. As compared to new construction, capital invest-ment in renovation has been steady throughout the period.
0
5
10
15
20
25
30
19.720.020.422.5 21.6
Trends in CRE Sector Capital Investment, Canada 2007-2011
Source: Altus Group Economic Consulting based on data from Statistics Canada
201120082007 20102009
$ Bi
llion
Renovation
New Construction
Figure 6

22
Macroeconomic Context and Sector Overview continued
Figure 7, above, illustrates capital investment in the CRE Sector by asset type during the 2007-2011 period.
Capital investment in industrial and retail properties declined during the recession and aftermath (between 2008 and 2010), however, investment in both asset classes recovered somewhat in 2011 to $6.0 and $7.5 billion, respectively. In contrast, capital investment (both new construction and renovation) in private office buildings has increased dramatically from $5.3 billion in 2007 to $8.1 billion in 2011.
Generally, the lead-time to undertake an office building project is longer than either industrial or retail. The uncertainty during the recession put many industrial and retail projects “on hold” but office project that were well underway generally proceeded at pace through the recession.
0
2
4
6
8
10
7.0
5.3
8.07.2
6.2
9.0
6.4 6.6
5.6
7.7
6.46.0
8.17.5
7.0
Trends in CRE Sector Capital Investment by Asset Type Canada, 2007-2011
Source: Altus Group Economic Consulting based on data from Statistics Canada
201120102007 20092008
$ Bi
llion
Industrial Private Office Retail
Figure 7
Key Points
•Capital investment (both new construction and renovation) in private office buildings has increased dramatically from $5.3 billion in 2007 to $8.1 billion in 2011, without any decline recorded during the recession years (2009-2010).

23
Capital Investment by Type of Cost
Capital investment in the CRE Sector in 2011 was about $21.6 billion, as presented previously in Figure 6. In Figure 8, the break-down of spending on new building construction into hard costs, soft costs and site development is displayed as well as the break-down of renovation spending into tenant improvements and other capital upgrades.
In 2011, hard costs (spending on actual construction) accounted for some $10.8 billion, which was about half of the total construction spending in the CRE Sector that year. Soft costs (design, financing, consulting) and site development costs were $2.6 billion and $1.5 billion, respectively. Additionally, the total renovation spending was $6.8 billion in 2011. Tenant improvements accounted for some $1.8 billion, and the rest, approximately $5.0 billion, was related to other capital upgrades and spending.
For further information on detailed construction spending in each region, refer to the tables in Appendix A-7.
0
5
10
15
20
25
1.81.5
10.8
2.6
21.6
5.0
CRE Sector Capital Investment in Canada, 2011
* Includes regular renovation spending such as upgrading a building’s lobby and repainting exterior walls.Source: Altus Group Economic Consulting based on data from Statistics Canada
TotalOtherCapital
Upgrades*
SoftCosts
HardCosts
SPENDING ON NEW BUILDINGS RENOVATIONS
TenantImprovement
SiteDevelopment
$ Bi
llion
Figure 8
Key Points
•Half of the annual investment in the CRE Sector is for actual construction (hard costs) of new facilities.

24
Macroeconomic Context and Sector Overview continued
On-going Operations
The on-going operations of CRE Sector buildings generates con-siderable economic activity and jobs through a variety of functions such as building management, leasing and maintenance (collec-tively measured as the volume of management fees), and economic value-add activities related to the purchase and sale of buildings (measured as the volume of brokerage fees). Figure 9 illustrates the total management fees generated by the CRE Sector in 2011.
Notable figures in the generation of management fees include:
• In total, the CRE Sector in Canada generated about $3.5 billion in management fees in 2011; and
• Among the regions, Ontario generated the largest volume of man-agement fees, accounting for some 40 percent of the total.
Industrial Office Retail Others Total
Region (Millions of Dollars)
Atlantic Canada 42 36 34 12 125 Quebec 226 234 183 72 716 Ontario 492 380 388 140 1,400 Manitoba and Saskatchewan 78 68 64 23 234 Alberta 148 145 119 46 457 British Columbia 157 149 167 53 525
Total 1,143 1,013 956 346 3,457
Source: Altus Group Economic Consulting
Figure 9
CRE Management Fees, 2011

25
Notable figures in the generation of brokerage fees include:
• Total brokerage fees generated in Canada were some $3.5 billion in 2011; and
• Transactions of office buildings generated $1.2 billion in broker-age fees, predominantly among commercial properties; and
• Transactions of other commercial properties, such as hotels and development land, generated some $1.1 billion in brokerage fees; also a big contributor to the CRE Sector.
Figure 10 illustrates total brokerage fees generated from transactions of commercial properties in 2011.
Industrial Office Retail Others Total
Region (Millions of Dollars)
Atlantic Canada 40 13 31 79 163 Quebec 56 118 129 238 541 Ontario 169 809 555 568 2,102 Manitoba and Saskatchewan 27 29 28 43 127 Alberta 72 165 81 135 453 British Columbia 6 18 22 31 78
Total 370 1,153 846 1,095 3,464
Source: Altus Group Economic Consulting
Figure 10
CRE Brokerage Fees, 2011

26
Macroeconomic Context and Sector Overview continued
Overall Output of the CRE Sector in 2011
Figure 11 illustrates the overall output of the CRE Sector in 2011 by dividing the output into four components; namely, land develop-ment, new construction, renovation and on-going operations.
By adding all of the components together, it can be shown that the total output of the Canadian CRE Sector was $28.5 billion in 2011.
Other points include:
• Capital investment in new buildings was the largest component of the sector’s output, followed by investment in on-going operations (both management and brokerage fees); and
• In general, building management companies and commercial real estate brokerage firms generated similar amounts of economic activity in 2011.
0 3 6 9 12 15
1.5
10.8
2.6
6.8
3.5
3.5
Output of the CRE Sector By Component, Canada, 2011
Land Development
New Construction
Hard Costs
Soft Costs
On-Going Operation
Property Management Fees
Brokerage Fees
$ Billion 2011
Source: Altus Group Economic Consulting
Renovation
Figure 11
Key Point
•On-going operation of CRE buildings in Canada generated $7.0 billion in 2011 with property management and brokerage activities generating approximately $3.5 billion each.

27
Economic Benefits of the Commercial Real Estate Sector in Canada
This section presents the economic benefits arising from construc-tion spending and on-going operations in the CRE Sector for Canada as a whole.
The non-tax benefits are calculated using multipliers derived from the Statistics Canada Inter-provincial Input-Output Model of the Canadian Economy, and distinguish that there are three “rounds” of activity:
• The direct round of activity (actual economic activities and actual jobs within the CRE Sector); plus
• Two spinoff rounds of activity:• Theindirectround(providersofgoodsandservicestotheCRE
Sector); and• Theinducedround(economicactivityandjobsrelatedtothe
spending of incomes earned by workers in the sector).
In this section, economic benefits are generally expressed as “direct” impacts (only the direct round is included) and “total” impacts (benefits of all three rounds are included).
The tax benefits utilize applicable tax rates and policies in effect for 2011.
For reference, a detailed description of the Input-Output Model methodology is provided in Appendix D.

28
Economic Benefits of the Commercial Real Estate Sector in Canada continued
Economic Activity
The construction spending on buildings in the CRE Sector and the on-going operation of these buildings generated some $63.3 billion of economic activity across Canada in 2011, as shown in Figure 12, below.
Directly, the sector generated economic activity as follows:
• New construction — $14.9 billion;• Improvements — $6.8 billion; • Property/building management — $3.5 billion; and• Brokerage services — $3.5 billion.
After two spinoff rounds of activity, the sector generated economic activity as follows:
• New construction — $33.1 billion;• Improvements — $14.2 billion; • Property/building management — $8.1 billion; and• Brokerage services — $8.0 billion.
The magnitude of economic activity generated by the CRE Sector, there-fore, is significant. To put this value into perspective, the economic activity of the Canadian CRE Sector is more than twice as large as the entire economy of the province of Newfoundland & Labrador.
For further information on the different rounds of economic activity and the benefits generated in each of the above categories, refer to the table in Appendix B.
Key Points
•The CRE Sector is directly engaged in $28.5 billion worth of activity each year, but accounting for the activity of suppliers and spinoff impacts, the total activity related to CRE is $63.3 billion in 2011.
•This value of economic activ-ity is more than twice as large as the entire economy of the province of Newfoundland & Labrador.
0 10 20 30 40 50 60 70
8.03.5
8.13.5
14.26.8
33.114.9
63.328.5
Economic Benefits of the CRE Sector in Canada, Total Economic Activity
Brokerage
Property Management
Total
$ Billion 2011
Total
Direct
*Includes both tenant improvement and other capital upgrades.**Includes “hard” and “soft” construction expenditure, and site development. Source: Altus Group Economic Consulting based on Statistics Canada Input-Output Model
Improvements*
New Construction**
Figure 12

29
GDP
GDP measures the value of the final goods and services produced in Canada. Whereas gross economic activity records all economic trans-actions in Canada, GDP includes only the value-added component of those transactions. The construction spending on buildings in the CRE Sector and the on-going operation of these buildings contrib-uted sizably to the nation’s GDP.
Overall, the sector generated some $32.4 billion to Canada’s GDP in 2011, as shown in Figure 13, below.
Directly, the sector contributed to the nation’s GDP as follows:
• New construction — $6.6 billion;• Improvements — $3.8 billion; • Property/building management — $1.6 billion; and• Brokerage services — $1.7 billion.
In total, the sector contributed to the nation’s GDP as follows:
• New construction — $16.2 billion;• Improvements — $7.8 billion; • Property/building management — $4.2 billion; and• Brokerage services — $4.2 billion.
Key Point
•The total contribution of the CRE Sector to Canada’s GDP is $32.4 billion, which is more than the total GDP of New Brunswick.
0 10 20 30 40 50
4.21.7
4.21.6
7.83.8
16.26.6
32.413.8
Economic Benefits of the CRE Sector in Canada, GDP
Brokerage
Property Management
Total
$ Billion 2011
Total
Direct
*Includes both tenant improvement and other capital upgrades.**Includes “hard” and “soft” construction expenditure, and site development. Source: Altus Group Economic Consulting based on Statistics Canada Input-Output Model
Improvements*
New Construction**
Figure 13

30
Economic Benefits of the Commercial Real Estate Sector in Canada continued
All told, the GDP, or the value-added component of the CRE Sector is very significant. Also, the sector as a whole is an important con-tributor to overall Canadian GDP. The value-added component of the CRE Sector alone is more than the GDP of New Brunswick.
Jobs
Thousands of jobs have been created by the CRE Sector in Canada and many are high-paying positions in a wide array of industries. Directly, the sector employs a large number of real estate profession-als, including property development professionals (project managers, designers, architects and engineers), building managers and brokers, and thousands of skilled trade workers. Indirectly, the sector sup-ports various high-paying jobs, such as financial and legal services professionals, architects, engineers, millwrights, and dozens of other professions and trade classes within the many businesses “down-stream” that benefit from this investment.
Overall, the sector created some 339,400 jobs for Canadians in 2011, as is shown in Figure 14.
Directly, the sector created jobs as follows:
• New construction — 77,200;• Improvements — 49,500; • Property/building management — 13,000; and • Brokerage services — 12,900.
In total, the sector created jobs as follows:
• New construction — 175,300;• Improvements — 92,000;• Property/building management — 36,600; and• Brokerage services — 35,600.
All told, the CRE Sector is an extraordinarily important generator of skilled jobs in Canada. Taken together, the nearly 340,000 jobs this sector supports is the equivalent of total employment in the entire Canadian agriculture industry.
Key Terms
Full-time equivalent jobs repre-sents the number of workers that would be employed for a full‐year; however, that includes both full and permanent part-time jobs at the ratios appropriate for each of the industries involved.
Key Point
•The total number of jobs cre-ated in the CRE Sector in 2011 (340,000) is roughly equivalent to the total employment in the entire Canadian agriculture industry.

31
0 50 100 150 200 250 300 350 400
35.612.9
36.613.0
92.049.5
175.377.2
339.4152.6
Economic Benefits of the CRE Sector in Canada, Jobs
Brokerage
Building Management
Total
Full-time Equivalent Jobs (000s)
Total
Direct
*Includes both tenant improvement and other capital upgrades.**Includes “hard” and “soft” construction expenditure, and site development. Source: Altus Group Economic Consulting based on Statistics Canada Input-Output Model
Improvements*
New Construction**
Figure 14
Personal Income
The employment supported by the CRE Sector generated billions of dollars in personal (labour) income for Canadians. On average, an employee in the CRE Sector earns more than $50,000 each year. The sector generated some $18.1 billion in personal income for Canadians in 2011, as shown in Figure 15.
Directly, the CRE Sector generated personal income as follows:
• New construction — $4.5 billion;• Improvements — $2.7 billion; • Property/building management — $0.6 billion; and• Brokerage services — $0.6 billion.
Key Point
•The $18.1 billion in personal (labour) income generated in the sector is more than twice the labour income of the Canadian agriculture, forestry, and fishing industries combined.

32
Economic Benefits of the Commercial Real Estate Sector in Canada continued
In total, the sector generated personal income as follows:
• New construction — $9.8 billion;• Improvements — $4.8 billion; • Property/building management — $1.8 billion; and• Brokerage services — $1.8 billion.
Overall, the CRE Sector is a significant source of income for thousands of Canadians. As a comparison, the $18.1 billion in personal income generated in the sector is more than twice the personal income of the Canadian agriculture, forestry, and fishing industries combined.
0 4 8 12 16 20
Economic Benefits of the CRE Sector in Canada, Personal Income
$ Billion 2011
Total
Direct
*Includes both tenant improvement and other capital upgrades.**Includes “hard” and “soft” construction expenditure, and site development. Source: Altus Group Economic Consulting based on Statistics Canada Input-Output Model
1.80.6
1.80.6
4.82.7
9.84.5
18.18.5
Brokerage
Building Management
Improvements*
New Construction**
Total
Figure 15

33
Corporate Profits
In 2011, all economic activities from the CRE Sector generated $12.5 billion in profits for Canadian companies, ranging from small to large corporations, as shown in Figure 16, below.
There is a healthy mix of small, medium and large firms in the con-struction industry. However, many commercial building managers are large corporations owned by pension funds and major insurance companies. The profits generated in the CRE sector will flow back into these pension and insurance funds, benefiting millions of Canadians.
Directly, the sector generated corporate profits as follows:
• New construction — $1.6 billion;• Improvements — $0.9 billion; • Property/building management — $0.9 billion; and• Brokerage services — $1.0 billion.
In total, the sector generated corporate profits as follows:
• New construction — $5.3 billion;• Improvements — $2.5 billion; • Property/building management — $2.3 billion; and• Brokerage services — $2.3 billion.
0 3 6 9 12 15
Economic Benefits of the CRE Sector in Canada, Corporate Profits
$ Billion 2011
Total
Direct
*Includes both tenant improvement and other capital upgrades.**Includes “hard” and “soft” construction expenditure, and site development. Source: Altus Group Economic Consulting based on Statistics Canada Input-Output Model
2.31.0
2.30.9
2.50.9
5.31.6
12.54.4
Brokerage
Building Management
Improvements*
New Construction**
Total
Figure 16

34
Economic Benefits of the Commercial Real Estate Sector in Canada continued
Personal Taxes
The CRE Sector generated some $4.5 billion in revenue for govern-ments, in the form of federal and provincial personal taxes and other payroll deductions in 2011, as shown in Figure 17.
Directly, the sector generated:
• $1.0 billion in federal income taxes;• $0.6 billion in provincial income taxes; and• $0.5 billion in other payroll deductions.
In total, the sector generated:
• $2.2 billion in federal income taxes;• $1.3 billion in provincial income taxes; and• $1.1 billion in other payroll deductions.
0 1 2 3 4 5
1.1
0.5
1.3
0.6
2.2
1.0
4.6
2.1
Economic Benefits of the CRE Sector in Canada, Personal Taxes
Other Payroll Deductions*
Provincial Income Taxes
Total
$ Billion 2011
Total
Direct
*Includes Canadian Pension Plan and Employment Insurance. Source: Altus Group Economic Consulting
Federal Income Taxes
Figure 17

35
Corporate Taxes
The CRE Sector generated some $2.6 billion in corporate taxes for the federal and provincial governments in Canada in 2011, as shown in Figure 18.
Directly, the sector generated:
• $0.5 billion in federal corporate taxes; and• $0.4 billion in provincial corporate taxes.
In total, the sector generated:
• $1.5 billion in federal corporate taxes; and• $1.1 billion in provincial corporate taxes.
0.0 0.5 1.0 1.5 2.0 2.5 3.0
1.10.4
1.50.5
2.60.9
Provincial Income Taxes
Federal Income Taxes
Total
Total
Direct
Economic Benefits of the CRE Sector in Canada, Corporate Taxes
Source: Altus Group Economic Consulting
$ Billion 2011
Figure 18
Key Point
•Governments earn over $7 bil-lion per year in tax revenues (personal and corporate com-bined) related to activities in the CRE Sector.

36
Economic Benefits of the Commercial Real Estate Sector in Canada continued
Other Economic Benefits
Beyond the strict numbers of economic activity, spinoff benefits, jobs created, income earned and taxes generated, the CRE Sector is also responsible for providing a tremendous benefit to communi-ties across Canada by providing high-quality spaces for Canadians to work, eat, shop and play.
The development of commercial and industrial spaces, including land development, in a timely manner in local communities is criti-cal for economic development. Canada’s economic strength stems from economic development at the local community level. A commu-nity’s ability to attract and retain talent and young workers is directly related to the quality of the workspaces available and to the array of amenities offered across the community, including attractive shop-ping centres, restaurants, other retail facilities and entertainment destinations. Canada’s CRE Sector provides all of these spaces. And, while commercial real estate is developed within municipal zoning and planning frameworks, the initiative to bring forward new devel-opments when required, tends to rest squarely upon the numerous strong entrepreneurial firms found within Canada’s CRE Sector.
Taken together, well-functioning local communities, with a healthy pace of economic development that is supported by a strong and active CRE Sector, help to produce a robust pace of economic devel-opment nationwide. Many of the large companies within the CRE Sector have operations across Canada and are active within count-less communities in large urban areas and small.
The strength and scope of the sector provides high-quality work spaces that support some of Canada’s leading industries such as financial services, advanced manufacturing, information technology, food distribution and retail.
Buildings, workspaces and facilities provided by Canada’s CRE Sector also foster economic development in local communities by providing a variety of employment opportunities. Successful retail shopping cen-tres house tenants providing full and part-time work at a variety of skill levels, which closely match labour force requirements.
The CRE Sector provides tremendous economic benefits and serves as the economic development backbone to communities across the country. In addition, properties owned by the CRE Sector provide substantial revenue to municipalities and school boards across Canada through realty taxes. Overall, the CRE Sector plays a crucial role in promoting economic development and improving Canada’s standard of living.
37
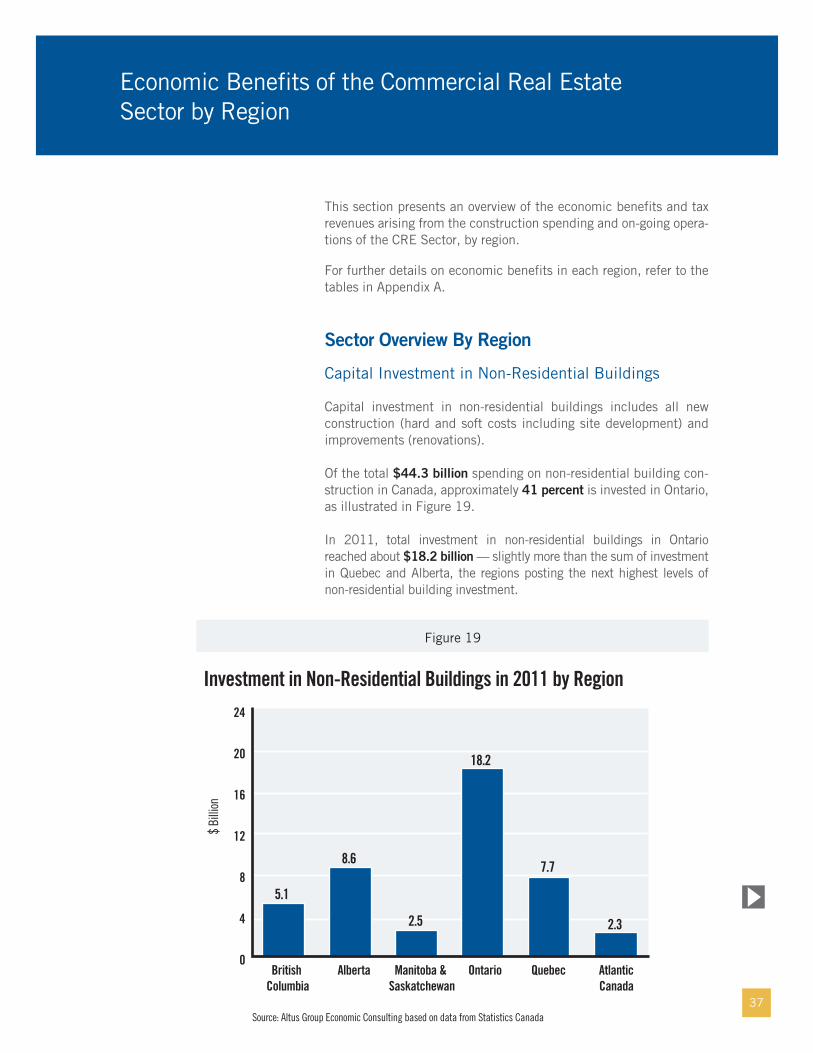
This section presents an overview of the economic benefits and tax revenues arising from the construction spending and on-going opera-tions of the CRE Sector, by region.
For further details on economic benefits in each region, refer to the tables in Appendix A.
Sector Overview By Region
Capital Investment in Non-Residential Buildings
Capital investment in non-residential buildings includes all new construction (hard and soft costs including site development) and improvements (renovations).
Of the total $44.3 billion spending on non-residential building con-struction in Canada, approximately 41 percent is invested in Ontario, as illustrated in Figure 19.
In 2011, total investment in non-residential buildings in Ontario reached about $18.2 billion — slightly more than the sum of investment in Quebec and Alberta, the regions posting the next highest levels of non-residential building investment.
Economic Benefits of the Commercial Real Estate Sector by Region
0
4
8
12
16
20
24
18.2
5.1
2.5
8.6
2.3
7.7
Investment in Non-Residential Buildings in 2011 by Region
Source: Altus Group Economic Consulting based on data from Statistics Canada
AtlanticCanada
QuebecAlbertaBritish Columbia
$ Bi
llion
OntarioManitoba & Saskatchewan
Figure 19

38
Economic Benefits of the Commercial Real Estate Sector by Region continued
Figure 20, below, shows the annual average growth of invest-ment in non-residential buildings through the 2007-2011 period. Observations to note:
• Although the amount of investment in Atlantic Canada was close to the combined amount in Manitoba and Saskatchewan, Atlantic Canada’s growth rate in non-residential investment was much higher than the growth rate seen in Manitoba and Saskatchewan over the 2007-2011 period (Figure 20); and
• Fuelled by a relatively strong local economy, Alberta enjoyed the highest growth rate for investment in non-residential buildings over the 2007-2011 period, followed by Ontario and Quebec.
Key Point
•Approximately 41 percent of non-residential building invest-ment in 2011 was made in Ontario, yet investment in Alberta has the fastest growth rate over the 2007-2011 period averaging 7 percent per year.
-4%
-2%
0%
2%
4%
6%
8%
5%
-2%
7%
2%3%
Average Annual Growth, Investment in Non-Residential Buildings, by Region, 2007-2011
*The growth rate is 0% for the period.Source: Altus Group Economic Consulting based on data from Statistics Canada
AtlanticCanada
QuebecAlbertaBritish Columbia
OntarioManitoba & Saskatchewan*
Figure 20

39
Capital Investment in CRE Sector Buildings
Capital investment in the CRE Sector is significant in all regions across Canada, as seen in Figure 21, below.
As illustrated, some $7.7 billion was invested in Ontario’s CRE Sector in 2011, compared to a combined amount of $9.2 billion in Quebec and Alberta. Ontario’s investment was concentrated in pub-lic sector buildings, including hospitals, libraries, research labs and government buildings.
0
1
2
3
4
5
6
7
8
9
7.7
1.2
2.4
5.0
1.0
4.2
Investment in the CRE Sector Buildings in 2011 by Region
Source: Altus Group Economic Consulting based on data from Statistics Canada
AtlanticCanada
QuebecAlbertaBritish Columbia
OntarioManitoba & Saskatchewan
$ Bi
llion
Figure 21

40
Economic Benefits of the Commercial Real Estate Sector by Region continued
As seen in Figure 21, Ontario accounted for the largest share of investment in CRE Sector buildings in 2011, yet the gap narrowed over the 2007-2011 period. Figure 22 demonstrates that invest-ment in Ontario declined by an average annual rate of two percent over the period, while investment in Alberta increased by an aver-age annual rate of one percent. In addition, Quebec and British Columbia saw modest annual growth (at about one percent) over the period.
-8%
-4%
0%
4%
8%
12%
16%
-2%-4%
1%
13%
-5%
1%
Average Annual Growth , Investment in the CRE Sector Buildings, by Region, 2007-2011
Source: Altus Group Economic Consulting based on data from Statistics Canada
AtlanticCanada
QuebecAlbertaBritish Columbia
OntarioManitoba & Saskatchewan
Figure 22

41
Economic Benefits
Economic Activity
Ontario accounted for the largest share of total economic activity generated by the CRE Sector in 2011, as illustrated in Figure 23, below.
The direct economic activity generated in Ontario’s CRE Sector totalled $11.2 billion, more than twice the amount generated in Quebec. However, the economic spinoffs are proportionately higher in Quebec than in Ontario, due to higher multipliers in Quebec. This means that one dollar spent in Quebec’s CRE Sector generates larger economic benefits than the same dollar spent in Ontario, according to the Statistics Canada Input-Output Model. Among the regions, British Columbia has the highest impact multiplier.
For additional information on economic benefits in each region, refer to the tables in Appendix C.
0 5 10 15 20 25 30
3.01.3
12.85.5
23.311.2
3.71.6
13.65.9
7.03.0
Economic Benefits of the CRE Sector by Region, Total Economic Activity
$ Billion 2011
Total
Direct
Source: Altus Group Economic Consulting based on Statistics Canada Input-Output Model
Atlantic Canada
Quebec
Alberta
British Columbia
Ontario
Manitoba & Saskatchewan
Figure 23

42
Economic Benefits of the Commercial Real Estate Sector by Region continued
GDP
Construction spending on new buildings in the CRE Sector and the on-going operation of these buildings play a significant role in regional economies across Canada, as can be seen in Figure 24, below.
Ontario’s GDP, by a wide margin, benefits the most from the CRE Sector, followed by Quebec and Alberta. Ontario also carries one of the highest GDP multipliers, so investment and economic activity in the CRE Sector makes a greater impact on the GDP of Ontario than on that of other regions.
0 3 6 9 12 15
1.40.6
6.12.4
13.16.2
1.80.7
6.62.6
3.41.3
Economic Benefits of the CRE Sector by Region, GDP
$ Billion 2011
Total
Direct
Source: Altus Group Economic Consulting based on Statistics Canada Input-Output Model
Atlantic Canada
Quebec
Alberta
British Columbia
Ontario
Manitoba & Saskatchewan
Figure 24

43
Jobs
The CRE Sector is a significant employer in each region across Canada, as can be seen in Figure 25, below.
In total, the sector supported some 137,600 jobs in Ontario, the largest number among all of the regions in Canada. The jobs sup-ported by Ontario’s CRE Sector are close to the total employment in a mid-sized urban area such as Windsor and Oshawa. Many of these jobs are high-paying professional positions, ranging from commercial brokers and managers to financial professionals.
0 30 60 90 120 150
20.19.5
70.628.5
137.669.4
18.37.2
56.523.2
36.314.8
Economic Benefits of the CRE Sector by Region, Jobs
Full-time Equivalent Jobs (000s)
Total
Direct
Source: Altus Group Economic Consulting based on Statistics Canada Input-Output Model
Atlantic Canada
Quebec
Alberta
British Columbia
Ontario
Manitoba & Saskatchewan
Figure 25
Key Point
•Approximately 137,600 jobs in Ontario are created within and support the CRE Sector, which is close to the total employment in Windsor or Oshawa.

44
Economic Benefits of the Commercial Real Estate Sector by Region continued
Personal Income
The employment supported by the CRE Sector generated billions of dollars in personal income across Canada’s regions in 2011, as can be seen in Figure 26, below.
In total, the sector generated personal income within the regions as follows:
• Atlantic Canada — $0.8 billion;• Quebec — $3.4 billion; • Ontario — $7.3 billion; • Manitoba and Saskatchewan — $0.9 billion;• Alberta — $3.8 billion; and• British Columbia — $1.8 billion.
0 2 4 6 8
0.80.4
3.41.4
7.33.8
0.90.3
3.81.8
1.80.7
Economic Benefits of the CRE Sector by Region, Personal Income
$ Billion 2011
Total
Direct
Source: Altus Group Economic Consulting based on Statistics Canada Input-Output Model
Atlantic Canada
Quebec
Alberta
British Columbia
Ontario
Manitoba & Saskatchewan
Figure 26

45
Corporate Profits
In 2011, activities from the CRE Sector generated substantial profits for companies in all regions of Canada, as shown in Figure 27.
In total, the sector generated corporate profits within the regions as follows:
• Atlantic Canada — $0.5 billion;• Quebec — $2.4 billion; • Ontario — $4.9 billion;• Manitoba and Saskatchewan — $0.8 billion;• Alberta — $2.6 billion; and• British Columbia — $1.4 billion.
0 1 2 3 4 5 6
0.50.2
2.40.8
4.91.9
0.80.3
2.60.8
1.40.5
Economic Benefits of the CRE Sector by Region, Corporate Profits
$ Billion 2011
Total
Direct
Source: Altus Group Economic Consulting based on Statistics Canada Input-Output Model
Atlantic Canada
Quebec
Alberta
British Columbia
Ontario
Manitoba & Saskatchewan
Figure 27

46
Economic Benefits of the Commercial Real Estate Sector by Region continued
Personal Taxes
The CRE Sector generates billions of dollars in revenue for govern-ments, in the form of federal and provincial personal taxes and other payroll deductions (employment insurance and Canadian pension plan contributions). Regional comparisons are displayed in Figure 28, below.
Among the regions, Quebec carries one of the highest personal income tax rates while Ontario and British Columbia feature some of the lowest. Unlike other provinces, Alberta has a flat personal income tax rate of 10 percent.
In total, the sector generated personal taxes within the regions as follows:
• Atlantic Canada — $0.2 billion;• Quebec — $1.1 billion; • Ontario — $1.6 billion;• Manitoba and Saskatchewan — $0.2 billion;• Alberta — $1.0 billion; and• British Columbia — $0.4 billion.
0.0 0.4 0.8 1.2 1.6 2.0
0.20.1
1.10.5
1.60.9
0.20.1
1.00.5
0.40.2
Economic Benefits of the CRE Sector by Region, Personal Taxes
Atlantic Canada
Quebec
Alberta
British Columbia
$ Billion 2011
Total
Direct
Source: Altus Group Economic Consulting
Ontario
Manitoba & Saskatchewan
Figure 28

47
Corporate Taxes
The CRE Sector generates billions of dollars in revenues for govern-ments, in the form of corporate taxes. In general, provinces have lower tax rates for small businesses, compared to tax rates for large corporations. The estimates in this section are based on corporate taxes as assessed in the province where buildings are located. Actual corporate taxes payable may differ from these estimates due to differences in reporting jurisdictions for CRE Sector companies. Regional comparisons are displayed in Figure 29, below.
In total, the sector generated corporate taxes within the regions as follows:
• Atlantic Canada — $110 million;• Quebec — $480 million; • Ontario — $960 million;• Manitoba and Saskatchewan — $60 million;• Alberta — $470 million; and• British Columbia — $250 million.
0.00 0.20 0.40 0.60 0.80 1.00 1.20
0.110.04
0.480.16
0.960.37
0.060.02
0.470.15
0.250.08
Economic Benefits of the CRE Sector by Region, Corporate Taxes
$ Billion 2011
Total
Direct
Source: Altus Group Economic Consulting
Atlantic Canada
Quebec
Alberta
British Columbia
Ontario
Manitoba & Saskatchewan
Figure 29

48
The CRE Sector plays a vital role in Canada’s economy and quality of life. Construction of commercial real estate buildings and their daily operations creates thousands of jobs and adds tremendous value to the Canadian economy. In addition, the sector provides high quality workspaces for millions of Canadians and places for Canadians to shop, eat and play.
Capital investment in the CRE Sector totalled some $21.6 billion in 2011, accounting for about half of total spending on non-residential construction. Some $14.9 billion was spent on new buildings, the rest ($6.7 billion) was invested in capital improvements, renovations and the upgrading of existing buildings. In 2011, the CRE Sector generated about $3.5 billion in building management fees and almost the same amount for commercial brokerage fees from the sale of commercial properties.
Taken together, the construction and investment in office, industrial and retail buildings in the CRE Sector and the on-going operation of these buildings make a substantial contribution to the Canadian economy.
The CRE Sector also generates an array of other benefits to com-munities across the country and to the national economy such as the promotion of economic development and accommodation of employ-ment growth. In addition, properties owned by the CRE Sector provide substantial revenue to municipalities and school boards across Canada through realty taxes.
Conclusion

49
Capital Investment in Non-Residential Buildings — represents a process of human endeavour resulting in the erection, assembly, completion of free standing and static buildings in the non-resi-dential sector, generally on a permanent foundation, bedding or location. It includes both new construction investment and renova-tion investment, as described below:
• New Construction Investment — spending that includes capital investment in construction of new buildings and major additions to existing buildings. In this report, it includes three components: • Site Development — a category of construction activity that
reflects improvements made to the site before a building can be constructed. These activities include grading, roadways, landscaping, surface and structured parking and other costs related to the preparation of the site to support the functions of the building constructed on the site.
• Hard Costs — a category of construction costs that reflects the outlays for the building construction phase. Costs for labour and materials are two basic types of hard costs.
• Soft Costs — a category of construction costs that reflect the professional services and administrative and management processes required to support the construction project. Soft costs may precede actual on-site construction by several years and include legal and other consultant services, architectural and engineering services, management and administration, inspections, loan origination fees, real estate taxes and other governmental fees, and insurance required to support the con-struction of the building.
• Renovation Investment — spending that includes capital investment related to the alteration and improvements of existing non-residen-tial buildings. In this report, it includes two components:• Tenant Improvements — a category of construction costs that
reflects improvements made to the interior of a building to meet the needs of a specific tenant. Costs may include interior walls and partitions, floor coverings, shelving, windows, and bathrooms. The building owner or the tenant or both may pay for these improvements depending on the specific lease terms.
• Other Capital Upgrades — a category of construction costs that includes regular renovation spending, which is necessary to ensure the daily function of the CRE building. Examples include upgrading the building’s lobby and repainting exterior walls.
Glossary

50
Glossary continued
Commercial Real Estate Sector (CRE Sector) — this category of real estate includes three components:
• Industrial — this category is composed of factories, warehouses, distribution centres, agricultural buildings, railway shops, aircraft hangers, maintenance garages, equipment storage and workshops.
• Office — this category is composed of downtown office towers, suburban offices, corporate campuses, and other office buildings owned by the private sector.
• Retail and Entertainment — this category is composed of shop-ping centers, theatres, performance arts and cultural centres, restaurants and bars, and automotive dealerships.
Economic Impact — the generation of new spending and the cre-ation of new jobs within a jurisdiction as a result of new economic activity in a specific sector, in this case, the CRE Sector. Generally, there are three “rounds” of economic impact:
• Direct Impact — effects of economic activity directly related to the subject sector. In this report, it means the CRE Sector.
• Indirect Impact — effects that are related to economic activity in industries providing goods and services to the companies directly involved in the CRE Sector.
• Induced Impact — effects that are generated from the expendi-ture of incomes generated in the direct and indirect rounds.• Note: collectively the ‘indirect’ and ‘induced’ rounds are
referred to as economic “spinoff” activities within this report.
Economic Parameters — a set of statistical measurements that can illustrate a sector’s impact on the economy. In this report, they include the following:
• Economic Activity — the volume of goods and services consumed in the economy related to the development, construction and on-going operation of the CRE Sector.
• Contribution to GDP — the value-added component of the eco-nomic activities, as a measure of the contribution of the activities to Canada’s GDP.
• Jobs — in this report, the term “jobs” is close to but not the same as “person‐years of employment.” The estimate of jobs provides the number of workers that would be employed for a full‐year; how-ever, the estimate includes both full and permanent part‐time jobs.
• Income — the volume of income generated through the various economic activities, including wages, other labour earnings, mixed income and corporate profits.
• Government Tax Revenues — federal and provincial tax revenues, primarily personal and corporate income taxes, and other payroll deductions such as Canadian Pension Plan contribution and Employment Insurance premium.
51
Full-Time Equivalent Jobs — represents the number of workers that would be employed for a full‐year; however, that includes both full and permanent part‐time jobs at the ratios appropriate for each of the industries involved. For example, two part-time jobs of 20 hours per week would be equivalent to one full-time equivalent job at 40 hours per week.
Gross Domestic Product (GDP) — the total unduplicated value of the goods and services produced in the economic territory of a country or region during a given period.
Mixed Income — this type of income consists of earnings of pro-prietors of unincorporated businesses (sole proprietorships and partnerships) such as retailers and consultants, earnings of inde-pendent professional practitioners such as lawyers and dentists, net (after expenses) rental income of owners of real property and the accrued net farm income of farm operators.
Multiplier — an input-output multiplier is a quantitative measure created by a particular input-output based economic model. It is an analytical answer to a hypothetical question about how certain expenditure is expected to impact the economy.
On-going Operations of Commercial Properties — in this report this term includes two categories of economic activity as follows:
• Brokerages Fees — fees that are paid to commercial real estate brokers when a property is sold through the broker.
• Building Management Fees — fees that are charged by building managers whose duties include operating and maintaining the property. Building managers also collect rents and search for new tenants on behalf of building owners.
Sector — a grouping of industries or firms by similar operational characteristics (e.g. retail trade sector, manufacturing sector, con-struction sector, mining sector, service sector, government sector).
52
Appendix A: Detailed Tables for Construction Spending on Non-Residential Buildings

53
2007 2008 2009 2010 2011
Canada (Billions of Dollars)
Industrial Buildings 7.0 7.2 6.4 5.6 6.0 Commercial 20.7 24.5 23.3 22.8 24.8 Private Office 5.3 6.2 7.0 7.7 8.1 Public Office 1.9 2.5 2.5 2.6 2.8 Retail/Entertainment 8.0 9.0 6.6 6.4 7.5 Others 5.4 6.8 7.2 6.1 6.4 Institutional 11.0 12.2 13.1 14.3 13.5 Total 38.7 44.0 42.8 42.6 44.3
Atlantic Canada Industrial Buildings 0.4 0.5 0.3 0.2 0.3 Commercial 1.1 1.1 1.1 0.9 1.1 Private Office 0.3 0.3 0.3 0.3 0.4 Public Office 0.1 0.1 0.1 0.1 0.1 Retail/Entertainment 0.5 0.5 0.4 0.3 0.4 Others 0.3 0.2 0.3 0.2 0.3 Institutional 0.6 0.7 1.0 0.8 0.9 Total 2.1 2.2 2.4 2.0 2.3
Quebec Industrial Buildings 1.4 1.4 1.5 1.2 1.2 Commercial 3.6 3.8 3.3 3.9 4.3 Private Office 1.1 1.0 0.9 1.1 1.2 Public Office 0.4 0.4 0.3 0.3 0.3 Retail/Entertainment 1.5 1.6 1.1 1.2 1.8 Others 0.6 0.7 1.0 1.3 1.0 Institutional 1.8 2.0 2.2 2.2 2.1 Total 6.8 7.2 7.0 7.3 7.7
Ontario Industrial Buildings 2.4 2.1 1.7 2.2 2.3 Commercial 8.7 10.0 8.9 9.1 9.8 Private Office 2.3 2.7 2.8 3.5 2.4 Public Office 0.8 1.1 1.0 1.1 1.2 Retail/Entertainment 3.6 3.9 2.4 2.6 3.0 Others 2.0 2.3 2.8 1.9 3.2 Institutional 4.1 4.1 4.8 5.3 6.1 Total 15.2 16.3 15.4 16.6 18.2
Manitoba and Saskatchewan Industrial Buildings 0.9 1.1 1.0 0.4 0.4 Commercial 1.0 1.3 1.5 1.3 1.3 Private Office 0.3 0.4 0.5 0.5 0.7 Public Office 0.1 0.2 0.2 0.2 0.2 Retail/Entertainment 0.3 0.3 0.3 0.2 0.2 Others 0.3 0.5 0.5 0.3 0.3 Institutional 0.6 1.0 0.7 0.8 0.8 Total 2.5 3.4 3.2 2.4 2.5
Alberta Industrial Buildings 1.2 1.5 1.1 1.0 1.3 Commercial 3.2 4.1 4.9 4.9 5.5 Private Office 0.8 1.2 1.8 1.6 2.7 Public Office 0.3 0.5 0.6 0.6 0.6 Retail/Entertainment 1.0 1.5 1.1 1.0 1.0 Others 1.1 1.0 1.4 1.7 1.1 Institutional 2.2 2.4 2.6 3.5 1.9 Total 6.6 8.1 8.6 9.4 8.6
British Columbia Industrial Buildings 0.7 0.6 0.7 0.5 0.5 Commercial 3.0 4.2 3.5 2.8 2.8 Private Office 0.6 0.7 0.7 0.7 0.7 Public Office 0.2 0.3 0.3 0.3 0.4 Retail/Entertainment 1.0 1.3 1.3 1.1 1.2 Others 1.2 2.0 1.2 0.7 0.6 Institutional 1.8 2.0 1.9 1.7 1.7 Total 5.5 6.8 6.1 4.9 5.1
Source: Altus Group Economic Consulting based on data from Statistics Canada
Appendix A-1
Total Spending on Non-Residential Building Construction by Region, 2007-2011

54
Appendix A continued
2007 2008 2009 2010 2011
Canada (Billions of Dollars)
Industrial Buildings 5.9 6.3 5.4 4.4 5.0 Commercial 15.1 17.1 14.9 15.3 16.3 Private Office 3.4 3.6 3.9 4.7 4.6 Public Office 1.4 1.5 1.7 2.1 2.2 Retail/Entertainment 6.2 6.9 4.4 4.3 5.3 Others 4.1 5.1 4.9 4.3 4.3 Institutional 8.1 9.1 9.5 9.7 9.3 Total 29.2 32.5 29.8 29.3 30.7
Atlantic Canada Industrial Buildings 0.4 0.4 0.3 0.2 0.2 Commercial 0.8 0.8 0.7 0.7 0.7 Private Office 0.2 0.2 0.2 0.2 0.2 Public Office 0.1 0.1 0.1 0.1 0.1 Retail/Entertainment 0.4 0.3 0.2 0.2 0.2 Others 0.2 0.2 0.2 0.1 0.2 Institutional 0.4 0.5 0.8 0.7 0.7 Total 1.6 1.7 1.9 1.6 1.7
Quebec Industrial Buildings 1.0 1.1 1.2 0.8 0.9 Commercial 2.2 2.2 1.9 2.3 2.8 Private Office 0.6 0.4 0.5 0.7 0.7 Public Office 0.2 0.2 0.1 0.2 0.1 Retail/Entertainment 1.1 1.2 0.7 0.7 1.3 Others 0.4 0.4 0.5 0.7 0.6 Institutional 0.9 1.0 0.9 0.9 0.8 Total 4.1 4.3 3.9 4.0 4.5
Ontario Industrial Buildings 2.0 1.8 1.4 1.7 1.9 Commercial 6.3 7.1 5.5 6.2 6.2 Private Office 1.4 1.5 1.5 2.0 1.2 Public Office 0.7 0.7 0.6 1.0 0.9 Retail/Entertainment 2.8 3.1 1.6 1.7 2.0 Others 1.4 1.7 1.9 1.5 2.0 Institutional 3.2 3.3 3.5 3.8 4.6 Total 11.5 12.3 10.4 11.6 12.6
Manitoba and Saskatchewan Industrial Buildings 0.8 1.0 0.9 0.4 0.3 Commercial 0.7 0.8 0.9 0.9 0.9 Private Office 0.1 0.2 0.2 0.4 0.4 Public Office 0.1 0.1 0.1 0.1 0.1 Retail/Entertainment 0.2 0.2 0.2 0.1 0.1 Others 0.2 0.3 0.4 0.2 0.2 Institutional 0.5 0.7 0.5 0.6 0.5 Total 1.9 2.6 2.3 1.8 1.7
Alberta Industrial Buildings 1.1 1.4 1.1 1.0 1.2 Commercial 2.8 3.0 3.6 3.5 3.7 Private Office 0.7 0.7 1.1 1.0 1.5 Public Office 0.2 0.4 0.6 0.5 0.6 Retail/Entertainment 0.9 1.1 0.8 0.7 0.7 Others 0.9 0.8 1.1 1.3 0.8 Institutional 1.6 2.1 2.3 2.6 1.4 Total 5.5 6.6 6.9 7.0 6.2
British Columbia Industrial Buildings 0.7 0.6 0.6 0.4 0.4 Commercial 2.3 3.1 2.3 1.8 2.1 Private Office 0.4 0.5 0.5 0.4 0.5 Public Office 0.1 0.1 0.2 0.2 0.3 Retail/Entertainment 0.8 0.9 0.9 0.8 0.9 Others 1.0 1.6 0.7 0.5 0.4 Institutional 1.5 1.4 1.5 1.1 1.3 Total 4.4 5.1 4.4 3.4 3.9
Source: Altus Group Economic Consulting based on data from Statistics Canada
Appendix A-2
Spending on Non-Residential Building Construction by Region, New Construction, 2007-2011

55
2007 2008 2009 2010 2011
Canada (Billions of Dollars)
Industrial Buildings 1.1 0.9 0.9 1.2 1.0 Commercial 5.5 7.4 8.3 7.5 8.5 Private Office 1.9 2.6 3.0 3.0 3.6 Public Office 0.5 1.0 0.7 0.6 0.6 Retail/Entertainment 1.9 2.1 2.2 2.1 2.2 Others 1.3 1.7 2.3 1.8 2.1 Institutional 2.9 3.1 3.7 4.6 4.2 Total 9.5 11.5 12.9 13.3 13.7
Atlantic Canada Industrial Buildings 0.1 0.1 0.0 0.0 0.0 Commercial 0.3 0.3 0.4 0.2 0.4 Private Office 0.1 0.1 0.1 0.1 0.2 Public Office 0.0 0.0 0.0 0.0 0.0 Retail/Entertainment 0.1 0.1 0.2 0.1 0.1 Others 0.1 0.1 0.1 0.0 0.1 Institutional 0.2 0.2 0.1 0.1 0.2 Total 0.5 0.6 0.5 0.4 0.6
Quebec Industrial Buildings 0.4 0.3 0.3 0.4 0.3 Commercial 1.3 1.5 1.5 1.6 1.5 Private Office 0.5 0.6 0.4 0.4 0.5 Public Office 0.2 0.2 0.2 0.1 0.2 Retail/Entertainment 0.4 0.4 0.4 0.5 0.5 Others 0.2 0.3 0.5 0.6 0.3 Institutional 0.9 1.0 1.3 1.3 1.3 Total 2.6 2.8 3.1 3.4 3.2
Ontario Industrial Buildings 0.4 0.3 0.3 0.5 0.4 Commercial 2.4 2.9 3.4 3.0 3.6 Private Office 0.9 1.2 1.3 1.5 1.2 Public Office 0.1 0.4 0.4 0.2 0.2 Retail/Entertainment 0.8 0.7 0.8 0.9 1.0 Others 0.5 0.6 0.9 0.4 1.2 Institutional 0.8 0.8 1.3 1.5 1.5 Total 3.7 4.0 5.0 5.0 5.6
Manitoba and Saskatchewan Industrial Buildings 0.1 0.1 0.1 0.1 0.0 Commercial 0.4 0.5 0.5 0.4 0.4 Private Office 0.1 0.2 0.3 0.2 0.2 Public Office 0.0 0.1 0.0 0.1 0.0 Retail/Entertainment 0.1 0.1 0.1 0.1 0.1 Others 0.1 0.1 0.1 0.1 0.1 Institutional 0.1 0.3 0.3 0.2 0.3 Total 0.6 0.9 0.9 0.6 0.7
Alberta Industrial Buildings 0.1 0.1 0.1 0.1 0.1 Commercial 0.5 1.1 1.4 1.4 1.8 Private Office 0.1 0.4 0.7 0.6 1.2 Public Office 0.0 0.0 0.0 0.1 0.1 Retail/Entertainment 0.1 0.4 0.3 0.3 0.3 Others 0.2 0.2 0.3 0.4 0.3 Institutional 0.6 0.3 0.3 0.9 0.5 Total 1.1 1.5 1.7 2.4 2.4
British Columbia Industrial Buildings 0.1 0.1 0.1 0.1 0.1 Commercial 0.7 1.1 1.2 0.9 0.7 Private Office 0.2 0.2 0.2 0.3 0.2 Public Office 0.1 0.2 0.1 0.1 0.0 Retail/Entertainment 0.2 0.4 0.4 0.3 0.3 Others 0.2 0.4 0.4 0.2 0.2 Institutional 0.3 0.6 0.4 0.5 0.3 Total 1.0 1.7 1.6 1.5 1.1
Source: Altus Group Economic Consulting based on data from Statistics Canada
Appendix A-3
Spending on Non-Residential Building Construction by Region, Renovation and Improvement, 2007-2011

56
Appendix A continued
2007 2008 2009 2010 2011
Canada (Billions of Dollars)
CRE Sector 20.4 22.5 20.0 19.7 21.6 Others 18.3 21.5 22.8 23.0 22.7 Total 38.7 44.0 42.8 42.6 44.3
Atlantic Canada CRE Sector 1.2 1.2 1.1 0.9 1.0 Others 0.9 1.0 1.4 1.1 1.3 Total 2.1 2.2 2.4 2.0 2.3
Quebec CRE Sector 4.0 4.0 3.6 3.5 4.2 Others 2.8 3.2 3.5 3.8 3.4 Total 6.8 7.2 7.0 7.3 7.7
Ontario CRE Sector 8.4 8.7 6.9 8.3 7.7 Others 6.8 7.5 8.5 8.3 10.5 Total 15.2 16.3 15.4 16.6 18.2
Manitoba and Saskatchewan CRE Sector 1.4 1.8 1.8 1.1 1.2 Others 1.0 1.6 1.4 1.3 1.2 Total 2.5 3.4 3.2 2.4 2.5
Alberta CRE Sector 3.0 4.2 4.0 3.6 5.0 Others 3.6 3.9 4.7 5.8 3.6 Total 6.6 8.1 8.6 9.4 8.6
British Columbia CRE Sector 2.3 2.6 2.7 2.3 2.4 Others 3.2 4.3 3.4 2.6 2.6 Total 5.5 6.8 6.1 4.9 5.1
1 Includes public offices, institutional and other commercial buildings. Source: Altus Group Economic Consulting based on data from Statistics Canada
Appendix A-4
Total Spending on Non-Residential Building Construction by Region, CRE Sector Buildings and Others1, 2007-2011

57
2007 2008 2009 2010 2011
Canada (Billions of Dollars)
CRE Sector 15.5 16.8 13.8 13.3 14.9 Others 13.6 15.7 16.0 16.0 15.8 Total 29.2 32.5 29.8 29.3 30.7
Atlantic Canada CRE Sector 0.9 0.9 0.7 0.7 0.7 Others 0.7 0.7 1.2 0.9 1.0 Total 1.6 1.7 1.9 1.6 1.7
Quebec CRE Sector 2.7 2.7 2.4 2.2 2.9 Others 1.5 1.6 1.6 1.8 1.6 Total 4.1 4.3 3.9 4.0 4.5
Ontario CRE Sector 6.2 6.5 4.5 5.4 5.0 Others 5.3 5.8 5.9 6.2 7.6 Total 11.5 12.3 10.4 11.6 12.6
Manitoba and Saskatchewan CRE Sector 1.1 1.4 1.3 0.8 0.9 Others 0.8 1.1 1.0 1.0 0.8 Total 1.9 2.6 2.3 1.8 1.7
Alberta CRE Sector 2.7 3.2 2.9 2.7 3.4 Others 2.8 3.3 4.0 4.3 2.8 Total 5.5 6.6 6.9 7.0 6.2
British Columbia CRE Sector 1.9 2.0 2.0 1.6 1.9 Others 2.6 3.1 2.4 1.8 2.1 Total 4.4 5.1 4.4 3.4 3.9
1 Includes public offices, institutional and other commercial buildings. Source: Altus Group Economic Consulting based on data from Statistics Canada
Appendix A-5
Spending on Non-Residential Building Construction by Region, CRE Sector Buildings and Others1, New Construction, 2007-2011

58
Appendix A continued
2007 2008 2009 2010 2011
Canada (Billions of Dollars)
CRE Sector 4.8 5.7 6.2 6.4 6.7 Others 4.7 5.8 6.7 7.0 6.9 Total 9.5 11.5 12.9 13.3 13.7
Atlantic Canada CRE Sector 0.3 0.3 0.3 0.2 0.3 Others 0.2 0.3 0.2 0.2 0.3 Total 0.5 0.6 0.5 0.4 0.6
Quebec CRE Sector 1.3 1.3 1.2 1.3 1.3 Others 1.3 1.6 1.9 2.0 1.9 Total 2.6 2.8 3.1 3.4 3.2
Ontario CRE Sector 2.1 2.2 2.4 2.9 2.6 Others 1.5 1.8 2.6 2.1 2.9 Total 3.7 4.0 5.0 5.0 5.6
Manitoba and Saskatchewan CRE Sector 0.3 0.4 0.4 0.3 0.4 Others 0.3 0.5 0.4 0.3 0.4 Total 0.6 0.9 0.9 0.6 0.7
Alberta CRE Sector 0.3 0.9 1.1 0.9 1.6 Others 0.8 0.6 0.6 1.5 0.8 Total 1.1 1.5 1.7 2.4 2.4
British Columbia CRE Sector 0.5 0.6 0.7 0.7 0.6 Others 0.6 1.1 0.9 0.8 0.6 Total 1.0 1.7 1.6 1.5 1.1
1 Includes public offices, institutional and other commercial buildings. Source: Altus Group Economic Consulting based on data from Statistics Canada
Appendix A-6
Spending on Non-Residential Building Construction by Region, CRE Sector Buildings and Others1, Renovation, 2007-2011

59
Other Hard Soft Site Tenant Capital Total Costs Costs Development Improvement Spending Renovation Total
Canada (Billions of Dollars)
Industrial Buildings 3.77 0.75 0.50 0.39 0.59 0.98 6.00 Commercial Private Office Building 3.30 0.87 0.41 0.71 2.84 3.55 8.13 Retail/Entertainment 3.69 1.00 0.58 0.66 1.55 2.21 7.48 Total 10.75 2.62 1.49 1.77 4.98 6.75 21.62
Atlantic CanadaIndustrial Buildings 0.18 0.04 0.02 0.02 0.03 0.04 0.29 Commercial Private Office Building 0.15 0.04 0.02 0.03 0.13 0.16 0.37 Retail/Entertainment 0.17 0.04 0.03 0.04 0.09 0.13 0.37 Total 0.50 0.12 0.07 0.09 0.24 0.33 1.02
QuebecIndustrial Buildings 0.69 0.14 0.09 0.13 0.19 0.32 1.24 Commercial Private Office Building 0.53 0.14 0.07 0.10 0.40 0.50 1.23 Retail/Entertainment 0.90 0.24 0.14 0.14 0.33 0.47 1.76 Total 2.12 0.52 0.30 0.37 0.92 1.29 4.23
OntarioIndustrial Buildings 1.40 0.28 0.19 0.17 0.25 0.42 2.28 Commercial Private Office Building 0.84 0.22 0.11 0.25 0.99 1.24 2.41 Retail/Entertainment 1.40 0.38 0.22 0.30 0.69 0.99 2.99 Total 3.64 0.88 0.51 0.71 1.94 2.65 7.68
Manitoba and SaskatchewanIndustrial Buildings 0.24 0.05 0.03 0.02 0.03 0.05 0.37 Commercial Private Office Building 0.32 0.08 0.04 0.05 0.20 0.24 0.68 Retail/Entertainment 0.09 0.02 0.01 0.02 0.04 0.06 0.19 Total 0.65 0.16 0.09 0.09 0.27 0.35 1.24
AlbertaIndustrial Buildings 0.91 0.18 0.12 0.03 0.04 0.07 1.29 Commercial Private Office Building 1.09 0.29 0.14 0.24 0.97 1.22 2.73 Retail/Entertainment 0.50 0.14 0.08 0.08 0.20 0.28 1.00 Total 2.50 0.61 0.34 0.36 1.21 1.57 5.01
British ColumbiaIndustrial Buildings 0.34 0.07 0.04 0.03 0.05 0.09 0.54 Commercial Private Office Building 0.37 0.10 0.05 0.04 0.15 0.19 0.70 Retail/Entertainment 0.63 0.17 0.10 0.09 0.20 0.28 1.19 Total 1.34 0.34 0.19 0.16 0.40 0.56 2.42
Source: Altus Group Economic Consulting
Appendix A-7
Detailed Construction Spending by Region, CRE Sector Buildings, 2011

60
Appendix B: Economic Benefits of the Commercial Real Estate Sector in Canada

61
New Non-Residential Site Tenant Management Brokerage Construction Development Improvement Fees Fees Total
Spending ($ Millions) 13,375 1,494 6,748 3,457 3,464 28,538
Gross output ($ Millions)
Direct gross output 13,375 1,494 6,748 3,457 3,464 28,538 Indirect gross output 9,568 1,035 3,856 2,582 2,517 19,557 Induced gross output 6,840 764 3,576 2,036 2,017 15,233 Total gross output 29,783 3,293 14,179 8,076 7,997 63,328
GDP ($ Millions)
Direct GDP 5,875 723 3,837 1,633 1,684 13,751 Indirect GDP 4,683 521 1,811 1,413 1,372 9,800 Induced GDP 3,949 456 2,126 1,147 1,150 8,829 Total GDP 14,508 1,700 7,774 4,193 4,205 32,380
Employment (Number of jobs)
Direct employment 70,407 6,795 49,501 12,984 12,942 152,629 Indirect employment 49,738 5,258 21,104 15,081 14,387 105,568 Induced employment 38,780 4,272 21,396 8,505 8,282 81,235 Total employment 158,925 16,325 92,001 36,569 35,611 339,432
Labour income ($ Millions)
Direct labour income 4,044 483 2,715 618 634 8,493 Indirect labour income 2,903 338 1,056 776 751 5,824 Induced labour income 1,822 215 1,003 371 368 3,780 Total labour income 8,769 1,036 4,774 1,765 1,753 18,097
Company Profit ($ Millions)
Direct company profit 1,388 206 950 920 959 4,422 Indirect company profit 1,619 168 679 557 540 3,563 Induced company profit 1,762 198 920 834 846 4,559 Total company profit 4,769 571 2,548 2,312 2,345 12,544
Note: Indirect impacts are related to economic activity in industries providing goods and services to the companies directly involved in the CRE Sector. Induced impacts are generated from the expenditure of incomes generated in the direct and indirect rounds.
Source: Altus Group Economic Consulting based on Statistics Canada’s Input-Output Model
Appendix B-1
Economic Benefits of the CRE Sector in Canada, 2011

62
Appendix C: Economic Benefits of the Commercial Real Estate Sector by Region

63
New Non-Residential Site Tenant Management Brokerage Construction Development Improvement Fees Fees Total
Spending ($ Millions) 623 69 332 125 163 1,312
Gross output ($ Millions)
Direct gross output 623 69 332 125 163 1,312 Indirect gross output 494 47 225 103 131 1,000 Induced gross output 333 35 188 77 99 732 Total gross output 1,449 152 745 305 394 3,044
GDP ($ Millions)
Direct GDP 243 35 166 54 74 573 Indirect GDP 230 24 101 54 67 476 Induced GDP 177 22 101 41 53 393 Total GDP 650 81 368 149 194 1,442
Employment (Number of jobs)
Direct employment 4,268 426 2,890 884 987 9,455 Indirect employment 2,735 247 1,368 679 819 5,849 Induced employment 2,260 239 1,291 473 548 4,810 Total employment 9,263 912 5,549 2,036 2,354 20,114
Labour income ($ Millions)
Direct labour income 193 23 114 23 30 384 Indirect labour income 143 15 60 30 37 285 Induced labour income 88 10 46 14 18 176 Total income 424 47 221 67 86 845
Company Profit ($ Millions)
Direct profit 46 11 49 27 39 172 Indirect profit 80 8 38 22 26 173 Induced profit 74 10 49 27 37 197 Total company profit 200 30 135 76 103 543
Note: Indirect impacts are related to economic activity in industries providing goods and services to the companies directly involved in the CRE Sector. Induced impacts are generated from the expenditure of incomes generated in the direct and indirect rounds.
Source: Altus Group Economic Consulting based on Statistics Canada’s Input-Output Model
Appendix C-1
Economic Benefits of the CRE Sector in Atlantic Canada, 2011

64
Appendix C continued
New Non-Residential Site Tenant Management Brokerage Construction Development Improvement Fees Fees Total
Spending ($ Millions) 2,643 300 1,287 716 541 5,487
Gross output ($ Millions)
Direct gross output 2,643 300 1,287 716 541 5,487 Indirect gross output 2,012 250 922 592 448 4,224 Induced gross output 1,388 166 745 441 333 3,073 Total gross output 6,043 716 2,954 1,748 1,322 12,785
GDP ($ Millions)
Direct GDP 1,109 123 589 305 230 2,356 Indirect GDP 983 123 420 312 236 2,075 Induced GDP 782 90 380 232 176 1,661 Total GDP 2,874 336 1,390 849 642 6,091
Employment (Number of jobs)
Direct employment 14,356 1,211 6,921 3,437 2,599 28,524 Indirect employment 11,640 1,372 5,577 3,747 2,833 25,170 Induced employment 8,391 915 3,788 2,177 1,646 16,917 Total employment 34,388 3,499 16,286 9,360 7,079 70,612
Labour income ($ Millions)
Direct labour income 780 76 345 139 105 1,445 Indirect labour income 611 79 246 177 134 1,247 Induced labour income 365 41 157 84 64 711 Total income 1,755 196 748 401 303 3,403
Company Profit ($ Millions)
Direct profit 271 39 205 146 110 771 Indirect profit 335 40 156 117 88 736 Induced profit 356 42 204 148 112 861 Total company profit 962 120 565 410 310 2,368
Note: Indirect impacts are related to economic activity in industries providing goods and services to the companies directly involved in the CRE Sector. Induced impacts are generated from the expenditure of incomes generated in the direct and indirect rounds.
Source: Altus Group Economic Consulting based on Statistics Canada’s Input-Output Model
Appendix C-2
Economic Benefits of the CRE Sector in Quebec, 2011

65
New Non-Residential Site Tenant Management Brokerage Construction Development Improvement Fees Fees Total
Spending ($ Millions) 4,521 511 2,649 1,400 2,102 11,183
Gross output ($ Millions)
Direct gross output 4,521 511 2,649 1,400 2,102 11,183 Indirect gross output 2,636 306 1,059 981 1,472 6,454 Induced gross output 2,134 247 1,250 803 1,205 5,639 Total gross output 9,290 1,065 4,958 3,183 4,779 23,275
GDP ($ Millions)
Direct GDP 2,373 274 1,834 699 1,050 6,230 Indirect GDP 1,309 157 506 536 804 3,312 Induced GDP 1,377 158 881 465 698 3,579 Total GDP 5,059 589 3,221 1,700 2,552 13,120
Employment (Number of jobs)
Direct employment 29,331 2,807 25,476 4,697 7,052 69,363 Indirect employment 14,355 1,622 5,804 5,453 8,187 35,422 Induced employment 14,101 1,570 9,479 3,076 4,618 32,844 Total employment 57,787 6,000 40,759 13,227 19,857 137,629
Labour income ($ Millions)
Direct labour income 1,631 182 1,400 252 378 3,843 Indirect labour income 823 105 297 290 435 1,949 Induced labour income 644 75 452 144 216 1,531 Total income 3,097 363 2,149 686 1,029 7,323
Company Profit ($ Millions)
Direct profit 478 75 338 409 615 1,915 Indirect profit 443 49 184 211 316 1,203 Induced profit 539 65 295 350 526 1,775 Total company profit 1,460 189 818 970 1,456 4,893
Note: Indirect impacts are related to economic activity in industries providing goods and services to the companies directly involved in the CRE Sector. Induced impacts are generated from the expenditure of incomes generated in the direct and indirect rounds.
Source: Altus Group Economic Consulting based on Statistics Canada’s Input-Output Model
Appendix C-3
Economic Benefits of the CRE Sector in Ontario, 2011

66
Appendix C continued
New Non-Residential Site Tenant Management Brokerage Construction Development Improvement Fees Fees Total
Spending ($ Millions) 806 86 352 234 127 1,605
Gross output ($ Millions)
Direct gross output 806 86 352 234 127 1,605 Indirect gross output 614 66 223 193 104 1,200 Induced gross output 423 46 194 144 78 885 Total gross output 1,843 198 769 572 308 3,691
GDP ($ Millions)
Direct GDP 306 35 186 94 52 673 Indirect GDP 304 35 110 109 58 615 Induced GDP 228 25 111 76 42 483 Total GDP 839 94 407 279 152 1,771
Employment (Number of jobs)
Direct employment 3,577 306 2,578 513 255 7,229 Indirect employment 3,118 342 1,316 1,241 648 6,665 Induced employment 2,161 230 1,180 532 274 4,376 Total employment 8,856 878 5,074 2,285 1,176 18,270
Labour income ($ Millions)
Direct labour income 169 18 117 30 15 350 Indirect labour income 182 22 60 59 31 355 Induced labour income 92 11 47 24 12 186 Total income 442 51 225 113 59 891
Company Profit ($ Millions)
Direct profit 106 14 58 56 33 266 Indirect profit 113 11 45 44 24 237 Induced profit 128 13 58 56 32 288 Total company profit 347 39 161 156 88 791
Note: Indirect impacts are related to economic activity in industries providing goods and services to the companies directly involved in the CRE Sector. Induced impacts are generated from the expenditure of incomes generated in the direct and indirect rounds.
Source: Altus Group Economic Consulting based on Statistics Canada’s Input-Output Model
Appendix C-4
Economic Benefits of the CRE Sector in Manitoba & Saskatchewan, 2011

67
New Non-Residential Site Tenant Management Brokerage Construction Development Improvement Fees Fees Total
Spending ($ Millions) 3,109 337 1,569 457 453 5,925
Gross output ($ Millions)
Direct gross output 3,109 337 1,569 457 453 5,925 Indirect gross output 2,499 209 1,090 304 302 4,404 Induced gross output 1,672 165 897 257 255 3,245 Total gross output 7,280 710 3,556 1,019 1,010 13,574
GDP ($ Millions)
Direct GDP 1,195 184 768 244 242 2,632 Indirect GDP 1,195 100 507 174 173 2,150 Induced GDP 894 104 480 157 156 1,792 Total GDP 3,284 389 1,754 576 570 6,573
Employment (Number of jobs)
Direct employment 11,115 1,393 7,081 1,824 1,808 23,221 Indirect employment 10,855 832 4,949 1,558 1,544 19,738 Induced employment 7,092 788 3,646 1,025 1,016 13,566 Total employment 29,063 3,013 15,676 4,407 4,367 56,525
Labour income ($ Millions)
Direct labour income 875 137 555 94 93 1,753 Indirect labour income 727 61 294 96 95 1,274 Induced labour income 420 52 226 50 50 799 Total income 2,022 251 1,075 240 238 3,826
Company Profit ($ Millions)
Direct profit 293 46 205 143 142 829 Indirect profit 427 36 195 72 72 802 Induced profit 422 43 226 122 120 933 Total company profit 1,142 125 627 337 334 2,564
Note: Indirect impacts are related to economic activity in industries providing goods and services to the companies directly involved in the CRE Sector. Induced impacts are generated from the expenditure of incomes generated in the direct and indirect rounds.
Source: Altus Group Economic Consulting based on Statistics Canada’s Input-Output Model
Appendix C-5
Economic Benefits of the CRE Sector in Alberta, 2011

68
Appendix C continued
New Non-Residential Site Tenant Management Brokerage Construction Development Improvement Fees Fees Total
Spending ($ Millions) 1,673 190 559 525 78 3,026
Gross output ($ Millions)
Direct gross output 1,673 190 559 525 78 3,026 Indirect gross output 1,314 157 336 409 60 2,275 Induced gross output 891 105 302 315 47 1,659 Total gross output 3,878 452 1,197 1,249 185 6,960
GDP ($ Millions)
Direct GDP 650 72 294 237 35 1,288 Indirect GDP 662 82 167 228 34 1,172 Induced GDP 491 57 173 175 26 921 Total GDP 1,802 211 634 640 95 3,382
Employment (Number of jobs)
Direct employment 7,760 652 4,554 1,629 241 14,836 Indirect employment 7,034 842 2,090 2,403 356 12,725 Induced employment 4,775 530 2,013 1,222 181 8,721 Total employment 19,569 2,024 8,657 5,254 778 36,282
Labour income ($ Millions)
Direct labour income 397 46 183 80 12 718 Indirect labour income 417 56 99 124 18 714 Induced labour income 213 27 75 54 8 378 Total income 1,027 129 357 258 38 1,809
Company Profit ($ Millions)
Direct profit 194 21 95 139 21 469 Indirect profit 221 24 61 92 14 412 Induced profit 243 24 88 131 19 505 Total company profit 658 69 243 362 54 1,386
Note: Indirect impacts are related to economic activity in industries providing goods and services to the companies directly involved in the CRE Sector. Induced impacts are generated from the expenditure of incomes generated in the direct and indirect rounds.
Source: Altus Group Economic Consulting based on Statistics Canada’s Input-Output Model
Appendix C-6
Economic Benefits of the CRE Sector in British Columbia, 2011

69
Appendix D: Description of the Input-Output Model

70
Appendix D continued
Estimates for the economic impact of the current operations of the CRE Sector are derived through the use of Statistics Canada’s Input-Output Model of the Canadian Economy. The current model relates to the year 2008.
An input-output model is used to estimate the impacts of various types of economic activities. It is an accounting framework of an economy’s production system. It shows the interconnections that exist between the various sectors of the economy when goods and services are pro-duced. By using an input-output model, it is possible to determine which goods and services are required to achieve a certain production level in a particular industry or the economy as whole.
It is generally accepted that there are three “rounds” of impacts generated by economic activities:
• Direct round — jobs and economic activity directly related to the industry;
• Indirect round — jobs and economic activity connected to the supply chain supporting the industry; and
• Induced round — jobs and economic activity stimulated by the first two rounds.
Direct and Indirect Impacts
The model takes expenditure on a given economic activity and trans-lates it into the impacts on various industries, and then ultimately translates it into the amount of income, economic output, GDP and jobs created from that original expenditure.
A key component of an input-output model is the set of “input structures” for each economic activity covered by the model. An input structure literally splits the original expenditure among all the different inputs that are used in that economic activity. For example, building construction involves expenditures within a variety of indus-tries — wood, steel, concrete, various service industries, etc. Each of these industries has an input structure of its own that involves inputs from a variety of other industries plus labour and owners of firms in that industry.
The input structure used to account for the impact on various sectors takes into consideration the origin of the various inputs. Therefore, the model is able to segment the location of the impacts that will take place somewhere in the province and those that take place elsewhere in Canada. Imported materials and services do not pro-

71
vide an economic impact with respect to their point of origin, but will contribute to the economy in terms of value-added activity that accrues on Canadian soil, such as transportation and wholesale and retail margins.
An input-output model includes a full array of input structures that have been estimated for all industries in the economy. Use of the model in this analysis involves estimating the impacts of new build-ing construction. To generate these estimates, the values for capital investment in construction are applied to the model.
Induced Impact
Traditionally, there is thought to be an additional round of economic impact from an activity, referred to as an induced impact. This is the so‐called “Keynesian multiplier effect” resulting from the expenditure of incomes generated in the first two rounds. The wages, salaries and other income that accrue to households as a result of the direct and indirect rounds will, in turn, generate economic activ-ity as these households spend their incomes in the general economy.
Definition of Jobs Impact
Some of the findings in this report are presented in terms of “jobs” generated. This is the term used by the Input-Output Division of Statistics Canada in its estimates of employment generated. The estimate of jobs provides the number of workers that would be employed for a full‐year; however, the estimate includes both full and permanent part‐time jobs at the ratios appropriate for each of the industries involved.

72
SELECT REALpac RESEARCH
Available at www.realpac.ca > Research
REALpac Capital Flows Report, released quarterly
Property Tax Rate Analysis, released annually
REALpac/FPL Canadian Real Estate Sentiment Survey, released quarterly
2011 Canadian Institutional Commercial Mortgage Market Report
Water Management: A Benchmark for Canadian Office Buildings (2011)
Whose Carbon is it? GHG Emissions and Commercial Real Estate (2011)
2010 Energy Benchmarking Report: Performance of the Canadian Office Sector (2011)
CMBS Maturities Update (2010)
Canadian Commercial Real Estate Sustainability Performance Report, REALpac-Jantzi Sustainalytics (2010)
A Guide to Corporate Responsibility and Sustainability Reporting in the Canadian Real Property Sector (2010)
Responsible Property Investing in Canada, Factoring both Environmental and Social Impacts in the Canadian Real Estate Market (2009)
Canadian Institutional Commercial Debt Market Report (2009)
Real Estate Cycles and the Profit Shell Game (2009)
Undertaken in a sound, reasoned, and deliberative manner, our internal and
directed research activities provide compelling arguments to support our advocacy initiatives and address issues of importance to
the Canadian real property investment industry.

73
SELECT NAIOP RESEARCH FOUNDATIONFUNDED RESEARCH
Available at www.naiop.org/foundation/completedresearch.cfm
The Complexity of Urban Waterfront Redevelopment (2011)
The New Borderless Marketplace: Repositioning Retail and Warehouse Properties for Tomorrow (2011)
How Office, Industrial and Retail Development and Construction Contributed to the U.S. Economy in 2011
A Development Model for the Middle Ring Suburbs (2011)
How Fuel Costs Affect Logistics Strategies (2011)
Solar Technology Reference Guide (2011)
Trends in Global Manufacturing, Goods Movement and Consumption (2010)
Rooftop Revenue: Making Underutilized Space Profitable Through Energy Harvesting (2010)
Logistics Trends and Specific Industries That Will Drive Warehouse and Distribution Growth and Demand for Space (2010)
Assessing Key Employment Trends Driving Commercial Real Estate (2009)
Going Green: Tips, Tools & Examples from the Field (2009)
National and Metro Predictors of Commercial Real Estate Development (2009)
The New Age of Trade: The Americas (2009)
“The work of the Foundation is absolutely essential to anyone involved in
industrial, office, retail and mixed-use development. The Foundation’s projects are a blueprint for shaping the future and a road map that helps to ensure
the success of the developments where we live, work and play.”
Ronald L. Rayevich, Founding ChairmanNAIOP Research Foundation

One University Avenue, Suite 1410Toronto, ON M5J 2PI
416-642-2700www.realpac.ca
33 Yonge StreetToronto, Ontario M5E 1G4
416-641-9500 altusgroup.com
2201 Cooperative Way, 3rd FloorHerndon, VA 20171-3034
703-904-7100www.naioprf.org