Embed Size (px)
Citation preview

1
Performance Management ReportsNote: NRS Tables can be run Year-to-Date. These tables will display final results after September 30th following the program year ending June 30th. All NRS Tables with the exception of NRS Table 7 are found under the NRS Summary link.• NRS Table 1 (AENRS-TABLE1) – Participants by EFL, Ethnicity and Sex• NRS Table 2 (AENRS-TABLE2) – Participants by Age, Ethnicity and Sex• NRS Table 3 (AENRS-TABLE3) – Participants by Program Type and Age• NRS Table 4 (AENRS-TABLE4) – Measurable Skill Gains by Entry Level• NRS Table 4B (AENRS-TABLE4B) – Educational Gains and Attendance for Pre- and Post-Tested Participants• NRS Table 5 (AENRS-TABLE5) – Core Follow-Up Outcome Achievements• NRS Table 6 (AENRS-TABLE6) – Participant Status and Program Enrollment• NRS Table 7 (AENRS-TABLE7) – Personnel by Function and Job Status• NRS Table 8 (AENRS-TABLE8) – Outcomes for Adults in Family Literacy Programs• Performance Report (AEPERF)• EFL Performance Snapshot (EFLPERF)• Participant Performance Summary (PERF Summary)
Data Management Reports• Characteristic Reports
Participant Characteristics (AEPARTCHAR) Instructional Area Characteristics (AEPROGCHAR)
• Follow Up Selection Report (AEFOLSEL)• Missing Data Report (AEMDR)• Participant Post Test Listing Report (AEPOSTTEST)• Participant Active Enrollment Report (AESER)• Simple Participant Listing Report (SIMPLEPART)
Helpful Tip:Click on the report name link to be directed to that report sample page
Report Filters Usage
Revised February 2018
MAERS Report Guide

2
Return
1. When making a change to certain filters, the Update Selection Changes button will appear. Click on this button each time it displays.
2. Filter the report by class locations3. Filter the report by teachers4. Participant Population
• All Participants – zero + hours (Reports will default to All Participants)
• NRS Participants with 12 or more hours
• Participants with 1 or more hours5. Filter by Funding Sources 6. Filter by Instructional Areas7. Filter by Program Types8. Most reports will allow a display of a table
for Statewide results, Fiscal Agent results, and/or Provider results
9. Type in a description to easily identify the report
10. Click Submit. Based on statewide report usage, reports should be available within 30 minutes
Note: If no selections are made in a filter, that is the same as selecting All
Most reports can be run by various filters.
Report Filters

3
Return
A. A list of characteristics for the Adult Education population
B. An unduplicated count of participants active during the report year
C. A count of participants whose Registration is currently active
D. A count of participants who exited in the report year with an Exit Status of Completed
E. A count of participants who exited in the report year with an Exit Status of Separated Before Completion. This includes those with a System Exit.
Requirements:• Based on Participant Population filter –
o All Participants = Pre-tested in the report yearo (NRS) Participants with 12 or more hours across
program yearso Participants with 1 or more hours across program
years
Participants Characteristics

4
Return
A. A list of characteristics for the Adult Education population
B. A count of participants in the ABE instructional area
C. A count of participants in the ASE instructional area
D. A count of participants in the ESL instructional area
E. A count of participants in the HSD instructional area
F. A count of participants in the HSE instructional area
Requirements:• Based on Participant Population filter –
o All Participants = Pre-tested in the report yearo (NRS) Participants with 12 or more hours across
program yearso Participants with 1 or more hours across
program years
Instructional Area Characteristics

5
Return
Scheduling/ Viewing Recommendation - Monthly
Scheduling / Viewing recommendations -Monthly
1. Follow Up Status defaults to ‘In Progress’ – This will only display participants still needing follow up. The report can also be run by changing the Follow Up Status to ‘Completed’ or ‘All’. ‘Completed’ will display participants whose follow up is completed. ‘All’ will display participants in the outcome measure regardless of attained status.
2. SSN - A ‘Yes’ is displayed for participant’s with a SSN. A ‘No’ will display if the participant does not have a SSN. If a ‘No’ displays, a manual Follow Up Survey is required for any employment measure. A quarterly data match will be done for participants with a SSN for employment measures. Manual surveys are required for participants without a SSN in an employment measure or for any of the educational measures regardless of a SSN.
3. Exit Year – Program Year in which the participant exited Note: Most outcome measures will take place one to two years after exit
4. Match Attempts - ‘N/A’ will display for all educational measures and for employment measures without a SSN. Up to 8 Data Match attempts will take place. 5. Data Source – Displays the source completing the follow up. This field will always be blank unless the report is run using the Follow Up Status of
‘Completed’ or ‘All’. a. Data Match – Follow Up was completed through the data match processb. User ID – A Manual Survey was completed
6. Column visibility/Excel/PDF – Filtering and export options7. Clicking on the name link will navigate to the Participant’s Follow Up screen
Requirements:• 12 or more attendance hours across program years• Program Exit
Follow Up Selection Report

6
Return
1. A link will display where there is missing data Click on the link to navigate directly to the screen needing the data
2. Click on the Participant Name link to navigate to the registration screen
Scheduling/Viewing Recommendation - Monthly
Requirement:• Active registration during the Report Program Year
Missing Data Report

7
Return
1. A Participant can have up to two Pre and Post-Tests per year; One in the ABE/ASE Instructional Area and one in the ESL Instructional Area. A participant will be listed twice if they have a pre-test in both instructional areas.
2. Registration Date: Displays the participants registration date3. PRE Test: Displays the type of Pre-Test that was entered into MAERS4. PRE Test Date: Displays the date of the Pre-Test5. Cumulative Attendance Hours: Displays the total hours for the Participant in that specific
Instructional Area6. Eligible to POST test: Displays a Yes or No indicating if the Participant has enough cumulative
attendance hours to Post-Test. This is determined by the Pre-Test type.7. POST Test Date: If a Post-Test was already entered into the MAERS, the date will display8. Clicking on the name link will navigate to the appropriate Participant screen
Scheduling/Viewing Recommendation -Monthly
Requirement:• Pre-Test in the Report
Program year
Participant Post Test Listing

8
Return
1. Registration Date: Displays the participant’s registration date2. Exit Date: A Program Exit date will display if the Participant has been exited from the program3. Assessments: Both Pre and Post-Test information will display
Beginning EFL, ending EFL, and if an educational gain or loss resulted Hours Between Tests indicates how many attendance hours have been entered since the Pre-Test date Clicking on the Assessment link will navigate to the Assessment History screen
Note: If no assessment is entered, this row will not display4. Achievements: A list of all possible Measurable Skill Gains and 107 Performance Measures will display
A Yes will display if an achievement was attained Clicking on the Achievements link will navigate to the Achievement History screen
5. Outcome Measures: A list of all possible Outcome Measures will display A Yes or No will display if the follow up has been completed An N/A will display if the participant doesn’t require follow up on a specific Outcome Measure Clicking on the Outcome Measures link will navigate to the Enter/Update Follow Up screen
Note: If the participant is still active, the Outcome Measures row will not display6. Clicking on the name link will navigate to the Participant’s Registration screen
Scheduling/Viewing Recommendation –As Needed
Requirement: • Active registration
during the Report Program Year
Participant Active Enrollment

9
Return
1. Registration Date: Displays the Participant’s registration date2. Exit Date: A Program Exit date will display if the Participant has been exited from the programNote: ‘System Exit’ will display if the Participant had no services for 90 days. The System Exit can be reversed and the record can then be updated as needed.3. Clicking on the name link will navigate to the Participant’s Registration screen4. If a Participant is displaying twice, check the Registration and Exit dates to determine if less than
180 days has passed between services. If it has, the MAERS helpdesk can delete the later registration and the first registration can be updated with a planned gap to continue on the first registration.
Scheduling/Viewing Recommendation - Monthly
Requirement:• Active Registration during the Report Program Year
Simple Participant Listing

10
Return
A. Beginning Educational Functioning LevelB. – O. Self reported ethnicity found from the ALPP. Total number of participants within the beginning EFLClicking on a number link will provide a list of participants within that row/columnNotes:• If a Participant self-reports being ‘Hispanic or Latino’ and another race, the Participant will only be
counted in the ‘Hispanic or Latino’ column. These participants will not count in any of the other race columns.
• If a Participant self-reports belonging to two race groups and also reports ‘Hispanic or Latino’ as ‘No’, they will only be counted in the Two or more Races column. Example – A male participant self-reports being Asian and White. The Participant will count in Column N.
Requirements:• 12 or more attendance
hours across program years
NRS Table 1 – Participants by EFL, Ethnicity and Sex

11
Return
A. Age of participant at the beginning of the Report YearB. – O. Self reported ethnicity found from the ALPP. Total number of participants within the Age GroupClicking on a number link will provide a list of participants within that row/columnNotes:• If a Participant self-reports being ‘Hispanic or Latino’ and another race, the Participant will
only be counted in the ‘Hispanic or Latino’ column. These participants will not count in any of the other race columns.
• If a Participant self-reports belonging to two race groups and also reports ‘Hispanic or Latino’ as ‘No’, they will only be counted in the Two or more Races column. Example – A male participant self-reports being Asian and White. The Participant will count in Column N.
Requirements:• 12 or more
attendance hours across program years
NRS Table 2 – Participants by Age, Ethnicity and Sex

12
Return
A. Program Type is determined by beginning Educational Functional Level (EFL) from the Pre-Test
Adult Basic Education counts participants with beginning EFLs 1-4 from the ABE/ASE pre-test
Adult Secondary Education counts participants with beginning EFLs 5 and 6 from the ABE/ASE pre-test
English-as-a-Second Language counts participants with beginning EFLs 1-6 from the ESL pre-test
Notes:• Integrated Education and Training Program under each Program Type is a subset of Participants
within that Program who have the IET completed on the Eligibility screen• If IELCE funding is selected for a Participant, they will be counted under Integrated English Literacy
and Civics Education instead of English Language Acquisition
B. – G. Counts use the participants age at registrationH. Total number of participants by Program Type
Clicking on a number link will provide a list of participants within that row/column
Requirements:• 12 or more
attendance hours across program years
NRS Table 3 – Participants by Program Type and Age

13
Return
A. Beginning Educational Functioning Level B. Total number of Participant’s enrolled with 12 or more attendance hours Note: Excludes those who separated due to a global exclusionary reasonC. Total attendance hours for the participants in the EFLNote: Total Attendance Hours will count hours for every Period of Participation within the Report YearD. Number of participants making an EFL gain through one of the three types of Measurable Skill GainsE. Number of participants who attained a secondary school diploma or equivalentNote: A participant will not count in both D and E. The count will display in whichever was earned last between an EFL Gain and a Secondary Credential.F. Number of participants who have program exited without making a Measurable Skill GainG. Number of active participants who did not achieve a Measurable Skill GainNote: Columns D+E+F+G = Column BH. Percentage of participants achieving a Measurable Skill Gain (Column D + E/Column B)I. Total number of registrations with 12+ hours (Participant’s may have more than one registration in the year with 12+ hours) Note: Column I will be equal or higher than Column BJ. Other registrations with 12+ hours that achieved a Measurable Skill GainK. Percentage of other registrations with 12+ hours achieving a Measurable Skill Gain (Column J/Column I)Clicking on a number link will provide a list of participants within that row/column
Requirements:• 12 or more attendance
hours across program years
NRS Table 4 – Measurable Skill Gains by Entry LevelNote: NRS Table 4C is identical to NRS Table 4 however it will only provide a count for Distance Learning Participants

14
Return
A. Beginning Educational Functioning LevelB. Total number of Participant’s enrolled with 12 or more attendance hours Note: Excludes those who separated due to a global exclusionary reasonC. Total attendance hours for the participants in the EFLNote: Total Attendance Hours will count hours for every Period of Participation within the Report YearD. Number of participants making an EFL gain between the pre and post-test E. Number of participants who have exited without making an EFL Gain (no post-test or post-tested with no gain)F. Number of active participants who did not make an EFL Gain (no post-test or post-tested with no gain)Note: Columns D+E+F = Column BG. Percentage of participants achieving an EFL Gain between the pre and post-test (Column D/Column B)
Clicking on a number link will provide a list of participants within that row/column
Requirements:• 12 or more
attendance hours across program years
• Post-Test in the Report Program Year
NRS Table 4B – Educational Gains and Attendance for Pre- and Post-tested Participants

15
Return
A. Outcome MeasuresNote: Most Outcome Measures are on those who exited in a previous program yearB. Total number of participants who exited with 12+ attendance hoursNote: Excludes those who were still incarcerated at exit or separated due to a global exclusionary reasonC. Number of participants achieving the Outcome MeasureD. Percentage of participants achieving the Outcome Measure (Column C/Column B)E. Total number of exited registrations with 12+ hours Note: Column E will be equal or higher than Column BF. Additional exited registrations with 12+ hours achieving the Outcome MeasureG. Percentage of additional exited registrations with 12+ hours achieving the Outcome Measure (Column F/Column E)
Median Earnings Second Quarter after exit row – Employment Second Quarter after exit Column B will match Median Earnings Second Quarter after exit column B. Column C will the be the Median Earning Value of those who achieved the Employment Second Quarter after exit.
Clicking on a number link will provide a list of participants within that row/column
Requirements:• 12 or more
attendance hours across program years
• Program Exit
NRS Table 5 – Core Follow Up Outcome AchievementNote: NRS Table 5A is identical to NRS Table 5 however it will only provide a count for Distance Learning Participants

16
Return
1. Status at Entry Characteristics2. Program Types in the report year3. Number of unduplicated participants with the characteristic
Clicking on a number link will provide a list of participants within that row/column
Requirements:• 12 or more
attendance hours across program years
NRS Table 6 – Participant Status and Program Registration
17
Return
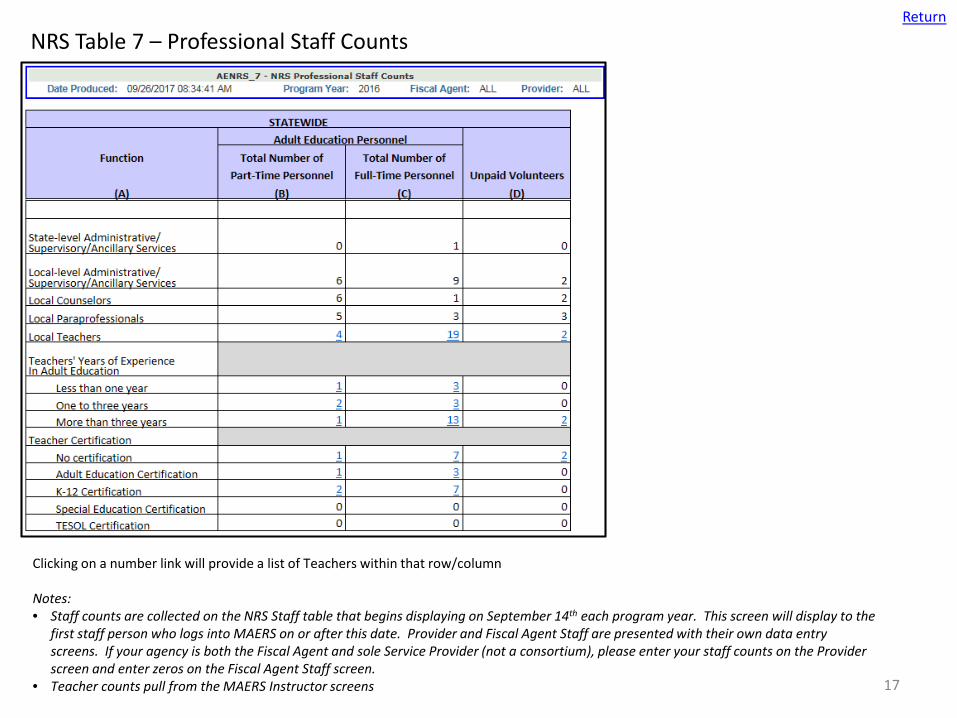
Clicking on a number link will provide a list of Teachers within that row/column
Notes:• Staff counts are collected on the NRS Staff table that begins displaying on September 14th each program year. This screen will display to the
first staff person who logs into MAERS on or after this date. Provider and Fiscal Agent Staff are presented with their own data entry screens. If your agency is both the Fiscal Agent and sole Service Provider (not a consortium), please enter your staff counts on the Provider screen and enter zeros on the Fiscal Agent Staff screen.
• Teacher counts pull from the MAERS Instructor screens
NRS Table 7 – Professional Staff Counts

18
Return
A1. Measurable Skill Gain row – Achievements of a Measurable Skill Gain in the report yearOutcome Measures rows – Attainments of Outcome Measures Note: Most Outcome Measures are on those who exited in a previous program year
B1. Measurable Skill Gain row – Total number of Family Literacy participants enrolled with 12+ attendance hours for both active and exited in report yearOutcome Measures rows – Total number of Family Literacy participants who exited with 12+ attendance hoursNote: Excludes those who were still incarcerated at exit or separated due to a global exclusionary reason
C1. Measurable Skill Gain row – Number of Family Literacy participants who made a Measurable Skill GainOutcome Measures rows – Number of Family Literacy participants achieving the Outcome Measure
D1. Percentage of Family Literacy participants achieving a Measurable Skill Gain/Outcome MeasureE1. Total number of Family Literacy registrations with 12+ hoursF1. Other registrations with 12+ hours achieving a Measurable Skill Gain/Outcome MeasureG1. Percentage of other registrations with 12+ hours achieving a Measureable Skill Gain/Outcome MeasureA2. Family Literacy additional Outcome MeasuresB2. Total number of Family Literacy participants who exited during the report yearC2. Number of those achieving one or more of the additional Family Literacy Outcome MeasuresD2. Percentage of Family Literacy participants achieving the additional Family Literacy Outcome Measures
Requirements:• Participants with the Family Literacy
program type selected in the Report Program Year
• 12 or more attendance hours across program years
• Program Exited for the Outcome Measure rows and the Secondary Outcomes
NRS Table 8 – Outcomes for Adults in Family Literacy Programs

19
Return
A. Measurable Skill Gain row – Achievements of a Measurable Skill Gain in the report yearOutcome Measures rows – Attainments of Outcome Measures Note: Most Outcome Measures are on those who exited in a previous program year
B. Measurable Skill Gain row – Total number of Correctional Education participants enrolled with 12+ hours for both active and exited in report yearOutcome Measures rows – Total number of Correctional Education participants who exited with 12+ attendance hoursNote: Excludes those who were still incarcerated at exit or separated due to a global exclusionary reason
C. Measurable Skill Gain row – Number of Correctional Education participants who made a Measurable Skill GainOutcome Measures rows – Number of Correctional Education participants achieving the Outcome Measure
D. Percentage of Correctional Education participants achieving a Measurable Skill Gain/Outcome MeasureE. Total number of Correctional Education registrations with 12+ hoursF. Other registrations with 12+ hours achieving a Measurable Skill Gain/Outcome MeasureG. Percentage of other registrations with 12+ hours achieving a Measureable Skill Gain/Outcome Measure
Clicking on a number link will provide a list of participants within that row/column
Requirements:• Participants with a
Correctional program type selected in the Report Program Year
• 12 or more attendance hours across program years
• Program Exited for the Outcome Measure Rows only
NRS Table 10 – Outcomes for Adults in Correctional Education Programs

20
Return
1. A Fiscal Agent table will display if the filter is requested. If the report is run by the Provider, as in the above screen shot, the report will list every Fiscal Agent who funded the Provider.
2. A Provider table will display if the filter is requested. If the report is run by a Fiscal Agent, the report will list every Provider funded by the Fiscal Agent.3. Total number of active registrations during the report yearNote: If a participant funded by multiple Fiscal Agents, they will be in each Fiscal Agent count4. Counts of ABE/ASE assessments, class enrollments, pre to post-test EFL gains and average attendance hours5. Counts of ESL assessments, class enrollments, pre to post-test EFL gains and average attendance hoursNote: If a participant is in both the ABE/ASE and ESL instructional areas, the participant will be counted in all applicable columns6. Total ABE/ASE and ESL assessment counts7. Computed post-test rateNotes: • Michigan has a 65% post-test rate requirement
Clicking on a number link will provide a list of participants within that row/column
Scheduling/Viewing Recommendation –Monthly beginning January 1st
Requirements:• Active in the
Report Program Year
Performance Report

21
Return
1. Beginning Educational Functioning Level2. Count of Participants in the beginning EFL3. Count of participants who have post-tested with a gain, post-tested with no gain, have enough hours with no post-test and does not have enough
hours to post-test4. Count of those who post-tested (Group 1+Group 2)5. Post-test rate percentage (Total Post-tested/Number Entering Level)6. Total participants achieving a Measurable Skill Gain7. Measurable Skill Gain rate percentage (Number that Completed an MSG/Number Entering Level)8. State negotiated MSG targets9. Above or below the State negotiated target10. Total number of participants needed to meet the target11. The report can be run with a graph or click on the Show Graph link to view the graph in a different window
Clicking on a number link will provide a list of participants within that row/column
Scheduling/Viewing Recommendation - Monthly
Requirement:• A Pre-Test in the Report Program
Year
**This report can be run with additional filters by emailing the MAERS helpdesk
EFL Performance Snapshot

22
Return
A. All performance types, i.e. Outcome Measures, WIOA reported Measurable Skill Gains, and State Section 107 PerformanceB. Specific performance measuresC. Count of participants in the measureD. Count of participants not attaining the measureE. Count of participants attaining the measureF. Percent of participants attaining the measure (Column E/Column C)G. State negotiated targetsH. Above or below the State negotiated targets
Clicking on a number link will provide a list of participants within that row/column
Scheduling/Viewing Recommendation - Monthly
Requirement:• Measurable Skill Gains and
State Measures – Active in the report year
• Outcome Measures – 12 or more hours across program years and exited
**This report can be run with additional filters by emailing the MAERS helpdesk
Participant Performance Summary