Embed Size (px)
Citation preview

Rafael FloresSenior Vice President &Chief Nuclear Officerrafael.flores @ luminantcom
Lumeauld
Luminant PowerP 0 Box 10026322 North FM 56Glen Rose, TX 76043
T 254.897.5590F 254.897.6652C 817.559.0403
CP-201000861Log # TXNB-10046
Ref.# 10CFR52
June 24, 2010
U. S. Nuclear Regulatory CommissionDocument Control DeskWashington, DC 20555ATTN: David B. Matthews, Director
Division of New Reactor Licensing
SUBJECT: COMANCHE PEAK NUCLEAR POWER PLANT, UNITS 3 AND 4DOCKET NUMBERS 52-034 AND 52-035RESPONSE TO REQUEST FOR ADDITIONAL INFORMATION NO. 4619 AND 4638
Dear Sir:
Luminant Generation Company LLC (Luminant) submits herein the response to Request for AdditionalInformation (RAI) No. 4619 and 4638 for the Combined License Application for Comanche PeakNuclear Power Plant Units 3 and 4. Both RAIs involve the probabilistic risk assessment.
Should you have any questions regarding these responses, please contact Don Woodlan (254-897-6887,[email protected]) or me.
There are no commitments in this letter.
I state under penalty of perjury that the foregoing is true and correct.
Executed on June 24, 2010.
Sincerely,
Luminant Generation Company LLC
Rafael Flores
Attachments: 1. Response to Request for Additional Information No. 4619 (CP RAI # 165)
2. Response to Request for Additional Information No. 4638 (CP RAI # 166)DOT0

U. S. Nuclear Regulatory CommissionCP-201000861TXNB-100466/24/2010Page 2 of 2
Electronic distribution w/attachments:
[email protected]@[email protected]@[email protected]@[email protected]@[email protected]@[email protected]@[email protected]@[email protected]@[email protected]@[email protected]@[email protected]@luminant.comNuBuild Licensing files
[email protected]@)[email protected]@mnes-us.comrussell [email protected]@[email protected]@[email protected]@[email protected]@[email protected]@[email protected]@[email protected]'[email protected]@[email protected]@[email protected]@[email protected]@[email protected]@[email protected]@[email protected]@[email protected] Records Management (.pdf files only)

U. S. Nuclear Regulatory CommissionCP-201000861TXNB-100466/24/2010
Attachment 1
Response to Request for Additional Information No. 4619 (CP RAI #165)

U. S. Nuclear Regulatory CommissionCP-201000861TXNB-100466/24/2010Attachment 1Page 1 of 16
RESPONSE TO REQUEST FOR ADDITIONAL INFORMATION
Comanche Peak, Units 3 and 4
Luminant Generation Company LLC
Docket Nos. 52-034 and 52-035
RAI NO.: 4619 (CP RAI #165)
SRP SECTION: 19 - Probabilistic Risk Assessment and Severe Accident Evaluation
QUESTIONS for PRA and Severe Accidents Branch (SPRA)
DATE OF RAI ISSUE: 5/19/2010
QUESTION NO.: 19-9
The NRC staff needs the following additional information or clarification related to your response to RAIQuestion 19-1 (RAI Number 26), dated September 22, 2009:
(1) Include in the Combined License (COL) FSAR a brief discussion of the rationale provided in theresponse for not considering other initiating events beyond loss of offsite power (LOOP) orcombined effects.
(2) The modified Table 19.1-203, included in your September 22, 2009 RAI response, shows threescenarios while the discussion of this table on page 19.1-7 of the COL FSAR states that "tornadoinduced accident scenarios were categorized into four scenarios." Please clarify.
(3) The scenario "loss of offsite power (LOOP) with loss of alternate component cooling water (CCW)induced by tornadoes of enhanced F-scale intensity F1 and F2" has been added in the revisedTable 19.1-203. This scenario should be also discussed on page 19.1-7 of the COL FSAR wherethe other two dominant tornado scenarios are discussed.
(4) A description of the scenario "tornado strike induced loss of offsite power (LOOP) and turbinebuilding (T/B) damage combined with failure of four emergency gas turbine generators" isprovided on page 19.1-7 of the COL FSAR. This description should be revised to include theenhanced F-scale intensity range of a tornado strike that would induce the described scenario.
(5) The third scenario listed in the revised Table 19.1-203 of the COL FSAR appears to associate theenhanced F-scale intensity F5 range with wind speeds above 230 mph. This information is inconflict with information provided in Table 19.1-201 of the FSAR where the enhanced F-scaleintensity F5 range is shown as associated with wind speeds between 200 mph and 230 mph.Please clarify.

U. S. Nuclear Regulatory CommissionCP-201000861TXNB-100466/24/2010Attachment 1Page 2 of 16
ANSWER:
(1) A brief discussion of the rationale has been added to FSAR Subsection 19.1.5.
(2) There was a typographical error in the mark-up file of the response to RAI Question 19-1. Thedescription "tornado induced accident scenarios were categorized into three scenarios" is correctand was reflected on FSAR Revision 1 page 19.1-8.
(3) A description of the LOOP plus loss of CCW accident scenario has been added to FSARSubsection 19.1.5.
(4) The description of the LOOP plus T/B damage accident scenario in FSAR Subsection 19.1.5 hasbeen revised.
(5) FSAR Table 19.1-201 has been revised to clarify that the category for the tornado intensity ofwind speed exceeding 230 mph is also F5.
Impact on R-COLA
See attached marked-up FSAR Revision 1 pages 19.1-8 and 19.1-13
Impact on S-COLA
None.
Impact on DCD
None.

Comanche Peak Nuclear Power Plant, Units 3 & 4COL Application
Part 2, FSAR
- Alternative ac power supply system (this is a mitigation system forLOOP events, which is initiating event potentially caused by atornado strike)
LOOP is the most severe initiating event for tornado strikes with enhancedF-scale intensity of F3 or greater and dominates the plant risk profile.LOOP event is applied to the tornado PRA as the most limiting case.
Based on the results of the plant vulnerability analysis and the discussionabove, tornado-induced accident scenarios were categorized into threescenarios as shown in Table 19.1-203. The frequency of each scenarioderived from the hazard fragility analysis of the T/B is also shown.
RCOL2_19-9
I RCOL2_19-9
Quantification
For the tornado induced accident scenarios, the CDF was calculatedbased on the internal event PRA results. The dominant core damagescenarios were the following:
- Enhanced F-scale intensity F1 and F2 tornado strike-induced LOOPand plant switchyard damaged combined with failure of all four CCWor ESW pumps.
The plant switchyard is assumed to be damaged by the tornado strike ofenhanced F-scale intensity F1 and F2. A LOOP occurs and COW or ESWpumps fail to re-start due to common cause failure. Since there is nofunction to cool reactor coolant pump (RCP). RCP seal loss-of-coolantaccident (LOCA) occurs, which results in the core damage. The CDF forthis scenario is 2.1 E-08/RY.
- Tornado ctrikc indlucdEnhanced F-scale intensity of F3, F4 and F5tornado strike-induced LOOP and T/B damage combined with failureof all four emergency gas turbine generators.
The plant switchyard and the T/B are assumed to be damaged by thetornado strike with wind speed between 136 mph and 230 mph. A LOOPoccurs and the emergency gas turbine generators fail to operate due tocommon cause failure. The alternative power source is unavailable sincethe T/B is damaged and total loss of ac power occurs. Offsite powercannot be recovered due to damage of the T/B. Rcactor cGoGlat PUMP(IR'D) seal locs of GGoGoat acident (LOGA)RCP seal LOCA occurs andeventually the core is damaged. The CDF for this scenario is 2.2E-08/RY.
- Failure of all safety systems by a beyond design basis tornado. Thisevent leads directly to core damage. This CDF for this scenario is2.5E-08/RY.
RCOL2_19-9
RCOL2_19-9
RCOL2_19-9
19.1-8 Re91-s8eieR-4

CP COL 19.3(4)
Comanche Peak Nuclear Power Plant, Units 3 & 4COL Application
Part 2, FSAR
Table 19.1-201
Tornado Strike and Exceedance Frequency for the ComanchePeak Site
Enhanced StrikeF-Scale Wind Strike ExceedanceTornado Speed Frequency FrequencyIntensity (mph) Description (/yr) (/yr)
FO 65-85 Light Damage 1.3E-04 2.8E-04
F1 86-110 Moderate Damage 1.OE-04 1.5E-04
ConsiderableF2 111-135 Damage 3.7E-05 5.1E-05
F3 136-165 Severe Damage 1.2E-05 1.4E-05
DevastatingF4 166-200 Damage 2.1 E-06 2.4E-06
F5 200-230 Incredible Damage 2.0E-07 2.3E-07
Beyond DesignF5 230> Base 2.5E-08 2.5E-08 RCOL2_19-9
19.1-13 Rensien 4

U. S. Nuclear Regulatory CommissionCP-201000861TXNB-100466/24/2010Attachment IPage 5 of 16
RESPONSE TO REQUEST FOR ADDITIONAL INFORMATION
Comanche Peak, Units 3 and 4
Luminant Generation Company LLC
Docket Nos. 52-034 and 52-035
RAI NO.: 4619 (CP RAI #165)
SRP SECTION: 19 - Probabilistic Risk Assessment and Severe Accident Evaluation
QUESTIONS for PRA and Severe Accidents Branch (SPRA)
DATE OF RAI ISSUE: 5/19/2010
QUESTION NO.: 19-10
Please provide the following additional information or clarification related to your response to RAIQuestion 19-2 (RAI Number 26), dated September 22, 2009:
(1) The following statement is made in the response: "For Comanche Peak Units 3 and 4, a value of 1 E-7for the annual frequency of occurrence is used as a more conservative quantitative screeningcriterion. If the criterion of lxi 06 per year CDF were used, the results would be a lower risk to plantwhen compared to using the lx10-7 annual frequency of occurrence criterion." Please clarify why thecriterion of 1 x, 06 per year CDF results in a lower risk to the plant than the lxi 0-7 annual frequency ofoccurrence criterion.
(2) It is stated in the response that a qualitative screening of external events has been performed, in* accordance with the five qualitative criteria provided in ANSI/ANS-58.21-2007 supporting technicalrequirement EXT-R1, and a quantitative screening of those external events that could not beeliminated by the qualitative screening was performed. However, the staff believes that the underlyingrationale of the ANSI/ANS-58.21-2007 qualitative criteria (which apply mainly to operating reactors)need to be examined when these criteria are applied to new reactor designs. An external event "withequal or less damage potential than a design basis event" can be a significant contributor to the coredamage frequency (CDF) of a new reactor because of the features of new light water reactors designswhich contribute to the lower risk of such reactors from internal events as compared to operatingreactors. For example, while an external event that contributes just below lxi 06 per year to the CDFof an operating reactor can be screened out from the quantitative analysis, this may not be the casefor a new reactor where the CDF from all other sources can be the same order of magnitude or evensmaller. Therefore, the five qualitative criteria provided in ANSI/ANS-58.21-2007 should becomplemented by appropriate qualitative or quantitative arguments (e.g., the frequency of theanalyzed design basis flooding event is smaller than lx10- per year, the explosion occurs far from theplant and it is physically impossible to impact it) to show that each eliminated external event is indeedan insignificant contributor to the total CDF of the new reactor. Such qualitative or quantitativearguments can be discussed in Table 19.1-205 of Revision 1 of the COL FSAR where the use of thequalitative screening criteria to eliminate external events from further analysis is documented. For

U. S. Nuclear Regulatory CommissionCP-201000861TXNB-100466/24/2010Attachment IPage 6 of 16
example, justification or clarification is needed for several statements made or conclusions reached inTable 19.1-205 of Revision 1 of the CPNPP Units 3 and 4 COL FSAR, such as the following:
(a) It is stated that the maximum flood elevation at CPNPP Units 3 and 4 is 793.46 ft msl and thiselevation provides more than 28 feet of freeboard under the worst potential flood considerations. Itis further stated that the maximum flood elevation is the sum of the maximum flood level thatresults from a probable maximum precipitation (PMP) on the Squaw Creek watershed (788.9 ft)and the maximum coincident wind waves (4.56 ft). These statements do not provide anyindication regarding the magnitude of the frequency of the calculated maximum flood elevation orany information' about the assumptions used in the calculation (e.g., it is not clear why the PMP isassociated with "the worst potential flood considerations"). Qualitative or quantitative argumentsare needed, in conjunction with the evaluation of plant design bases, to show that externalflooding is indeed an insignificant contributor to the total ODF (i.e., the frequency of a floodingevent that would reach the safety-related plant elevation is less than 10.7 per year orits contribution to ODE' is a small fraction of the total CDF from all initiating events).
(b) Please clarify the description of probable maximum flood (PMF) in Table 19.1-205 of Revision 1 ofthe CPNPP Units 3 and 4 COL FSAR. It is stated that the PMF and maximum coincident windwave activity results in a flood elevation of 809.28 ft msl and the top elevation of the retaining wallis 805 ft msl. What is the location of the flood elevation of 809.28 ft msl and that of the retainingwall? Qualitative or quantitative arguments are needed, in conjunction with the evaluation of plantdesign bases, to show that the probable maximum flood is indeed an insignificant contributor tothe total ODF from all initiating events.
(c) The following statements are made: "There are no surface water impoundments other than smallfarm ponds that could impact the [Squaw Creek Reservoir] SCR," "Failure of downstream dams,including Squaw Creek Dam, would not affect the CPNPP Units 3 and 4," and "The critical damfailure event is the assumed domino-type failure of the Hubbard Creek Dam, the Morris SheppardDam and the De Cordova Bend Dam coincident with the PMF." It is not clear how thesestatements are used to conclude that "[t]here are no safety-related structures that could beaffected by flooding due to dam failures." Please clarify the description of dam failures in Table19.1-205 of Revision 1 of the CPNPP Units 3 and 4 FSAR. In addition, qualitative or quantitativearguments are needed, in conjunction with the evaluation of plant design bases, to show that adam failure event is indeed an insignificant contributor to the total CDF from all initiating events.
(d) It is stated that there is no threat from brush or forest fires because "... the nuclear island issituated sufficiently clear of trees and brush. The distance exceeds the minimum fuel modificationarea requirements of 30 ft, per NFPA-1 144." However, brush and forest fires have been known tojump fairly wide "fire lines." In addition, it is conceivable that a large fire burning only 30 feet fromthe nuclear island on a hot summer day could effectively raise the local air temperature above the"maximum safety" temperature listed in Table 2.0-1 R of the FSAR. Qualitative and/or quantitativearguments are needed, in conjunction with the evaluation of plant design bases, to show that anexternal fire event is indeed an insignificant contributor to the total ODF from all initiating events.Also, a commitment to assure that requirements assumed in the screening analysis, if any, will bemet after the plant is built needs to be established (e.g., NFPA-1 144 requirements). Pleasediscuss.
(e) For aircraft hazards it is stated: "The probability of aircraft-related accidents for CPNPP Units 3and 4 is less than an order of magnitude of 10- per year for aircraft, airway, and airportinformation reflected in Subsection 2.2.2.7." Please clarify this statement and justify theapplicability of the ANSI/ANS-58.21-2007 qualitative criterion number 2 (i.e., an aircraft hazardsevent has a significantly lower frequency and no worse consequences than another event thatwas analyzed).

U. S. Nuclear Regulatory CommissionCP-201000861TXNB-100466/24/2010Attachment 1Page 7 of 16
(f) For turbine missiles it is stated: "The probability of turbine failure resulting in the ejection ofturbine rotor (or internal structure) fragments through the turbine casing, P1, as less than 10-5per year. The acceptable risk rate P4 = P1xP2xP3 is therefore maintained as less than 10-7 peryear." Please clarify this statement, define P2 and P3, and justify the applicability of theANSI/ANS-58.21-2007 qualitative criteria 2 and 3 to a turbine missile event.
ANSWER:
(1) A screening criteria of 1x, 06 per year results in a lower risk to the plant than the 1x, 0-7
annual frequency of occurrence screening criteria because the higher screening value (lxi 06 peryear) screens out more events (those between 10-6 and 107). When fewer events areconsidered, the risk will be reduced. A value of lx 10-7 for the annual frequency of occurrence isused as a quantitative screening criterion for CPNPP Units 3 and 4. If the screening criterion oflx106 per year ODF or annual frequency of occurrence were used, the events lower than thesescreening criteria would be eliminated and would not be taken into account in the quantitativerisk. Therefore, the lower criterion of lx 0,7 for the annual frequency of occurrence is used.
(2) External event preliminary screening criteria defined in ANSI/ANS-58.21-2007 are universalscreening criteria without regard for plant types. Therefore, the preliminary screening criteria areapplicable for CPNPP Units 3 and 4. This is because each screening criteria has the followingcharacteristics:
" Lower damage potential than a design basis event
Safety-related SSCs are contained in seismic category I structures. Those SSCs aredesigned to prevent significant impact from design basis hazards. Therefore, those eventsthat have a lower damage potential than a design basis event would not cause significantevents or degradation in safety-related systems. Those events are covered in the internalevents PRA or in design analysis.
" Lower event frequency of occurrence than another event
The events that have similar impact on the plant would result in similar accident sequences.Therefore, those events are represented by one event scenario. If the frequency of anevent has a lower magnitude than another event, the contribution to risk from the event withthe higher frequency envelopes the contribution from event with lowers frequency.
" Cannot occur close enough to the plant to have an affect
The event that cannot affect the plant does not need to be taken into consideration.
" Included in the definition of another eventAn event that is included in another event definition does not need to be taken intoconsideration.
Sufficient time to eliminate the source of the threat or to provide an adequate responseIf there is sufficient time during an event to eliminate the source of the threat or to providean adequate response and the event has very low risk compared to other events, the eventcan be screened out.
US-APWR is an advanced LWR with enhanced safety. The plant risk such as core damagefrequencies are one order of magnitude lower than conventional LWRs. Therefore, the lower
U. S. Nuclear Regulatory CommissionCP-201000861TXNB-100466/24/2010Attachment 1Page 8 of 16
value of 10-7 per year is applied for a quantitative screening criterion. Additionally, the qualitativescreening criteria noted above are applicable for advanced plants because those qualitativecriteria assure, no hazardous potential exist or the effect of hazards have lower damage potentialthan enhanced design basis.
Additional discussions of the basis for qualitative or quantitative screening in response to parts(2)(a) to (f) are provided below. FSAR Table 19.1-205 has been revised to reflect this response.
(a) The PMP distributions used as input for determining the Probable Maximum Flood (PMF) forthe CPNPP Units 3 and 4 were developed using Hydrometerological Report (HMR) 51 andHMR 52.
The PMP distributions were calculated for the following scenarios:
* Overall PMP for storm centers within the Squaw Creek watershed* Overall PMP for storm centers within the Paluxy River watershed" Squaw Creek Reservoir PMP for storm centers within the Squaw Creek watershed.
The critical storm center within the Paluxy River watershed (Basin 4) results in the maximumPMP for the overall watershed (Basins 1, 2, 3 and 4 combined) at the confluence of PaluxyRiver and Squaw Creek. Additionally, when the storm center was kept in the Squaw Creekwatershed (Basin 1), it resulted in a higher PMP for the Squaw Creek watershed. A higherPMP for the Squaw Creek watershed can result in a higher water surface elevation at CPNPPUnits 3 and 4. The PMP for the critical storm center for each basin in the scenarios above wasanalyzed individually to determine the resulting peak runoff and the water surface elevation.
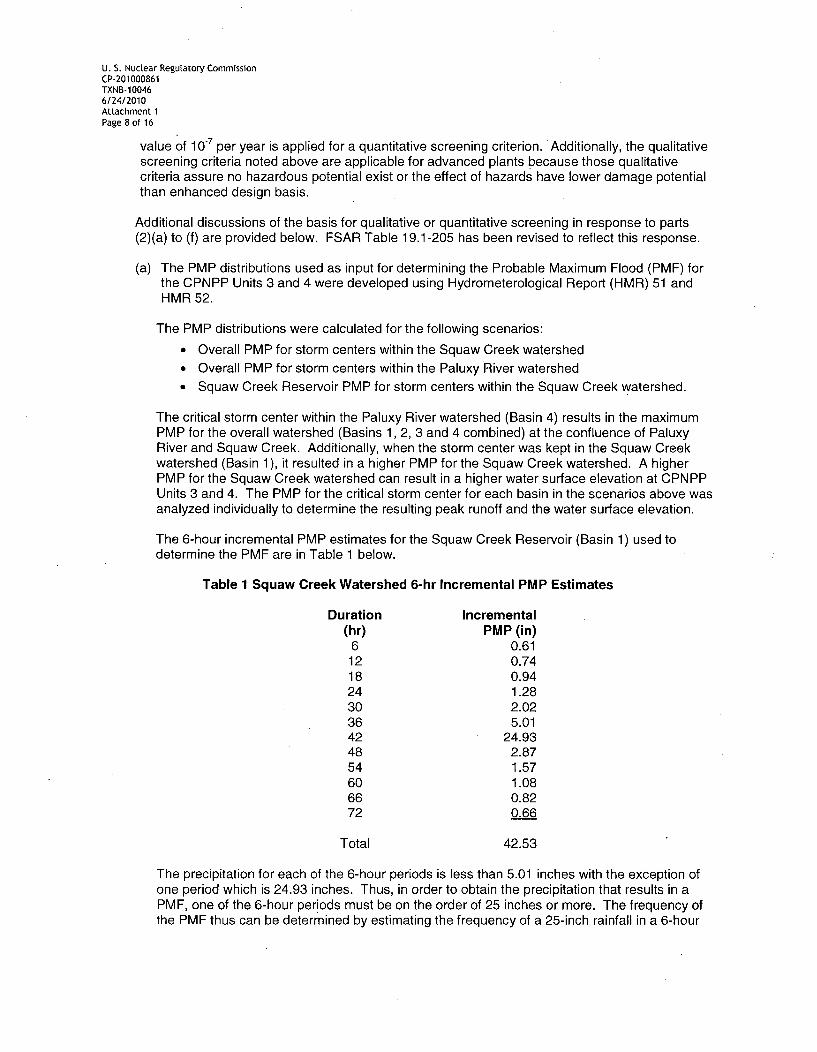
The 6-hour incremental PMP estimates for the Squaw Creek Reservoir (Basin 1) used todetermine the PMF are in Table 1 below.
Table 1 Squaw Creek Watershed 6-hr Incremental PMP Estimates
Duration Incremental(hr) PMP (in)
6 0.6112 0.7418 0.9424 1.2830 2.0236 5.0142 24.9348 2.8754 1.5760 1.0866 0.8272 0.66
Total 42.53
The precipitation for each of the 6-hour periods is less than 5.01 inches with the exception ofone period which is 24.93 inches. Thus, in order to obtain the precipitation that results in aPMF, one of the 6-hour periods must be on the order of 25 inches or more. The frequency ofthe PMF thus can be determined by estimating the frequency of a 25-inch rainfall in a 6-hour

U. S. Nuclear Regulatory CommissionCP-201000861TXNB-100466/24/2010Attachment 1Page 9 of 16
period. Such an estimate would be conservative because there must be additional rainfall invery close time frames to obtain the total precipitation that result in a PMF.
Reference 1 lists extreme rainfall events worldwide for the time period of about 1819 to about19491, a period of 130 years. This source documents several extreme rainfall events in theU.S. that could have included a 6-hour 25-inch rainfall. Reference 2, which includes datathrough 1996 (an additional 47 years), identifies events in addition to those included inReference 1. Table 2 is a listing of the events from both sources.
Table 2 U.S. Extreme Rainfall Events (6 to 24 hr Duration)
Location Date Duration Rainfall (in) Source(hr)
Smethport, PA 7/18/1942 4.5 30.8+ Ref 1Smethport, PA 7/17-18/1942 15 34.5 Ref 1Thrall, TX 9/9/1921 18 36.5 Ref 1Smethport, PA 7/18/1942* 3 28.50 estimated Ref 2Smethport, PA 7/18/1942* 4.5 30.70 Ref 2Smethport, PA 7/18/1942* 12 34.30 Ref 2Thrall, TX 9/9/1921 18 36.40 Ref 2Alvin, TX 7/25-26/1979 24 43.00 Ref 2
The two sources agree for most of the events with the following exceptions. The Smethport,PA event, which occurred on 7/17-18/1942, is recorded as two events in Reference 1 andthree events in Reference 2. According to Reference 3, this was actually a single event thatlasted 18 hours with a total rainfall of 34.3 inches. There was one 6-hour period where 30.7inches fell. Therefore, the Smethport rainfall will be treated as one event. The only otherdifference between the two sources is the inclusion of the Alvin, TX event. This eventextended 24 hours with a total rainfall of 43 inches. It is assumed that it includes one 6-hourperiod with at least 25 inches of rainfall. The Thrall, TX event lasted for 18 hours with 36.4inches of rainfall. It is also assumed that this event included one 6-hour period with 25 inchesof rainfall. Therefore, based on this data, there are three events which potentially had or didhave 25 inches of rainfall or greater in a 6-hour period during the data period of 177 years. Itis also assumed that these three events affected at least 10-sq-mi areas.
The three locations for the rainfall events considered in the estimation of PMF frequency(Smethport, PA, Thrall, TX and Alvin, TX) are superimposed on Figure 18 from Reference 4(below). This figure includes isopleths for various PMPs. The isopleth for 25-inch rainfallpasses near Smethport and includes both Thrall and Alvin. The area enclosed by this 25-inchcontour is the area of the U.S. that could experience extreme rainfall events equal to or greaterthan the three events identified above.
Figure 18 shows that there are many states that are completely included in the PMP area.Note that there are two bands of shading from the original map, a north-south band on thewest of the PMP region, and a southwest-northeast band along the Appalachian Mountainsthat indicate areas not included in the PMP calculations. Portions of states that are not totallyenclosed in the PMP area are indicated with dark shading. The cross-hatched areas are partof the PMP area but are not included in the calculation of total PMP area to compensate forthe two areas (shaded and dark shaded) discussed above. It can be seen that the shaded and
1 The earliest event in the Ref. 1 data is in 1819; it is likely that the record goes back farther than that. The
manuscript was received for publication in Dec 1949, so it likely includes data up to about 1949; e.g., an event in1947 is identified in the paper.

U. S. Nuclear Regulatory CommissionCP-201000861TXNB-100466/24/2010Attachment 1Page 10 of 16
cross-hatched areas approximately balance. Table 3 provides the areas of the included statestaken from the U.S. Census Bureau's QuickFacts (Ref. 5).
Table 3 Land Area of States in PMP Area
State
Rhode IslandConnecticutNew JerseyDelawareMarylandPennsylvaniaOhioIndianaIllinoisMissouriKansasVirginiaWest VirginiaKentuckyOklahomaArkansasTennesseeNorth CarolinaSouth CarolinaGeorgiaFloridaAlabamaMississippiLouisianaTexas
Land Area(sq-mi)
1,0454,8457,4171,9549,774
44,81740,94835,86755,58468,88681,81539,59424,07839,72868,66752,06841,21748,71130,10957,90653,92750,74446,90743,562
261,797
Total 1,211,967

U. S. Nuclear Regulatory CommissionCP-201000861TXNB-100466/24/2010Attachment 1Page 11 of 16
Figure 18 !. -Aseason PMP (in.) ýfor. 6 hr 10 mi2 (6In.
With the above information, the frequency of a 6-hour 25-inch PMP at any given point can becalculated. The overall frequency of a 6-hour, 25-inch PMP event for the U.S. is determinedby dividing the number of events by the duration of the historical record. The areal frequencyof a PMP event is calculated by dividing the U.S. PMP frequency by this total area over whicha PMP could occur and multiplying this amount by the area of a PMP, 10 sq-mi. Thus thePMP frequency is:
( No. of PMP Events Apmp EventfPMP ( Duration of Historical Record ATotalPMPRegion
(3 IC OMi2 i.177yrs •1,211,967mi2)
= 1.4xlO- 7 / yr
Therefore, the frequency of a PMP of 25 inches over 10 square miles is estimated to be1.4x10 7 per year. This is a conservative estimate of the frequency of the PMP that results in aPMF for CNNPP Units 3 and 4 because additional periods of significant rainfall must alsooccur in close temporal proximity to the 25-inch 6-hour rainfall event. Given the calculatedPMF is not projected to reach the safety-related elevation of the plant and the estimated PMPand PMF frequency of 1.4xl 0 7/year, the frequency of a flooding event that would reach thesafety-related elevation of the plant is projected to be well below 107 per year.

U. S. Nuclear Regulatory CommissionCP-201000861TXNB-100466/24/2010Attachment 1Page 12 of 16
(b) The PMF elevation has been revised due to RAI No. 4310 (CP RAI #143) Question02.04.03-5, the response for which has not been submitted to the NRC yet. The revised PMFelevation is 793.66 ft. This elevation represents the maximum still water elevation of SquawCreek Reservoir during the PMF. The coincident wind wave activity has also been reviseddue to RAI 143 Question 02.04.03-11. The revised PMF with coincident wind wave activityrunup elevation is 810.64 ft. The site grading plan has been revised and the top of theretaining wall is now at elevation 795 ft. The revised PMF with coincident wind wave activityelevation exceeds the top elevation of the retaining wall.
The retaining wall is located approximately 555 ft. northeast from the center point of CPNPPUnit 3 on the slopes of the Squaw Creek Reservoir. Above the retaining wall, a 2:1 (horizontalto vertical) slope continues up to elevation 820 ft. The coincident wind wave activity analysisresult is based on the runup on a continuous vertical wall. Comparative analysis for runup onadjacent slopes concludes it is conservative to assume that runup above the top elevation ofthe retaining wall rises vertically, because runup evaluated for the 2:1 slope would result in alower elevation. It is assumed that the PMF with coincident wind wave activity elevation of810.64 ft is applicable to the entire rim of the Squaw Creek Reservoir.
As indicated in the response to (2)(a) above, the estimated frequency of a PMF capable ofreaching the plant grade elevation is estimated to be less than 10-7 per year. Consideration ofthe maximum coincident wind wave activity along with the PMF would tend to lower the overallfrequency.
(c) The dam failure analysis has been revised due to RAI No. 4311 (CP RAI #140) Questions02.04.04-5 and -7, the response for which has not been submitted to the NRC yet. Therevised qualitative analysis considers both existing and future conditions and is performedbased on comparison of distance from the confluence of the Paluxy River with the BrazosRiver, reservoir storage, dam height, and drainage area. Domino-type failures andsimultaneous failures are postulated when applicable. The qualitative analysis resulted in twopotential scenarios that were evaluated further by quantitative analysis.
The quantitative analysis results in the critical dam failure event of the assumed domino-typefailure of Fort Phantom Hill Dam, the proposed Cedar Ridge Reservoir, Morris Sheppard Dam,and De Cordova Bend Dam. In addition, Lake Stamford Dam is assumed to fail simultaneouswith the Cedar Ridge Reservoir Dam. Dam failures are assumed coincident with the PMF.The resulting water surface elevation at the confluence of the Paluxy River and the BrazosRiver is 760.71 ft. CPNPP Units 3 and 4 safety-related facilities are located at elevation 822 ft.There are no safety-related facilities that could be affected by flooding due to dam failures.
As noted above, this analysis is based on dam failures coincident with the PMF; therefore, thefrequency of the event is estimated to be less than 10-7 per year.
(d) The guidance in NFPA 1144 identifies that buildings located closer than 9.14 m (30 ft) to avegetated slope shall require special mitigation measures as determined by the authorityhaving jurisdiction. The 30-ft distance is the minimum distance which should be cleared ofvegetation in order to prevent continued propagation of a wildfire. Regarding CDF, theCPNPP Units 3 and 4 reactor buildings will be well in excess of this minimum distance fromany concentrated vegetation. The entire site will be surrounded by a perimeter security fencewhich will employ an isolation zone of a minimum 20 feet. This isolation zone will be void ofany vegetation and will have a layer of crushed stone. The perimeter fence is positioned adistance away from the power block which well exceeds the minimum 30 feet as described inNFPA 1144.

U. S. Nuclear Regulatory CommissionCP-201000861TXNB-100466/24/2010Attachment 1Page 13 of 16
The area between the perimeter fence and the plant makes up the Protected Area. This areawill not have a concentration of vegetation that will maintain a flame front or propagate awildfire. The combination of the isolation zone (20 ft) and the Protected Area distancebetween the isolation zone and the power block will provide a sufficient separation from anyforest or grassland that may be in the vicinity of CPNPP Units 3 and 4.
The area outside the perimeter fence is identified as the Owner Controlled Area (OCA). Thisarea is where vegetation may be present. Luminant will procedurally maintain the NFPA 1144minimum setback distance in the OCA. Also, the OCA adjacent to the isolation zone will becleared of any concentration of vegetation for security reasons as well.
Therefore, based on the CPNPP Units 3 and 4 site configurations, the protected area distancefrom the perimeter fence to the power block, the security isolation zone of 20 feet and thesetback distance in accordance with the guidance in NFPA 1144 of minimum 30 feet, aminimum total distance in excess of 100 ft will be obtained. This distance is significantlygreater that the NFPA 1144 requirements. Therefore, a wildfire in the vicinity of the site willnot continue to propagate onto the Protected Area. Furthermore, this combined distance willensure that the power block will not experience temperatures from a wildfire that would affectthe CDF established in the PRA. Due the significant distance from concentrated vegetationthat can fuel wild fires, and the fact that wild fires cannot occur frequently because the eventitself will eliminate concentrated vegetation, qualitative screening criteria Criterion 3 can beapplied. Table 19.1-205 has been revised to provide the commitment to procedurally maintainthe NFPA 1144 setback distance in the OCA.
(e) The description in Table 19.1-205 for aircraft hazards has been revised to provide a briefsummary of the screening analysis performed in FSAR Subsection 3.5.1.6. The analysis ofFSAR Subsection 3.5.1.6 demonstrates that to maintain the probability of an aircraft crashinginto the plant below lxI0-7 per year, the estimated annual number of aircraft operations mustbe less than 19,300. FSAR Subsection 2.2.2.7 states only one military training route, Victorair route VR-158, passes within 10 mi of the OPNPP site, and it only has "300-400 annualsorties or aircraft deployments."
Thus the probability of aircraft-related hazards is less than 107 per year, and criterion 2 of theANSI/ANS-58.21-2007 screening criteria can be applied.
/
(f) The definition of P2 and P3 can be found in the DOD Revision 2 Subsection 3.5.1.3.2, whichstates,
The probability of unacceptable damage resulting from turbine missiles, P4,is expressed as the product of (a) the probability of turbine failure resulting inthe ejection of turbine rotor (or internal structure) fragments through theturbine casing, P1; (b) the probability of ejected missiles perforatingintervening barriers and striking safety-related SS~s, P2 and (c) theprobability of struck SS~s failing to perform their safety function, P3.
The justification for applying ANSI/ANS-58.21-2007 qualitative criterion 2 is found in FSAR
Revision 1 Subsection 3.5.1.3.2, which states,
Mathematically, P4 = P1 x P2x P3, where RG 1.1 15 considers anacceptable risk rate for P4 as less than 10- per year. For unfavorablyoriented T/Gs determined in Subsection 3.5.1.3, the product of P2 and P3 isestimated as 10-2 per year, which is a more conservative estimate than for afavorably oriented single unit. OPNPP Units 3 and 4 procedures will beimplemented 6 months prior to delivery of the T/G to require inspection

U. S. Nuclear Regulatory CommissionCP-201000861TXNB-100466/24/2010Attachment IPage 14 of 16
intervals established in Technical Report, MUAP-07028-NP, "Probability ofMissile Generation From Low Pressure Turbines", and to require a turbinevalve test frequency per Technical Report, MUAP-07029-NP, "ProbabilisticEvaluation of Turbine Valve Test Frequency", and other actions to maintainP1 within acceptable limits as outlined in NUREG-0800 Subsection 3.5.1.3,Table 3.5.1.3-1. These inspection intervals maintain the probability of turbinefailure resulting in the ejection of turbine rotor (or internal structure)fragments through the turbine casing, P1, as less than I0s per year. Theacceptable risk rate P4 = P1 x P2 x P3 is therefore maintained as less than10.7 per year.
The justification for applying ANSI/ANS-58.21-2007 qualitative criterion 3 is found in FSAR
Revision 1 Subsection 3.5.1.3,1 which states,
The CPNPP site plan (Figure 1.2-1 R) reflects the placement of CPNPPUnits 3 and 4 in relation to existing Units 1 and 2. The location of CPNPPUnits 3 and 4 is such that CPNPP Units 1 and 2 are outside the low-trajectory turbine missile strike zone inclined at 25 degrees to the turbine,and therefore no postulated low-trajectory turbine missiles affect CPNPPUnits 1 and 2. Similarly, no postulated low trajectory turbine missiles fromCPNPP Units 1 and 2 will affect CPNPP Units 3 and 4. The placement ofCPNPP Units 3 and 4, however, does generate an unfavorable orientation,as defined in NUREG-0800, Section 3.5.1, of the turbine generator (T/G) inrelationship with safety-related SSCs of the adjacent US-APWR Unit.
Therefore, through site layout criterion 3 is applied to screen CPNPP's existing and new unitsfrom producing a turbine missile that could affect the other units. Also, through the use ofoperational programs the probability of a turbine missile being created at CPNPP Units 3 or 4that affect safety-related SSCs is maintained below 10,7 per year and criterion 2 is applied.
References
1. Jennings, A. H., "World's Greatest Observed Point Rainfall," Monthly Weather Review, vol. 78,pp. 4-5, 1950. Available online at http://docs.lib.noaa..ov/rescue/mwr/078/mwr-078-01-0004.pdf.
2. "USA Record Point Precipitation Measurements," Hydrometeorological Design Studies Center,NOAA's National Weather Service Website. Available online athttp://www.nws.noaa.gov/oh/hdsc/record precip/record precip us.html.
3. Burt, Christopher C., and Mark Stroud, "Extreme Weather: A Guide and Record Book-ClimateChange Edition," W. W. Norton & Company, New York, NY, 2007.
4. Schreiner, L. C., and J. T. Riedel, "Probable Maximum Precipitation Estimates, United StatesEast of the 105th Meridian," Hydrometeorological Report No. 51, National Weather Service,Office of Hydrology, Hydrometeorological Branch, June 1978. (Published by U.S. CommerceDepartment, National Oceanic and Atmospheric Administration, and U.S. Department of theArmy, Corps of Engineers.) Available online athttp://www.weather.gov/oh/hdsc/PMP documents/HMR51.pdf.
5. U.S. Census Bureau, State & County QuickFacts. Available online athttp://quickfacts.census.qov/qfd/.
Impact on R-COLA
See marked-up FSAR Revision 1 page 19.1-51. See also Table 19.1-205 included in the response toRAI No. 4638 (CP RAI #166) Question 19-13 found in Attachment 2 of this letter.

U. S. Nuclear Regulatory CommissionCP-201000861TXNB-100466/24/2010Attachment 1Page 15 of 16
Impact on S-COLA
None.
Impact on DCD
None.

Comanche Peak Nuclear Power Plant, Units 3 & 4COL Application
Part 2, FSAR
CP COL 19.3(4) Table 19.1-206
Site-specific Key AssumptionsKey Insights and Assumptions DispositionSite-Specific Design Features and Assumptions
Design features and assumptions that contribute to high reliabilityof continuous operation after the 24 hour mission time are thefollowings.- The normal makeup water to the UHS inventory is from Lake
Granbury via the circulating water system.
- UHS transfer pumps and the ESW pumps located in each basinare powered by the different Class 1 E buses. UHS transferpump operates to permit the use of three of the four basin water
volumes.
- The transfer line is a high integrity line, regularly tested and
inspected for corrosion.
- There are adequate low-level and high-level alarms to providerapid control room annunciation of a level problem and to allow
adeguate time to confirm the level and take effective action toaddress it.
- Two basins contain enough water to supply water to remove
decay heat for at least 24 hours after plant trip.
Overfill protection will be provided to prevent overfilling the basinand failing the pump(s). This feature is important to preventdegradation of the ESWS when the basin is overfilled due to failurein the transfer pump or circulation system.
Backup actions can avoid excessive room heat up in the event ofloss of ESW room ventilation. Based on this assumption, loss ofESW room ventilation is not modeled in the PRA model.Operational procedures to avoid excessive room heat up will beprepared.
Plant specific SSCs that potentially impact plant safety areseismically designed and thus will not impact the plant HCLPF.HCLPF values for the plant specific SSCs, such as cooling towers,will be confirmed with calculation using EPRI TR-103959methodology after completion of seismic design and stress analysisof the SSCs.
NFPA 1144 minimum setback distance in the Owner ControlledArea will be procedurally maintained. Also, the Owner Controlled
FSAR 9.2.5.2.2
FSAR 9.2.5.2.2, 9.2.5.3
FSAR 9.2.1.2.1, 9.2.5.4
FSAR 9.2.5.5
FSAR 9.2.5
FSAR 13.5
Prepare operationalprocedures to monitor thewater level of basin atmain control room.
FSAR 13.5
Prepare operationalprocedures to monitor thewater level of basin atmain control room.
FSAR 19.1.2.4FSAR 19.1.5.1
DCD Tier 1 ITAAC #24
FSAR 9.5NFPA 1144 minimumsetback distance will beprocedurally maintained
RCOL2_19-11
RCOL2_19-11
RCOL2_19-11
RCOL2_19-10
Area adiacent to the isolation zone will be cleared of anyconcentration of vegetation for security reasons.
19.1-51 Reviswen4

U. S. Nuclear Regulatory CommissionCP-201000861TXNB-100466/24/2010
Attachment 2
Response to Request for Additional Information No. 4638 (CP RAI #166)

U. S. Nuclear Regulatory CommissionCP-201000861TXNB-100466/24/2010Attachment 2Page I of 40
RESPONSE TO REQUEST FOR ADDITIONAL INFORMATION
Comanche Peak, Units 3 and 4
Luminant Generation Company LLC
Docket Nos. 52-034 and 52-035
RAI NO.: 4638 (CP RAI #166)
SRP SECTION: 19 - Probabilistic Risk Assessment and Severe Accident Evaluation
QUESTIONS for PRA and Severe Accidents Branch (SPRA)
DATE OF RAI ISSUE: 5/20/2010
QUESTION NO.: 19-11
The staff requests the following additional information or clarification related to Luminant's response toRAI Number 28 (3214), Question 19-5, dated September 24, 2009:
(1) Luminant, in its response dated September 24, 2009, submitted a revision to Table 19.1-206 of theCombined License (COL) FSAR. The last three site-specific key insights and assumptions listed inTable 19.1-206 of the CPNPP Units 3 and 4 COL FSAR (i.e., overfill protection, backup actions toavoid excessive room heat up in the event of loss of essential service water (ESW) room ventilation,and plant high confidence of low probability of failure (HCLPF) values of structure, system, andcomponents (SSCs)) require action by the COL licensee. As such, the reference to these specificCOL licensee actions is requested to be shown in the disposition column of Table 19.1-206.
(2) The following statement is made in Part 3 of the response and in the last item of Table 19.1-206:"Plant-specific SSCs that potentially impact plant safety are seismically designed and will not impactthe plant high confidence of low probability of failure (HCLPF)." This statement does not addressthe staff's question regarding any changes to the seismic margins analysis results, assumptions andinsights (documented in the referenced US-APWR DCD) that result from site specific designchanges. The PRA-based seismic margins analysis has additional objectives beyond estimatingthe plant's HCLPF value, such as the identification of dominant seismic sequences and associatedmajor contributors (see Section 19.1.5.1.2 of the US-APWR DCD).
ANSWER:
(1) FSAR Table 19.1-206 has been revised to include the COL action item information for the lastthree site-specific key insights and assumptions.
(2) The site-specific SSE for CPNPP Units 3 and 4 is less than the 0.3g SSE for US-APWR standarddesign. Therefore the seismic analysis of US-APWR standard design is applicable for CPNPPUnits 3 and 4.

U. S. Nuclear Regulatory CommissionCP-201000861TXNB-100466/24/2010Attachment 2Page 2 of 40
At the design certification phase, specific design data such as material properties, analysisresults, qualification test information, etc. were not available. Therefore, generic fragility datawere used for the component fragilities of US-APWR standard design components. The genericdata used for US-APWR were based on the fragilities provided by the Electric Power ResearchInstitute (EPRI) Utility Requirements Document. A conservative HCLPF value of 0.5g wasassumed for components for which generic data were not available or not appropriate, includingthe ESWS. Seismic fragilities of standard design structures were developed using themethodology in EPRI TR-1 03959.
The PRA related SSCs are generally designed to have adequate margin to both the DCDcondition and CPNPP Units 3 and 4 site-specific conditions because the site-specific SSE is lessthan the 0.3g SSE for US-APWR standard design. Therefore, the results and insights of SMA inthe DOD are applicable to CPNPP Units 3 and 4.
The site-specific seismic margin analysis using the design specific in-structure response and theresults of stress analysis will be performed as part of the design ITAAC #24 to confirm that theHCLPF values meets the SMA criteria (no less than 1.67 times SSE). This will include CPNPPUnits 3 and 4 site-specific PRA related SSCs such as UHRSR.
FSAR Subsection 19.1.5.1 .1 has been revised to specify the SSE of CPNPP Units 3 and 4.
Impact on R-COLA
See attached marked-up FSAR Revision 1 pages 19.1-10 and 19.1-51.
Impact on S-COLA
None.
Impact on DCD
None.

Comanche Peak Nuclear Power Plant, Units 3 & 4COL Application
Part 2, FSAR
19.1.5.1.1 Descriptions of the Seismic Risk Evaluation RCOL2_19-11
Replace the last sentence of the first paragraph after the first bullet "Selection ofreview level earthquake" in DCD Subsection 19.1.5.1.1 page 19.1-63 with thefollowing.
The seismic margin analysis of the DOD is incorporated by reference although theRLE of CPNPP is less than the DCD RLE of 0.5g, which is 1.67 times the SSE(0.3g).
19.1.5.1.2 Results from the Seismic Risk Evaluation RCOL2_19-1
1
Add a paragraph after the last paragraph in DOD Subsection 19.1.5.1.2 page19.1-73 with the following.
The plant-specific HCLPFs of CPNPP Units 3 and 4 that are not less than 1.67times SSE will be confirmed using the design specific in-structure response andthe results of the stress analysis of the US-APWR standard design.
19.1.5.2.2 Results from the Internal Fires Risk Evaluation
cP COL 19.3(4) Add the following text at the beginning of DCD Subsection 19.1.5.2.2.
The only site-specific design that has potential effect on internal fires risk is thesite-specific UHS.
Four-train separation is maintained in the site-specific UHS design. Modeling ofthe site-specific UHS shows a small effect on the reliability of CCWS for internalfire events. As was the case with the results of the Level 1 PRA for operations atpower (Subsection 19.1.4.1.2), it has been determined that consideration of thesite-specific UHS would have no discernible effect on the fire PRA results that arebased on the standard US-APWR design. Therefore, the results described beloware considered sufficient and applicable.
19.1.5.3.2 Results from the Internal Flooding Risk Evaluation
CP COL 19.3(4) Add the following text at the beginning of DCD Subsection 19.1.5.3.2.
The only site-specific design that has potential effect on internal flooding risk is thesite-specific UHS.
19.1-10 19.-10Reymsie4

Comanche Peak Nuclear Power Plant, Units 3 & 4COL Application
Part 2, FSAR
CP COL 19.3(4) Table 19.1-206
Site-specific Key AssumptionsKey Insights and Assumptions Disposition
Site-Specific Design Features and Assumptions
Design features and assumptions that contribute to high reliabilityof continuous operation after the 24 hour mission time are the
followings.- The normal makeup water to the UHS inventory is from Lake
Granbury via the circulating water system.
- UHS transfer pumps and the ESW pumps located in each basinare powered by the different Class 1 E buses. UHS transferpump operates to permit the use of three of the four basin watervolumes.
- The transfer line is a high integrity line, regularly tested andinspected for corrosion.
- There are adequate low-level and high-level alarms to providerapid control room annunciation of a level problem and to allowadeguate time to confirm the level and take effective action toaddress it.
- Two basins contain enough water to supply water to removedecay heat for at least 24 hours after plant trip.
Overfill protection will be provided to prevent overfilling the basinand failing the pump(s). This feature is important to preventdegradation of the ESWS when the basin is overfilled due to failurein the transfer pump or circulation system.
Backup actions can avoid excessive room heat up in the event ofloss of ESW room ventilation. Based on this assumption, loss ofESW room ventilation is not modeled in the PRA model.Operational procedures to avoid excessive room heat up will beprepared.
Plant specific SSCs that potentially impact plant safety areseismically designed and thus will not impact the plant HCLPF.HCLPF values for the plant specific SSCs, such as cooling towers,will be confirmed with calculation using EPRI TR-103959methodology after completion of seismic design and stress analysisof the SSCs.
NFPA 1144 minimum setback distance in the Owner ControlledArea will be procedurally maintained. Also, the Owner ControlledArea adiacent to the isolation zone will be cleared of anyconcentration of vegetation for security reasons.
FSAR 9.2.5.2.2
FSAR 9.2.5.2.2, 9.2.5.3
FSAR 9.2.1.2.1, 9.2.5.4
FSAR 9.2.5.5
FSAR 9.2.5
FSAR 13.5Preoare operationalprocedures to monitor thewater level of basin atmain control room.
FSAR 13.5Preoare operationalprocedures to monitor thewater level of basin atmain control room.
FSAR 19.1.2.4FSAR 19.1.5.1
DCD Tier 1 ITAAC #24
FSAR 9.5NFPA 1144 minimumsetback distance will beprocedurally maintained
RCOL2_19-11
RCOL2_19-11
RCOL2_19-11
RCOL2_19-10
19.1-51 Revosien4

U. S. Nuclear ReguLatory CommissionCP-201000861TXNB-100466/24/2010Attachment 2Page 5 of 40
RESPONSE TO REQUEST FOR ADDITIONAL INFORMATION
Comanche Peak, Units 3 and 4
Luminant Generation Company LLC
Docket Nos. 52-034 and 52-035
RAI NO.: 4638 (CP RAI #166)
SRP SECTION: 19 - Probabilistic Risk Assessment and Severe Accident Evaluation
QUESTIONS for PRA and Severe Accidents Branch (SPRA)
DATE OF RAI ISSUE: 5/20/2010
QUESTION NO.: 19-12
The staff requests the following additional information or clarification related to Luminant's response toRAI Number 28 (3214), Question 19-6, dated September 24, 2009:
(1) Assumptions and important design features regarding the plant-specific essential service watersystem (ESWS) and ultimate heat sink (UHS) are listed in Section 19.1.4.1.2 (page 19.1-3) andTable 19.1-206 of Revision 1 of the CPNPP Unit 3 and 4 COL FSAR and Luminant's response tothe RAI dated September 24, 2009. One assumption states: "Should the plant trip, the basins canbe effective in removing decay heat more than 24 hours." This assumption needs to be clarified tostate that two basins are effective in removing decay heat for more than 24 hours withoutreplenishment or transferring water from another basin.
(2) It is stated in item (3) of the response: "The PRA considers that the assumption related to theeffectivity of basins for the 24 hours can also be applied under the maximum ambient temperatureof CPNPP site described in FSAR Chapter 2." Please provide the basis for this statement. Is thedesign basis calculation based on the maximum ambient temperature for the CPNPP site describedin FSAR Chapter 2?
ANSWER:
(1) The UHS design assumption in FSAR Subsection 19.1.4.1.2 has been revised.
(2) The maximum ambient temperature assumed in this statement is the wet-bulb temperature of 83 °Fbased on 0% annual exceedance as described in FSAR Chapter 2. The calculation that supports thisstatement is described in the response to RAI No. 3762 (CP RAI #121) Question 09.02.05-5(ML093520667).
Impact on R-COLA
See attached marked-up FSAR Revision 1 page 19.1-3.

U. S. Nuclear Regulatory CommissionCP-201000861TXNB-100466/24/2010Attachment 2Page 6 of 40
Impact on S-COLA
None.
Impact on DCD
None.

Comanche Peak Nuclear Power Plant, Units 3 & 4COL Application
Part 2, FSAR
Adoption of CTWs to the UHS for the ESWS raises an additional failure mode forthe ESWS, which is the failure of CTW fans. Failure of the CTW fans would causedegradation of heat release from the ESWS to the atmosphere, which wouldresult increase of the ESWS temperature in the faulted train. Failure of both fansin a single CTW train is considered a potential failure mode of the ESWS.
Failures of CTW fans were modeled in ESWS fault tree to address the effect ofsite-specific UHS. The reliability of ESWS affects both the initiating eventfrequency of loss of CCW and the reliability of ESWS after the initiating event.Therefore, the initiating event frequency given, later in this subsection based onthe US-APWR design was re-quantified based on the site-specific ESWS designsalong with re-quantification of post-initiating event ESWS reliability.
Assumptions and important design features regarding the UHS and ESWS are asfollows:
A drain line is provided as an overfill protection from overfilling the basinand failing the pump(s).
There are adequate low-level and high-level alarms to provide rapidcontrol room annunciation of a level problem and to allow adequate time toconfirm the level and take effective action to address it.
On failure of the fans during normal plant operation, operating status ofeach fan is indicated in the main control room (MCR).
Should the plant trip, the basiRn .an be effectiy" in rFmoving de.a'. heat RCOL2_19-1
marc than 24 ho-rc.two basins are effective in removing decay heat for 2
more than 24 hours without replenishment or transferring water fromanother basin.
The transfer line is a high integrity line, regularly tested and inspected forcorrosion.
* Failure of the transfer line will not drain any CTW basin.
* The basin water is tested regularly and maintained in a condition topreclude corrosion and organic material from plugging strainers.
Ventilation of the ESWP room is reliable not to significantly degrade theunavailability of ESWP.
The internal event core damage frequency (CDF) was found to be numerically thesame as reported later in this subsection with an actual increase in the CDF dueto the site-specific designs of less than 1 percent. The initiating event frequencyfor loss of component cooling water (CCW), as reported later in this subsection inTables 19.1-2 and 19.1-20, increases from 2.3E-05/reactor-year (RY) to2.4E-05/RY due to the site-specific ESWS designs. The effect of the site-specificESWS designs'on the internal CDF is very small. Therefore, any discrepancy ofcutsets, and dominant sequences from that documented for the standardUS-APWR design is considered negligible. Changes in importance are the basicevents related to the site-specific design shown in Table 19.1-204. The results
19.1-3 19.1-3 Re eR

U. S. Nuclear Regulatory CommissionCP-201000861TXNB-100466/24/2010Attachment 2Page 8 of 40
RESPONSE TO REQUEST FOR ADDITIONAL INFORMATION
Comanche Peak, Units 3 and 4
Luminant Generation Company LLC
Docket Nos. 52-034 and 52-035
RAI NO.: 4638 (CP RAI #166)
SRP SECTION: 19 - Probabilistic Risk Assessment and Severe Accident Evaluation
QUESTIONS for PRA and Severe Accidents Branch (SPRA)
DATE OF RAI ISSUE: 5/20/2010
QUESTION NO.: 19-13
The staff requests the following additional information or clarification related to Luminant's response toRAI Number 28 (3214), Question 19-7, dated September 24, 2009:
(1) It is stated in the response that a qualitative screening of external events has been performed, inaccordance with the five qualitative criteria provided in ANSI/ANS-58.21-2007 supporting technicalrequirement EXT-B1, and a quantitative screening of those external events that could not beeliminated by the qualitative screening was performed. As stated in the staff's follow-up RAI relatedto the response to RAI Question 19-2, the staff believes that the underlying rationale of theANSI/ANS-58.21-2007 qualitative criteria (which apply mainly to operating reactors) needs to beexamined when these criteria are applied to new reactor designs. The five qualitative criteriaprovided in ANSI/ANS-58.21-2007 should be complemented by appropriate qualitative orquantitative arguments to show that each eliminated external event is indeed an insignificantcontributor to the total CDF of the new reactor. Such qualitative or quantitative arguments can bediscussed in Table 19.1-205 of Revision 1 of the COL FSAR, where the use of the qualitativescreening criteria to eliminate external events from further analysis is documented.
(2) It is stated that Table 19.7-1, of Luminant's response, dated September 24, 2009, does not involveexternal hazards, such as seismic, "because [they] are already described in DCD chapter 19.1.5using seismic margin method or PRA method." However, the analysis of the seismic eventsdescribed in DCD chapter 19.1.5 does not address seismically-induced accidents beyond the plantitself, such as flooding due to failure of upstream dams or release of hazardous materials due to thecollapse of nearby industrial, transportation and military facilities. Please discuss.
(3) For hurricanes it is stated: "The Probable Maximum Hurricane (PMH) for the CPNPP site, the PMHsustained (10-minute average) wind speed at 30 ft above ground is 81 mph." Based on thisstatement hurricanes are screened out from the quantitative analysis since all structures aredesigned to withstand winds up to 90 mph. The staff believes that this event cannot be screenedout without considering the frequency of hurricanes that reach the CPNPP site with wind speedabove 90 mph. For example, a hurricane event that strikes the CPNPP site with wind speed above

U. S. Nuclear Regulatory CommissionCP-201000861TXNB-100466/24/2010Attachment 2Page 9 of 40
90 mph once every 100 years is more risk significant than tornadoes of enhanced F-scale intensityF1 since it causes the same plant failures with a significantly higher frequency.
(4) For extreme winds it is stated: "The 3-second gust wind speed for a 100-yr return period [at theCPNPP site] is 96 mph..... This event is not significant impact than hurricanes and tornadoes."Please explain the reason why this event is not more significant than tornadoes of enhanced F-scale intensity F1 given that it can cause the same plant failures (plant switchyard, fire protectionsystem and non-essential chilled water system) with a significantly higher frequency (i.e., onceevery 100 years vs. 1.4x10⁻⁴ per year).
ANSWER:
(1) The discussion on the basis of qualitative or quantitative screening for each external event hasbeen supplemented in the FSAR Table 19.1-205. The revision incorporates the response to RAINo. 4619 (CP RAI #165) Question 19-10.
(2) Other external hazards in FSAR Revision 1 Table 19.1-205 such as flooding due to failure ofupstream dams or release of hazardous material due to the collapse of nearby industrial,transportation and military facilities are screened out by considering the maximum hazardousconditions without regard for the cause of such accidents. Arguments applied to screen out suchhazards are also applicable under seismic event conditions.
(3) The determination of the frequency that hurricanes, with wind speed above 90 mph, could reachthe CPNPP site depends on the frequency of hurricanes striking this section of the Texas coast,the hurricane wind speed at landfall, the attenuation of wind speed while traveling inland, and theprobability of a hurricane striking the CPNPP site.
As stated in FSAR Subsection 2.3.1.2.2, thirty-nine tropical storms or hurricanes have struck theTexas coast between 1899 through 2006. For major hurricanes (Category 4 or higher), the returnperiod is 17.7 yr (annual frequency of 5.7x1 0-2). The minimum wind speed for a Category 4hurricane on the Saffir/Simpson scale is 131 mph. FSAR Figure 2.3-212 gives the number ofhurricanes as a function of wind speed based on the entire U. S. coast not only the Gulf coast. Asexpected, the hurricane frequency of occurrence decreases as wind speed increases. This figuregives a return period of 1000 years for a wind speed of 175 knots (201 mph). The shape of thewind speed versus return period curve in Figure 2.3-212 shows that there is a maximum probablewind speed. This has been investigated by Jagger and Eisner (Reference 1) who determined thatthe maximum possible near-coastal hurricane wind speed is estimated to be 183 kt (211 mph)using a maximum likelihood approach and 208 kt (240 mph) using a Bayesian approach. The Gulfcoast model presented in this paper gives a mean 1000-year return level of 173 kt (199 mph) with a95% confidence limit of 191 kt (220 mph). In the following evaluations, the hurricane wind speedwill be assumed to be the maximum possible wind speed of 240 mph with a recurrence interval ofzero.
Tropical cyclones including hurricanes lose strength rapidly as they move inland. FSAR Figure 2.3-214 shows the decay of tropical cyclone winds after landfall. As seen, only the fastest movingstorms will maintain any significant wind speed by the time they reach the CPNPP site. In a paperby Kaplan and Demaria (Reference 2), the decay of tropical cyclone winds after landfall wasevaluated. The wind speed after landfall is given by the following inland wind decay model:
V(t) = Vb + (RVO - Vb)e-a - C

U. S. Nuclear Regulatory CommissionCP-201000861TXNB-100466/24/2010Attachment 2Page 10 of 40
Where:V(t) is the wind speed as a function of time,
Vb is 26.7 kt,
R is 0.9,
(x is 0.095 hr-',t is the time after landfall, and
C is a correction factor to account for the inland distance. Where:
C ==M n('L)J+ b
Where:D in the inland distance in kilometers,
Do is 1 km,
m = c14(to - t),
b = di4(to- t),
c= 0.0109 kt/hr2,2d= -0.0503 kt/hr , and
to = 50 hr.
Assuming a maximum landfall wind speed or 208 kt (-240 mph), a translational velocity of 16 kt(18.4 mph), and a distance of 400 miles from the CPNPP site to Galveston, gives a maximumpossible wind speed of 61 mph at the CPNPP site. This should be considered as the upper boundof possible hurricane wind speed at the CPNPP site.
The number of tropical storms passing within 50 statute mi of the CPNPP site are listed on FSARTable 2.3-208 and shown on Figure 2.3-213. These data, obtained from the NOAA CoastalServices Center, show that only one hurricane, in 1900, passed within 50 mi of the site during theperiod 1851 - 2006. This gives a frequency of 1/156 yr = 6.4x10 3 per yr of a hurricane striking theCPNPP site.
As shown above, the probability of a major hurricane striking the Texas coast is small (5.7x10⁻² peryear) and the probability of a major hurricane passing within 50 miles of the CPNPP site is alsosmall (6.4x10 per yr). Even if a major hurricane is assumed to strike the CPNPP site, themaximum wind speed would be 61 mph based on the maximum possible hurricane landfall windspeed. Therefore, hurricane winds can be screened out as not risk significant because thefrequency of hurricanes reaching the CPNPP site with a wind speed above 90 mph is exceedinglysmall.
(4) DCD Subsection 3.3.1.1 states that the design wind for the standard plant has a basic speed of155 mph, corresponding to a 3-second gust at 33 ft above ground for exposure category C (openterrain). For all seismic category I and II SSCs, the basic wind speed is multiplied by animportance factor of 1.15 correlating to essential facilities in hurricane-prone regions as defined inASCE/SEI 7-05 Tables 1-1 and 6-1.
FSAR Subsection 3.3.1 .1 states that the site-specific basic wind speed of 90 mph corresponds to a3-second gust at 33 ft. above ground for exposure category C, which is enveloped by the basicwind speed used for the design of the standard plant. Site-specific structures, systems, andcomponents (SSCs) are designed using the site-specific basic wind speed of 90 mph, or higher.

U. S. Nuclear Regulatory CommissionCP-201000861TXNB-100466/24/2010Attachment 2Page 11 of 40
The maximum wind speed by extreme winds is not greater than the F-scale intensity F1 oftornadoes for CPNPP. Also all seismic category I and II SSCs including fire suppression systemsare designed for the wind load and are not damaged by the extreme winds. Although, a loss ofoffsite power is a hazardous potential from extreme winds, it is included in the loss of offsite power(LOOP) event of internal event PRA in a single weather-related LOOP category.
Thus an extreme wind event does not have a hazardous potential greater than a hazard from a F1scale of tornado.
References
1. Climatology Models for Extreme Hurricane Winds Near the United States, Thomas H. Jagger andJames B. Eisner, January 19, 2006.
2. A Simple Empirical Model for Predicting the Decay of Tropical Cyclone Winds after Landfall, JohnKaplan and Mark Demaria, JOURNAL OF APPLIED METEOROLOGY, Volume 34, November,1995.
Impact on R-COLA
See attached marked-up of FSAR Revision 1 pages 2.3-13, 19.1-12, 19.1-18, 19.1-20, 19.1-22, 19.1-23,19.1-24, 19.1-25, 19.1-26, 19.1-27, 19.1-28, 19.1-30, 19.1-31, 19.1-32, 19.1-35, 19.1-36, 19.1-37,19.1-39, 19.1-40, 19.1-41, 19.1-42, 19.1-43, 19.1-44, 19.1-45, 19.1-46, 19.1-47, 19.1-48, 19.1-49, and19.1-50.
Impact on S-COLA
None.
Impact on DCD
None.

Comanche Peak Nuclear Power Plant, Units 3 & 4COL Application
Part 2, FSAR
In a naper by Kaplan and Demaria, the decay of tropical cyclone winds after RCOL2_19landfall was evaluated. The wind speed after landfall is given by the following -13inland wind decay model:
V(t) = Vb+(RVo-Vb)e-ct-c
Where:V(t) is the wind speed as a function of time,Vb is 26.7 kt,R is 0.9,
a is 0.095 hr-1t is the time after landfall, andC is a correction factor to account for the inland distance. Where:
c= m[in(o) + b
Where:D in the inland distance in kilometers,Do_ is 1 km,
m = c1*t(to - t.b =d*t~to=at
£1 = 0.0109 kt/hr2-,d, = -0.0503 ktlhr- and
= 50 hr.
Assuming a maximum landfall wind speed or 208 kt (-240 mph), a translationalvelocity of 16 kt (18.4 mph), and a distance of 400 miles from the CPNPP site toGalveston, gives a maximum possible wind sWeed of 61 mph at the CPNPP site.This should be considered as the upper bound of possible hurricane wind speedat the CPNPP site.
The Probable Maximum Hurricane (PMH) is discussed in CPNPP UFSARSubsection 2.3.1.2.2. For the CPNPP site, the PMH sustained (10-minuteaverage) wind speed at 30 ft aboveground is 81 mph (Reference 2.3-205).
2.3.1.2.3 Tornadoes
During the period January 1, 1950 through July 31, 2006, 158 tornadoes (meanannual frequency of 2.8/yr) occurred within Somervell County and the surroundingcounties (Bosque,.Erath, Hood, and Johnson) (Reference 2.3-225). It should benoted that statistical data on severe local storms, tornadoes particularly, are highlydependent on human observation. For example, as population density increases,the number of tornado occurrences observed and accurately reported generallyincreases. However, tornadoes that cross county lines may be counted twice dueto this increase in reporting.
2.3-13 2.313Re;,OAR I

Comanche Peak Nuclear Power Plant, Units 3 & 4COL Application
Part 2, FSAR
19.1.9 References
Add the following references after the last reference in DCD Subsection 19.1.9.
19.1-201 Risk-Informed Method for Control of Surveillance Frequencies, NEI04-10, Rev. 1, Nuclear Energy Institute, Washington DC, April 2007.
19.1-202 Climatology Models for Extreme Hurricane Winds Near the United RCOL2_19-1States, Thomas H. Jaoaer and James B. Eisner, January 19, 2006. 3
19.1-203 A Simple Empirical Model for Predicting the Decay of TropicalCyclone Winds after Landfall, John Kaplan and Mark Demaria,JOURNAL OF APPLIED METEOROLOGY, Volume 34, November,1995.
19.1-12 19.-12Reymsen
Comanche Peak Nuclear Power Plant, Units 3 & 4COL Application
Part 2, FSAR
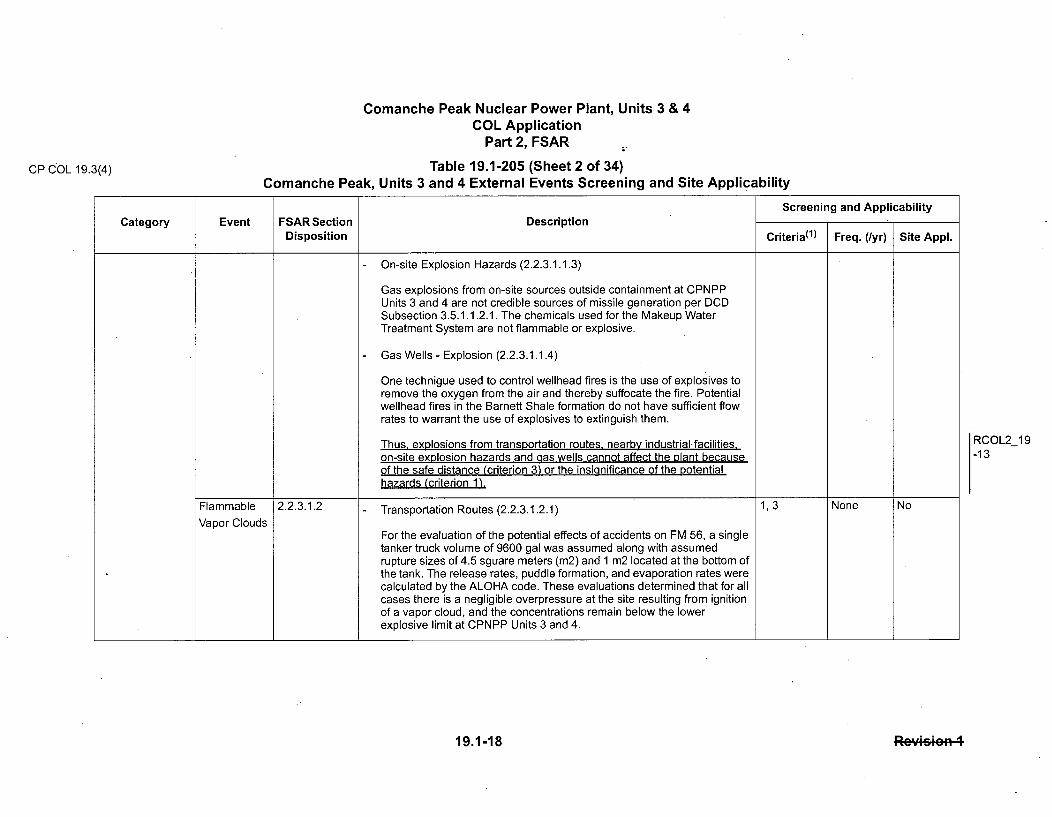
Table 19.1-205 (Sheet 2 of 34)Comanche Peak, Units 3 and 4 External Events Screening and Site Applicability
CP COL 19.3(4)
Screening and ApplicabilityCategory Event FSAR Section Description
Disposition Criteria(1 ) Freq. (/yr) Site Appl.
On-site Explosion Hazards (2.2.3.1.1.3)
Gas explosions from on-site sources outside containment at CPNPPUnits 3 and 4 are not credible sources of missile generation per DCDSubsection 3.5.1.1.2.1. The chemicals used for the Makeup WaterTreatment System are not flammable or explosive.
Gas Wells - Explosion (2.2.3.1.1.4)
One technigue used to control wellhead fires is the use of explosives toremove the oxygen from the air and thereby suffocate the fire. Potentialwellhead fires in the Barnett Shale formation do not have sufficient flowrates to warrant the use of explosives to extinguish them.
Thus, explosions from transportation routes, nearby industrial facilities,on-site explosion hazards and gas wells cannot affect the olant becauseof the safe distance (criterion 3) or the insignificance of the potentialhazards (criterion 1).
Flammable 2.2.3.1.2 - Transportation Routes (2.2.3.1.2.1) 1,3 None No
Vapor CloudsFor the evaluation of the potential effects of accidents on FM 56, a singletanker truck volume of 9600 gal was assumed along with assumedrupture sizes of 4.5 sguare meters (m2) and 1 m2 located at the bottom ofthe tank. The release rates, puddle formation, and evaporation rates werecalculated by the ALOHA code. These evaluations determined that for allcases there is a negligible overpressure at the site resulting from ignitionof a vapor cloud, and the concentrations remain below the lowerexplosive limit at CPNPP Units 3 and 4.
RCOL2_19-13
19.1-18 Rev9s.11 ee

Comanche Peak Nuclear Power Plant, Units 3 & 4COL Application
Part 2, FSAR
Table 19.1-205 (Sheet 4 of 34)Comanche Peak, Units 3 and 4 External Events Screening and Site Applicability
CP COL 19.3(4)
Screening and ApplicabilityCategory Event FSAR Section Description
Disposition Criteria(1 ) Freq. (/yr) Site Appl.
For the small breaks, a leak rate of 0.62 cfs was assumed for a period of32 hours (hr). The concentration at the CPNPP Units 3 and 4 control roomintakes is below 8680 ppm, which is below the LEL of 13,000 ppm. TheSunoco crude oil pipeline does not represent an explosion or flammablevapor cloud hazard at CPNPP Units 3 and 4.
Gas Wells (2.2.3.1.2.4)
The closest functioning natural gas well, owned and ogerated by XTOEnergy Inc., is 1.2 mi from the center point of CPNPP Units 3 and 4. Forthe purposes of evaluating the consequences of breaching a well, a gasrelease rate of 15.6 million cu ft/day was assumed. The analysis showsthat, at the assumed release rate, the area of flammability is less than 0.1mi downwind from a gas well release. The results show that the maximumconcentration at the CPNPP Units 3 and 4 control room intakes is 346ppm, which is well below the LEL concentration of 44,000 ppm. Themaximum overpressure at the closest safety-related structure resultingfrom ignition of the natural gas cloud is negligible. The analysis alsoshows the overpressure from a gas explosion does not exceed 1 psig at adistance less than 0.1 mi from the cloud. It is concluded that the delayedignition of vagor clouds from nearby transportation routes, pipelines, andfacilities does not pose a hazard to CPNPP Units 3 and 4.
Thus, flammable vaoor clouds from transportation routes, nearbyindustrial facilities, pipelines and gas wells cannot affect the plantbecause of the safe distance (criterion 3) or insignificance of the potentialhazards (criterion 1).
RCOL2_19-13
19.1-20 19.1-20R~iOR I

Comanche Peak Nuclear Power Plant, Units 3 & 4COL Application
Part 2, FSAR
Table 19.1-205 (Sheet 6 of 34)Comanche Peak, Units 3 and 4 External Events Screening and Site Applicability
CP COL 19.3(4)
Screening and ApplicabilityCategory Event FSAR Section Description
Disposition Criteria(1 ) Freq. (/yr) Site Appl.
- Stationary Sources (2.2.3.1.3.2.2)
The fixed facilities that could not be initially screened out based on thechemicals stored at the facility are: Wolf Hollow I, LP; Cleburne Propane;DeCordova SES; and
Glen Rose WWTP. Table 2.2-214 summarizes the chemicals that do notmeet the Regulatory Guide 1.78 screening criteria, and the quantity anddistance to the nearest CPNPP Units 3 and 4 MCR inlets to beconsidered for the control room habitability analysis in Section 6.4.
Section 6.4.4.2 performed the analysis on the design based control roomhabitability to specific toxic chemicals of mobile and stationary sources. Using
conservative assumptions and input data for chemical source term, CPNPP
Units 3 and 4 control room parameters, site characteristics, and meteorologyinputs, postulated chemical releases are analyzed for maximum value
concentration to the MCR using the HABIT code, version 1.1. RG 1.78
specifies the use of HABIT 1.1 software for evaluating control room
habitability.
Instrumentation to detect and alarm a hazardous chemical release in the
vicinity of CPNPP Units 3 and 4, and to automatically isolate the control roomenvelope (CRE) from such releases is not required based on analyses
described in Subsection 6.4.4.2. No hazardous chemicals concentrations in
the MCR exceeded the IDLH criteria of RG 1.78.
Thus, the main control room is habitable for toxic chemicals from mobile or
stationary sources because no hazardous chemical concentration in the main
control room exceeds the criteria of RG 1.78 (criterion 1).
RCOL-2_19-13
19.1-22 19.1 -22 R QR I

Comanche Peak Nuclear Power Plant, Units 3 & 4COL Application
Part 2, FSAR
Table 19.1-205 (Sheet 7 of 34)Comanche Peak, Units 3 and 4 External Events Screening and Site Applicability
CP COL 19.3(4)
Screening and ApplicabilityCategory Event FSAR Section Description
Disposition Criteria(1 ) Freq. (/yr) Site Appl.
Fires 2.2.3.1.4 Fires originating from accidents at any of the facilities or transportation routes 1, 3 None No
discussed previously would not endanger the safe operation of the stationbecause of the distance between potential accident locations and CPNPP
Units 3 and 4. The location of CPNPP Units 3 and 4 is at least 0.25 mi awallfrom any potential accident location.
The nuclear island is situated sufficiently clear of trees and brush. The
distance exceeds the minimum fuel modification area reguirements of 30 ft.
per NFPA-1144. NFPA 1144 minimum setback distance in the Owner
Controlled Area (OCA) will be Procedurally maintained. Also, the OCAadiacent to the isolation zone will be cleared of any concentration of
vegetation for security reasons as well. There is no threat from brush or forest
fires. Based on the CPNPP Units 3 and 4 site configuration, the Protected
Area distance from the perimeter fence to the power block, the security
isolation zone of 20 feet and the setback distance in accordance with the
guidance in NFPA 1144 of minimum 30 feet. a wildfire in the vicinity of the site
will not continue to propagate onto the Protected Area. Furthermore, this
combined distance will ensure that the power block will not experience
temperatures from a wildfire that would affect the CDF established in the
PRA.
RCOL2_19-10
19.1-23 19.-23RWeSeR I

Comanche Peak Nuclear Power Plant, Units 3 & 4COL Application
Part 2, FSAR
Table 19.1-205 (Sheet 8 of 34)Comanche Peak, Units 3 and 4 External Events Screening and Site Applicability
CP COL 19.3(4)
Screening and ApplicabilityCategory Event FSAR Section Description
Disposition Criteria(1 ) Freq. (/yr) Site Appl.
Fire and smoke from accidents at nearby homes, industrial facilities.
transportation routes, or from area forest or brush fires, do not jeopardize the
safe operation of the plant due to the distance of potential fires from the plant.Any potential heavy smoke problems at the MCR air intakes would not affect
the plant operators.
A potential gas well fire wqs analyzed using the ALOHA code. This heat flux
is sufficiently low as to not result in exceeding any of the thermal acceptance
criteria of the structures.
On-site fuel storage facilities are designed in accordance with applicable fire
codes. and plant safety is not jeopardized by fires or smoke in these areas. A
detailed description of the plant fire protection system is presented in DCDSubsection 9.5.1.
Thus, fire and smoke from accidents at nearby facilities and transportation
routes, forest or brush fires, and on-site fuel storage facilities can not affect
the plant because of the safe distance from (criterion 3) or the insignificance
of the potential hazards (criterion 1).
RCOL2_19-13
19.1-24 Re'siee-oR

Comanche Peak Nuclear Power Plant, Units 3 & 4COL Application
Part 2, FSAR
Table 19.1-205 (Sheet 9 of 34)Comanche Peak, Units 3 and 4 External Events Screening and Site Applicability
CP COL 19.3(4)
Screening and ApplicabilityCategory Event FSAR Section Description
Disposition Criteria(1 ) Freq. (/yr) Site Appl.
Collision with 2.2.3.1.5 The oRly watcr'y n.ar CPNPP is • CR, 8whi9,6h ,o nt pr..id. publi. 31 None No
Intake ...... to the site. Th-hr ;5 HE) . .mmeAAIa Ar ........ no tr^A-f on.^ • CGR-.Structure Thc3re aro n Rna"gable ri'e-re 'w'ithin 5 mi of thc ctc. ThRsc, c YllicOn U with the
inta1Kc ctr'-cturc rc , Ft ccncsdcrcd tc bc crcdib!c.The ESWS and the CWSdraw make up water from the intake structure on Lake Granbury. The ESWS
is supplied with water from the ultimate heat sink (UHS) and returns water tothe UHS. The UHS is designed to assure sufficient cooling water inventory to
mitigate the consequences of a design basis accident for a minimum of 30
days without makeup. The intake structure is not safety related.
Thus, collision with the intake structure is of equal or lesser damage potential
than the events for which the plant has been designed (criterion 1).
Liguid spills 2.2.3.1.6 The onIY .. ur.e of liguid spells in tho•' "i'it" of CP-o PP O, ithe c..udc oil 1, 3 None No
pipeline. Tho accidcntal rcFease ef p.tre um, product, into 3CR would not
affcct eperatiOn cf the plant. NcFRmal cpcralticn of the WatcrF intakc ctrucGturcepumpc requiroc cubmoroqGcnc. Liquids with a .p..ifi gra..ity less than unit,,ouch ac potrlou-m prod-uts, would ficat cR thc cu-rfaco cf tho riV-r aRd
ccncguctly aro net likeoly to be drawn inte the makeup watcr cyctcmf.The accidental release of oetroleum products into Lake Granbury, the most
likely material released, would not affect operation of the plant. The normal
water level in Lake Granbury is El. 696.00 ft. with the pumo intake screen at
656.00 ft. Liquids with a soecific gravity less than unity, such as petroleum
products, would float on the surface of the lake and are not likely to be drawninto the makeup water system. Liguids with a specific gravity greater than
unity would disperse and be diluted before reaching the oumo intake.
Thus, liguid soills cannot affect the plant because no potential for it to be
drawn into the makeuo water system. (criterion 1).
RCOL2_19-13
19.1-25 RPW1;MAR I

Comanche Peak Nuclear Power Plant, Units 3 & 4COL Application
Part 2, FSAR
Table 19.1-205 (Sheet 10 of 34)Comanche Peak, Units 3 and 4 External Events Screening and Site Applicability
CP COL 19.3(4)
Screening and ApplicabilityCategory Event FSAR Section Description
Disposition Criteria(t ) Freq. (/yr) Site Appl.
Aircraft 3.5.1.6 The .r ,bability 6f aircraft r.lated eGoidont. for CPNPR •i•tO 3 a,4 n s le o 2 <10-7 No
Hazards than A1n ardor of m•ngnitudc 9f 10-e por ycar for aifrraft, air:ay, and airportnfrmati. rofleotod in 8binn 2.2.2.7.Thus, the probability of
aircraft-related hazards for CPNPP Units 3 and 4 is less than 10-7 per year
(criterion 2).
There are no commercial airports within 5 mi of CPNPP site. Only one military
traininq route, Victor air route VR-158. passes within 10 mi of CPNPP site.
The probability of an aircraft crashing into the plant (PFA) is estimated in the
following manner:
PFA = C x N x Aiw
Where
C = In-fliqht crash rate per mile for aircraft using the airway (4xl0•-Ž)
w = Width of airway, olus twice the distance from the airway edge tothe site, conservatively provided in statute miles, equals 10 statutemiles + (2 x 2 statute miles)
N = Estimated annual number of aircraft operations
A = Effective area of plant in square miles (0.0907)
In order to maintain PFA less than the order of 101. the above eguation is
rearranaed to solve for N using values of C. A. and w given above:
N = PFA /(C x AMw) = 19,300 operations per year
19.1-26
RCOL2_19-10
RCOL2_19-13
RCOL2_19-10

Comanche Peak Nuclear Power Plant, Units 3 & 4COL Application
Part 2, FSAR
Table 19.1-205 (Sheet 11 of 34)Comanche Peak, Units 3 and 4 External Events Screening and Site Applicability
CP COL 19.3(4)
Screening and Applicability
Category Event FSAR Section DescriptionDisposition Criteria(1 ) Freq. (/yr) Site Appl.
The annual number of aircraft operations on military training route VR-158
are less than 19,300 operations per year. Thus the probability of
aircraft-related hazards for CPNPP Units 3 and 4 is less than 10--7 oer year
(criterion 2).
Site Proximity 3.5.1.5 PIG p.te•,tial cite pr,•• im.. ity , ,, cc,,8 hazardc.Externallv initiated missiles 3 None No
Missle considered for design are based on tornado missiles as described in DCD
Subsection 3.5.1.4. As described in Section 2.2. no potential site-proximity
missile hazards are identified except aircraft, which are evaluated in
Subsection 3.5.1.6.
Thus, no site proximity missile hazard is identified (criterion 3).
RCOL2_19-10
RCOL2_19-13
19.1-27 19.1-27ReyiiGR 4

Comanche Peak Nuclear Power Plant, Units 3 & 4COL Application
Part 2, FSAR
Table 19.1-205 (Sheet 12 of 34)Comanche Peak, Units 3 and 4 External Events Screening and Site Applicability
CP COL 19.3(4)
Screening and ApplicabilityCategory Event FSAR Section Description
Disposition Criteria(1) Freq. (/yr) Site Appl.
Turbine 3.5.1.3.1 The probability 8f turbHFi failur. roculting in the eoj8ti• n ,f ubino •rto•r (or, 2,3 <10-7 NoMissile intornal ctruoturo) fragmontc through the turbino oeoi'ng, ., cc ....... th -
3.5.1.3.2 Pr y.ar. The a...ptable riSk r•at P4 - P4 * P2 if PS i thoro•fe r• aint.aino
ac lcss than 104 per year-The CPNPP site plan shows the location of
CPNPP Units 3 and 4 is such that no postulated low traiectory turbinemissiles from CPNPP Units 1 and 2 can affect CPNPP Units 3 and 4
(Criterion 3).
The probability of of turbine missile accidents for CPNPP Units 3 and 4 is less
than 1 _ • per year is analyzed in FSAR Subsection 3.5.1.3.2. Mathematically,P4 = P1 x P2 x P3. where RG 1.115 considers an acceptable risk rate for P4
as less than 10-1 per year. For unfavorably oriented T/Gs determined in
Subsection 3.5.1.3. the product of P2 and P3 is estimated as 1042 oer year.which is a more conservative estimate than for a favorably oriented singleunit. The probability of turbine failure resulting in the eiection of turbine rotor
(or internal structure) fragments through the turbine casing, P1. as less than
10-5- per year. CPNPP Units 3 and'4 procedures will reguire inspectionintervals and a turbine valve test freouency to maintain P1 within acceotablelimits. The acceptance risk rate P4 = P1 x P2 x P3 is therefore maintained as
less than 101 per year (criterion 2).
RCOL2_19-10
19.1-28 19.1-28ReveisoR41

Comanche Peak Nuclear Power Plant, Units 3 & 4COL Application
Part 2, FSAR
Table 19.1-205 (Sheet 14 of 34)Comanche Peak, Units 3 and 4 External Events Screening and Site Applicability
CP COL 19.3(4)
Screening and ApplicabilityCategory Event FSAR Section Description
Disposition Criteria(1 ) Freq. (/yr) Site Appl.
The determination of the freauency that hurricanes, with wind speed above90 mph, could reach the CPNPP site depends on the frequency of hurricanes
striking this section of the Texas coast, the hurricane wind speed at landfall,the attenuation of wind speed while traveling inland, and the probability of ahurricane striking the CPNPP site.
As stated in FSAR Subsection 2.3.1.2.2. thirty-nine tropical storms orhurricanes have struck the Texas coast between 1899 through 2006. For
maior hurricanes (Category 4 or higher), the return period is 17.7 yr (annual
freauency of 5.7x10;). The minimum wind soeed for a Category 4 hurricane
on the Saffir/Simpson scale is 131 mph. FSAR Figure 2.3-212 gives thenumber of hurricanes as a function of wind speed. These results were basedon the entire U. S. coast not only the Gulf coast. As expected. the hurricanefrequency of occurrence decreases as wind speed increases. This figuregives a return period of 1000 years for a wind speed of 175 knots (201 mph).The shape of the wind speed versus return period curve in Figure 2.3-212
shows that there is a maximum probable wind speed. This has beeninvestigated by Jagger and Eisner (Reference 19.1-202) who determined that
the maximum possible near-coastal hurricane wind speed is estimated to be183 kt (211 mph) using a maximum likelihood anproach and 208 kt (240 mph)using a Bayesian approach. The Gulf coast model presented in this papergives a mean 1000-year return level of 173 kt (199 mph) with a 95%
confidence limit of 191 kt (220 mph). In the following evaluations, thehurricane wind speed will be assumed to be the maximum possible wind
speed of 240 mph with a recurrence interval of zero.
RCOL2_19-13
19.1-30 19.-30ReyaseR

Comanche Peak Nuclear Power Plant, Units 3 & 4COL Application
Part 2, FSAR
Table 19.1-205 (Sheet 15 of 34)Comanche Peak, Units 3 and 4 External Events Screening and Site Applicability
CP COL 19.3(4)
Screening and ApplicabilityCategory Event FSAR Section Description
Disposition Criteria(1 ) Freq. (/yr) Site Appl.
In a paper by Kaplan and Demaria (Reference 19.1-203), the decay oftropical cyclone winds after landfall was evaluated. The wind speed afterlandfall is given by the following inland wind decay model:
V(I) = V + (RVo- Vb)e-O"- C
Where:V(t) is the wind speed as a function of time,Vb is 26.7 kt.R is 0.9(x is 0.095 hr1
t is the time after landfall. andC is a correction factor to account for the inland distance. Where:
C = M [In (g)] ± b
Where:D in the inland distance in kilometers,DQ is 1 km
b =dj*t&t0 ,
= 0.0109 kt/hr2-.
= -0.0503 kt/hr2 , and= 50 hr.
RCOL2_19-13
19.1-31 19.-31RePeRO4

Comanche Peak Nuclear Power Plant, Units 3 & 4COL Application
Part 2, FSAR
Table 19.1-205 (Sheet 16 of 34)Comanche Peak, Units 3 and 4 External Events Screening and Site Applicability
CP COL 19.3(4)
Screening and ApplicabilityCategory Event FSAR Section Description
Disposition CriteriaM1 ) Freq. (/yr) Site Appl.
Assuming a maximum landfall wind sweed or 208 kt (-240 mph). a
translational velocity of 16 kt (18.4 mph). and a distance of 400 miles from the
CPNPP site to Galveston. gives a maximum possible wind speed of 61 mph
at the CPNPP site. This should be considered as the upper bound of possible
hurricane wind soeed at the CPNPP site.
Only one hurricane, in 1900, passed within 50 mi of the site during the period
1851 - 2006. This gives a freauency of 1/156 yr = 6.4x10g per yr of a
hurricane striking the CPNPP site. As shown above, the probability of a
maior hurricane strikinq the Texas coast is small (5.7x10⁻² per year) and the
probability of a maior hurricane passing within 50 miles of the CPNPP site is
also small (6.4x1 0: per yr). Even if a maior hurricane is assumed to strike the
CPNPP site, the maximum wind speed would be 61 mph based on the
maximum possible hurricane landfall wind speed. Therefore, hurricane windscan be screened out as not risk significant because the frequency of
hurricanes reaching the CPNPP site with a wind speed above 90 mph is
exceedingly small (criterion 1).
RCOL2_19-13
19.1-32 19.-32ReveseR

Comanche Peak Nuclear Power Plant, Units 3 & 4COL Application
Part 2, FSAR
Table 19.1-205 (Sheet 19 of 34)Comanche Peak, Units 3 and 4 External Events Screening and Site Applicability
CP COL 19.3(4)
Screening and ApplicabilityCategory Event FSAR Section Description
Disposition Criteria(1 ) Freq. (/yr) Site Appl.
Compliance with Regulatory Guide 1.76 is discussed in Section 1.9. Tornadoloadings are discussed in Subsection 3.3.2. It is easily lost when stand alone.
This event is not screened out. Perform a bounding analysis.
Thunder-stor 2.3.1.2.4 Thunderstorms, from which damaging local weather can develop (tornadoes, 1,4 Not No
ms hail, high winds, and flooding), occur about eight days each year based on determined
data from the counties surrounding the site. The maximum frequency ofthunderstorms and high wind events occurs from April to June, while the
months from November through February have few thunderstorms. The
monthly and regional distributions of thunderstorms and high wind events are
displayed in Table 2.3-211.
Impa. t of this ae.Ant is less than by hur.ion. ...rR G oenF oThus. thunder
storms cannot affect the plant because of the insianificance of the ootentialhazards (criterion 1) and the impact is less than hurricanes or tornadoes
(criterion 4).
Lightnings 2.3.1.2.5 The annual mean number of thunderstorm days in the site area is 1, 4 None Noconservatively estimated to be 48 based on interpolation from the isokeraunic
map; therefore it is estimated that the annual lightning stroke density in theCPNPP site area is 25 strikes/sg mi/yr. Recent studies based on data from
the National Lightning Detection Network (NLDN) indicate that the abovestrike densities are upper bounds for the CPNPP site.
Impact of this oYvnt 4c loc' than by hurriconoc or tornadoc.The lightninq
cannot affect the plant because of the insignificance of potential hazards
(criterion 1), and the impact is less than that of hurricanes and tornadoes(criterion 4).
RCOL-2_19-13
RCOL-2_19-13
19.1-35 ReyieR4

Comanche Peak Nuclear Power Plant, Units 3 & 4COL Application
Part 2, FSAR
Table 19.1-205 (Sheet 20 of 34)Comanche Peak, Units 3 and 4 External Events Screening and Site Applicability
CP COL 19.3(4)
Screening and ApplicabilityCategory Event FSAR Section Description
Disposition Criteria(1 ) Freq. (/yr) Site Appl.
Hails 2.3.1.2.6 Almost all localities in Texas occasionally experience damage from hail. 1,4 None No
While the most commonly reported hailstones are 1/2 to 3/4 inch in diameter,
hailstones 3 to 3-1/2 inch in diameter are reported in Texas several times a
year. Fortunately, recurrence of damaging hail at a specific location is veryinfrequent. The monthly and seasonal breakdown of large-hail occurrences
(3/4 in diameter or larger) for the area around the CPNPP site is given in
Table 2.3-212.
I mp St of th. ..... t ic G c than by hu , o1r t...r -A d.. . Hail cannot affect
the plant because of the insionificance of the ootential hazard (criterion 1).Also, the impact is less than from hurricanes or tornadoes (criterion 4)
Air Pollution 2.3.1.2.7 The Clean Air Act, which was last amended in 1990, requires the U.S. 1,4 None No
Potential Environmental Protection Agency (EPA) to set National Air Quality Standards
for pollutants considered harmful to the Public health and the environment.The EPA Office of Air Quality Planning and Standards has set National
Ambient Air Quality Standards for six principle pollutants, which are called
"Criteria" pollutants.
The newly promulgated EPA 8-hour ozone standard (62 FR 36, July 18,
1997) is 0.08 ppm in accordance with 40 CFR 50.10 (Reference 2.3-226).
Somervell County is in attainment for all criteria pollutants (carbon monoxide,lead, nitrogen dioxide, particulate matter ([PM10, particulate matter less than
10 micron], [PM2.5, particulate matter less than 2.5 micron]), ozone, and
sulfur oxides.
RCOL2_19-13
19.1-36 19.-36RP49*6oR I

Comanche Peak Nuclear Power Plant, Units 3 & 4COL Application
Part 2, FSAR
Table 19.1-205 (Sheet 21 of 34)Comanche Peak, Units 3 and 4 External Events Screening and Site Applicability
CP COL 19.3(4)
Screening and ApplicabilityCategory Event FSAR Section Description
Disposition Criteria(1 ) Freq. (/yr) Site Appl.
The ventilation rate is a significant consideration in the dispersion of
pollutants. Higher ventilation rates are better for dispersing pollution thanlower ventilation rates. The atmospheric ventilation rate is numerically equal
to the product of the mixing height and the wind speed within the mixing layer.
Conditions in the region generally favor turbulent mixing. Two conditions
which reduce mixing, increasing the air pollution potential, are surfaceinversions and stable air layers aloft. The surface inversion is generally a
short-term effect and surface heating on most days creates a uniform mixinglayer by mid-afternoon.
The air stagnation trend for this general area is negative (Figure 2.3-246)
over the 50-yr period of record.
This e.vnt is net ,ignifeant imp..t than teAd chcmical.sThus, air pollution is
not a significant site hazard (criterion 1). and is less severe than the impact
from toxic chemicals (criterion 4).
Precipitation 2.3.1.2.8 Probable Maximum Precipitation (PMP), sometimes called maximum 1 None No
possible precipitation, for a given area and duration is the depth which can be2.3.2.1.5 reached but not exceeded under known meteorological conditions. For the
site area, using a 100-yr return period, the PMP for 6, 12, 24, and 48 hours is
6.9, 8.3, 9.5, and 11.0 in, respectively (Table 2.3-217).
RCOL2_19-13
19.1-37 19.1-37 ReoR I

Comanche Peak Nuclear Power Plant, Units 3 & 4COL Application
Part 2, FSAR
Table 19.1-205 (Sheet 23 of 34)Comanche Peak, Units 3 and 4 External Events Screening and Site Applicability
CP COL 19.3(4)
Screening and ApplicabilityCategory Event FSAR Section Description
Disposition Criteria(1 ) Freq. (/yr) Site Appl.
As stated in the US-APWR DCD Subsection 3.4.1.2, if PMWP was to occur,US-APWR safety-related systems and components would not bejeopardized. US-APWR seismic category I building roofs are designed as a
drainage system capable of handling the probable maximum winterprecipitation (PMWP). The US-APWR DCD also states that seismic categoryI structures have sloped roofs designed to preclude roof ponding. This isaccomplished by channeling rainfall expeditiously off the roof. Also insubsection 3.4.1.2, the design-basis flooding level (DBFL) listed in Section2.4, and adequate sloped site grading and drainage prevents flooding caused
by probable maximum precipitation (PMP) or postulated failure of nonsafety-related, non seismic storage tanks located on site.
Thus. precipitation cannot affect the Olant because of the insignificant
potential hazard (criterion 1).
Dust Storms 2.3.1.2.9 Blowing dust or sand may occur occasionally in West Texas where strong 1 None No
winds are more freguent and vegetation is sparse. While blowing dust or
sand may reduce visibility to less than five mi over an area of thousands of sgmi, dust storms that reduce visibility to one mi or less are quite localized and
depend on soil type, soil condition, and vegetation in the immediate area. TheNCDC Storm Event database did not report any dust storms in Somervell
County between January 1,1950 and August 31,2007.
Thic event ic nat cignificant impact to the plant.Thus, dust storms cannot
affect the plant because of the insignificant potential hazard (criterion 1).
RCOL2_19-13
RCOL2_19-13
19.1-39 Re9.s9eR-l.

Comanche Peak Nuclear Power Plant, Units 3 & 4COL Application
Part 2, FSAR
Table 19.1-205 (Sheet 24 of 34)Comanche Peak, Units 3 and 4 External Events Screening and Site Applicability
CP COL 19.3(4)
Screening and ApplicabilityCategory Event FSAR Section Description
Disposition Criteria(1 ) Freq. (Iyr) Site Appl.
Ultimate Heat 2.3.1.2.10 The performance of the ultimate heat sink is discussed in Subsection 9.2.5. 1 None NoSink The wet bulb design temperature for the ultimate heat sink was selected to be
2.3.2.1.3 80'F based on 30 yr (1977 -2006) of climatological data obtained from
National Climatic Data Center/Nationa! Oceanic and AtmosphericAdministrator for Dallas/Fort Worth International Airport Station in accordance
with RG 1.27. The worst 30 day period was selected from the above
climatological data between June 1, 1998 and June 30, 1998, with anaverage wet bulb temperature of 78.0°F. A 2°F margin was added to themaximum average wet bulb temperature for conservatism.
These are not significant impact to ultimate heat sink.
Extreme 2.3.1.2.11 Estimated extreme winds (fastest mile) for the general area based on the 1,4 None NoWinds Frechet distribution are:
3.3.1.1Return Period (yiear) Wind Speed (mi per hr)
2 5110 6150 71
100 76
Fastest mile winds are sustained winds, normalized to 30 ft aboveground andinclude all meteorological ghenomena excegt tornadoes.
RCOL2 19-13 -
19.1-40 1w9.1-4 R w I

Comanche Peak Nuclear Power Plant, Units 3 & 4COL Application
Part 2, FSAR
Table 19.1-205 (Sheet 25 of 34)Comanche Peak, Units 3 and 4 External Events Screening and Site Applicability
CP COL 19.3(4)
Screening and ApplicabilityCategory Event FSAR Section Description
Disposition Criteria(1 ) Freq. (/yr) Site Appl.
Tha docign bacic wind vclecity ic bascd en the data from A.S!ASCE 7 05.
From F!gua 6- 4 1 f A441^SIAC 7 05, the 3 see...d "juct wind cpeed at 33
(41pmA) ab9grnd fer tho, .....P ..t ic •0 ,mph (40 m!,ec). The 3 ccfordgust wind cpeed fer a 1 00 yrroturn peried is mph. The imper.an. fact..
01.15 and the oxpocurG oatcgr,' is C. Wind leadings for thc cito arcdiccucood in S-bccction 3.3.1.
Thic ovant ac not cignificant impact than h-rricanac and tarnadece.The design
wind has a basic speed of 155 mph. corresponding to a 3-second gust at 33 ft
above around for exposure category C (ooen terrain). For all seismic
cateqory I and II SSCs. the basic wind speed is multiplied by an importance
factor of 1.15 correlating to essential facilities in hurricane-prone regions asdefined in ASCE/SEI 7-05 Tables 1-1 and 6-1. Site-specific structures,
systems, and components (SSCs) are designed using the site-specific basicwind speed of 90 mph, or higher. Therefore, the maximum wind soeed by
extreme winds is not areater than the F-scale intensity F1 of tornadoes forCPNPP. Also all seismic category I and II SSCs including fire suppression
systems are designed for the wind load and are not damaged by the extreme
winds. Although only loss of offsite power is the hazardous potential byextreme winds, it is considered as the loss of offsite power (LOOP) event forinternal event PRA as weather-related LOOP.
Thus, extreme winds are insignificant potential hazards (criteria 1 and 4).
RCOL2_19-13
19.1-41 19.-41Re;;imR I

Comanche Peak Nuclear Power Plant, Units 3 & 4COL Application
Part 2, FSAR
Table 19.1-205 (Sheet 26 of 34)Comanche Peak, Units 3 and 4 External Events Screening and Site Applicability
CP COL 19.3(4)
Screening and ApplicabilityCategory Event FSAR Section Description
Disposition Criteria(1 ) Freq. (/yr) Site Appl.
Surface 2.3.2.1.2 Annually, the prevailing surface winds in the region are from the south to 1 None No
Winds southeast while the average wind speed is about 10 mi per hour (mph) based
on-site data from 2001 through 2006. As shown on Figures 2.3-208 through2.3-210, the annual resultant wind vectors for the Dallas Fort Worth Airport,
Mineral Wells, and CPNPP are 149', 138', and 1530, respectively. The
annual average wind speeds for Dallas Fort Worth Airport, Mineral Wells, and
CPNPP are 10.3, 9.0, and 9.8 mi per hour, respectively. In winter there is a
secondary wind direction maximum from the north to northwest due tofrequent outbreaks of polar air masses (Figures 2.3-274 and 2.3-306).
Monthly and seasonal wind roses for the lower level CPNPP data are
provided on Figures 2.3-278 through 2.3-293. On a monthly basis, these
figures show the dominant south south-southeast wind direction. Theseasonal wind rose plots show a significant additional north and
north-northwest component in the winter and fall. The annual wind rose plot
for CPNPP is provided on Figure 2.3-210. Monthly and seasonal wind rosesfor the upper level CPNPP data are provided on Figures 2.3-294 through
2.3-309. On a monthly basis, these figures show the dominant
south-southeast wind direction. The seasonal wind rose plots show that theonly significant north and north-northwest component is in the winter. The
annual wind rose plot for CPNPP is provided on Figure 2.3-310.
Thisz c':nt ic Rnt ci•gnfcant impBct th8A hur;cAco rnd tc8Radocc.Thus
surface winds cannot severely affect the plant because of the insignificant
ootential hazards (criterion 1).
RCOL2_19-13
19.1-42 19.142Rei-lR

Comanche Peak Nuclear Power Plant, Units 3 & 4COL Application
Part 2, FSAR
Table 19.1-205 (Sheet 27 of 34)Comanche Peak, Units 3 and 4 External Events Screening and Site Applicability
CP COL 19.3(4)
Screening and ApplicabilityCategory Event FSAR Section Description
Disposition Criteria(1 ) Freq. (Iyr) Site Appl.
Hydrologic Floods 2.4.2 The maximum flood level at CPNPP Units 3 and 4 is elevation -7-8.793.66 ft 1,32 Nee1j_!.z No
Engineering msl. This elevation would result from a probable maximum precipitation
(PMP) on the Squaw Creek watershed. Coincident wind waves would create
maximum waves of 4.664.59 ft (trough to crest), resulting in a maximum flood
elevation of 7-3.46810.64 ft msl. CPNPP Units 3 and 4 safety-related plant
elevation is 822 ft msl, providing more than 281_1 ft of freeboard under the
worst potential flood considerations.
The Probable Maximum Precipitation (PMP) distributions used as input to the
determination of the Probable Maximum Flood (PMF) for the CPNPP Units 3
and 4 were developed usinq Hydrometeroloqical Report (HMR) 51 and HMR
52.
The PMP distributions were calculated for the followinq scenarios:
* Overall PMP for storm centers within the Squaw Creek watershed
* Overall PMP for storm centers within the Paluxy River watershed
* Souaw Creek Reservoir PMP for storm centers within the SquawCreek watershed.
RCOL2_19-10
RCOL2_19-10
RCOL2_19-10
RCOL2 191-10
19.1-43 R1. 4ReR4

Comanche Peak Nuclear Power Plant, Units 3 & 4COL Application
Part 2, FSAR
Table 19.1-205 (Sheet 28 of 34)Comanche Peak, Units 3 and 4 External Events Screening and Site Applicability
CP COL 19.3(4)
Screening and ApplicabilityCategory Event FSAR Section Description
Disposition Criteria(1 ) Freq. (/yr) Site Appl.
The critical storm center within the Paluxy River watershed (Basin 4) results
in the maximum PMP for the overall watershed (Basins 1. 2. 3 and 4combined) at the confluence of Paluxy River and Souaw Creek. Additionally,
when the storm center was kept in the Sauaw Creek watershed (Basin 1) itresulted in a higher PMP for the Squaw Creek watershed. A hioher PMP for
the Squaw Creek watershed can result in a higher water surface elevation at
CPNPP Units 3 and 4. The PMP for the critical storm center for each basin for
the above mentioned scenarios was analyzed individually to determine theresulting peak runoff and the water surface elevation. No. of PMP Events
The overall frequency of a 6-hour. 25-inch PMP event for the U.S. isdetermined by dividing the number of-events by the duration of the historical
record. The areal frequency of a PMP event is calculated by dividing the U.S.PMP frequency by this total area over which a PMP could occur and
multiplving this amount by the area of a PMP. 10 mi2. Thus the PMP
frequency is:
Duration of stori ecord
S177y. 1-, 2/, 9 6 7 mi2
1.4xl107/yr
RCOL2_19-10
19.1-44 191 44Re-W;OR I

Comanche Peak Nuclear Power Plant, Units 3 & 4COL Application
Part 2, FSAR
Table 19.1-205 (Sheet 29 of 34)Comanche Peak, Units 3 and 4 External Events Screening and Site Applicability
CP COL 19.3(4)
Screening and ApplicabilityCategory Event FSAR Section Description
Disposition Criteria(1 ) Freq. (/yr) Site Appl.
Therefore, the frequency of a PMP of 25 inches over a 10 square mile is
estimated to be 1.4 X 10"7 per year. This is a conservative estimate of thefrequency of the PMP that results in a PMF for CNNPP Units 3 and 4
because additional periods of significant rainfall must also occur in close
temporal proximity to the 25-inch 6-hour rainfall event. Given the calculatedPMF is not proiected to reach the safety-related elevation of the plant
(criterion 1) and the estimated PMP and PMF freguencv of 1.4 X 10:Z/vear.the frequency of a flooding event that would reach the safety-related
elevation of the plant is proiected to be well below 101 per year (criterion 2).
Probable 2.4.3 The probable maximum flood (PMF) was determined for the Squaw Creek 1, 2 Neee< 10-7 No
Maximum watershed and routed through the Squaw Creek Reservoir (SCR) to
Flood determine a water surface elevation of W.B793.66 ft msl. The CPNPP Units
3 and 4 safety-related facilities are located at elevation 822 ft msl. Therefore,PMF on rivers and streams does not present any potential hazards for
CPNPP Units 3 and 4 safety-related facilities.
The PMF and maximum coincident wind wave activity results in a flood
elevation of 8gg,29810.64 ft msl. The top elevation of the retaining wall is896795 ft msl. The CPNPP Units 3 and 4 safety-related structures are
located at elevation 822 ft msl and are unaffected by flood conditions and
coincident wind wave activity.
Thus, the probable maximum flood cannot affect the plant because of the
insignificance of the potential hazards (criterion 1) and the frequency of the
PMP is less than 1 pz oer year (criterion 2).
RCOL2_19-10
RCOL2_19-10
RCOL2_19-10
RCOL2_19-10
RCOL2_19-13
19.1-45 19.-45RevisOR I

Comanche Peak Nuclear Power Plant, Units 3 & 4COL Application
Part 2, FSAR
Table 19.1-205 (Sheet 30 of 34)Comanche Peak, Units 3 and 4 External Events Screening and Site Applicability
CP COL 19.3(4)
Screening and ApplicabilityCategory Event FSAR Section Description
Disposition Criteria(1 ) Freq. (/yr) Site Appl.
The retaining wall is located approximately 555 ft. northeast from the center
point of CPNPP Unit 3 on the slopes of the Squaw Creek Reservoir. Abovethe retaininq wall, a 2:1 (horizontal to vertical) slope continues up to elevation
820 ft. The coincident wind wave activity analysis result is based on the runup on a continuous vertical wall. Comparative analysis for run up on adiacentslopes concludes it is conservative to assume that run uo above the topelevation of the retaining wall rises vertically, because run up evaluated forthe 2:1 slope would result in a lower elevation. It is assumed that the PMFwith coincident wind wave activity elevation of 810.64 ft is applicable to theentire rim of the Squaw Creek Reservoir.
The estimated frequency of a PMF capable of reaching the plant gradeelevation is estimated to be less than 10-7 per year. Consideration of themaximum coincident wind wave activity along vith the PMF would tend tolower the overall freguency.
RCOL2_19-10
19.1-46 19.-46Re~geIQR I

Comanche Peak Nuclear Power Plant, Units 3 & 4COL Application
Part 2, FSAR
Table 19.1-205 (Sheet 31 of 34)Comanche Peak, Units 3 and 4 External Events Screening and Site Applicability
CP COL 19.3(4)
Screening and ApplicabilityCategory Event FSAR Section Description
Disposition Criteria(1 ) Freq. (/yr) Site Appl.
Dam Failures 2.4.4 Thr. a.. Re curfa a.tX..... i^mpo-ndmntc,,t 9tho than .. Mall fo rm p.nd. that 1, 3 None No
cuild ifmpact the SCR. The Gom... farm pnd, ha-. nogligibl Gtfrage .apacity,
and_ a broFach would have no mo-acuroblo offot. Failuro of downctram damc,including SqUaw Cr ..k Dam, would A. t aff.t the GPNP. P Units 3 and 4. The
cFWritc ] Am failuroe eyent iothe assumed domino type failurwe of the HubbardCrook Dam, the ,Morri.. Shoppard Dam and the Do Cordova Bend Dameoenoidon.t W"i'th the PMF.Qualitative analysis considers both existing and
future conditions and is performed based on comparison of distance from the
confluence of the Paluxv River with the Brazos River, reservoir storage, damheight, and drainaae area. Domino-type failures and simultaneous failures'
are postulated when applicable. The qualitative analysis resulted in two
potential scenarios that were evaluated further by quantitative analysis. The
quantitative analysis results in the critical dam failure event of the assumeddomino-type failure of Fort Phantom Hill Dam, the proposed Cedar Ridge
Resevoir, Morris Sheppard Dam, and De Cordova Bend Dam. In addition,Lake Stamford Dam is assumed to fail simultaneous with the Cedar Ridge
Reservoir Dam. Dam failures are assumed coincident with the PMF. The
resulting water surface elevation at the confluence of the Paluxy River and
the Brazos River is 760.71 ft. CPNPP Units 3 and 4 safety-related facilities
are located at elevation 822 ft. There are no safety-related structures thatcould be affected by flooding due to dam failures.
Thus, there are no safety-related structures that could be affected by floodina
due to dam failures (criteria 1 and 3).
RCOL2_19-10
RCOL2_19-13
19.1-47 19.7ReiiR4

Comanche Peak Nuclear Power Plant, Units-3 & 4COL Application
Part 2, FSAR
Table 19.1-205 (Sheet 32 of 34)Comanche Peak, Units 3 and 4 External Events Screening and Site Applicability
CP COL 19.3(4)
Screening and ApplicabilityCategory Event FSAR Section Description
Disposition Criteria(1 ) Freq. (/yr) Site Appl.
Surge and 2.4.5 CPNPP Units 3 and 4 are located approximately 275 mi inland from the Gulf 3 None No
Seiche of Mexico. CPNPP Units 3 and 4 safety-related facilities are located atFlooding elevation 822 ft msl. A surge due to a probable maximum hurricane (PMH)
event would not cause flooding at the site.
SCR does not connect directly with any of the water bodies considered forsuch meteorological events associated with surge and seiche flooding.Because of the inland location and elevation characteristics, CPNPP Units 3
and 4 safety-related facilities are not at risk from surge and seiche flooding.
Thus, suroe and seiche flooding cannot affect the olant because of the
location (criterion 3).
Tsunami 2.4.6 CPNPP Units 3 and 4 are located approximately 275 mi inland from the Gulf 3 None No
Coast. CPNPP Units 3 and 4 safety-related facilities are located at elevation822 ft msl. Because of their inland location and elevation, CPNPP Units 3 and
4 safety related facilities would not be at risk from tsunami flooding.-
Thus, tsunami cannot affect the plant because of the safe distance (criterion
RCOL2_19-13
RCOL2_19-13
19.1-48 RevisieR.4

Comanche Peak Nuclear Power Plant, Units 3 & 4COL Application
Part 2, FSAR
Table 19.1-205 (Sheet 33 of 34)Comanche Peak, Units 3 and 4 External Events Screening and Site Applicability
CP COL 19.3(4)
Screening and ApplicabilityCategory Event FSAR Section Description
Disposition Criteria(1 ) Freq. (/yr) Site Appl.
Ice Effects 2.4.7 The USACE ice jam database reports that Brazos River was obstructed by 3 None Norough ice at Rainbow near Glen Rose, Texas, on January 22-23 and January
25-28, 1940, with flood stage of 20 ft. CPNPP Units 3 and 4 safety-related
facilities are located at elevation 822 ft msl. The SCR spillway elevation is775 ft ms!. The maximum water surface elevation during a probable
maximum flood event is at 7-88.9793.66 ft msl, which is more than ,28 ft
below the CPNPP Units 3 and 4 safety-related facilities. The possibility ofinundating CPNPP Units 3 and 4 safety-related facilities due to an ice jam is
remote.
The climate and operation of SCR prevent any significant icing on the Squaw
Creek. There are no safety related facilities that could be affected by iceinduced low flow.
Thus, ice effects cannot affect the olant because of the location (criterion 3).
Cooling 2.4.8 There are no current or proposed safety-related cooling water canals or 3 None No
Water Canals reservoirs required for CPNPP Units 3 and 4. The ultimate heat sink (UHS) is
and part of the essential (sometimes called emergency) service water system
Resevoirs (ESWS). The UHS does not rely on cooling water canals or reservoirs and isnot dependent on a stream, river, estuary, lake, or ocean (criterion 3).
Channel 2.4.9 There is no evidence suggesting there have been significant historical 3 None No
Diversions diversions or realignments of Squaw Creek or the Brazos River. Thetopography does not suggest potential diversions. The streams and rivers in
the region are characterized by traditional shaped valleys with no steep,
unstable side slopes that could contribute to landslide cutoffs or diversions.
There is no evidence of ice-induced channel diversion.
RCOL2_1 9
- 10
RCOL2 19-13 -
RCOL2_I 9-13
19.1-49 RevosieR-

Comanche Peak Nuclear Power Plant, Units 3 & 4COL Application
Part 2, FSAR
Table 19.1-205 (Sheet 34 of 34)Comanche Peak, Units 3 and 4 External Events Screening and Site Applicability
CP COL 19.3(4)
Screening and ApplicabilityCategory Event FSAR Section Description
'Disposition Criteria(1 ) Freq. (/yr) Site Appl.
The UHS is part of the ESWS. Each unit's ESWS consists of four wetmechanical draft cooling towers, each providing 50 percent cooling capacity.Therefore, channel diversion can not adversely affect CPNPP Units 3 and 4
safety-related structures or systems (criterion 3).
Low Water 2.4.11 There are no safety-related facilities that could be affected by low-flow or 3 None No
drought conditions, since the UHS does not rely on the rivers and streams as
a source of water (criterion 3).
Groundwater 2.4.12 Groundwater is not used as an operational or safety-related source of water 3 None No
for CPNPP Units 3 and 4. CPNPP Units 3 and 4 are to be constructed on theGlen Rose Formation. According to the Design Control Document (DCD) forthe US-APWR, the design maximum groundwater elevation is 1 ft below plantgrade. The CPNPP plant grade elevation is 822 ft msl; therefore,:the design
maximum groundwater elevation is 821 ft msl relative to the current elevation
of the Glen Rose Formation.
Thus, ground water cannot affect the plant because of its location (criterion3_).
RCOL2g19-13
RCa L2 19
SRCOL2_19-13
NOTES
(1) Screening criteria categories'1" Lower damage potential than a design basis event"2" Lower event frequency of occurrence than another event"3" Cannot occur close enough to the plant to have an affect"4" Included in the definition of another event"5" Sufficient time to eliminate the threat or to provide an adequate response
19.1-50 Rev*rieR4