Embed Size (px)
Citation preview
Final Version April 2016 Page 1
LPIC Project, Sohar, Oman
Social Baseline
1 INTRODUCTION
As part of the LPIC Project, Orpic is engaged with investors who are seeking compliance with international standards, in particular Environmental and Social Performance Standards in the 2012 version of the IFC Sustainability Framework and Equator Principles III. Compliance with Standards, policies and guidance documents requires that a robust socio-economic baseline is in place. An analysis of the socio-economic situation and possible outcomes is then reflected in the Social Monitoring Plan. Orpic prepared a series of EIA reports for each component of the LPIC Project in 2015 and a suite of supplementary documents, including a separate Social Impact Assessment (SIA) in 2016. These documents were reviewed and approved by the Investors. Omani EIA legislation does not require the collection and analysis of a socio-economic baseline for development projects. While a number of EIA and resultant reports have been carried out in the Sohar area and approved by the Ministry of Environment and Climate Affairs (MECA), these reports do not contain detailed social baseline data and only refer to anecdotal information, which is often outdated. To comply with the investors’ requirements and policies, a socio-economic survey was carried out by the Orpic Team with the following objectives, to:
Obtain an understanding of the potential impact of the LPIC Project on local communities in the study area
Learn about the communities’ attitude towards, and expectations from, the LPIC Project, and
Create a socio-economic baseline against which can be measured in the future and to ensure that mitigation measures are adequate.
This document briefly describes the survey methodology and focuses on an analysis of the survey results which form the social baseline in the project area.
Final Version April 2016 Page 2
2 METHODOLOGY AND IMPLEMENTATION OF THE SURVEY
2.1 Questionnaires
In January 2016, Orpic was advised by the Lenders to collect social baseline data to enable the company to monitor the project’s future social performance. Local specialists advised Orpic to use a questionnaire which was focussing more on the qualitative data collection, and this survey (further called the “first survey”) was carried out in late January 2016. Based on the Orpic’s feedback1, the implementation of the first survey presented the Orpic team with the following challenges:
The first survey questionnaire contained questions which required significant amount of respondents’ time to answer them. As a result, some of them tried to give quick answers to bring the lengthy interview to an end, and
The first questionnaire had a significant number of open questions, and the surveyors had to spend additional time to provide explanations to recipients in order to obtain answers.
In addition, local households in the project area do not have experience of participating in surveys organised by non-governmental entities. Based on international experience of conducting similar socio-economic surveys, these situations – coupled with an inappropriate questionnaire – often could lead to meaningless answers or respondents feeling overwhelmed by a lengthy interview, which was the case during the first social survey. To address the challenges met during the first social survey and to ensure the quality of social baseline, an enhanced, two-page and concise questionnaire was prepared for the second social survey. It focussed on both quantitative and qualitative data and also on two main and interrelated aspects: socio-economics and health. This “second” questionnaire was designed to be coded for easier analysis of the collected data, and included questions on:
Demographic profile (e.g. age, gender, family structure);
Occupational profile, employment and income sources and expenditure;
Education (all levels);
Asset ownership (including agricultural and residential plots, cars, household technology);
Health data, and
Concerns and expectations related to the Project. A copy of the “second” questionnaire is presented in Annex 1.
2.2 Targeting Respondents and Second Survey Implementation
The Orpic survey team armed with a different questionnaire also changed the implementation methodology. This led to an overall improvement in the response rate and quality of responses.
1 Orpic Correspondence dated 14 March 2016
Final Version April 2016 Page 3
During the second survey, the targeted communities were interviewed during working hours and also in the evenings, to ensure that various groups of respondents are available for the second survey, and also to avoid potential survey fatigue among the communities. Schools, hospitals, different governmental offices, supermarkets, clubs, mosques and garden centres were all visited during the second survey. To ensure wider gender participation and to capture the views of housewives and other groups, including those who confirmed that they cannot write or read, a few households were visited separately in different villages. Separate local women’s groups (typically gathering for wider family occasions) were also targeted around the Majlis and mosques areas (on women’s visiting days). Oman Women Association was also involved in the second survey, to ensure participation of women from all educational backgrounds. Those respondents, who were illiterate, were assisted by the surveyors writing down the respondents’ verbal answers. To address some respondents’ sensitivity about answering personal questions (e,g, on income sources, salaries, land ownership), a short introduction about the purpose of the survey was given to all groups before inviting them to take part in the survey. The short introduction covered some details about the LPIC project and expected dates of construction and commissioning. This introduction was useful in securing a good response rate and contributed to positive engagement with the local communities and robust social baseline methodology and approach. The immediate project area extends to the Sohar, Shinas, Liwa and Saham wilayats in the Al Batinah North Governorate. The target respondents for the second socio-economic questionnaire were from 31 villages and settlements covered by the four wilayats (see Annex 2 for a list of villages and settlements’ names). The Orpic survey team was represented by both men and women to ensure a gender-balanced approach to the survey. The second survey took place throughout February 2016. In total, close to 390 people were approached to complete the questionnaire. Approximately 100 people declined to take part in the second survey and at the end 289 completed questionnaires were obtained by Orpic (response rate of 74%) and translated into English. The “raw” data obtained during the second survey, was first checked for quality and uploaded into the Excel spreadsheet which was later analysed by the social team at Royal HaskoningDHV.
3 LIMITATIONS OF THE SURVEY
A socio-economic baseline survey for projects being developed to international standards to satisfy lender’s requirements is rare in Oman, which could be one of the reasons why nearly 26% of the people approached during the second survey declined to answer the questionnaire. However, the vast majority who agreed to participate (74%), diligently answered most, if not all the questions. This magnitude of response can be considered a success and the information provides an invaluable and rare insight into the socio-economic and social activities of daily life in the project area.
Final Version April 2016 Page 4
There are a number of potential limitations related to the second survey, including:
It is possible that the respondents (within the four targeted wilayats) are not necessarily 100% representative of all local residents who might be affected by the Project;
An estimate of the total population in the four wilayats located in the immediate project area is approximately 420,000. On average, a typical household consists of eight people2. There are over 52,000 households in the project area. With 289 completed questionnaires (one respondent representing one household) the survey represents a relatively small sample of this population. Extrapolation of the findings can be applied for the wider project area, but conclusions must be drawn with caution.
Some respondents raised issues and concerns about historical pollution in the wider area, associated with previous industrial and infrastructure development. These local residents will associate any new projects along with previous developments and as a consequence, will expect only adverse impacts and negative connotations. Thus, the data about people’s concerns with potential pollution levels as a result of the LPIC Project could be affected by historic impacts from other developments.
4 GENERAL POPULATION PROFILE AT THE NATIONAL LEVEL
According to the results of a recent study called “Families in the Sultanate of Oman and Their Social and Economic Characteristics”3, the majority of households in the Sultanate are headed by men (over 92%), while 8% of households are headed by women. The average size of a typical household in Oman is 8 people, and the average age of the head of the households is 43. The age distribution of the heads of households in the Sultanate shows that 13% of them are under thirty years old, 30.6% belong to the 30-39 age group and 25.5% fall under the 40-49 age category. In other words, 69% of heads of households in the Sultanate are under 50 years old. At the national level, 9.5% of household heads in urban areas hold a diploma compared to 3.6% in the villages. The educational status also varies according to the place of residence. Based on the national data, around 30.5% of the household heads residing in rural areas and villages are illiterate, compared to 13.6% in urban areas. The national data indicated that 97.3% of households in the Sultanate have mobile phones and 96.5% have television sets. However, a significant number of households do not have a computer. Based on the 2015 survey, 59.6% of households do not have Internet connections and 75.9% do not have fixed lines phones, while car ownership among Omani households stood at 90%.
2 National 2010 Census data
3 The survey was carried out by the National Centre for Statistics and Information (NCSI) and published 06 July
2015 in the Times of Oman
Final Version April 2016 Page 5
In 2014, the average monthly household income in the Sultanate of Oman rose to 1,172.00 Omani Riyal (OR) (or $3,044)4, according to a report by the National Centre for Statistics and Information (NSCI)5. In 2014, the Muscat governorate recorded the highest average household income of 1,459.00 OR per month with a monthly household spend averaging at 930.00 OR. Based on the 2014 Oman Health Strategy prepared by the World Health Organisation (WHO)6, Oman has made notable progress in: reaching near universal education (including gender equity); reducing child and maternal mortality; reducing incidence of malaria; and tuberculosis and ensuring access to essential medicines. At the same time, non-communicable diseases and injuries are among the leading causes of mortality and morbidity in the country. Rapid lifestyle changes contribute to less healthy dietary habits, where the situation is often exacerbated by limited physical activity, the spread of tobacco use, as well as risky behaviours such as unsafe driving (e.g. speeding)7. Based on the assessment of the amount of exercise and physical activity in the country8, two particular diseases – type II diabetes and cardiovascular disease present a major public health challenge. The health assessment results demonstrate that among adults 33% of men and 41% of women do not regularly engage in physical exercise. The lack of physical activities is even higher among younger people who are studying in colleges and universities: 43% of young men and 57.8% of young women in the Sultanate of Oman do not exercise.
5 ORPIC SOCIO-ECONOMIC SURVEY RESULTS AND ANALYSIS
5.1 Gender and Age
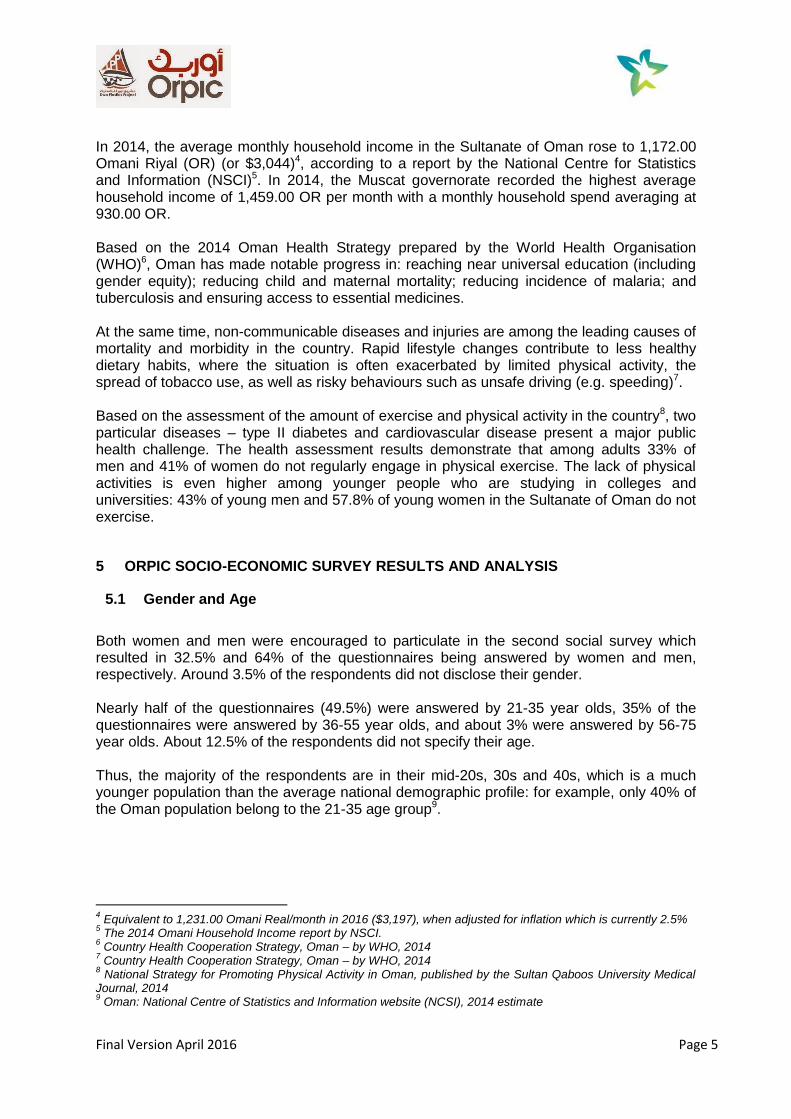
Both women and men were encouraged to particulate in the second social survey which resulted in 32.5% and 64% of the questionnaires being answered by women and men, respectively. Around 3.5% of the respondents did not disclose their gender. Nearly half of the questionnaires (49.5%) were answered by 21-35 year olds, 35% of the questionnaires were answered by 36-55 year olds, and about 3% were answered by 56-75 year olds. About 12.5% of the respondents did not specify their age. Thus, the majority of the respondents are in their mid-20s, 30s and 40s, which is a much younger population than the average national demographic profile: for example, only 40% of the Oman population belong to the 21-35 age group9.
4 Equivalent to 1,231.00 Omani Real/month in 2016 ($3,197), when adjusted for inflation which is currently 2.5%
5 The 2014 Omani Household Income report by NSCI.
6 Country Health Cooperation Strategy, Oman – by WHO, 2014
7 Country Health Cooperation Strategy, Oman – by WHO, 2014
8 National Strategy for Promoting Physical Activity in Oman, published by the Sultan Qaboos University Medical
Journal, 2014 9 Oman: National Centre of Statistics and Information website (NCSI), 2014 estimate
Final Version April 2016 Page 6
Figure 1: Respondents’ age and gender
182 respondents confirmed that they are married (i.e. over 62%). The percentage of married respondents might appear to be low, however, this could be explained by the fact that the surveyed cohort of people is relatively young and some of them are not married yet. Based on the 2010 National Census data, the average first age of marriage in the Sultanate (both among men and women) is gradually increasing, and currently stands at 28.
5.2 Education
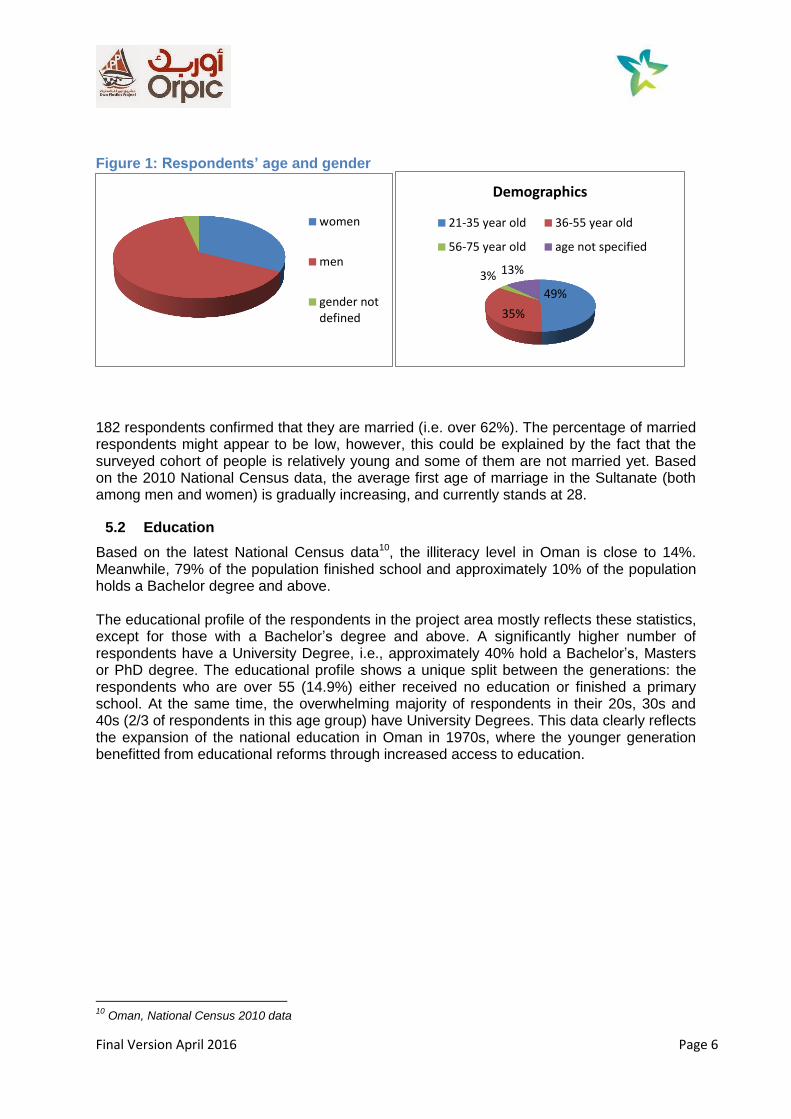
Based on the latest National Census data10, the illiteracy level in Oman is close to 14%. Meanwhile, 79% of the population finished school and approximately 10% of the population holds a Bachelor degree and above. The educational profile of the respondents in the project area mostly reflects these statistics, except for those with a Bachelor’s degree and above. A significantly higher number of respondents have a University Degree, i.e., approximately 40% hold a Bachelor’s, Masters or PhD degree. The educational profile shows a unique split between the generations: the respondents who are over 55 (14.9%) either received no education or finished a primary school. At the same time, the overwhelming majority of respondents in their 20s, 30s and 40s (2/3 of respondents in this age group) have University Degrees. This data clearly reflects the expansion of the national education in Oman in 1970s, where the younger generation benefitted from educational reforms through increased access to education.
10
Oman, National Census 2010 data
women
men
gender notdefined
49%
35%
3% 13%
Demographics
21-35 year old 36-55 year old
56-75 year old age not specified
Final Version April 2016 Page 7
Figure 2: Respondents’ Education
5.3 Employment
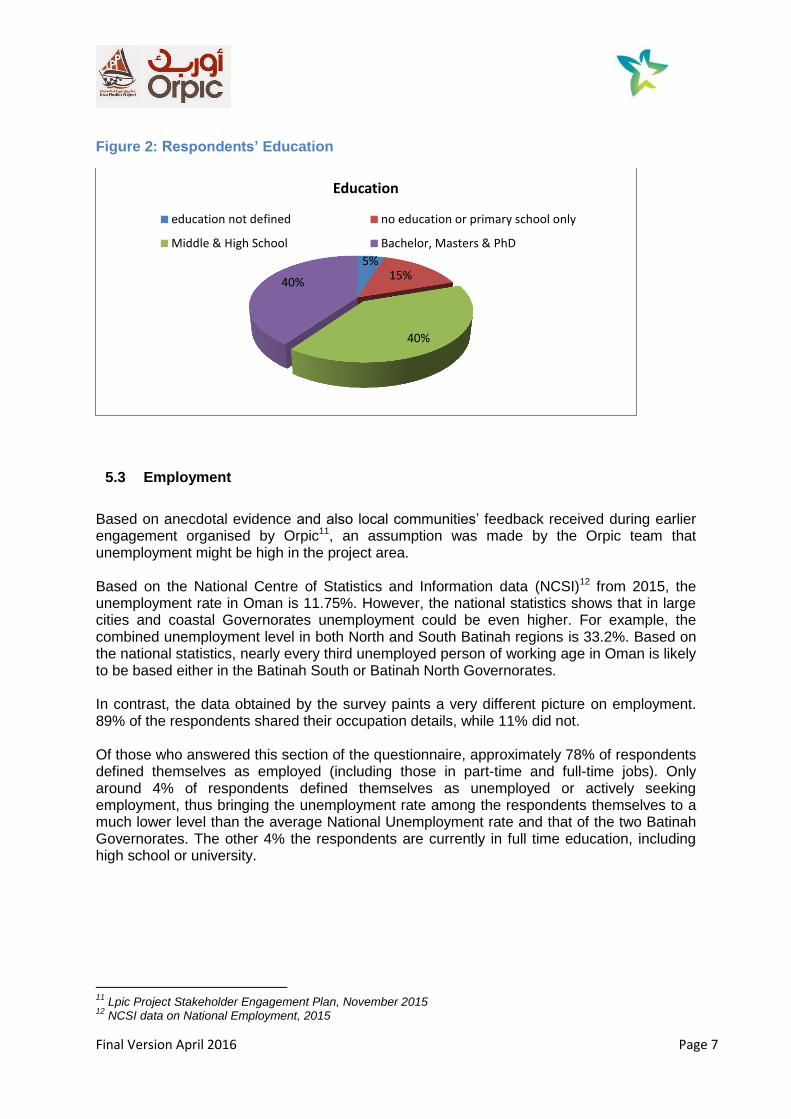
Based on anecdotal evidence and also local communities’ feedback received during earlier engagement organised by Orpic11, an assumption was made by the Orpic team that unemployment might be high in the project area. Based on the National Centre of Statistics and Information data (NCSI)12 from 2015, the unemployment rate in Oman is 11.75%. However, the national statistics shows that in large cities and coastal Governorates unemployment could be even higher. For example, the combined unemployment level in both North and South Batinah regions is 33.2%. Based on the national statistics, nearly every third unemployed person of working age in Oman is likely to be based either in the Batinah South or Batinah North Governorates. In contrast, the data obtained by the survey paints a very different picture on employment. 89% of the respondents shared their occupation details, while 11% did not. Of those who answered this section of the questionnaire, approximately 78% of respondents defined themselves as employed (including those in part-time and full-time jobs). Only around 4% of respondents defined themselves as unemployed or actively seeking employment, thus bringing the unemployment rate among the respondents themselves to a much lower level than the average National Unemployment rate and that of the two Batinah Governorates. The other 4% the respondents are currently in full time education, including high school or university.
11
Lpic Project Stakeholder Engagement Plan, November 2015 12
NCSI data on National Employment, 2015
5% 15%
40%
40%
Education
education not defined no education or primary school only
Middle & High School Bachelor, Masters & PhD
Final Version April 2016 Page 8
Figure 3: Data on Respondents’ Occupation
Such high employment rate amongst the respondents is backed by the relatively high number of interviewees with University Degrees, who are expected to be in demand in the Omani labour market. 72% of employed respondents hold jobs in the public sector and often work in Ministries and government departments as teachers, policemen, nurses, guards, etc. 28% of those who are employed, work in the private sector or have a business of their own. Even though most respondents themselves are in employment, 23% of them have at least one person in their household who is actively looking for a job. In other words, nearly every fourth household in the project area could have a job seeker in their family who will be expecting an increase in direct and indirect job opportunities resulting from the Project.
5.4 Asset Ownership
The wider project area and particularly the surveyed area are encompassed by the developed and mostly industrial land, whereas the agricultural land is scarce. This predominant developed/industrial land use thus creates more opportunities for investments in residential or commercial property as opposed to buying and cultivating the land for agricultural purposes. As a result, over 78% of surveyed households tend to own at least one residential property (i.e. a house and an adjacent plot which is typically not used for agricultural activities), and close to 39% of respondents confirmed that their family owns an agricultural plot. In some instances, the respondents indicated that their families own a residential property and an agricultural plot. As some respondents came from the Liwa area, some of them belonged to the group of local residents who could be relocated to the “New Liwa City” development, according to the 2013 Royal Degree (RD 52/2013). The Decree details the official Royal decision for the
in full time education
4% occupation not
defined 11%
in employment 78%
Other occupation (retired, housewife,
etc) 3%
Job seeking 4%
Occupation status
Final Version April 2016 Page 9
establishment of the New Liwa City Project, which involves relocating local residents nearest to SIPA and the Sohar Free Zone to reduce negative impacts on the Liwa local communities. As of March 2016, the decision on where the households will be moved to has not been officially announced. Based on the comments received from the respondents currently residing in Liwa, it is clear that most of them view the resettlement as a positive development, particularly as they will continue to own their existing plots and will be able to lease them to businesses in SIPA and the Sohar Free Zone area, thus generating an additional income for their families. Over 68% of the respondents confirmed that there is no landline in their households and nearly 39% of respondents do not have an access to the internet at home. However, the internet is typically accessed via mobile or smart phones, particularly by people in their 20s and 30s. Car ownership in the surveyed households is 95% which is higher than the national car ownership at 90%.
5.5 Household Income and Expenses
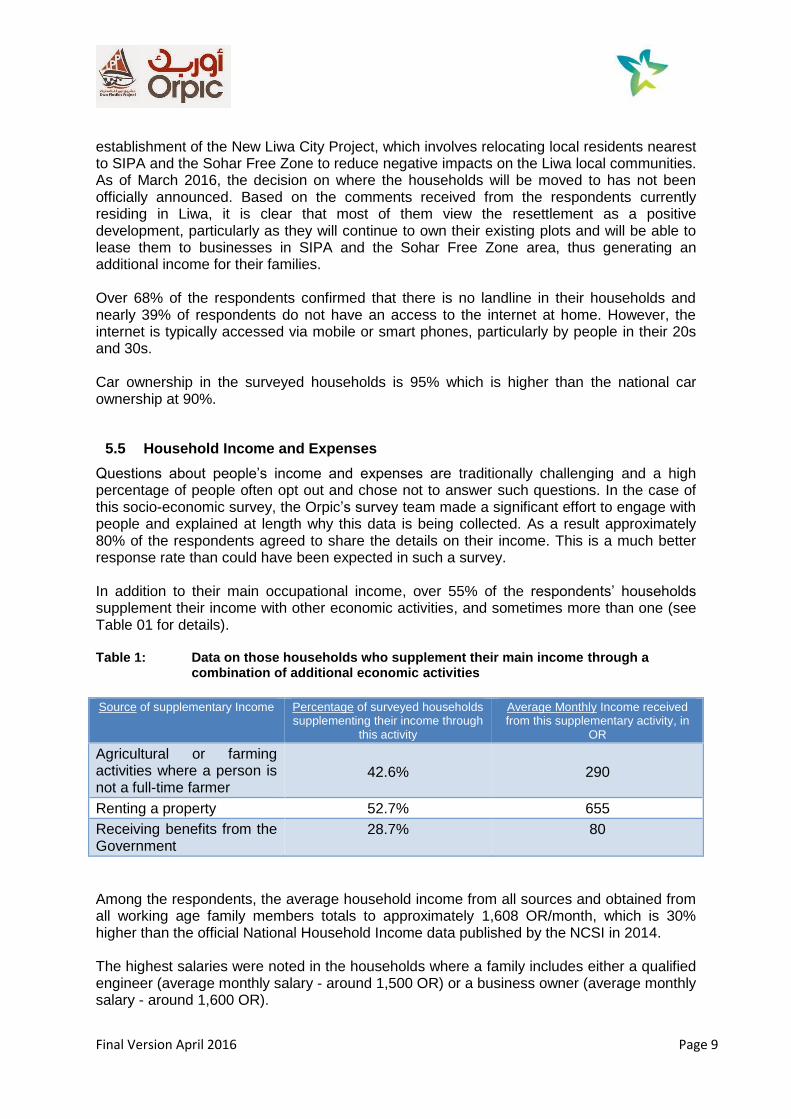
Questions about people’s income and expenses are traditionally challenging and a high percentage of people often opt out and chose not to answer such questions. In the case of this socio-economic survey, the Orpic’s survey team made a significant effort to engage with people and explained at length why this data is being collected. As a result approximately 80% of the respondents agreed to share the details on their income. This is a much better response rate than could have been expected in such a survey. In addition to their main occupational income, over 55% of the respondents’ households supplement their income with other economic activities, and sometimes more than one (see Table 01 for details). Table 1: Data on those households who supplement their main income through a combination of additional economic activities
Source of supplementary Income Percentage of surveyed households
supplementing their income through this activity
Average Monthly Income received from this supplementary activity, in
OR
Agricultural or farming activities where a person is not a full-time farmer
42.6%
290
Renting a property 52.7% 655
Receiving benefits from the Government
28.7% 80
Among the respondents, the average household income from all sources and obtained from all working age family members totals to approximately 1,608 OR/month, which is 30% higher than the official National Household Income data published by the NCSI in 2014. The highest salaries were noted in the households where a family includes either a qualified engineer (average monthly salary - around 1,500 OR) or a business owner (average monthly salary - around 1,600 OR).
Final Version April 2016 Page 10
When asked about their monthly expenditures, approximately 10% of people did not share this information. Out of those who provided their monthly expenditure details, unsurprisingly, 81% of people confirmed that the first and most important expenditure item was buying food for their household. Tuition and education-related costs were the second most important expenditure for 24% of the surveyed households. This reinforces the educational aspirations of the respondents in their 30s and 40s, as after having benefitted from the 1970 National Education Reforms, they are now willing to spend money on the next generation’s education. The average monthly expenditure for education or tuition was 240 OR among the surveyed households. Health and health-related costs were the third most important monthly expenditure among the respondents. Approximately 12% of respondents regularly spend on average 180 OR/month on health-related expenses.
6 HEALTH SITUATION
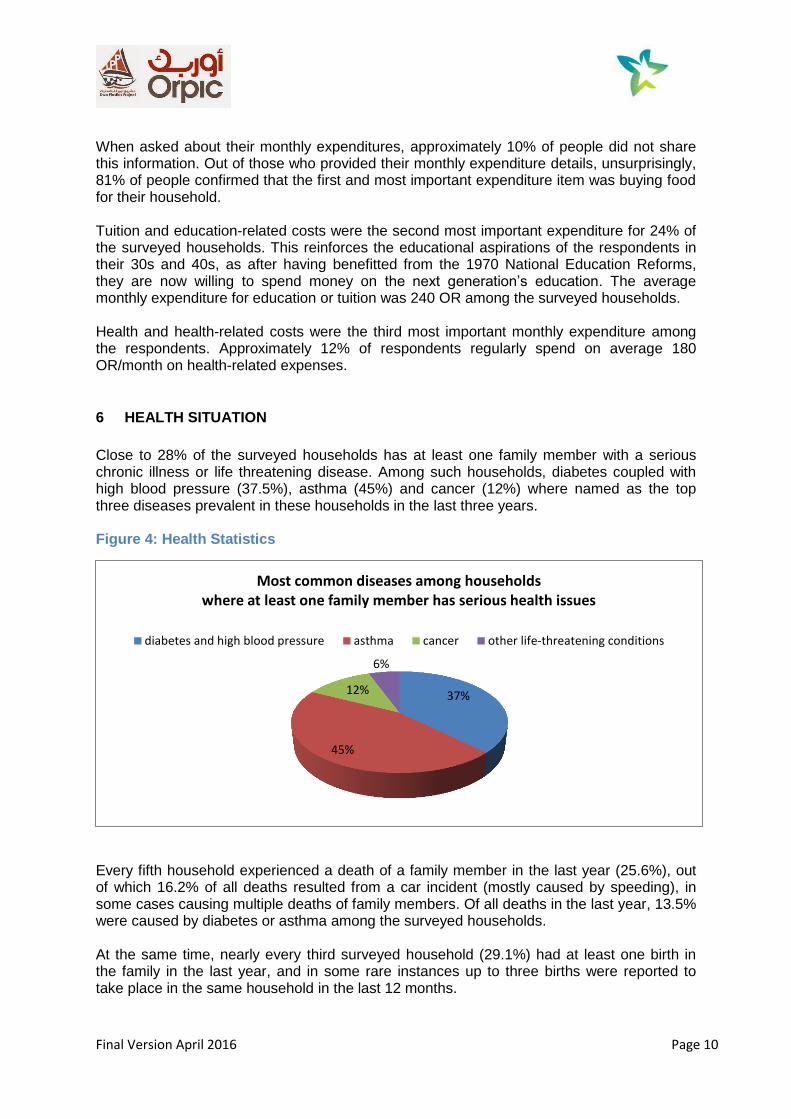
Close to 28% of the surveyed households has at least one family member with a serious chronic illness or life threatening disease. Among such households, diabetes coupled with high blood pressure (37.5%), asthma (45%) and cancer (12%) where named as the top three diseases prevalent in these households in the last three years. Figure 4: Health Statistics
Every fifth household experienced a death of a family member in the last year (25.6%), out of which 16.2% of all deaths resulted from a car incident (mostly caused by speeding), in some cases causing multiple deaths of family members. Of all deaths in the last year, 13.5% were caused by diabetes or asthma among the surveyed households. At the same time, nearly every third surveyed household (29.1%) had at least one birth in the family in the last year, and in some rare instances up to three births were reported to take place in the same household in the last 12 months.
37%
45%
12%
6%
Most common diseases among households where at least one family member has serious health issues
diabetes and high blood pressure asthma cancer other life-threatening conditions
Final Version April 2016 Page 11
7 EXPECTATIONS OF THE PROJECT
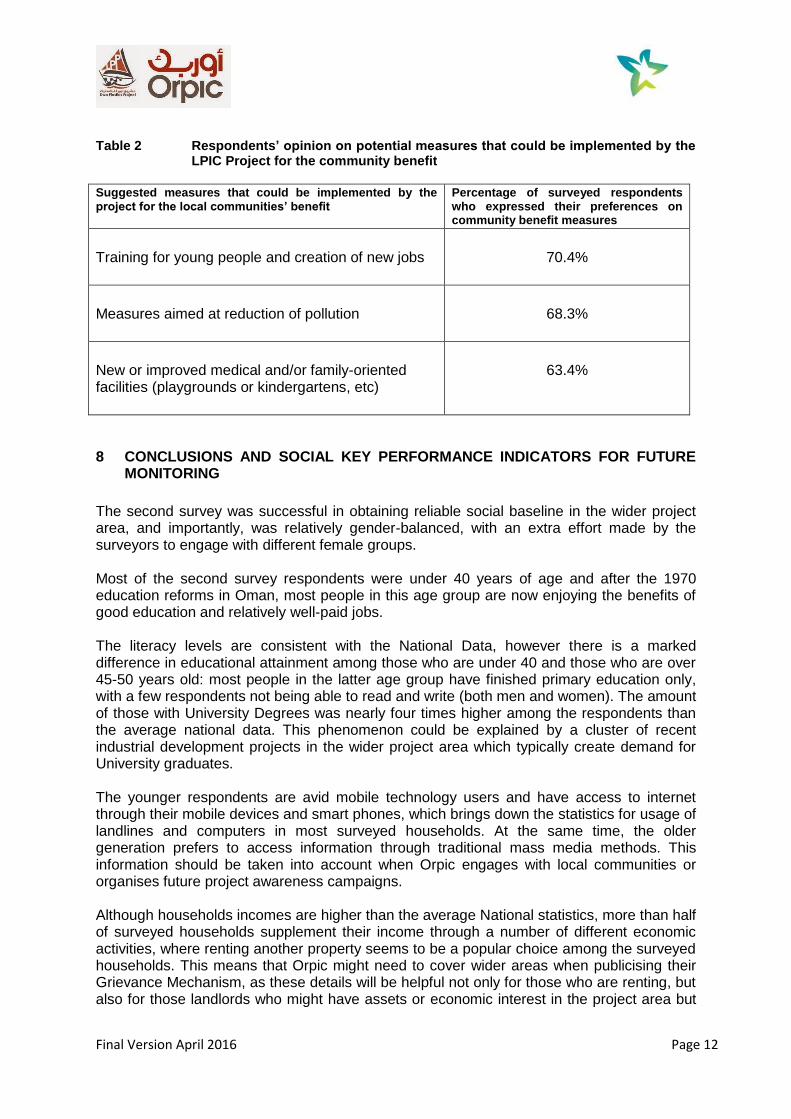
Omani EIA legislation and guidance stipulates that public consultations must take place during the EIA process, however, it is not clear to what extent and how the local communities were consulted in the past especially about the potential cumulative impact of a number of developments in their area, some of which are taking place in parallel. It should be noted that typically, consultations with local communities and awareness raising on new development by the responsible authorities is rather weak in the area. As the communities are not always able to separate one ongoing development/project from another (and some of them in the wider project area are indeed, connected), any mistakes or incidents on a “non-Orpic” project could contribute to creating an unjustifiably negative perception of the LPIC Project itself. To address this issue, for the last few years the LPIC senior management significantly strengthened their engagement with the communities in the area. The EIA report prepared for the Project in 2015 was recently disclosed on the Orpic’s website, but it is not clear if the information available on the website was widely publicised among local communities. Perhaps for this reason, over 39% of the respondents were unaware of the project. Out of those respondents who were aware about the Project, over 69% stated that they have a positive attitude towards the project, over 16% have a negative attitude and 14% were neutral. Those who support the Project explained that they feel positive about it because they expect Orpic to provide new jobs in the area. Among those respondents who do not support the development, 51% said that potential pollution is their main concern, while another 25% said that they are worried about potential influx of workers in the area. The respondents were also asked to create a ”wish list” of three key measures that could be implemented by the LPIC Project for the benefit of a wider community (as opposed to their family or friends only). An overwhelming majority of the respondents (70.4%) said that Orpic’s contribution to the training for young people and new jobs in the area would be on the top of their wish list. On a par in terms of magnitude of responses, over 68% of the respondents raised the reduction of pollution as their second preference. Measures aimed at creation of new (or improved) medical and/or public facilities would be the third priority for 63% of the respondents (see Table 2 below).
Final Version April 2016 Page 12
Table 2 Respondents’ opinion on potential measures that could be implemented by the LPIC Project for the community benefit
Suggested measures that could be implemented by the project for the local communities’ benefit
Percentage of surveyed respondents who expressed their preferences on community benefit measures
Training for young people and creation of new jobs
70.4%
Measures aimed at reduction of pollution
68.3%
New or improved medical and/or family-oriented facilities (playgrounds or kindergartens, etc)
63.4%
8 CONCLUSIONS AND SOCIAL KEY PERFORMANCE INDICATORS FOR FUTURE MONITORING
The second survey was successful in obtaining reliable social baseline in the wider project area, and importantly, was relatively gender-balanced, with an extra effort made by the surveyors to engage with different female groups. Most of the second survey respondents were under 40 years of age and after the 1970 education reforms in Oman, most people in this age group are now enjoying the benefits of good education and relatively well-paid jobs. The literacy levels are consistent with the National Data, however there is a marked difference in educational attainment among those who are under 40 and those who are over 45-50 years old: most people in the latter age group have finished primary education only, with a few respondents not being able to read and write (both men and women). The amount of those with University Degrees was nearly four times higher among the respondents than the average national data. This phenomenon could be explained by a cluster of recent industrial development projects in the wider project area which typically create demand for University graduates. The younger respondents are avid mobile technology users and have access to internet through their mobile devices and smart phones, which brings down the statistics for usage of landlines and computers in most surveyed households. At the same time, the older generation prefers to access information through traditional mass media methods. This information should be taken into account when Orpic engages with local communities or organises future project awareness campaigns. Although households incomes are higher than the average National statistics, more than half of surveyed households supplement their income through a number of different economic activities, where renting another property seems to be a popular choice among the surveyed households. This means that Orpic might need to cover wider areas when publicising their Grievance Mechanism, as these details will be helpful not only for those who are renting, but also for those landlords who might have assets or economic interest in the project area but
Final Version April 2016 Page 13
live elsewhere. If the Grievance Mechanism contact details are widely publicised, this group of people will be able to access Grievance Mechanism via their mobiles and/or the Orpic’s website. Although the employment level among the respondents themselves is relatively high, a quarter of the surveyed households have at least one job seeker in their family of a working age. This is a relatively high percentage of people looking for jobs, which might create high expectations among local communities about the amount of new jobs that can be created by the Project. The survey did not obtain the details on the educational background of those family members who are seeking jobs, so it can be safely assumed that the educational background of these people will be varied. To manage the new employment expectations among local communities, Orpic is advised to consider and devise an employment strategy related to the Project implementation and make provisions for all levels of educational attainment and age groups. Above all, a well-designed LPIC Project employment strategy listing the required skills should be transparent and ultimately, published (when finalised) on the Orpic’s website, which will be vital for the communities’ expectations management. The indication of the average monthly salary among qualified engineers in the Project area will help Orpic during their future employment campaign and when adjusting the salaries to attract and retain new engineering talent among local communities. At the same time, this data must be used with caution: not all Engineering Degrees warrant the same high salary. The health data collected from the respondents provides a useful insight for Orpic. Although diabetes and high blood pressure in the Project area are clearly outside of the Project’s control, Orpic’s extra effort in managing HSE issues, project-related air emissions and awareness raising among Orpic’s and subcontractor’s employees about safe driving, will help the company to develop positive and sustainable relationship with the local communities. Slightly higher car ownership among the surveyed households when compared to the average national car ownership level, and a very high number of deaths in the Project area associated with car accidents, demands a particular attention. This issue must be taken into consideration when designing an overall Traffic Management Plan for the project area and also all LPIC project facilities. It is worth noting that the Sultanate of Oman has the third highest traffic-related death rate among all Gulf Countries (after Jordan and Saudi Arabia)13. The reliance on state benefits is often used as a proxy to assess the vulnerability levels14 among local communities. However, 15% of the surveyed households who receive state benefits could also include households receiving child benefits. This is consistent with the relatively high number of new births among the respondents’ families. With regards to the older respondents, most of people in the “over 50” age category live with their immediate families or children and therefore are looked after by a number of relatives. Extrapolating the survey results on the whole Project area, and adjusting for the generational relationship and high number of new mothers among those who receive state benefit, it is safe to assume that the Project area does not have a high number of vulnerable individuals. Orpic has engaged with local communities in the past and the details on engagement with general public can be found in the Stakeholder Engagement Plan (SEP) which was prepared in 2015 and accepted by the Lenders. However, nearly 40% of the respondents (including
13
WHO data, 2015 14
Vulnerable people are defined as those who by virtue of social origin, age, health, property ownership, birth or other status may be more adversely affected by the development than other groups of people.
Final Version April 2016 Page 14
young people with a wide access to the internet and mass media) were not aware about the project until the survey. This means that Orpic will need to monitor the project awareness levels among local communities to see if the stakeholder engagement strategy is efficient and whether it needs to be scaled up in the future. Importantly, the survey provided a valuable insight into the project-related concerns and worries among local communities. Based on the survey results, the surveyed households are concerned about: (1) air emissions and pollution that will be generated by the project, and (2) how the influx of workers will be managed by the project. These issues are as important as the respondents’ expectations about the (3) creation of new jobs and (4) training to be provided for young adults in the project area. These four main social “themes” identified in the second social survey, will be incorporated into the Social Management Plan, monitored by Orpic throughout the project life-cycle and reported to the Lenders.
Final Version April 2016 Page 15
ANNEX 1 Copy of Main (i.e. second) Socio-economic Questionnaire (original was in Arabic)

Socio-Economic Questionnaire to collect Social Baseline
SECTION 1, General Details
1. Address/Location details of the surveyed Household (HH): _______________ 2. Village: ________________
3. Full name of the head of the HH: __________________________________________________________________
4. Telephone number/mobile and email (if necessary for future correspondence):
_______________________________________________________________________________________
5. HH Composition
1 (Head of HH) 2nd
member 3d member 4th member 5
th member
Relationship to HH Head - See codes below
N/A
Age
Gender (M/F)
Primary occupation See codes below
Educational level See codes below
Relationship to Household Head: 1: Spouse 2: Son or Daughter 3: Father or Mother 4: Brother or Sister 5:Other
Primary Occupation: 1. Farmer 2. Pensioner 3. Unemployed 4. Civil Servant 5. Business/Trade) 6. Other
Educational Level: 1. Primary 2. Secondary 3. Technical Diploma 4. Higher (univ/institute) 5. None (primary not completed)
6. Does your HH own one
or several of the following
items (Yes=1, No=0)
7. What is your most important item of expenditures? ____________________________________________________
1. Food 2. Housing 3. Schooling or university expenses 4. Utilities 5. Health 6. Business Expenditures 7.Other
8. How much on average do you spend monthly on these items (in Omani Rial/OR)?
______________________________________________________________________________________
SECTION 2, Land and other Assets 9. Agricultural Plots
Location (Village)
Surface, m2
Ownership status: (Owner/Co- Owner/Tenant/CO- Tenant/License-used)
Agricultural Use (Crops typically grown)
O CO T/COT L
O CO T/COT L
10. Houses or Structures
Location (Village)
Construction type: Permanent /
Not Permanent)
Ownership Status: (Owner/ Co-Owner/Tenant)
Condition
P NP O CO T/COT
P NP O CO T/COT
Colour TV Satellite Dish Telephone Mobile phone Internet Radio
Personal computer Washing machine Refrigerator Motorcycle Car Bicycle

SECTION 3, Income Sources
11. Income details, estimates
Item Description In Omani Rial, 2016 (could be an estimate, also put 0 if the answer is No to certain categories))
Income from Household Activities
Agriculture/ Farming (if applicable)
Income from raising cattle (eg Camels or Poultry, if applicable)
Non-Agricultural Income
Property Income
Rent received from rented property (land, housing)
Benefits
Social security benefits/benefits received by the family from the State
Remittances and assistance received from other family members
Other (inheritance, alimony, scholarships, etc)
Employment
Formal employment income (indicate type of work)
TOTAL
SECTION 4, Health
12. Are there disabled or chronically ill people in the household? YES NO
13. If YES: - Type of disability/illness: _____________________________________________________
- Type of care required: ___________________________________________________________
14. Number of births & deaths over the last 12 months in the household:
- Births:
- Deaths: Cause: _________________________________________
15. What are the most common diseases that affect the family (last 3 years)?
- ________________________________________________________
- _________________________________________________________________________
16. Is this a household where a woman is a head of the Household (widow, etc?) YES NO
SECTION 5, Expectations and Concerns about the Project
17. Attitude towards the Project:
17.1 Are you aware of the proposed Wastewater Project? Yes -1, No -0
17.2 If Yes, Source of information, how did you find out about it___________________________
17.3 What is your opinion about the project? Positive -0, Negative – 1, Neutral-2
17.4 If positive, what positive impacts do you expect from it? ______________________________
17.5 If negative, what negative impacts do you expect from it? _______________________________
Final Version April 2016 Page 16
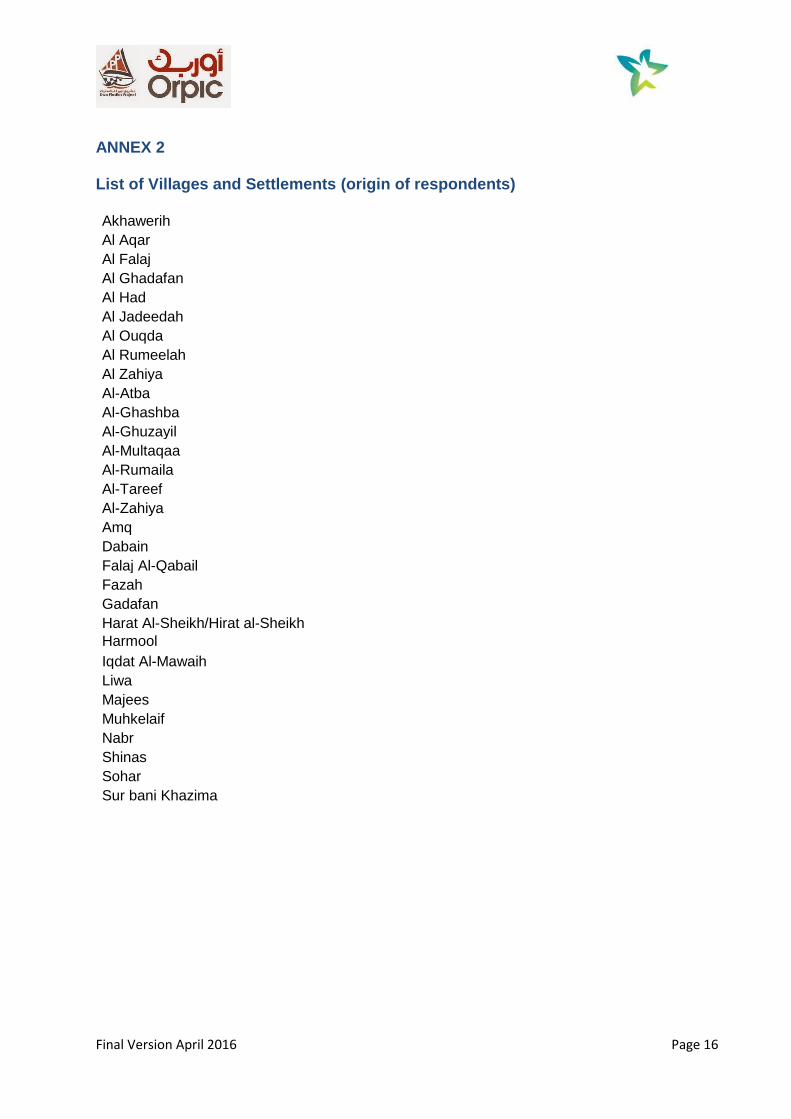
ANNEX 2 List of Villages and Settlements (origin of respondents)
Akhawerih
Al Aqar
Al Falaj
Al Ghadafan
Al Had
Al Jadeedah
Al Ouqda
Al Rumeelah
Al Zahiya
Al-Atba
Al-Ghashba
Al-Ghuzayil
Al-Multaqaa
Al-Rumaila
Al-Tareef
Al-Zahiya
Amq
Dabain
Falaj Al-Qabail
Fazah
Gadafan
Harat Al-Sheikh/Hirat al-Sheikh
Harmool
Iqdat Al-Mawaih
Liwa
Majees
Muhkelaif
Nabr
Shinas
Sohar
Sur bani Khazima
Final Version April 2016 Page 17
ANNEX 3 Summary of Findings from First Socio-economic Survey
Final Version April 2016 Page 18
First Socio-Economic Questionnaire: Summary of Results and Analysis
1. Introduction This summary summarizes the results of the first socio-economic survey and is divided into the four main components (as per the survey questions):
i. Demography ii. Economic Baseline iii. Social and Cultural Baseline iv. Attitudes towards the LPIC Project.
2. Key Findings of Questionnaire
2.1 Demography
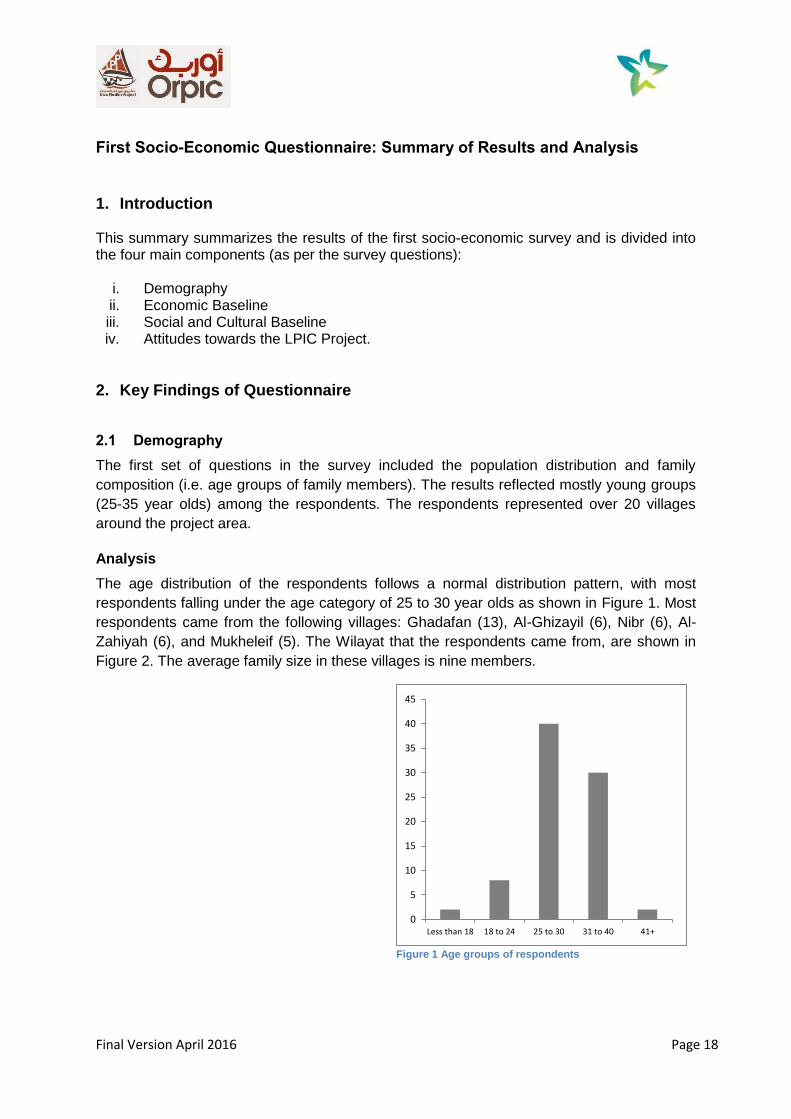
The first set of questions in the survey included the population distribution and family
composition (i.e. age groups of family members). The results reflected mostly young groups
(25-35 year olds) among the respondents. The respondents represented over 20 villages
around the project area.
Analysis
The age distribution of the respondents follows a normal distribution pattern, with most
respondents falling under the age category of 25 to 30 year olds as shown in Figure 1. Most
respondents came from the following villages: Ghadafan (13), Al-Ghizayil (6), Nibr (6), Al-
Zahiyah (6), and Mukheleif (5). The Wilayat that the respondents came from, are shown in
Figure 2. The average family size in these villages is nine members.
Figure 1 Age groups of respondents
0
5
10
15
20
25
30
35
40
45
Less than 18 18 to 24 25 to 30 31 to 40 41+
Final Version April 2016 Page 19
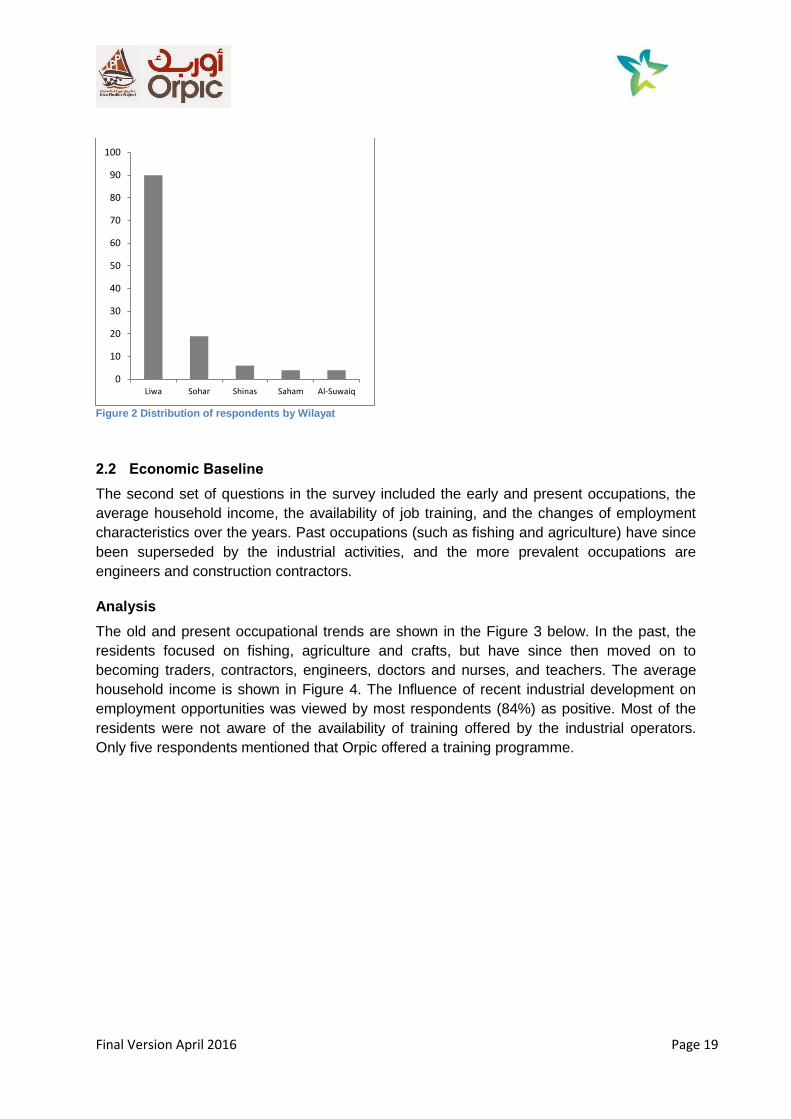
Figure 2 Distribution of respondents by Wilayat
2.2 Economic Baseline
The second set of questions in the survey included the early and present occupations, the
average household income, the availability of job training, and the changes of employment
characteristics over the years. Past occupations (such as fishing and agriculture) have since
been superseded by the industrial activities, and the more prevalent occupations are
engineers and construction contractors.
Analysis
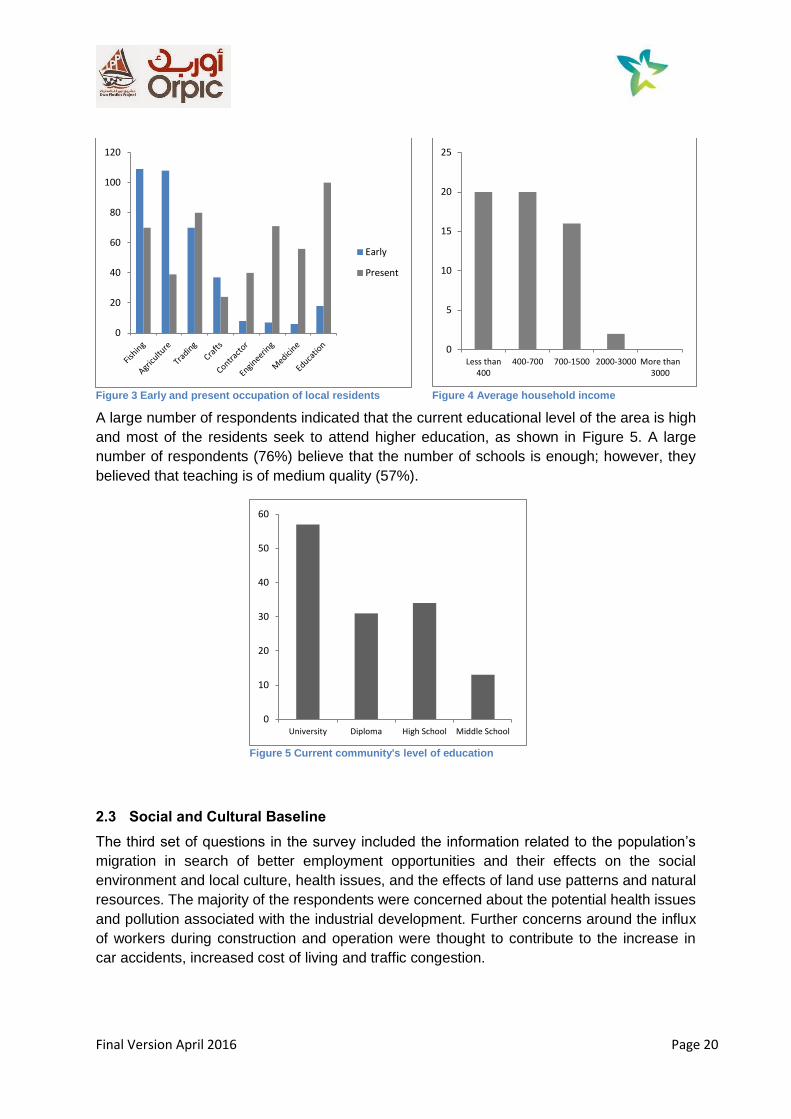
The old and present occupational trends are shown in the Figure 3 below. In the past, the
residents focused on fishing, agriculture and crafts, but have since then moved on to
becoming traders, contractors, engineers, doctors and nurses, and teachers. The average
household income is shown in Figure 4. The Influence of recent industrial development on
employment opportunities was viewed by most respondents (84%) as positive. Most of the
residents were not aware of the availability of training offered by the industrial operators.
Only five respondents mentioned that Orpic offered a training programme.
0
10
20
30
40
50
60
70
80
90
100
Liwa Sohar Shinas Saham Al-Suwaiq
Final Version April 2016 Page 20
Figure 3 Early and present occupation of local residents
Figure 4 Average household income
A large number of respondents indicated that the current educational level of the area is high
and most of the residents seek to attend higher education, as shown in Figure 5. A large
number of respondents (76%) believe that the number of schools is enough; however, they
believed that teaching is of medium quality (57%).
Figure 5 Current community's level of education
2.3 Social and Cultural Baseline
The third set of questions in the survey included the information related to the population’s
migration in search of better employment opportunities and their effects on the social
environment and local culture, health issues, and the effects of land use patterns and natural
resources. The majority of the respondents were concerned about the potential health issues
and pollution associated with the industrial development. Further concerns around the influx
of workers during construction and operation were thought to contribute to the increase in
car accidents, increased cost of living and traffic congestion.
0
20
40
60
80
100
120
Early
Present
0
5
10
15
20
25
Less than400
400-700 700-1500 2000-3000 More than3000
0
10
20
30
40
50
60
University Diploma High School Middle School
Final Version April 2016 Page 21
Analysis
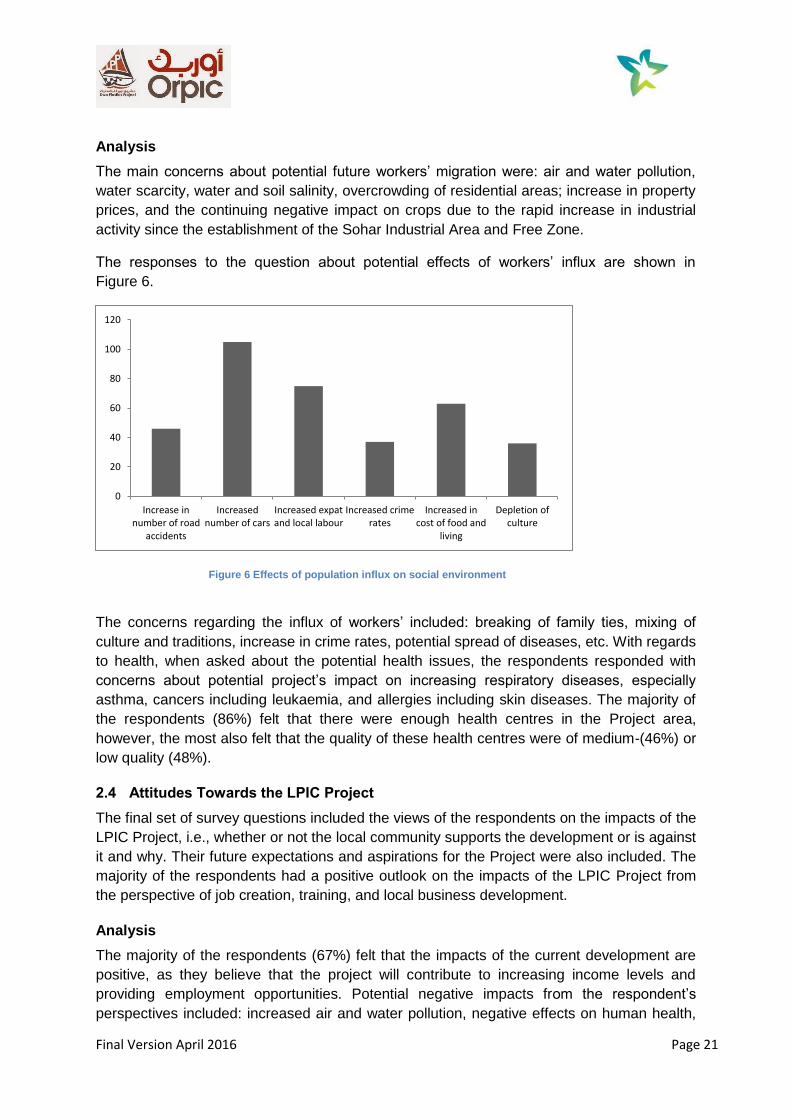
The main concerns about potential future workers’ migration were: air and water pollution,
water scarcity, water and soil salinity, overcrowding of residential areas; increase in property
prices, and the continuing negative impact on crops due to the rapid increase in industrial
activity since the establishment of the Sohar Industrial Area and Free Zone.
The responses to the question about potential effects of workers’ influx are shown in
Figure 6.
Figure 6 Effects of population influx on social environment
The concerns regarding the influx of workers’ included: breaking of family ties, mixing of
culture and traditions, increase in crime rates, potential spread of diseases, etc. With regards
to health, when asked about the potential health issues, the respondents responded with
concerns about potential project’s impact on increasing respiratory diseases, especially
asthma, cancers including leukaemia, and allergies including skin diseases. The majority of
the respondents (86%) felt that there were enough health centres in the Project area,
however, the most also felt that the quality of these health centres were of medium-(46%) or
low quality (48%).
2.4 Attitudes Towards the LPIC Project
The final set of survey questions included the views of the respondents on the impacts of the
LPIC Project, i.e., whether or not the local community supports the development or is against
it and why. Their future expectations and aspirations for the Project were also included. The
majority of the respondents had a positive outlook on the impacts of the LPIC Project from
the perspective of job creation, training, and local business development.
Analysis
The majority of the respondents (67%) felt that the impacts of the current development are
positive, as they believe that the project will contribute to increasing income levels and
providing employment opportunities. Potential negative impacts from the respondent’s
perspectives included: increased air and water pollution, negative effects on human health,
0
20
40
60
80
100
120
Increase innumber of road
accidents
Increasednumber of cars
Increased expatand local labour
Increased crimerates
Increased incost of food and
living
Depletion ofculture
Final Version April 2016 Page 22
further development without proper planning, loss of access to general community services
and increase in crimes levels. Finally, the expectations and aspirations of the local
community were the following: that the environment will be protected and any potential
pollution will be reduced, local businesses will benefit from potential future tenders
generated by the Project, that more recreational/ entertainment centres and parks will be
created for families and that the quality of local health centres will be improved.
3. Future Monitoring and Potential Key Performance Indicators
The following Key Performance Indicators (KPI) are suggested based on the concerns
expressed by the respondents as well as key findings and analysis from the ongoing Social
Imapct Assessment (SIA) work. The following nine KPIs represent the most important socio-
economic aspects to the local communities around the Sohar industrial area.
1. Employment Opportunities: When asked about the influence of recent industrial
development on employment opportunities, 84% of survey respondents believe that it
is a positive influence and they have expectations about the generation of new jobs.
2. Training Opportunities: Over half of the respondents (64%) said that job training
was not available to them and expressed their need for more training opportunities to
enable their contribution to the LPIC project.
3. Income: Over a third (34%) respondents indicated that their average monthly
household income is less than 400 Omani Riyals (OR) and were keen for new job
opportunities to increase their income level through the LPIC Project.
4. Business Opportunities: A quarter (25%) of the survey respondents indicated that
their present occupation is in business/trading, or as construction workers and
engineers and would look for opportunities to develop or open their own businesses
to provide goods and services for the LPIC Project.
5. Population: One of the key concerns expressed during the survey was the influx of
workers due to the increased industrial activity. Over 47% say that workers’ influx
would impact negatively on economic growth within the community.
6. Human Health and the Environment – Air Quality, Dust and Noise: a large number
of respondents communicated their concerns about potential health issues. Some of
the respondents had specific health issues and diseases among their family
members such as respiratory diseases especially asthma, cancer including
leukaemia, allergies including skin diseases, and miscarriages of pregnant women.
Therefore, it is essential to monitor the cases of these specific health issues at local
health centres and hospitals in order to assess whether or not they are linked to
industrial activities at both the construction and operation phases of the Project.
7. Education: The current level of education among the respondents is as follows: 42%
have a university degree, 23% attained a diploma, 25% completed high school, and
10% only completed their middle school education. With the initiation of the LPIC
Final Version April 2016 Page 23
Project, it is expected that college level education will increase through scholarship
programmes and other Orpic initiatives.
8. Public and Workers’ Safety and Security: This issue was particularly highlighted
by 10% of survey respondents who indicated that their concerns are about potentially
increased crime rates that could be caused by the new development. Further
concerns also included potential increase in road traffic accidents.
9. Traffic, Congestion and Accessibility: Over 29% of the survey respondents
indicated that potential increase in the number of vehicles on the roads (associated
with the new development) would be an issue and that traffic jams are getting worse.