Embed Size (px)
Citation preview

Journal of
Personalized
Medicine
Article
Long-Term Tacrolimus Blood Trough Level and Patient Survivalin Adult Liver Transplantation
Chih-Yang Hsiao 1,2,3,4 , Ming-Chih Ho 2,3, Cheng-Maw Ho 3 , Yao-Ming Wu 2,3, Po-Huang Lee 3,5
and Rey-Heng Hu 2,3,4,*
�����������������
Citation: Hsiao, C.-Y.; Ho, M.-C.; Ho,
C.-M.; Wu, Y.-M.; Lee, P.-H.; Hu, R.-H.
Long-Term Tacrolimus Blood Trough
Level and Patient Survival in Adult
Liver Transplantation. J. Pers. Med.
2021, 11, 90. https://doi.org/
10.3390/jpm11020090
Academic Editor: Aaron W. Bell
Received: 30 December 2020
Accepted: 29 January 2021
Published: 1 February 2021
Publisher’s Note: MDPI stays neutral
with regard to jurisdictional claims in
published maps and institutional affil-
iations.
Copyright: © 2021 by the authors.
Licensee MDPI, Basel, Switzerland.
This article is an open access article
distributed under the terms and
conditions of the Creative Commons
Attribution (CC BY) license (https://
creativecommons.org/licenses/by/
4.0/).
1 Graduate Institute of Clinical Medicine, College of Medicine, National Taiwan University,Taipei City 110, Taiwan; [email protected]
2 Department of Surgery, National Taiwan University College of Medicine, Taipei City 110, Taiwan;[email protected] (M.-C.H.); [email protected] (Y.-M.W.)
3 Department of Surgery, National Taiwan University Hospital, Taipei City 110, Taiwan;[email protected] (C.-M.H.); [email protected] (P.-H.L.)
4 Department of Traumatology, National Taiwan University Hospital, Taipei City 110, Taiwan5 Department of Surgery, E-Da Hospital, I-Shou University, Kaohsiung 886, Taiwan* Correspondence: [email protected]; Tel.: +886-2-2312-3456 (ext. 65106)
Abstract: Tacrolimus is the most widely used immunosuppressant in liver transplant (LT) patients.However, the ideal long-term target level for these patients is unknown. This retrospective studyaimed to investigate the impact of tacrolimus blood concentration five years after LT on long-termpatient survival outcomes in adult LT recipients. Patients who underwent LT between January2004 and July 2014 at a tertiary medical center were included in this study (n = 189). The meantacrolimus blood concentrations of each patient during the fifth year after LT were recorded and theoverall survival rate was determined. A multivariate analysis of factors associated with long-termsurvival was conducted using a Cox’s model. The median follow-up period was 9.63 years, and144 patients (76.2%) underwent live donor LT. Sixteen patients died within 5 years of LT. In theCox’s model, patients with a mean tacrolimus blood trough level of 4.6–10.2 ng/mL had significantlybetter long-term survival than those with a mean tacrolimus blood trough level outside this range(estimated hazard ratio = 4.76; 95% confidence interval: 1.34–16.9, p = 0.016). Therefore, a tacrolimuslevel no lower than 4.6 ng/mL would be recommended in adult LT patients.
Keywords: Cox’s model; immunosuppressant; liver transplantation; survival; tacrolimus
1. Introduction
Liver transplantation (LT) has become a mature treatment of end-stage liver diseasein clinical practice [1]. The continuous improvement of effective immunosuppressiontreatments has led to a significant improvement in patient and graft survival in recentyears [2]. Calcineurin inhibitors are the cornerstone of immunosuppression in LT [3],and tacrolimus is currently the mainstay of initial and maintenance immunosuppressiontherapies [4–6]. Tacrolimus reduces the incidence and severity of early and late T-cellmediated rejection by inhibiting T-cell production of interleukin-2 [5,6]. However, thelong-term use of immunosuppressants leads to an increasing burden of toxicity. Thereported toxic effects of calcineurin inhibitors include infections, chronic renal insufficiency,metabolic diseases (such as hyperlipidemia, hypertension, and diabetes mellitus), andmalignancy [7–9], which, along with cardiovascular diseases, have been reported to bethe major causes of morbidity and mortality after LT [3,10]. However, most LT patientscannot withdraw from lifelong immunosuppression therapy; the only exceptions are a fewselected patients participating in experimental trials [11,12].
It is a clinical challenge to design a well-balanced immunosuppressive regimen forLT recipients. Tacrolimus has a narrow therapeutic dose range and its blood levels should
J. Pers. Med. 2021, 11, 90. https://doi.org/10.3390/jpm11020090 https://www.mdpi.com/journal/jpm

J. Pers. Med. 2021, 11, 90 2 of 11
be carefully monitored. The Advagraf (tacrolimus prolonged-release hard capsules) rec-ommendation for adult LT patients is a blood trough level of 5–20 ng/mL in the earlypost-transplant period and 5–15 ng/mL during subsequent maintenance therapy. Nev-ertheless, the current recommendations from the clinical practice guidelines for the idealtacrolimus level in adults after LT remain controversial. The American Association forthe Study of Liver Diseases (AASLD) recommends a target blood trough level of 5–10ng/mL for tacrolimus three months after LT [13]. The Consensus on Managing ModifiableRisk in Transplantation Group (COMMIT) recommends that the target tacrolimus bloodtrough levels be 6–10 ng/mL during the first month after LT and decrease to 4–8 ng/mLthereafter, except when used in combination with mammalian target of rapamycin (mTOR)inhibitors [14]. Moreover, the International Liver Transplant Society (ILTS) consensusstatement on immunosuppression in LT recipients recommends the target blood troughlevels of tacrolimus be 6–10 ng/mL three months after LT, lower than 5 ng/mL 12 monthsafter LT, and decrease to 3 ng/mL thereafter, resulting in a blood trough level just abovethe lower limit of detection five years after LT [15]. However, the impact of the long-termtacrolimus blood trough level on the outcomes of the LT recipients remains unclear. Thisstudy aimed to suggest an appropriate tacrolimus blood trough level for adult patients fiveyears after LT.
2. Materials and Methods
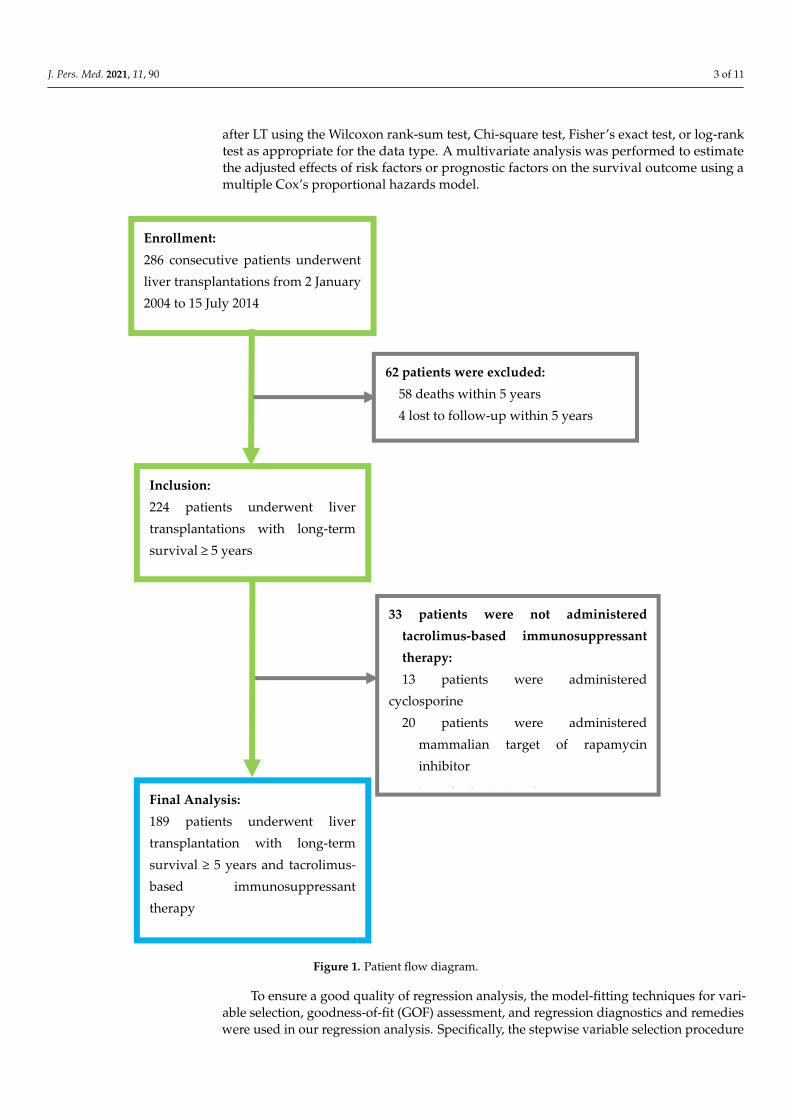
This study was approved by the Institutional Review Board of National TaiwanUniversity Hospital and was conducted according to the Declaration of Helsinki. A totalof 286 patients who underwent LT at 18 years or older at a tertiary medical center fromJanuary 2004 to July 2014 were recruited for this study. Patients who died within 5 yearsof LT, were lost to follow-up, or did not use tacrolimus-based calcineurin inhibitor forimmunosuppressant therapy were excluded from this study (Figure 1). In addition, thosewho received mTOR inhibitor treatment were excluded, as mTOR inhibitors are typicallyused as a combination therapy to reduce the required dose of tacrolimus. The final analysisincluded 189 patients. All eligible patients were followed up for more than five yearsuntil August 2019. Patients who underwent a LT due to liver cancer met the Milan criteria(before 2006) or the criteria of the University of California, San Francisco (since 2006) at thetime of LT. All patients received regular monthly or bi-monthly follow-ups at the outpatientclinic after LT. Routine blood examinations for the tacrolimus blood trough level, liverfunction, and renal function were conducted at each visit, and abdominal sonography wasperformed every 6 to 12 months.
The patients’ medical records were reviewed retrospectively to extract demographicand clinical data, including patient characteristics, laboratory tests, and survival outcomes.The serum bilirubin and creatinine data at the end of the fifth year after LT were used inthis study. The tacrolimus level used in this study was the mean of the values obtained atthe three follow-up visits during the fifth year after LT.
The immunosuppression protocol for adult LT patients consisted of tacrolimus, my-cophenolate mofetil, and steroids. Tacrolimus was administered orally beginning on thefirst day after LT, and the dose was adjusted to achieve the desired therapeutic drug level.Basiliximab was administered immediately before graft reperfusion and on the fourth dayafter LT for induction therapy. A 500-mg intravenous bolus of methylprednisolone wasadministered immediately before reperfusion of the liver graft and was tapered to oralprednisolone over one week and reduced to withdrawal after six months.
All statistical analyses were performed using R 4.0.2 software (R Foundation for Statis-tical Computing, Vienna, Austria). Statistical significance was set at p ≤ 0.05. Continuousvariables are presented as mean ± standard deviation (SD) and median (interquartile range,IQR), and categorical variables are presented as frequency (percentage, %). The survivalcurve was estimated by the Kaplan-Meier method. A univariate analysis was conducted toexamine the differences in the distributions of continuous variables, categorical variables,and survival outcomes between the surviving and deceased liver recipients five years
J. Pers. Med. 2021, 11, 90 3 of 11
after LT using the Wilcoxon rank-sum test, Chi-square test, Fisher’s exact test, or log-ranktest as appropriate for the data type. A multivariate analysis was performed to estimatethe adjusted effects of risk factors or prognostic factors on the survival outcome using amultiple Cox’s proportional hazards model.J. Pers. Med. 2021, 11, x FOR PEER REVIEW 3 of 12
Figure 1. Patient flow diagram.
The patients’ medical records were reviewed retrospectively to extract demographic and clinical data, including patient characteristics, laboratory tests, and survival out-comes. The serum bilirubin and creatinine data at the end of the fifth year after LT were used in this study. The tacrolimus level used in this study was the mean of the values obtained at the three follow-up visits during the fifth year after LT.
The immunosuppression protocol for adult LT patients consisted of tacrolimus, my-cophenolate mofetil, and steroids. Tacrolimus was administered orally beginning on the first day after LT, and the dose was adjusted to achieve the desired therapeutic drug level. Basiliximab was administered immediately before graft reperfusion and on the fourth day after LT for induction therapy. A 500-mg intravenous bolus of methylprednisolone was
Enrollment: 286 consecutive patients underwent liver transplantations from 2 January 2004 to 15 July 2014
Inclusion: 224 patients underwent liver transplantations with long-term survival ≥ 5 years
62 patients were excluded: 58 deaths within 5 years 4 lost to follow-up within 5 years
33 patients were not administered tacrolimus-based immunosuppressant therapy: 13 patients were administered
cyclosporine 20 patients were administered
mammalian target of rapamycin inhibitor
i h d i i dFinal Analysis: 189 patients underwent liver transplantation with long-term survival ≥ 5 years and tacrolimus-based immunosuppressant therapy
Figure 1. Patient flow diagram.
To ensure a good quality of regression analysis, the model-fitting techniques for vari-able selection, goodness-of-fit (GOF) assessment, and regression diagnostics and remedieswere used in our regression analysis. Specifically, the stepwise variable selection procedure
J. Pers. Med. 2021, 11, 90 4 of 11
(with iterations between the forward and backward steps) was applied to obtain the bestfinal regression model using the My.stepwise package of the R software [16]. All significantand non-significant relevant covariates from the univariate analysis (listed in Table 1) andsome of the interaction terms were used in the multivariate analysis. The significance levelsfor entry and for stay were set to 0.15 for being conservative. With the aid of substantiveknowledge, the best candidate final regression model was identified manually by drop-ping the covariates with p value > 0.05 one at a time until all regression coefficients weresignificantly different from 0. To assess the GOF of the fitted Cox’s model, the concordanceand adjusted generalized R2 [17] were examined. A concordance ≥ 0.7 and an adjustedgeneralized R2 > 0.15 indicated an acceptable level of discrimination, power, and fitness.
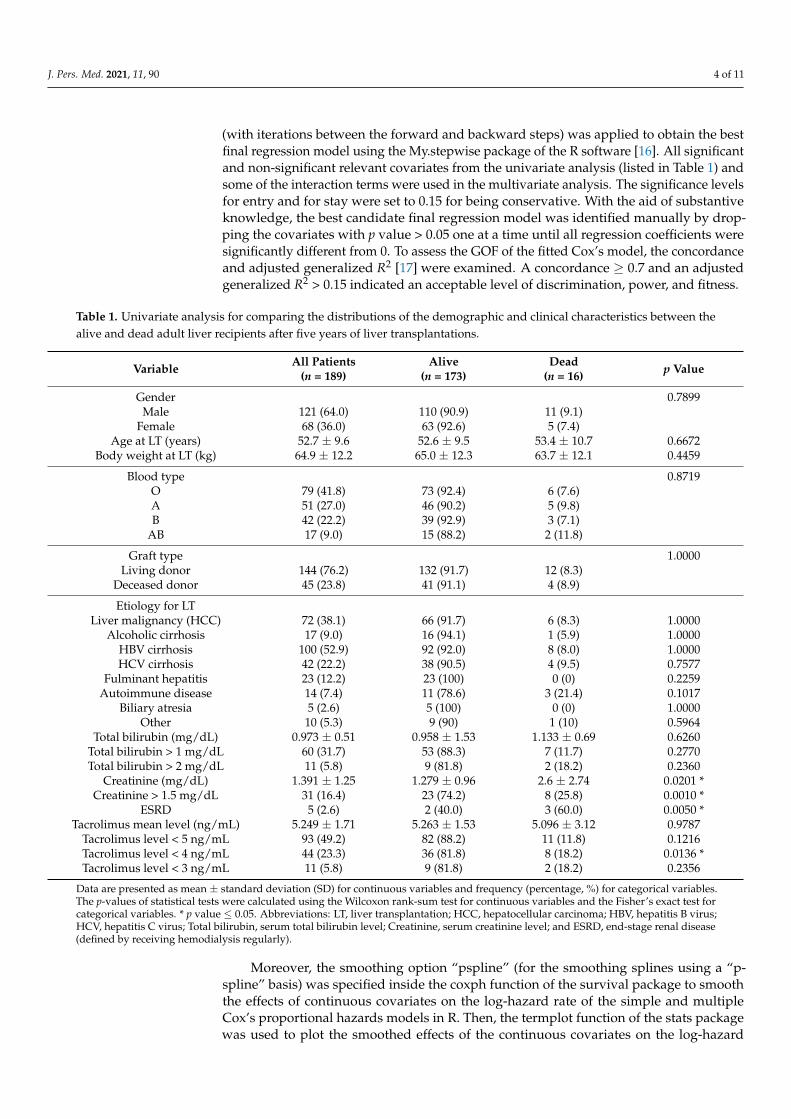
Table 1. Univariate analysis for comparing the distributions of the demographic and clinical characteristics between thealive and dead adult liver recipients after five years of liver transplantations.
Variable All Patients(n = 189)
Alive(n = 173)
Dead(n = 16) p Value
Gender 0.7899Male 121 (64.0) 110 (90.9) 11 (9.1)
Female 68 (36.0) 63 (92.6) 5 (7.4)Age at LT (years) 52.7 ± 9.6 52.6 ± 9.5 53.4 ± 10.7 0.6672
Body weight at LT (kg) 64.9 ± 12.2 65.0 ± 12.3 63.7 ± 12.1 0.4459
Blood type 0.8719O 79 (41.8) 73 (92.4) 6 (7.6)A 51 (27.0) 46 (90.2) 5 (9.8)B 42 (22.2) 39 (92.9) 3 (7.1)
AB 17 (9.0) 15 (88.2) 2 (11.8)
Graft type 1.0000Living donor 144 (76.2) 132 (91.7) 12 (8.3)
Deceased donor 45 (23.8) 41 (91.1) 4 (8.9)
Etiology for LTLiver malignancy (HCC) 72 (38.1) 66 (91.7) 6 (8.3) 1.0000
Alcoholic cirrhosis 17 (9.0) 16 (94.1) 1 (5.9) 1.0000HBV cirrhosis 100 (52.9) 92 (92.0) 8 (8.0) 1.0000HCV cirrhosis 42 (22.2) 38 (90.5) 4 (9.5) 0.7577
Fulminant hepatitis 23 (12.2) 23 (100) 0 (0) 0.2259Autoimmune disease 14 (7.4) 11 (78.6) 3 (21.4) 0.1017
Biliary atresia 5 (2.6) 5 (100) 0 (0) 1.0000Other 10 (5.3) 9 (90) 1 (10) 0.5964
Total bilirubin (mg/dL) 0.973 ± 0.51 0.958 ± 1.53 1.133 ± 0.69 0.6260Total bilirubin > 1 mg/dL 60 (31.7) 53 (88.3) 7 (11.7) 0.2770Total bilirubin > 2 mg/dL 11 (5.8) 9 (81.8) 2 (18.2) 0.2360
Creatinine (mg/dL) 1.391 ± 1.25 1.279 ± 0.96 2.6 ± 2.74 0.0201 *Creatinine > 1.5 mg/dL 31 (16.4) 23 (74.2) 8 (25.8) 0.0010 *
ESRD 5 (2.6) 2 (40.0) 3 (60.0) 0.0050 *Tacrolimus mean level (ng/mL) 5.249 ± 1.71 5.263 ± 1.53 5.096 ± 3.12 0.9787
Tacrolimus level < 5 ng/mL 93 (49.2) 82 (88.2) 11 (11.8) 0.1216Tacrolimus level < 4 ng/mL 44 (23.3) 36 (81.8) 8 (18.2) 0.0136 *Tacrolimus level < 3 ng/mL 11 (5.8) 9 (81.8) 2 (18.2) 0.2356
Data are presented as mean ± standard deviation (SD) for continuous variables and frequency (percentage, %) for categorical variables.The p-values of statistical tests were calculated using the Wilcoxon rank-sum test for continuous variables and the Fisher’s exact test forcategorical variables. * p value ≤ 0.05. Abbreviations: LT, liver transplantation; HCC, hepatocellular carcinoma; HBV, hepatitis B virus;HCV, hepatitis C virus; Total bilirubin, serum total bilirubin level; Creatinine, serum creatinine level; and ESRD, end-stage renal disease(defined by receiving hemodialysis regularly).
Moreover, the smoothing option “pspline” (for the smoothing splines using a “p-spline” basis) was specified inside the coxph function of the survival package to smooththe effects of continuous covariates on the log-hazard rate of the simple and multipleCox’s proportional hazards models in R. Then, the termplot function of the stats packagewas used to plot the smoothed effects of the continuous covariates on the log-hazard
J. Pers. Med. 2021, 11, 90 5 of 11
rate in R [18]. The regression diagnostics for the verification of proportional hazardsassumption, residual analysis, detection of influential cases, and a multicollinearity checkwere applied to discover any model or data problems. A variance inflating factor (VIF) ≥ 10in continuous covariates or VIF ≥ 2.5 in categorical covariates indicated the occurrence ofthe multicollinearity problem among some of the covariates in the fitted regression model.
3. Results3.1. Patients’ Demographic and Clinical Characteristics
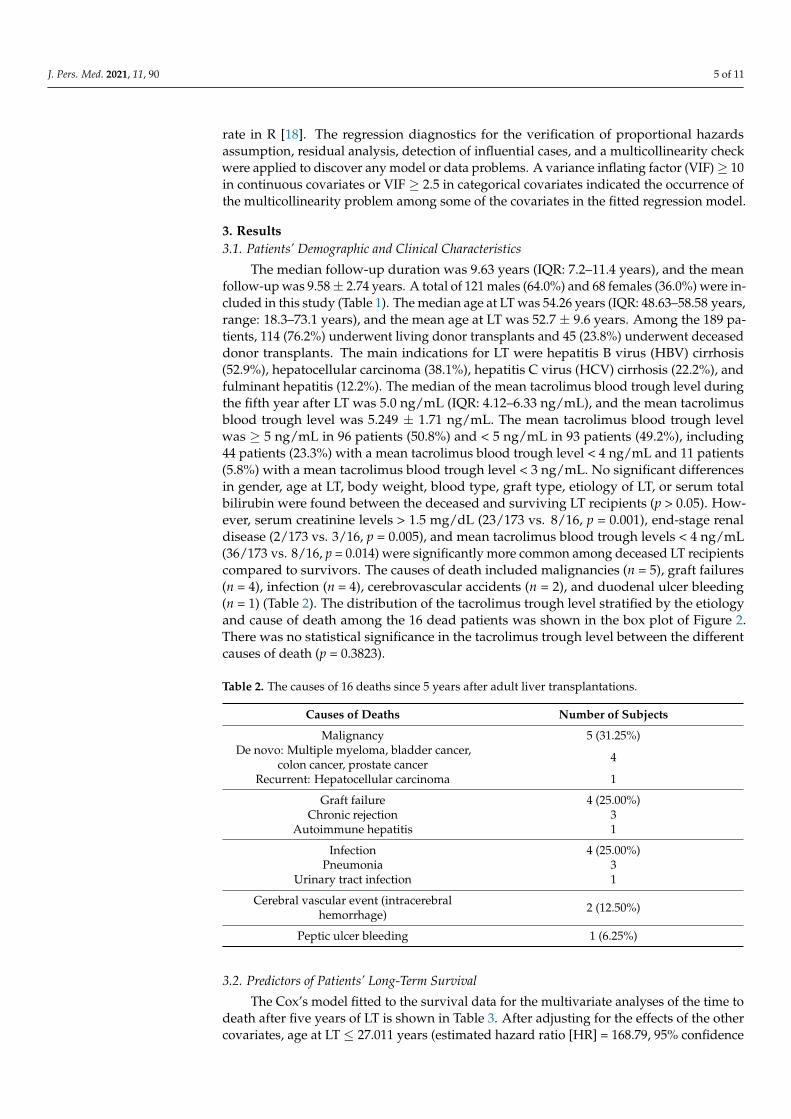
The median follow-up duration was 9.63 years (IQR: 7.2–11.4 years), and the meanfollow-up was 9.58 ± 2.74 years. A total of 121 males (64.0%) and 68 females (36.0%) were in-cluded in this study (Table 1). The median age at LT was 54.26 years (IQR: 48.63–58.58 years,range: 18.3–73.1 years), and the mean age at LT was 52.7 ± 9.6 years. Among the 189 pa-tients, 114 (76.2%) underwent living donor transplants and 45 (23.8%) underwent deceaseddonor transplants. The main indications for LT were hepatitis B virus (HBV) cirrhosis(52.9%), hepatocellular carcinoma (38.1%), hepatitis C virus (HCV) cirrhosis (22.2%), andfulminant hepatitis (12.2%). The median of the mean tacrolimus blood trough level duringthe fifth year after LT was 5.0 ng/mL (IQR: 4.12–6.33 ng/mL), and the mean tacrolimusblood trough level was 5.249 ± 1.71 ng/mL. The mean tacrolimus blood trough levelwas ≥ 5 ng/mL in 96 patients (50.8%) and < 5 ng/mL in 93 patients (49.2%), including44 patients (23.3%) with a mean tacrolimus blood trough level < 4 ng/mL and 11 patients(5.8%) with a mean tacrolimus blood trough level < 3 ng/mL. No significant differencesin gender, age at LT, body weight, blood type, graft type, etiology of LT, or serum totalbilirubin were found between the deceased and surviving LT recipients (p > 0.05). How-ever, serum creatinine levels > 1.5 mg/dL (23/173 vs. 8/16, p = 0.001), end-stage renaldisease (2/173 vs. 3/16, p = 0.005), and mean tacrolimus blood trough levels < 4 ng/mL(36/173 vs. 8/16, p = 0.014) were significantly more common among deceased LT recipientscompared to survivors. The causes of death included malignancies (n = 5), graft failures(n = 4), infection (n = 4), cerebrovascular accidents (n = 2), and duodenal ulcer bleeding(n = 1) (Table 2). The distribution of the tacrolimus trough level stratified by the etiologyand cause of death among the 16 dead patients was shown in the box plot of Figure 2.There was no statistical significance in the tacrolimus trough level between the differentcauses of death (p = 0.3823).
Table 2. The causes of 16 deaths since 5 years after adult liver transplantations.
Causes of Deaths Number of Subjects
Malignancy 5 (31.25%)De novo: Multiple myeloma, bladder cancer,
colon cancer, prostate cancer 4
Recurrent: Hepatocellular carcinoma 1
Graft failure 4 (25.00%)Chronic rejection 3
Autoimmune hepatitis 1
Infection 4 (25.00%)Pneumonia 3
Urinary tract infection 1
Cerebral vascular event (intracerebralhemorrhage) 2 (12.50%)
Peptic ulcer bleeding 1 (6.25%)
3.2. Predictors of Patients’ Long-Term Survival
The Cox’s model fitted to the survival data for the multivariate analyses of the time todeath after five years of LT is shown in Table 3. After adjusting for the effects of the othercovariates, age at LT ≤ 27.011 years (estimated hazard ratio [HR] = 168.79, 95% confidence
J. Pers. Med. 2021, 11, 90 6 of 11
interval [C.I.]: 11.13–2559.51), pre-transplant autoimmune liver disease (HR = 8.12, 95%C.I.: 1.97–33.43), pre-transplant HCV infection × survival time in years (HR = 1.34, 95%C.I.: 1.12–1.60), serum creatinine level > 1.311 mg/dL × serum total bilirubin level > 1.411mg/dL (HR = 921.69, 95% C.I.: 43.40–19,573.71), serum creatinine level > 1.311 mg/dL ×serum total bilirubin level ≤ 0.792 mg/dL (HR = 105.68, 95% C.I.: 7.81–1430.79), serumcreatinine level ≤ 1.311 mg/dL × serum total bilirubin level > 0.882 mg/dL (HR = 30.49,95% C.I.: 2.98–312.34), and the mean tacrolimus trough level during the fifth year after LT≤ 4.609 ng/mL or > 10.168 ng/mL (HR = 4.76, 95% C.I.: 1.34–16.94) were associated with ahigher long-term mortality five years after LT. The time-dependent interaction term, HCV× survival time in years, was added to the Cox’s model to account for the non-proportionalhazards problem between the patients with and without HCV, and its positive-valuedregression coefficient estimate, 0.292, indicates that the risk of mortality in patients withHCV increases with time five years post-LT. Moreover, the three second-order interactionterms between the serum creatinine and total bilirubin levels were compared to the othertwo possible combinations, serum creatinine level > 1.311 mg/dL × (0.792 mg/dL < serumtotal bilirubin level ≤ 1.411 mg/dL) and serum creatinine level ≤ 1.311 mg/dL × serumtotal bilirubin level ≤ 0.882 mg/dL, as the reference group (i.e., HR = 1.0), where the crosssign × can be literally interpreted as “and”.
Table 3. Multivariate analysis for identifying the predictors of long-term overall survival after 5 years of liver transplanta-tions by fitting a multiple Cox’s Model in the adult liver transplant recipients 1.
Covariate 2 Estimate StandardError
Wald’sz Test p Value Hazard
Ratio (HR)95% Confidence
Interval (C.I.)
Age at LT ≤ 27.011 years 5.1286 1.3872 3.6970 0.0002 168.7851 11.130–2559.512Autoimmune (including PBC) 2.0946 0.7219 2.9015 0.0037 8.1221 1.973–33.431HCV × Overall survival years 0.2924 0.0914 3.1978 0.0014 1.3397 1.120–1.603
Cre > 1.311 × T-Bil > 1.411 mg/dL 6.8262 1.5591 4.3784 <0.0001 921.6940 43.401–19,573.712Cre > 1.311 × T-Bil ≤ 0.792 mg/dL 4.6604 1.3294 3.5056 0.0005 105.6778 7.805–1430.790Cre ≤ 1.311 × T-Bil > 0.882 mg/dL 3.4174 1.1871 2.8788 0.0040 30.4913 2.977–312.341
Tacrolimus mean ≤ 4.609 or> 10.168 ng/mL 1.5599 0.6479 2.4076 0.0161 4.7581 1.336–16.940
1 The above multiple Cox’s model was fitted to the 189 adult patients who underwent liver transplantations with 16 death events, formodeling the hazard rate of the right-censored overall survival time five years after liver transplantations. All the cut-off values of thecontinuous covariates (e.g., age at liver transplantations) were estimated by choosing the option of applying the p-spline smoothingtechniques in fitting simple and multiple Cox’s proportional hazards models (e.g., Figure 3). The time-dependent interaction term,HCV × Overall survival year, was added to the Cox’s model for handling the non-proportional hazards problem between the patientswith and without HCV, and its positive-valued regression coefficient estimate, 0.2924, indicated that the risk of dying in the patientswith HCV would increase as time elapsed five years after liver transplantations. Moreover, the three second-order interaction terms,Cre > 1.311 × T-Bil > 1.411, Cre > 1.311 × T-Bil ≤ 0.792, and Cre ≤ 1.311 × T-Bil > 0.882, were compared to the other two possiblecombinations, Cre > 1.311 × (0.792 < T-Bil ≤ 1.411) and Cre ≤ 1.311 × T-Bil ≤ 0.882, as the reference group (i.e., HR = 1.0), where the crosssign × can be literally interpreted as “and.” Finally, both goodness-of-fit (GOF) measures, concordance = 0.9041 (se = 0.0265) > 0.7 andadjusted generalized R2 = 0.3878 > 0.15, indicated an excellent fit of this multiple Cox’s model to the observed survival data. 2 Abbreviations:LT, liver transplantation; PBC, primary biliary cirrhosis; HCV, hepatitis C viral infection; Cre, serum creatinine level (mg/dL); T-Bil, serumtotal bilirubin level (mg/dL); and Tacrolimus mean, the averaged dosage of the tacrolimus-based immunosuppressant (ng/mL).
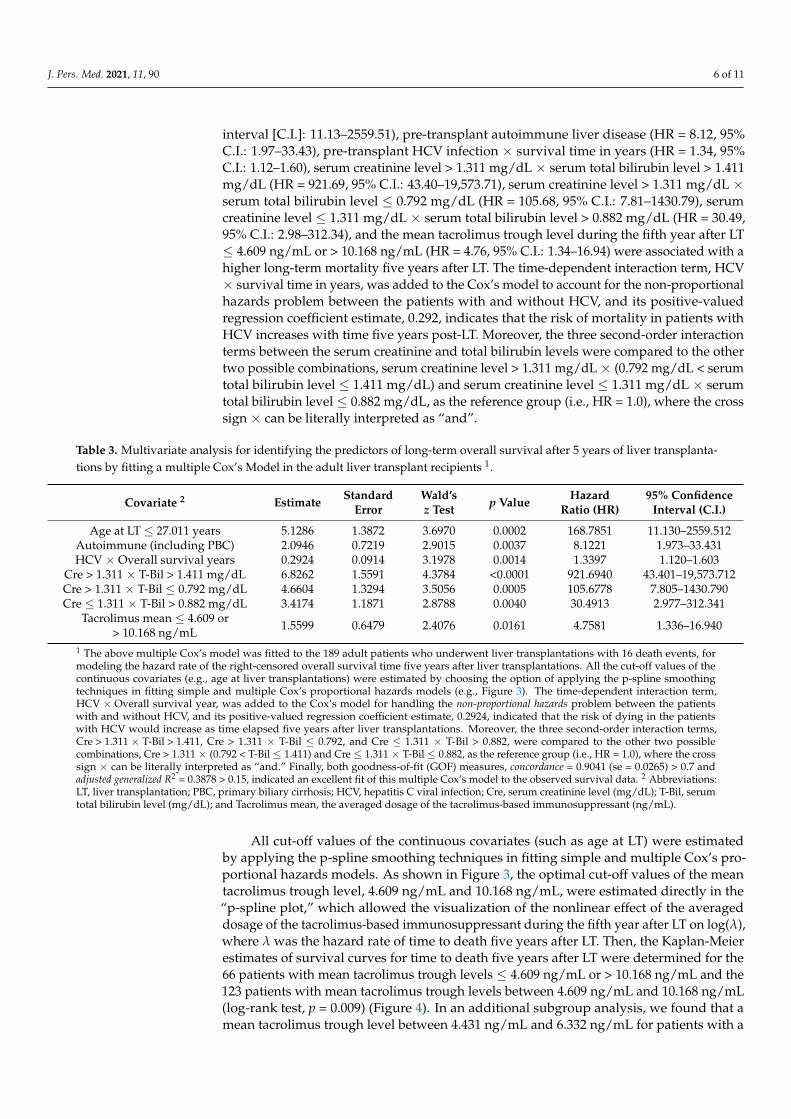
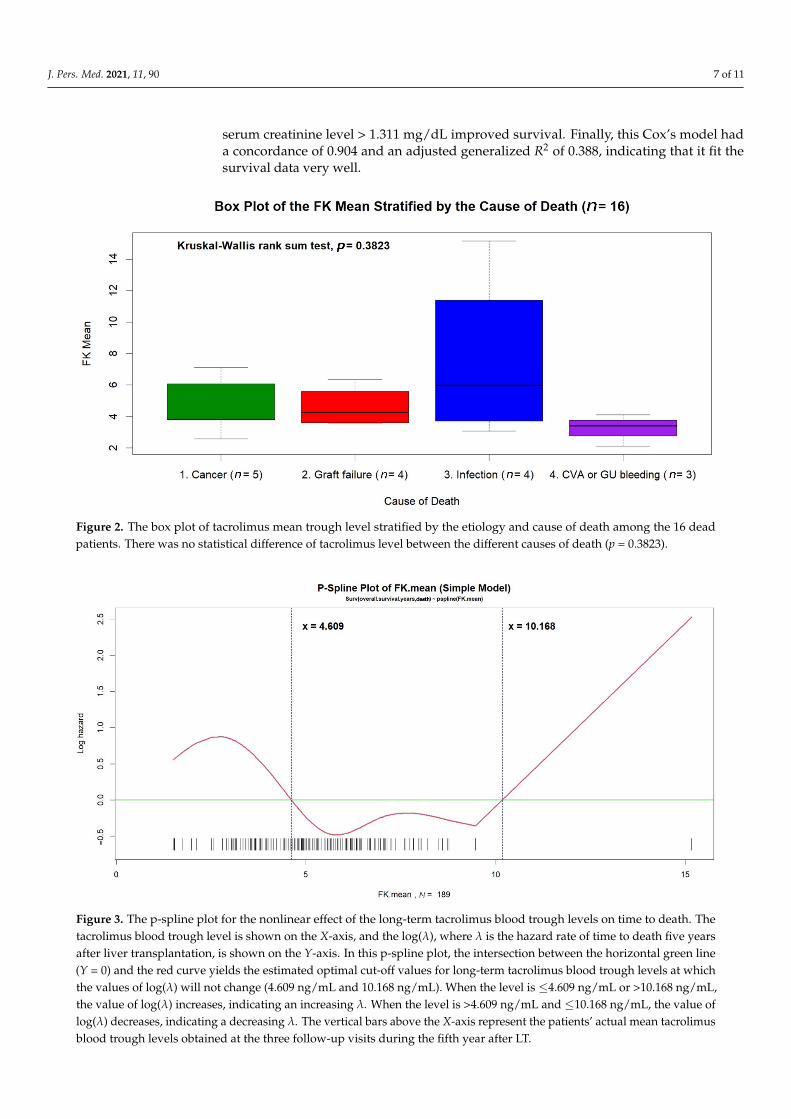
All cut-off values of the continuous covariates (such as age at LT) were estimatedby applying the p-spline smoothing techniques in fitting simple and multiple Cox’s pro-portional hazards models. As shown in Figure 3, the optimal cut-off values of the meantacrolimus trough level, 4.609 ng/mL and 10.168 ng/mL, were estimated directly in the“p-spline plot,” which allowed the visualization of the nonlinear effect of the averageddosage of the tacrolimus-based immunosuppressant during the fifth year after LT on log(λ),where λ was the hazard rate of time to death five years after LT. Then, the Kaplan-Meierestimates of survival curves for time to death five years after LT were determined for the66 patients with mean tacrolimus trough levels ≤ 4.609 ng/mL or > 10.168 ng/mL and the123 patients with mean tacrolimus trough levels between 4.609 ng/mL and 10.168 ng/mL(log-rank test, p = 0.009) (Figure 4). In an additional subgroup analysis, we found that amean tacrolimus trough level between 4.431 ng/mL and 6.332 ng/mL for patients with a
J. Pers. Med. 2021, 11, 90 7 of 11
serum creatinine level > 1.311 mg/dL improved survival. Finally, this Cox’s model hada concordance of 0.904 and an adjusted generalized R2 of 0.388, indicating that it fit thesurvival data very well.
J. Pers. Med. 2021, 11, x FOR PEER REVIEW 6 of 12
was no statistical significance in the tacrolimus trough level between the different causes of death (p = 0.3823).
Table 2. The causes of 16 deaths since 5 years after adult liver transplantations.
Causes of Deaths Number of Subjects Malignancy 5 (31.25%)
De novo: Multiple myeloma, bladder cancer, colon cancer, prostate cancer 4
Recurrent: Hepatocellular carcinoma 1 Graft failure 4 (25.00%)
Chronic rejection 3 Autoimmune hepatitis 1
Infection 4 (25.00%) Pneumonia 3
Urinary tract infection 1 Cerebral vascular event (intracerebral hemorrhage) 2 (12.50%)
Peptic ulcer bleeding 1 (6.25%)
Figure 2. The box plot of tacrolimus mean trough level stratified by the etiology and cause of death among the 16 dead patients. There was no statistical difference of tacrolimus level between the different causes of death (p = 0.3823).
3.2. Predictors of Patients’ Long-Term Survival The Cox’s model fitted to the survival data for the multivariate analyses of the time
to death after five years of LT is shown in Table 3. After adjusting for the effects of the other covariates, age at LT ≤ 27.011 years (estimated hazard ratio [HR] = 168.79, 95% con-fidence interval [C.I.]: 11.13–2559.51), pre-transplant autoimmune liver disease (HR = 8.12, 95% C.I.: 1.97–33.43), pre-transplant HCV infection × survival time in years (HR = 1.34, 95% C.I.: 1.12–1.60), serum creatinine level > 1.311 mg/dL × serum total bilirubin level > 1.411 mg/dL (HR = 921.69, 95% C.I.: 43.40–19,573.71), serum creatinine level > 1.311 mg/dL × serum total bilirubin level ≤ 0.792 mg/dL (HR = 105.68, 95% C.I.: 7.81–1430.79), serum cre-atinine level ≤ 1.311 mg/dL × serum total bilirubin level > 0.882 mg/dL (HR = 30.49, 95% C.I.: 2.98–312.34), and the mean tacrolimus trough level during the fifth year after LT ≤
Figure 2. The box plot of tacrolimus mean trough level stratified by the etiology and cause of death among the 16 deadpatients. There was no statistical difference of tacrolimus level between the different causes of death (p = 0.3823).
Figure 3. The p-spline plot for the nonlinear effect of the long-term tacrolimus blood trough levels on time to death. Thetacrolimus blood trough level is shown on the X-axis, and the log(λ), where λ is the hazard rate of time to death five yearsafter liver transplantation, is shown on the Y-axis. In this p-spline plot, the intersection between the horizontal green line(Y = 0) and the red curve yields the estimated optimal cut-off values for long-term tacrolimus blood trough levels at whichthe values of log(λ) will not change (4.609 ng/mL and 10.168 ng/mL). When the level is ≤4.609 ng/mL or >10.168 ng/mL,the value of log(λ) increases, indicating an increasing λ. When the level is >4.609 ng/mL and ≤10.168 ng/mL, the value oflog(λ) decreases, indicating a decreasing λ. The vertical bars above the X-axis represent the patients’ actual mean tacrolimusblood trough levels obtained at the three follow-up visits during the fifth year after LT.
J. Pers. Med. 2021, 11, 90 8 of 11
J. Pers. Med. 2021, 11, x FOR PEER REVIEW 8 of 12
serum creatinine level > 1.311 mg/dL improved survival. Finally, this Cox’s model had a concordance of 0.904 and an adjusted generalized R2 of 0.388, indicating that it fit the sur-vival data very well.
Figure 3. The p-spline plot for the nonlinear effect of the long-term tacrolimus blood trough levels on time to death. The tacrolimus blood trough level is shown on the X-axis, and the log(λ), where λ is the hazard rate of time to death five years after liver transplantation, is shown on the Y-axis. In this p-spline plot, the intersection between the horizontal green line (Y = 0) and the red curve yields the estimated optimal cut-off values for long-term tacrolimus blood trough levels at which the values of log(λ) will not change (4.609 ng/mL and 10.168 ng/mL). When the level is ≤4.609 ng/mL or >10.168 ng/mL, the value of log(λ) increases, indicating an increasing λ. When the level is >4.609 ng/mL and ≤10.168 ng/mL, the value of log(λ) decreases, indicating a decreasing λ. The vertical bars above the X-axis represent the patients’ actual mean tacroli-mus blood trough levels obtained at the three follow-up visits during the fifth year after LT.
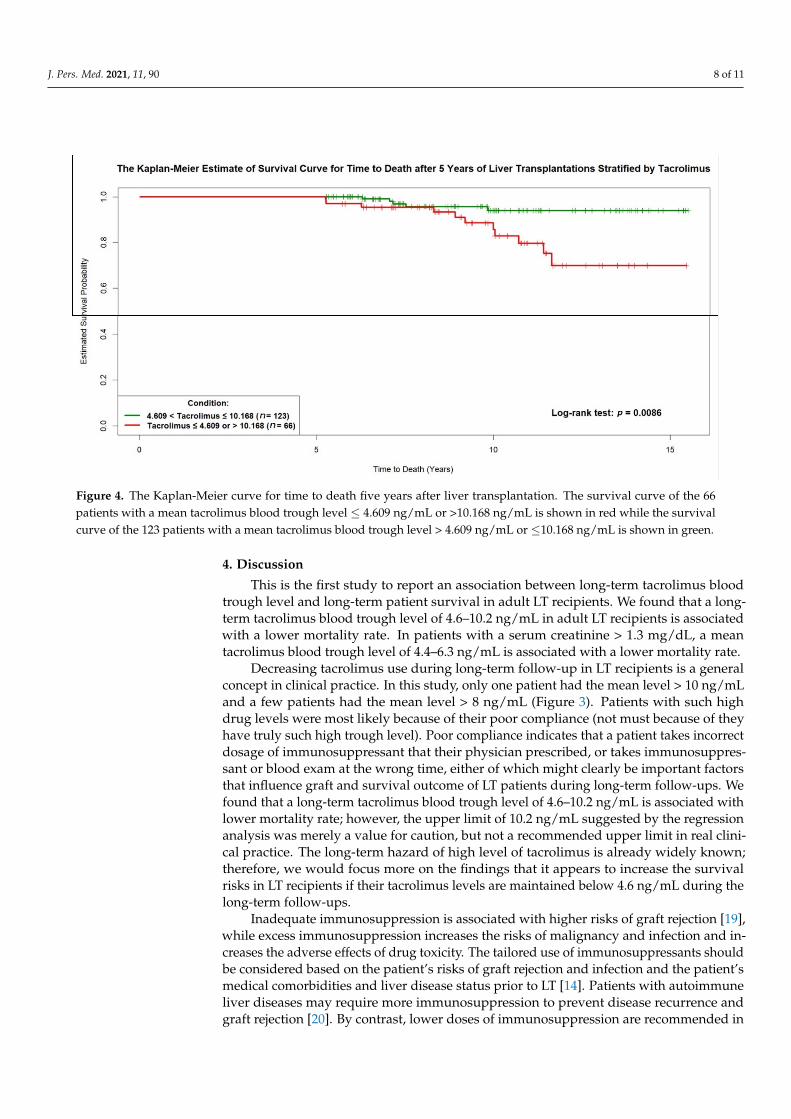
Figure 4. The Kaplan-Meier curve for time to death five years after liver transplantation. The survival curve of the 66patients with a mean tacrolimus blood trough level ≤ 4.609 ng/mL or >10.168 ng/mL is shown in red while the survivalcurve of the 123 patients with a mean tacrolimus blood trough level > 4.609 ng/mL or ≤10.168 ng/mL is shown in green.
4. Discussion
This is the first study to report an association between long-term tacrolimus bloodtrough level and long-term patient survival in adult LT recipients. We found that a long-term tacrolimus blood trough level of 4.6–10.2 ng/mL in adult LT recipients is associatedwith a lower mortality rate. In patients with a serum creatinine > 1.3 mg/dL, a meantacrolimus blood trough level of 4.4–6.3 ng/mL is associated with a lower mortality rate.
Decreasing tacrolimus use during long-term follow-up in LT recipients is a generalconcept in clinical practice. In this study, only one patient had the mean level > 10 ng/mLand a few patients had the mean level > 8 ng/mL (Figure 3). Patients with such highdrug levels were most likely because of their poor compliance (not must because of theyhave truly such high trough level). Poor compliance indicates that a patient takes incorrectdosage of immunosuppressant that their physician prescribed, or takes immunosuppres-sant or blood exam at the wrong time, either of which might clearly be important factorsthat influence graft and survival outcome of LT patients during long-term follow-ups. Wefound that a long-term tacrolimus blood trough level of 4.6–10.2 ng/mL is associated withlower mortality rate; however, the upper limit of 10.2 ng/mL suggested by the regressionanalysis was merely a value for caution, but not a recommended upper limit in real clini-cal practice. The long-term hazard of high level of tacrolimus is already widely known;therefore, we would focus more on the findings that it appears to increase the survivalrisks in LT recipients if their tacrolimus levels are maintained below 4.6 ng/mL during thelong-term follow-ups.
Inadequate immunosuppression is associated with higher risks of graft rejection [19],while excess immunosuppression increases the risks of malignancy and infection and in-creases the adverse effects of drug toxicity. The tailored use of immunosuppressants shouldbe considered based on the patient’s risks of graft rejection and infection and the patient’smedical comorbidities and liver disease status prior to LT [14]. Patients with autoimmuneliver diseases may require more immunosuppression to prevent disease recurrence andgraft rejection [20]. By contrast, lower doses of immunosuppression are recommended in
J. Pers. Med. 2021, 11, 90 9 of 11
patients who have undergone LT due to HCV, as high levels of immunosuppression arerelated to increased viral replication [21,22]. Rejection results in abnormal liver functionand is one of the most important factors associated with poor long-term graft and patientoutcomes [23–25]. Tacrolimus reduces the risk of T-cell mediated rejection to protect graftfunction and is the cornerstone of a successful LT. However, short and long-term adverseeffects of tacrolimus such as infection, chronic renal insufficiency, metabolic diseases (hy-perlipidemia, hypertension, and diabetes mellitus), and malignancy have been widelyreported and influence patients” long-term outcomes [7–9]. The early causes of death afterLT within one year are infection and graft loss, and the late causes of death three yearspost-LT are malignancy, cardiovascular disease, and renal failure [10]. As graft functiontypically stabilizes, factors associated with the long-term outcome are often patient-relatedfactors (such as chronic medical diseases) that are usually associated with tacrolimus.
Previous studies have reported that minimizing tacrolimus use in the early post-LTperiod is associated with a lower risk of new-onset diabetes mellitus [26], a lower incidenceof hyperlipidemia [27], and better long-term survival [19,28]. In recent years, studies havefocused on the reduction or complete withdrawal of long-term immunosuppressants inLT recipients [12,29–34]. One study reported satisfactory outcomes with the combineduse of tacrolimus and mycophenolate mofetil, which allowed for the tacrolimus doseto be reduced [35]. Other studies demonstrated that the concomitant use of everolimusmay reduce the required dose of tacrolimus while having potential renal benefits [29,36].However, only some LT recipients were able to discontinue the use of immunosuppressants,and these patients more frequently experienced biopsy-proven acute rejection [29]. Therisk of chronic rejection during long-term follow-up remains in patients with inadequateimmunosuppression [30,33]. The tacrolimus blood concentration in LT recipients may playa key role in long-term outcomes, as it is associated with long-term graft function and itsadverse effects are related to several chronic medical diseases. However, to the best of ourknowledge, this is the first report regarding the effect of long-term tacrolimus levels on thelong-term survival outcomes of LT recipients.
Several factors are associated with the long-term outcomes of adult LT recipients,including pre-transplant primary sclerosing cholangitis, immunosuppression therapies,acute and chronic rejections, malignancy, and metabolic syndrome [37,38]. As listed inTable 3, we found several independent risk factors of long-term mortality in this study. Onlyfour patients aged <27 years at the time of LT were included in this study, and one dieddue to pneumonia 6.3 years after LT. Patients who underwent LT due to autoimmune liverdiseases had worse outcomes, as they were more likely to experience acute rejections [39]and suffer disease recurrence, leading to graft loss. Patients who underwent LT due to HCVinfections had relatively poor post-LT outcomes due to the disease recurrence followed bygraft dysfunction and failure [40]. As direct-acting antiviral agents have advanced [41], thesurvival outcomes of HCV patients should improve in the near future. Long-term renaland liver functions are reflected by serum creatinine and total bilirubin levels, respectively.We found that abnormal serum creatinine levels have a bigger impact than abnormal serumtotal bilirubin levels on the survival outcomes of LT recipients. The graft function of adultLT recipients is chronically stable five years after LT. While some patients may experienceasymptomatic hyperbilirubinemia at this time, the long-term outcomes remain favorable.By contrast, the gradual deterioration of renal function may lead to chronic kidney diseaseor end-stage renal disease, affecting the long-term survival, especially in patients withlong-term use of tacrolimus.
This study had some limitations. First, the data were obtained from a single medicalcenter in Asia, which provided a relatively small number of eligible patients with singleethnicity and fewer death events. Second, the study spanned a long time period, andtherefore the improvements in surgical and medical expertise and advances in immuno-suppression therapies may have influenced the patient outcomes. Third, we did not collector analyze the time-dependent tacrolimus blood trough level during the follow-up visitsfive years after LT.
J. Pers. Med. 2021, 11, 90 10 of 11
In summary, we found an association between the long-term tacrolimus blood troughlevels and the long-term survival five years after LT. A mean tacrolimus blood trough leveloutside the range of 4.6–10.2 ng/mL appeared to be an independent risk factor for long-term mortality. Further studies with larger sample sizes are needed to verify these resultsand to further identify an appropriate tacrolimus blood trough level for maintenance use.
Author Contributions: C.-Y.H. drafted the manuscript and R.-H.H. designed the study. C.-Y.H.,M.-C.H., and Y.-M.W. conducted data processing, and C.-Y.H. and C.-M.H. performed data analysis.P.-H.L. and R.-H.H. were the directors responsible for general organization and instruction. Allauthors have read and agreed to the published version of the manuscript.
Funding: This research received no external funding.
Institutional Review Board Statement: The study was conducted according to the guidelines ofthe Declaration of Helsinki, and approved by the Institutional Review Board of National TaiwanUniversity Hospital.
Informed Consent Statement: Patient consent was waived due to retrospective design of the study.
Data Availability Statement: The datasets used and analyzed during the current study are availablefrom the corresponding author upon reasonable request.
Acknowledgments: We thank the coordinators (Hui-Ying Lin and Min-Heuy Lin) for their helpfulefforts in data collection.
Conflicts of Interest: The authors declare no conflict of interest.
References1. Adam, R.; Karam, V.; Delvart, V.; O’Grady, J.; Mirza, D.; Klempnauer, J.; Burroughs, A. Evolution of indications and results
of liver transplantation in Europe. A report from the European Liver Transplant Registry (ELTR). J. Hepatol. 2012, 57, 675–688.[CrossRef] [PubMed]
2. Fung, J.; Kelly, D.; Kadry, Z.; Patel-Tom, K.; Eghtesad, B. Immunosuppression in liver transplantation: Beyond calcineurininhibitors. Liver Transpl. 2005, 11, 267–280. [CrossRef] [PubMed]
3. European Association for the Study of the Liver. Electronic address EEE. EASL Clinical Practice Guidelines: Liver transplantation.J. Hepatol. 2016, 64, 433–485. [CrossRef] [PubMed]
4. Wiesner, R.H.; Fung, J.J. Present state of immunosuppressive therapy in liver transplant recipients. Liver Transpl. 2011, 17 (Suppl. 3),S1–S9. [CrossRef] [PubMed]
5. McAlister, V.C.; Haddad, E.; Renouf, E.; Malthaner, R.A.; Kjaer, M.S.; Gluud, L.L. Cyclosporin versus tacrolimus as primaryimmunosuppressant after liver transplantation: A meta-analysis. Am. J. Transplant. 2006, 6, 1578–1585. [CrossRef]
6. O’Grady, J.G.; Hardy, P.; Burroughs, A.K.; Elbourne, D.; UK and Ireland Liver Transplant Study Group. Randomized controlledtrial of tacrolimus versus microemulsified cyclosporin (TMC) in liver transplantation: Poststudy surveillance to 3 years. Am. J.Transplant. 2007, 7, 137–141. [CrossRef]
7. Gonwa, T.A.; Mai, M.L.; Melton, L.B.; Hays, S.R.; Goldstein, R.M.; Levy, M.F. End-stage renal disease (ESRD) after orthotopic livertransplantation (OLTX) using calcineurin-based immunotherapy: Risk of development and treatment. Transplantation 2001, 72,1934–1939. [CrossRef]
8. Dantal, J.; Soulillou, J.P. Immunosuppressive drugs and the risk of cancer after organ transplantation. N. Engl. J. Med. 2005, 352,1371–1373. [CrossRef]
9. Halloran, P.F. Immunosuppressive drugs for kidney transplantation. N. Engl. J. Med. 2004, 351, 2715–2729. [CrossRef]10. Watt, K.D.; Pedersen, R.A.; Kremers, W.K.; Heimbach, J.K.; Charlton, M.R. Evolution of causes and risk factors for mortality
post-liver transplant: Results of the NIDDK long-term follow-up study. Am. J. Transplant. 2010, 10, 1420–1427. [CrossRef]11. Benitez, C.; Londono, M.C.; Miquel, R.; Manzia, T.M.; Abraldes, J.G.; Lozano, J.J. Prospective multicenter clinical trial of immunosup-
pressive drug withdrawal in stable adult liver transplant recipients. Hepatology 2013, 58, 1824–1835. [CrossRef] [PubMed]12. Londono, M.C.; Rimola, A.; O’Grady, J.; Sanchez-Fueyo, A. Immunosuppression minimization vs. complete drug withdrawal in
liver transplantation. J. Hepatol. 2013, 59, 872–879. [CrossRef] [PubMed]13. Lucey, M.R.; Terrault, N.; Ojo, L.; Hay, J.E.; Neuberger, J.; Blumberg, E. Long-term management of the successful adult liver
transplant: 2012 practice guideline by the American Association for the Study of Liver Diseases and the American Society ofTransplantation. Liver Transpl. 2013, 19, 3–26. [CrossRef] [PubMed]
14. Neuberger, J.M.; Bechstein, W.O.; Kuypers, D.R.; Burra, P.; Citterio, F.; De Geest, S.; Duvoux, C.; Jardine, A.G.; Kamar, N.; Krämer,B.K.; et al. Practical Recommendations for Long-term Management of Modifiable Risks in Kidney and Liver Transplant Recipients:A Guidance Report and Clinical Checklist by the Consensus on Managing Modifiable Risk in Transplantation (COMMIT) Group.Transplantation 2017, 101 (Suppl. 2), S1–S56. [CrossRef] [PubMed]
J. Pers. Med. 2021, 11, 90 11 of 11
15. Charlton, M.; Levitsky, J.; Aqel, B.; O’Grady, J.; Hemibach, J.; Rinella, M.; Saliba, F. International Liver Transplantation SocietyConsensus Statement on Immunosuppression in Liver Transplant Recipients. Transplantation 2018, 102, 727–743. [CrossRef]
16. Hu, F.C. My Stepwise: Stepwise Variable Selection Procedures for Regression Analysis. R Package, Version 0.1.0. Available online:https://CRAN.R-project.org/package=My.stepwise (accessed on 12 October 2020).
17. Nagelkerke, N. A note on a general definition of the coefficient of determination. Biometrika 1991, 78, 691–692. [CrossRef]18. Moore, D.F. Applied Survival Analysis Using R; Springer International Publishing: Cham, Switzerland, 2016; pp. 84–85.19. Rodriguez-Peralvarez, M.; Germani, G.; Papastergiou, V.; Tsochatzis, E.; Thalassinos, E.; Luong, T.V. Early tacrolimus exposure
after liver transplantation: Relationship with moderate/severe acute rejection and long-term outcome. J. Hepatol. 2013, 58,262–270. [CrossRef]
20. Khalaf, H.; Mourad, W.; El-Sheikh, Y.; Abdo, A.; Helmy, A.; Medhat, Y. Liver transplantation for autoimmune hepatitis: Asingle-center experience. Transplant. Proc. 2007, 39, 1166–1170. [CrossRef]
21. Grassi, A.; Ballardini, G. Post-liver transplant hepatitis C virus recurrence: An unresolved thorny problem. World J. Gastroenterol.2014, 20, 11095–11115. [CrossRef]
22. Moini, M.; Schilsky, M.L.; Tichy, E.M. Review on immunosuppression in liver transplantation. World J. Hepatol. 2015, 7,1355–1368. [CrossRef]
23. Adams, D.H.; Neuberger, J.M. Patterns of graft rejection following liver transplantation. J. Hepatol. 1990, 10, 113–119. [CrossRef]24. Mor, E.; Gonwa, T.A.; Husberg, B.S.; Goldstein, R.M.; Klintmalm, G.B. Late-onset acute rejection in orthotopic liver transplantation–
associated risk factors and outcome. Transplantation 1992, 54, 821–824. [CrossRef] [PubMed]25. Thurairajah, P.H.; Carbone, M.; Bridgestock, H.; Thomas, P.; Hebbar, S.; Gunson, B.K.; Shah, T.; Neuberger, J. Late acute liver allograft
rejection; a study of its natural history and graft survival in the current era. Transplantation 2013, 95, 955–959. [CrossRef] [PubMed]26. Song, J.L.; Gao, W.; Zhong, Y.; Yan, L.N.; Yang, J.Y.; Wen, T.F.; Yang, J. Minimizing tacrolimus decreases the risk of new-onset
diabetes mellitus after liver transplantation. World J. Gastroenterol. 2016, 22, 2133–2141. [CrossRef] [PubMed]27. Li, H.Y.; Li, B.; Wei, Y.G.; Yan, L.N.; Wen, T.F.; Zhao, J.C. Higher tacrolimus blood concentration is related to hyperlipidemia in
living donor liver transplantation recipients. Dig. Dis. Sci. 2012, 57, 204–209. [CrossRef] [PubMed]28. Jia, J.J.; Lin, B.Y.; He, J.J.; Geng, L.; Kadel, D.; Wang, L.; Yu, D.-D.; Shen, T.; Yang, Z.; Ye, Y.-F.; et al. “Minimizing tacrolimus”
strategy and long-term survival after liver transplantation. World J. Gastroenterol. 2014, 20, 11363–11369. [CrossRef] [PubMed]29. Saliba, F.; Duvoux, C.; Gugenheim, J.; Kamar, N.; Dharancy, S.; Salame, E. Efficacy and Safety of Everolimus and Mycophenolic
Acid with Early Tacrolimus Withdrawal after Liver Transplantation: A Multicenter Randomized Trial. Am. J. Transplant. 2017, 17,1843–1852. [CrossRef] [PubMed]
30. Girlanda, R.; Rela, M.; Williams, R.; O’Grady, J.G.; Heaton, N.D. Long-term outcome of immunosuppression withdrawal afterliver transplantation. Transplant. Proc. 2005, 37, 1708–1709. [CrossRef]
31. Oike, F.; Yokoi, A.; Nishimura, E.; Ogura, Y.; Fujimoto, Y.; Kasahara, M. Complete withdrawal of immunosuppression in livingdonor liver transplantation. Transplant. Proc. 2002, 34, 1521. [CrossRef]
32. Mazariegos, G.V.; Reyes, J.; Marino, I.R.; Demetris, A.J.; Flynn, B.; Irish, W.; Starzl, T.E. Weaning of immunosuppression in livertransplant recipients. Transplantation 1997, 63, 243–249. [CrossRef]
33. Takatsuki, M.; Uemoto, S.; Inomata, Y.; Egawa, H.; Kiuchi, T.; Fujita, S.; Hayashi, M.; Kanematsu, T.; Tanaka, K. Weaning ofimmunosuppression in living donor liver transplant recipients. Transplantation 2001, 72, 449–454. [CrossRef] [PubMed]
34. Tisone, G.; Orlando, G.; Cardillo, A.; Palmieri, G.; Manzia, T.M.; Baiocchi, L. Complete weaning off immunosuppression inHCV liver transplant recipients is feasible and favourably impacts on the progression of disease recurrence. J. Hepatol. 2006, 44,702–709. [CrossRef] [PubMed]
35. Boudjema, K.; Camus, C.; Saliba, F.; Calmus, Y.; Salame, E.; Pageaux, G.; Ducerf, C.; Duvoux, C.; Mouchel, C.; Renault, A.; et al.Reduced-dose tacrolimus with mycophenolate mofetil vs. standard-dose tacrolimus in liver transplantation: A randomized study.Am. J. Transplant. 2011, 11, 965–976. [CrossRef] [PubMed]
36. Fischer, L.; Saliba, F.; Kaiser, G.M.; De Carlis, L.; Metselaar, H.J.; De Simone, P. Three-year Outcomes in De Novo LiverTransplant Patients Receiving Everolimus with Reduced Tacrolimus: Follow-Up Results from a Randomized, Multicenter Study.Transplantation 2015, 99, 1455–1462. [CrossRef] [PubMed]
37. Imai, D.; Yoshizumi, T.; Sakata, K.; Ikegami, T.; Itoh, S.; Harada, N.; Maehara, Y. Long-Term Outcomes and Risk Factors afterAdult Living Donor Liver Transplantation. Transplantation 2018, 102, e382–e391. [CrossRef] [PubMed]
38. Durand, F. How to improve long-term outcome after liver transplantation? Liver Int. 2018, 38 (Suppl. 1), 134–138. [CrossRef]39. Edmunds, C.; Ekong, U.D. Autoimmune Liver Disease Post-Liver Transplantation: A Summary and Proposed Areas for Future
Research. Transplantation 2016, 100, 515–524. [CrossRef]40. Pruthi, J.; Medkiff, K.A.; Esrason, K.T.; Donovan, J.A.; Yoshida, E.M.; Erb, S.R.; Steinbrecher, U.P.; Fong, T.-L. Analysis of causes of
death in liver transplant recipients who survived more than 3 years. Liver Transpl. 2001, 7, 811–815. [CrossRef]41. Suraweera, D.; Sundaram, V.; Saab, S. Treatment of Hepatitis C Virus Infection in Liver Transplant Recipients. Gastroenterol.
Hepatol. (N. Y.) 2016, 12, 23–30.