Embed Size (px)
Citation preview
Clin. Lab. 9/2015 1
Clin. Lab. 2015;61:XXX-XXX ©Copyright
ORIGINAL ARTICLE
Evaluation of the New Cyclosporine and Tacrolimus Automated Electrochemiluminescence Immunoassays under Field Conditions
Barry Toole 1, Cecilia Gechtman 2, Jens Dreier 3, Joachim Kuhn 3, Miguel Rueda Gutierrez 4,
Alan Barrett 5, Christoph Niederau 6
1 Department of Blood Sciences, Freeman Hospital, Newcastle upon Tyne, UK 2 Ospedale Niguarda Ca Granda, Milano, Italy
3 Institute for Laboratory and Transfusion Medicine, Heart and Diabetes Center North Rhine-Westphalia, Ruhr-University Bochum, Bad Oeynhausen, Germany
4 Cruces University Hospital, Bilbao, Spain 5 Department 413, Peterborough City Hospital, Peterborough, UK
6 Department of Clinical Chemistry, Health Care Centre for Laboratory Medicine, Microbiology and Infectious Disease Epidemiology, Dortmund, Germany
SUMMARY
Background: Careful monitoring of the post-transplantation immunosuppressant drugs (ISDs) cyclosporine (CsA) and tacrolimus (TAC) in whole blood is essential to prevent adverse drug events. Immunoassays represent the most widely used methodology for therapeutic drug monitoring. In this study, the technical performance of the new automated electrochemiluminescence immunoassays (ECLIAs) for CsA and TAC measurement were assessed under field conditions. Methods: Residual whole blood samples from patients undergoing CsA or TAC therapy following organ trans-plant were used to evaluate the assays at six independent laboratories across four countries. Experiments included within-run imprecision using PreciControl ISD controls and recovery of commercial external quality assurance (EQA) scheme samples. Both assays were compared with liquid chromatography-tandem mass spectrometry (LC-MS/MS), using methods routinely employed at each investigational site, as well as with an equivalent commercial chemiluminescent microparticle immunoassay (CMIA) and enzyme multiplied immunoassay (EMIT). Results: Within-run imprecision testing gave coefficients of variation of ≤ 5% in the > 90.0 - 2000 ng/mL range for the CsA ECLIA and ≤ 4.2% in the 3.5 - 12 ng/mL range and ≤ 4.9% in the > 12 - 40 ng/mL range for the TAC ECLIA. EQA sample recovery by ECLIA gave a mean bias of 6.9% for CsA and 4.9% for TAC versus the spiked concentration or the mean LC-MS/MS value. Deming regression analysis of ECLIA method comparison to LC-MS/MS for all sites yielded a slope of 1.22, intercept 8.43 ng/mL and r = 0.97 for CsA and a slope of 1.22, intercept -0.51 ng/mL and r = 0.96 for TAC. Comparison with CMIA yielded a slope of 0.87, intercept 5.51 ng/mL and r = 0.97 for CsA and a slope of 0.98, intercept 0.12 ng/mL and r = 0.97 for TAC. Comparison with EMIT yielded a slope of 1.23, intercept -8.74 ng/mL and r = 0.96 for CsA. Conclusions: The CsA and TAC ECLIA compare favorably with existing commercial immunoassays and with LC-MS/MS. They represent modern generation assays that meet the demands of monitoring drug concentrations in current immunosuppressive regimens. This study also highlights the importance of standardizing protocols and LC-MS/MS methods to give improved comparability between ISD assays. (Clin. Lab. 2015;61:xx-xx. DOI: 10.7754/Clin.Lab.2015.150225) Correspondence: Christoph Niederau Department of Clinical Chemistry Health Care Centre for Laboratory Medicine Microbiology and Infectious Disease Epidemiology
Leopold Strasse 10 44147 Dortmund, Germany Phone: +49 231 860270 Fax: +49 231 86027 2810 _____________________________________________ Manuscript accepted March 11, 2015

B. Toole et al.
Clin. Lab. 9/2015 2
KEY WORDS
Cyclosporine, tacrolimus, therapeutic drug monitoring, immunoassay, ECLIA
INTRODUCTION
Cyclosporine A (CsA) was the first calcineurin inhibitor (CNI) to be introduced as an immunosuppressant drug in the 1980s. Over the following years CsA became the cornerstone for preventing rejection in transplantation medicine [1]. In the early 1990s, the discovery of the second genera-tion CNI, tacrolimus (TAC), further enhanced the thera-peutic success of organ transplantation [2]. TAC has subsequently replaced CsA as the first-choice immuno-suppressant. However, as the only immunosuppressant approved for the treatment of bone-marrow graft-ver-sus-host disease, CsA remains an important drug in transplantation medicine. This is especially true given the uncertainty over the higher incidence of diabetes in patients receiving TAC therapy as compared with CsA [3,4]. Following the introduction of TAC, therapeutic drug monitoring (TDM) was recommended. CNIs are critical dose drugs with a narrow therapeutic index between ad-equate immunosuppression and adverse drug events. Therefore, the toxicity profile of CNIs is a continued concern and can lead to poor patient outcome [2-5]. Drug levels also exhibit a high degree of inter- and in-tra-patient variability, and there is a risk of poor or non-compliance due to lifelong reliance on the drug [5]. Treatment strategies often involve combining CNIs with other drugs and significant drug-drug interactions can occur [6]. As a result, effective TDM is extremely important in CNI patients. The need for tight control of immunosuppressive drug levels to maintain each patient’s drug exposure within a narrow therapeutic window has made it extremely im-portant for laboratories to provide rapid and precise drug concentration measurements [5]. The majority of clinical laboratories measure CNIs by semi-automated and automated immunoassays [7]. This is supported by recent surveys, which suggest that 60 - 80% of participating laboratories are using an immu-noassay [8,9]. However, quantification of CNI in blood using liquid chromatography mass spectrometry (LC-MS) and liquid chromatography combined with tandem mass spectrometry (LC-MS/MS) is becoming increas-ingly common [5]. An advantage of using LC-MS/MS is the favorable analytical specificity and sensitivity over existing immunoassays, as well as multiplex test-ing capabilities. However, implementation of LC-MS/ MS into routine clinical laboratories remains a chal-lenge, and the lack of acceptance may reflect the initial high instrument costs, lack of automation, and need for specialized staff training [10]. The use of immunoassays offers flexibility in terms of
operation and timeframe as well as being relatively easy to incorporate into existing automated systems and lab-oratory workflow [10]. However, many of the currently available assays have limited analytical performance and can be susceptible to interference from cross-react-ing drugs, molecules or metabolites, resulting in overes-timation of the drug concentration [11,12]. Only a few of the existing immunoassays offer the requisite sensi-tivity, accuracy, and precision [13-15]. Therefore, the need remains for alternative, robust and time-efficient assays for CsA and TAC to fulfill the therapeutic moni-toring needs of the clinical routine laboratory. The new Elecsys® automated electrochemiluminescence immunoassays (ECLIA) (Roche Diagnostics GmbH, Mannheim, Germany) for the quantification of CsA or TAC in whole blood have been developed to be imple-mented on an existing commercial analyzer, the cobas®e analyzer (Roche Diagnostics GmbH, Rotkreuz, Swit-zerland). Both assays have been shown to be fit for pur-pose for TDM in transplantation medicine in previous analytical evaluations [8,9]. The aim of this study was to assess the technical perfor-mance of both the CsA and TAC ECLIA under field conditions, as well as to generate descriptive data com-paring these assays to LC-MS/MS and routine methods in specific clinical cohorts. These cohorts consist of transplant patients receiving CNI therapy preventing or-gan rejection.
MATERIALS AND METHODS
A multicenter evaluation of the Elecsys® CsA and TAC ECLIA involved six independent laboratories from four countries (UK, Italy, Germany, and Spain), although not all investigations were performed by all sites. Only rem-nant leftover samples from routine testing were used and waivers were obtained from the responsible ethics committees where applicable. All investigational sites conducted the study in accordance with the Declaration of Helsinki (as amended in Tokyo, Venice, and Hong Kong), or country-specific regulations and followed the International Conference on Harmonisation of Techni-cal Requirements for Registration of Pharmaceuticals for Human Use (ICH) Good Clinical Practice guide-lines. ECLIA The ECLIA assays, for use on the cobas e analyzer, use the principle of electrochemiluminescence for detection and measurement of analyte in samples [16]. The ECLIA measuring principle uses a ruthenium-labelled complex and biotinylated analyte-specific antibodies, which are combined with pre-treated samples and re-covered with streptavidin microparticles. Measurements were performed according to the manu-facturer’s instructions. Briefly, the material to be mea-sured (calibrators, quality control [QC] material or pa-tient whole-blood specimen) was equilibrated to room
Evaluation of Cyclosporine and Tacrolimus ECLIA
Clin. Lab. 9/2015 3
temperature (20 - 25°C) and mixed gently but thorough-ly to re-suspend erythrocytes. 300 μL of this material, for both CsA and TAC analysis, was then combined with 300 μL of Elecsys® ISD sample pre-treatment re-agent (Roche Diagnostics GmbH, Mannheim, Germa-ny), in a single pre-treatment step, and vortexed for ≥ 10 seconds. Samples were subsequently centrifuged for 4 minutes at ≥ 10,000 g and the supernatant was trans-ferred to an appropriate vial and capped before being loaded onto the system. Pre-treated samples were stored in closed tubes for up to 4 hours at 20 - 25°C. The TAC and CsA ECLIA were calibrated using their respective CalSet (Roche Diagnostics GmbH, Mann-heim, Germany), each with two concentration levels. Calibrators were reconstituted according to the manu-facturer’s instructions and stored in 300 μL aliquots at 2 - 8°C for 7 days or below -15°C for 28 days. CalSet level 1 and 2 were processed with pre-treatment reagent alongside patient samples (the same for both CsA and TAC immunoassays). Calibration was performed once per reagent lot and as required for maintaining QC val-ues within acceptable limits. The lot calibration stability period was 28 days. The QC to measure appropriate function of the instru-ment was PreciControl ISD (PC ISD) and was provided by Roche Diagnostics, GmbH (Mannheim, Germany). QC samples were prepared and stored in a similar man-ner to calibrators. In order to validate each run, controls were measured prior to the investigation of patient sam-ples and sample measurements were only valid if the corresponding control material fell within the target range. The limit of detection of the CsA and TAC ECLIA assays are 30 ng/mL and 0.5 ng/mL, respective-ly. LC-MS/MS and comparator assays Each site tested the CsA and/or TAC ECLIA and com-pared them with either LC-MS/MS measurements or at least one comparator assay. Details of the comparator assays used by each site are given in Table 1. Sample measurement using chemiluminescent microparticle im-munoassay (CMIA) on the Abbott Architect platform (Abbott Laboratories, Abbott Park, IL, USA) and en-zyme multiplied immunoassay (EMIT) on the Integra 800 platform (Roche Diagnostics GmbH, Mannheim, Germany) were performed according to the manufactur-ers’ instructions and according to site-specific standard operating procedures. The investigational sites utilizing LC-MS/MS performed measurements according to the protocols developed and routinely used at the specific site. Samples EDTA whole-blood samples from patients who had re-ceived a heart, kidney or liver transplant under CsA or TAC therapy were provided based on the availability at the different sites. Details of the cohorts tested at the different sites and the number of samples contributed are given in Table 1. Samples were “remnant” samples,
i.e., leftover from other sampling. Samples to be tested within 8 hours were stored at room temperature (18 - 25°C). Alternatively, samples to be tested within 7 days were stored refrigerated at 2 - 8°C. Where longer storage was required, samples were frozen below -20°C. Samples not available on site were shipped frozen on dry ice in a thermally insulated container and stored at below -20°C until analysis. Samples were measured within 6 months after collection. Aliquoted samples did not undergo more than one freeze/thaw cycle. Frozen samples were thawed and mixed thoroughly before use. Samples were never centrifuged. Assay imprecision The appropriate function of the instrument and the re-agent handling was verified by performing a within-run precision experiment using PC ISD controls at three concentration levels. 21 aliquots were prepared from each level with 300 μL per aliquot. Following system calibration, a single run was performed with 21 repli-cates from each sample material. The acceptance criteria for CsA ECLIA assay impreci-sion were set at a concentration of 30.0 - 90.0 ng/mL: ≤ ± 7.00 ng/mL (SD); at a concentration of > 90.0 - 2000 ng/mL: ≤ 8% (coefficient of variation [CV]). The acceptance criteria for TAC ECLIA assay imprecision were set at a concentration of 0.5 to 3.5 ng/mL: ≤ ± 0.25 ng/mL (SD); at a concentration of > 3.5 - 12 ng/mL: ≤ 5% (CV); and at a concentration of > 12 - 40 ng/mL: ≤ 6% (CV). External quality assurance (EQA) scheme EQA samples from the International Proficiency Test-ing (IPT) scheme organized by Analytical Services In-ternational (ASI Ltd, London, UK) were measured at all investigational sites by ECLIA, LC-MS/MS, CMIA or EMIT. The scheme includes samples that are either spiked to a known concentration (“spiked” samples) or pooled patient samples. All instruments were calibrated before the experimental run. Samples were measured in triplicate in a single analytical run for each sample ma-terial. For each EQA sample, bias relative to the spiked value for spiked samples, or to the mean LC-MS/MS value from the overall EQA group results (as displayed on the IPT reports) for pooled samples, was calculated for the ECLIA, LC-MS/MS, CMIA, and EMIT method means. Method comparison The method comparison experiment was performed at all investigational sites, comparing the ECLIA on cobas e 411, e 601, e 602 and modular analytics platforms with either LC-MS/MS or an alternative comparator im-munoassay (depending on the site) for CsA or TAC. Remnant samples from patient cohorts for heart, liver or kidney were measured with one replicate per method. More than 60 samples per tested cohort and a minimum of 120 samples over all cohorts were measured for each assay. Comparisons were calculated using weighted
B. Toole et al.
Clin. Lab. 9/2015 4
Deming regression. Results were rated against the following criteria. CsA ECLIA versus LC-MS/MS: Slope 1.00 ± 0.20; intercept ≤ ± 30.0 ng/mL; Pearson’s correlation r ≥ 0.9; SD for Deming on ECLIA CV = 10%. CsA ECLIA versus CMIA: Slope 1.00 ± 0.20; intercept ≤ ± 30.0 ng/mL; Pearson’s correlation r ≥ 0.9; SD for Deming on CMIA = 15% and ECLIA CV = 10%. TAC ECLIA versus LC-MS/MS: Slope 1.00 ± 0.20; intercept ≤ ± 0.5 ng/mL; Pearson’s correlation r > 0.9; SD for Deming on ECLIA CV = 5%. TAC ECLIA versus CMIA: Slope 1.00 ± 0.20; intercept ≤ ± 0.5 ng/mL; Pearson’s correlation r > 0.9, SD for Deming on ECLIA CV = 7% and CMIA CV = 10%. To gain further information on method comparability, Bland-Altman difference plots were evaluated. Discrepant results Discrepant results were resolved by comparing them with the respective results obtained with LC-MS/MS. All results displaying a greater than 40% difference to LC-MS/MS were considered discrepant. If sufficient sample volume remained, the sample was re-tested in triplicate using all analyzers. Where insufficient sample volume was available, testing was repeated in triplicate using the assay which showed the discrepant value. Where sample volumes were very low, single or dupli-cate testing was used. Statistical analysis Statistical analysis was performed using the Windows-based Computer Aided Evaluation (WinCAEv) data capture software to calculate slope, intercept, and Pear-son’s r.
RESULTS
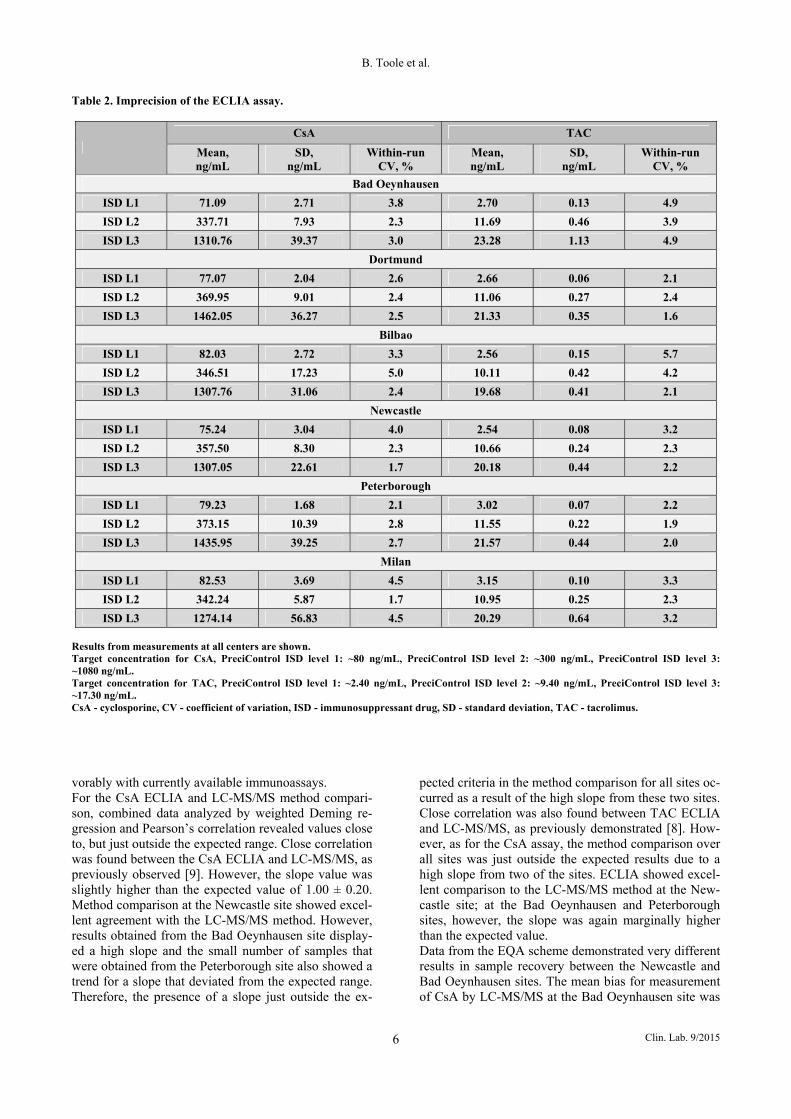
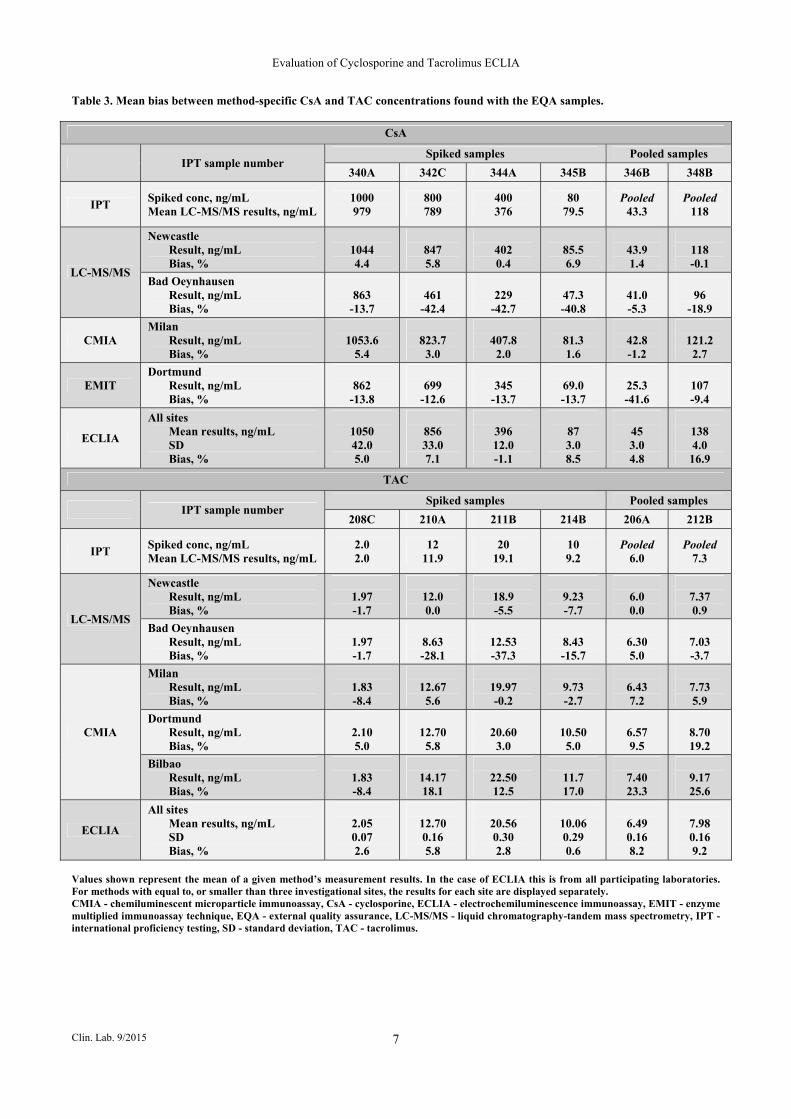
Assay imprecision Results for within-run precision of the ECLIA are given in Table 2. For the CsA ECLIA all sample concentra-tions > 90.0 - 2000 ng/mL had a within-run CV ≤ 5% (within the acceptance criteria). For the TAC ECLIA all sample concentrations between 3.5 - 12 ng/mL had a within-run CV ≤ 4.2%, and all sample concentrations between 12 - 40 ng/mL had a within-run CV ≤ 4.9% (within acceptance criteria). EQA scheme Results from the EQA sample measurements are out-lined in Table 3. The mean of all sites is presented for the ECLIA. For all other methods tested, the results for each site are displayed separately. ECLIA yielded a mean bias of 6.9% and 4.9% for CsA and TAC samples, respectively, across all sites. For CsA samples, a mean bias of 3.1% was found for LC-MS/MS at the Newcas-tle site and a mean bias of -27.3% at the Bad Oeyn-hausen site. A mean bias of 2.3% and -17.5% was found using CMIA and EMIT, respectively. For TAC sam-
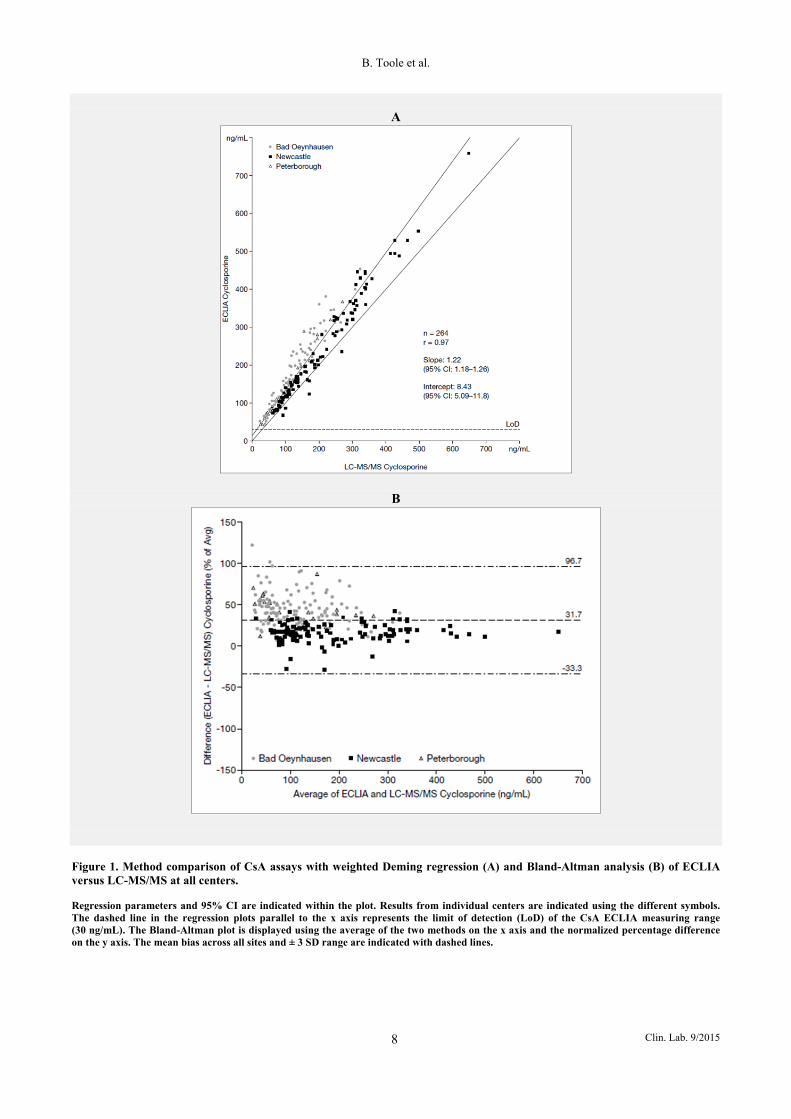
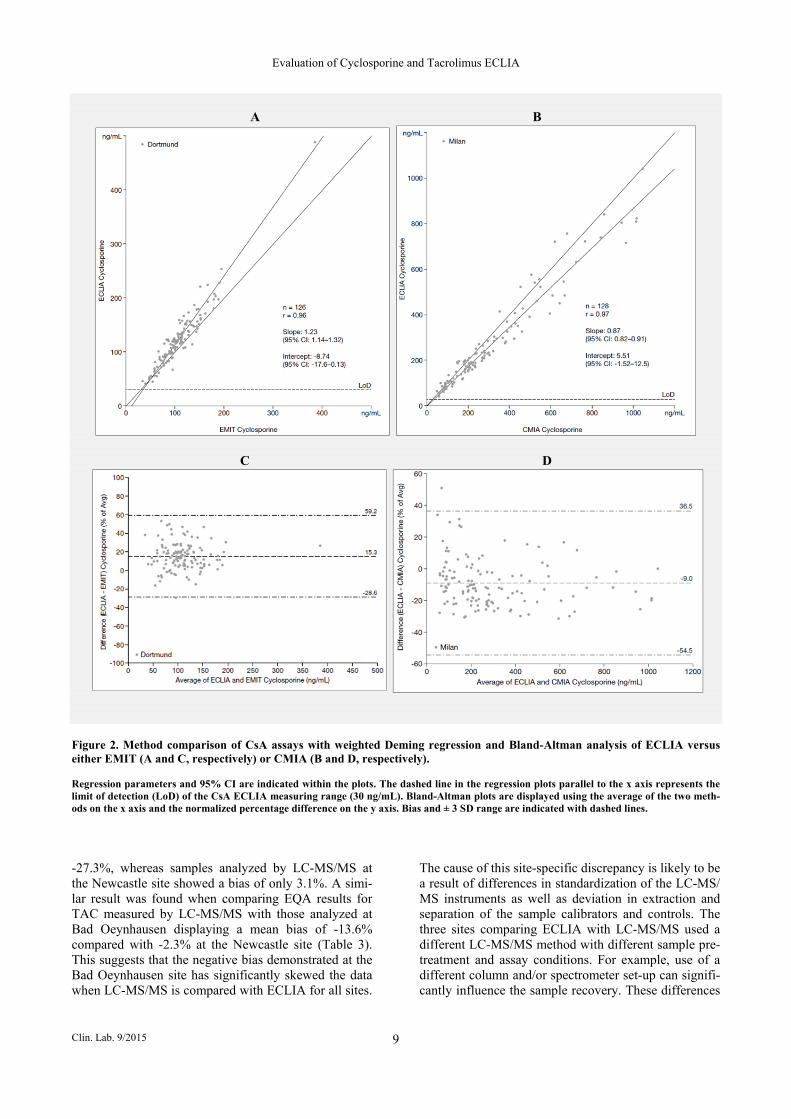
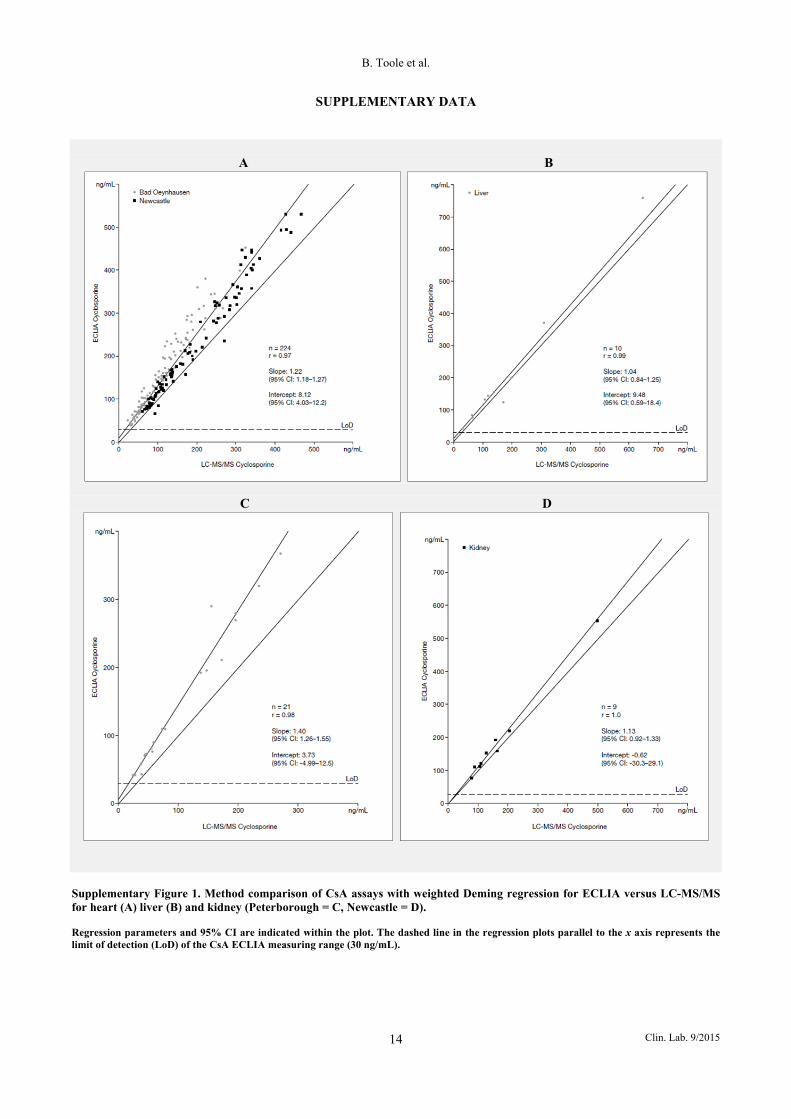
ples, a mean bias of -2.3% was found for LC-MS/MS at the Newcastle site and -13.6% at the Bad Oeynhausen site. CMIA yielded a mean bias of 1.2%, 7.9%, and 14.7% at the Milan, Dortmund, and Bilbao sites, respec-tively. Method comparison Comparability of CsA and TAC ECLIA results with LC-MS/MS and alternative routine assays were investi-gated for specimens derived from heart, liver, and kid-ney recipients using weighted Deming regression analy-sis. Comparison of CsA assays Figure 1A shows the weighted Deming regression of the CsA LC-MS/MS measurements versus ECLIA for 264 samples from all sites and cohorts (Bad Oeynhau-sen, n = 123; Newcastle, n = 120; Peterborough, n = 21). Assay-specific results were combined for the evaluation. The slope value for all transplant patients was 1.22 (95% CI: 1.18 - 1.26), the intercept was 8.43 ng/mL (95% CI: 5.09 - 11.8 ng/mL) and Pearson’s correlation r was 0.97. The expected results were met at the Newcastle site (slope 1.16, 95% CI: 1.11 - 1.21; in-tercept -0.74 ng/mL, 95% CI -7.52 - 6.05; Pearson’s correlation r = 0.99). However, the slope from samples measured at the Bad Oeynhausen site did not meet the expected results (slope 1.39, 95% CI: 1.31 - 1.46; inter-cept 4.14 ng/mL, 95% CI -1.49 - 9.77; Pearson’s corre-lation r = 0.97). In addition, only 21 samples could be measured at the Peterborough site due to sample un-availability. Therefore, the method comparison over all sites did not quite meet the expected criteria due to the high slope. Pearson’s correlation r was very similar for the global comparison and the three individual patient cohorts (heart = 0.97, liver = 0.99, and kidney > 0.9) (Supplementary Figure 1). The bias between the ECLIA and LC-MS/MS methods for CsA is demonstrated in the Bland-Altman difference plot shown for each site in Figure 1B. The mean bias at the Newcastle site was 16.3% (± 3 SD: -17.6 - 50.2%), compared with 44.2% (± 3 SD: -16.7 - 105.2%) at Bad Oeynhausen and 46.5% (± 3 SD: -1.2 - 94.3%) at Peterborough. Results of the comparison between CsA ECLIA and EMIT for all the available cohorts are shown in Figure 2A (Dortmund, n = 126). The slope value was 1.23 (95% CI: 1.14 - 1.32), intercept -8.74 ng/mL (95% CI: -17.6 - 0.13 ng/mL) and Pearson’s correlation r was 0.96. The comparison between CsA ECLIA and CMIA for all cohorts is shown in Figure 2B (Milan, n = 128). The slope value was 0.87 (95% CI: 0.82 - 0.91), inter-cept 5.51 ng/mL (95% CI: -1.52 - 12.5 ng/mL) and Pearson’s correlation r was 0.97. These results were well within the pre-defined expected ranges. Pearson’s correlation r was the same for the global comparison and the individual patient cohorts (Supplementary Fig-ure 2). The Bland-Altman difference plots for CsA ECLIA versus EMIT and CMIA are shown in Figure 2C and 2D. Comparison of ECLIA and EMIT gave an
Evaluation of Cyclosporine and Tacrolimus ECLIA
Clin. Lab. 9/2015 5
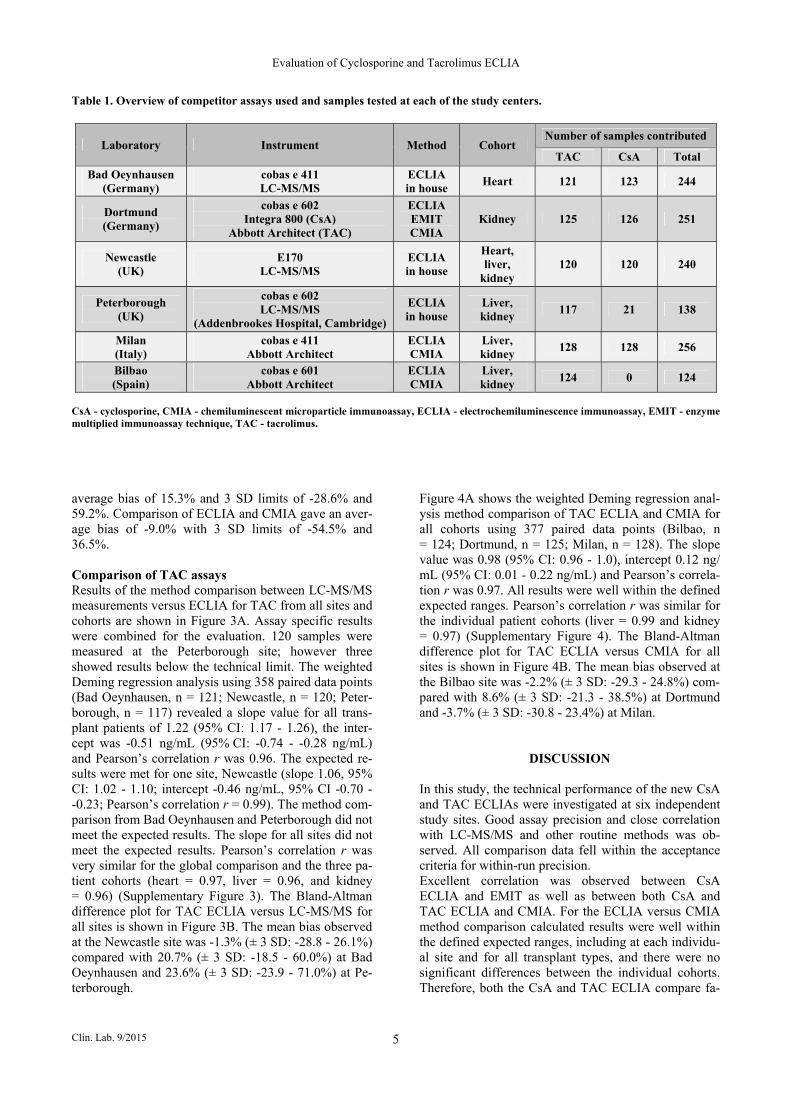
Table 1. Overview of competitor assays used and samples tested at each of the study centers.
CsA - cyclosporine, CMIA - chemiluminescent microparticle immunoassay, ECLIA - electrochemiluminescence immunoassay, EMIT - enzyme multiplied immunoassay technique, TAC - tacrolimus. average bias of 15.3% and 3 SD limits of -28.6% and 59.2%. Comparison of ECLIA and CMIA gave an aver-age bias of -9.0% with 3 SD limits of -54.5% and 36.5%. Comparison of TAC assays Results of the method comparison between LC-MS/MS measurements versus ECLIA for TAC from all sites and cohorts are shown in Figure 3A. Assay specific results were combined for the evaluation. 120 samples were measured at the Peterborough site; however three showed results below the technical limit. The weighted Deming regression analysis using 358 paired data points (Bad Oeynhausen, n = 121; Newcastle, n = 120; Peter-borough, n = 117) revealed a slope value for all trans-plant patients of 1.22 (95% CI: 1.17 - 1.26), the inter-cept was -0.51 ng/mL (95% CI: -0.74 - -0.28 ng/mL) and Pearson’s correlation r was 0.96. The expected re-sults were met for one site, Newcastle (slope 1.06, 95% CI: 1.02 - 1.10; intercept -0.46 ng/mL, 95% CI -0.70 - -0.23; Pearson’s correlation r = 0.99). The method com-parison from Bad Oeynhausen and Peterborough did not meet the expected results. The slope for all sites did not meet the expected results. Pearson’s correlation r was very similar for the global comparison and the three pa-tient cohorts (heart = 0.97, liver = 0.96, and kidney = 0.96) (Supplementary Figure 3). The Bland-Altman difference plot for TAC ECLIA versus LC-MS/MS for all sites is shown in Figure 3B. The mean bias observed at the Newcastle site was -1.3% (± 3 SD: -28.8 - 26.1%) compared with 20.7% (± 3 SD: -18.5 - 60.0%) at Bad Oeynhausen and 23.6% (± 3 SD: -23.9 - 71.0%) at Pe-terborough.
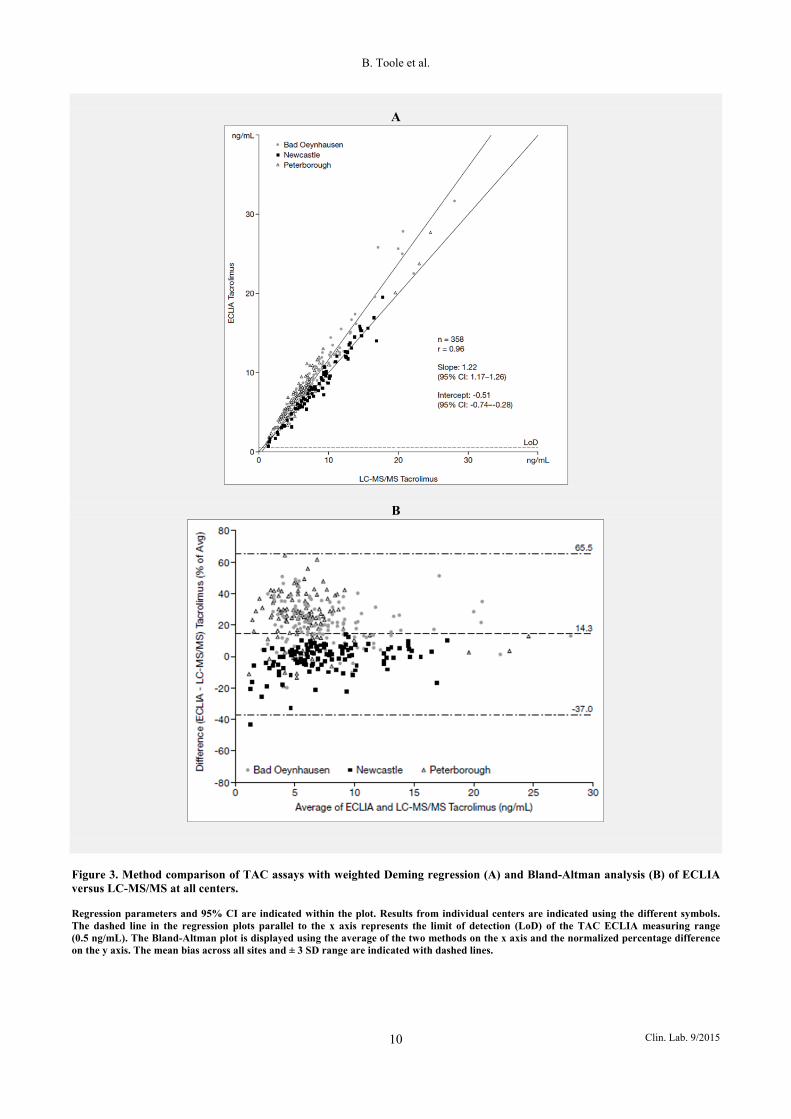
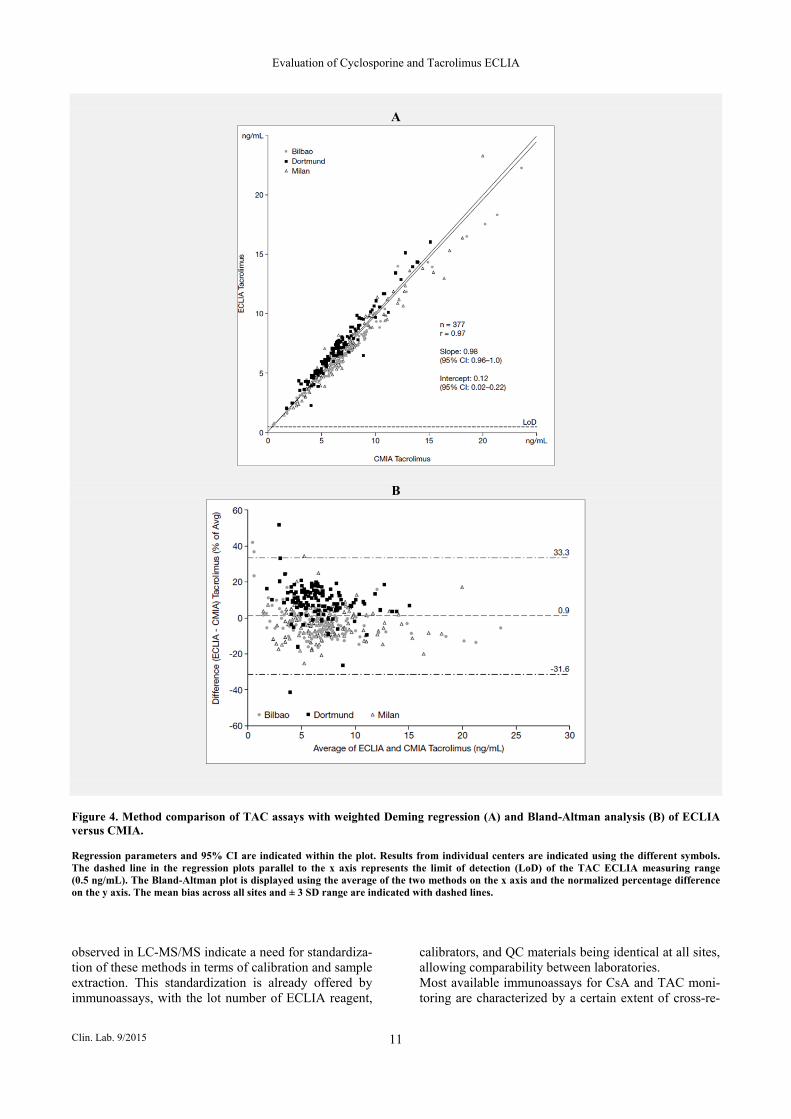
Figure 4A shows the weighted Deming regression anal-ysis method comparison of TAC ECLIA and CMIA for all cohorts using 377 paired data points (Bilbao, n = 124; Dortmund, n = 125; Milan, n = 128). The slope value was 0.98 (95% CI: 0.96 - 1.0), intercept 0.12 ng/ mL (95% CI: 0.01 - 0.22 ng/mL) and Pearson’s correla-tion r was 0.97. All results were well within the defined expected ranges. Pearson’s correlation r was similar for the individual patient cohorts (liver = 0.99 and kidney = 0.97) (Supplementary Figure 4). The Bland-Altman difference plot for TAC ECLIA versus CMIA for all sites is shown in Figure 4B. The mean bias observed at the Bilbao site was -2.2% (± 3 SD: -29.3 - 24.8%) com-pared with 8.6% (± 3 SD: -21.3 - 38.5%) at Dortmund and -3.7% (± 3 SD: -30.8 - 23.4%) at Milan.
DISCUSSION
In this study, the technical performance of the new CsA and TAC ECLIAs were investigated at six independent study sites. Good assay precision and close correlation with LC-MS/MS and other routine methods was ob-served. All comparison data fell within the acceptance criteria for within-run precision. Excellent correlation was observed between CsA ECLIA and EMIT as well as between both CsA and TAC ECLIA and CMIA. For the ECLIA versus CMIA method comparison calculated results were well within the defined expected ranges, including at each individu-al site and for all transplant types, and there were no significant differences between the individual cohorts. Therefore, both the CsA and TAC ECLIA compare fa-
Laboratory Instrument Method Cohort Number of samples contributed
TAC CsA Total
Bad Oeynhausen (Germany)
cobas e 411 LC-MS/MS
ECLIA in house
Heart 121 123 244
Dortmund (Germany)
cobas e 602 Integra 800 (CsA)
Abbott Architect (TAC)
ECLIA EMIT CMIA
Kidney 125 126 251
Newcastle (UK)
E170 LC-MS/MS
ECLIA in house
Heart, liver,
kidney 120 120 240
Peterborough (UK)
cobas e 602 LC-MS/MS
(Addenbrookes Hospital, Cambridge)
ECLIA in house
Liver, kidney
117 21 138
Milan (Italy)
cobas e 411 Abbott Architect
ECLIA CMIA
Liver, kidney
128 128 256
Bilbao (Spain)
cobas e 601 Abbott Architect
ECLIA CMIA
Liver, kidney
124 0 124
B. Toole et al.
Clin. Lab. 9/2015 6
Table 2. Imprecision of the ECLIA assay.
CsA TAC
Mean, ng/mL
SD, ng/mL
Within-run CV, %
Mean, ng/mL
SD, ng/mL
Within-run CV, %
Bad Oeynhausen
ISD L1 71.09 2.71 3.8 2.70 0.13 4.9
ISD L2 337.71 7.93 2.3 11.69 0.46 3.9
ISD L3 1310.76 39.37 3.0 23.28 1.13 4.9
Dortmund
ISD L1 77.07 2.04 2.6 2.66 0.06 2.1
ISD L2 369.95 9.01 2.4 11.06 0.27 2.4
ISD L3 1462.05 36.27 2.5 21.33 0.35 1.6
Bilbao
ISD L1 82.03 2.72 3.3 2.56 0.15 5.7
ISD L2 346.51 17.23 5.0 10.11 0.42 4.2
ISD L3 1307.76 31.06 2.4 19.68 0.41 2.1
Newcastle
ISD L1 75.24 3.04 4.0 2.54 0.08 3.2
ISD L2 357.50 8.30 2.3 10.66 0.24 2.3
ISD L3 1307.05 22.61 1.7 20.18 0.44 2.2
Peterborough
ISD L1 79.23 1.68 2.1 3.02 0.07 2.2
ISD L2 373.15 10.39 2.8 11.55 0.22 1.9
ISD L3 1435.95 39.25 2.7 21.57 0.44 2.0
Milan
ISD L1 82.53 3.69 4.5 3.15 0.10 3.3
ISD L2 342.24 5.87 1.7 10.95 0.25 2.3
ISD L3 1274.14 56.83 4.5 20.29 0.64 3.2 Results from measurements at all centers are shown. Target concentration for CsA, PreciControl ISD level 1: ~80 ng/mL, PreciControl ISD level 2: ~300 ng/mL, PreciControl ISD level 3: ~1080 ng/mL. Target concentration for TAC, PreciControl ISD level 1: ~2.40 ng/mL, PreciControl ISD level 2: ~9.40 ng/mL, PreciControl ISD level 3: ~17.30 ng/mL. CsA - cyclosporine, CV - coefficient of variation, ISD - immunosuppressant drug, SD - standard deviation, TAC - tacrolimus. vorably with currently available immunoassays. For the CsA ECLIA and LC-MS/MS method compari-son, combined data analyzed by weighted Deming re-gression and Pearson’s correlation revealed values close to, but just outside the expected range. Close correlation was found between the CsA ECLIA and LC-MS/MS, as previously observed [9]. However, the slope value was slightly higher than the expected value of 1.00 ± 0.20. Method comparison at the Newcastle site showed excel-lent agreement with the LC-MS/MS method. However, results obtained from the Bad Oeynhausen site display-ed a high slope and the small number of samples that were obtained from the Peterborough site also showed a trend for a slope that deviated from the expected range. Therefore, the presence of a slope just outside the ex-
pected criteria in the method comparison for all sites oc-curred as a result of the high slope from these two sites. Close correlation was also found between TAC ECLIA and LC-MS/MS, as previously demonstrated [8]. How-ever, as for the CsA assay, the method comparison over all sites was just outside the expected results due to a high slope from two of the sites. ECLIA showed excel-lent comparison to the LC-MS/MS method at the New-castle site; at the Bad Oeynhausen and Peterborough sites, however, the slope was again marginally higher than the expected value. Data from the EQA scheme demonstrated very different results in sample recovery between the Newcastle and Bad Oeynhausen sites. The mean bias for measurement of CsA by LC-MS/MS at the Bad Oeynhausen site was
Evaluation of Cyclosporine and Tacrolimus ECLIA
Clin. Lab. 9/2015 7
Table 3. Mean bias between method-specific CsA and TAC concentrations found with the EQA samples.
CsA
IPT sample number Spiked samples Pooled samples
340A 342C 344A 345B 346B 348B
IPT Spiked conc, ng/mL Mean LC-MS/MS results, ng/mL
1000 979
800 789
400 376
80 79.5
Pooled 43.3
Pooled 118
LC-MS/MS
Newcastle Result, ng/mL Bias, %
1044 4.4
847 5.8
402 0.4
85.5 6.9
43.9 1.4
118 -0.1
Bad Oeynhausen Result, ng/mL Bias, %
863
-13.7
461
-42.4
229
-42.7
47.3 -40.8
41.0 -5.3
96
-18.9
CMIA Milan Result, ng/mL Bias, %
1053.6
5.4
823.7 3.0
407.8 2.0
81.3 1.6
42.8 -1.2
121.2 2.7
EMIT Dortmund Result, ng/mL Bias, %
862
-13.8
699
-12.6
345
-13.7
69.0 -13.7
25.3 -41.6
107 -9.4
ECLIA
All sites Mean results, ng/mL SD Bias, %
1050 42.0 5.0
856 33.0 7.1
396 12.0 -1.1
87 3.0 8.5
45 3.0 4.8
138 4.0 16.9
TAC
IPT sample number Spiked samples Pooled samples
208C 210A 211B 214B 206A 212B
IPT Spiked conc, ng/mL Mean LC-MS/MS results, ng/mL
2.0 2.0
12 11.9
20 19.1
10 9.2
Pooled 6.0
Pooled 7.3
LC-MS/MS
Newcastle Result, ng/mL Bias, %
1.97 -1.7
12.0 0.0
18.9 -5.5
9.23 -7.7
6.0 0.0
7.37 0.9
Bad Oeynhausen Result, ng/mL Bias, %
1.97 -1.7
8.63 -28.1
12.53 -37.3
8.43 -15.7
6.30 5.0
7.03 -3.7
CMIA
Milan Result, ng/mL Bias, %
1.83 -8.4
12.67 5.6
19.97 -0.2
9.73 -2.7
6.43 7.2
7.73 5.9
Dortmund Result, ng/mL Bias, %
2.10 5.0
12.70 5.8
20.60 3.0
10.50 5.0
6.57 9.5
8.70 19.2
Bilbao Result, ng/mL Bias, %
1.83 -8.4
14.17 18.1
22.50 12.5
11.7 17.0
7.40 23.3
9.17 25.6
ECLIA
All sites Mean results, ng/mL SD Bias, %
2.05 0.07 2.6
12.70 0.16 5.8
20.56 0.30 2.8
10.06 0.29 0.6
6.49 0.16 8.2
7.98 0.16 9.2
Values shown represent the mean of a given method’s measurement results. In the case of ECLIA this is from all participating laboratories. For methods with equal to, or smaller than three investigational sites, the results for each site are displayed separately. CMIA - chemiluminescent microparticle immunoassay, CsA - cyclosporine, ECLIA - electrochemiluminescence immunoassay, EMIT - enzyme multiplied immunoassay technique, EQA - external quality assurance, LC-MS/MS - liquid chromatography-tandem mass spectrometry, IPT - international proficiency testing, SD - standard deviation, TAC - tacrolimus.
B. Toole et al.
Clin. Lab. 9/2015 8
A
B
Figure 1. Method comparison of CsA assays with weighted Deming regression (A) and Bland-Altman analysis (B) of ECLIA versus LC-MS/MS at all centers. Regression parameters and 95% CI are indicated within the plot. Results from individual centers are indicated using the different symbols. The dashed line in the regression plots parallel to the x axis represents the limit of detection (LoD) of the CsA ECLIA measuring range (30 ng/mL). The Bland-Altman plot is displayed using the average of the two methods on the x axis and the normalized percentage difference on the y axis. The mean bias across all sites and ± 3 SD range are indicated with dashed lines.
Evaluation of Cyclosporine and Tacrolimus ECLIA
Clin. Lab. 9/2015 9
A B
C D
Figure 2. Method comparison of CsA assays with weighted Deming regression and Bland-Altman analysis of ECLIA versus either EMIT (A and C, respectively) or CMIA (B and D, respectively). Regression parameters and 95% CI are indicated within the plots. The dashed line in the regression plots parallel to the x axis represents the limit of detection (LoD) of the CsA ECLIA measuring range (30 ng/mL). Bland-Altman plots are displayed using the average of the two meth-ods on the x axis and the normalized percentage difference on the y axis. Bias and ± 3 SD range are indicated with dashed lines. -27.3%, whereas samples analyzed by LC-MS/MS at the Newcastle site showed a bias of only 3.1%. A simi-lar result was found when comparing EQA results for TAC measured by LC-MS/MS with those analyzed at Bad Oeynhausen displaying a mean bias of -13.6% compared with -2.3% at the Newcastle site (Table 3). This suggests that the negative bias demonstrated at the Bad Oeynhausen site has significantly skewed the data when LC-MS/MS is compared with ECLIA for all sites.
The cause of this site-specific discrepancy is likely to be a result of differences in standardization of the LC-MS/ MS instruments as well as deviation in extraction and separation of the sample calibrators and controls. The three sites comparing ECLIA with LC-MS/MS used a different LC-MS/MS method with different sample pre-treatment and assay conditions. For example, use of a different column and/or spectrometer set-up can signifi-cantly influence the sample recovery. These differences
B. Toole et al.
Clin. Lab. 9/2015 10
A
B
Figure 3. Method comparison of TAC assays with weighted Deming regression (A) and Bland-Altman analysis (B) of ECLIA versus LC-MS/MS at all centers. Regression parameters and 95% CI are indicated within the plot. Results from individual centers are indicated using the different symbols. The dashed line in the regression plots parallel to the x axis represents the limit of detection (LoD) of the TAC ECLIA measuring range (0.5 ng/mL). The Bland-Altman plot is displayed using the average of the two methods on the x axis and the normalized percentage difference on the y axis. The mean bias across all sites and ± 3 SD range are indicated with dashed lines.
Evaluation of Cyclosporine and Tacrolimus ECLIA
Clin. Lab. 9/2015 11
A
B
Figure 4. Method comparison of TAC assays with weighted Deming regression (A) and Bland-Altman analysis (B) of ECLIA versus CMIA. Regression parameters and 95% CI are indicated within the plot. Results from individual centers are indicated using the different symbols. The dashed line in the regression plots parallel to the x axis represents the limit of detection (LoD) of the TAC ECLIA measuring range (0.5 ng/mL). The Bland-Altman plot is displayed using the average of the two methods on the x axis and the normalized percentage difference on the y axis. The mean bias across all sites and ± 3 SD range are indicated with dashed lines. observed in LC-MS/MS indicate a need for standardiza-tion of these methods in terms of calibration and sample extraction. This standardization is already offered by immunoassays, with the lot number of ECLIA reagent,
calibrators, and QC materials being identical at all sites, allowing comparability between laboratories. Most available immunoassays for CsA and TAC moni-toring are characterized by a certain extent of cross-re-
B. Toole et al.
Clin. Lab. 9/2015 12
activity with therapeutically active metabolites, al-though this is largely accepted in clinical practice [17]. Due to its high level of analytical specificity, LC-MS/ MS does not detect these molecules, which might ex-plain some of the discrepancies observed. Cross-reactivity with metabolites commonly found in whole blood was evaluated by the manufacturers during ECLIA development for both CNIs. The only reported cross-reactivity from TAC metabolites for the TAC ECLIA occurred with the active metabolite, M-II (~70%) [18]. The cross-reactivity observed here is low-er than that demonstrated for the CMIA (94%). Cross-reactivity with pharmacologically inactive TAC metab-olites was reported for CMIA (~45%) and antibody-conjugated magnetic immunoassay (ACMIA) (~18%); however, ECLIA is not affected [15,19]. The CsA ECLIA also has significantly reduced CsA metabolite interference relative to other commonly used immuno-assays, with a cross-reactivity of 6% for AM9, 2% for AM1 and AM4n, and no detectable cross-reactivity for AM1c, AM1c9, and AM19 [20,21]. Conversely, CMIA detected all tested metabolites [21]. Given that the cross-reactivity of both CNI ECLIAs has been shown to be low, the difference in LC-MS/MS method standardi-zation is the most likely cause of the observed discrep-ancies in results. It is interesting to see from this study that, despite the intrinsic difference in their methodolo-gy, comparability between LC-MS/MS and the ECLIA was still good. Both the CsA and TAC ECLIA have demonstrated ex-cellent overall performance in previous analytical evalu-ations, and offer high precision and compare favorably with LC-MS/MS and other routine assays under field conditions [8,9], which is consistent with other compar-isons of routinely used immunoassays versus LC-MS/ MS [22,23]. The ECLIAs were found to be easy to handle, with a calibration curve of only two points providing a signifi-cant time-saving compared to the seven-point calibra-tion most commonly applied for LC-MS/MS assays. This ease of use was found despite the inclusion of a manual protein precipitation step before automated analysis. This extra step ensures removal of endogenous antibodies, which can cause interference, and utilizes a single pre-treatment reagent and handling procedure for both CsA and TAC assays, thereby reducing the risk of operator handling errors and contributing to the ease of use of the assays. Endogenous antibodies have been shown to interfere with several immunoassays, particu-larly the ACMIA method, which does not include a pro-tein precipitation step, causing false-positive results [17,24-27]. As a result, removal of endogenous antibod-ies by protein precipitation gives more accurate results and contributes to better patient safety [24,25]. CMIA has been shown to be less susceptible to the interfer-ences seen with ACMIA [28], and in this study, ECLIA shows excellent concordance with CMIA. The need for standardized, accurate, and precise mea-surement of immunosuppressive drugs presents a major
challenge for clinical laboratories. Evaluation of the technologies available should be based on their medical value and the benefits they offer to patients. In the case of TDM, due to the necessity of maintaining therapeutic values within a narrow therapeutic range, analytical ac-curacy, and excellent precision as well as rapid sample turnaround time represent the highest priorities [10]. The simplicity of automated and semi-automated immu-noassays provides ease of use and superior operational flexibility to LC-MS/MS, which is extremely important in the clinical setting, allowing measurement of multi-ple factors, including hormones and serologic factors alongside TDM [10]. Immunoassays also offer greater throughput than LC-MS/MS and the fact that automated systems do not rely on specialized operators removes potential source of human error and site-to-site or peri-od-to-period variability. The improved workflow of-fered by immunoassay technology could have many im-plications, accelerating clinical decision making through a reduction in turnaround time, as well as reducing the overall costs [10]. This could lead to earlier and more informed treatment decisions that help to maximize therapy efficacy [10]. Many of the currently available immunoassays, however, lack the required analytical performance that is provided by the LC-MS/MS. Given that the majority of clinical laboratories currently still measure CNIs using an immunoassay [8,9], the obser-vation from this study, that the new CNI ECLIAs are not only superior to LC-MS/MS in terms of workflow but also match it in terms of performance, is very im-portant.
CONCLUSION
The data presented here show that the ECLIA represents a robust and promising alternative for the quantitative determination of CsA and TAC in human whole blood that not only offers a reduced laboratory workload, but also offers the required technical performance to meet the demands of TDM in current immunosuppressive regimens. This will aid in the management of heart, liv-er, and kidney transplant patients. Acknowledgement and Funding: Funding for the study was provided by Roche Diagnos-tics GmbH, Rotkreuz, Switzerland. The authors would also like to thank Laura Harrison, of Elements Commu-nications Westerham, UK, for providing medical writing assistance supported by Roche Diagnostics GmbH. Declaration of Interest: CG, JD, JK, MRG, AB, and CN received support from Roche Diagnostics GmbH for the work under consider-ation for publication. BT has declared no conflict of in-terest.

Evaluation of Cyclosporine and Tacrolimus ECLIA
Clin. Lab. 9/2015 13
References: 1. Abendroth D. Experience with therapeutic drug monitoring of cy-
closporine. Transplant Proc 2004;36:426S-429S.
2. Levy GA. Progress in transplantation. Ther Drug Monit 2010;32: 246-9.
3. Chadban S. New-onset diabetes after transplantation; should it be a factor in choosing an immunosuppressant regimen for kidney transplant recipients? Nephrol Dial Transplant 2008;23:1816-8.
4. Moore R. New-onset diabetes after renal transplantation: compar-ing ciclosporin and tacrolimus. Nat Clin Pract Nephrol 2008;4: 20-1.
5. Kelly KA, Butch AW. Immunosuppressive drug monitoring: lim-itations of immunoassays and the application of liquid chroma-tography mass spectrometry. In: Dasgupta A, (ed). Therapeutic Drug Monitoring: Newer Drugs and Biomarkers, 1st ed. London: Elsevier Academic Press, 2012:323-48.
6. Van Gelder T, Klupp J, Bartem MJ, Christians U, Morris RE. Comparison of the effects of tacrolimus and cyclosporine on the pharmacokinetics of mycophenolic acid. Ther Drug Monit 2001; 23:119-28.
7. Wild DG, editor. 2006. The Immunoassay Handbook. 3rd edn. North Holland: Elsevier D V.
8. Shipkova M, Vogeser M, Alia Ramos P, et al. Multi-center ana-lytical evaluation of a novel automated tacrolimus immunoassay. Clin Biochem 2014;47:1069-77.
9. Vogeser M, Shipkova M, Rigo-Bonnin R, et al. Multicenter ana-lytical evaluation of the automated electrochemiluminescence im-munoassay for cyclosporine. Ther Drug Monit 2014;36:640-50.
10. Brandhorst G, Oellerich M, Maine G, Taylor P, Veen G, Wal-lemacq P. Liquid chromatography-tandem mass spectrometry for automated immunoassays: what are the future trends in therapeu-tic drug monitoring? Clin Chem 2012;58:821-5.
11. Wallemacq P, Armstrong VW, Brunet M, et al. Opportunities to optimize tacrolimus therapy in solid organ transplantation: report of the European consensus conference. Ther Drug Monit 2009; 31:139-52.
12. Barceló Martín B, Marquet P, Ferrer JM, et al. Rheumatoid factor interference in a tacrolimus immunoassay. Ther Drug Monit 2009;31:743-5.
13. Amann S, Parker TS, Levine DM. Evaluation of 2 immunoassays for monitoring low blood levels of tacrolimus. Ther Drug Monit 2009;31:273-6.
14. De BK, Jimenez E, De S, Sawyer JC, McMillin GA. Analytical performance characteristics of the Abbott Architect i2000 Tacro-limus assay: comparisons with liquid chromatography-tandem mass spectrometry (LC-MS/MS) and Abbott IMx methods. Clin Chim Acta 2009;410:25-30.
15. Wallemacq P, Goffinet JS, O’Morchoe S, et al. Multisite analyti-cal evaluation of the Abbott Architect tacrolimus assay. Ther Drug Monit 2009;31:198-204.
16. Leland JK, Powell MJ. Electrogenerated chemiluminescence: an oxidative-reduction type ECL reaction sequence using tripropyl amine. J Electrochem Soc 1990;137:3127-31.
17. Morelle J, Wallemacq P, van Caeneghem O, Goffin E. Clinically unexpected cyclosporine levels using the ACMIA method on the RXL dimension analyser. Nephrol Dial Transplant 2011;26:1428-31.
18. Tacrolimus for Elecsys® [package insert]. 2010. Roche.
19. Tacrolimus for Architect® [package insert]. 2009. Abbott Park, IL, USA: Abbott Laboratories.
20. Cyclosporine for Elecsys® [package insert]. 2010. Roche.
21. Cyclosporine for Architect® [package insert]. 2010. Abbott Park, IL, USA: Abbott Laboratories.
22. Cangemi G, Barco S, Bonifazio P, Maffia A, Agazzi A, Melioli G. Comparison of antibody-conjugated magnetic immunoassay and liquid chromatography-tandem mass spectrometry for the measurement of cyclosporine and tacrolimus in whole blood. Int J Immunopathol Pharmacol 2013;26:419-26.
23. Soldin SJ, Hardy RW, Wians FH Jr., et al. Performance evalua-tion of the new ADVIA Centaur system cyclosporine assay (sin-gle-step extraction). Clin Chim Acta 2010;411:806-11.
24. Altinier S, Varagnolo M, Zaninotto M, Boccagni P, Plebani M. Heterophilic antibody interference in a non-endogenous molecule assay: an apparent elevation in the tacrolimus concentration. Clin Chim Acta 2009;402:193-5.
25. Bartoli A, Molinaro M, Visai L. Falsely elevated whole blood cy-closporine concentrations measured by an immunoassay with au-tomated pre-treatment. Ther Drug Monit 2010;32:791-2.
26. D'Alessandro M, Mariani P, Mennini G, Severi D, Berloco P, Bachetoni A. Falsely elevated tacrolimus concentrations mea-sured using the ACMIA method due to circulating endogenous antibodies in a kidney transplant recipient. Clin Chim Acta 2011; 412:245-8.
27. Peter A, Shipkova M, Wieland E, Schleicher E, Müller I. In-creased cyclosporine concentrations in the absence of cyclospor-ine administration. Clin Chem 2011;57:670-3.
28. Bazin C, Guinedor A, Barau C, et al. Evaluation of the Architect tacrolimus assay in kidney, liver, and heart transplant recipients. J Pharm Biomed Anal 2010;53:997-1002.
B. Toole et al.
Clin. Lab. 9/2015 14
SUPPLEMENTARY DATA
A B
C D
Supplementary Figure 1. Method comparison of CsA assays with weighted Deming regression for ECLIA versus LC-MS/MS for heart (A) liver (B) and kidney (Peterborough = C, Newcastle = D). Regression parameters and 95% CI are indicated within the plot. The dashed line in the regression plots parallel to the x axis represents the limit of detection (LoD) of the CsA ECLIA measuring range (30 ng/mL).
Evaluation of Cyclosporine and Tacrolimus ECLIA
Clin. Lab. 9/2015 15
A B
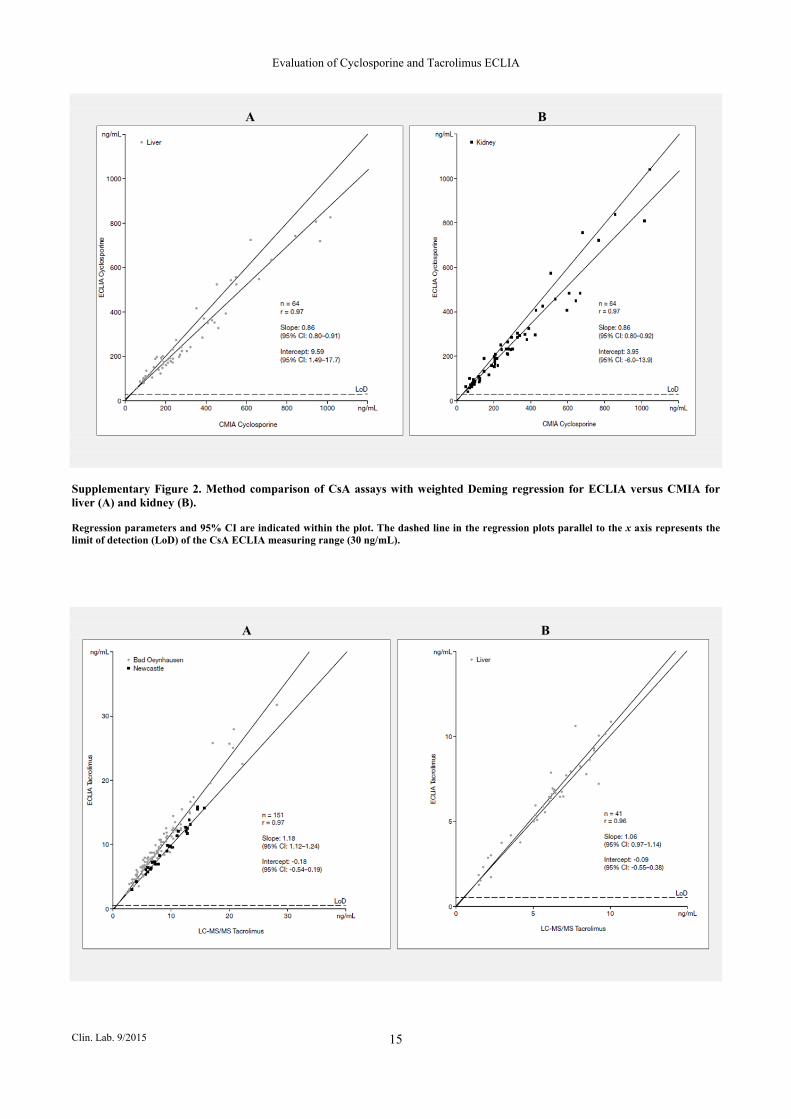
Supplementary Figure 2. Method comparison of CsA assays with weighted Deming regression for ECLIA versus CMIA for liver (A) and kidney (B). Regression parameters and 95% CI are indicated within the plot. The dashed line in the regression plots parallel to the x axis represents the limit of detection (LoD) of the CsA ECLIA measuring range (30 ng/mL).
A B

B. Toole et al.
Clin. Lab. 9/2015 16
C
Supplementary Figure 3. Method comparison of TAC assays with weighted Deming regression for ECLIA versus LC-MS/MS for heart (A), liver (B) and kidney (C). Regression parameters and 95% CI are indicated within the plot. The dashed line in the regression plots parallel to the x axis represents the limit of detection (LoD) of the TAC ECLIA measuring range (0.5 ng/mL).
A B
Supplementary Figure 4. Method comparison of TAC assays with weighted Deming regression for ECLIA versus CMIA for liver (A) and kidney (B). Regression parameters and 95% CI are indicated within the plot. The dashed line in the regression plots parallel to the x axis represents the limit of detection (LoD) of the TAC ECLIA measuring range (0.5 ng/mL).