Embed Size (px)
Citation preview
USE IMPROVE EVANGELIZE
Little Shop of Performance HorrorsBrendan GreggStaff EngineerSun Microsystems, Fishworks
FROSUG 2009
2
USE IMPROVE EVANGELIZE
Performance Horrors● I usually give talks on:
– how to perform perf analysis!
– cool performance technologies!!
– awesome benchmark results!!!
in other words, things going right.● This talk is about things going wrong:
– performance horrors
– learning from mistakes
3
USE IMPROVE EVANGELIZE
Horrific Topics● The worst perf issues I've ever seen!● Common misconfigurations● The encyclopedia of poor assumptions● Unbelievably bad perf analysis● Death by complexity● Bad benchmarking● Misleading analysis tools● Insane performance tuning● The curse of the unexpected
4
USE IMPROVE EVANGELIZE
The worst perf issuesI've ever seen!
5
USE IMPROVE EVANGELIZE
The worst perf issues I've ever seen!● SMC
– Administration GUI for Solaris
– Could take 30 mins to load on first boot
6
USE IMPROVE EVANGELIZE
The worst perf issues I've ever seen!● SMC
– Administration GUI for Solaris
– Could take 30 mins to load on first boot
● Problems:– 12 Million mostly 1 byte sequential read()s of
/var/sadm/smc/properties/registry.ser, a 72 KB file
– 7742 processes executed
– 9504 disk events, 2228 of them writes to the 72Kb registry.ser file.
● Happy ending – performance was improved in an update
7
USE IMPROVE EVANGELIZE
The worst perf issues I've ever seen!● SMC (cont.)● Analysis using DTrace:
– syscall frequency counts
– syscall args
This is “low hanging fruit” for DTrace● Lesson: examine high level events.● Happy ending – performance was improved in an update
8
USE IMPROVE EVANGELIZE
The worst perf issues I've ever seen!● nxge
– 10 GbE network driver
– tested during product development
9
USE IMPROVE EVANGELIZE
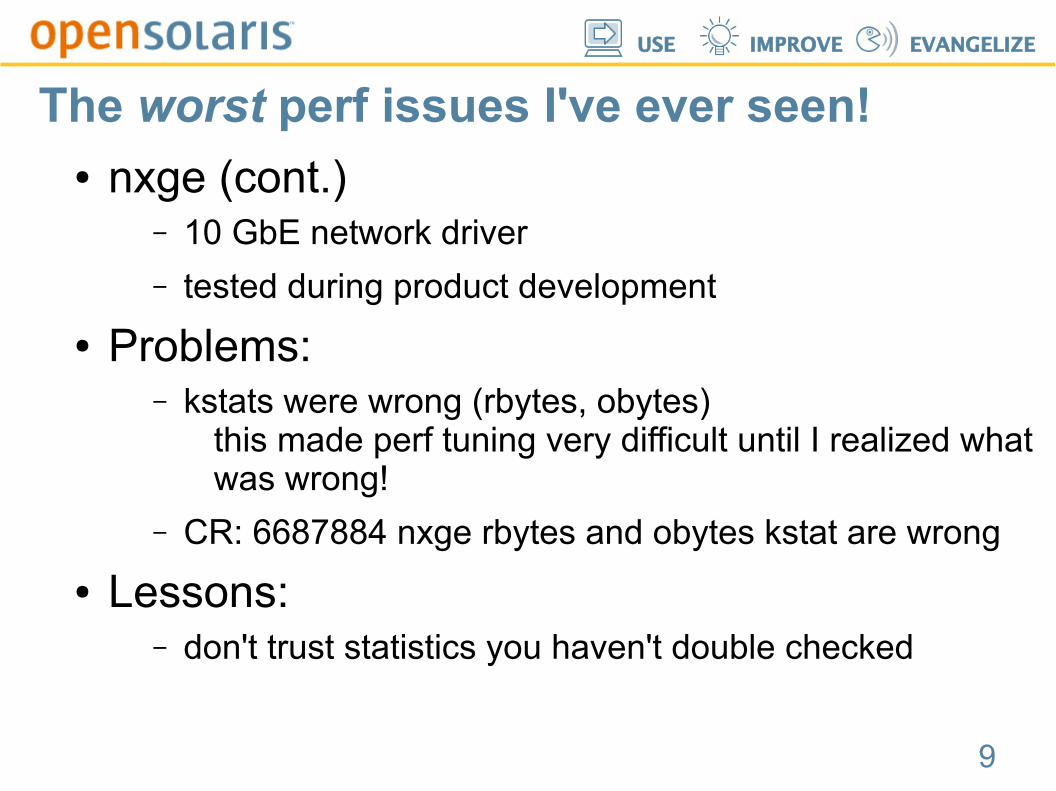
The worst perf issues I've ever seen!● nxge (cont.)
– 10 GbE network driver
– tested during product development
● Problems:– kstats were wrong (rbytes, obytes)
this made perf tuning very difficult until I realized what was wrong!
– CR: 6687884 nxge rbytes and obytes kstat are wrong
● Lessons:– don't trust statistics you haven't double checked
10
USE IMPROVE EVANGELIZE
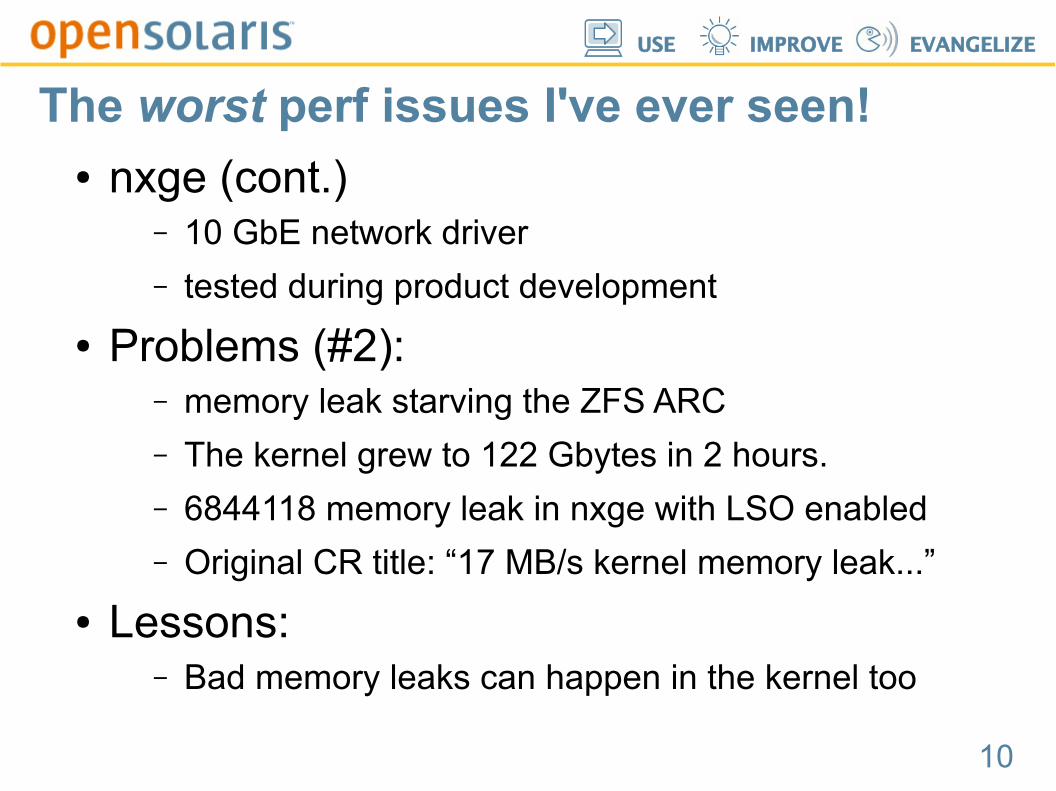
The worst perf issues I've ever seen!● nxge (cont.)
– 10 GbE network driver
– tested during product development
● Problems (#2):– memory leak starving the ZFS ARC
– The kernel grew to 122 Gbytes in 2 hours.
– 6844118 memory leak in nxge with LSO enabled
– Original CR title: “17 MB/s kernel memory leak...”
● Lessons:– Bad memory leaks can happen in the kernel too
11
USE IMPROVE EVANGELIZE
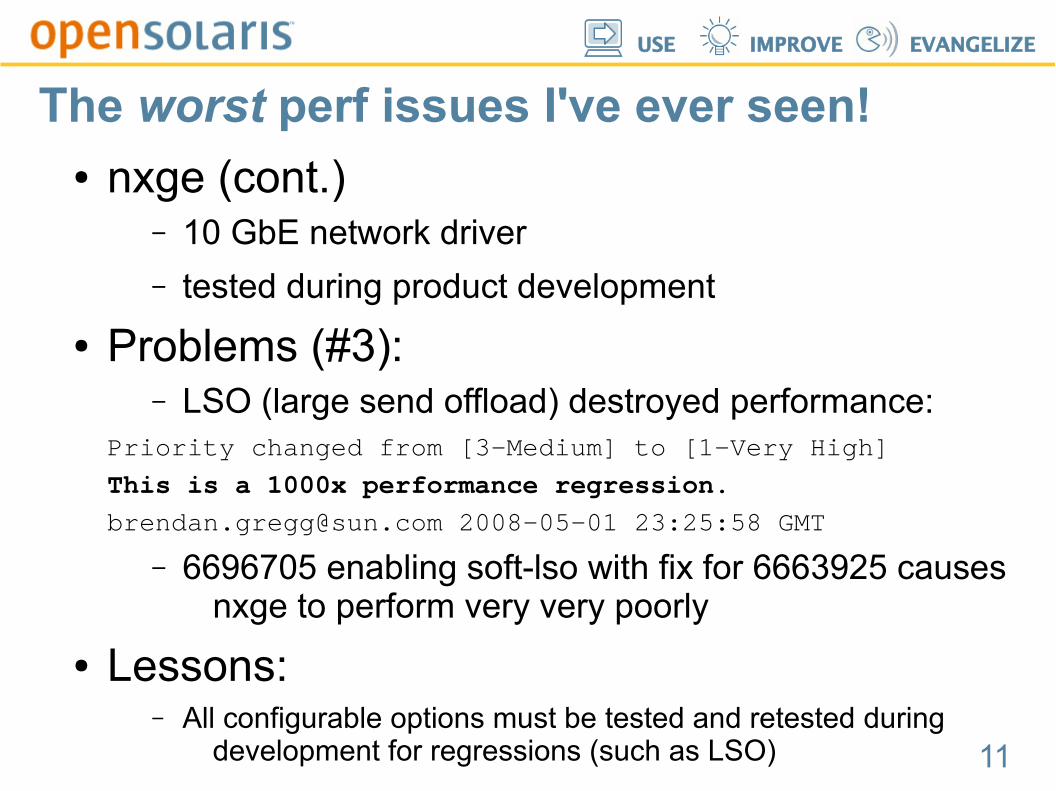
The worst perf issues I've ever seen!● nxge (cont.)
– 10 GbE network driver
– tested during product development
● Problems (#3):– LSO (large send offload) destroyed performance:
Priority changed from [3-Medium] to [1-Very High]
This is a 1000x performance regression.
[email protected] 2008-05-01 23:25:58 GMT
– 6696705 enabling soft-lso with fix for 6663925 causes nxge to perform very very poorly
● Lessons:– All configurable options must be tested and retested during
development for regressions (such as LSO)
12
USE IMPROVE EVANGELIZE
CommonMisconfigurations
13
USE IMPROVE EVANGELIZE
Common misconfigurations● ZFS RAID-Z2 with half a JBOD
– half a JBOD may mean 12 disks. A RAID-Z2 stripe may be 12 disks in width, therefore this configuration acts like a single disk:
perf is that of the slowest disk in the stripe with so few stripes (1), a multi-threaded workload is much
more likely to scale
● Max throughput config without:– jumbo frames
– 10 GbE ports (they do work!)
● sync write workloads without ZFS SLOG devices
14
USE IMPROVE EVANGELIZE
Common misconfigurations● Not running the latest software bits
– perf issues are fixed often; always try to be on the latest software versions
● 4 x 1 GbE trunks, and < 4 clients– they won't map to all ports
15
USE IMPROVE EVANGELIZE
The Encyclopedia ofPoor Assumptions
16
USE IMPROVE EVANGELIZE
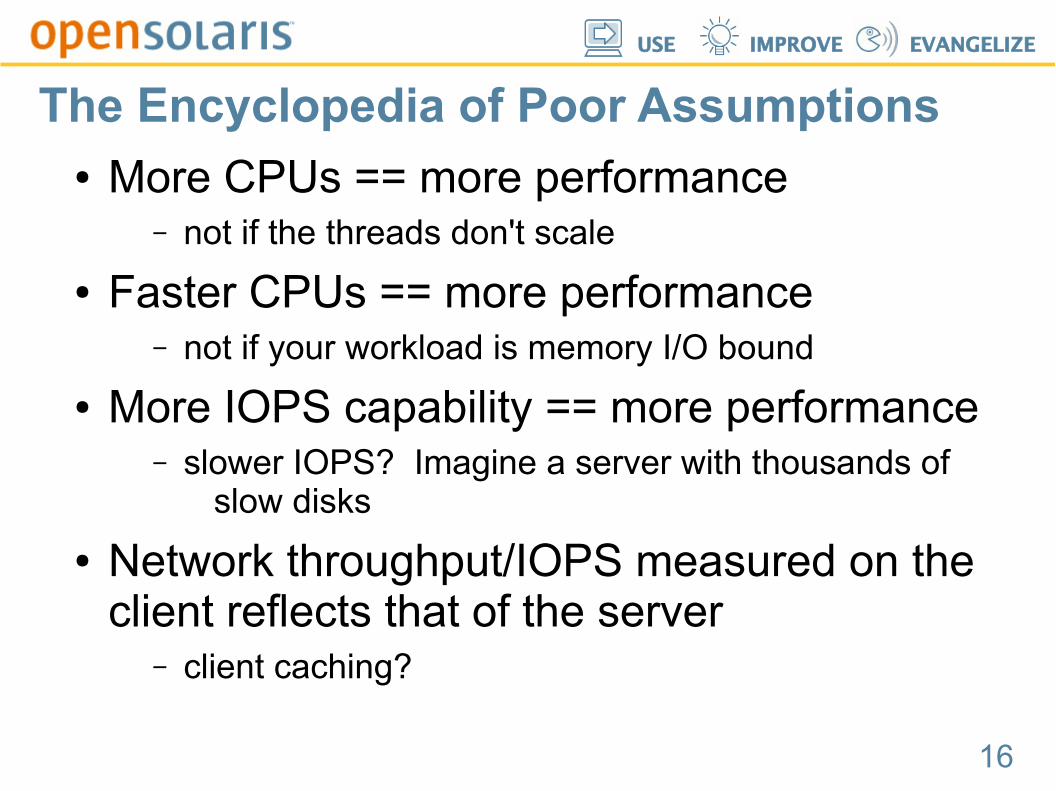
The Encyclopedia of Poor Assumptions● More CPUs == more performance
– not if the threads don't scale
● Faster CPUs == more performance– not if your workload is memory I/O bound
● More IOPS capability == more performance– slower IOPS? Imagine a server with thousands of
slow disks
● Network throughput/IOPS measured on the client reflects that of the server
– client caching?
17
USE IMPROVE EVANGELIZE
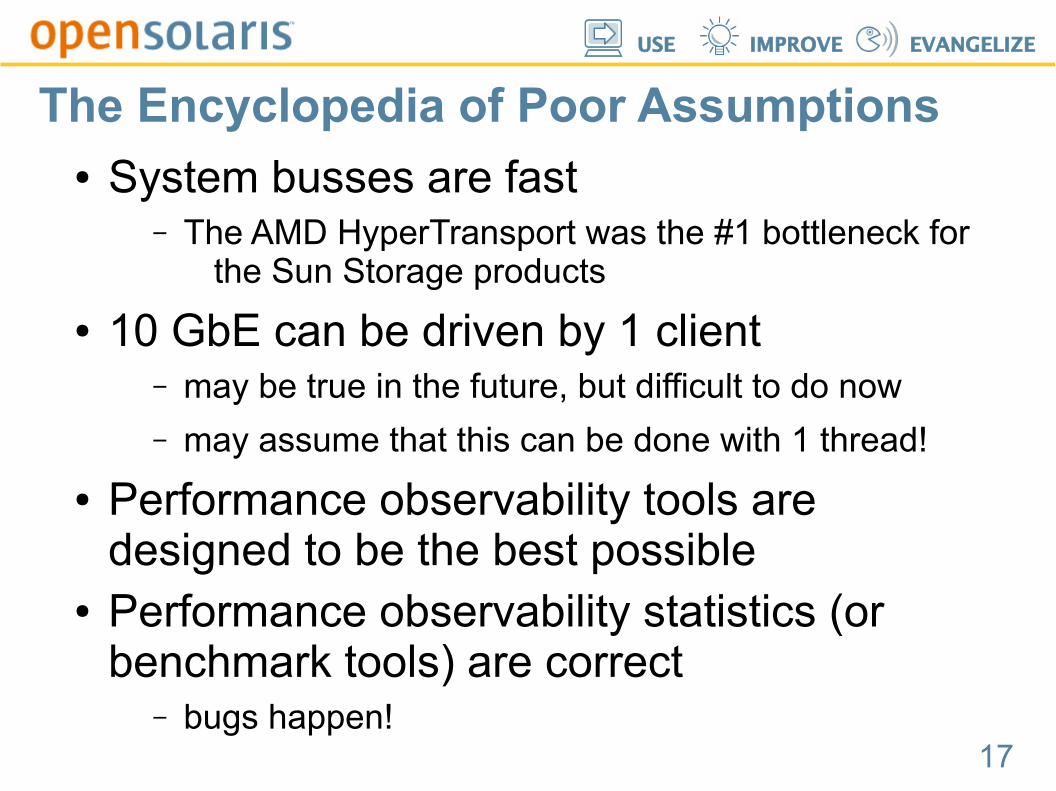
The Encyclopedia of Poor Assumptions● System busses are fast
– The AMD HyperTransport was the #1 bottleneck for the Sun Storage products
● 10 GbE can be driven by 1 client– may be true in the future, but difficult to do now
– may assume that this can be done with 1 thread!
● Performance observability tools are designed to be the best possible
● Performance observability statistics (or benchmark tools) are correct
– bugs happen!
18
USE IMPROVE EVANGELIZE
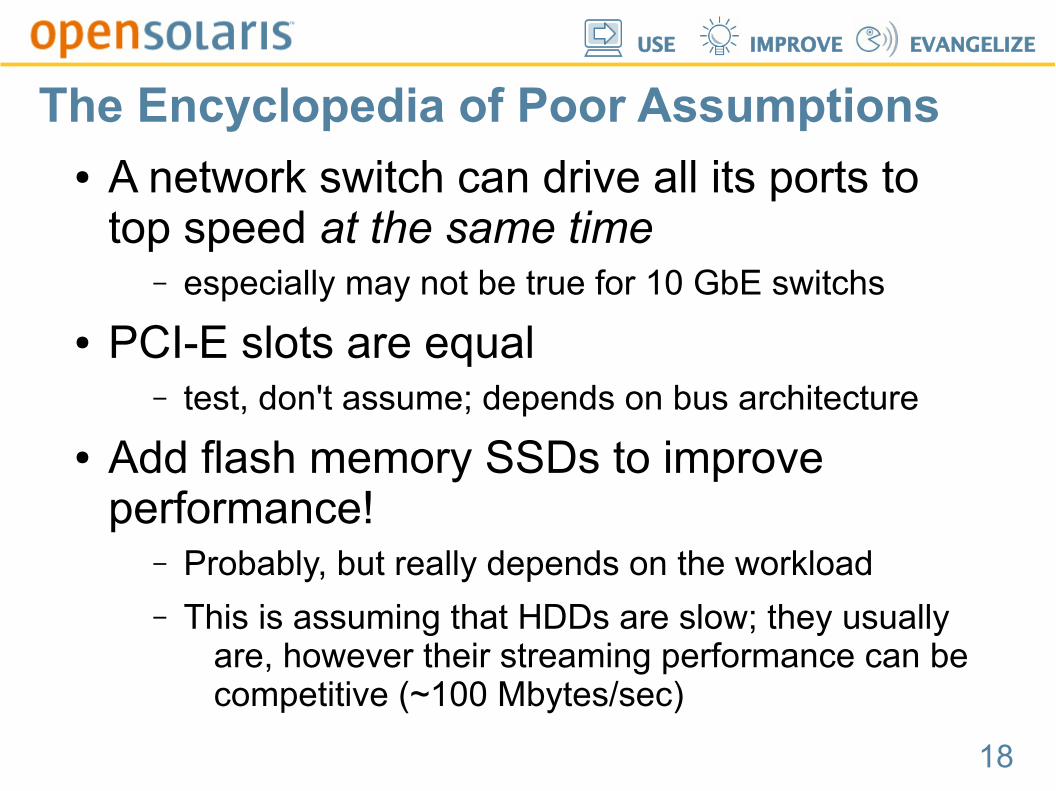
The Encyclopedia of Poor Assumptions● A network switch can drive all its ports to
top speed at the same time– especially may not be true for 10 GbE switchs
● PCI-E slots are equal– test, don't assume; depends on bus architecture
● Add flash memory SSDs to improve performance!
– Probably, but really depends on the workload
– This is assuming that HDDs are slow; they usually are, however their streaming performance can be competitive (~100 Mbytes/sec)
19
USE IMPROVE EVANGELIZE
Unbelievably BadPerformance Analysis
20
USE IMPROVE EVANGELIZE
Unbelievably bad perf analysis● The Magic 1 GbE NIC!● How fast can a 1 GbE NIC run in one
direction?
21
USE IMPROVE EVANGELIZE
Unbelievably bad perf analysis● The Magic 1 GbE NIC!● How fast can a 1 GbE NIC run in one
direction?● Results sent to me include:
– 120 Mbytes/sec
– 200 Mbytes/sec
– 350 Mbytes/sec
– 800 Mbytes/sec
– 1.15 Gbytes/sec
● Lesson: perform sanity checks
22
USE IMPROVE EVANGELIZE
Death byComplexity!
23
USE IMPROVE EVANGELIZE
Death by complexity!● Performance isn't that hard, however it
often isn't that easy either...● TCP/IP stack performance analysis
– heavy use of function pointers
● ZFS performance analysis– I/O processed asynchorously by the ZIO pipeline
24
USE IMPROVE EVANGELIZE
Bad Benchmarking
25
USE IMPROVE EVANGELIZE
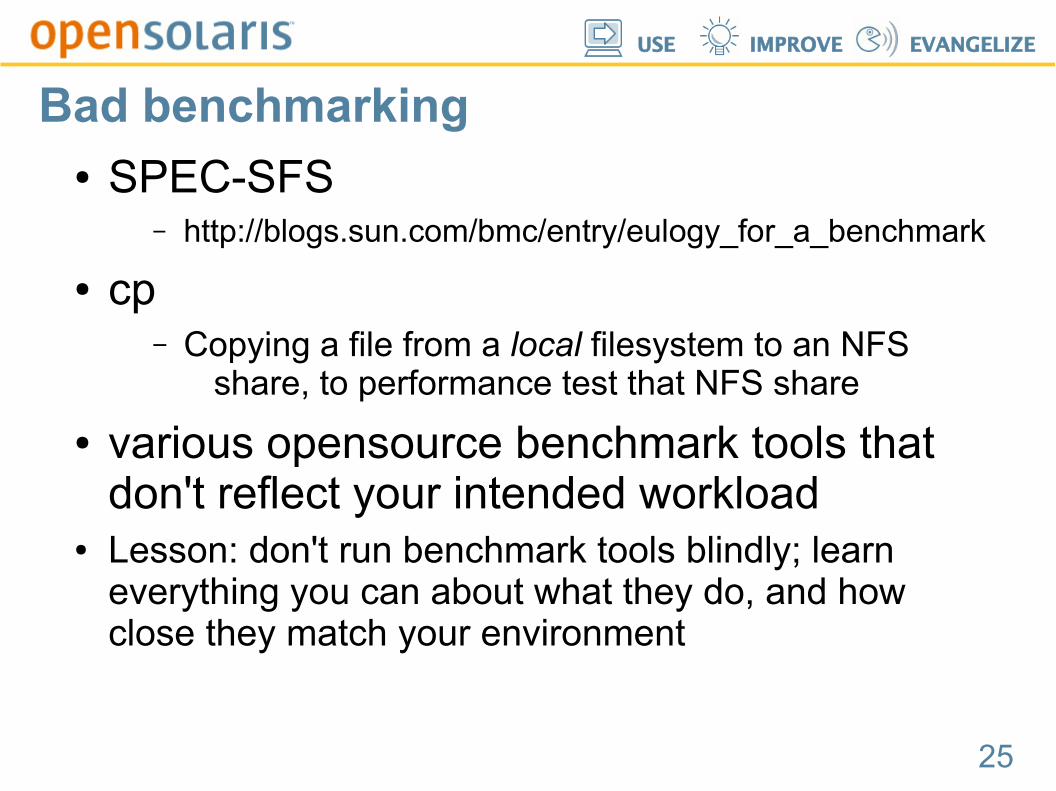
Bad benchmarking● SPEC-SFS
– http://blogs.sun.com/bmc/entry/eulogy_for_a_benchmark
● cp– Copying a file from a local filesystem to an NFS
share, to performance test that NFS share
● various opensource benchmark tools that don't reflect your intended workload
● Lesson: don't run benchmark tools blindly; learn everything you can about what they do, and how close they match your environment
26
USE IMPROVE EVANGELIZE
MisleadingAnalysis Tools
27
USE IMPROVE EVANGELIZE
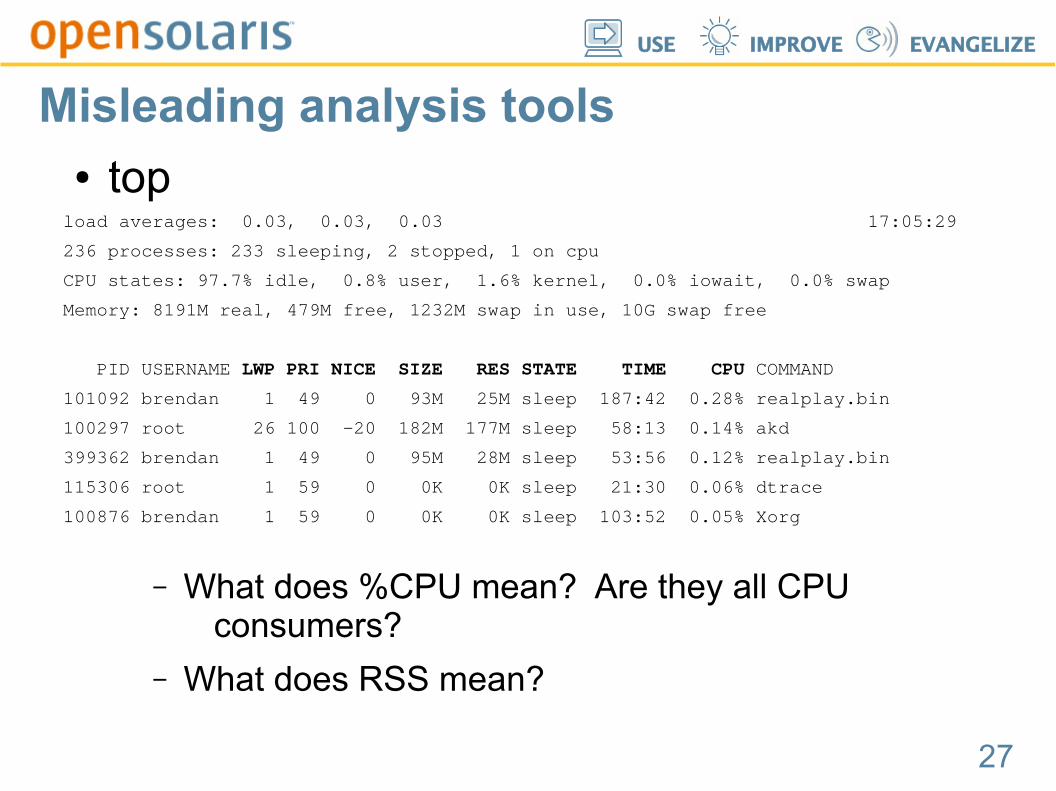
Misleading analysis tools● top
load averages: 0.03, 0.03, 0.03 17:05:29
236 processes: 233 sleeping, 2 stopped, 1 on cpu
CPU states: 97.7% idle, 0.8% user, 1.6% kernel, 0.0% iowait, 0.0% swap
Memory: 8191M real, 479M free, 1232M swap in use, 10G swap free
PID USERNAME LWP PRI NICE SIZE RES STATE TIME CPU COMMAND
101092 brendan 1 49 0 93M 25M sleep 187:42 0.28% realplay.bin
100297 root 26 100 -20 182M 177M sleep 58:13 0.14% akd
399362 brendan 1 49 0 95M 28M sleep 53:56 0.12% realplay.bin
115306 root 1 59 0 0K 0K sleep 21:30 0.06% dtrace
100876 brendan 1 59 0 0K 0K sleep 103:52 0.05% Xorg
– What does %CPU mean? Are they all CPU consumers?
– What does RSS mean?
28
USE IMPROVE EVANGELIZE
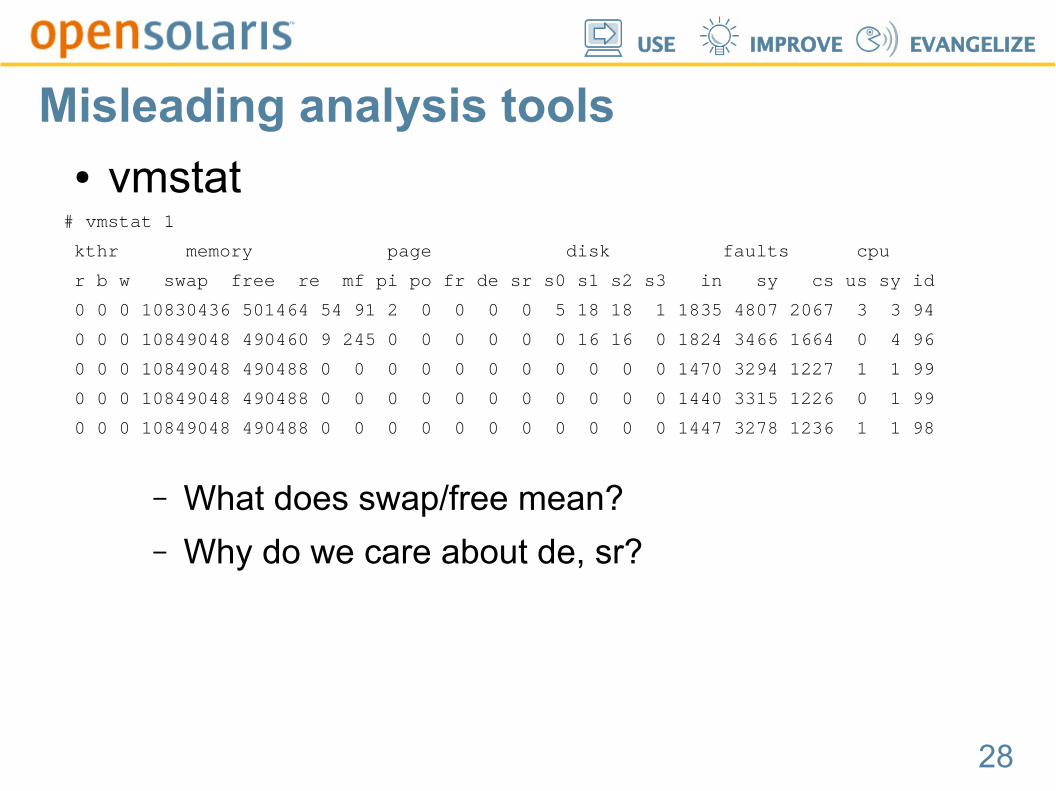
Misleading analysis tools● vmstat
# vmstat 1
kthr memory page disk faults cpu
r b w swap free re mf pi po fr de sr s0 s1 s2 s3 in sy cs us sy id
0 0 0 10830436 501464 54 91 2 0 0 0 0 5 18 18 1 1835 4807 2067 3 3 94
0 0 0 10849048 490460 9 245 0 0 0 0 0 0 16 16 0 1824 3466 1664 0 4 96
0 0 0 10849048 490488 0 0 0 0 0 0 0 0 0 0 0 1470 3294 1227 1 1 99
0 0 0 10849048 490488 0 0 0 0 0 0 0 0 0 0 0 1440 3315 1226 0 1 99
0 0 0 10849048 490488 0 0 0 0 0 0 0 0 0 0 0 1447 3278 1236 1 1 98
– What does swap/free mean?
– Why do we care about de, sr?
29
USE IMPROVE EVANGELIZE
InsanePerformance Tuning
30
USE IMPROVE EVANGELIZE
Insane performance tuning● disabling CPUs
– turning off half the available CPUs can improve performance (relieving scaleability issues)
● binding network ports to fewer cores– improves L1/L2 CPU cache hit rate
– reduces cache coherency traffic
● reducing CPU clock rate– if the workload is memory bound, this may have little
effect, but save heat, fan, vibration issues...
31
USE IMPROVE EVANGELIZE
Insane performance tuning● less memory
– systems with 256+ Gbytes of DRAM – codepaths that walk DRAM
● warming up the kmem caches– before benchmarking, a freshly booted server won't
have its kmem caches populated. Warming them up with any data can improve performance by 15% or so.
32
USE IMPROVE EVANGELIZE
The Curse of theUnexpected
33
USE IMPROVE EVANGELIZE
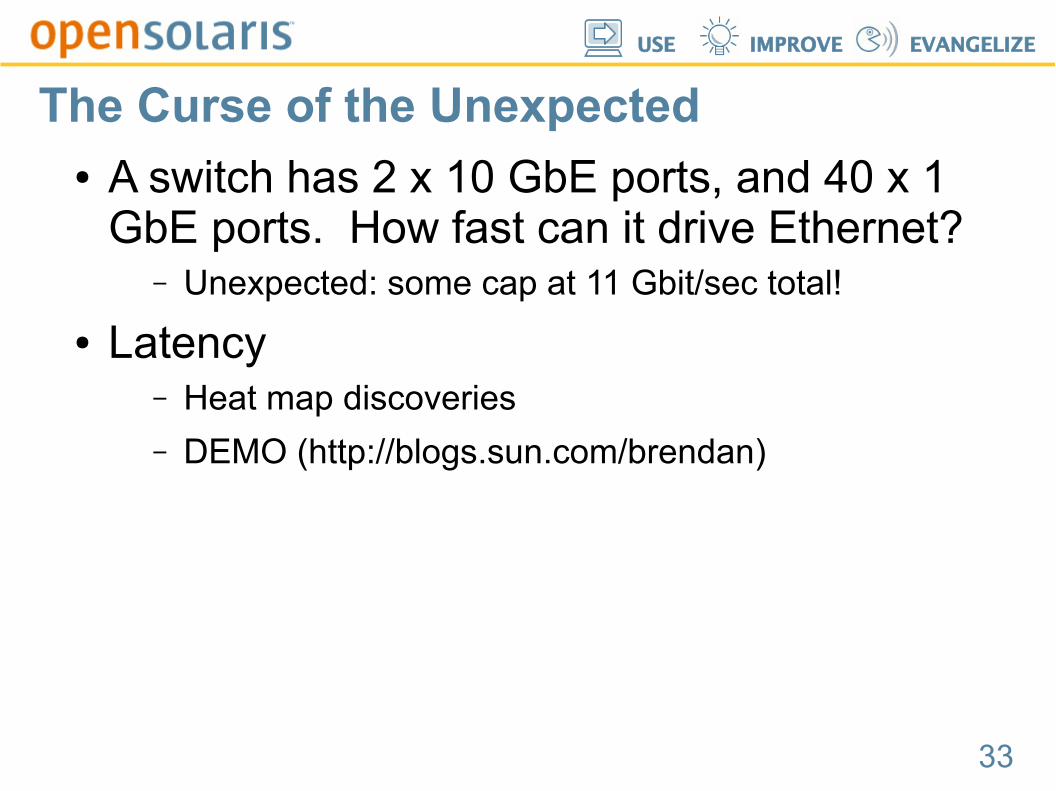
The Curse of the Unexpected● A switch has 2 x 10 GbE ports, and 40 x 1
GbE ports. How fast can it drive Ethernet?– Unexpected: some cap at 11 Gbit/sec total!
● Latency– Heat map discoveries
– DEMO (http://blogs.sun.com/brendan)
USE IMPROVE EVANGELIZE
Thank you!
Brendan GreggStaff Engineer
[email protected]://blogs.sun.com/brendan
“open” artwork and icons by chandan: http://blogs.sun.com/chandan