Embed Size (px)
Citation preview
Netflix Instance Performance Analysis
Requirements
Brendan Gregg Senior Performance Architect Performance Engineering Team [email protected] @brendangregg
Jun 2015
Monitoring companies are selling faster horses
I want to buy a car
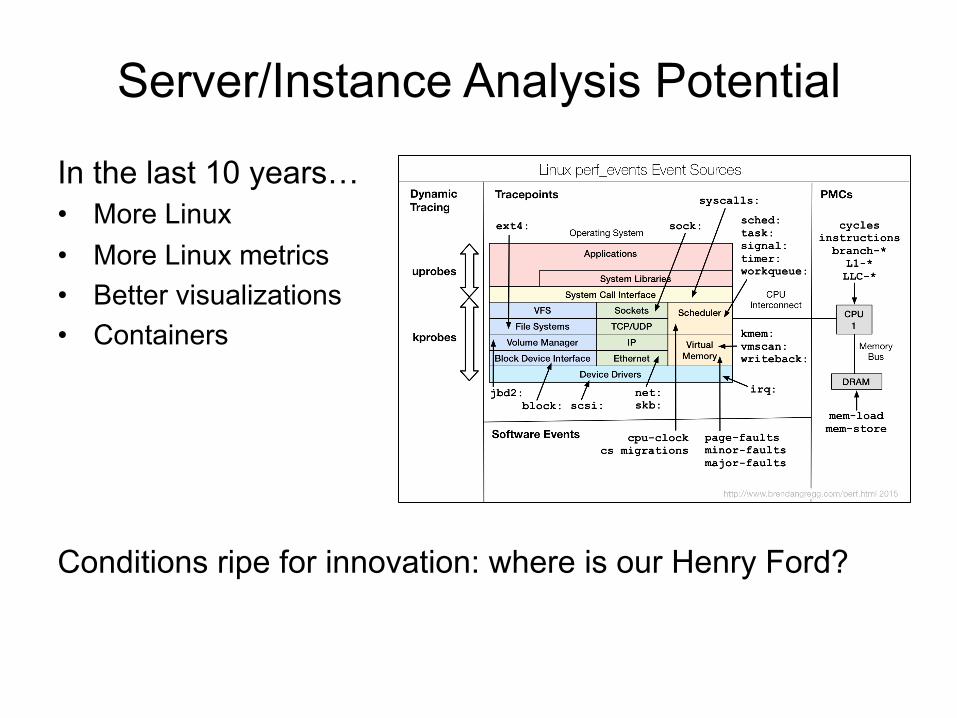
Server/Instance Analysis Potential
In the last 10 years… • More Linux
• More Linux metrics • Better visualizations • Containers
Conditions ripe for innovation: where is our Henry Ford?
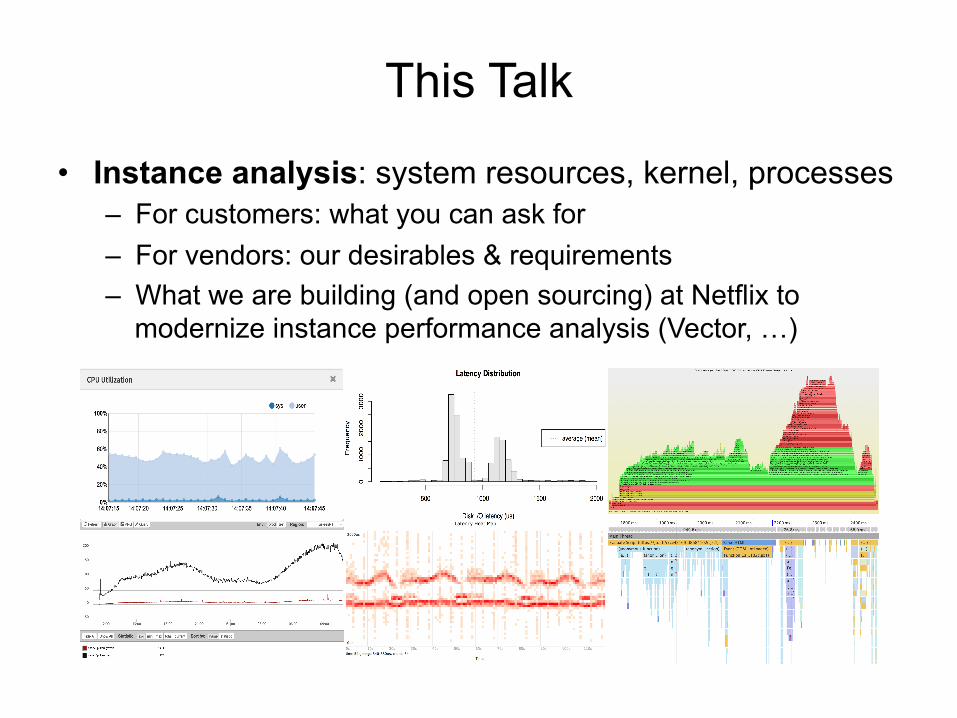
This Talk
• Instance analysis: system resources, kernel, processes – For customers: what you can ask for – For vendors: our desirables & requirements – What we are building (and open sourcing) at Netflix to
modernize instance performance analysis (Vector, …)
• Over 60M subscribers • FreeBSD CDN for content delivery • Massive AWS EC2 Linux cloud • Many monitoring/analysis tools • Awesome place to work
Agenda
1. Desirables 2. Undesirables 3. Requirements 4. Methodologies 5. Our Tools
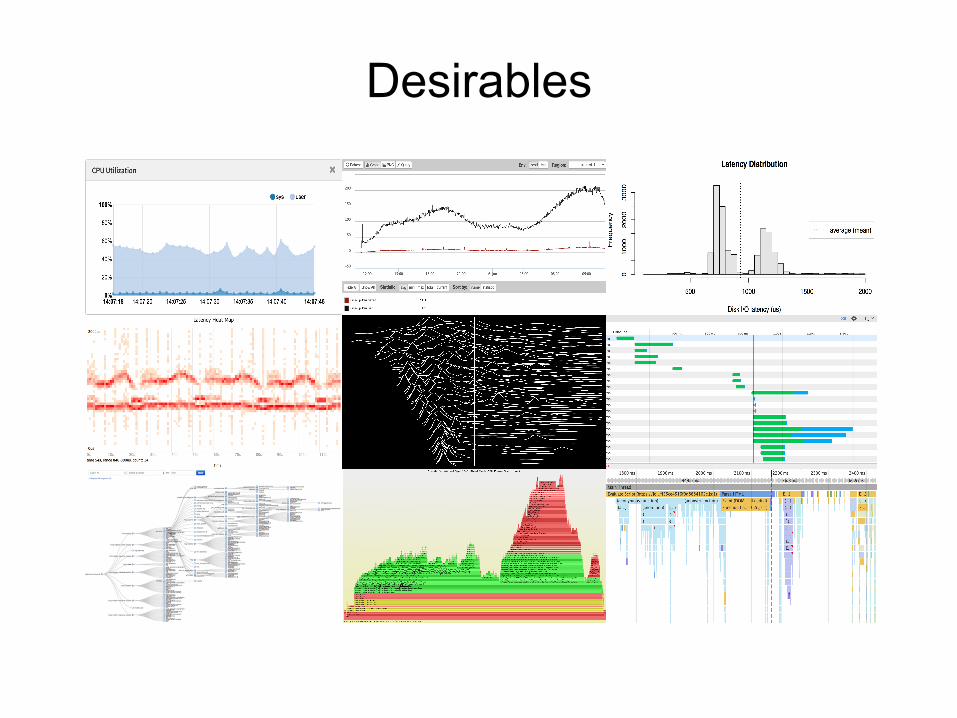
1. Desirables
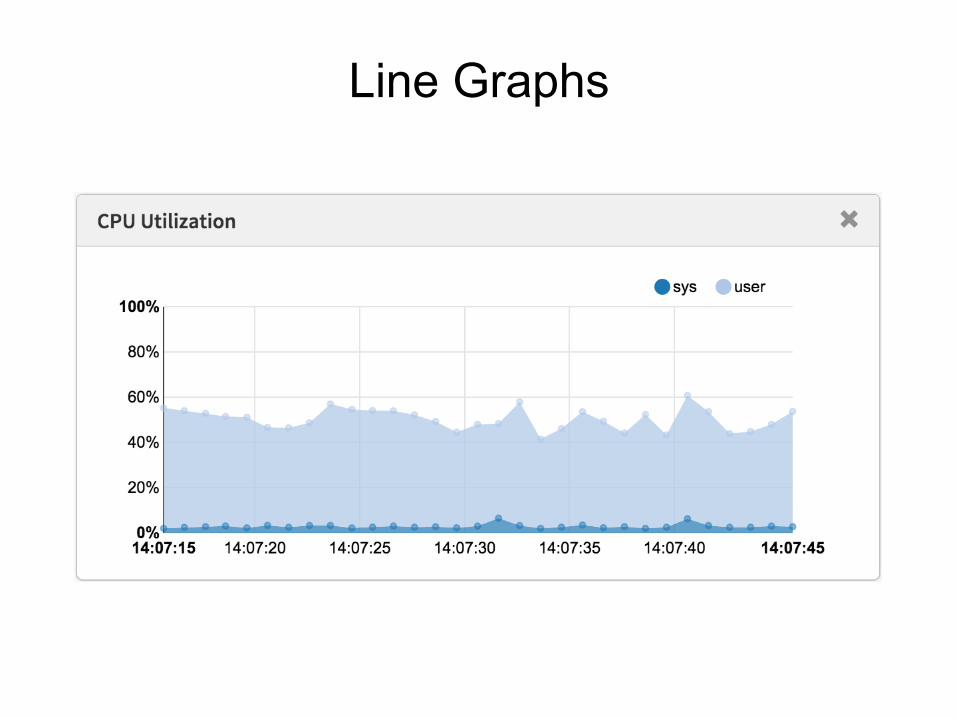
Line Graphs
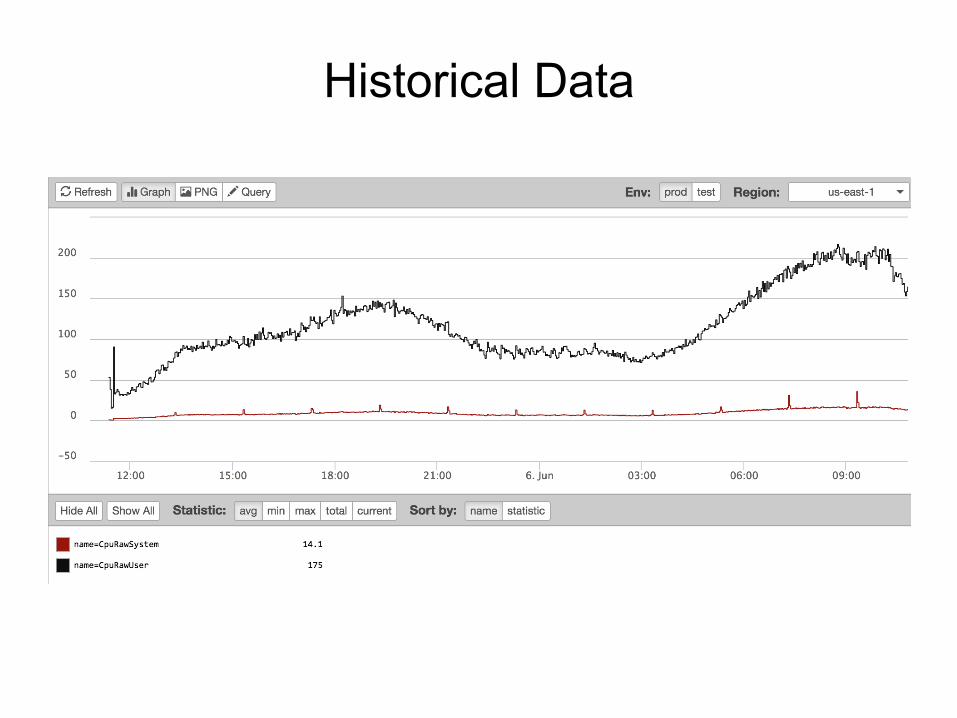
Historical Data
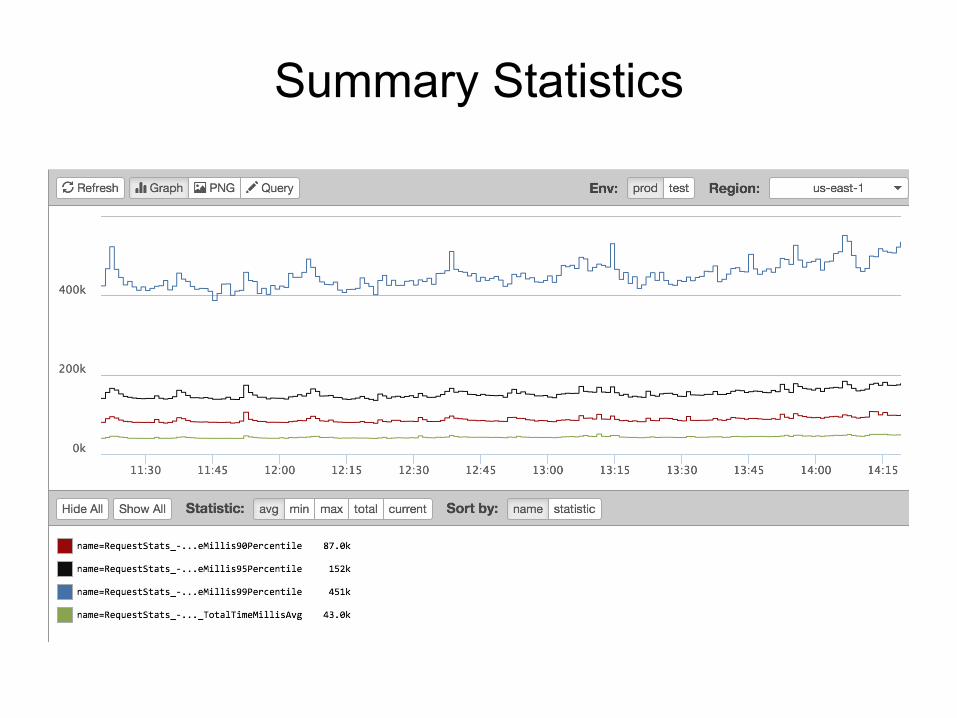
Summary Statistics
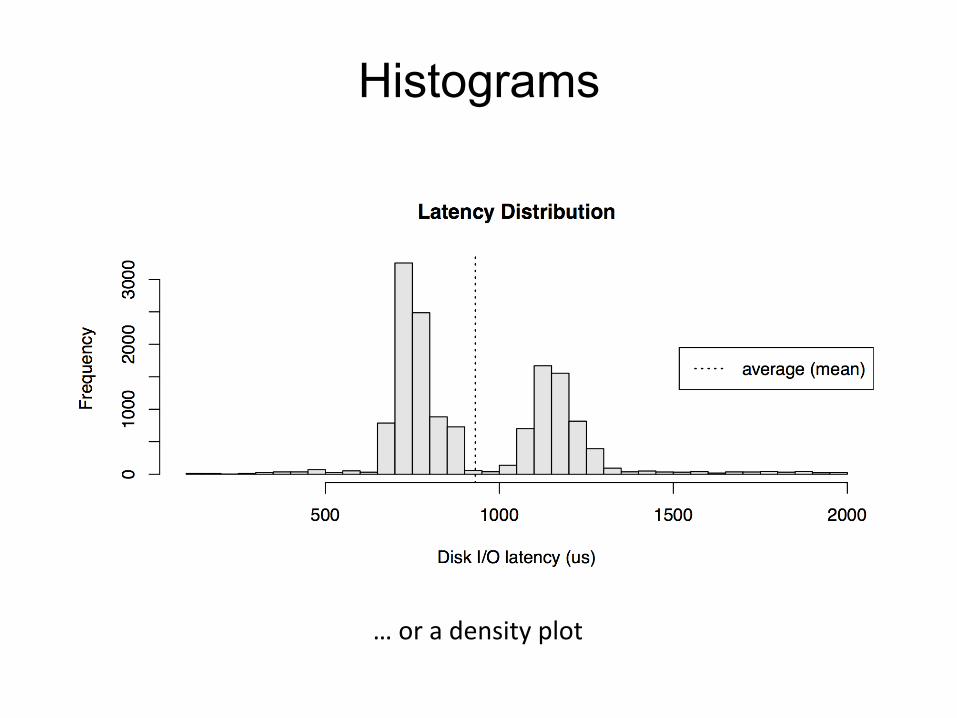
Histograms
… or a density plot
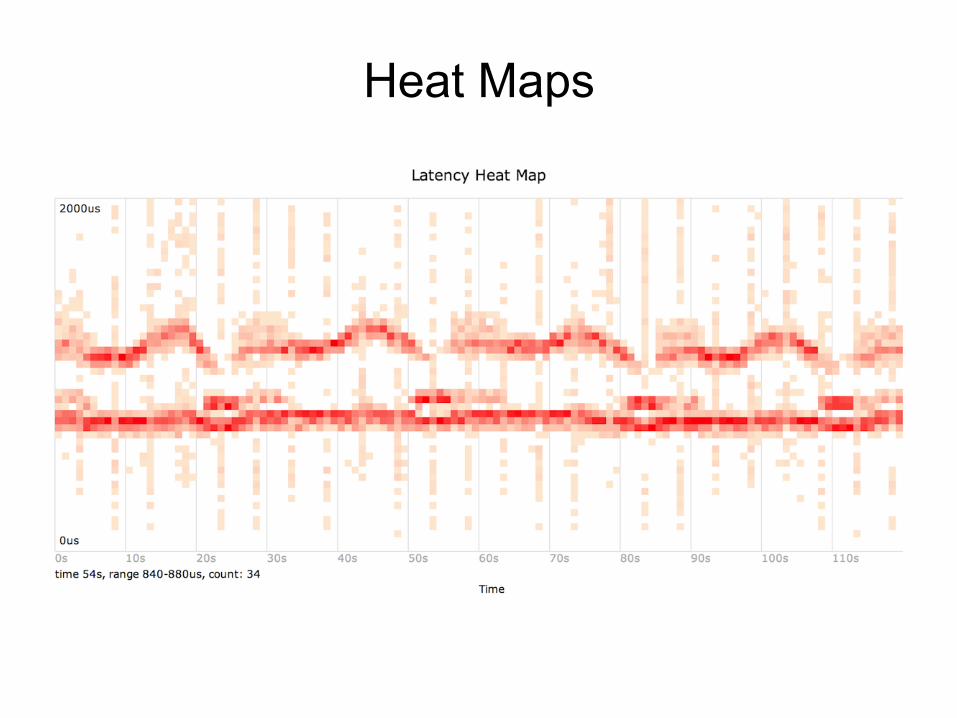
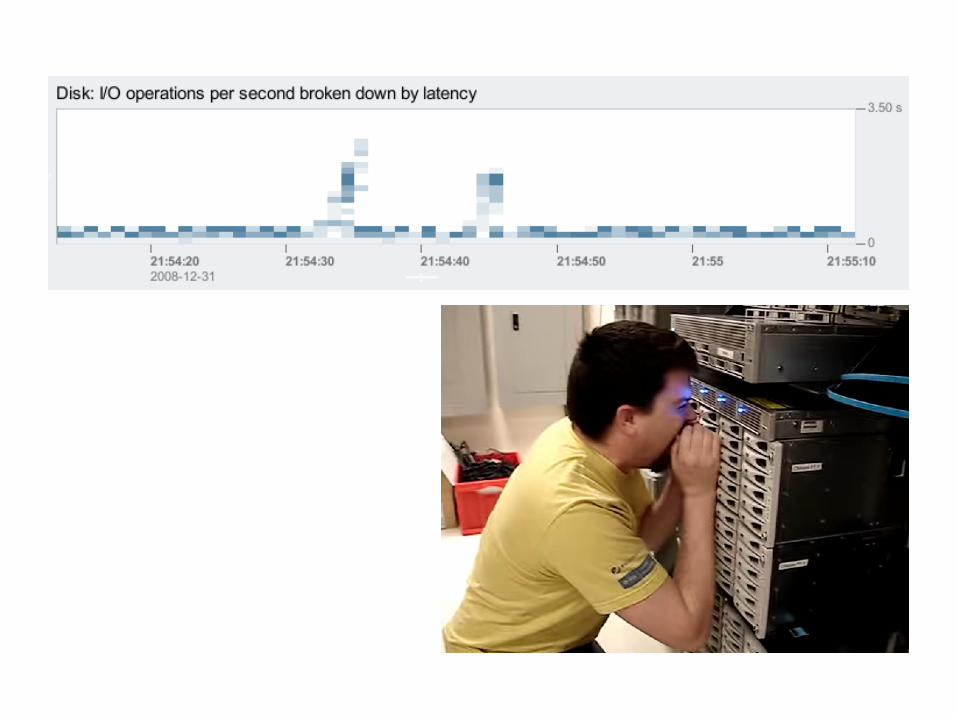
Heat Maps
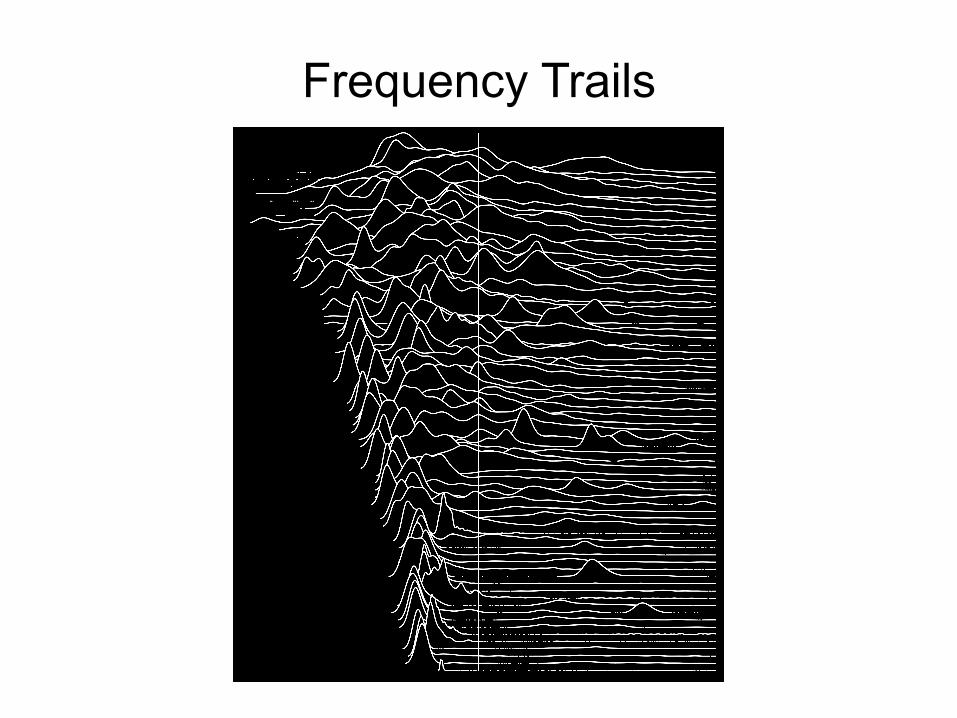
Frequency Trails
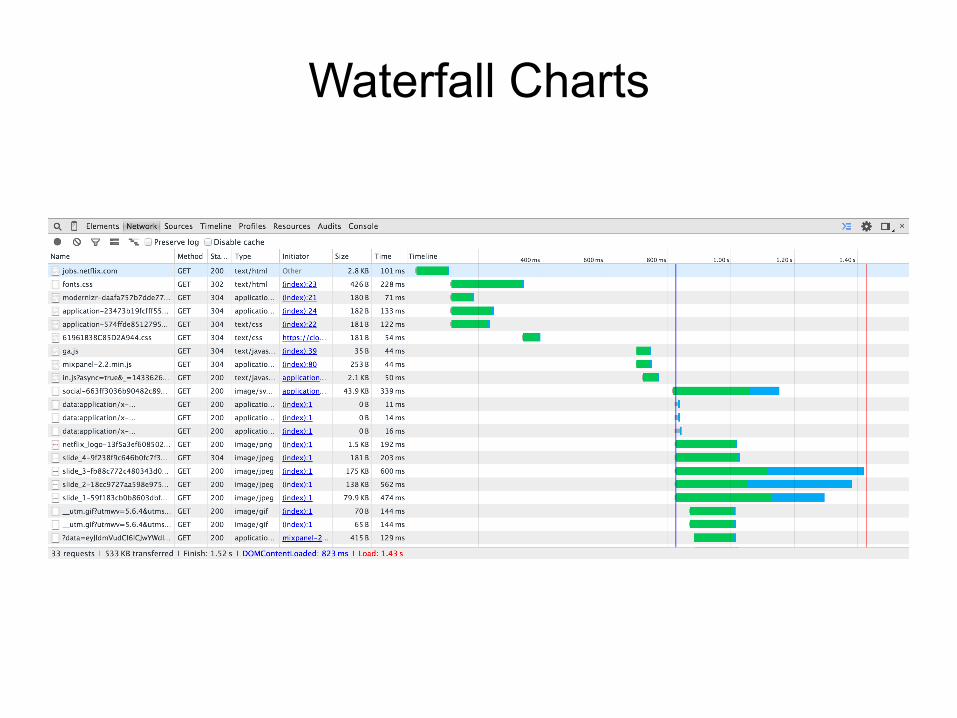
Waterfall Charts
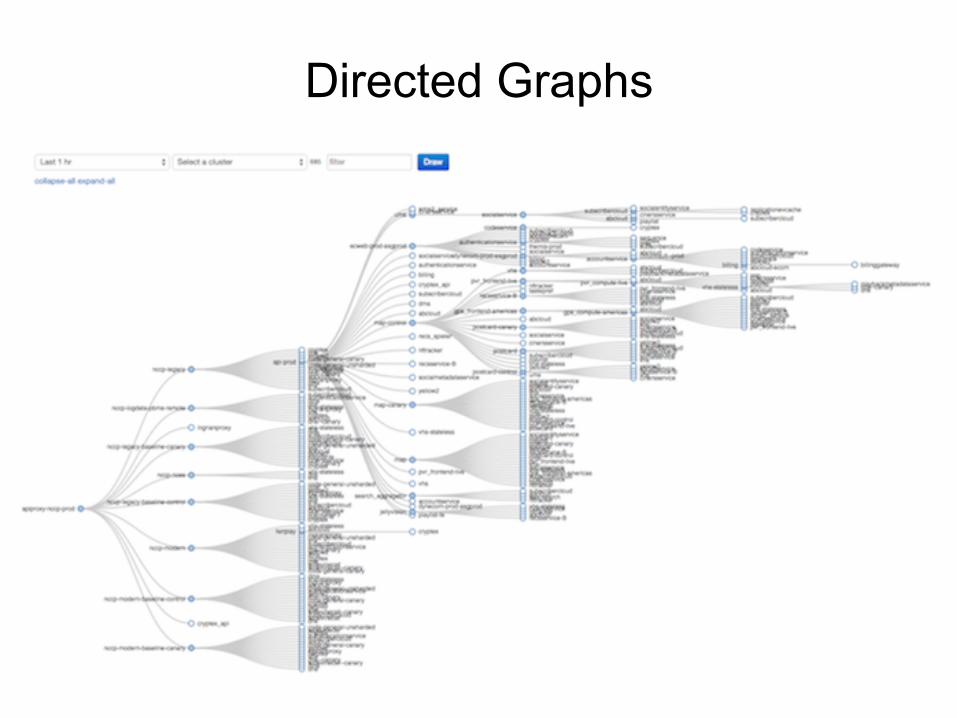
Directed Graphs
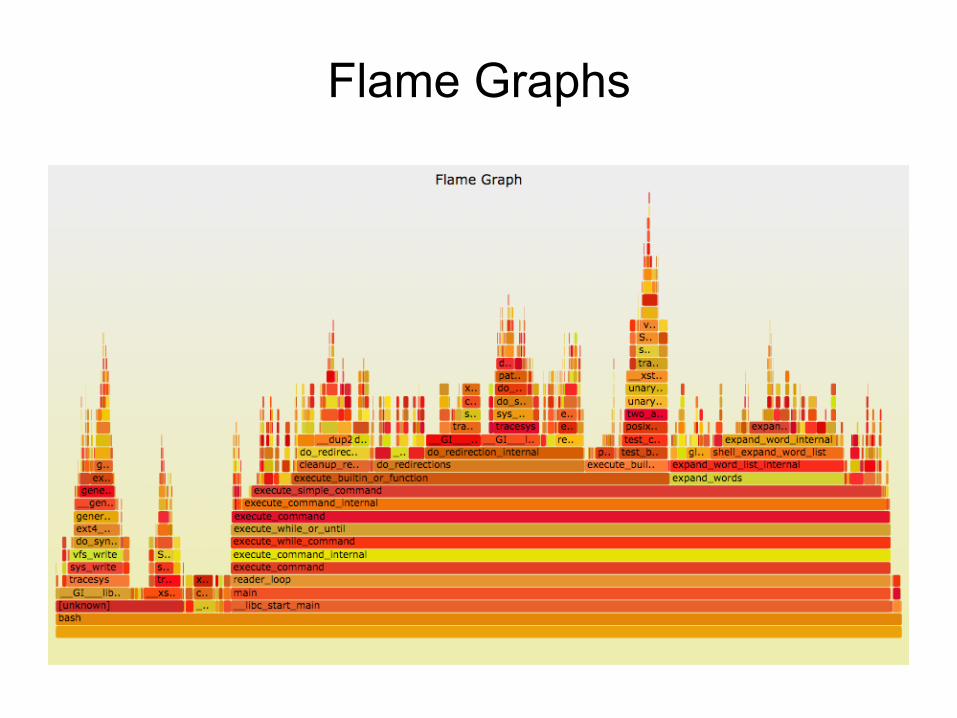
Flame Graphs
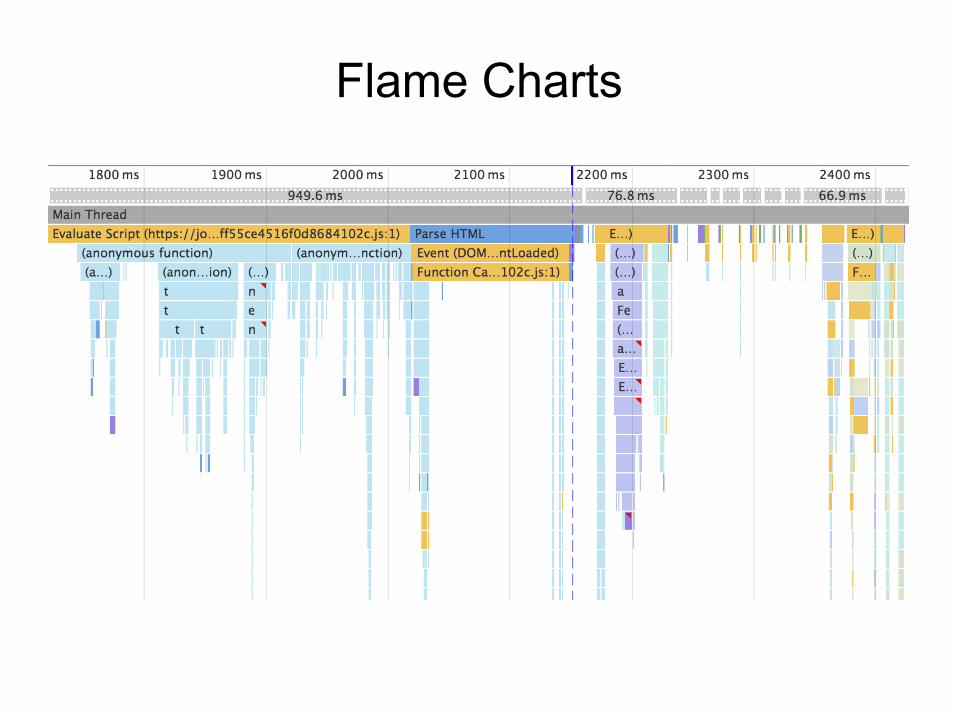
Flame Charts
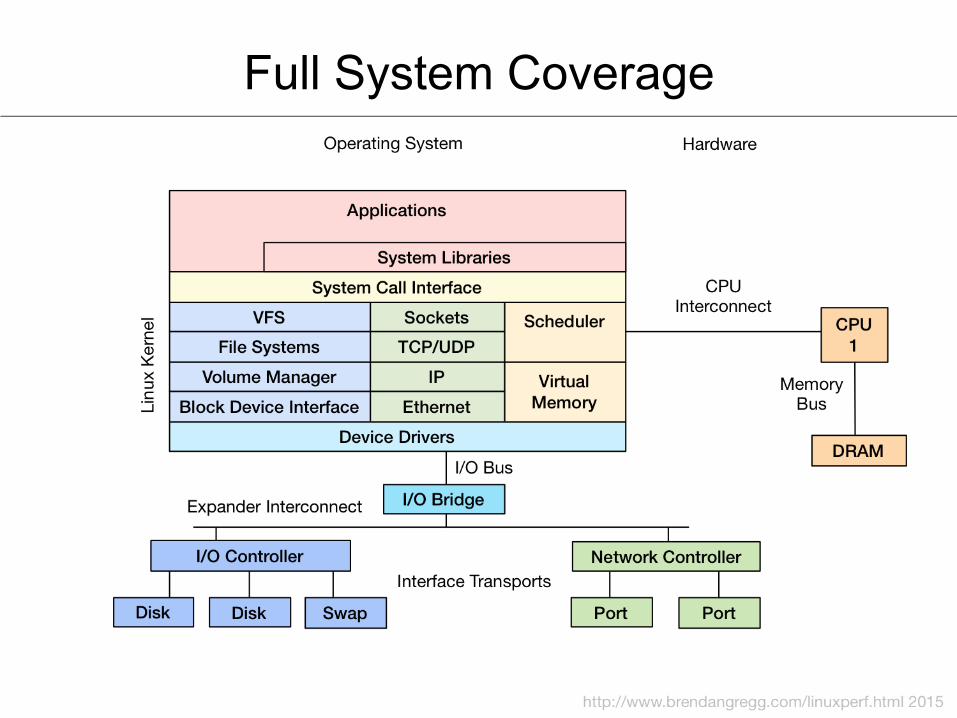
Full System Coverage
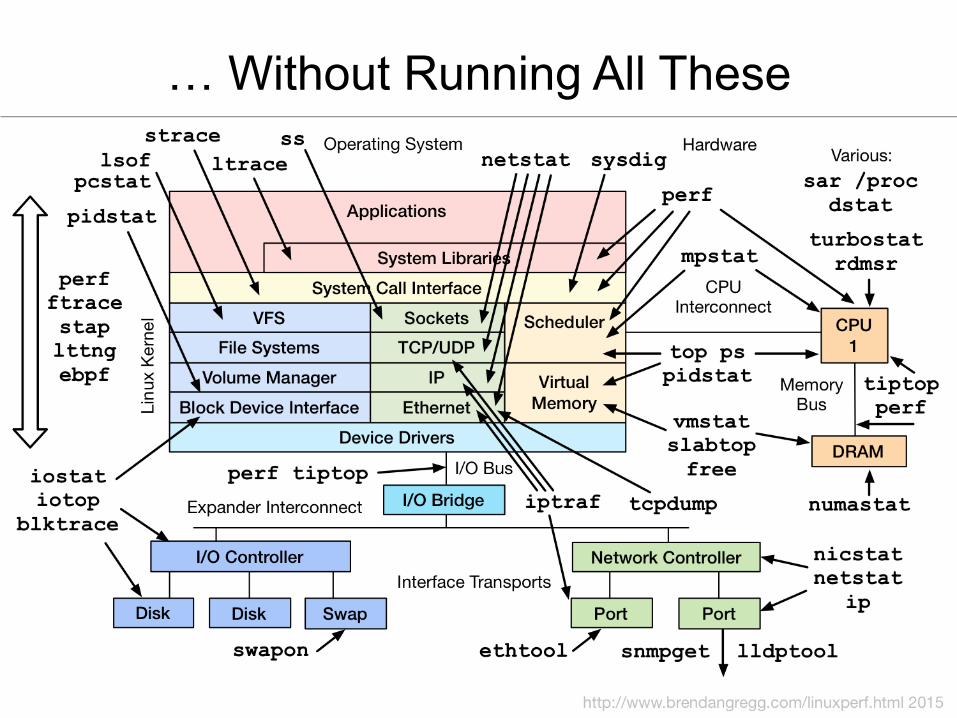
… Without Running All These
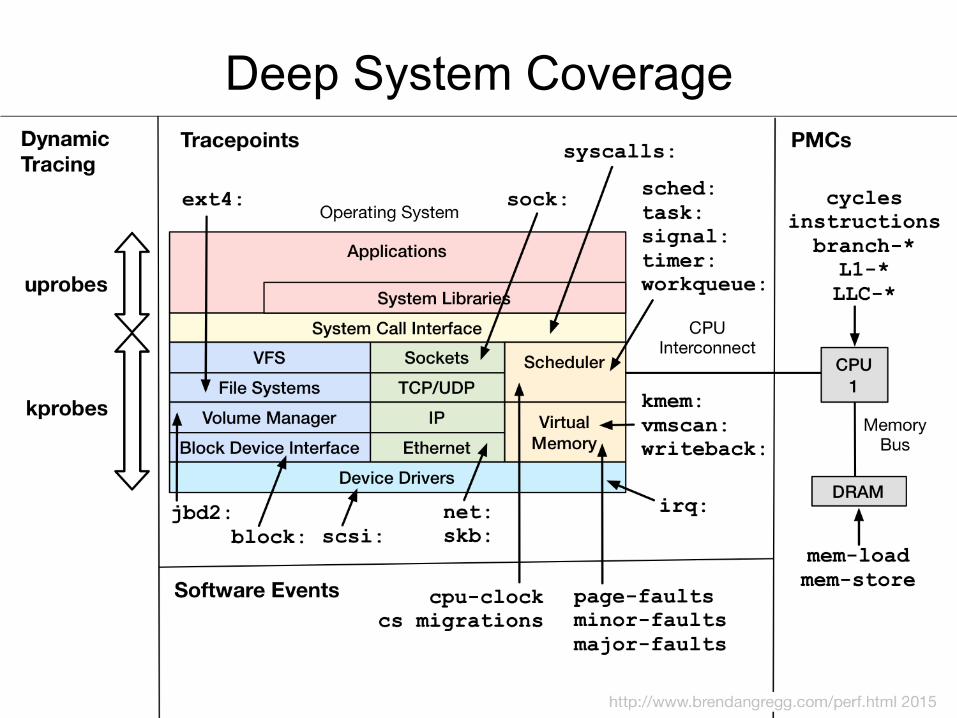
Deep System Coverage
Other Desirables
• Safe for production use • Easy to use: self service • [Near] Real Time • Ad hoc / custom instrumentation • Complete documentation • Graph labels and units • Open source • Community

2. Undesirables
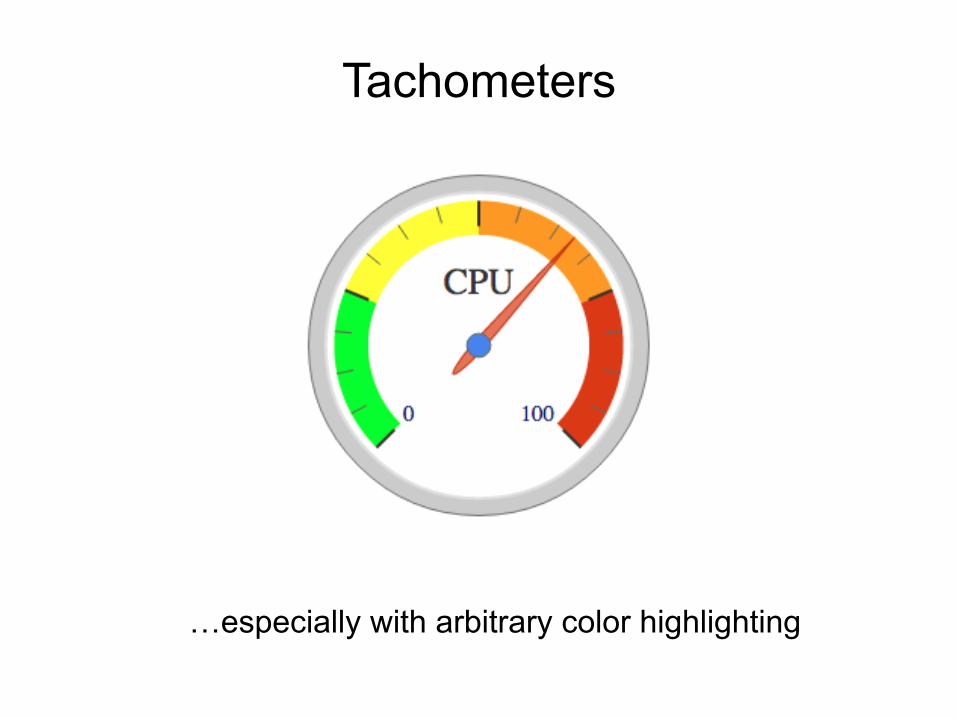
Tachometers
…especially with arbitrary color highlighting
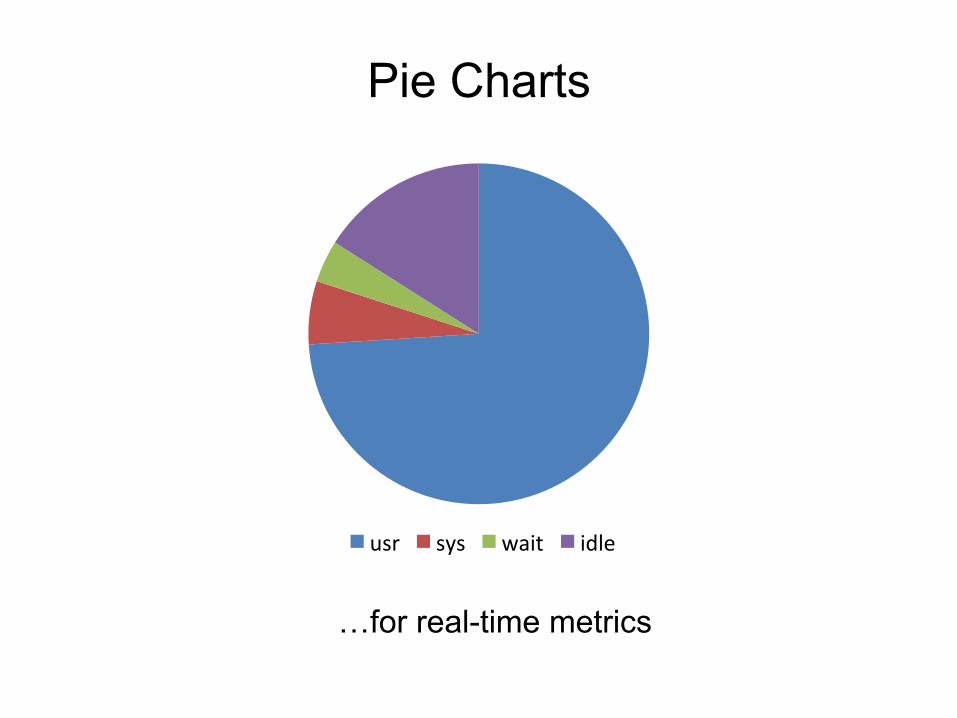
Pie Charts
…for real-time metrics
usr sys wait idle
Doughnuts
usr sys wait idle
…like pie charts but worse
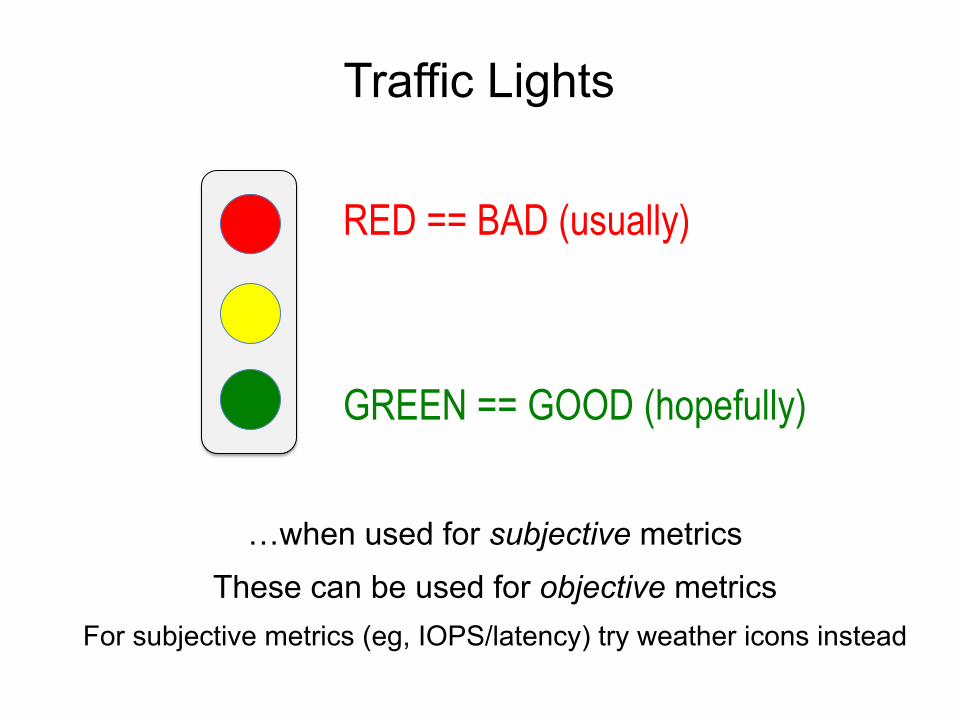
Traffic Lights
…when used for subjective metrics
These can be used for objective metrics For subjective metrics (eg, IOPS/latency) try weather icons instead
RED == BAD (usually)
GREEN == GOOD (hopefully)
3. Requirements
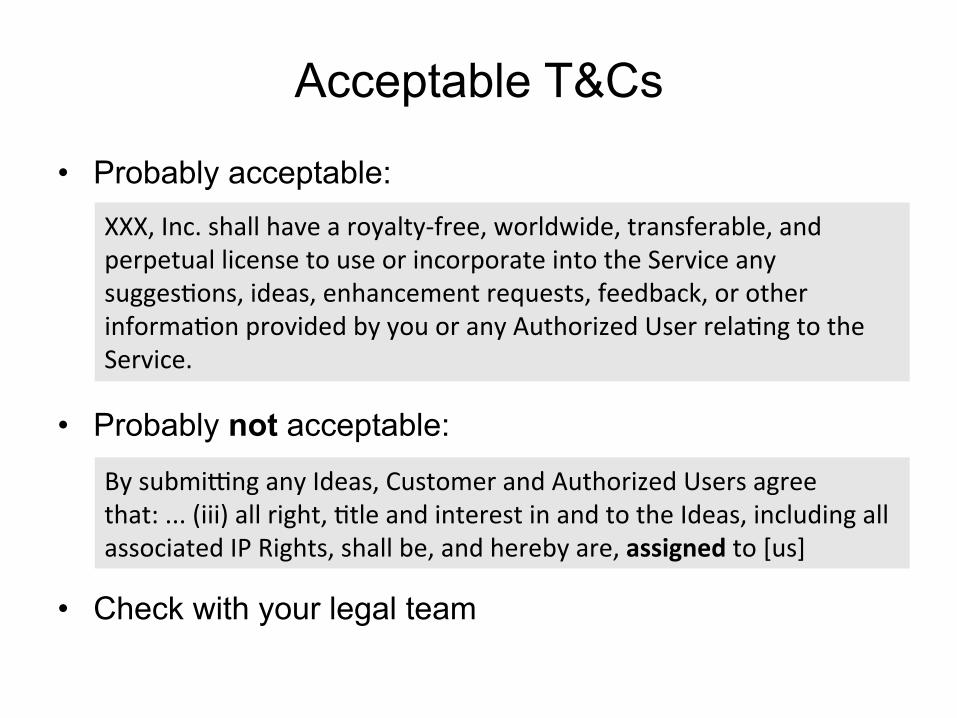
Acceptable T&Cs
• Probably acceptable:
• Probably not acceptable:
• Check with your legal team
By submi9ng any Ideas, Customer and Authorized Users agree that: ... (iii) all right, Ftle and interest in and to the Ideas, including all associated IP Rights, shall be, and hereby are, assigned to [us]
XXX, Inc. shall have a royalty-‐free, worldwide, transferable, and perpetual license to use or incorporate into the Service any suggesFons, ideas, enhancement requests, feedback, or other informaFon provided by you or any Authorized User relaFng to the Service.
Acceptable Technical Debt
• It must be worth the … • Extra complexity when debugging • Time to explain to others • Production reliability risk • Security risk
• There is no such thing as a free trial
Known Overhead
• Overhead must be known to be managed – T&Cs should not prohibit its measurement or publication
• Sources of overhead: – CPU cycles – File system I/O – Network I/O – Installed software size
• We will measure it
Low Overhead
• Overhead should also be the lowest possible – 1% CPU overhead means 1% more instances, and $$$
• Things we try to avoid – Tracing every function/method call – Needless kernel/user data transfers – strace (ptrace), tcpdump, libpcap, …
• Event logging doesn't scale
Scalable
• Can the product scale to (say) 100,000 instances? – Atlas, our cloud-wide analysis tool, can – We tend to kill other monitoring tools that attempt this
• Real-time dashboards showing all instances: – How does that work? Can it scale to 1k? … 100k? – Adrian Cockcroft's spigo can simulate protocols at scale
• High overhead might be worth it: on-demand only
Useful
An instance analysis solution must provide actionable information
that helps us improve performance
4. Methodologies
Methodologies
Methodologies pose the questions for metrics to answer
Good monitoring/analysis tools should support performance analysis methodologies
Drunk Man Anti-Method
• Tune things at random until the problem goes away
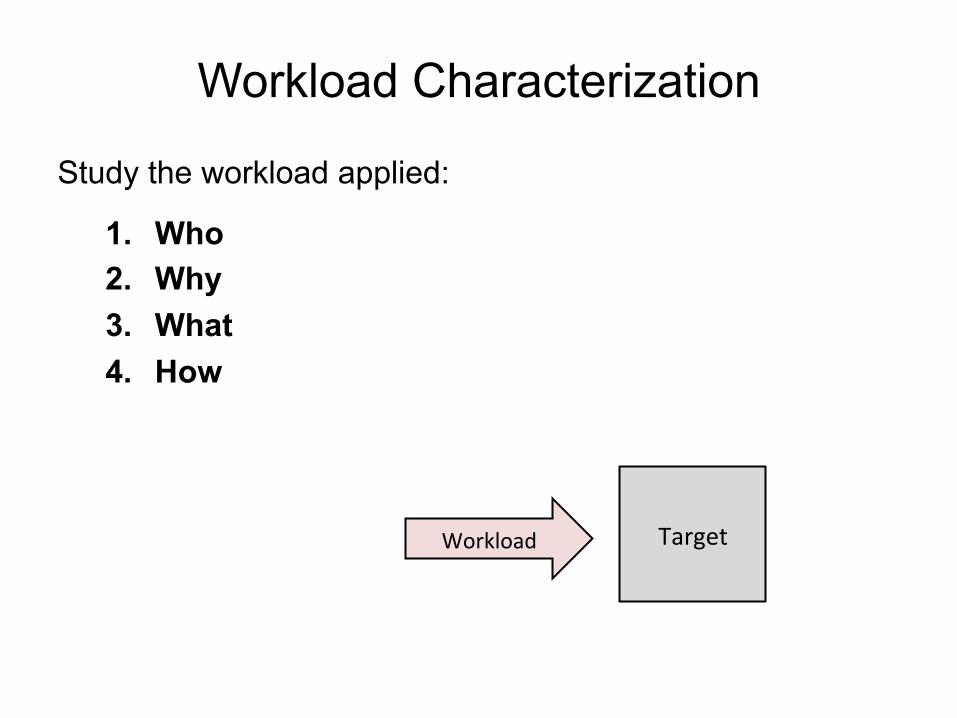
Workload Characterization
Study the workload applied:
1. Who 2. Why 3. What 4. How
Target Workload
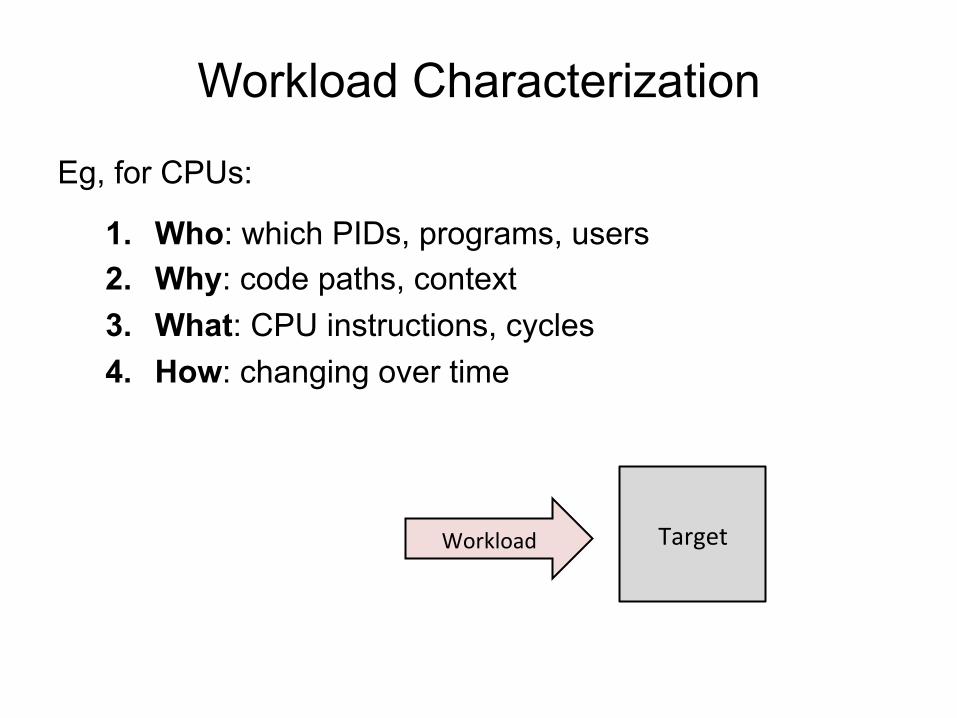
Workload Characterization
Eg, for CPUs:
1. Who: which PIDs, programs, users 2. Why: code paths, context 3. What: CPU instructions, cycles 4. How: changing over time
Target Workload
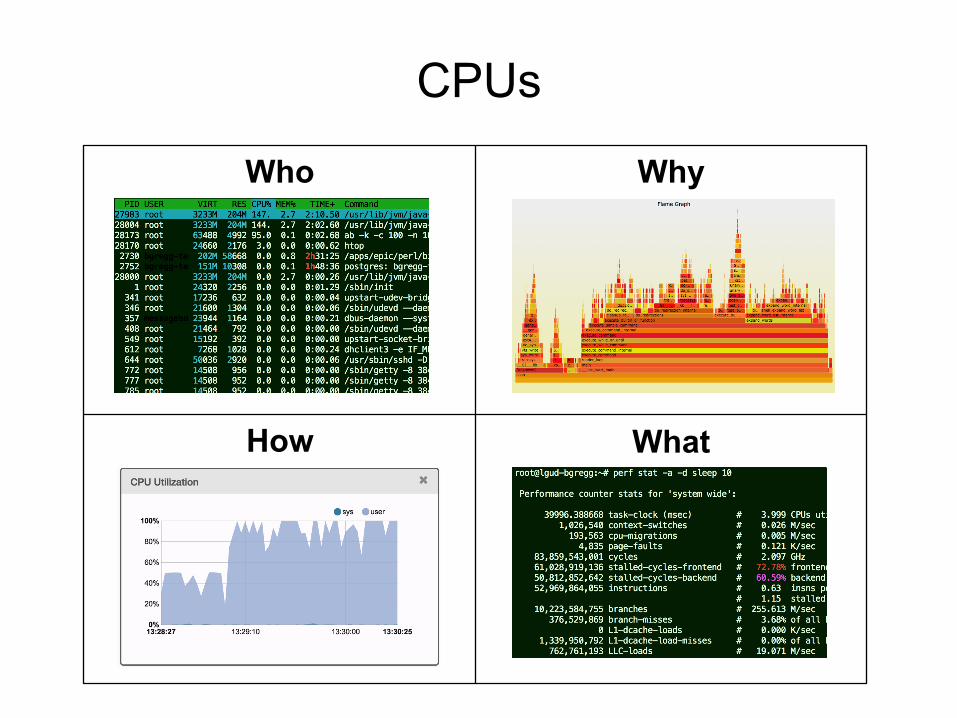
CPUs
Who
How What
Why
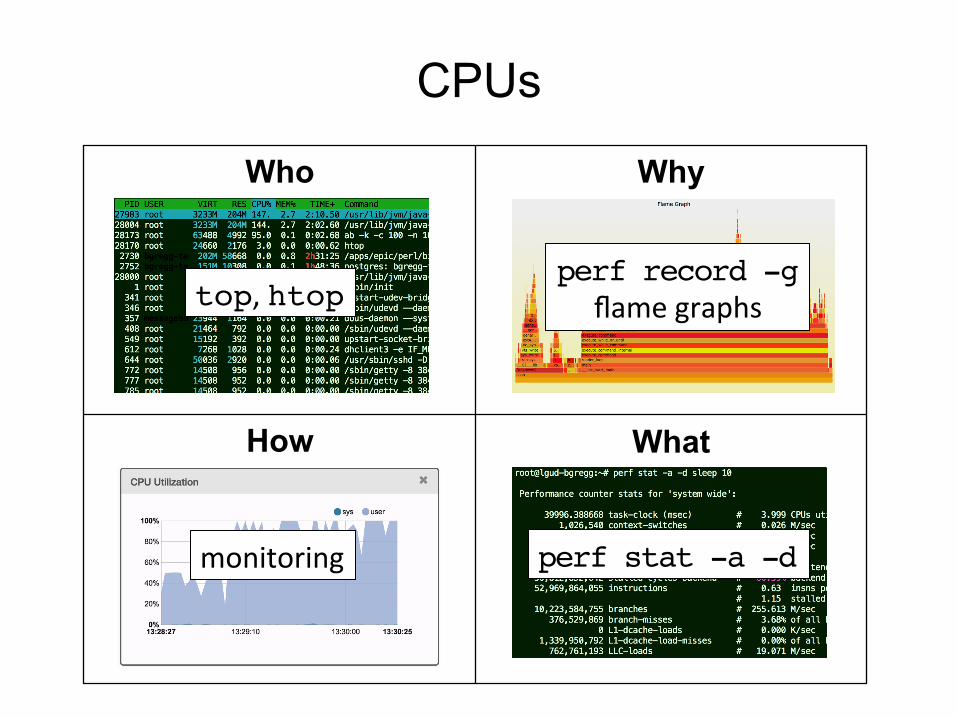
CPUs
Who
How What
Why
top, htop!perf record -g!
flame graphs
monitoring perf stat -a -d!
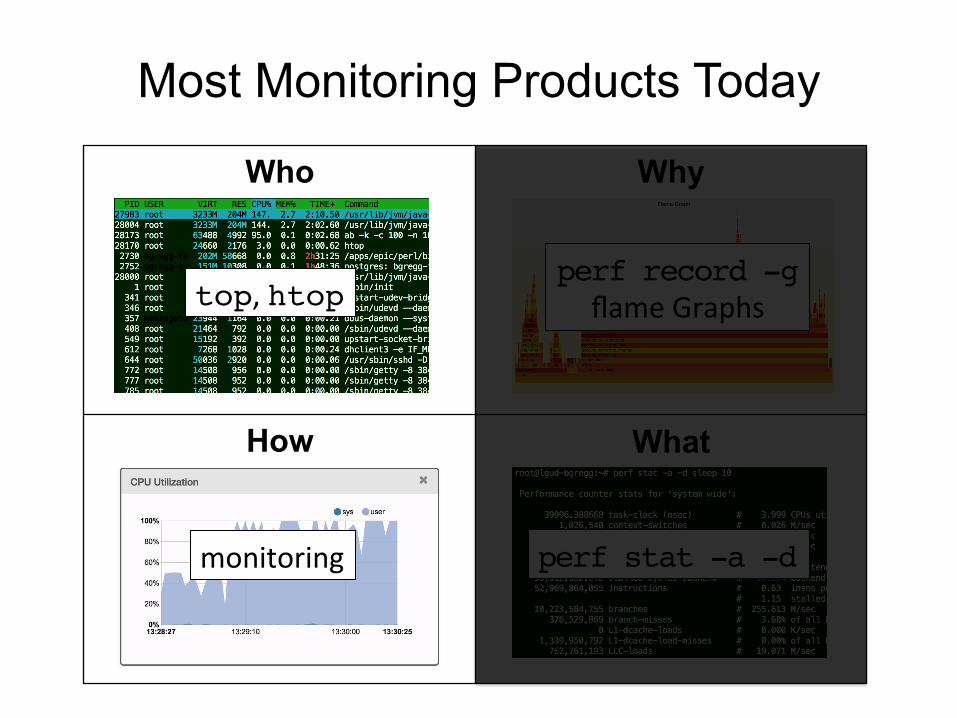
Most Monitoring Products Today
Who
How What
Why
top, htop!perf record -g!
flame Graphs
monitoring perf stat -a -d!
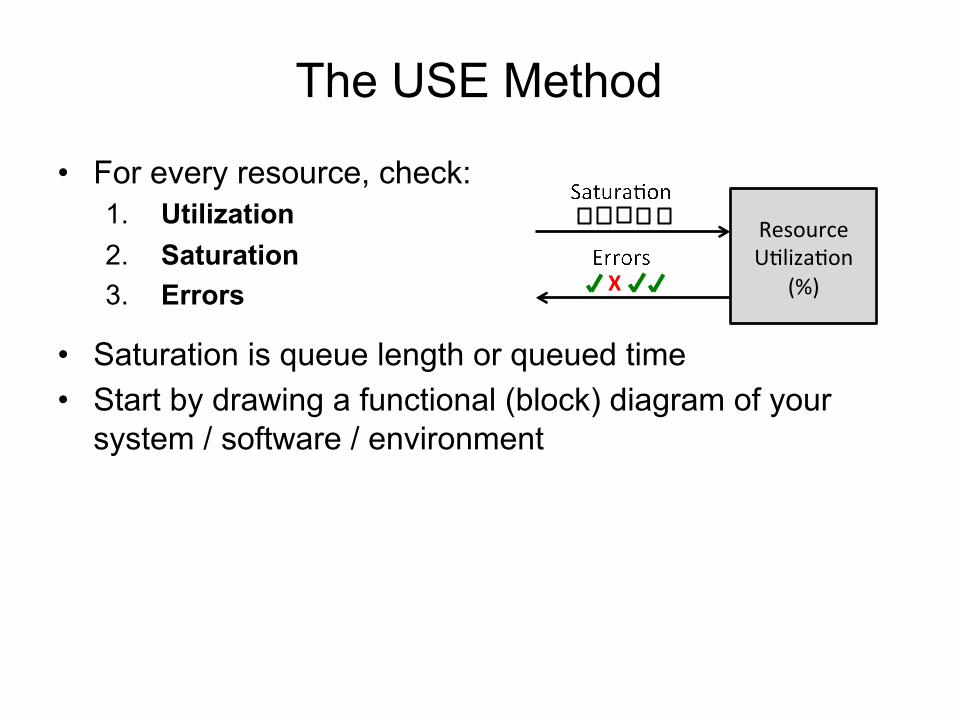
The USE Method
• For every resource, check: 1. Utilization 2. Saturation 3. Errors
• Saturation is queue length or queued time • Start by drawing a functional (block) diagram of your
system / software / environment
Resource UFlizaFon
(%) X
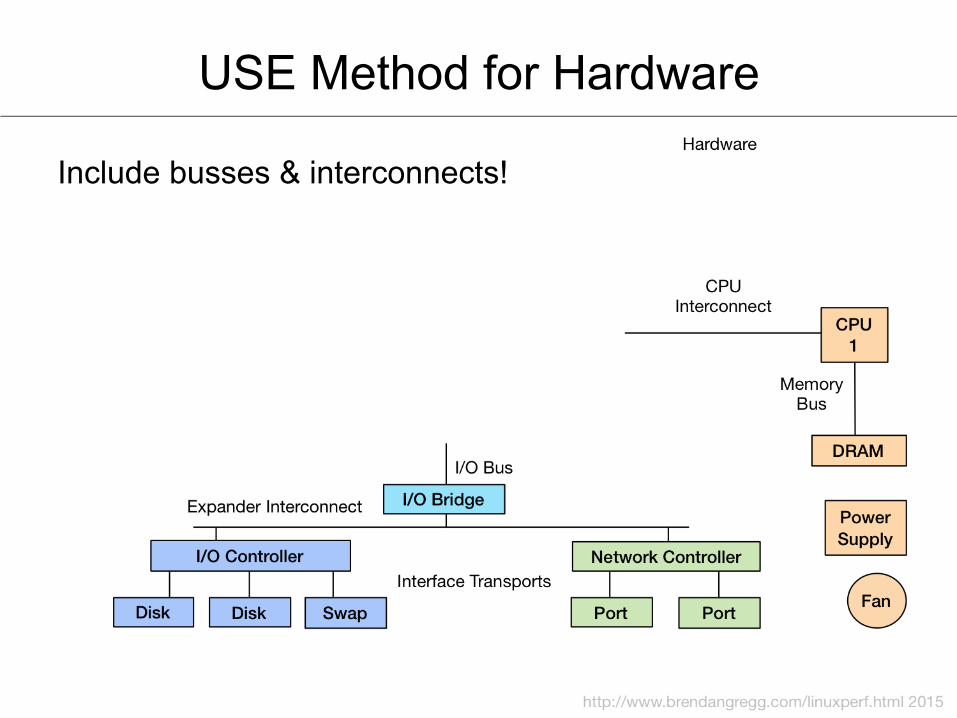
USE Method for Hardware
Include busses & interconnects!
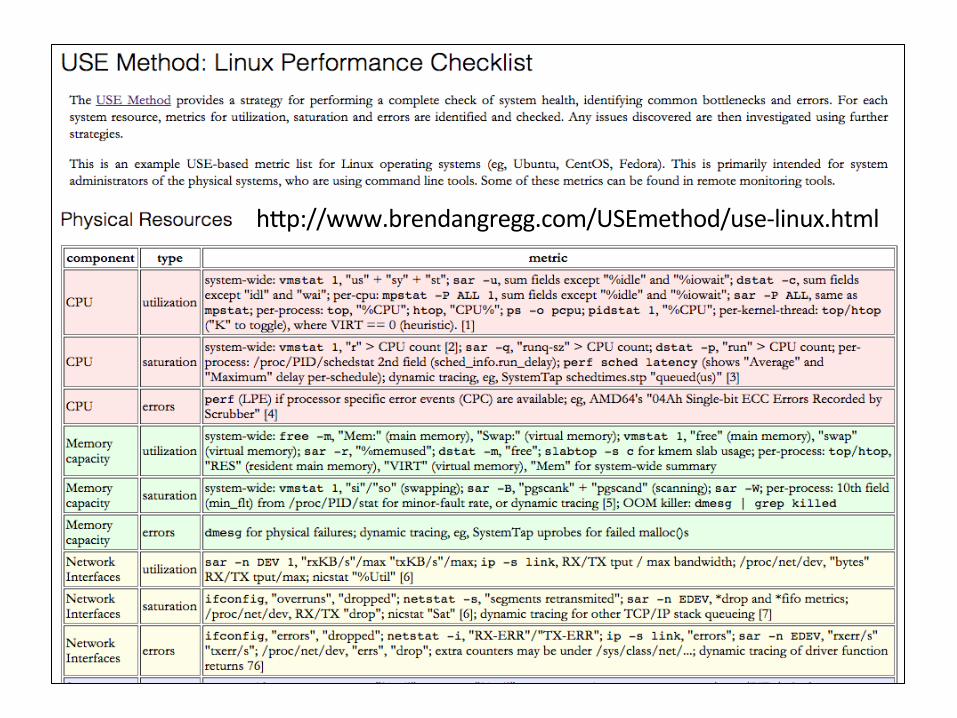
hXp://www.brendangregg.com/USEmethod/use-‐linux.html
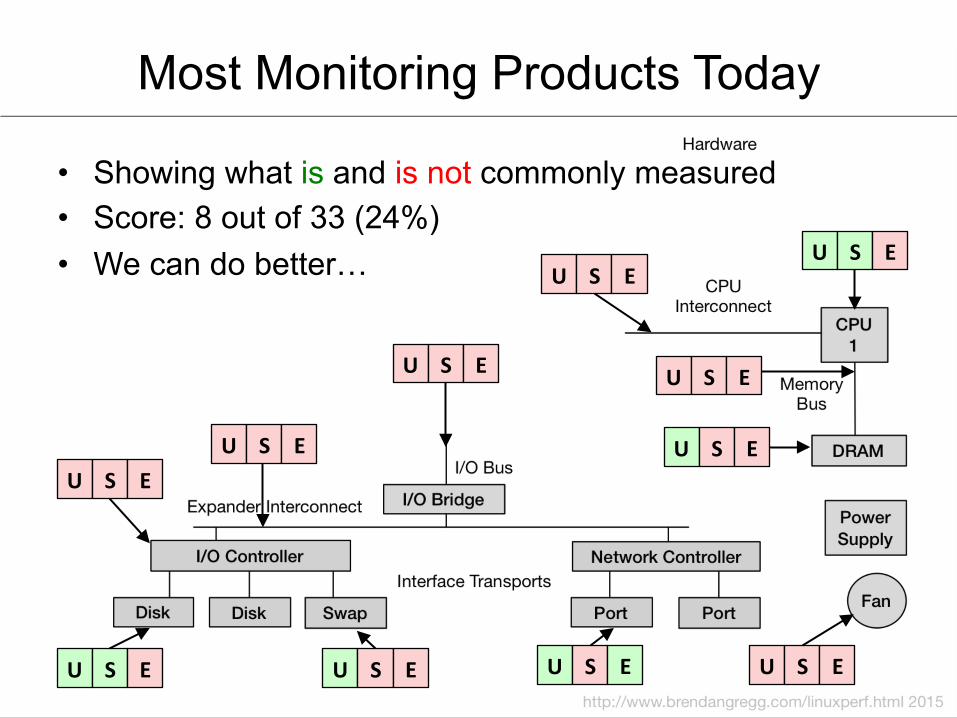
Most Monitoring Products Today
• Showing what is and is not commonly measured • Score: 8 out of 33 (24%) • We can do better… U S E
U S E
U S E
U S E
U S E
U S E U S E
U S E U S E U S E U S E
Other Methodologies
• There are many more: – Drill-Down Analysis Method – Time Division Method – Stack Profile Method – Off-CPU Analysis – … – I've covered these in previous talks & books
5. Our Tools
Atlas
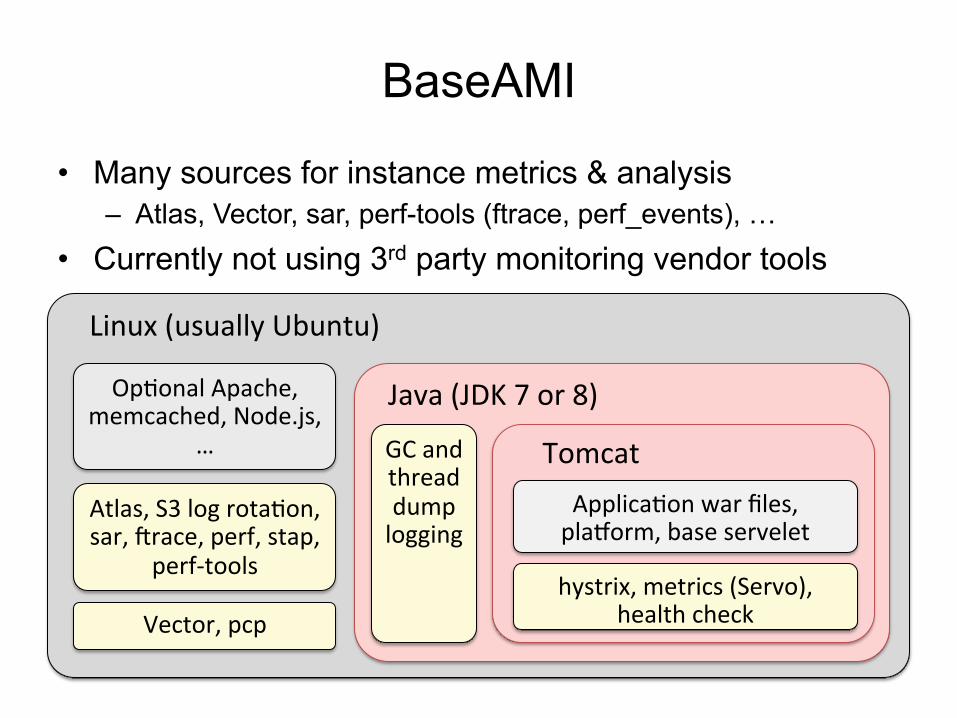
BaseAMI
• Many sources for instance metrics & analysis – Atlas, Vector, sar, perf-tools (ftrace, perf_events), …
• Currently not using 3rd party monitoring vendor tools
Linux (usually Ubuntu)
Java (JDK 7 or 8)
Tomcat GC and thread dump logging
hystrix, metrics (Servo), health check
OpFonal Apache, memcached, Node.js,
…
Atlas, S3 log rotaFon, sar, erace, perf, stap,
perf-‐tools
Vector, pcp
ApplicaFon war files, plahorm, base servelet
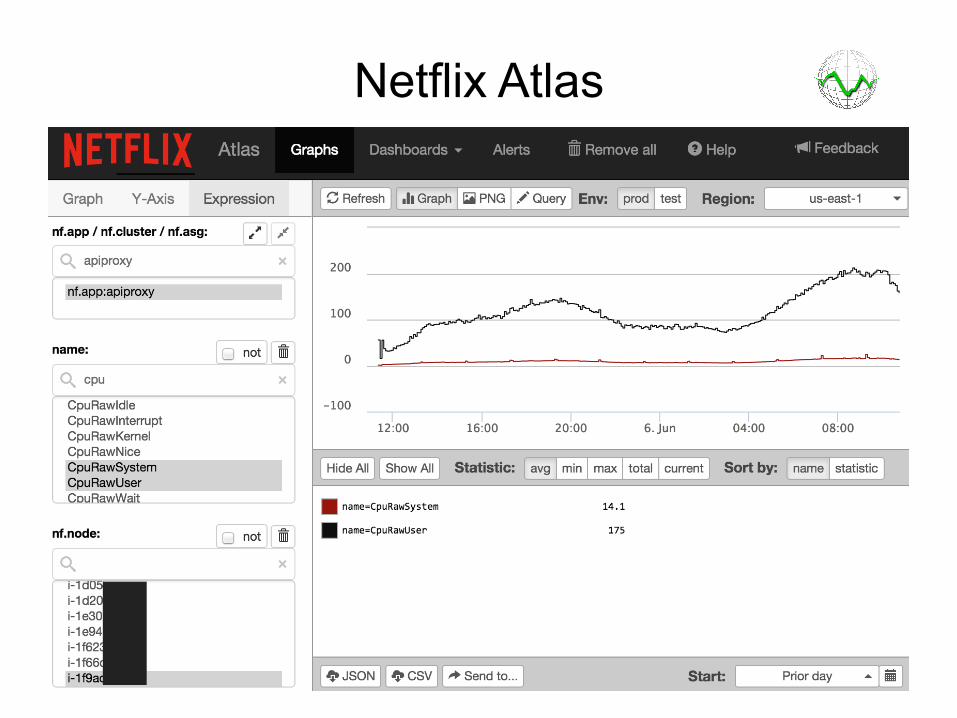
Netflix Atlas
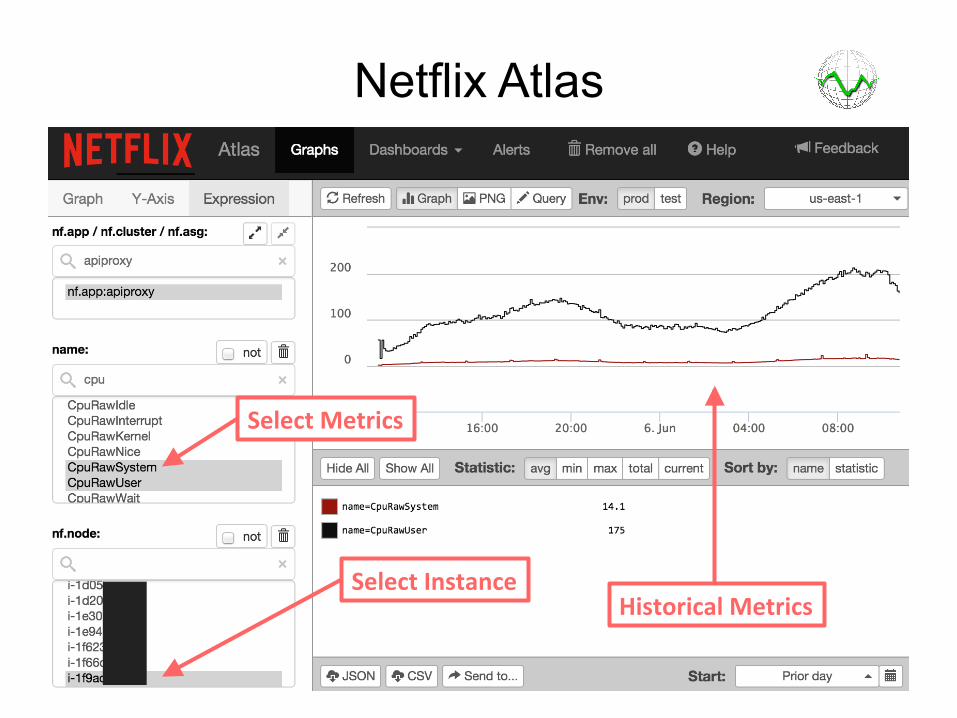
Netflix Atlas
Select Instance Historical Metrics
Select Metrics
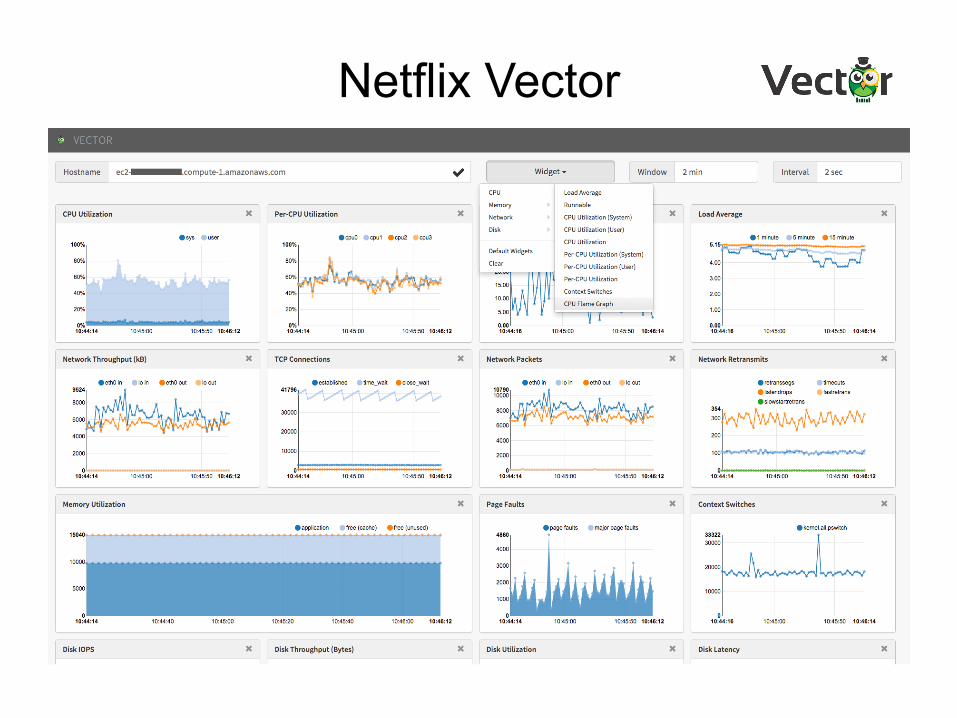
Netflix Vector
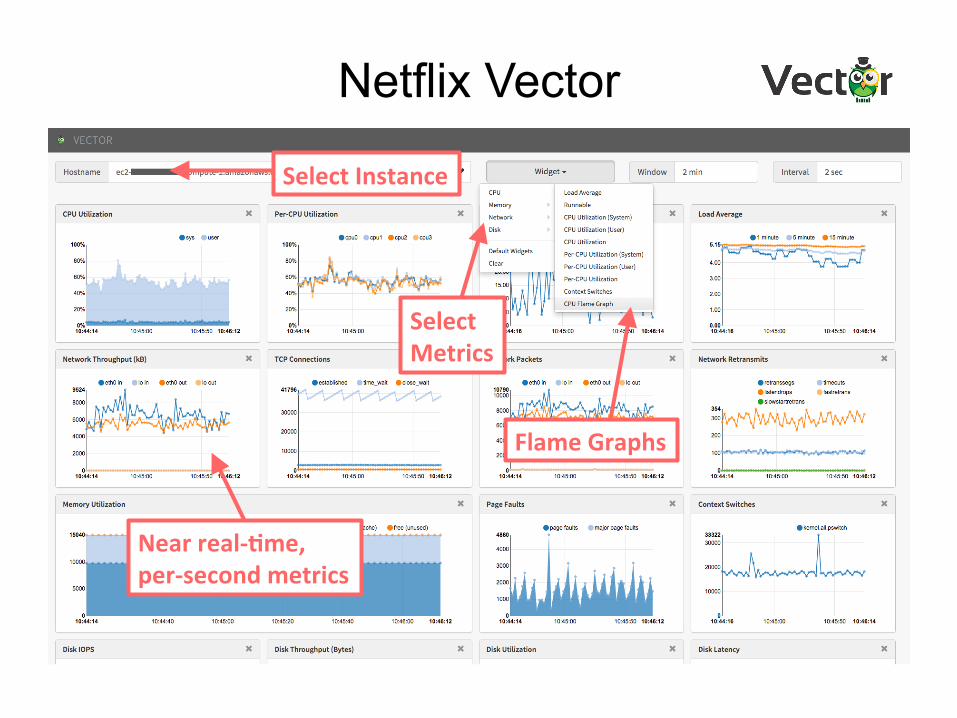
Netflix Vector
Near real-‐7me, per-‐second metrics
Flame Graphs
Select Metrics
Select Instance
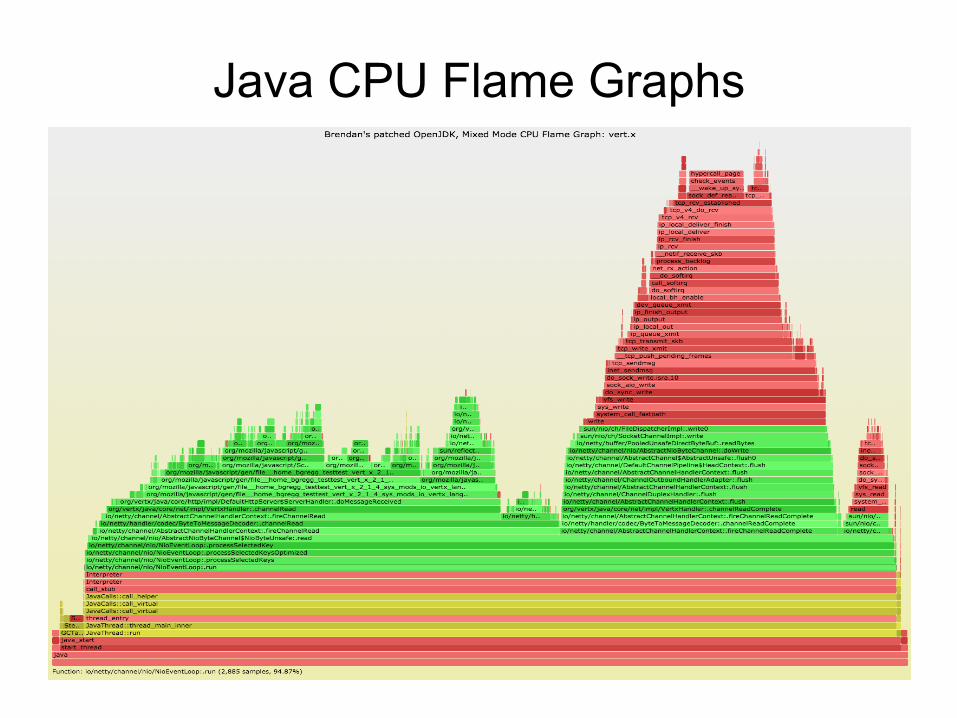
Java CPU Flame Graphs
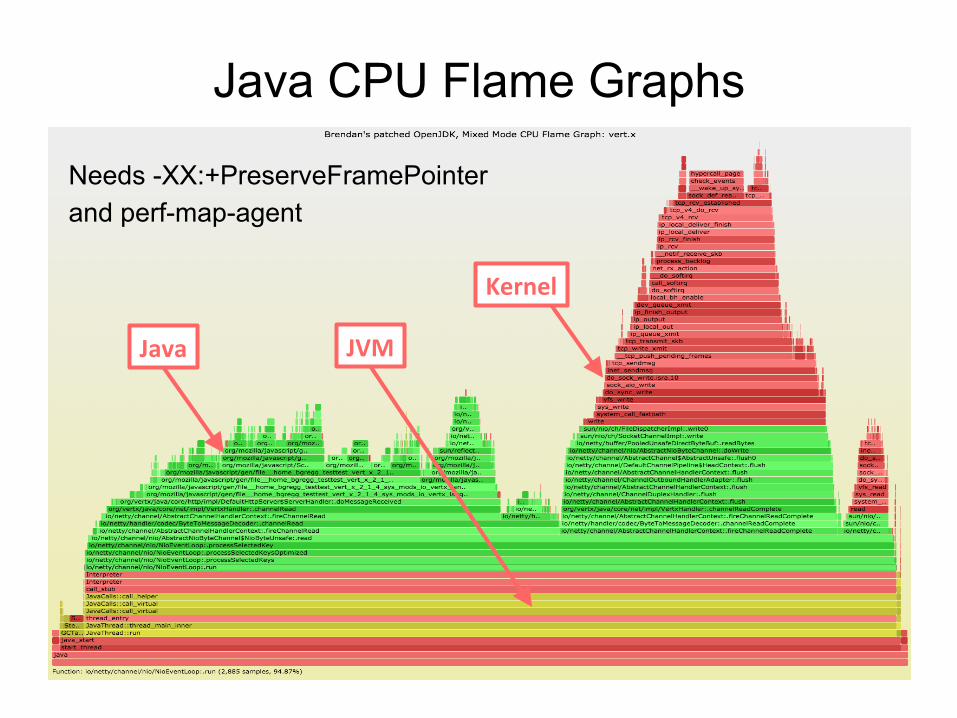
Needs -XX:+PreserveFramePointer and perf-map-agent
Java CPU Flame Graphs
Java JVM
Kernel
sar
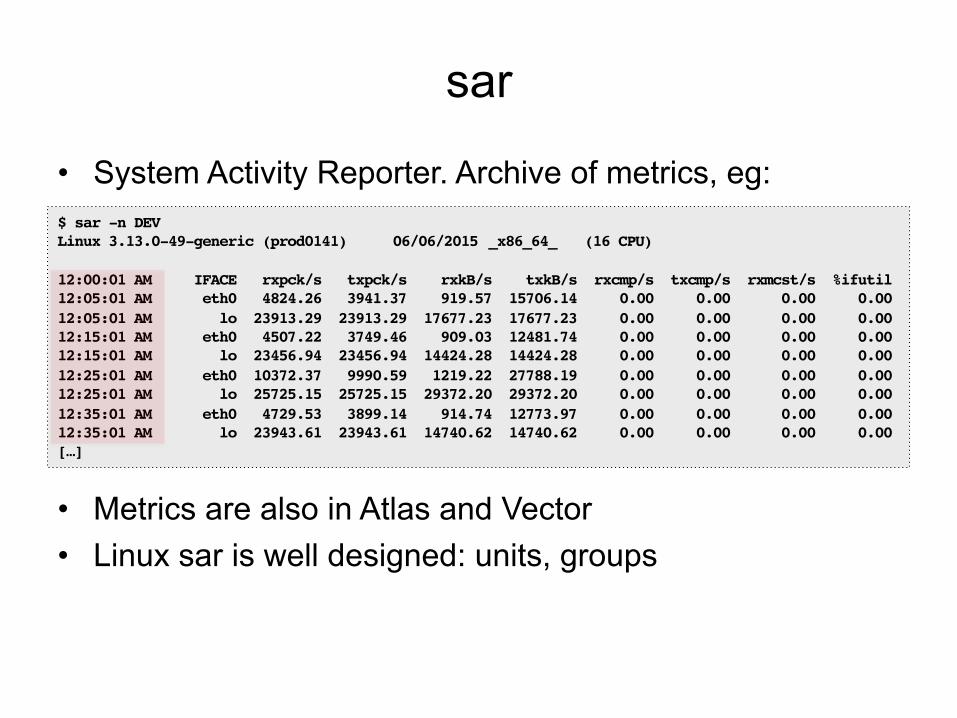
• System Activity Reporter. Archive of metrics, eg:
• Metrics are also in Atlas and Vector • Linux sar is well designed: units, groups
$ sar -n DEV!Linux 3.13.0-49-generic (prod0141) !06/06/2015 !_x86_64_ !(16 CPU)!!12:00:01 AM IFACE rxpck/s txpck/s rxkB/s txkB/s rxcmp/s txcmp/s rxmcst/s %ifutil!12:05:01 AM eth0 4824.26 3941.37 919.57 15706.14 0.00 0.00 0.00 0.00!12:05:01 AM lo 23913.29 23913.29 17677.23 17677.23 0.00 0.00 0.00 0.00!12:15:01 AM eth0 4507.22 3749.46 909.03 12481.74 0.00 0.00 0.00 0.00!12:15:01 AM lo 23456.94 23456.94 14424.28 14424.28 0.00 0.00 0.00 0.00!12:25:01 AM eth0 10372.37 9990.59 1219.22 27788.19 0.00 0.00 0.00 0.00!12:25:01 AM lo 25725.15 25725.15 29372.20 29372.20 0.00 0.00 0.00 0.00!12:35:01 AM eth0 4729.53 3899.14 914.74 12773.97 0.00 0.00 0.00 0.00!12:35:01 AM lo 23943.61 23943.61 14740.62 14740.62 0.00 0.00 0.00 0.00![…]!
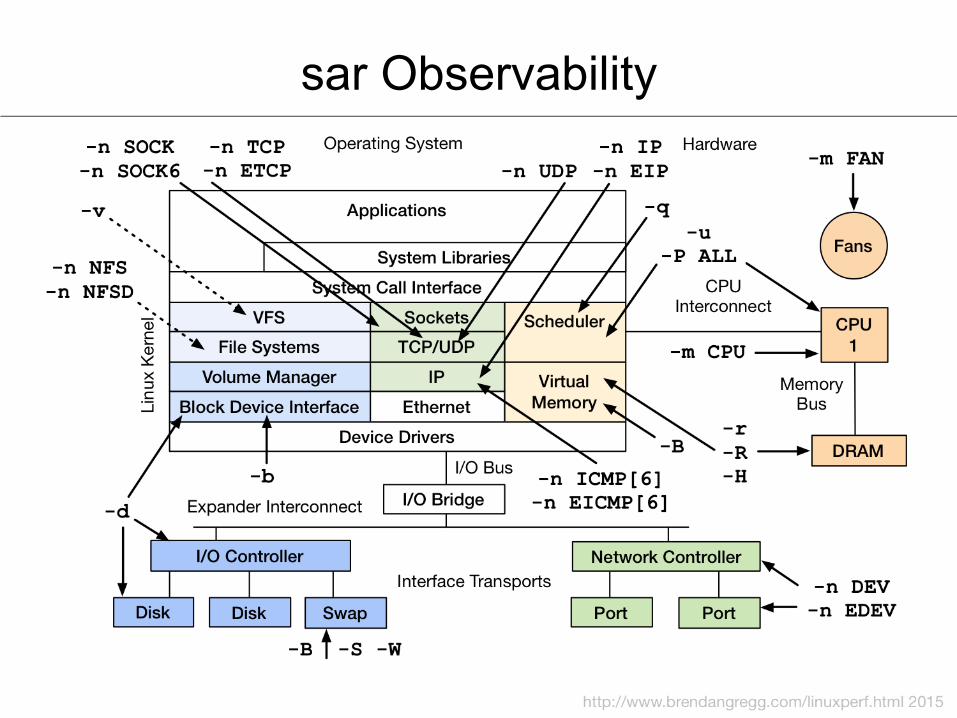
sar Observability
perf-tools
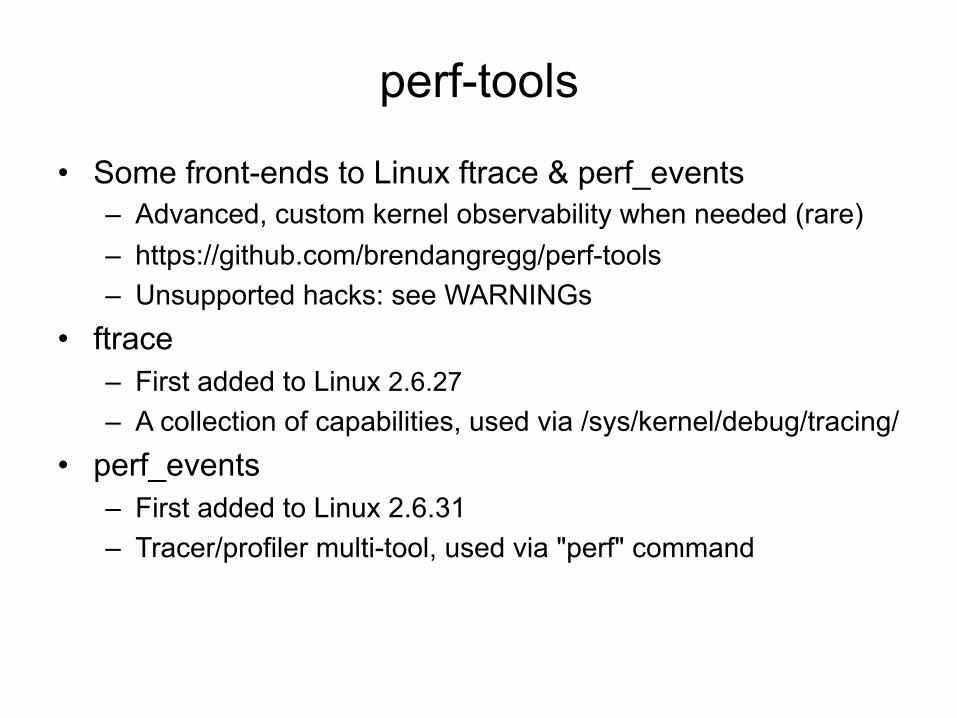
• Some front-ends to Linux ftrace & perf_events – Advanced, custom kernel observability when needed (rare) – https://github.com/brendangregg/perf-tools – Unsupported hacks: see WARNINGs
• ftrace – First added to Linux 2.6.27 – A collection of capabilities, used via /sys/kernel/debug/tracing/
• perf_events – First added to Linux 2.6.31 – Tracer/profiler multi-tool, used via "perf" command
perf-tools: funccount
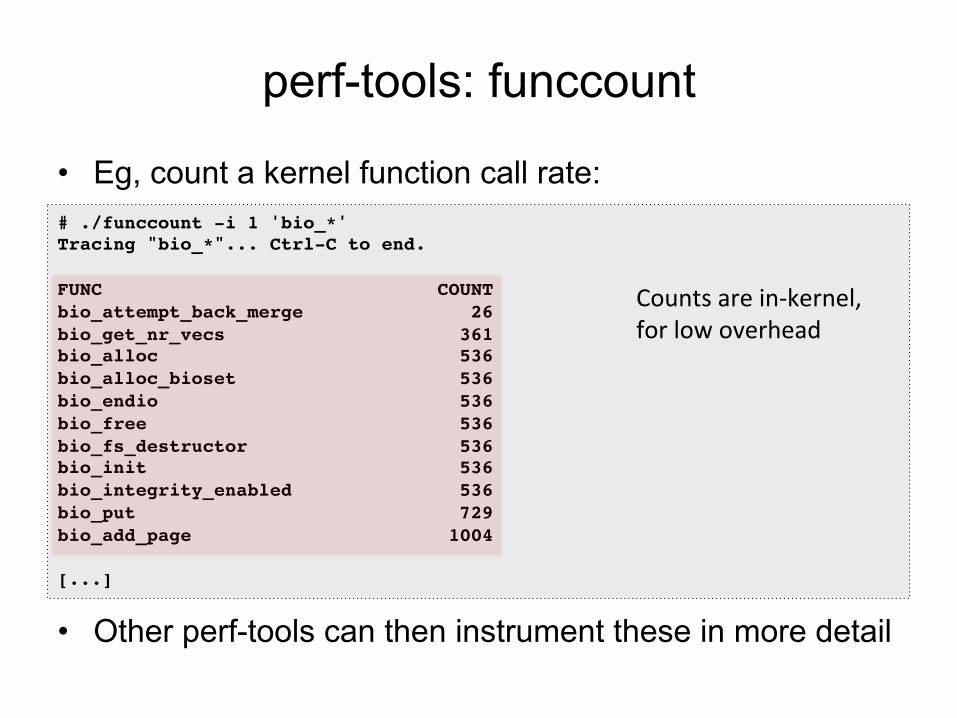
• Eg, count a kernel function call rate:
• Other perf-tools can then instrument these in more detail
# ./funccount -i 1 'bio_*'!Tracing "bio_*"... Ctrl-C to end.!!FUNC COUNT!bio_attempt_back_merge 26!bio_get_nr_vecs 361!bio_alloc 536!bio_alloc_bioset 536!bio_endio 536!bio_free 536!bio_fs_destructor 536!bio_init 536!bio_integrity_enabled 536!bio_put 729!bio_add_page 1004!![...]!
Counts are in-‐kernel, for low overhead
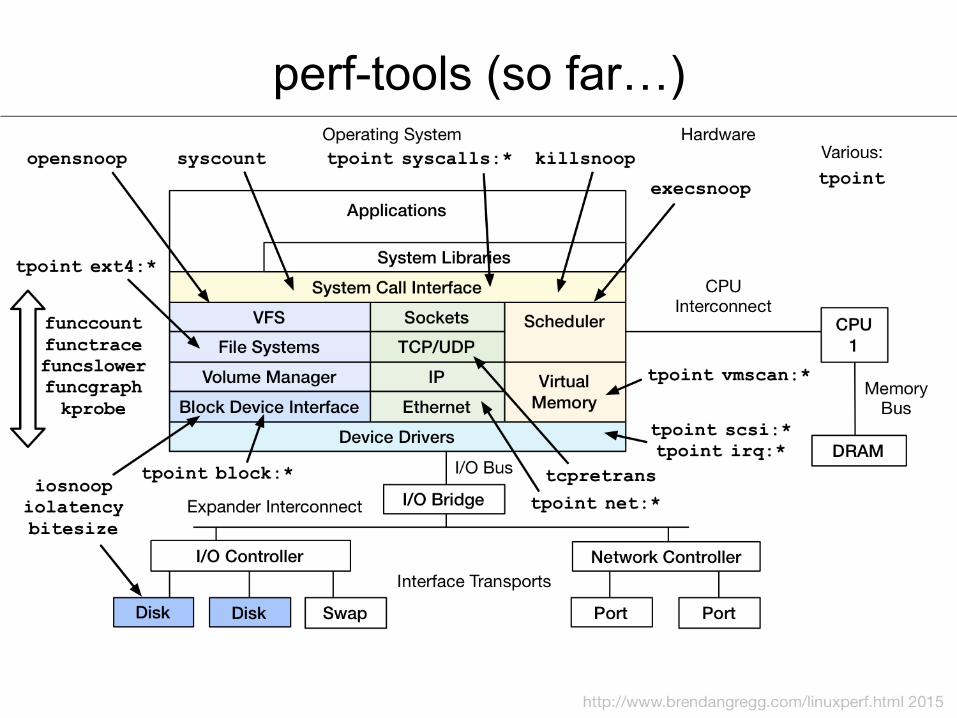
perf-tools (so far…)
eBPF
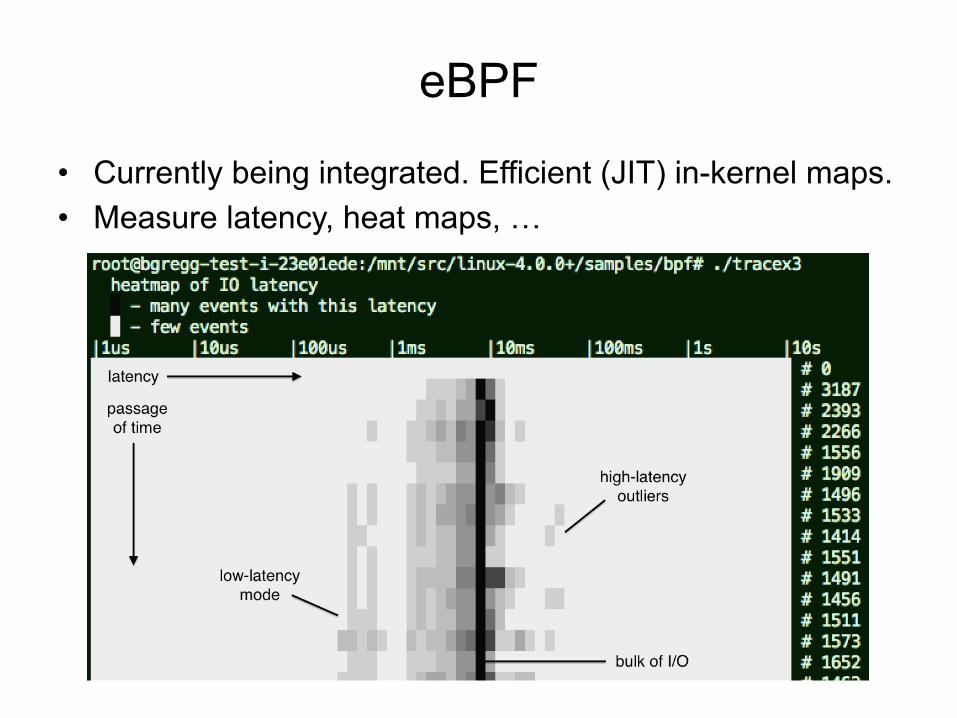
• Currently being integrated. Efficient (JIT) in-kernel maps. • Measure latency, heat maps, …
eBPF
eBPF will make a profound difference to monitoring on Linux systems
There will be an arms race to support it, post Linux 4.1+ If it's not on your roadmap, it should be
Summary
Requirements
• Acceptable T&Cs • Acceptable technical debt • Known overhead • Low overhead • Scalable • Useful
Methodologies
Support for: • Workload Characterization • The USE Method • … Not starting with metrics in search of uses
Desirables
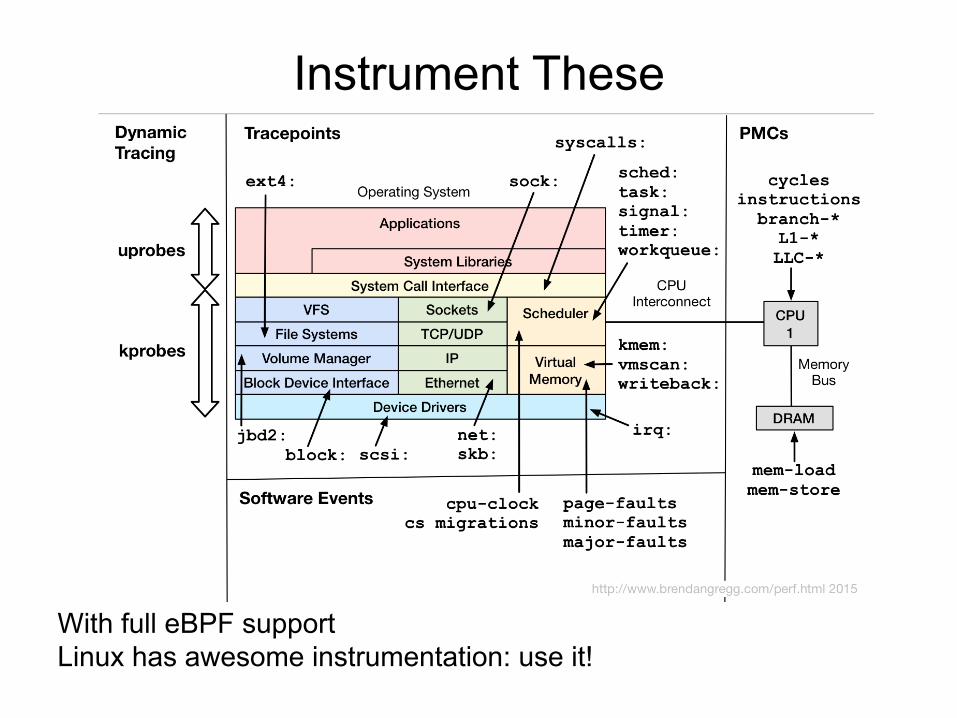
Instrument These
With full eBPF support Linux has awesome instrumentation: use it!
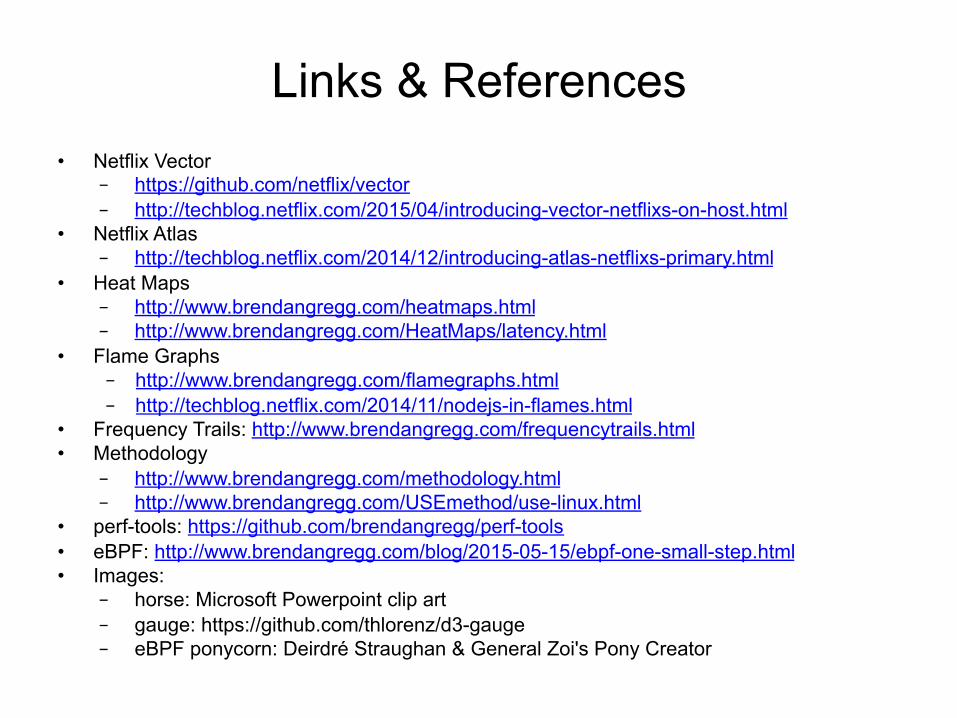
Links & References • Netflix Vector
– https://github.com/netflix/vector – http://techblog.netflix.com/2015/04/introducing-vector-netflixs-on-host.html
• Netflix Atlas – http://techblog.netflix.com/2014/12/introducing-atlas-netflixs-primary.html
• Heat Maps – http://www.brendangregg.com/heatmaps.html – http://www.brendangregg.com/HeatMaps/latency.html
• Flame Graphs – http://www.brendangregg.com/flamegraphs.html – http://techblog.netflix.com/2014/11/nodejs-in-flames.html
• Frequency Trails: http://www.brendangregg.com/frequencytrails.html • Methodology
– http://www.brendangregg.com/methodology.html – http://www.brendangregg.com/USEmethod/use-linux.html
• perf-tools: https://github.com/brendangregg/perf-tools • eBPF: http://www.brendangregg.com/blog/2015-05-15/ebpf-one-small-step.html • Images:
– horse: Microsoft Powerpoint clip art – gauge: https://github.com/thlorenz/d3-gauge – eBPF ponycorn: Deirdré Straughan & General Zoi's Pony Creator
Thanks
• Questions? • http://techblog.netflix.com • http://slideshare.net/brendangregg • http://www.brendangregg.com • [email protected] • @brendangregg
Jun 2015


![S4Net: Single stage salient-instance segmentation · rather than instance segments. 2.3 Semantic instance segmentation Earlier semantic instance segmentation methods [22–24, 54]](https://img.pdfslide.us/doc/110x75/5fa63c2f83ae5a0cdb44c66e/s4net-single-stage-salient-instance-segmentation-rather-than-instance-segments.jpg)