Embed Size (px)
Citation preview
October29–November3,2017|SanFrancisco,CAwww.usenix.org/lisa17#lisa17
ContainerPerformanceAnalysisBrendanGregg
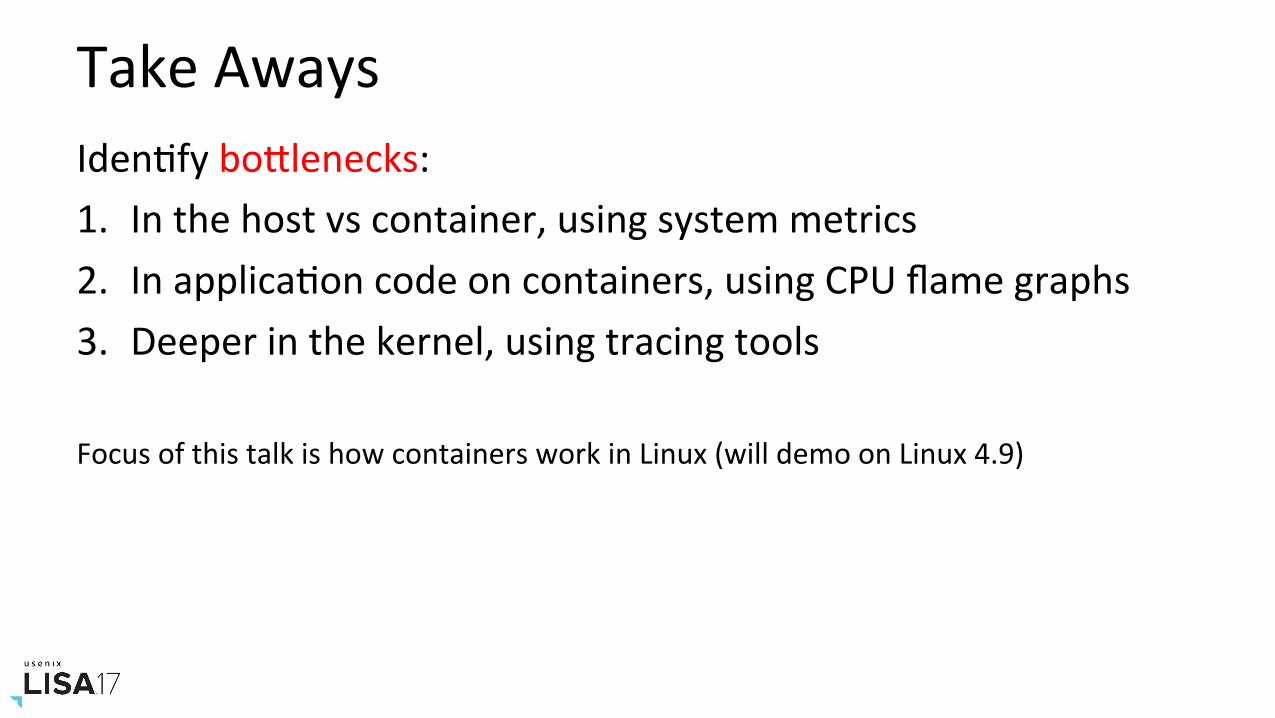
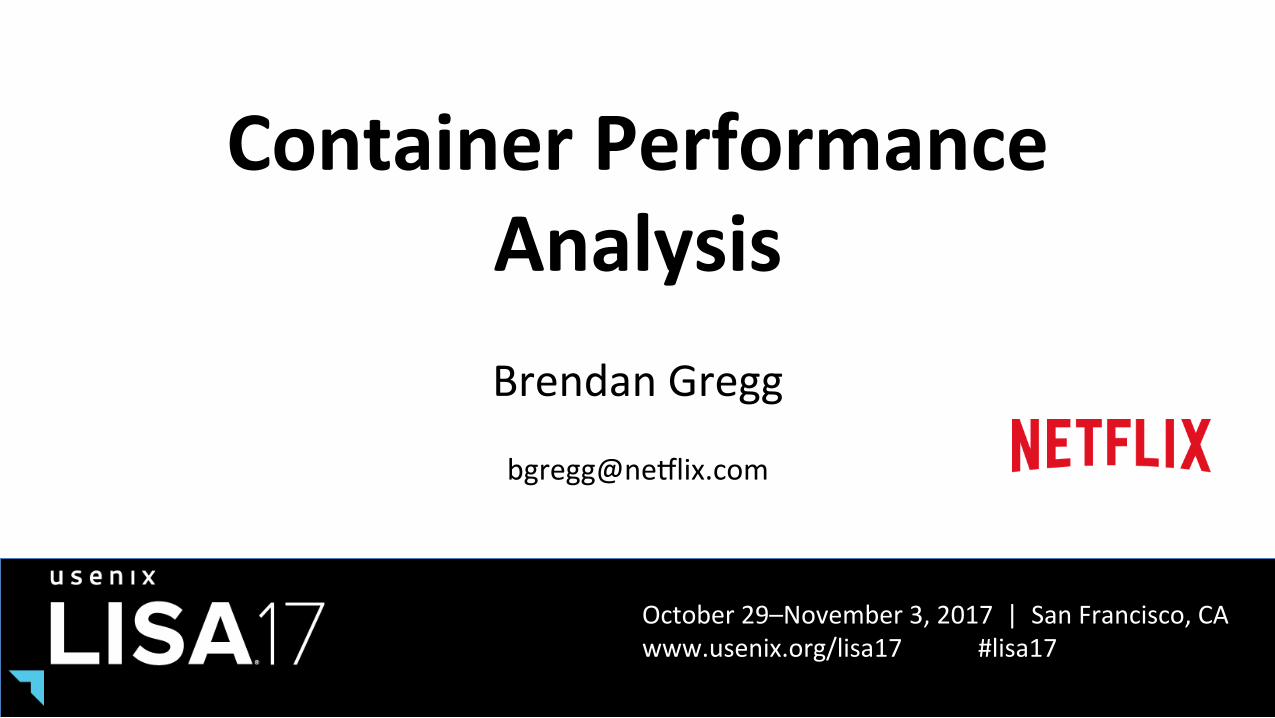
TakeAwaysIdenNfyboPlenecks:1. Inthehostvscontainer,usingsystemmetrics2. InapplicaNoncodeoncontainers,usingCPUflamegraphs3. Deeperinthekernel,usingtracingtools
FocusofthistalkishowcontainersworkinLinux(willdemoonLinux4.9)
1.TITUSContainersatNeIlix:summaryslidesfromtheTitusteam.
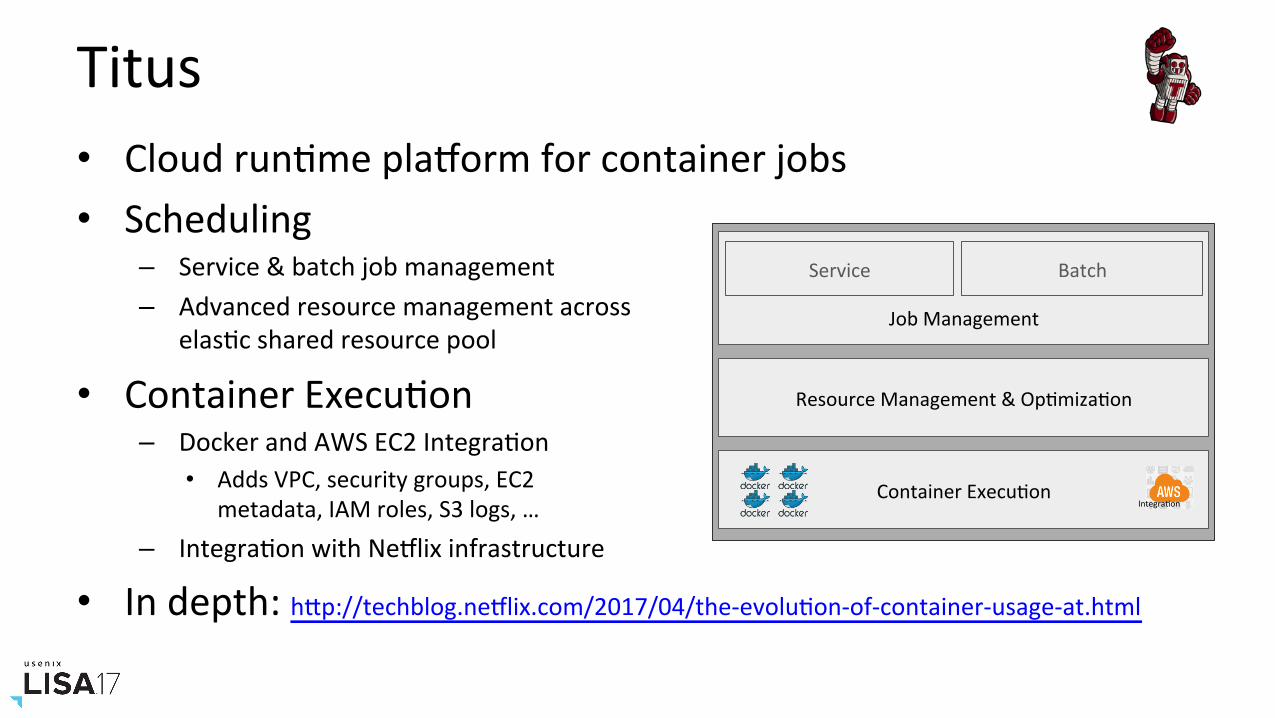
Titus• CloudrunNmeplaIormforcontainerjobs• Scheduling
– Service&batchjobmanagement– Advancedresourcemanagementacross
elasNcsharedresourcepool
• ContainerExecuNon– DockerandAWSEC2IntegraNon
• AddsVPC,securitygroups,EC2metadata,IAMroles,S3logs,…
– IntegraNonwithNeIlixinfrastructure
• Indepth:hPp://techblog.neIlix.com/2017/04/the-evoluNon-of-container-usage-at.html
Service
JobManagement
ResourceManagement&OpNmizaNon
ContainerExecuNonIntegraNon
Batch
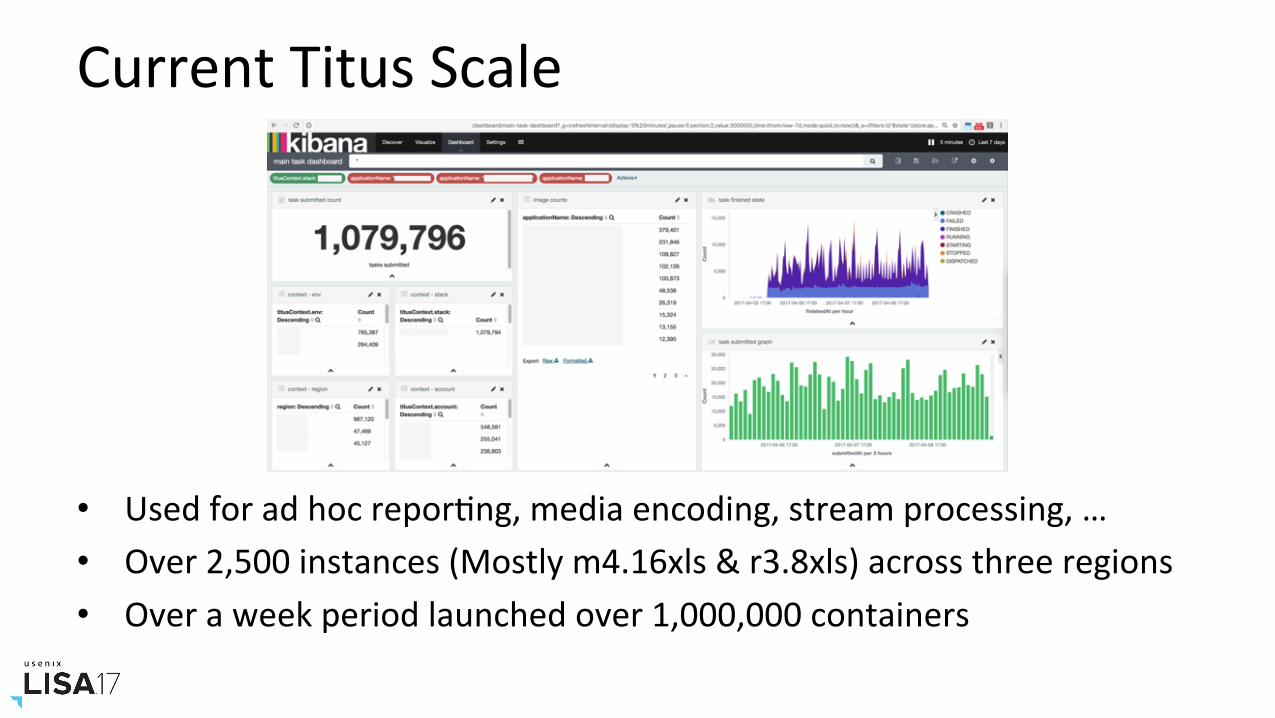
CurrentTitusScale
• UsedforadhocreporNng,mediaencoding,streamprocessing,…• Over2,500instances(Mostlym4.16xls&r3.8xls)acrossthreeregions• Overaweekperiodlaunchedover1,000,000containers
ContainerPerformance@NeIlix• AbilitytoscaleandbalanceworkloadswithEC2andTitus• Performanceneeds:
– ApplicaNonanalysis:usingCPUflamegraphswithcontainers
– Hosttuning:filesystem,networking,sysctl's,…
– Containeranalysisandtuning:cgroups,GPUs,…– Capacityplanning:reduceoverprovisioning

2.CONTAINERBACKGROUNDAndStrategy
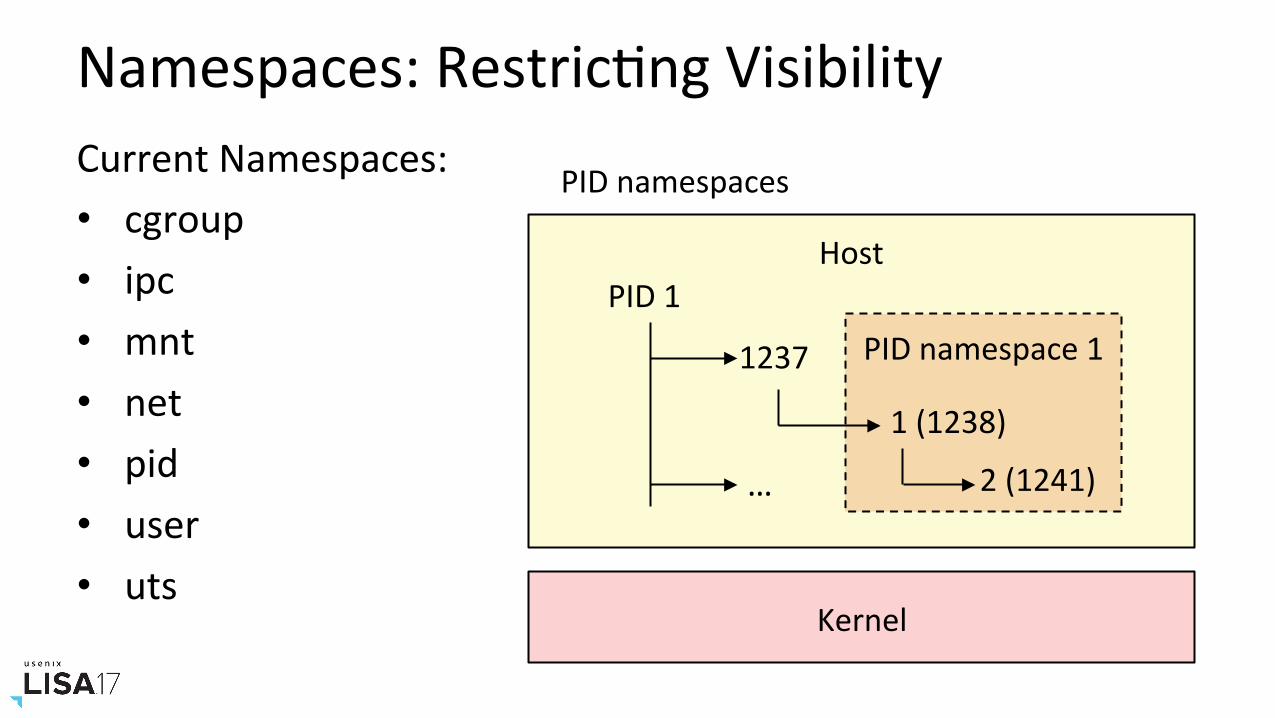
Namespaces:RestricNngVisibilityCurrentNamespaces:• cgroup• ipc• mnt• net• pid• user• uts
Kernel
PIDnamespace1
HostPID1
1237
1(1238)
2(1241)…
PIDnamespaces
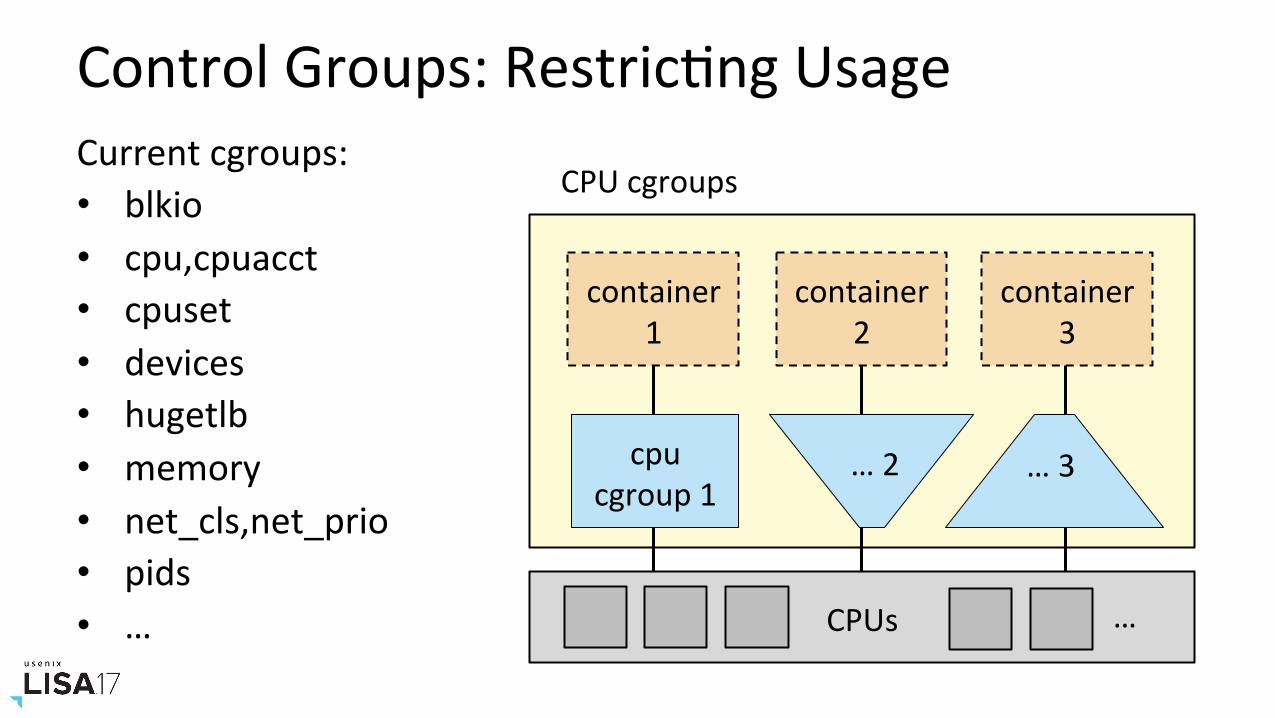
CPUs
container1
container2
container3
cpucgroup1
…2 …3
…
ControlGroups:RestricNngUsageCurrentcgroups:• blkio• cpu,cpuacct• cpuset• devices• hugetlb• memory• net_cls,net_prio• pids• …
CPUcgroups
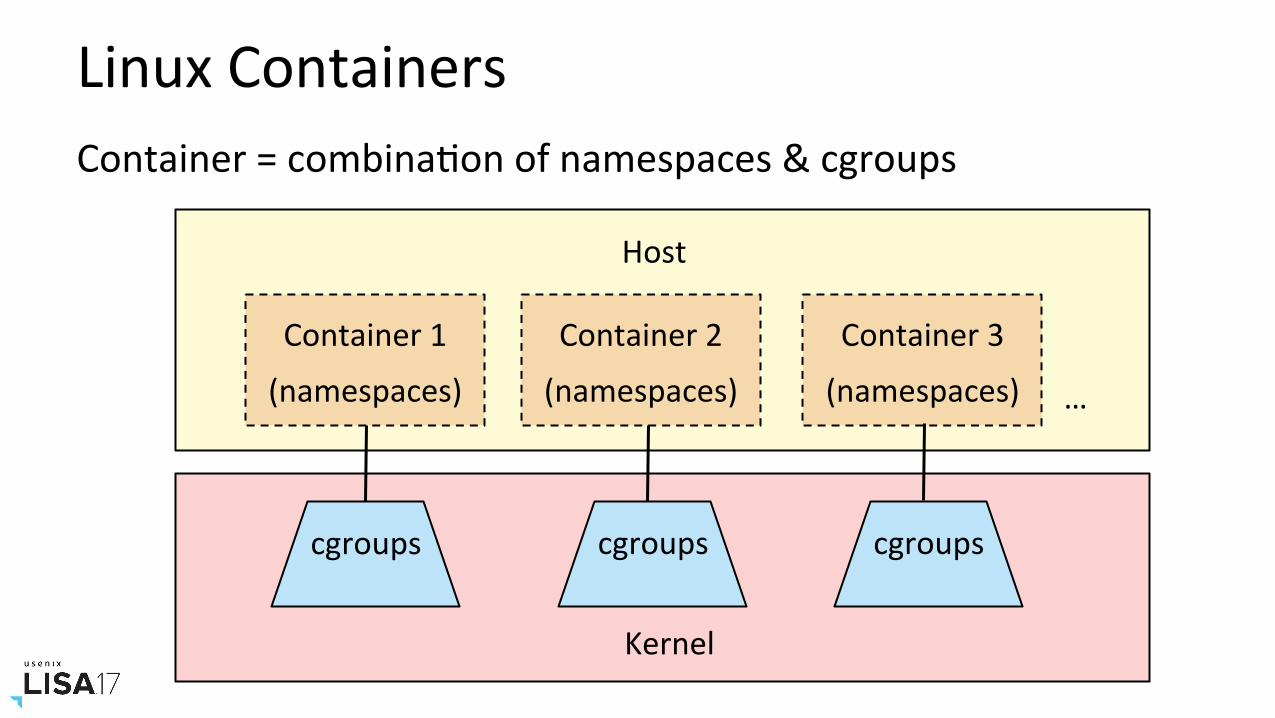
LinuxContainersContainer=combinaNonofnamespaces&cgroups
Container1
(namespaces)
Host
…
cgroups
Kernel
cgroups
cgroups
Container2
(namespaces)
Container3
(namespaces)
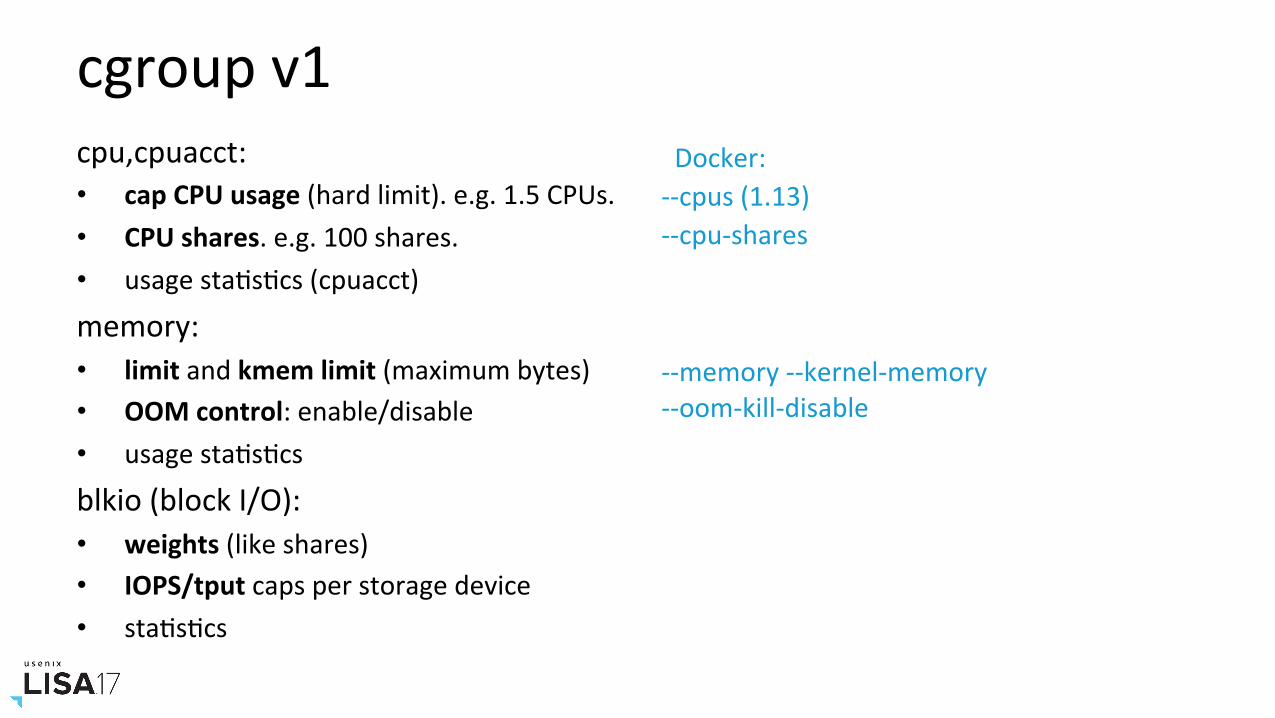
cgroupv1cpu,cpuacct:• capCPUusage(hardlimit).e.g.1.5CPUs.• CPUshares.e.g.100shares.• usagestaNsNcs(cpuacct)
memory:• limitandkmemlimit(maximumbytes)• OOMcontrol:enable/disable• usagestaNsNcs
blkio(blockI/O):• weights(likeshares)• IOPS/tputcapsperstoragedevice• staNsNcs
Docker:--cpus(1.13)--cpu-shares
--memory--kernel-memory--oom-kill-disable
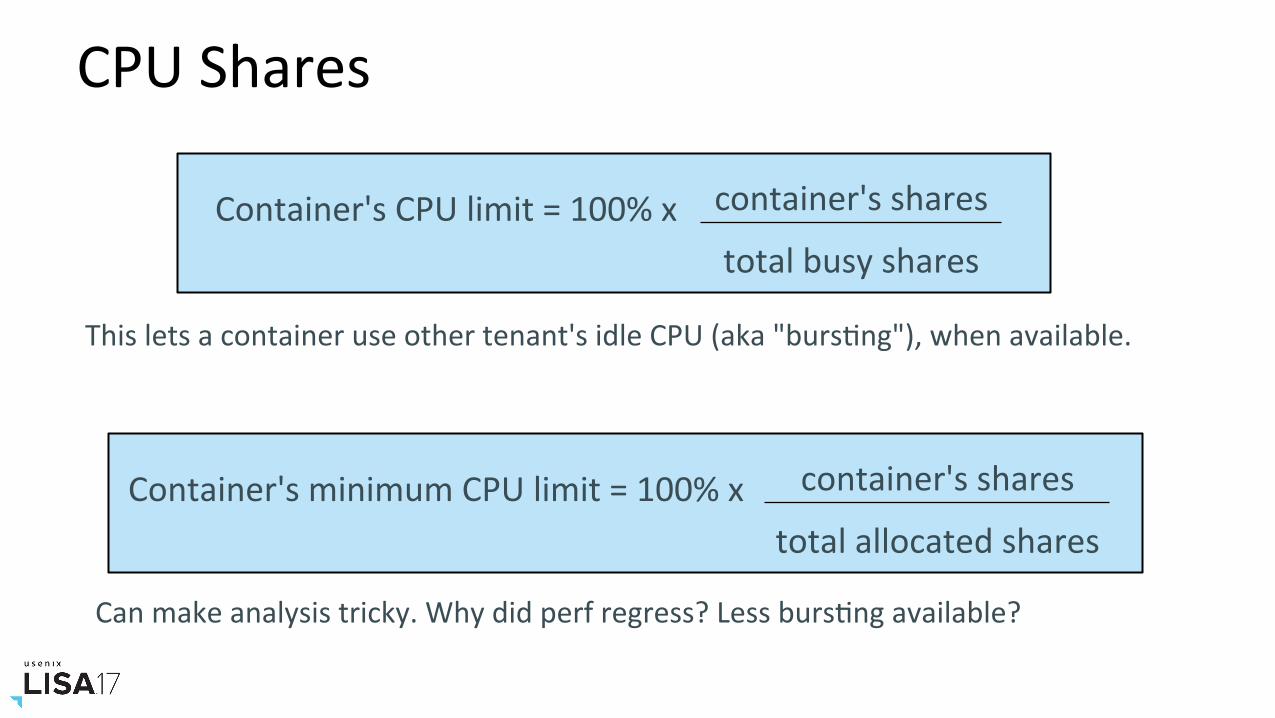
CPUShares
container'sshares
totalbusysharesContainer'sCPUlimit=100%x
Thisletsacontaineruseothertenant'sidleCPU(aka"bursNng"),whenavailable.
container'sshares
totalallocatedsharesContainer'sminimumCPUlimit=100%x
Canmakeanalysistricky.Whydidperfregress?LessbursNngavailable?
cgroupv2• Majorrewritehasbeenhappening:cgroupsv2
– Supportsnestedgroups,bePerorganizaNonandconsistency– Somealreadymerged,somenotyet(e.g.CPU)
• Seedocs/talksbymaintainerTejunHeo(Facebook)• References:
– hPps://www.kernel.org/doc/DocumentaNon/cgroup-v2.txt– hPps://lwn.net/ArNcles/679786/
ContainerOSConfiguraNonFilesystems• Containersmaybesetupwithaufs/overlayontopofanotherFS• See"inpracNce"pagesandtheirperformancesecNonsfrom
hPps://docs.docker.com/engine/userguide/storagedriver/
Networking• WithDocker,canbebridge,host,oroverlaynetworks• Overlaynetworkshavecomewithsignificantperformancecost
AnalysisStrategyPerformanceanalysiswithcontainers:• Onekernel• TwoperspecNves• Namespaces• cgroups
Methodologies:• USEMethod• WorkloadcharacterizaNon• Checklists• Eventtracing
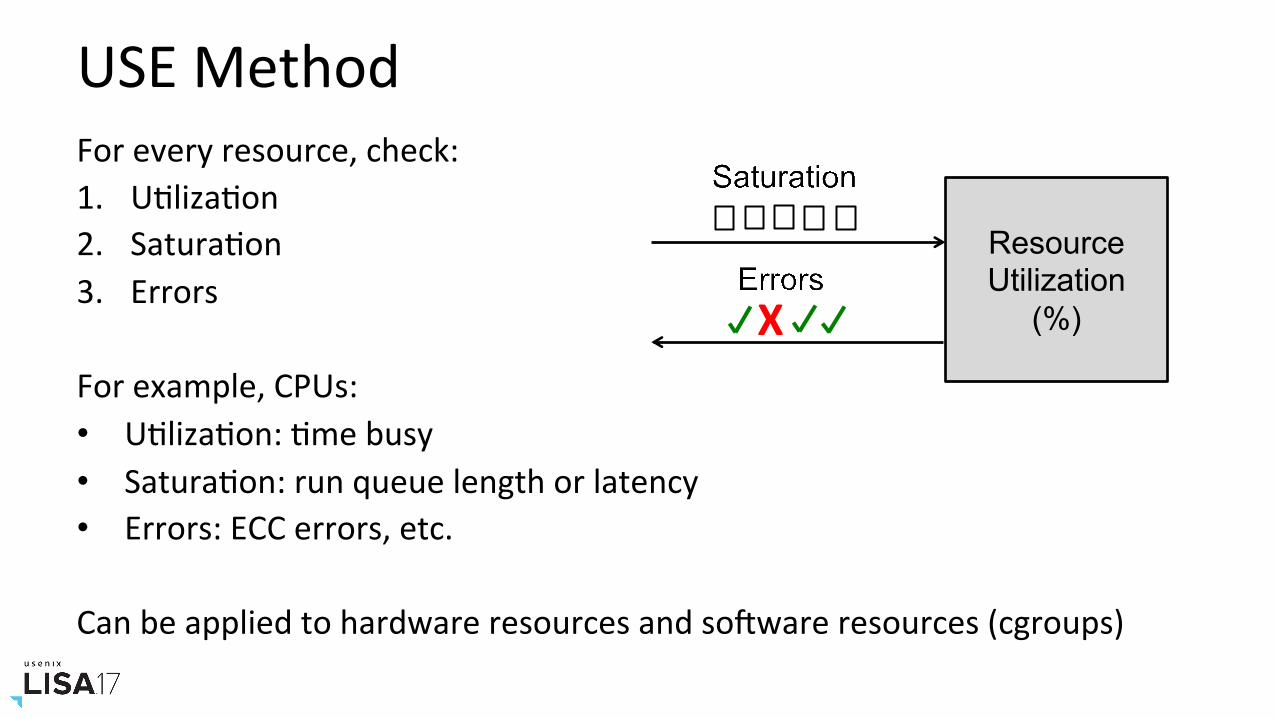
USEMethodForeveryresource,check:1. UNlizaNon2. SaturaNon3. Errors
Forexample,CPUs:• UNlizaNon:Nmebusy• SaturaNon:runqueuelengthorlatency• Errors:ECCerrors,etc.
Canbeappliedtohardwareresourcesandsotwareresources(cgroups)
Resource Utilization
(%) X
3.HOSTTOOLSAndContainerAwareness
HostAnalysisChallenges• PIDsinhostdon'tmatchthoseseenincontainers• Symbolfilesaren'twheretoolsexpectthem• Thekernelcurrentlydoesn'thaveacontainerID
3.1.HostPhysicalResources
Arefresherofbasics...Notcontainerspecific.
Thiswill,however,solvemanyissues!
Containersareotennottheproblem.
IwilldemoCLItools.GUIssourcethesamemetrics.
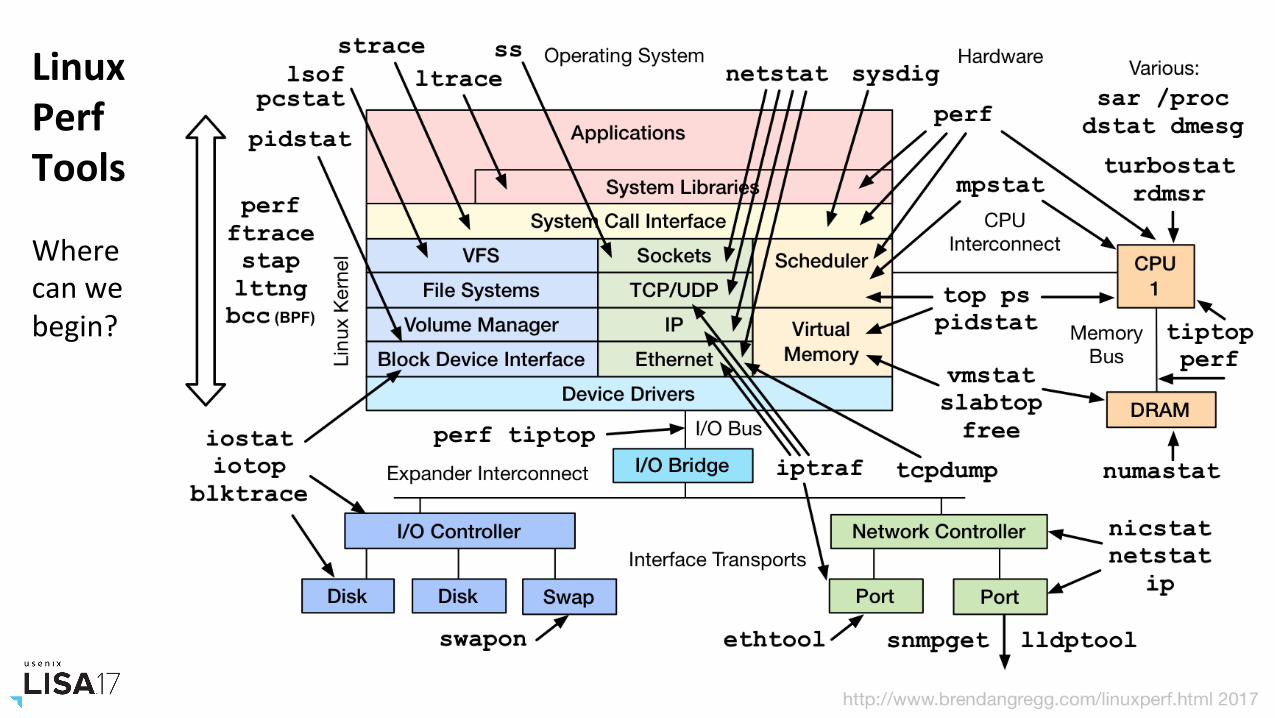
LinuxPerfToolsWherecanwebegin?
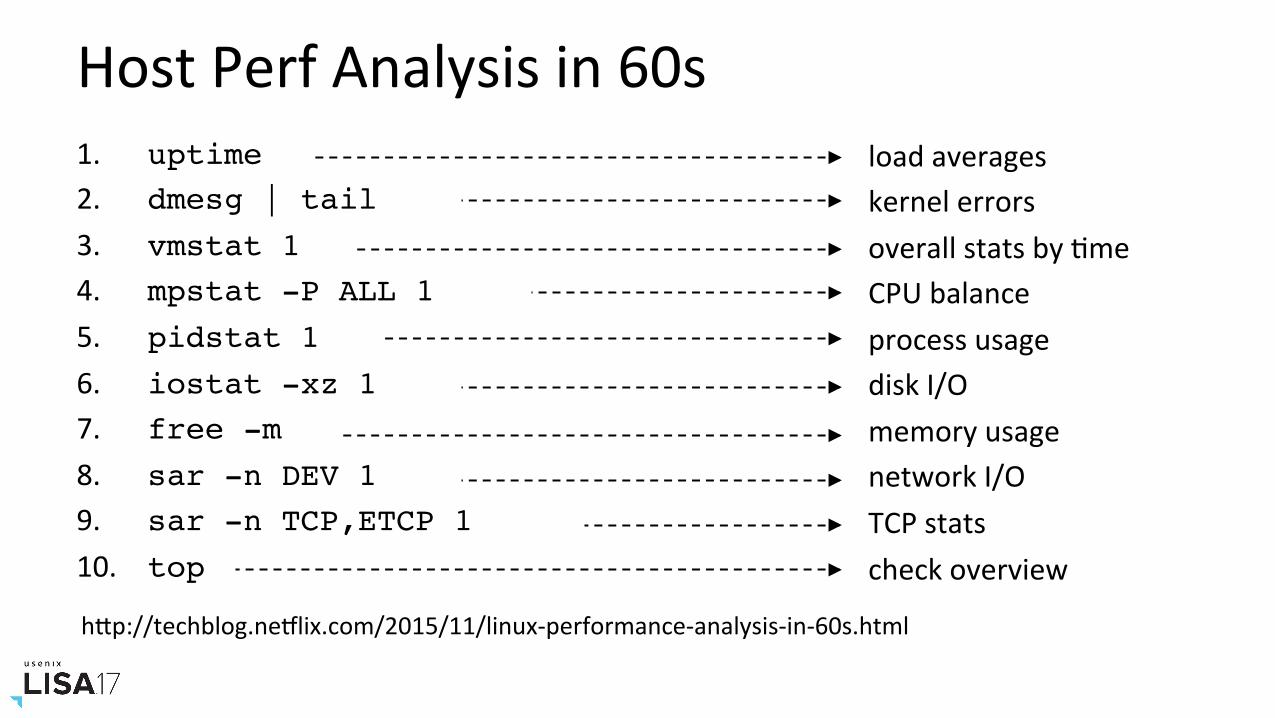
HostPerfAnalysisin60s
hPp://techblog.neIlix.com/2015/11/linux-performance-analysis-in-60s.html
1. uptime2. dmesg | tail3. vmstat 14. mpstat -P ALL 15. pidstat 16. iostat -xz 17. free -m8. sar -n DEV 19. sar -n TCP,ETCP 110. top
loadaverageskernelerrorsoverallstatsbyNmeCPUbalanceprocessusagediskI/OmemoryusagenetworkI/OTCPstatscheckoverview
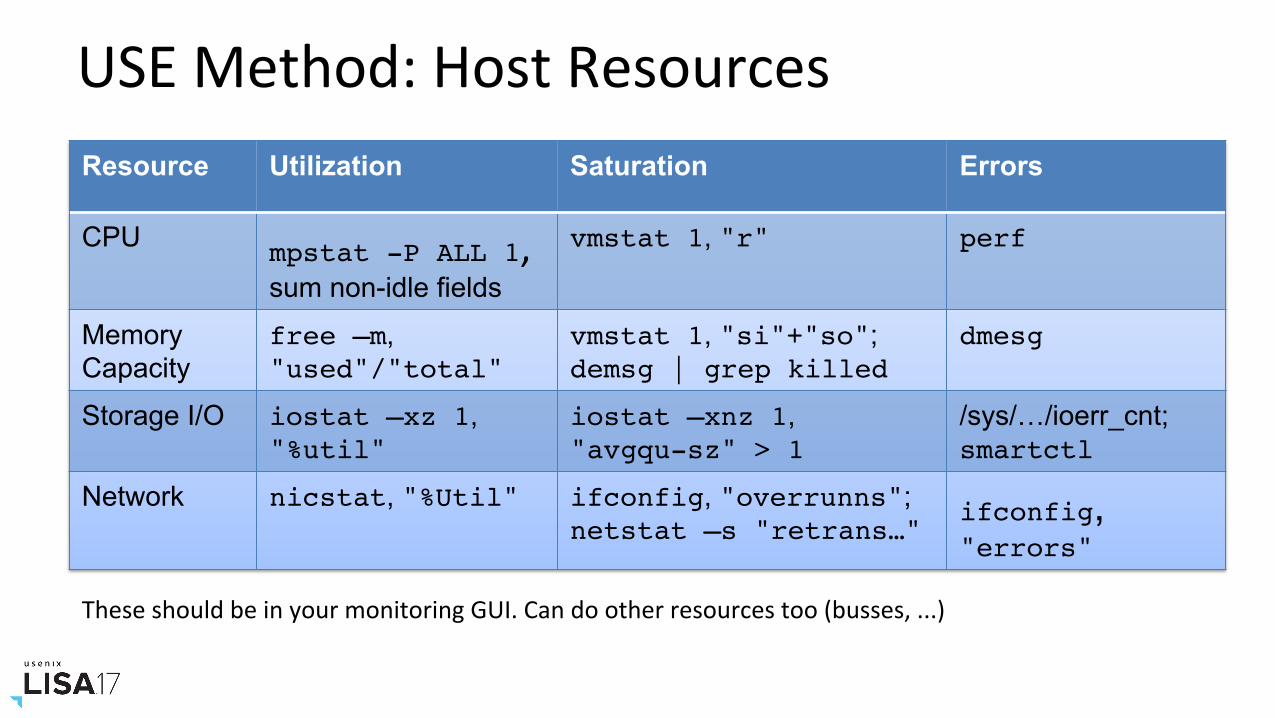
USEMethod:HostResourcesResource Utilization Saturation Errors
CPU mpstat -P ALL 1,sum non-idle fields
vmstat 1, "r" perf
Memory Capacity
free –m, "used"/"total"
vmstat 1, "si"+"so"; demsg | grep killed
dmesg
Storage I/O iostat –xz 1, "%util"
iostat –xnz 1, "avgqu-sz" > 1
/sys/…/ioerr_cnt; smartctl
Network nicstat, "%Util" ifconfig, "overrunns"; netstat –s "retrans…"
ifconfig, "errors"
TheseshouldbeinyourmonitoringGUI.Candootherresourcestoo(busses,...)
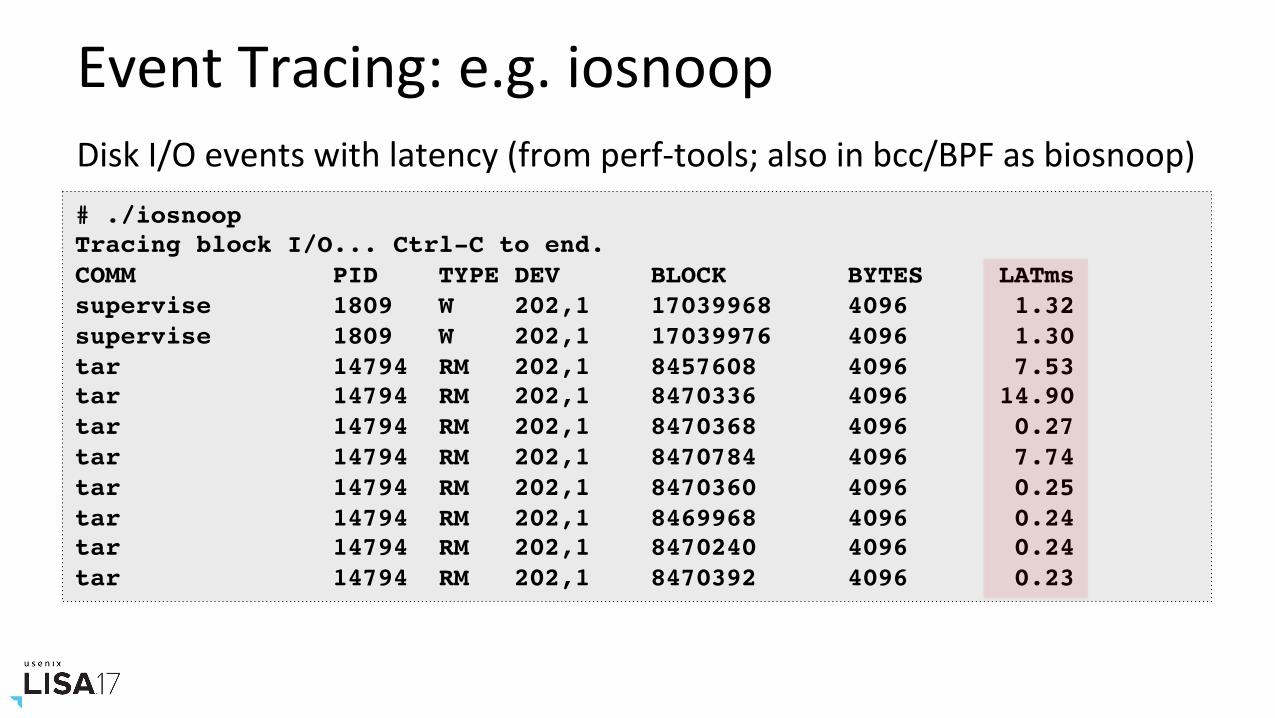
EventTracing:e.g.iosnoopDiskI/Oeventswithlatency(fromperf-tools;alsoinbcc/BPFasbiosnoop)# ./iosnoop Tracing block I/O... Ctrl-C to end.COMM PID TYPE DEV BLOCK BYTES LATmssupervise 1809 W 202,1 17039968 4096 1.32supervise 1809 W 202,1 17039976 4096 1.30tar 14794 RM 202,1 8457608 4096 7.53tar 14794 RM 202,1 8470336 4096 14.90tar 14794 RM 202,1 8470368 4096 0.27tar 14794 RM 202,1 8470784 4096 7.74tar 14794 RM 202,1 8470360 4096 0.25tar 14794 RM 202,1 8469968 4096 0.24tar 14794 RM 202,1 8470240 4096 0.24tar 14794 RM 202,1 8470392 4096 0.23
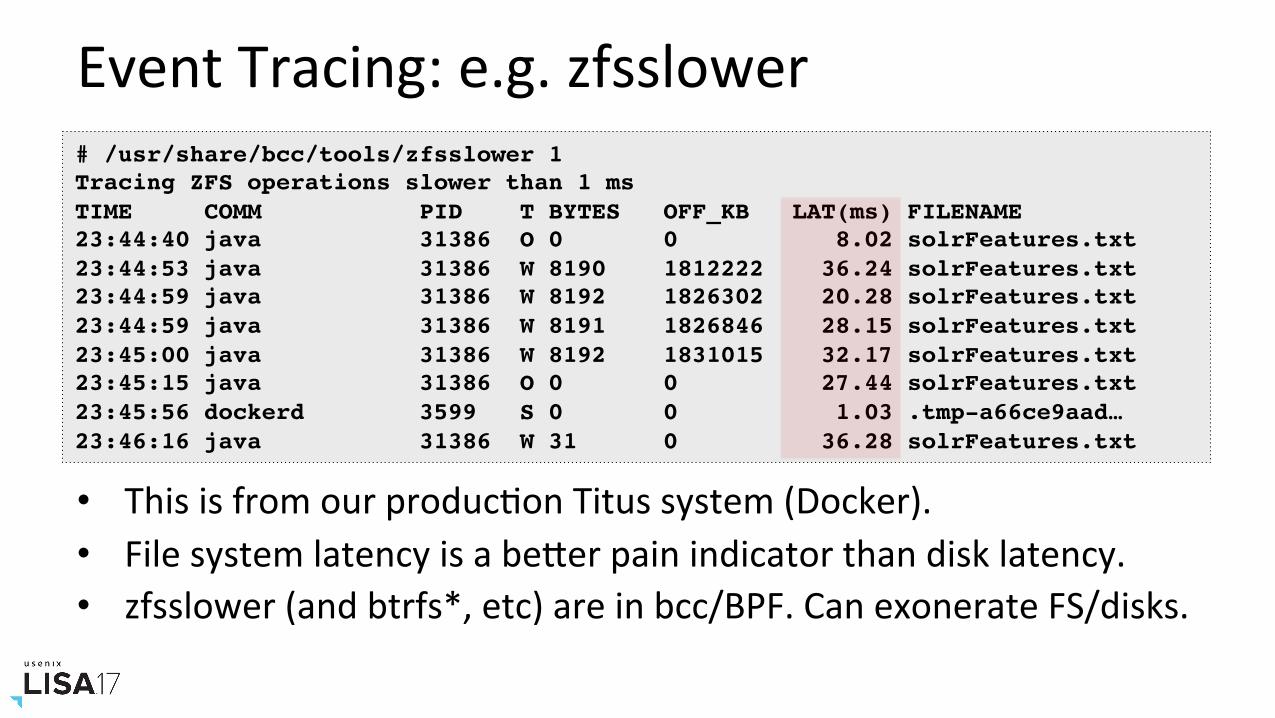
EventTracing:e.g.zfsslower
• ThisisfromourproducNonTitussystem(Docker).• FilesystemlatencyisabePerpainindicatorthandisklatency.• zfsslower(andbtrfs*,etc)areinbcc/BPF.CanexonerateFS/disks.
# /usr/share/bcc/tools/zfsslower 1Tracing ZFS operations slower than 1 msTIME COMM PID T BYTES OFF_KB LAT(ms) FILENAME23:44:40 java 31386 O 0 0 8.02 solrFeatures.txt23:44:53 java 31386 W 8190 1812222 36.24 solrFeatures.txt23:44:59 java 31386 W 8192 1826302 20.28 solrFeatures.txt23:44:59 java 31386 W 8191 1826846 28.15 solrFeatures.txt23:45:00 java 31386 W 8192 1831015 32.17 solrFeatures.txt23:45:15 java 31386 O 0 0 27.44 solrFeatures.txt23:45:56 dockerd 3599 S 0 0 1.03 .tmp-a66ce9aad…23:46:16 java 31386 W 31 0 36.28 solrFeatures.txt
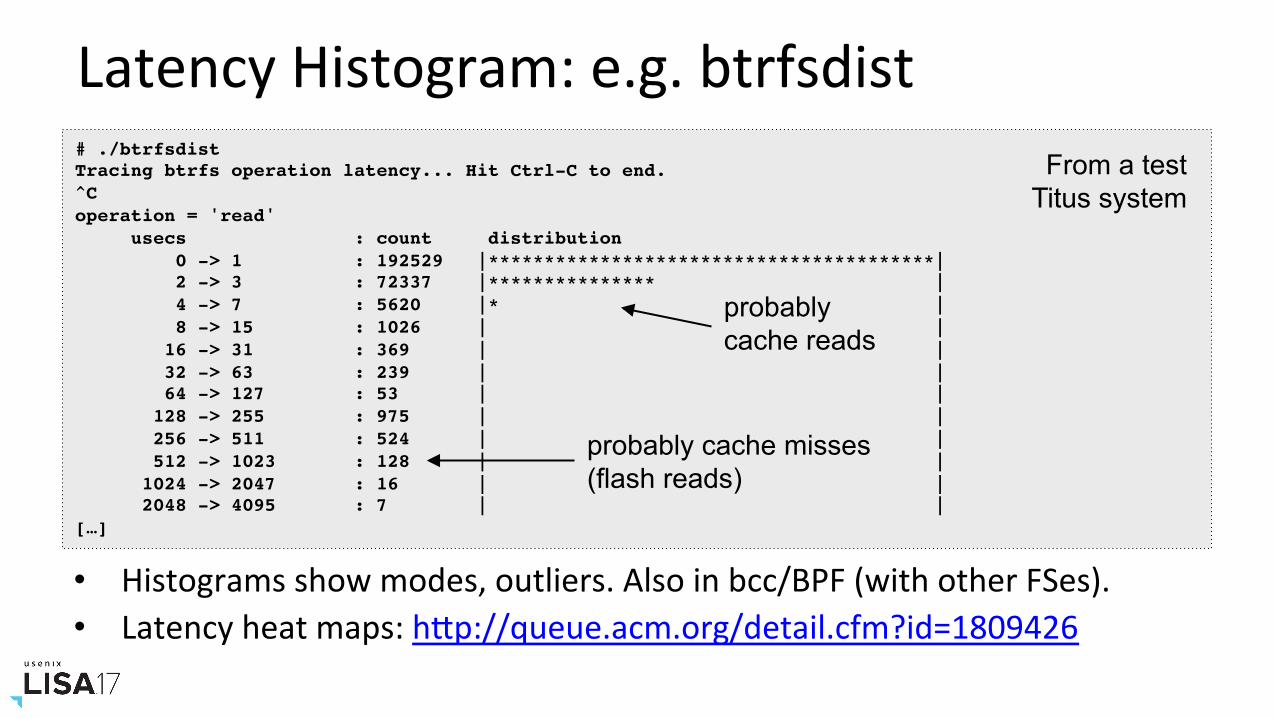
LatencyHistogram:e.g.btrfsdist# ./btrfsdist Tracing btrfs operation latency... Hit Ctrl-C to end.^Coperation = 'read' usecs : count distribution 0 -> 1 : 192529 |****************************************| 2 -> 3 : 72337 |*************** | 4 -> 7 : 5620 |* | 8 -> 15 : 1026 | | 16 -> 31 : 369 | | 32 -> 63 : 239 | | 64 -> 127 : 53 | | 128 -> 255 : 975 | | 256 -> 511 : 524 | | 512 -> 1023 : 128 | | 1024 -> 2047 : 16 | | 2048 -> 4095 : 7 | |[…]
probably cache reads
probably cache misses (flash reads)
• Histogramsshowmodes,outliers.Alsoinbcc/BPF(withotherFSes).• Latencyheatmaps:hPp://queue.acm.org/detail.cfm?id=1809426
From a test Titus system
3.2.HostContainers&cgroups
InspecNngcontainersfromthehost
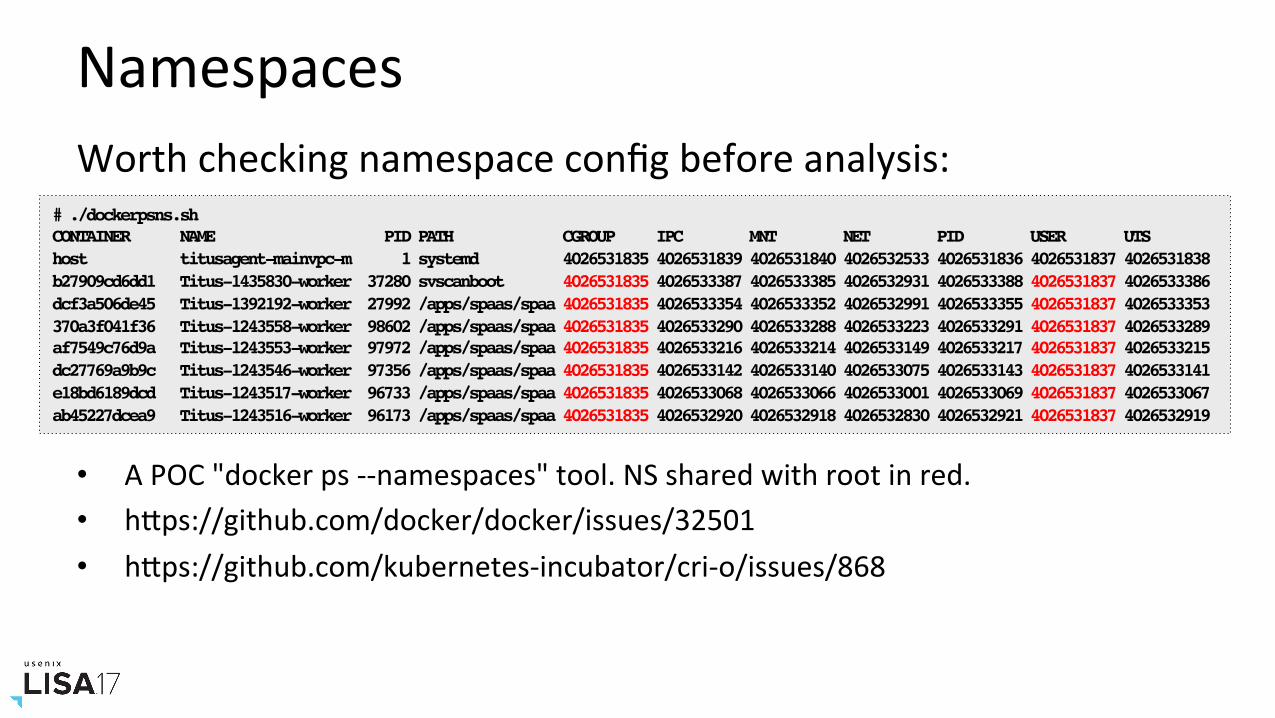
NamespacesWorthcheckingnamespaceconfigbeforeanalysis:
• APOC"dockerps--namespaces"tool.NSsharedwithrootinred.• hPps://github.com/docker/docker/issues/32501• hPps://github.com/kubernetes-incubator/cri-o/issues/868
# ./dockerpsns.sh CONTAINER NAME PID PATH CGROUP IPC MNT NET PID USER UTS host titusagent-mainvpc-m 1 systemd 4026531835 4026531839 4026531840 4026532533 4026531836 4026531837 4026531838b27909cd6dd1 Titus-1435830-worker 37280 svscanboot 4026531835 4026533387 4026533385 4026532931 4026533388 4026531837 4026533386dcf3a506de45 Titus-1392192-worker 27992 /apps/spaas/spaa 4026531835 4026533354 4026533352 4026532991 4026533355 4026531837 4026533353370a3f041f36 Titus-1243558-worker 98602 /apps/spaas/spaa 4026531835 4026533290 4026533288 4026533223 4026533291 4026531837 4026533289af7549c76d9a Titus-1243553-worker 97972 /apps/spaas/spaa 4026531835 4026533216 4026533214 4026533149 4026533217 4026531837 4026533215dc27769a9b9c Titus-1243546-worker 97356 /apps/spaas/spaa 4026531835 4026533142 4026533140 4026533075 4026533143 4026531837 4026533141e18bd6189dcd Titus-1243517-worker 96733 /apps/spaas/spaa 4026531835 4026533068 4026533066 4026533001 4026533069 4026531837 4026533067ab45227dcea9 Titus-1243516-worker 96173 /apps/spaas/spaa 4026531835 4026532920 4026532918 4026532830 4026532921 4026531837 4026532919
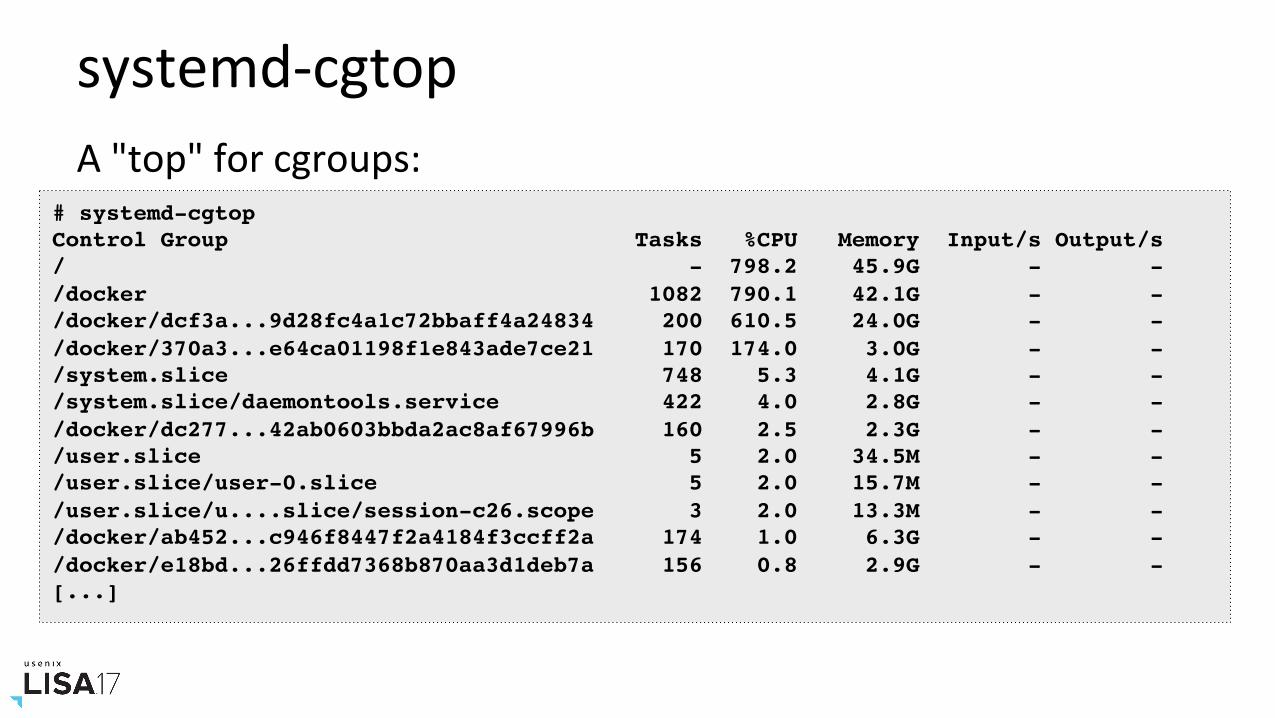
systemd-cgtopA"top"forcgroups:
# systemd-cgtopControl Group Tasks %CPU Memory Input/s Output/s/ - 798.2 45.9G - -/docker 1082 790.1 42.1G - -/docker/dcf3a...9d28fc4a1c72bbaff4a24834 200 610.5 24.0G - -/docker/370a3...e64ca01198f1e843ade7ce21 170 174.0 3.0G - -/system.slice 748 5.3 4.1G - -/system.slice/daemontools.service 422 4.0 2.8G - -/docker/dc277...42ab0603bbda2ac8af67996b 160 2.5 2.3G - -/user.slice 5 2.0 34.5M - -/user.slice/user-0.slice 5 2.0 15.7M - -/user.slice/u....slice/session-c26.scope 3 2.0 13.3M - -/docker/ab452...c946f8447f2a4184f3ccff2a 174 1.0 6.3G - -/docker/e18bd...26ffdd7368b870aa3d1deb7a 156 0.8 2.9G - -[...]
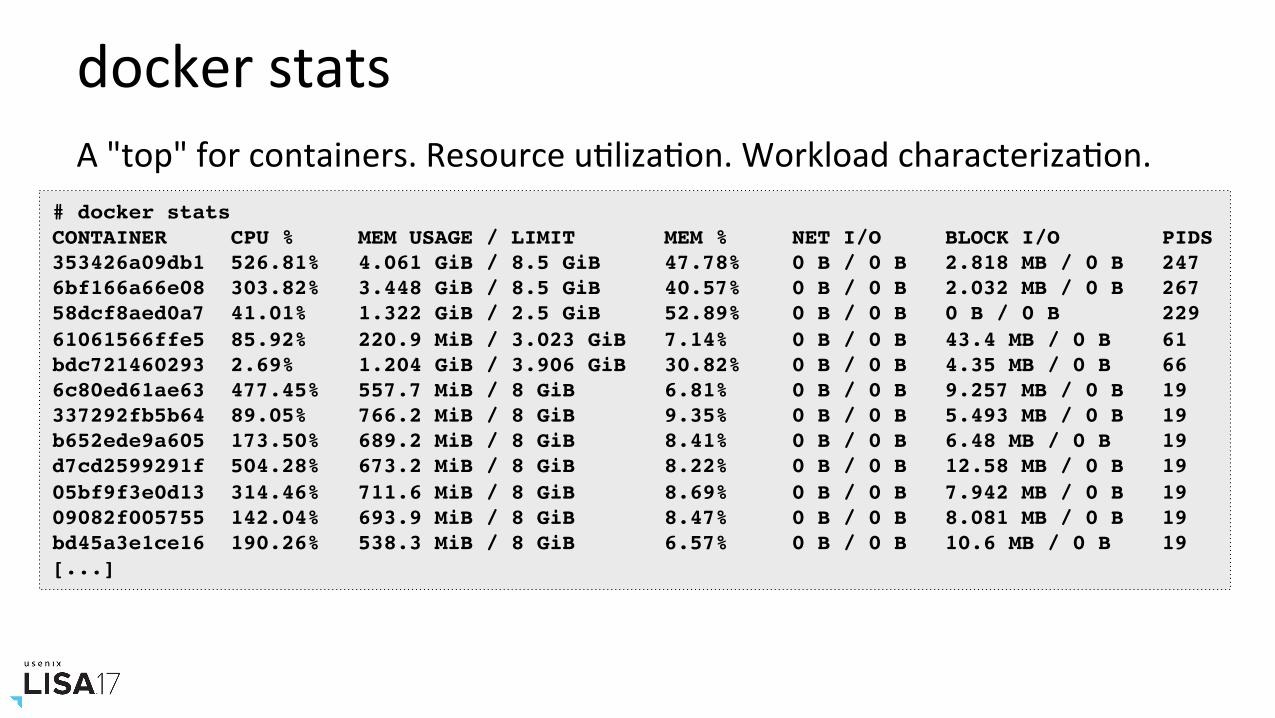
dockerstats
# docker statsCONTAINER CPU % MEM USAGE / LIMIT MEM % NET I/O BLOCK I/O PIDS353426a09db1 526.81% 4.061 GiB / 8.5 GiB 47.78% 0 B / 0 B 2.818 MB / 0 B 2476bf166a66e08 303.82% 3.448 GiB / 8.5 GiB 40.57% 0 B / 0 B 2.032 MB / 0 B 26758dcf8aed0a7 41.01% 1.322 GiB / 2.5 GiB 52.89% 0 B / 0 B 0 B / 0 B 22961061566ffe5 85.92% 220.9 MiB / 3.023 GiB 7.14% 0 B / 0 B 43.4 MB / 0 B 61bdc721460293 2.69% 1.204 GiB / 3.906 GiB 30.82% 0 B / 0 B 4.35 MB / 0 B 666c80ed61ae63 477.45% 557.7 MiB / 8 GiB 6.81% 0 B / 0 B 9.257 MB / 0 B 19337292fb5b64 89.05% 766.2 MiB / 8 GiB 9.35% 0 B / 0 B 5.493 MB / 0 B 19b652ede9a605 173.50% 689.2 MiB / 8 GiB 8.41% 0 B / 0 B 6.48 MB / 0 B 19d7cd2599291f 504.28% 673.2 MiB / 8 GiB 8.22% 0 B / 0 B 12.58 MB / 0 B 1905bf9f3e0d13 314.46% 711.6 MiB / 8 GiB 8.69% 0 B / 0 B 7.942 MB / 0 B 1909082f005755 142.04% 693.9 MiB / 8 GiB 8.47% 0 B / 0 B 8.081 MB / 0 B 19bd45a3e1ce16 190.26% 538.3 MiB / 8 GiB 6.57% 0 B / 0 B 10.6 MB / 0 B 19[...]
A"top"forcontainers.ResourceuNlizaNon.WorkloadcharacterizaNon.
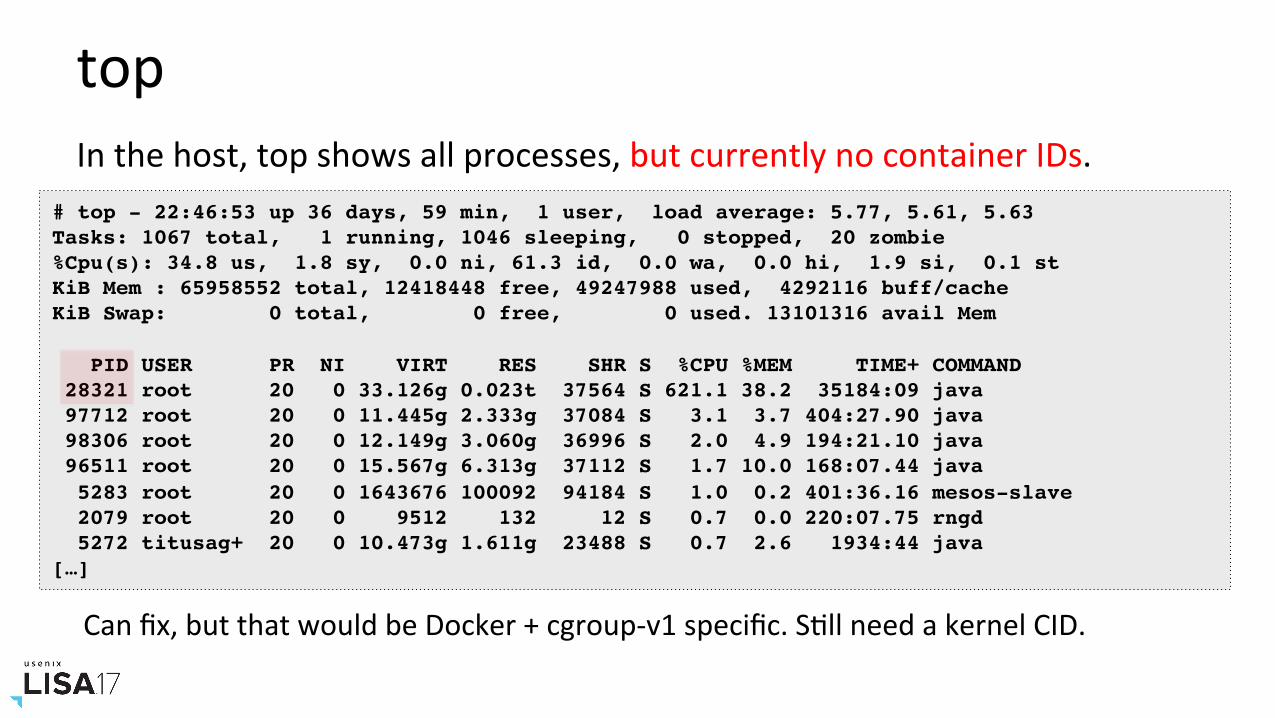
top
# top - 22:46:53 up 36 days, 59 min, 1 user, load average: 5.77, 5.61, 5.63Tasks: 1067 total, 1 running, 1046 sleeping, 0 stopped, 20 zombie%Cpu(s): 34.8 us, 1.8 sy, 0.0 ni, 61.3 id, 0.0 wa, 0.0 hi, 1.9 si, 0.1 stKiB Mem : 65958552 total, 12418448 free, 49247988 used, 4292116 buff/cacheKiB Swap: 0 total, 0 free, 0 used. 13101316 avail Mem
PID USER PR NI VIRT RES SHR S %CPU %MEM TIME+ COMMAND 28321 root 20 0 33.126g 0.023t 37564 S 621.1 38.2 35184:09 java 97712 root 20 0 11.445g 2.333g 37084 S 3.1 3.7 404:27.90 java 98306 root 20 0 12.149g 3.060g 36996 S 2.0 4.9 194:21.10 java 96511 root 20 0 15.567g 6.313g 37112 S 1.7 10.0 168:07.44 java 5283 root 20 0 1643676 100092 94184 S 1.0 0.2 401:36.16 mesos-slave 2079 root 20 0 9512 132 12 S 0.7 0.0 220:07.75 rngd 5272 titusag+ 20 0 10.473g 1.611g 23488 S 0.7 2.6 1934:44 java […]
Inthehost,topshowsallprocesses,butcurrentlynocontainerIDs.
Canfix,butthatwouldbeDocker+cgroup-v1specific.SNllneedakernelCID.
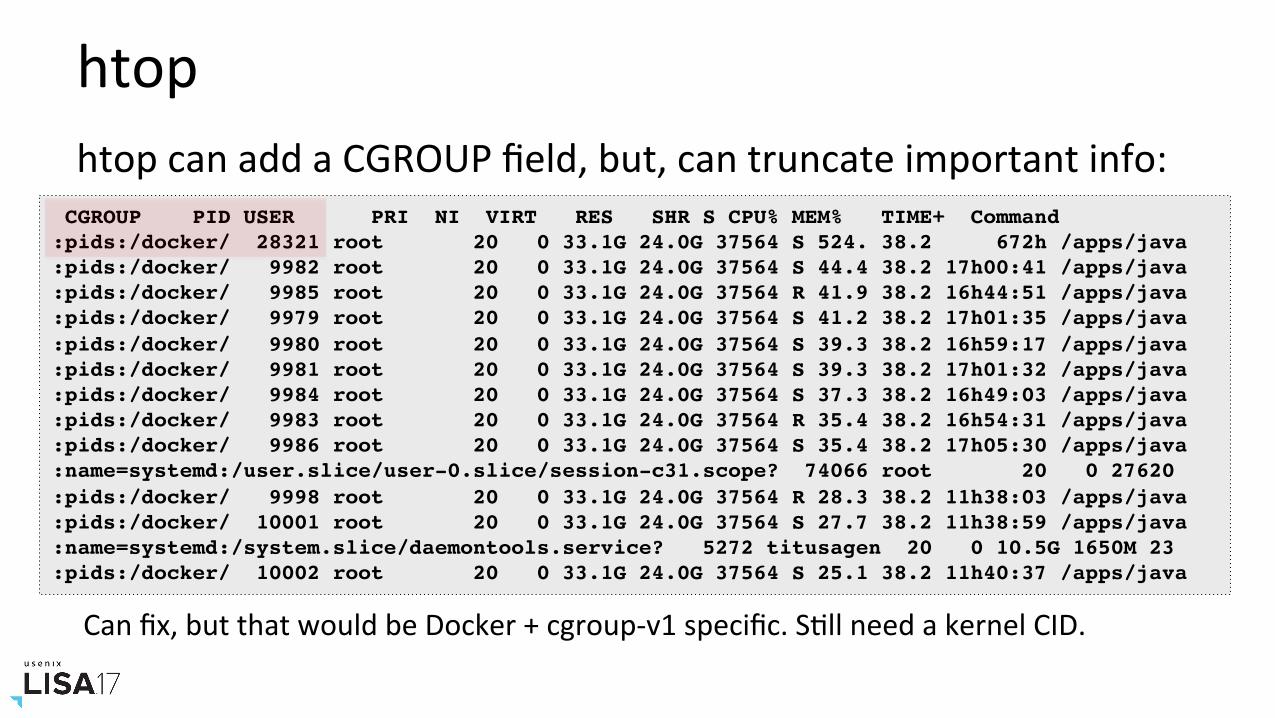
htophtopcanaddaCGROUPfield,but,cantruncateimportantinfo:
CGROUP PID USER PRI NI VIRT RES SHR S CPU% MEM% TIME+ Command:pids:/docker/ 28321 root 20 0 33.1G 24.0G 37564 S 524. 38.2 672h /apps/java:pids:/docker/ 9982 root 20 0 33.1G 24.0G 37564 S 44.4 38.2 17h00:41 /apps/java:pids:/docker/ 9985 root 20 0 33.1G 24.0G 37564 R 41.9 38.2 16h44:51 /apps/java:pids:/docker/ 9979 root 20 0 33.1G 24.0G 37564 S 41.2 38.2 17h01:35 /apps/java:pids:/docker/ 9980 root 20 0 33.1G 24.0G 37564 S 39.3 38.2 16h59:17 /apps/java:pids:/docker/ 9981 root 20 0 33.1G 24.0G 37564 S 39.3 38.2 17h01:32 /apps/java:pids:/docker/ 9984 root 20 0 33.1G 24.0G 37564 S 37.3 38.2 16h49:03 /apps/java:pids:/docker/ 9983 root 20 0 33.1G 24.0G 37564 R 35.4 38.2 16h54:31 /apps/java:pids:/docker/ 9986 root 20 0 33.1G 24.0G 37564 S 35.4 38.2 17h05:30 /apps/java:name=systemd:/user.slice/user-0.slice/session-c31.scope? 74066 root 20 0 27620:pids:/docker/ 9998 root 20 0 33.1G 24.0G 37564 R 28.3 38.2 11h38:03 /apps/java:pids:/docker/ 10001 root 20 0 33.1G 24.0G 37564 S 27.7 38.2 11h38:59 /apps/java:name=systemd:/system.slice/daemontools.service? 5272 titusagen 20 0 10.5G 1650M 23:pids:/docker/ 10002 root 20 0 33.1G 24.0G 37564 S 25.1 38.2 11h40:37 /apps/java
Canfix,butthatwouldbeDocker+cgroup-v1specific.SNllneedakernelCID.
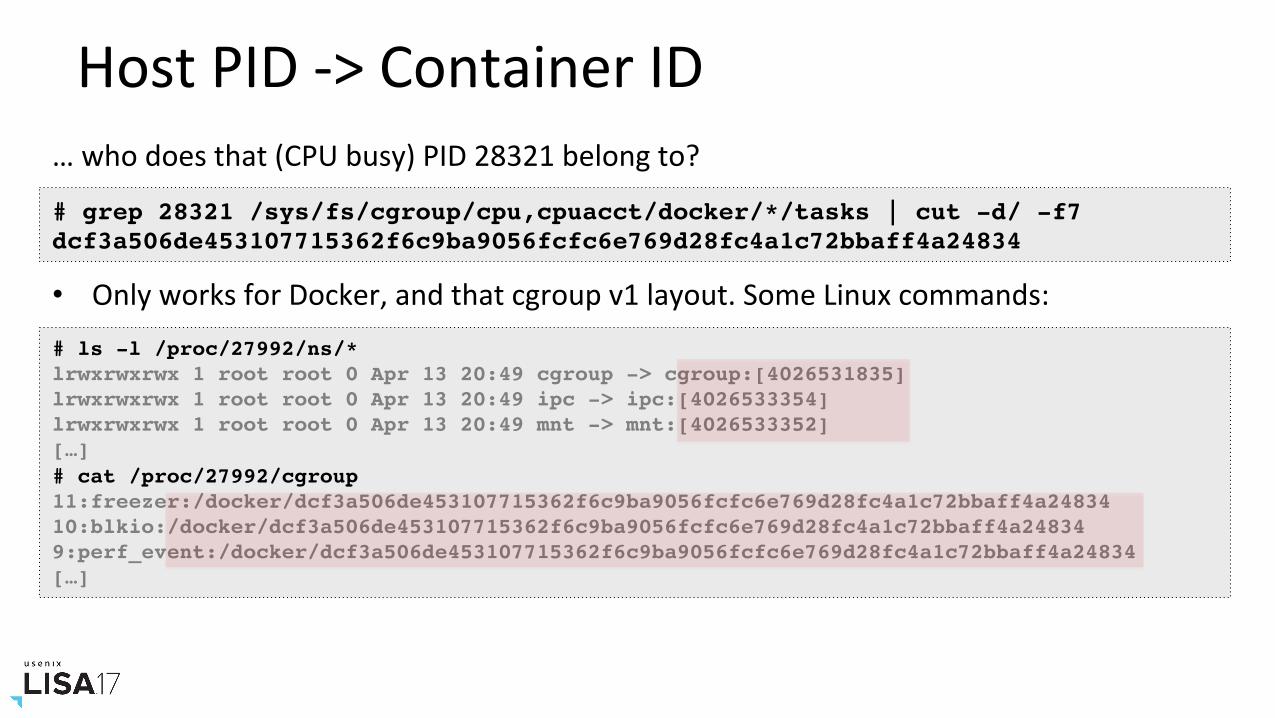
HostPID->ContainerID
# grep 28321 /sys/fs/cgroup/cpu,cpuacct/docker/*/tasks | cut -d/ -f7dcf3a506de453107715362f6c9ba9056fcfc6e769d28fc4a1c72bbaff4a24834
…whodoesthat(CPUbusy)PID28321belongto?
• OnlyworksforDocker,andthatcgroupv1layout.SomeLinuxcommands:# ls -l /proc/27992/ns/*lrwxrwxrwx 1 root root 0 Apr 13 20:49 cgroup -> cgroup:[4026531835]lrwxrwxrwx 1 root root 0 Apr 13 20:49 ipc -> ipc:[4026533354]lrwxrwxrwx 1 root root 0 Apr 13 20:49 mnt -> mnt:[4026533352][…]# cat /proc/27992/cgroup 11:freezer:/docker/dcf3a506de453107715362f6c9ba9056fcfc6e769d28fc4a1c72bbaff4a2483410:blkio:/docker/dcf3a506de453107715362f6c9ba9056fcfc6e769d28fc4a1c72bbaff4a248349:perf_event:/docker/dcf3a506de453107715362f6c9ba9056fcfc6e769d28fc4a1c72bbaff4a24834[…]
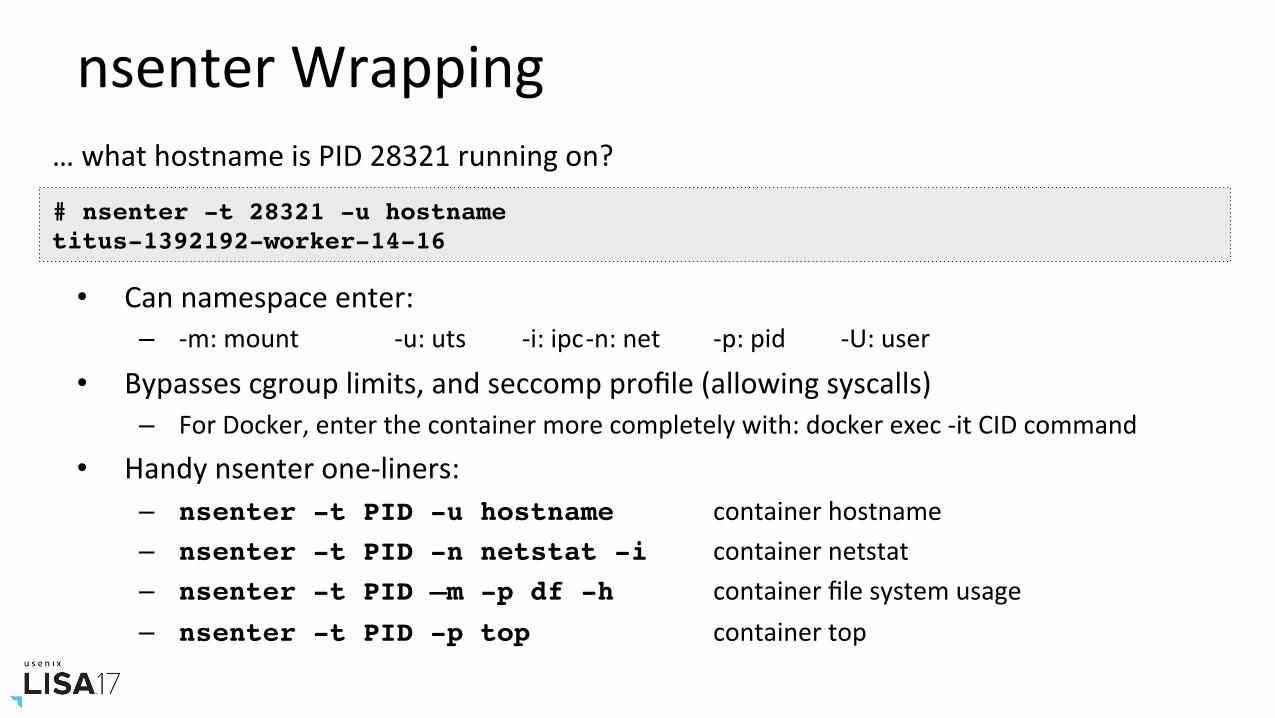
nsenterWrapping
• Cannamespaceenter:– -m:mount -u:uts -i:ipc-n:net -p:pid -U:user
• Bypassescgrouplimits,andseccompprofile(allowingsyscalls)– ForDocker,enterthecontainermorecompletelywith:dockerexec-itCIDcommand
• Handynsenterone-liners:– nsenter -t PID -u hostname containerhostname– nsenter -t PID -n netstat -i containernetstat– nsenter -t PID –m -p df -h containerfilesystemusage– nsenter -t PID -p top containertop
# nsenter -t 28321 -u hostnametitus-1392192-worker-14-16
…whathostnameisPID28321runningon?
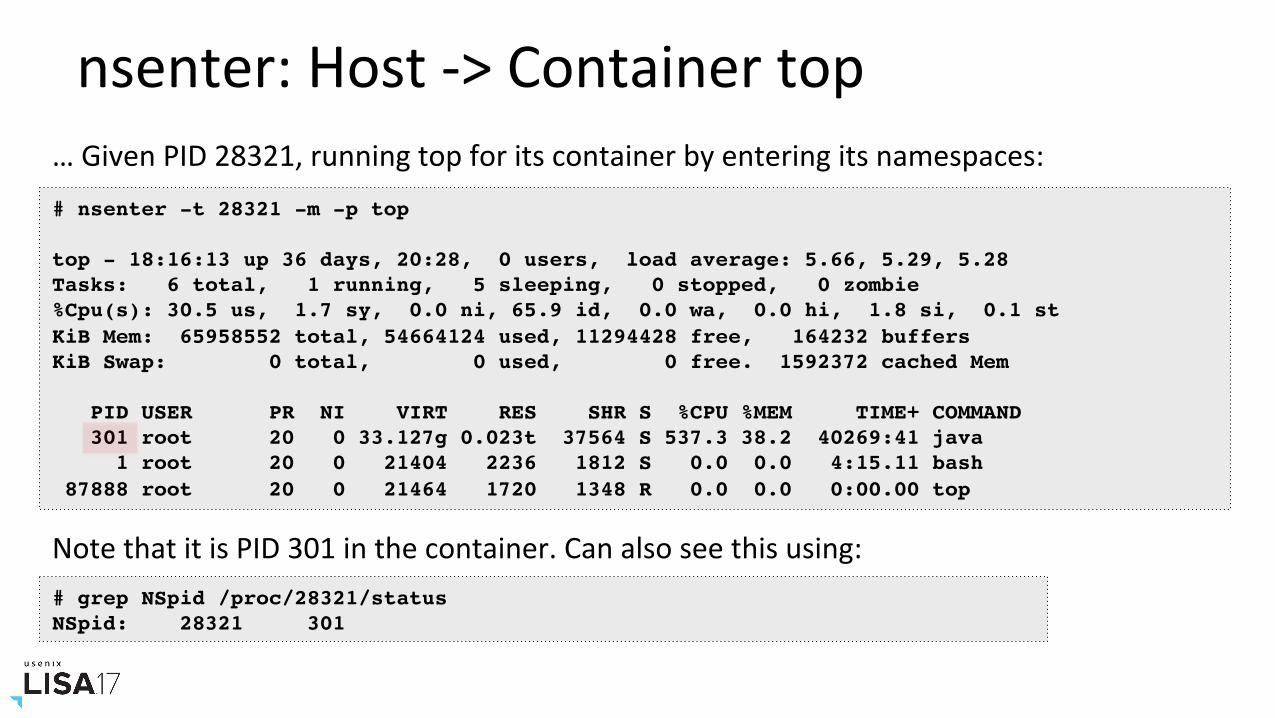
nsenter:Host->Containertop
# nsenter -t 28321 -m -p top
top - 18:16:13 up 36 days, 20:28, 0 users, load average: 5.66, 5.29, 5.28Tasks: 6 total, 1 running, 5 sleeping, 0 stopped, 0 zombie%Cpu(s): 30.5 us, 1.7 sy, 0.0 ni, 65.9 id, 0.0 wa, 0.0 hi, 1.8 si, 0.1 stKiB Mem: 65958552 total, 54664124 used, 11294428 free, 164232 buffersKiB Swap: 0 total, 0 used, 0 free. 1592372 cached Mem
PID USER PR NI VIRT RES SHR S %CPU %MEM TIME+ COMMAND 301 root 20 0 33.127g 0.023t 37564 S 537.3 38.2 40269:41 java 1 root 20 0 21404 2236 1812 S 0.0 0.0 4:15.11 bash 87888 root 20 0 21464 1720 1348 R 0.0 0.0 0:00.00 top
…GivenPID28321,runningtopforitscontainerbyenteringitsnamespaces:
NotethatitisPID301inthecontainer.Canalsoseethisusing:# grep NSpid /proc/28321/status NSpid: 28321 301
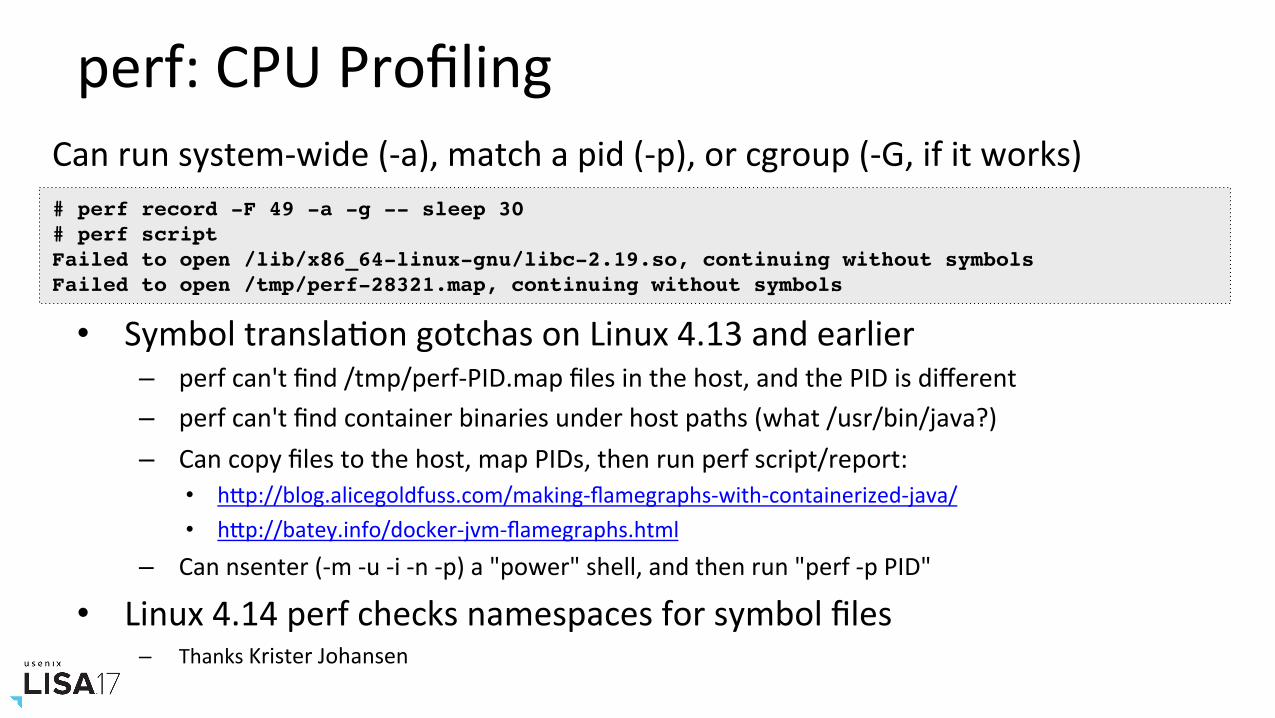
perf:CPUProfiling
• SymboltranslaNongotchasonLinux4.13andearlier– perfcan'tfind/tmp/perf-PID.mapfilesinthehost,andthePIDisdifferent– perfcan'tfindcontainerbinariesunderhostpaths(what/usr/bin/java?)– Cancopyfilestothehost,mapPIDs,thenrunperfscript/report:
• hPp://blog.alicegoldfuss.com/making-flamegraphs-with-containerized-java/• hPp://batey.info/docker-jvm-flamegraphs.html
– Cannsenter(-m-u-i-n-p)a"power"shell,andthenrun"perf-pPID"
• Linux4.14perfchecksnamespacesforsymbolfiles– ThanksKristerJohansen
# perf record -F 49 -a -g -- sleep 30# perf scriptFailed to open /lib/x86_64-linux-gnu/libc-2.19.so, continuing without symbolsFailed to open /tmp/perf-28321.map, continuing without symbols
Canrunsystem-wide(-a),matchapid(-p),orcgroup(-G,ifitworks)
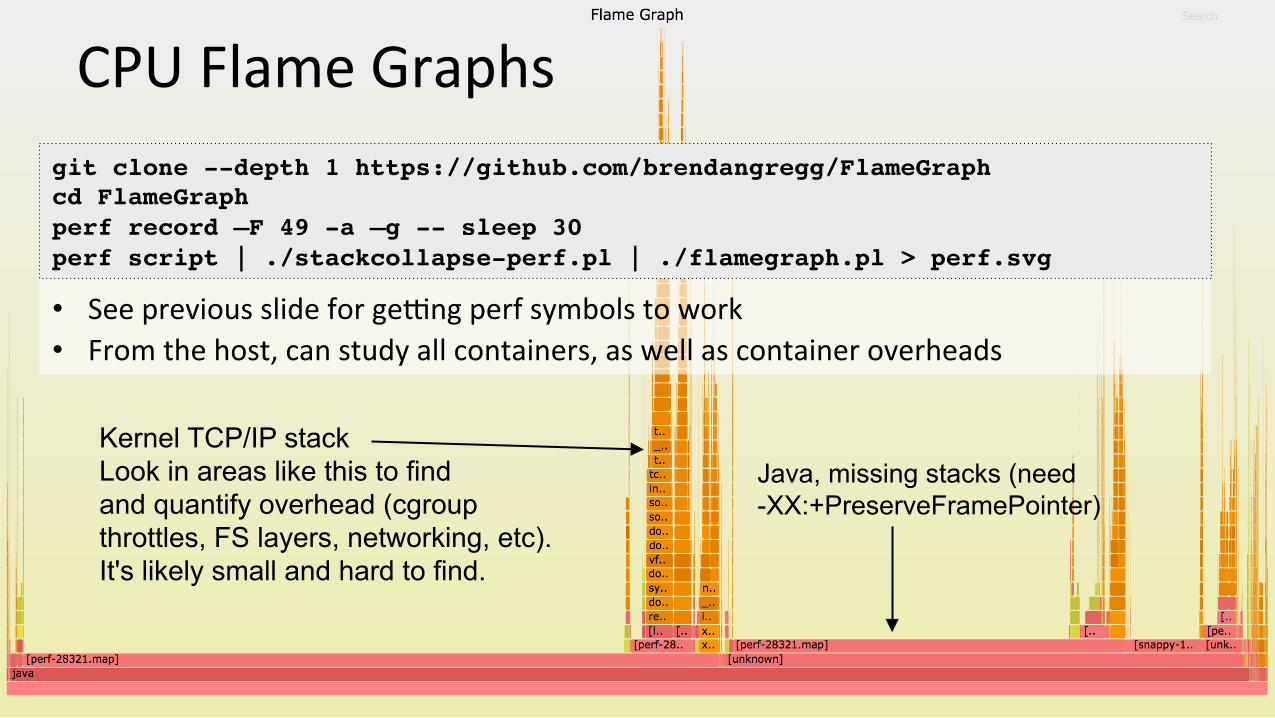
CPUFlameGraphs
• Seepreviousslideforge{ngperfsymbolstowork• Fromthehost,canstudyallcontainers,aswellascontaineroverheads
git clone --depth 1 https://github.com/brendangregg/FlameGraphcd FlameGraphperf record –F 49 -a –g -- sleep 30perf script | ./stackcollapse-perf.pl | ./flamegraph.pl > perf.svg
Java, missing stacks (need -XX:+PreserveFramePointer)
Kernel TCP/IP stack Look in areas like this to find and quantify overhead (cgroup throttles, FS layers, networking, etc). It's likely small and hard to find.
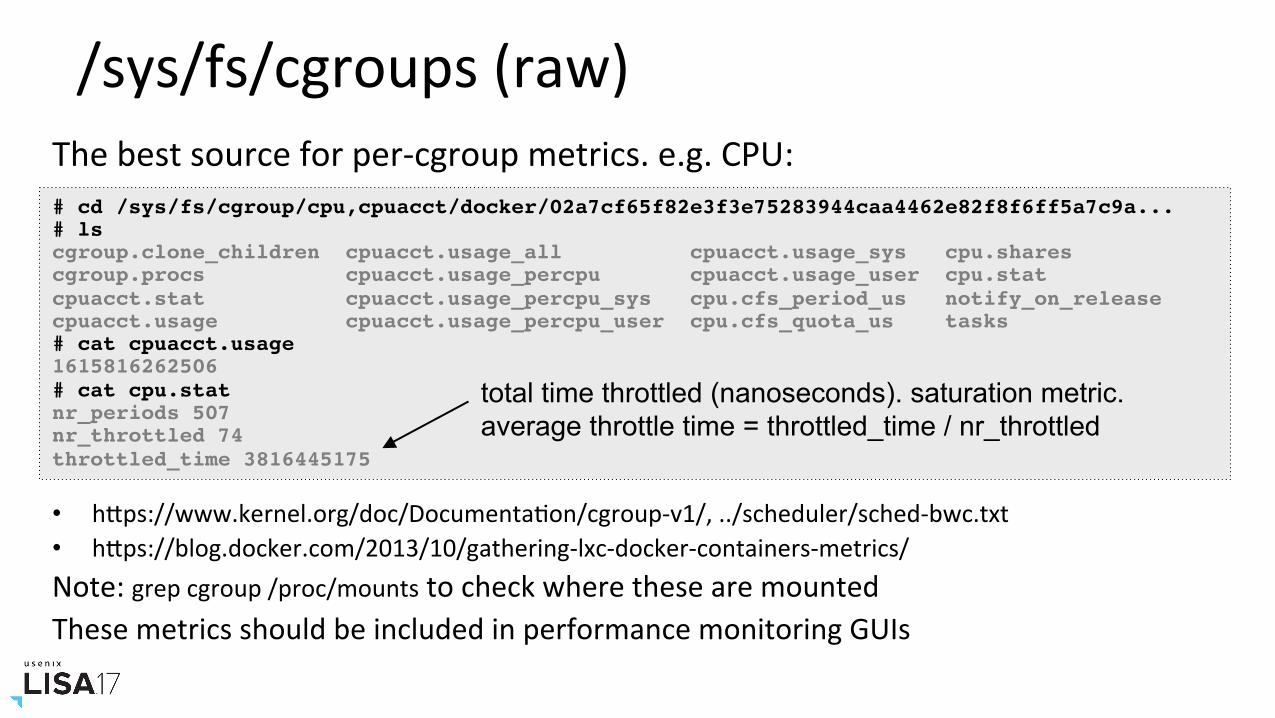
/sys/fs/cgroups(raw)
# cd /sys/fs/cgroup/cpu,cpuacct/docker/02a7cf65f82e3f3e75283944caa4462e82f8f6ff5a7c9a...# lscgroup.clone_children cpuacct.usage_all cpuacct.usage_sys cpu.sharescgroup.procs cpuacct.usage_percpu cpuacct.usage_user cpu.statcpuacct.stat cpuacct.usage_percpu_sys cpu.cfs_period_us notify_on_releasecpuacct.usage cpuacct.usage_percpu_user cpu.cfs_quota_us tasks# cat cpuacct.usage1615816262506# cat cpu.statnr_periods 507nr_throttled 74throttled_time 3816445175
Thebestsourceforper-cgroupmetrics.e.g.CPU:
• hPps://www.kernel.org/doc/DocumentaNon/cgroup-v1/,../scheduler/sched-bwc.txt• hPps://blog.docker.com/2013/10/gathering-lxc-docker-containers-metrics/Note:grepcgroup/proc/mountstocheckwherethesearemountedThesemetricsshouldbeincludedinperformancemonitoringGUIs
total time throttled (nanoseconds). saturation metric. average throttle time = throttled_time / nr_throttled
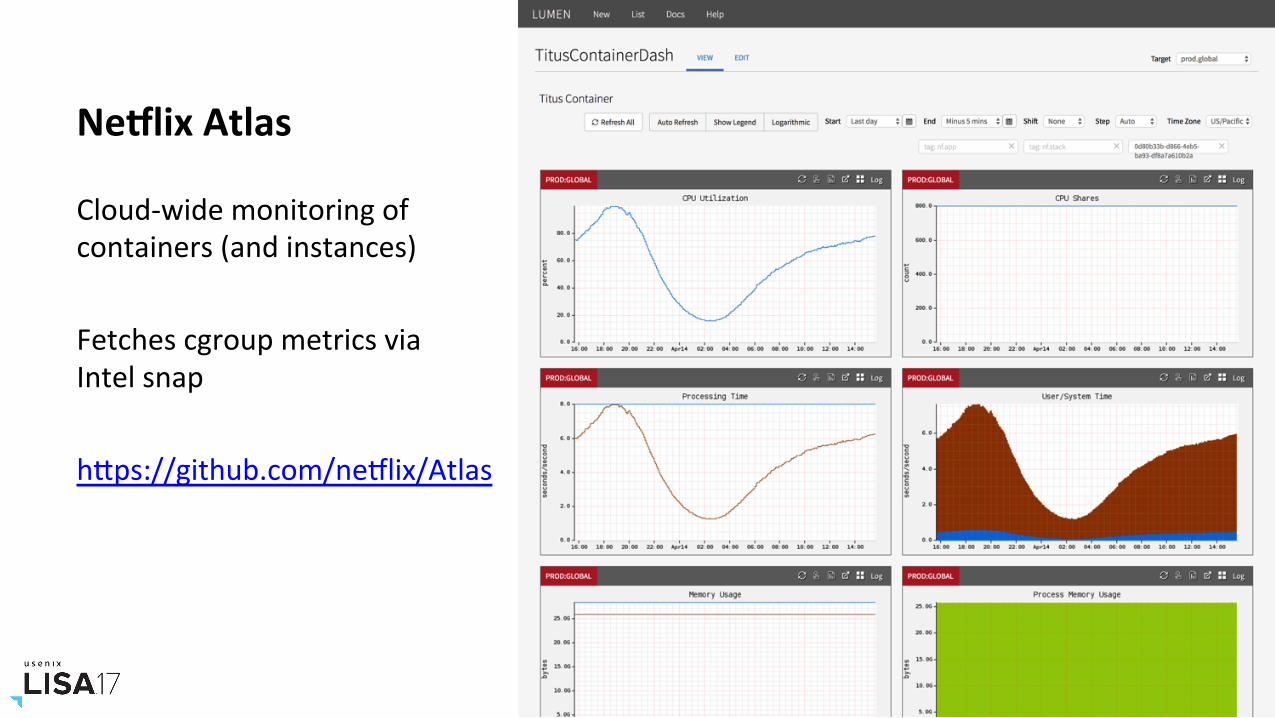
NeOlixAtlas
Cloud-widemonitoringofcontainers(andinstances)FetchescgroupmetricsviaIntelsnaphPps://github.com/neIlix/Atlas
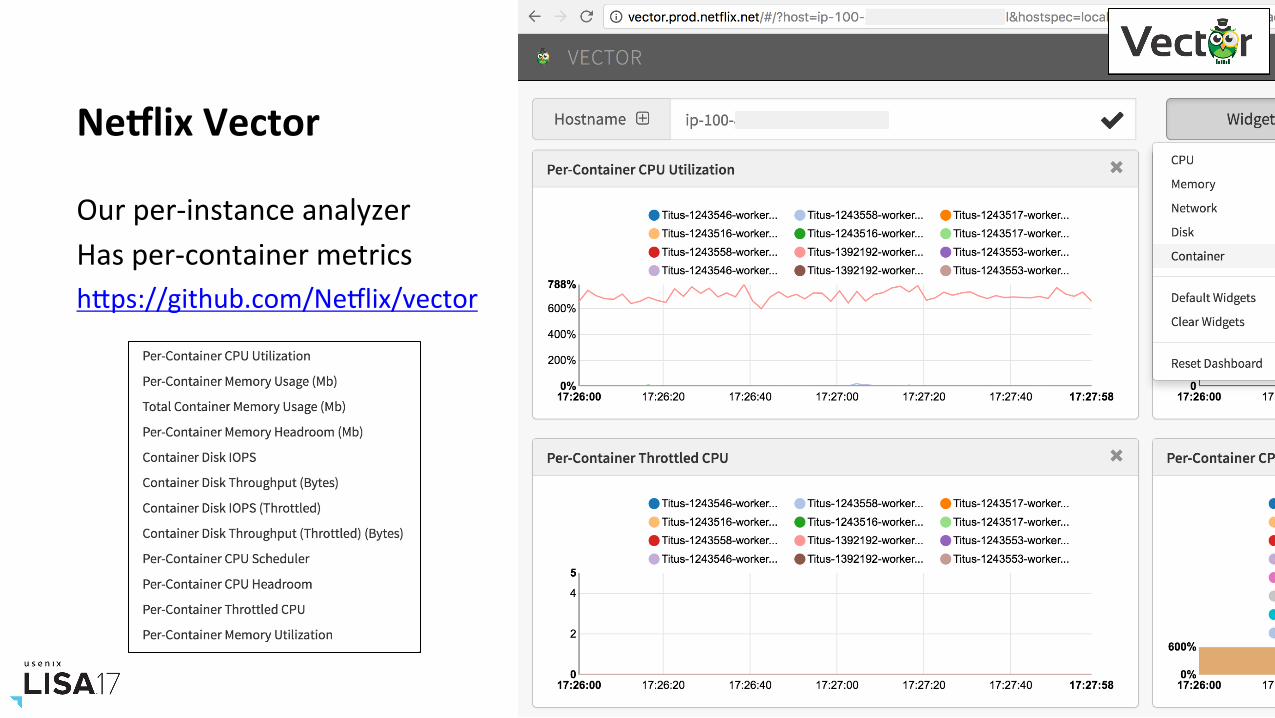
NeOlixVector
Ourper-instanceanalyzerHasper-containermetricshPps://github.com/NeIlix/vector
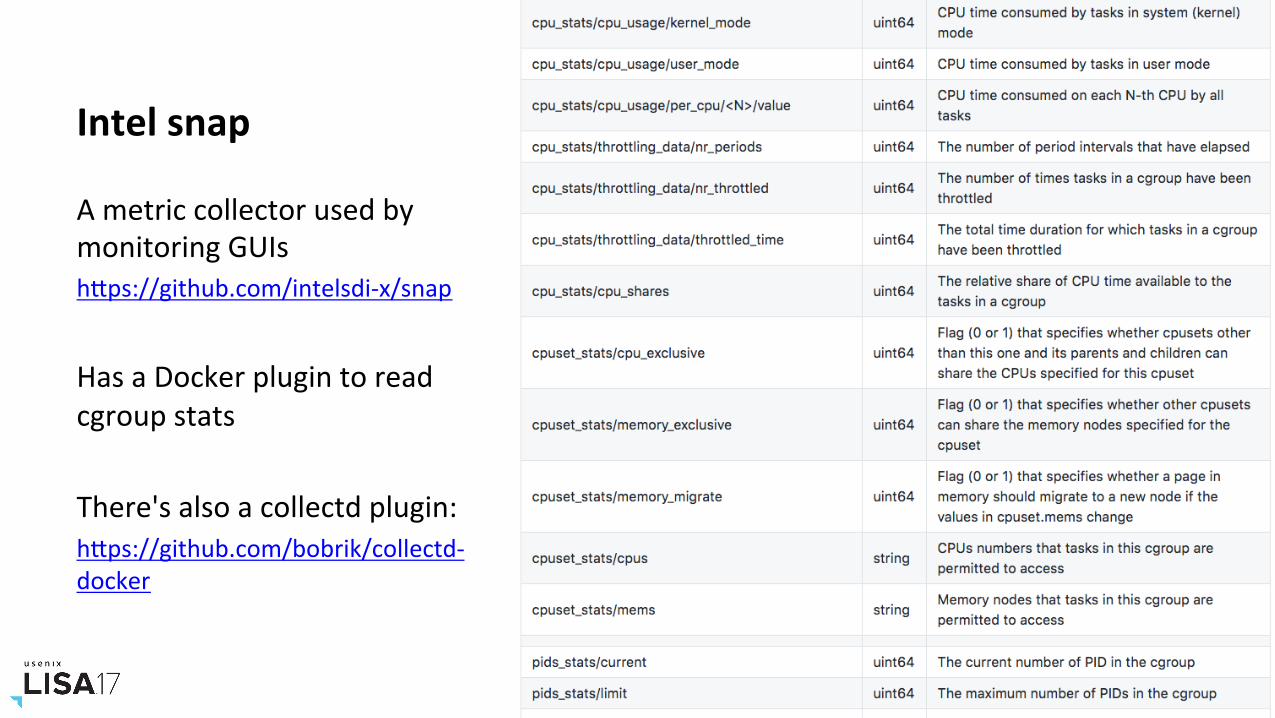
Intelsnap
AmetriccollectorusedbymonitoringGUIshPps://github.com/intelsdi-x/snap
HasaDockerplugintoreadcgroupstatsThere'salsoacollectdplugin:hPps://github.com/bobrik/collectd-docker
3.3.Let'sPlayaGame
HostorContainer?
(orNeither?)
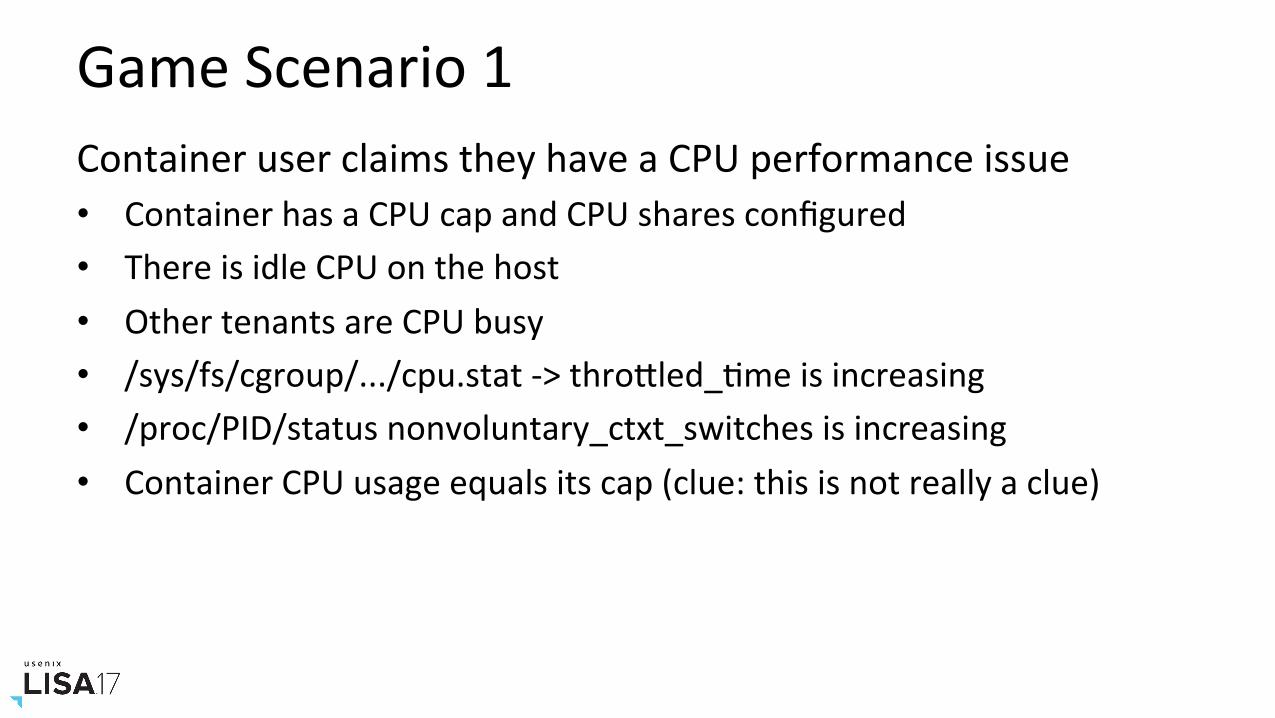
GameScenario1ContaineruserclaimstheyhaveaCPUperformanceissue• ContainerhasaCPUcapandCPUsharesconfigured• ThereisidleCPUonthehost• OthertenantsareCPUbusy• /sys/fs/cgroup/.../cpu.stat->throPled_Nmeisincreasing• /proc/PID/statusnonvoluntary_ctxt_switchesisincreasing• ContainerCPUusageequalsitscap(clue:thisisnotreallyaclue)
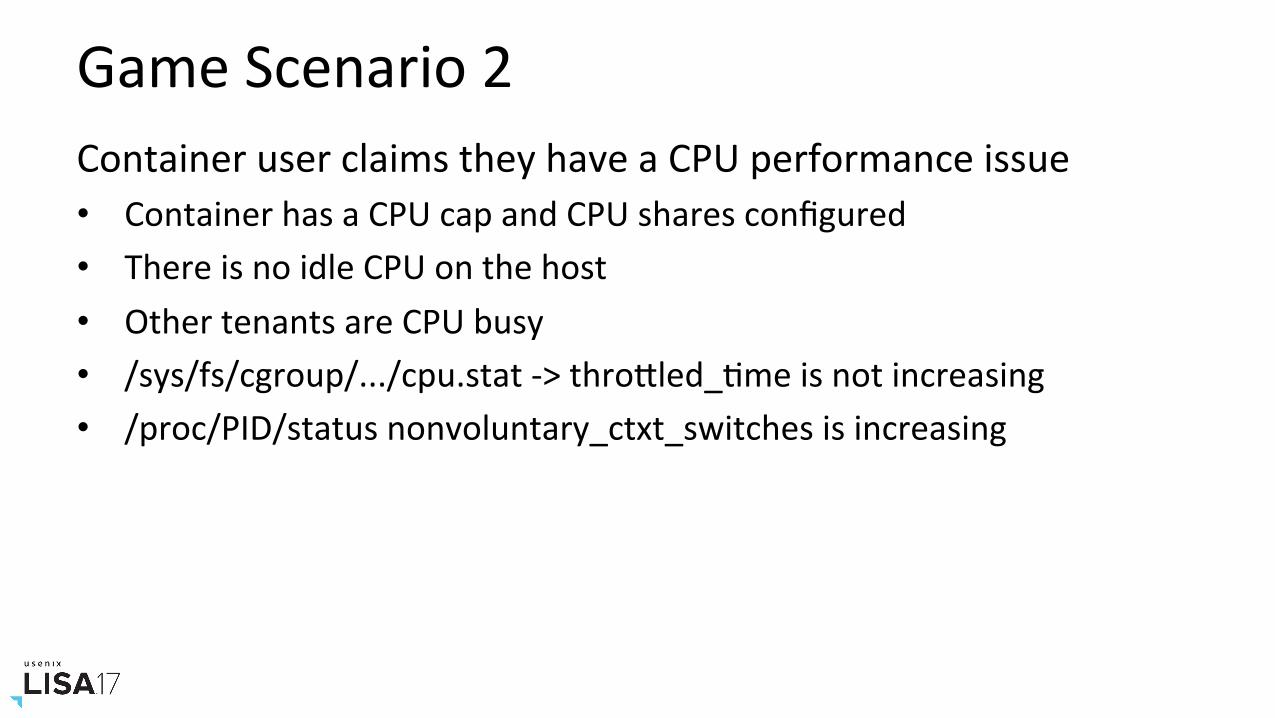
GameScenario2ContaineruserclaimstheyhaveaCPUperformanceissue• ContainerhasaCPUcapandCPUsharesconfigured• ThereisnoidleCPUonthehost• OthertenantsareCPUbusy• /sys/fs/cgroup/.../cpu.stat->throPled_Nmeisnotincreasing• /proc/PID/statusnonvoluntary_ctxt_switchesisincreasing
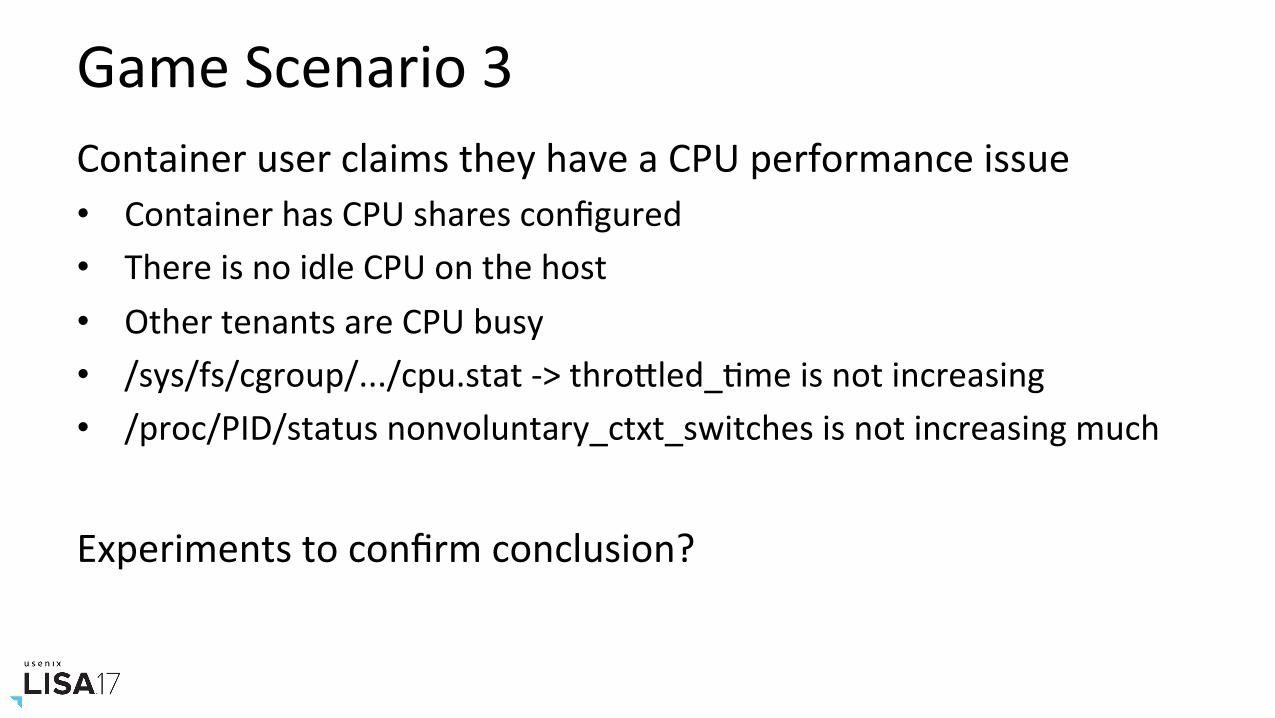
GameScenario3ContaineruserclaimstheyhaveaCPUperformanceissue• ContainerhasCPUsharesconfigured• ThereisnoidleCPUonthehost• OthertenantsareCPUbusy• /sys/fs/cgroup/.../cpu.stat->throPled_Nmeisnotincreasing• /proc/PID/statusnonvoluntary_ctxt_switchesisnotincreasingmuch
Experimentstoconfirmconclusion?
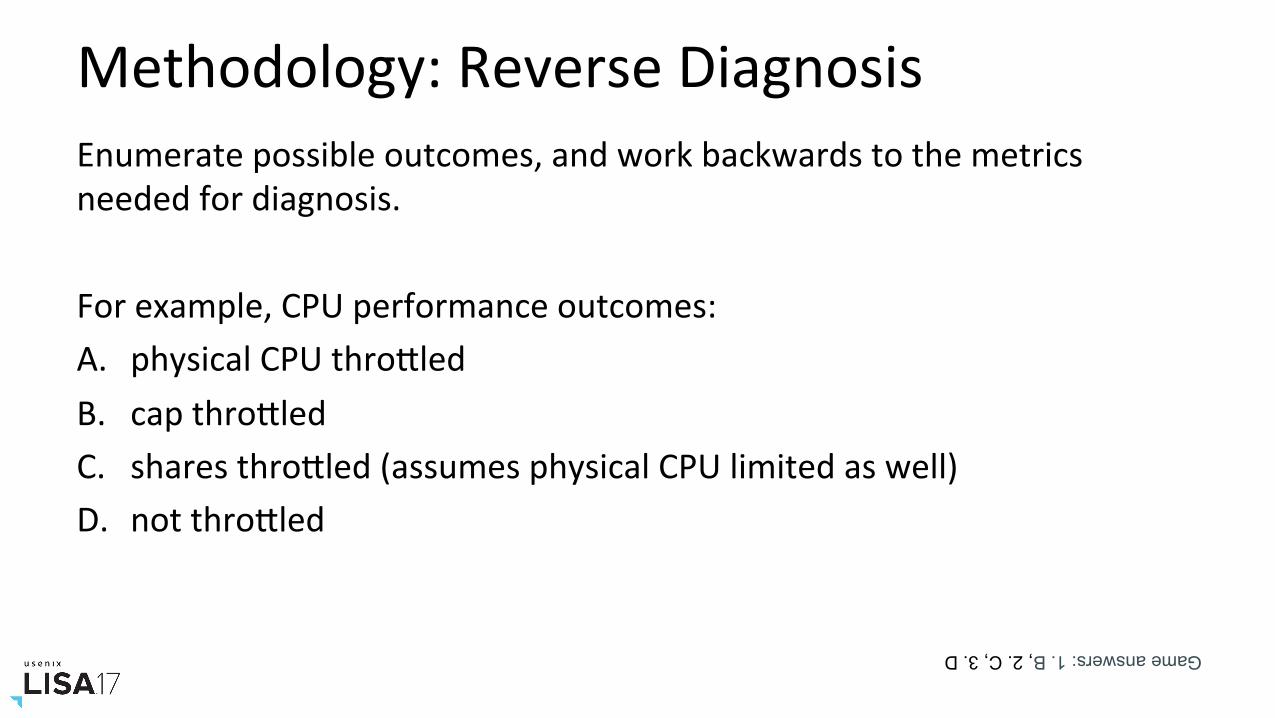
Methodology:ReverseDiagnosisEnumeratepossibleoutcomes,andworkbackwardstothemetricsneededfordiagnosis.Forexample,CPUperformanceoutcomes:A. physicalCPUthroPledB. capthroPledC. sharesthroPled(assumesphysicalCPUlimitedaswell)D. notthroPled
Game answers: 1. B, 2. C, 3. D
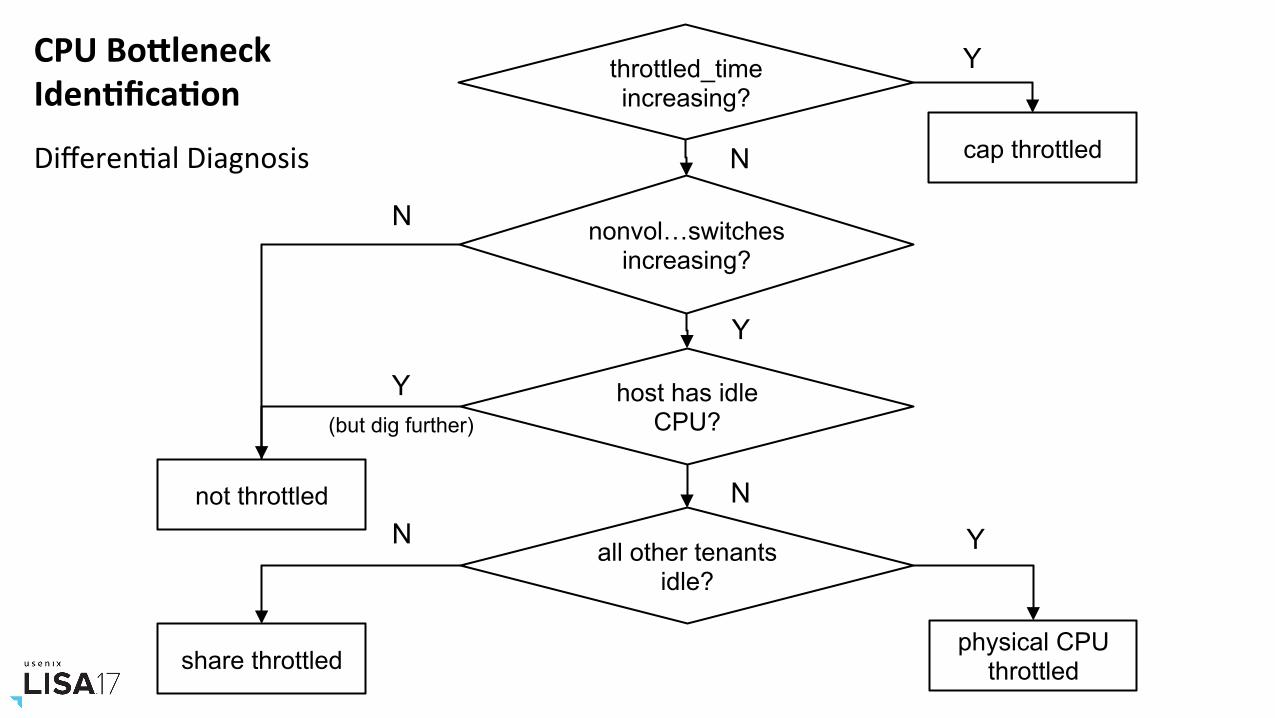
CPUBoRleneckIdenTficaTonDifferenNalDiagnosis
throttled_time increasing?
cap throttled
Y
nonvol…switches increasing?
not throttled
N
Y
host has idle CPU?
Y (but dig further)
physical CPU throttled share throttled
all other tenants idle?
N YN
N
4.GUESTTOOLSAndContainerAwareness
…ifyouonlyhaveguestaccess
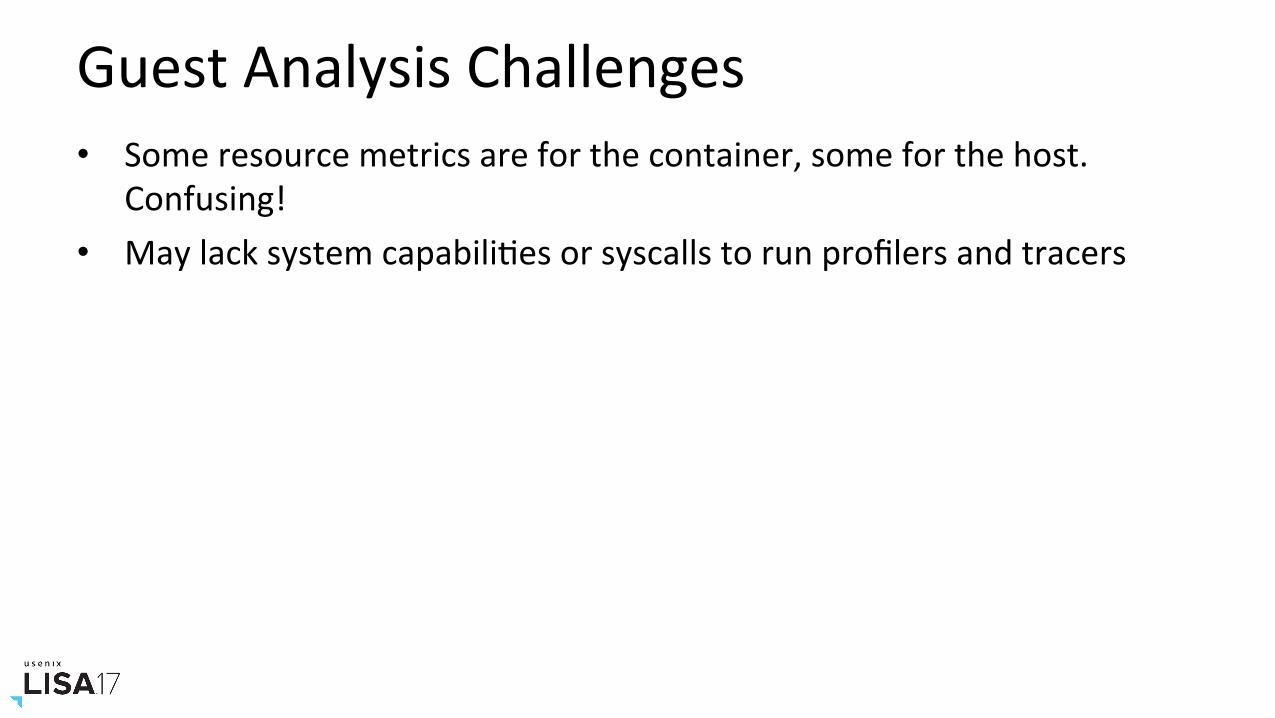
GuestAnalysisChallenges• Someresourcemetricsareforthecontainer,someforthehost.
Confusing!• MaylacksystemcapabiliNesorsyscallstorunprofilersandtracers
CPU
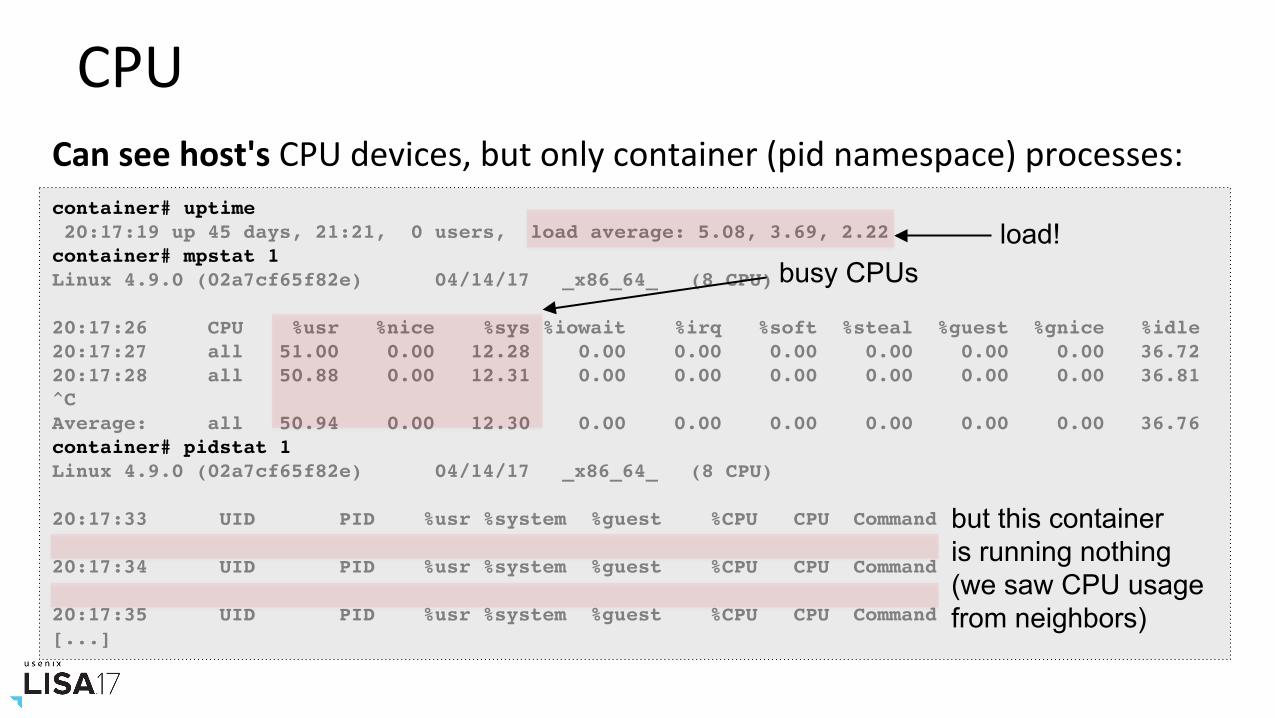
container# uptime 20:17:19 up 45 days, 21:21, 0 users, load average: 5.08, 3.69, 2.22container# mpstat 1Linux 4.9.0 (02a7cf65f82e) 04/14/17 _x86_64_ (8 CPU)
20:17:26 CPU %usr %nice %sys %iowait %irq %soft %steal %guest %gnice %idle20:17:27 all 51.00 0.00 12.28 0.00 0.00 0.00 0.00 0.00 0.00 36.7220:17:28 all 50.88 0.00 12.31 0.00 0.00 0.00 0.00 0.00 0.00 36.81^CAverage: all 50.94 0.00 12.30 0.00 0.00 0.00 0.00 0.00 0.00 36.76container# pidstat 1Linux 4.9.0 (02a7cf65f82e) 04/14/17 _x86_64_ (8 CPU)
20:17:33 UID PID %usr %system %guest %CPU CPU Command
20:17:34 UID PID %usr %system %guest %CPU CPU Command
20:17:35 UID PID %usr %system %guest %CPU CPU Command[...]
Canseehost'sCPUdevices,butonlycontainer(pidnamespace)processes:
load! busy CPUs
but this container is running nothing (we saw CPU usage from neighbors)
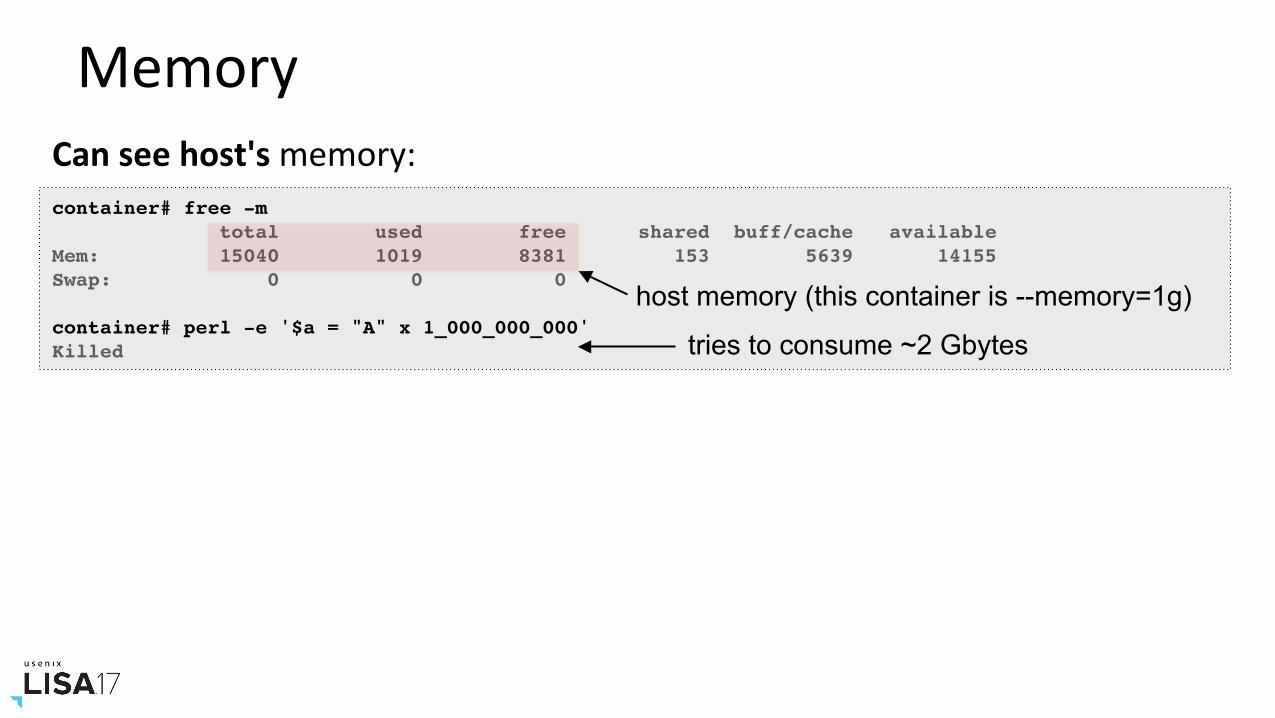
MemoryCanseehost'smemory:container# free -m total used free shared buff/cache availableMem: 15040 1019 8381 153 5639 14155Swap: 0 0 0
container# perl -e '$a = "A" x 1_000_000_000'Killed tries to consume ~2 Gbytes
host memory (this container is --memory=1g)
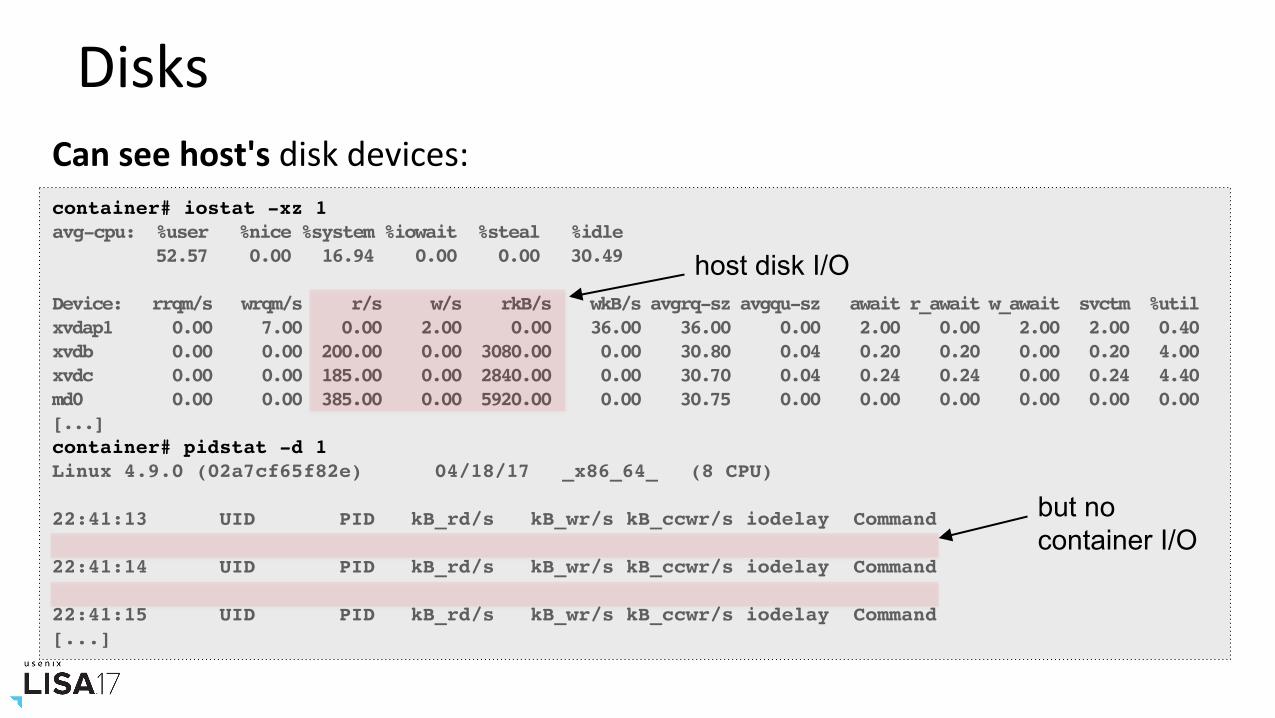
DisksCanseehost'sdiskdevices:container# iostat -xz 1avg-cpu: %user %nice %system %iowait %steal %idle 52.57 0.00 16.94 0.00 0.00 30.49
Device: rrqm/s wrqm/s r/s w/s rkB/s wkB/s avgrq-sz avgqu-sz await r_await w_await svctm %utilxvdap1 0.00 7.00 0.00 2.00 0.00 36.00 36.00 0.00 2.00 0.00 2.00 2.00 0.40xvdb 0.00 0.00 200.00 0.00 3080.00 0.00 30.80 0.04 0.20 0.20 0.00 0.20 4.00xvdc 0.00 0.00 185.00 0.00 2840.00 0.00 30.70 0.04 0.24 0.24 0.00 0.24 4.40md0 0.00 0.00 385.00 0.00 5920.00 0.00 30.75 0.00 0.00 0.00 0.00 0.00 0.00[...]container# pidstat -d 1Linux 4.9.0 (02a7cf65f82e) 04/18/17 _x86_64_ (8 CPU)
22:41:13 UID PID kB_rd/s kB_wr/s kB_ccwr/s iodelay Command
22:41:14 UID PID kB_rd/s kB_wr/s kB_ccwr/s iodelay Command
22:41:15 UID PID kB_rd/s kB_wr/s kB_ccwr/s iodelay Command[...]
host disk I/O
but no container I/O
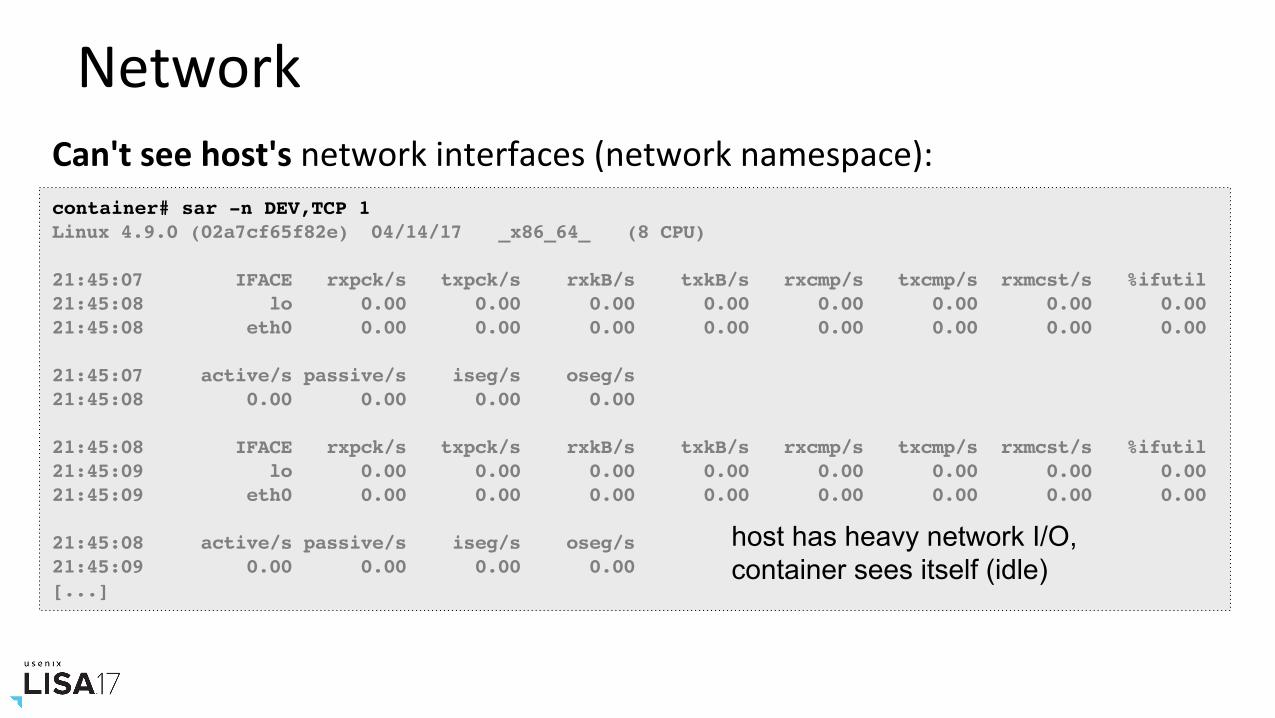
NetworkCan'tseehost'snetworkinterfaces(networknamespace):container# sar -n DEV,TCP 1Linux 4.9.0 (02a7cf65f82e) 04/14/17 _x86_64_ (8 CPU)
21:45:07 IFACE rxpck/s txpck/s rxkB/s txkB/s rxcmp/s txcmp/s rxmcst/s %ifutil21:45:08 lo 0.00 0.00 0.00 0.00 0.00 0.00 0.00 0.0021:45:08 eth0 0.00 0.00 0.00 0.00 0.00 0.00 0.00 0.00
21:45:07 active/s passive/s iseg/s oseg/s21:45:08 0.00 0.00 0.00 0.00
21:45:08 IFACE rxpck/s txpck/s rxkB/s txkB/s rxcmp/s txcmp/s rxmcst/s %ifutil21:45:09 lo 0.00 0.00 0.00 0.00 0.00 0.00 0.00 0.0021:45:09 eth0 0.00 0.00 0.00 0.00 0.00 0.00 0.00 0.00
21:45:08 active/s passive/s iseg/s oseg/s21:45:09 0.00 0.00 0.00 0.00[...]
host has heavy network I/O, container sees itself (idle)
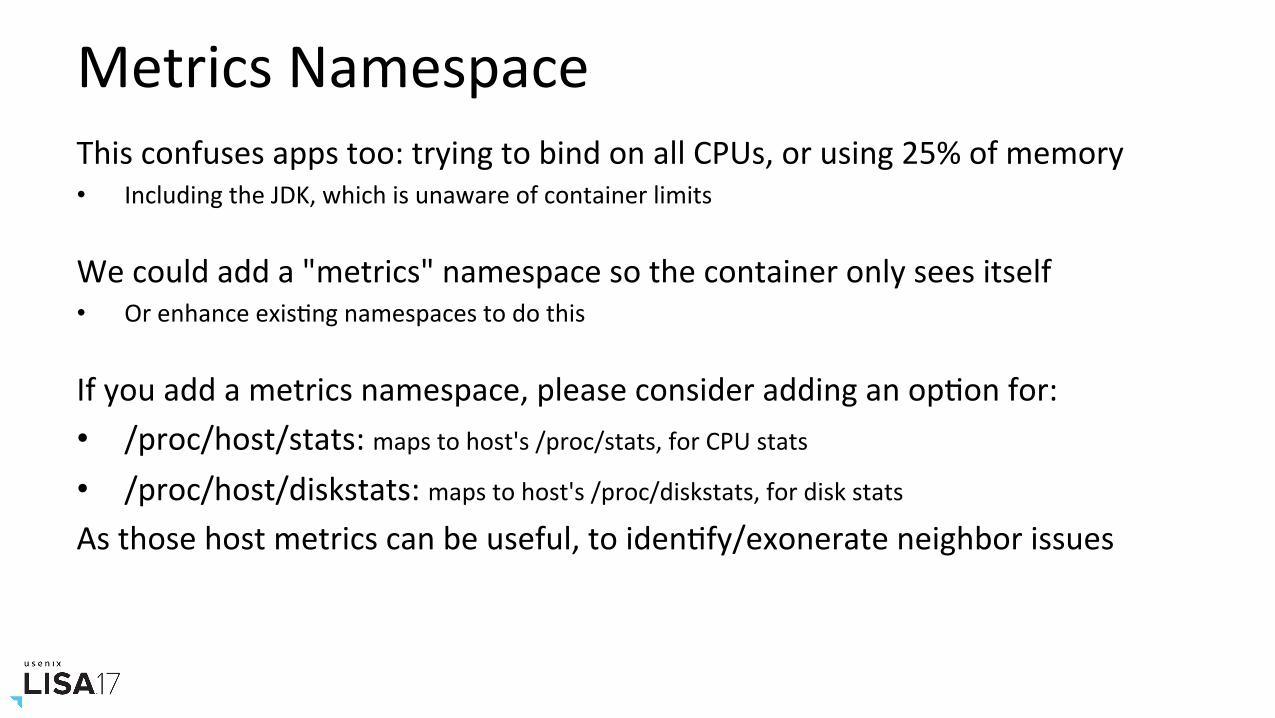
MetricsNamespaceThisconfusesappstoo:tryingtobindonallCPUs,orusing25%ofmemory• IncludingtheJDK,whichisunawareofcontainerlimits
Wecouldadda"metrics"namespacesothecontaineronlyseesitself• OrenhanceexisNngnamespacestodothis
Ifyouaddametricsnamespace,pleaseconsideraddinganopNonfor:• /proc/host/stats:mapstohost's/proc/stats,forCPUstats
• /proc/host/diskstats:mapstohost's/proc/diskstats,fordiskstats
Asthosehostmetricscanbeuseful,toidenNfy/exonerateneighborissues
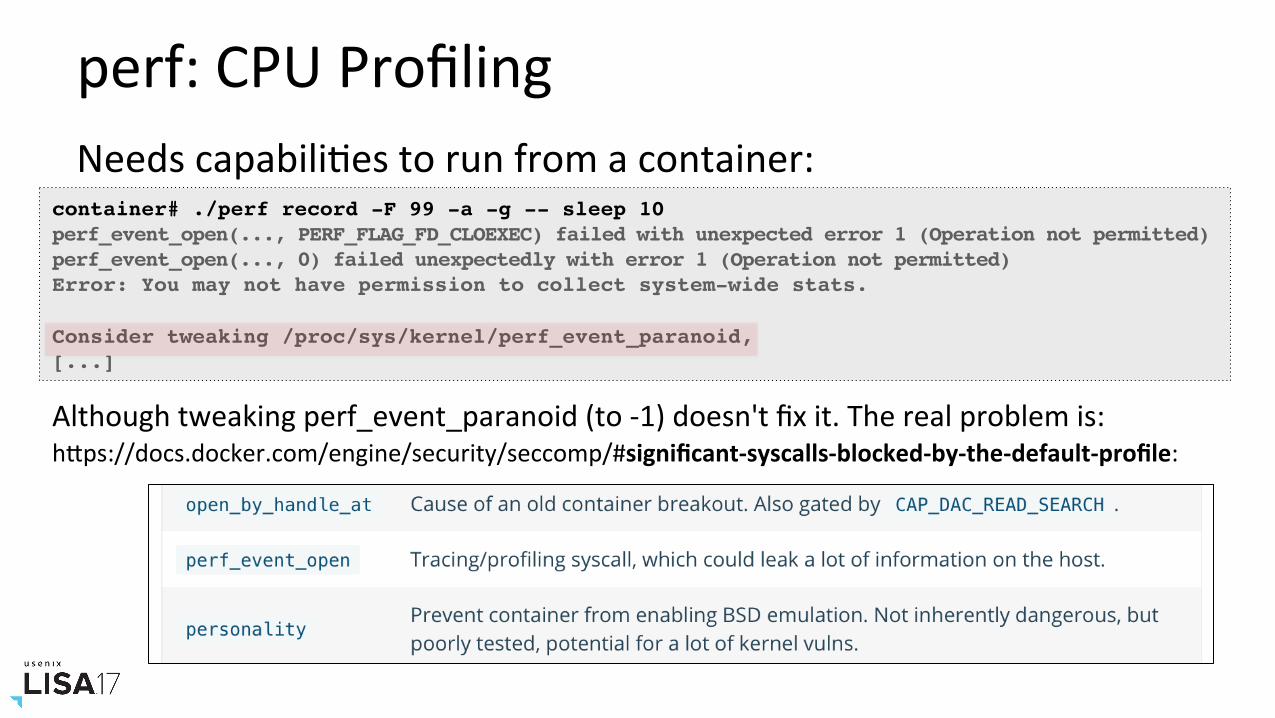
perf:CPUProfilingNeedscapabiliNestorunfromacontainer:
container# ./perf record -F 99 -a -g -- sleep 10perf_event_open(..., PERF_FLAG_FD_CLOEXEC) failed with unexpected error 1 (Operation not permitted)perf_event_open(..., 0) failed unexpectedly with error 1 (Operation not permitted)Error: You may not have permission to collect system-wide stats.
Consider tweaking /proc/sys/kernel/perf_event_paranoid,[...]
Althoughtweakingperf_event_paranoid(to-1)doesn'tfixit.Therealproblemis:hPps://docs.docker.com/engine/security/seccomp/#significant-syscalls-blocked-by-the-default-profile:
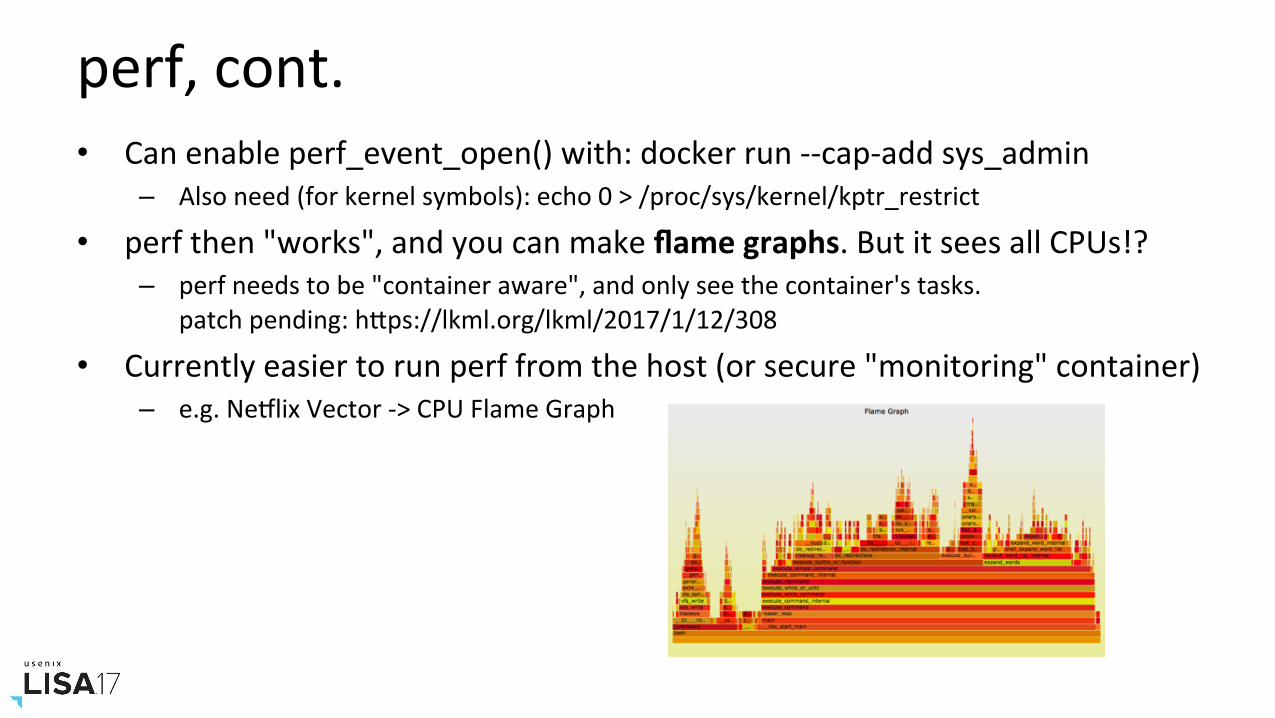
perf,cont.• Canenableperf_event_open()with:dockerrun--cap-addsys_admin
– Alsoneed(forkernelsymbols):echo0>/proc/sys/kernel/kptr_restrict
• perfthen"works",andyoucanmakeflamegraphs.ButitseesallCPUs!?– perfneedstobe"containeraware",andonlyseethecontainer'stasks.
patchpending:hPps://lkml.org/lkml/2017/1/12/308
• Currentlyeasiertorunperffromthehost(orsecure"monitoring"container)– e.g.NeIlixVector->CPUFlameGraph
5.TRACINGAdvancedAnalysis
…afewmoreexamples(iosnoop,zfsslower,andbtrfsdistshownearlier)
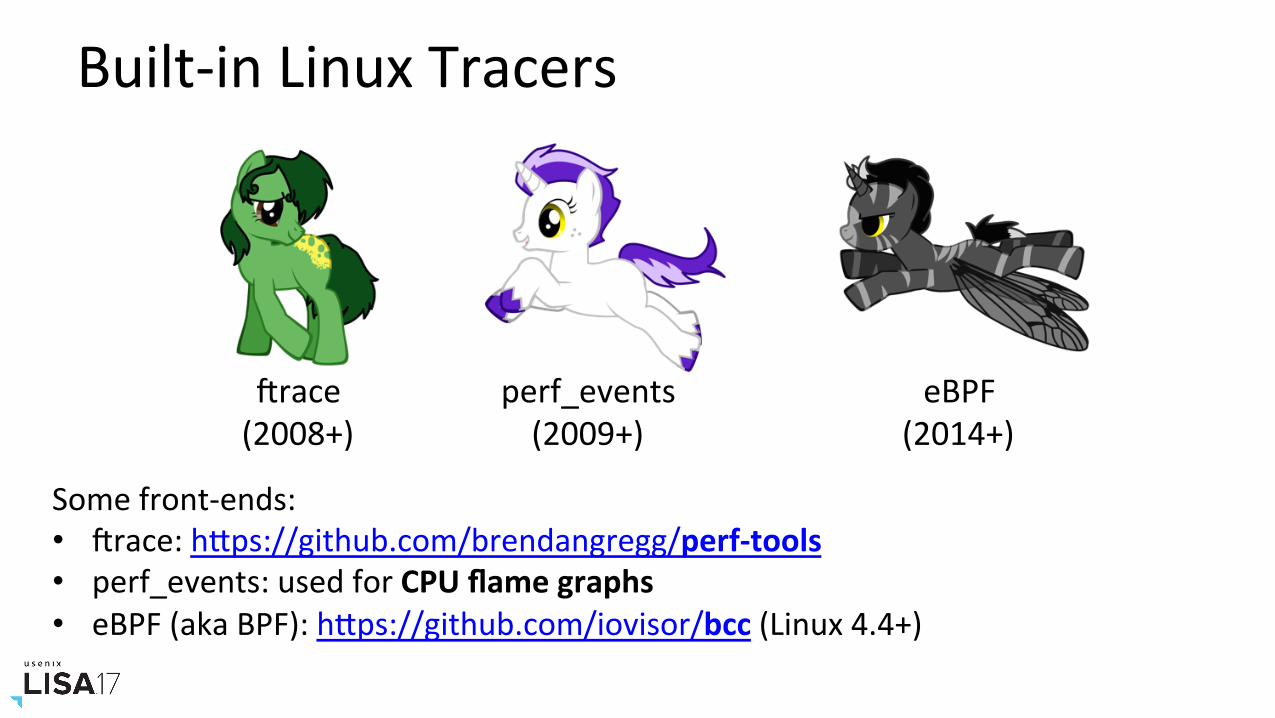
Built-inLinuxTracers
trace(2008+)
perf_events(2009+)
eBPF(2014+)
Somefront-ends:• trace:hPps://github.com/brendangregg/perf-tools• perf_events:usedforCPUflamegraphs• eBPF(akaBPF):hPps://github.com/iovisor/bcc(Linux4.4+)
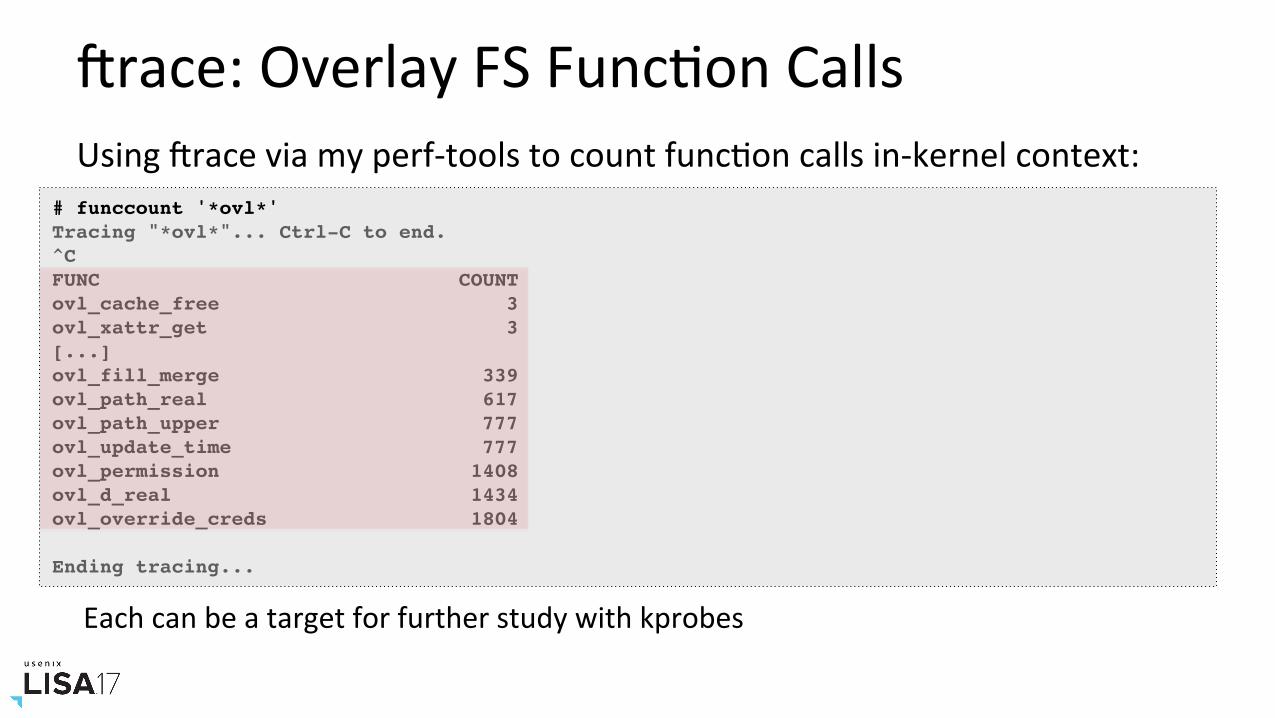
trace:OverlayFSFuncNonCallsUsingtraceviamyperf-toolstocountfuncNoncallsin-kernelcontext:
Eachcanbeatargetforfurtherstudywithkprobes
# funccount '*ovl*'Tracing "*ovl*"... Ctrl-C to end.^CFUNC COUNTovl_cache_free 3ovl_xattr_get 3[...]ovl_fill_merge 339ovl_path_real 617ovl_path_upper 777ovl_update_time 777ovl_permission 1408ovl_d_real 1434ovl_override_creds 1804
Ending tracing...
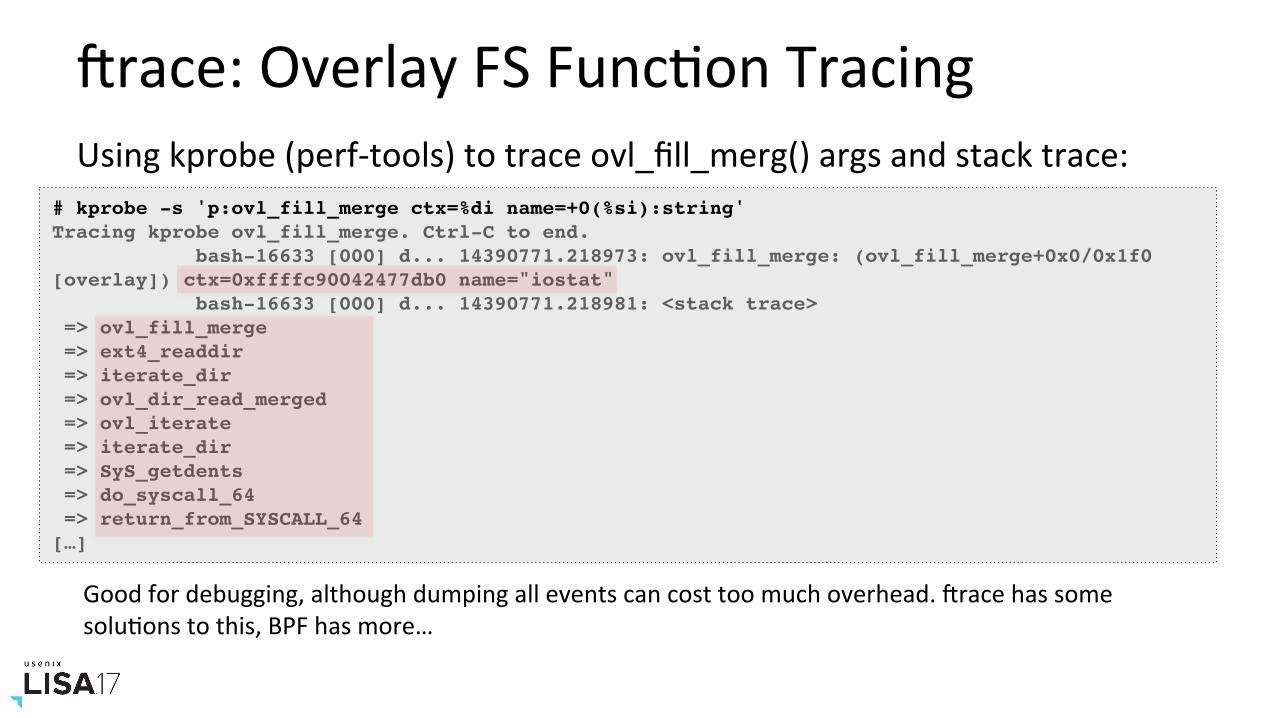
trace:OverlayFSFuncNonTracingUsingkprobe(perf-tools)totraceovl_fill_merg()argsandstacktrace:
Goodfordebugging,althoughdumpingalleventscancosttoomuchoverhead.tracehassomesoluNonstothis,BPFhasmore…
# kprobe -s 'p:ovl_fill_merge ctx=%di name=+0(%si):string'Tracing kprobe ovl_fill_merge. Ctrl-C to end. bash-16633 [000] d... 14390771.218973: ovl_fill_merge: (ovl_fill_merge+0x0/0x1f0 [overlay]) ctx=0xffffc90042477db0 name="iostat" bash-16633 [000] d... 14390771.218981: <stack trace> => ovl_fill_merge => ext4_readdir => iterate_dir => ovl_dir_read_merged => ovl_iterate => iterate_dir => SyS_getdents => do_syscall_64 => return_from_SYSCALL_64[…]
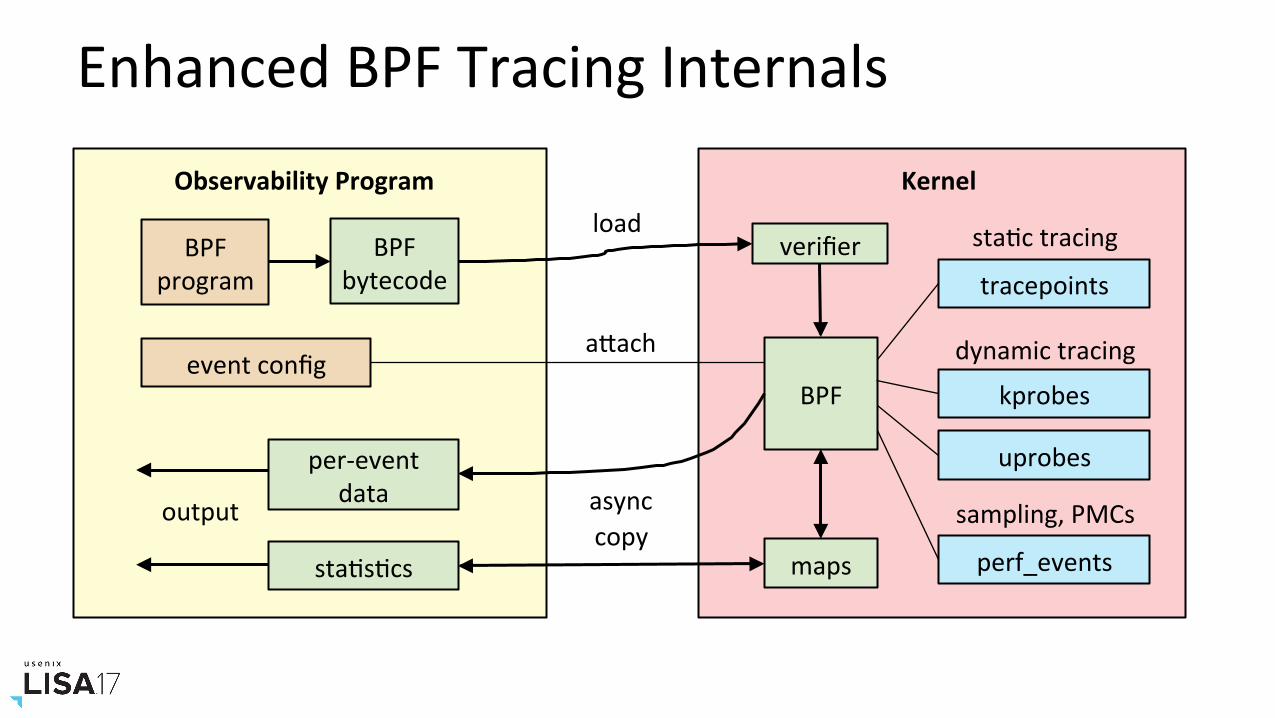
EnhancedBPFTracingInternals
BPFbytecode
ObservabilityProgram Kernel
tracepoints
kprobes
uprobes
BPF
maps
per-eventdata
staNsNcs
verifier
output
staNctracing
dynamictracing
asynccopy
perf_events
sampling,PMCs
BPFprogram
eventconfigaPach
load
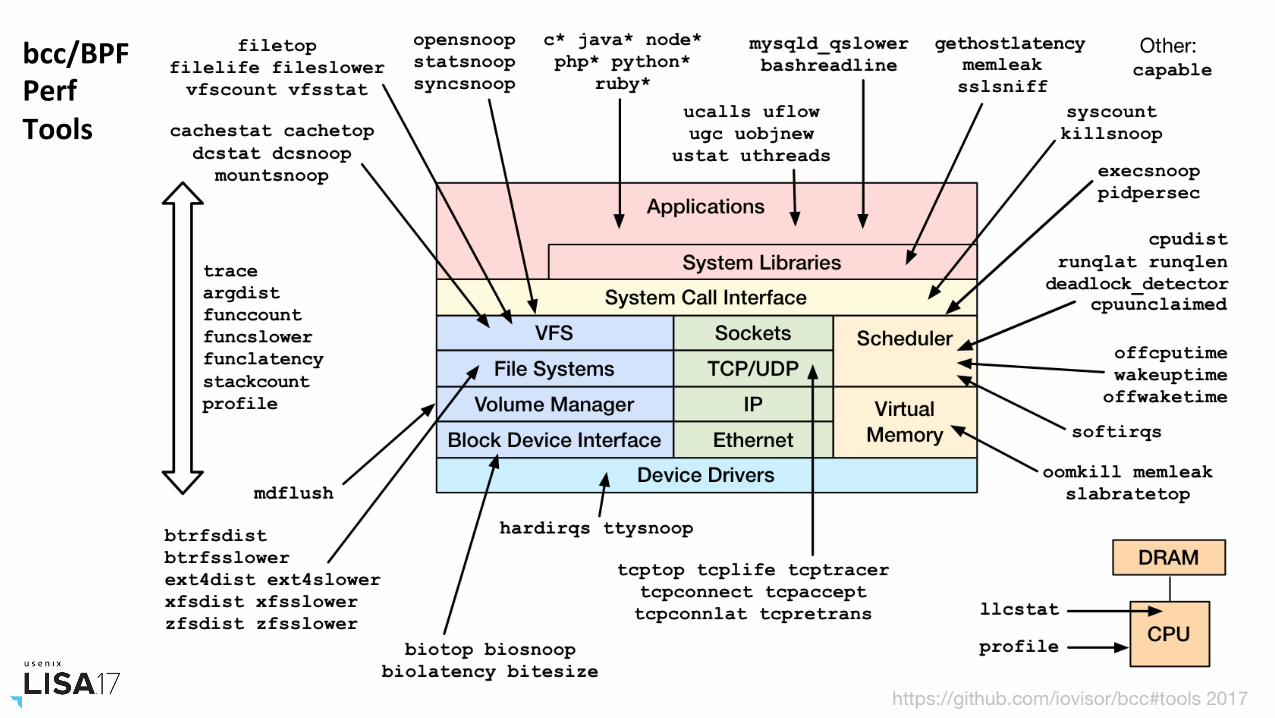
bcc/BPFPerfTools
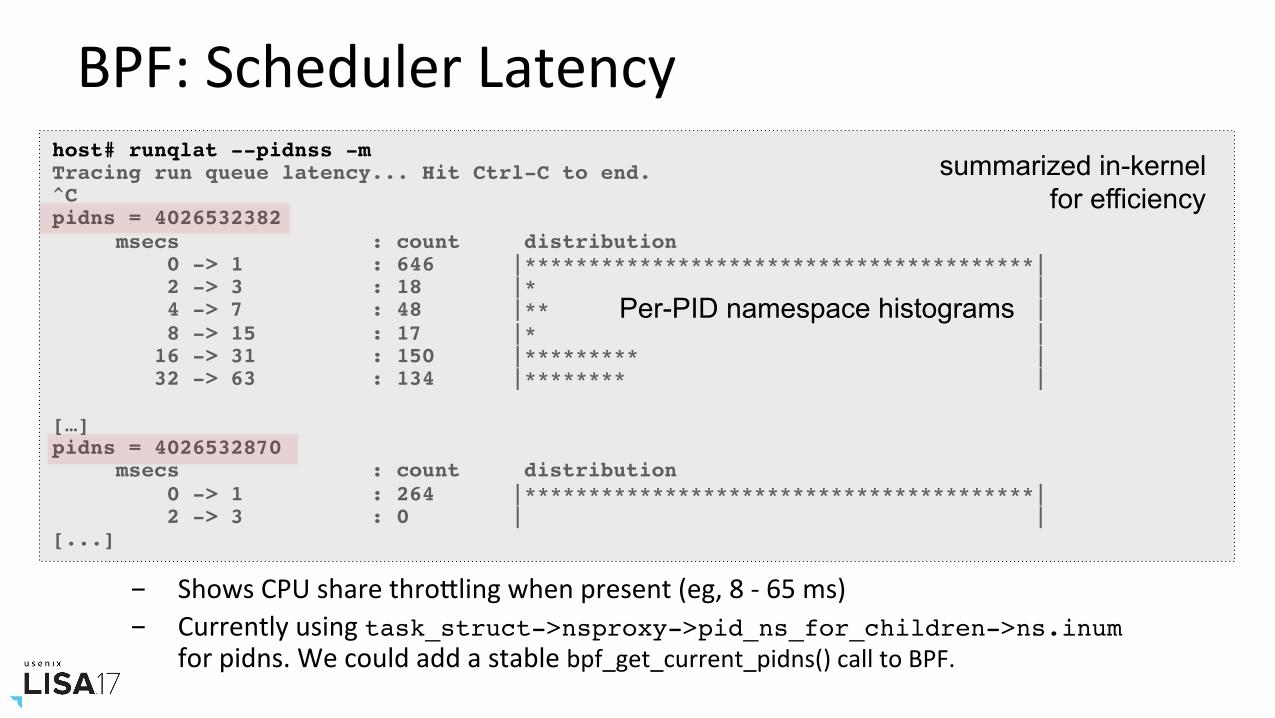
BPF:SchedulerLatencyhost# runqlat --pidnss -mTracing run queue latency... Hit Ctrl-C to end.^Cpidns = 4026532382 msecs : count distribution 0 -> 1 : 646 |****************************************| 2 -> 3 : 18 |* | 4 -> 7 : 48 |** | 8 -> 15 : 17 |* | 16 -> 31 : 150 |********* | 32 -> 63 : 134 |******** |
[…]pidns = 4026532870 msecs : count distribution 0 -> 1 : 264 |****************************************| 2 -> 3 : 0 | |[...]
Per-PID namespace histograms
summarized in-kernel for efficiency
- ShowsCPUsharethroPlingwhenpresent(eg,8-65ms)- Currentlyusingtask_struct->nsproxy->pid_ns_for_children->ns.inum
forpidns.Wecouldaddastablebpf_get_current_pidns()calltoBPF.
DockerAnalysis&DebuggingIfneeded,dockerdcanalsobeanalyzedusing:• goexecuNontracer• GODEBUGwithgctraceandschedtrace• gdbandGorunNmesupport• perfprofiling• bcc/BPFanduprobes
Eachhaspros/cons.bcc/BPFcantraceuser&kernelevents.
BPF:dockerdGoFuncNonCounNng
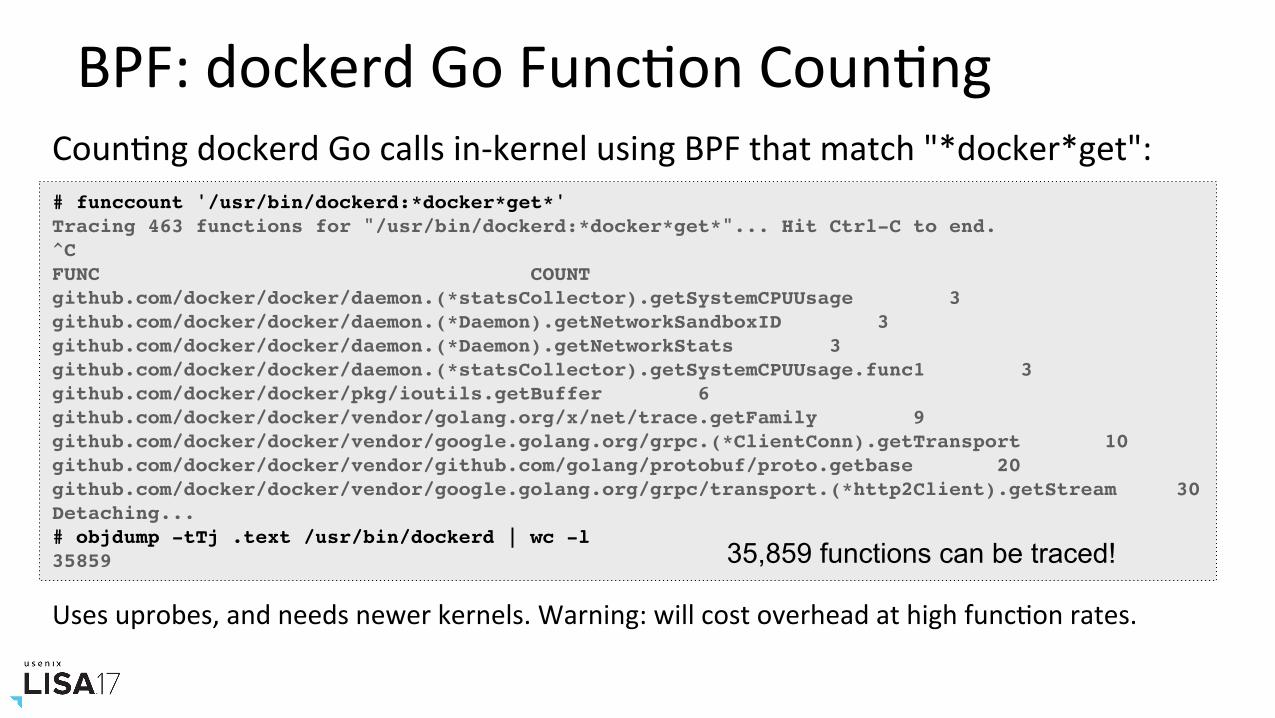
# funccount '/usr/bin/dockerd:*docker*get*'Tracing 463 functions for "/usr/bin/dockerd:*docker*get*"... Hit Ctrl-C to end.^CFUNC COUNTgithub.com/docker/docker/daemon.(*statsCollector).getSystemCPUUsage 3github.com/docker/docker/daemon.(*Daemon).getNetworkSandboxID 3github.com/docker/docker/daemon.(*Daemon).getNetworkStats 3github.com/docker/docker/daemon.(*statsCollector).getSystemCPUUsage.func1 3github.com/docker/docker/pkg/ioutils.getBuffer 6github.com/docker/docker/vendor/golang.org/x/net/trace.getFamily 9github.com/docker/docker/vendor/google.golang.org/grpc.(*ClientConn).getTransport 10github.com/docker/docker/vendor/github.com/golang/protobuf/proto.getbase 20github.com/docker/docker/vendor/google.golang.org/grpc/transport.(*http2Client).getStream 30Detaching...# objdump -tTj .text /usr/bin/dockerd | wc -l35859
CounNngdockerdGocallsin-kernelusingBPFthatmatch"*docker*get":
35,859 functions can be traced!
Usesuprobes,andneedsnewerkernels.Warning:willcostoverheadathighfuncNonrates.
BPF:dockerdGoStackTracing
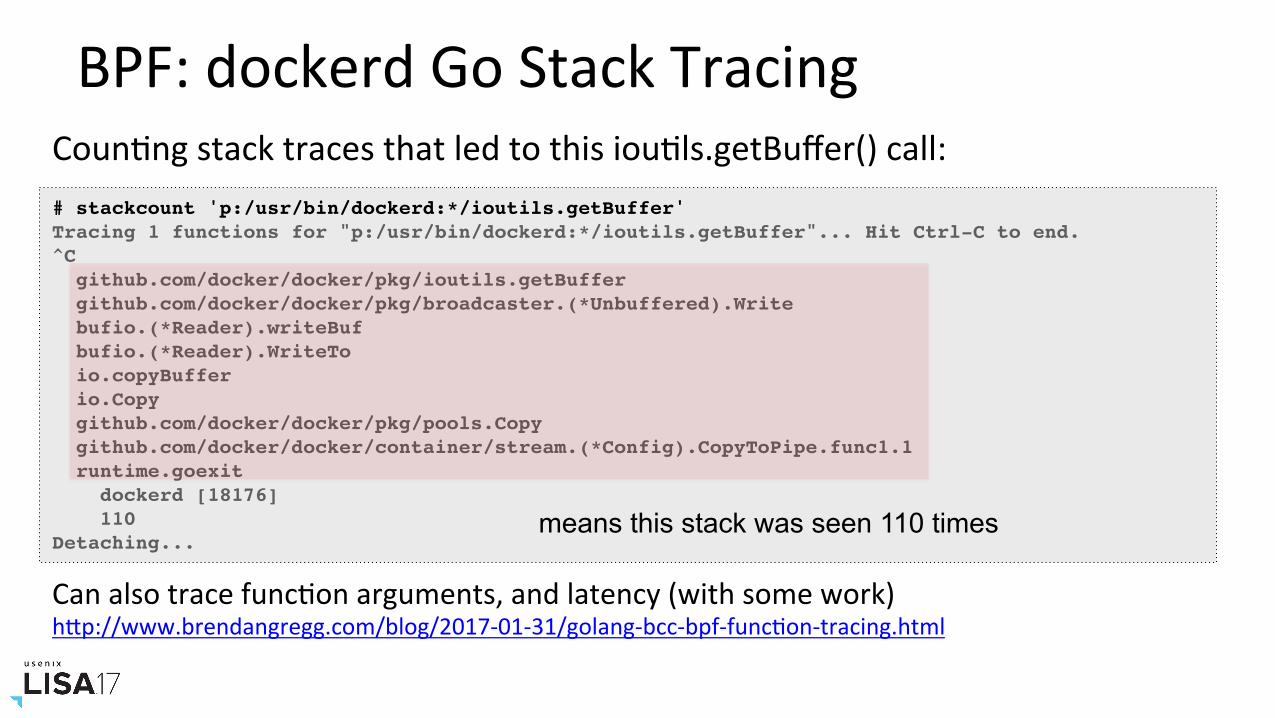
# stackcount 'p:/usr/bin/dockerd:*/ioutils.getBuffer'Tracing 1 functions for "p:/usr/bin/dockerd:*/ioutils.getBuffer"... Hit Ctrl-C to end.^C github.com/docker/docker/pkg/ioutils.getBuffer github.com/docker/docker/pkg/broadcaster.(*Unbuffered).Write bufio.(*Reader).writeBuf bufio.(*Reader).WriteTo io.copyBuffer io.Copy github.com/docker/docker/pkg/pools.Copy github.com/docker/docker/container/stream.(*Config).CopyToPipe.func1.1 runtime.goexit dockerd [18176] 110Detaching...
means this stack was seen 110 times
CanalsotracefuncNonarguments,andlatency(withsomework)hPp://www.brendangregg.com/blog/2017-01-31/golang-bcc-bpf-funcNon-tracing.html
CounNngstacktracesthatledtothisiouNls.getBuffer()call:
SummaryIdenNfyboPlenecks:1. Inthehostvscontainer,usingsystemmetrics2. InapplicaNoncodeoncontainers,usingCPUflamegraphs3. Deeperinthekernel,usingtracingtools
References• hPp://techblog.neIlix.com/2017/04/the-evoluNon-of-container-usage-at.html• hPp://techblog.neIlix.com/2016/07/distributed-resource-scheduling-with.html• hPps://www.slideshare.net/aspyker/neIlix-and-containers-Ntus• hPps://docs.docker.com/engine/admin/runmetrics/#Nps-for-high-performance-metric-collecNon• hPps://blog.docker.com/2013/10/gathering-lxc-docker-containers-metrics/• hPps://www.slideshare.net/jpetazzo/anatomy-of-a-container-namespaces-cgroups-some-filesystem-magic-linuxcon• hPps://www.youtube.com/watch?v=sK5i-N34im8Cgroups,namespaces,andbeyond• hPps://jvns.ca/blog/2016/10/10/what-even-is-a-container/• hPps://blog.jessfraz.com/post/containers-zones-jails-vms/• hPp://blog.alicegoldfuss.com/making-flamegraphs-with-containerized-java/• hPp://www.brendangregg.com/USEmethod/use-linux.htmlfullUSEmethodlist• hPp://www.brendangregg.com/blog/2017-01-31/golang-bcc-bpf-funcNon-tracing.html• hPp://techblog.neIlix.com/2015/11/linux-performance-analysis-in-60s.html• hPp://queue.acm.org/detail.cfm?id=1809426latencyheatmaps• hPps://github.com/brendangregg/perf-toolstracetools,hPps://github.com/iovisor/bccBPFtools
October29–November3,2017|SanFrancisco,CAwww.usenix.org/lisa17#lisa17
ThankYou!hPp://techblog.neIlix.comhPp://slideshare.net/brendangregghPp://[email protected]@brendangreggTitusteam:@aspyker@anwleung@fabiokung@tomaszbak1974@amit_joshee@sargun@corindwyer…