Embed Size (px)
Citation preview

Performance Analysis Superpowers with Linux eBPF
Brendan Gregg Senior Performance Architect Jun 2017

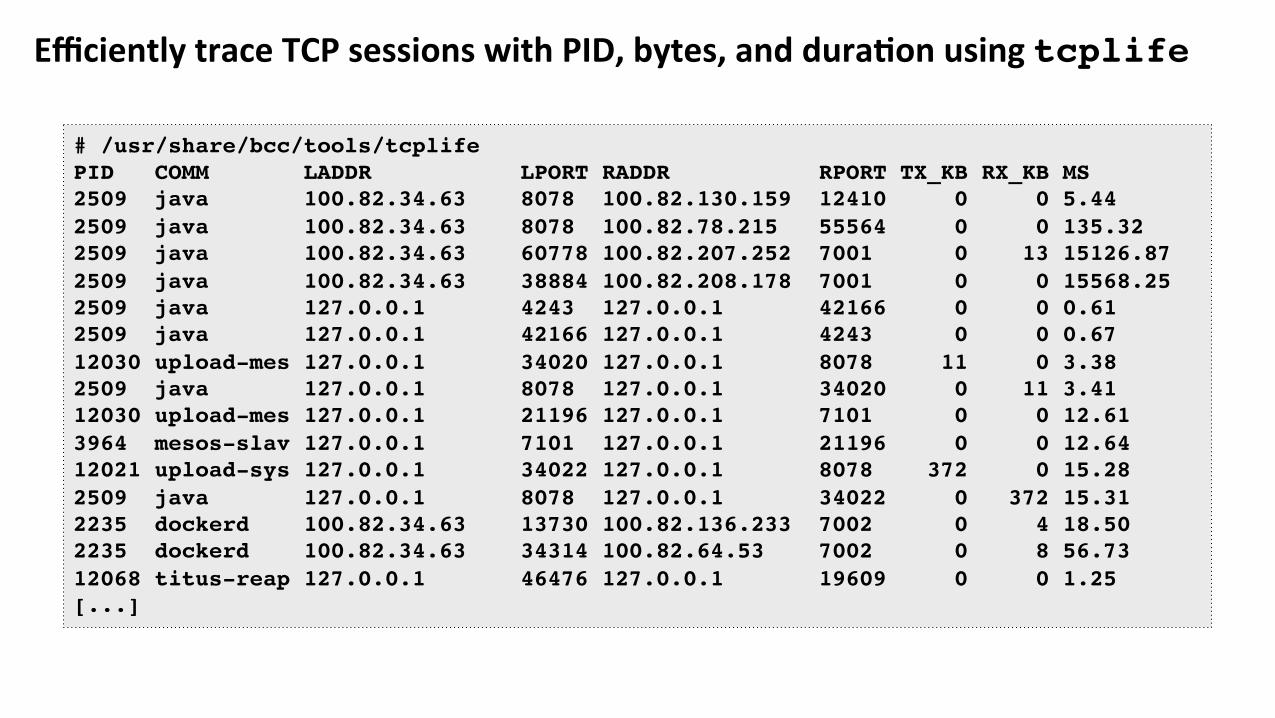
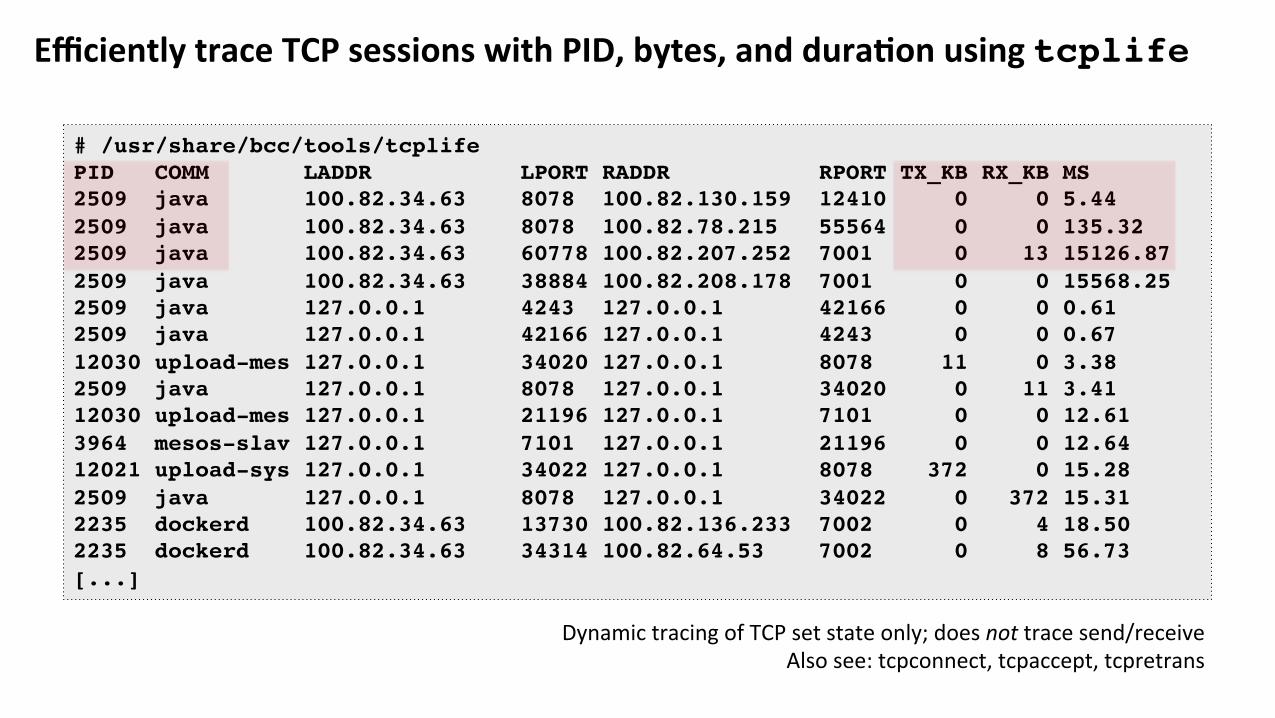
EfficientlytraceTCPsessionswithPID,bytes,anddura:onusingtcplife
# /usr/share/bcc/tools/tcplifePID COMM LADDR LPORT RADDR RPORT TX_KB RX_KB MS2509 java 100.82.34.63 8078 100.82.130.159 12410 0 0 5.442509 java 100.82.34.63 8078 100.82.78.215 55564 0 0 135.322509 java 100.82.34.63 60778 100.82.207.252 7001 0 13 15126.872509 java 100.82.34.63 38884 100.82.208.178 7001 0 0 15568.252509 java 127.0.0.1 4243 127.0.0.1 42166 0 0 0.612509 java 127.0.0.1 42166 127.0.0.1 4243 0 0 0.6712030 upload-mes 127.0.0.1 34020 127.0.0.1 8078 11 0 3.382509 java 127.0.0.1 8078 127.0.0.1 34020 0 11 3.4112030 upload-mes 127.0.0.1 21196 127.0.0.1 7101 0 0 12.613964 mesos-slav 127.0.0.1 7101 127.0.0.1 21196 0 0 12.6412021 upload-sys 127.0.0.1 34022 127.0.0.1 8078 372 0 15.282509 java 127.0.0.1 8078 127.0.0.1 34022 0 372 15.312235 dockerd 100.82.34.63 13730 100.82.136.233 7002 0 4 18.502235 dockerd 100.82.34.63 34314 100.82.64.53 7002 0 8 56.7312068 titus-reap 127.0.0.1 46476 127.0.0.1 19609 0 0 1.25[...]
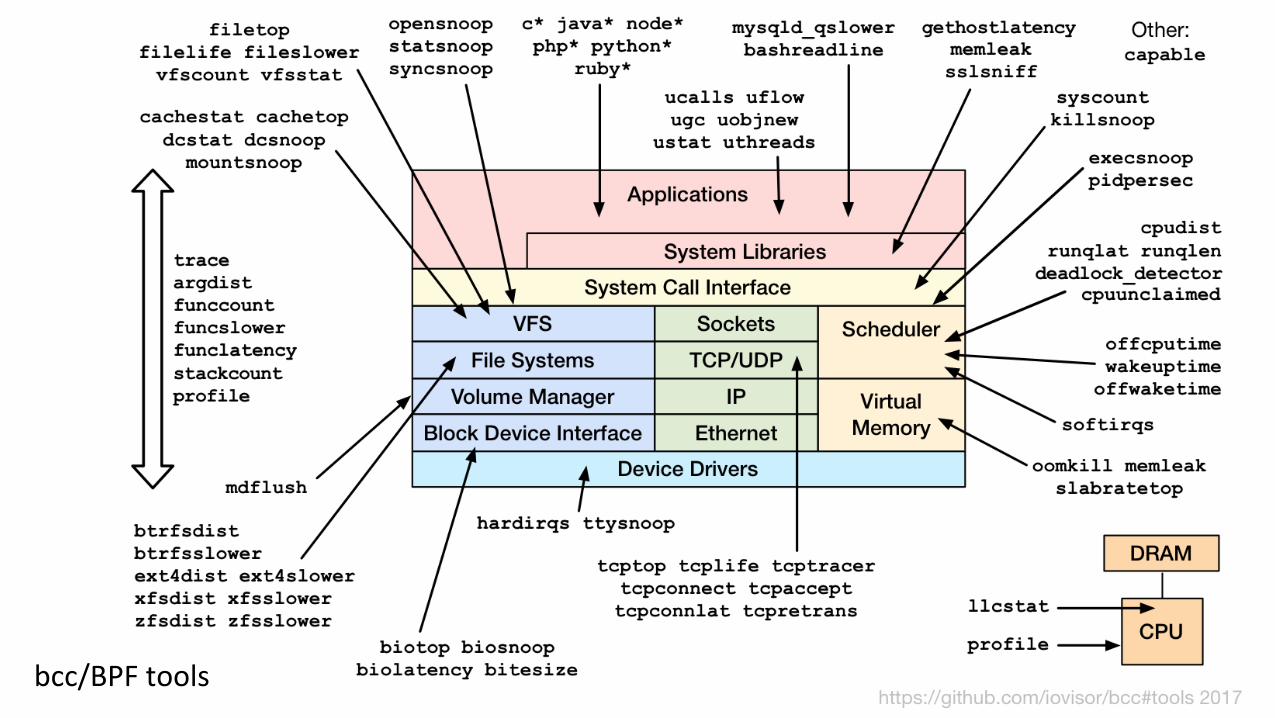
bcc/BPFtools

Enhanced BPF is in Linux
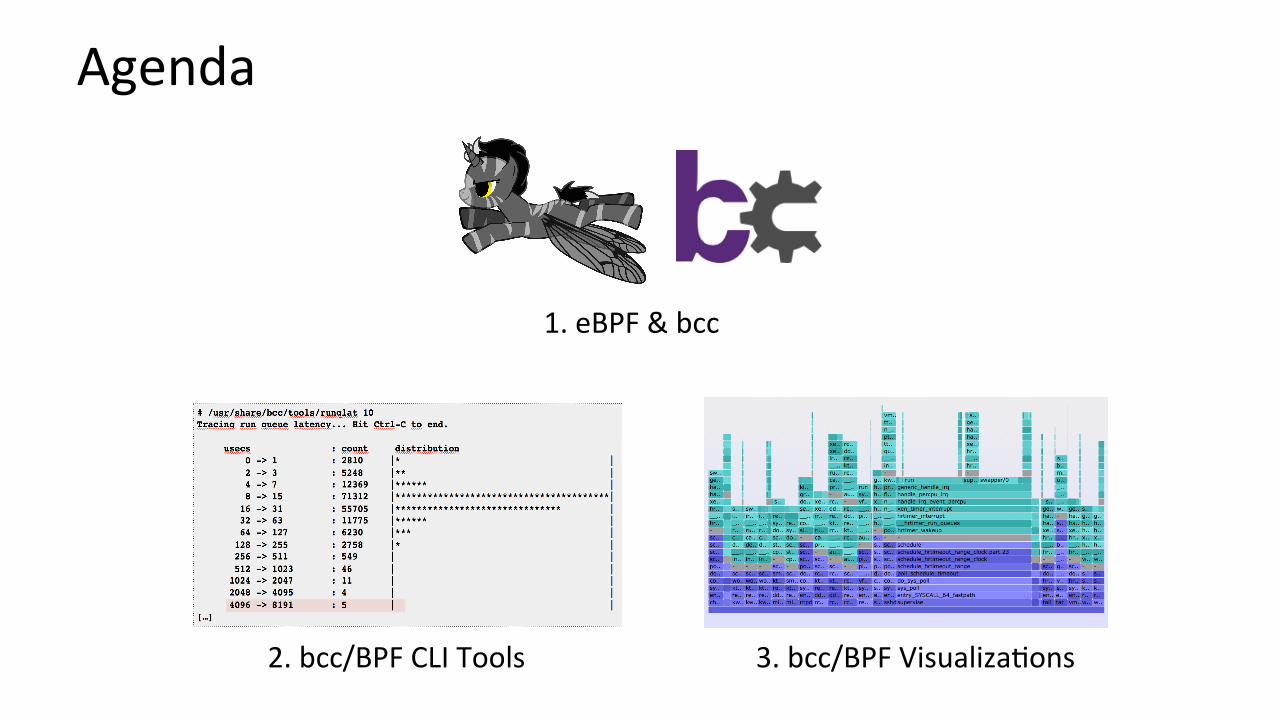
Agenda
1.eBPF&bcc
2.bcc/BPFCLITools 3.bcc/BPFVisualiza?ons
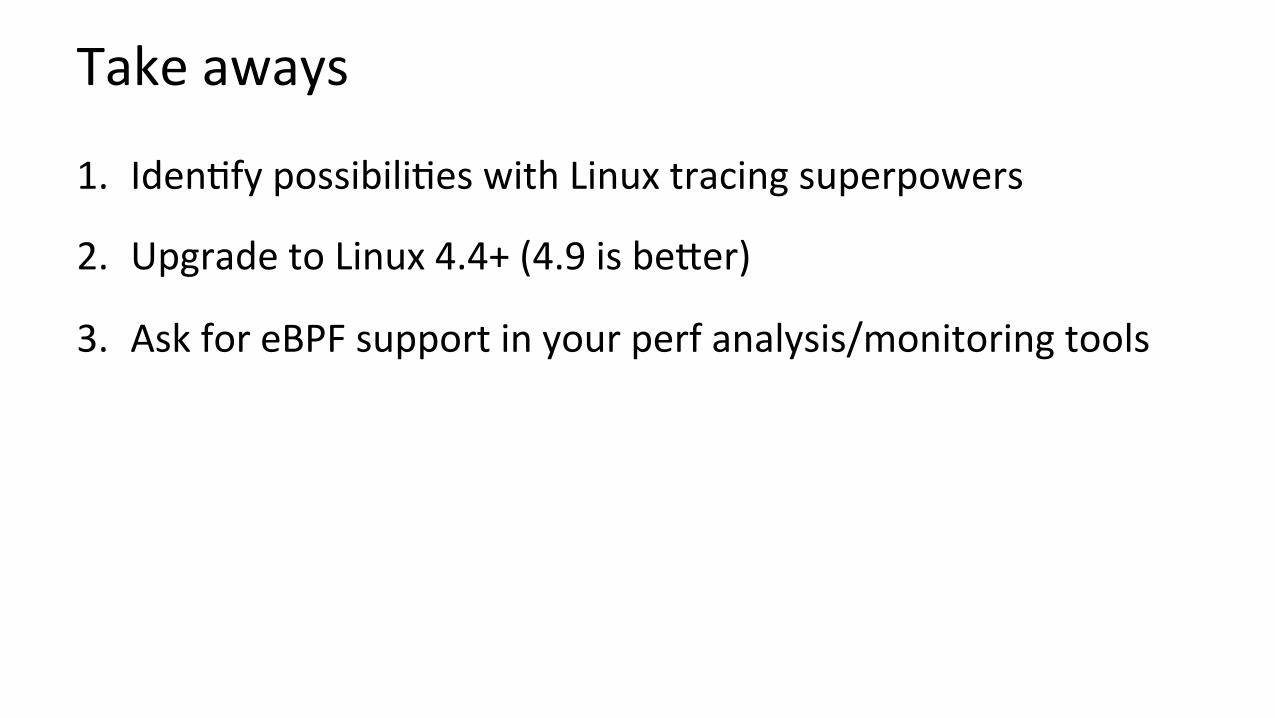
Takeaways
1. Iden?fypossibili?eswithLinuxtracingsuperpowers
2. UpgradetoLinux4.4+(4.9isbeMer)
3. AskforeBPFsupportinyourperfanalysis/monitoringtools

WhoatNeRlixwilluseBPF?

BPFIntroducingenhancedBPFfortracing:kernel-levelsoWware
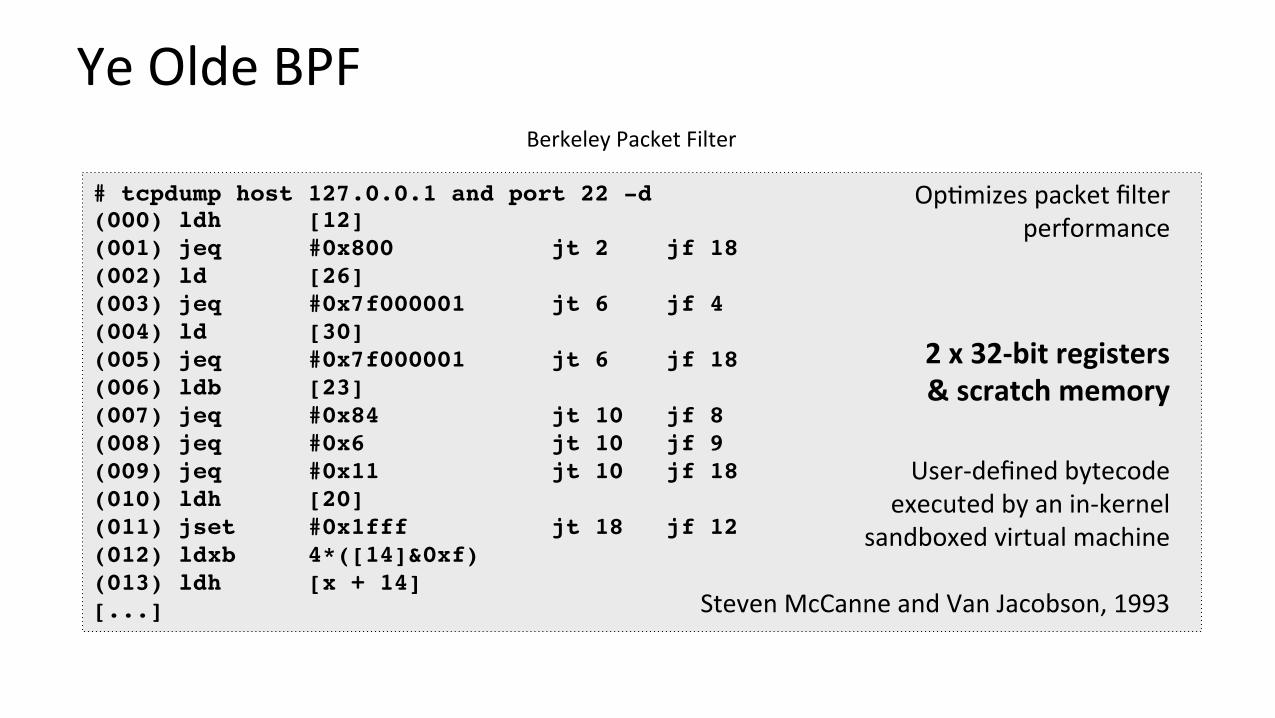
YeOldeBPFBerkeleyPacketFilter
# tcpdump host 127.0.0.1 and port 22 -d(000) ldh [12](001) jeq #0x800 jt 2 jf 18(002) ld [26](003) jeq #0x7f000001 jt 6 jf 4(004) ld [30](005) jeq #0x7f000001 jt 6 jf 18(006) ldb [23](007) jeq #0x84 jt 10 jf 8(008) jeq #0x6 jt 10 jf 9(009) jeq #0x11 jt 10 jf 18(010) ldh [20](011) jset #0x1fff jt 18 jf 12(012) ldxb 4*([14]&0xf)(013) ldh [x + 14][...]
User-definedbytecodeexecutedbyanin-kernel
sandboxedvirtualmachine
StevenMcCanneandVanJacobson,1993
2x32-bitregisters&scratchmemory
Op?mizespacketfilterperformance
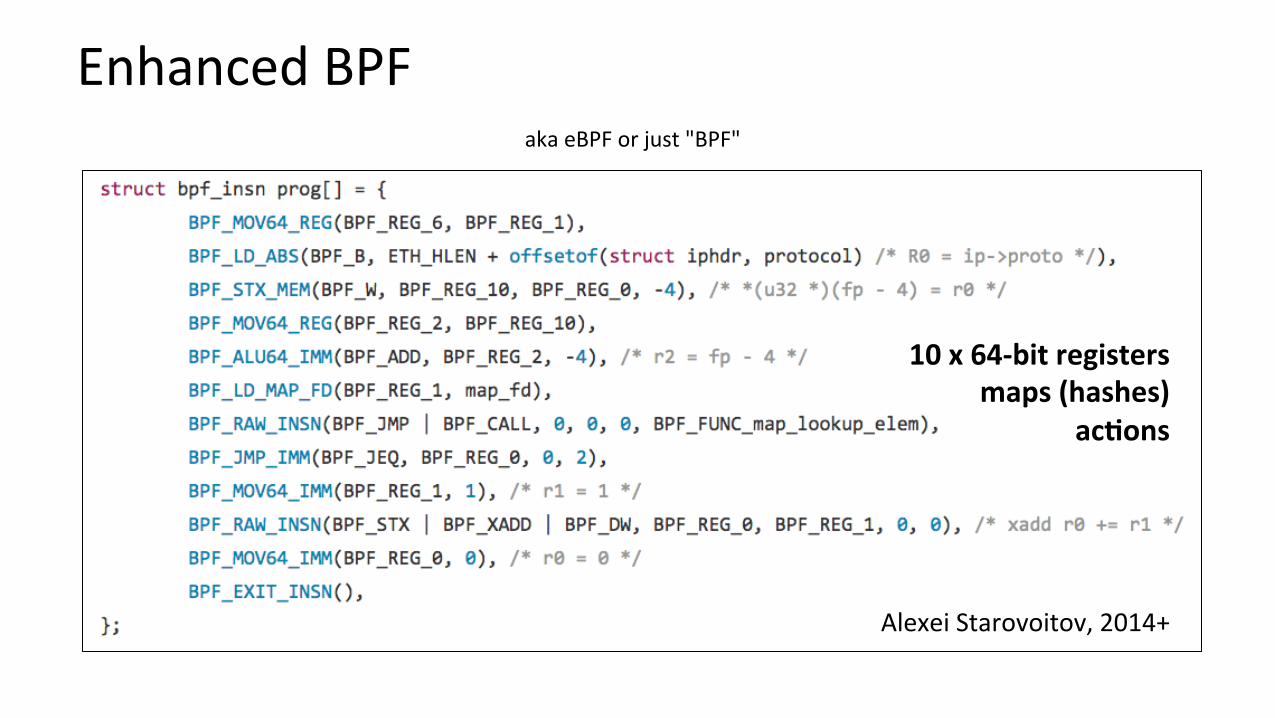
EnhancedBPFakaeBPForjust"BPF"
AlexeiStarovoitov,2014+
10x64-bitregistersmaps(hashes)
ac:ons
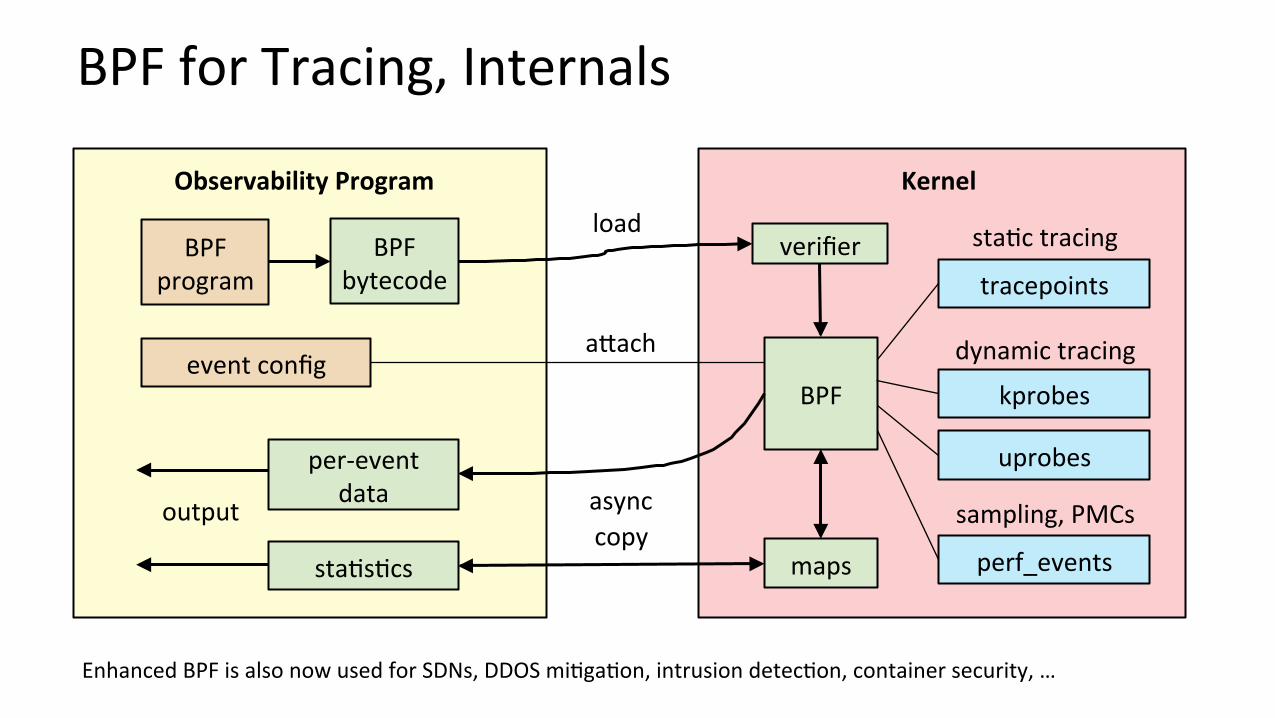
BPFforTracing,Internals
BPFbytecode
ObservabilityProgram Kernel
tracepoints
kprobes
uprobes
BPF
maps
per-eventdata
sta?s?cs
verifier
output
sta?ctracing
dynamictracing
asynccopy
perf_events
sampling,PMCs
BPFprogram
eventconfigaMach
load
EnhancedBPFisalsonowusedforSDNs,DDOSmi?ga?on,intrusiondetec?on,containersecurity,…
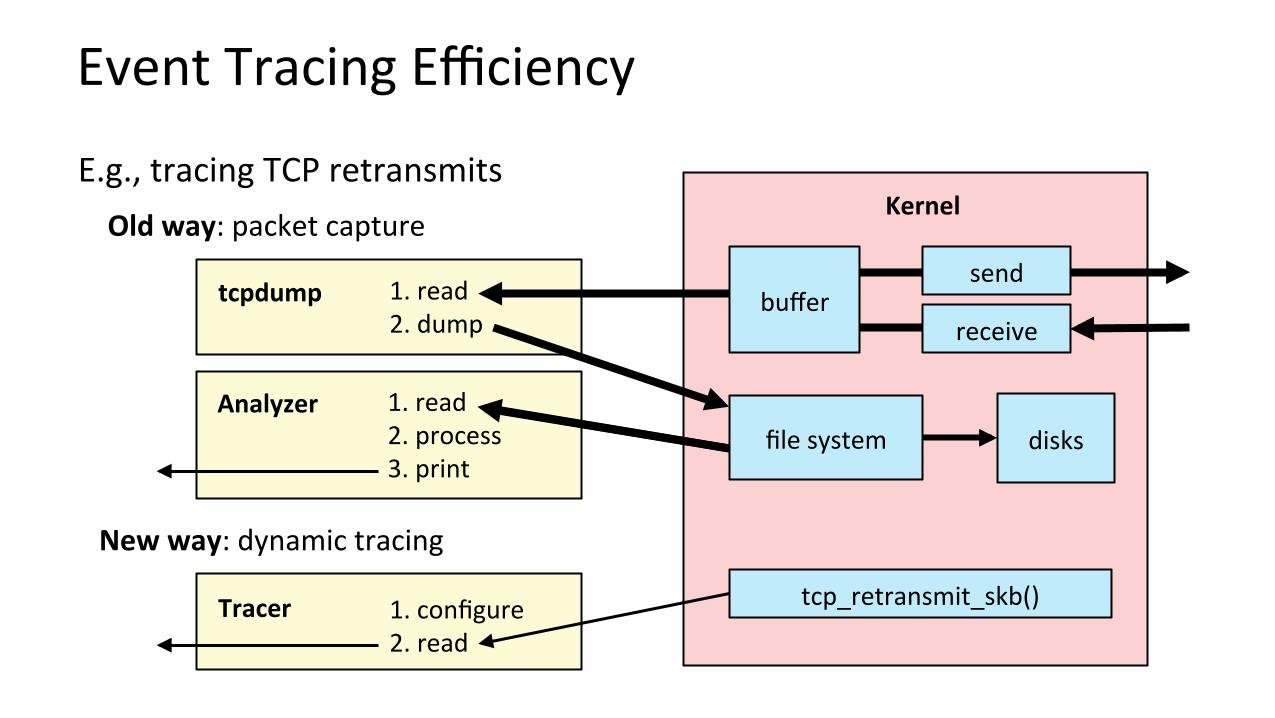
EventTracingEfficiency
send
receivetcpdump
Kernel
buffer
filesystem
1.read2.dump
Analyzer 1.read2.process3.print
disks
Oldway:packetcapture
Newway:dynamictracing
Tracer 1.configure2.read
tcp_retransmit_skb()
E.g.,tracingTCPretransmits
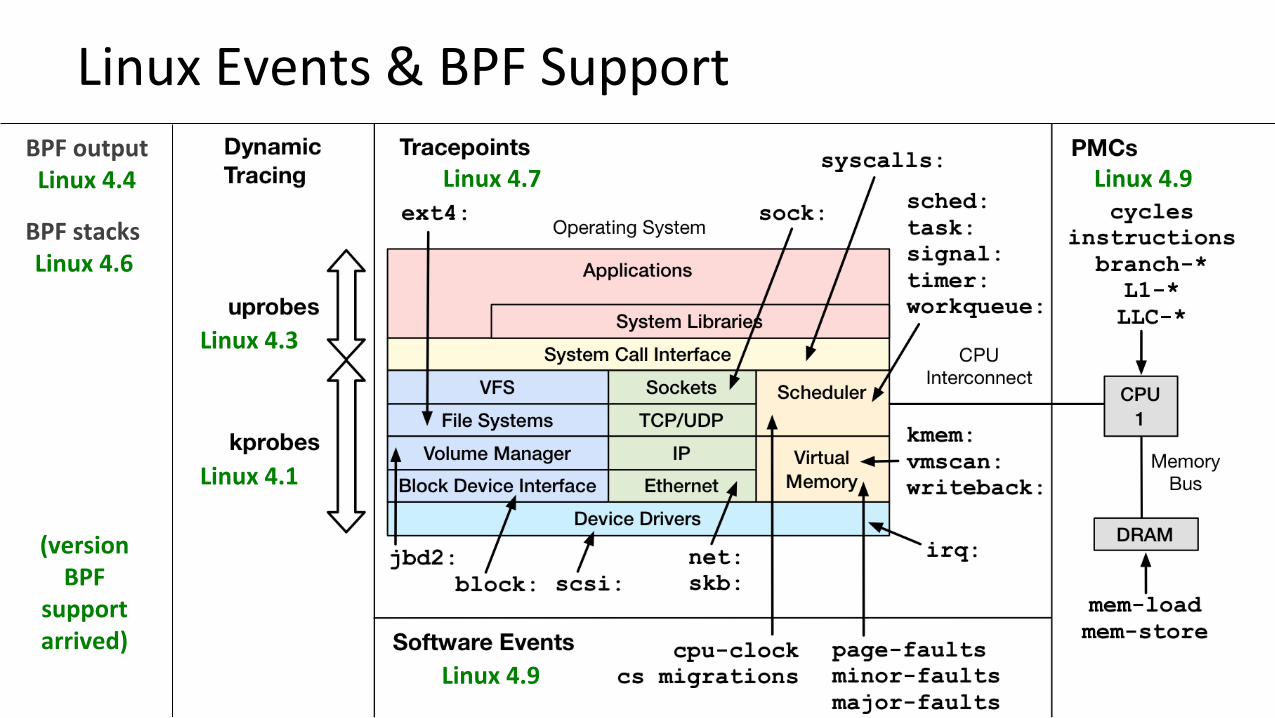
LinuxEvents&BPFSupport
Linux4.3
Linux4.7 Linux4.9
Linux4.9
Linux4.1
BPFstacksLinux4.6
BPFoutputLinux4.4
(versionBPF
supportarrived)
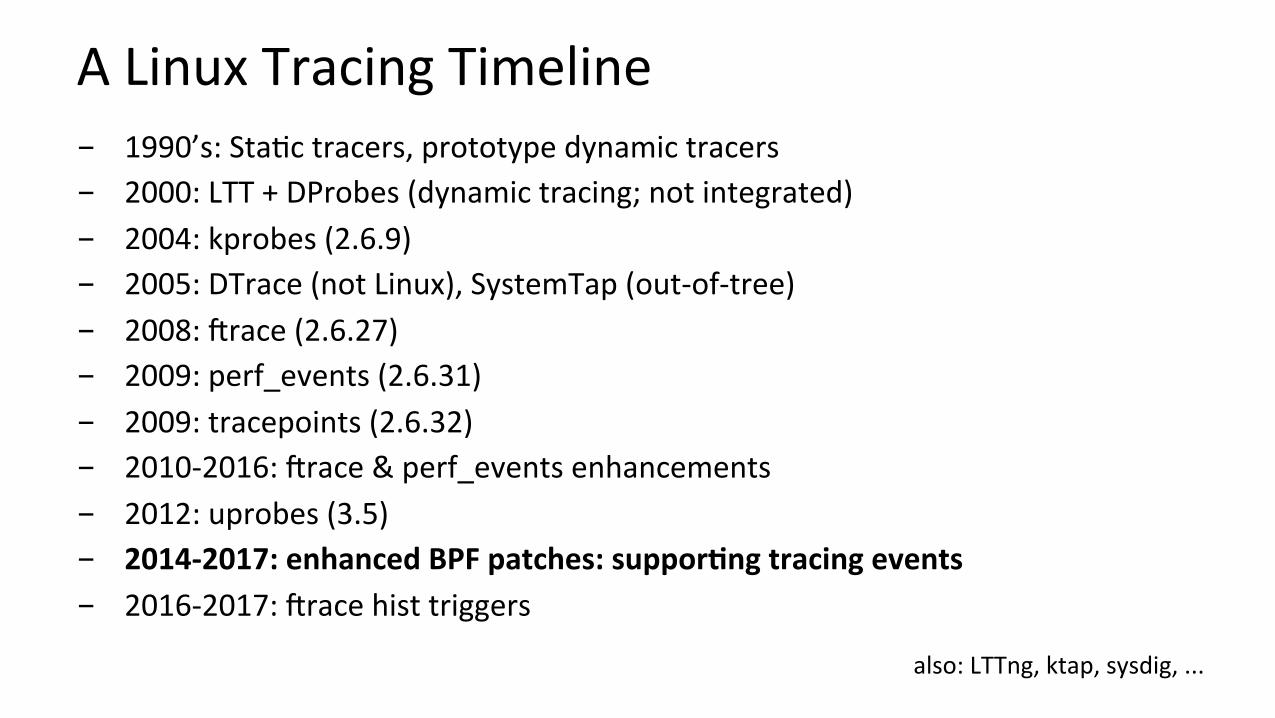
ALinuxTracingTimeline- 1990’s:Sta?ctracers,prototypedynamictracers- 2000:LTT+DProbes(dynamictracing;notintegrated)- 2004:kprobes(2.6.9)- 2005:DTrace(notLinux),SystemTap(out-of-tree)- 2008:Wrace(2.6.27)- 2009:perf_events(2.6.31)- 2009:tracepoints(2.6.32)- 2010-2016:Wrace&perf_eventsenhancements- 2012:uprobes(3.5)- 2014-2017:enhancedBPFpatches:suppor:ngtracingevents- 2016-2017:Wracehisttriggers
also:LTTng,ktap,sysdig,...
BCCIntroducingBPFComplierCollec?on:user-levelsoWware
bcc
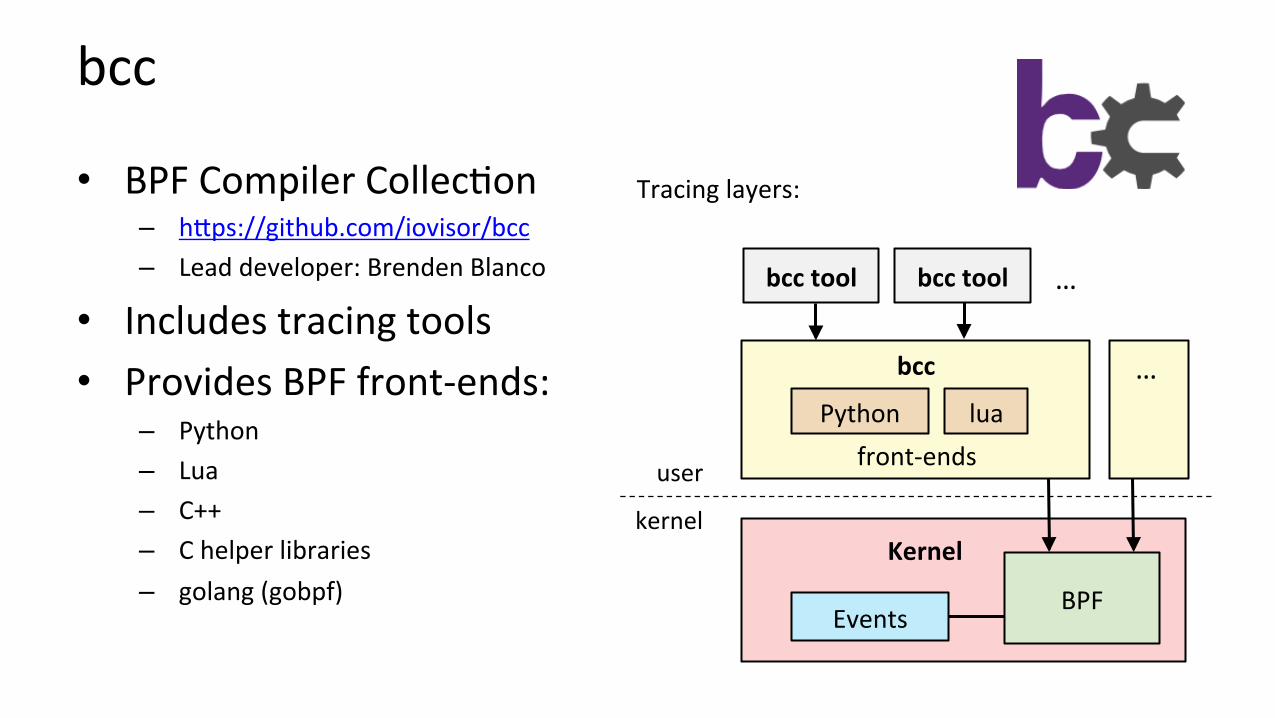
• BPFCompilerCollec?on– hMps://github.com/iovisor/bcc– Leaddeveloper:BrendenBlanco
• Includestracingtools• ProvidesBPFfront-ends:
– Python– Lua– C++– Chelperlibraries– golang(gobpf) BPF
Python
Events
Kernel
lua
bcc
front-ends
bcctool bcctool …
…
user
kernel
Tracinglayers:
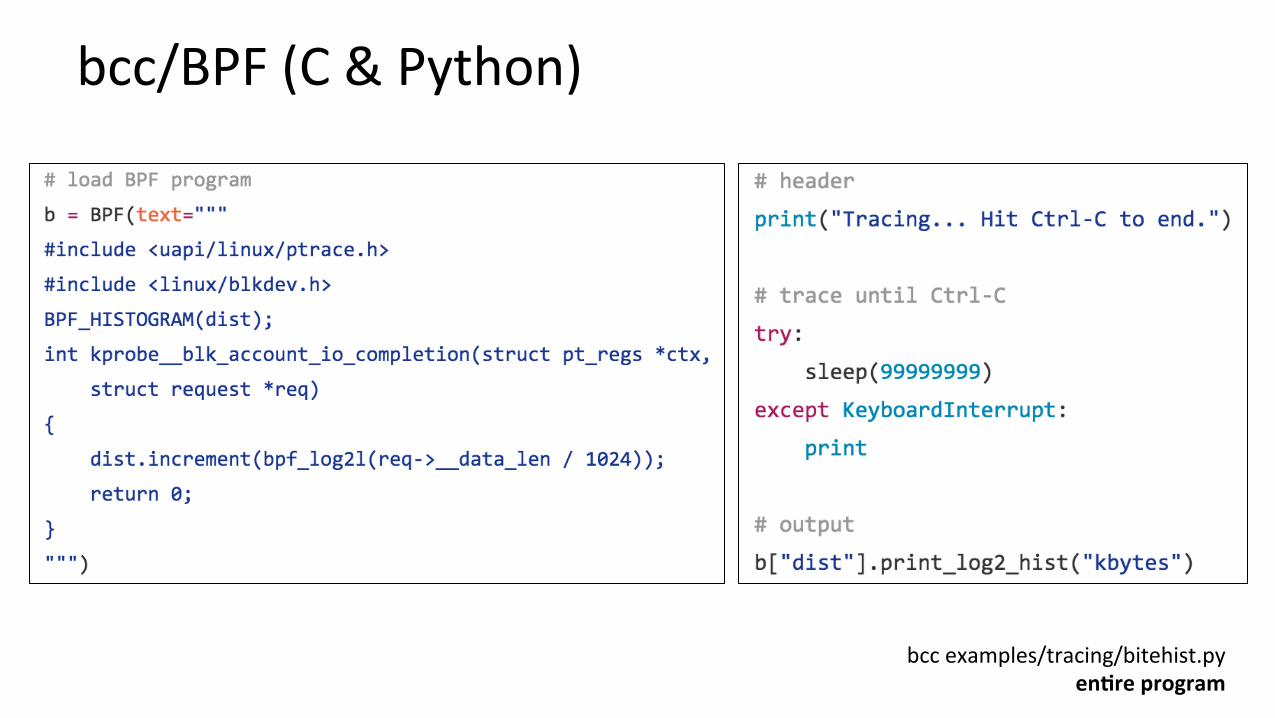
bcc/BPF(C&Python)
bccexamples/tracing/bitehist.pyen:reprogram
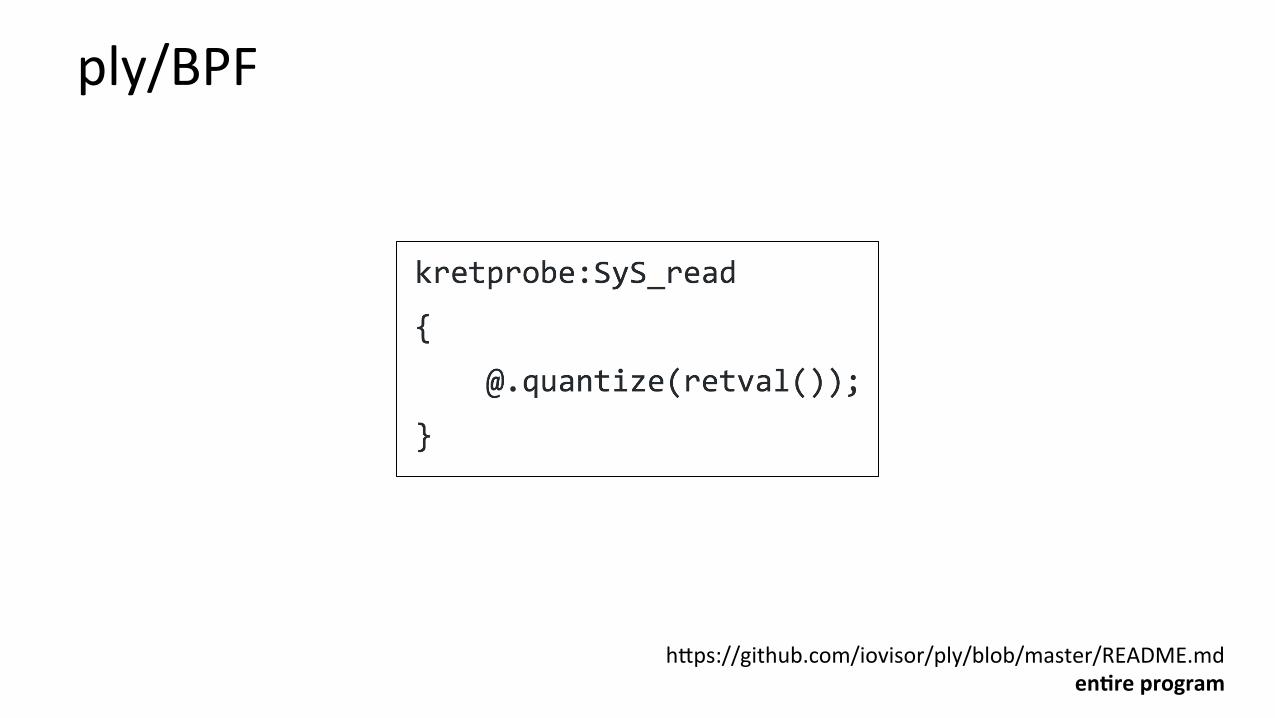
ply/BPF
hMps://github.com/iovisor/ply/blob/master/README.mden:reprogram
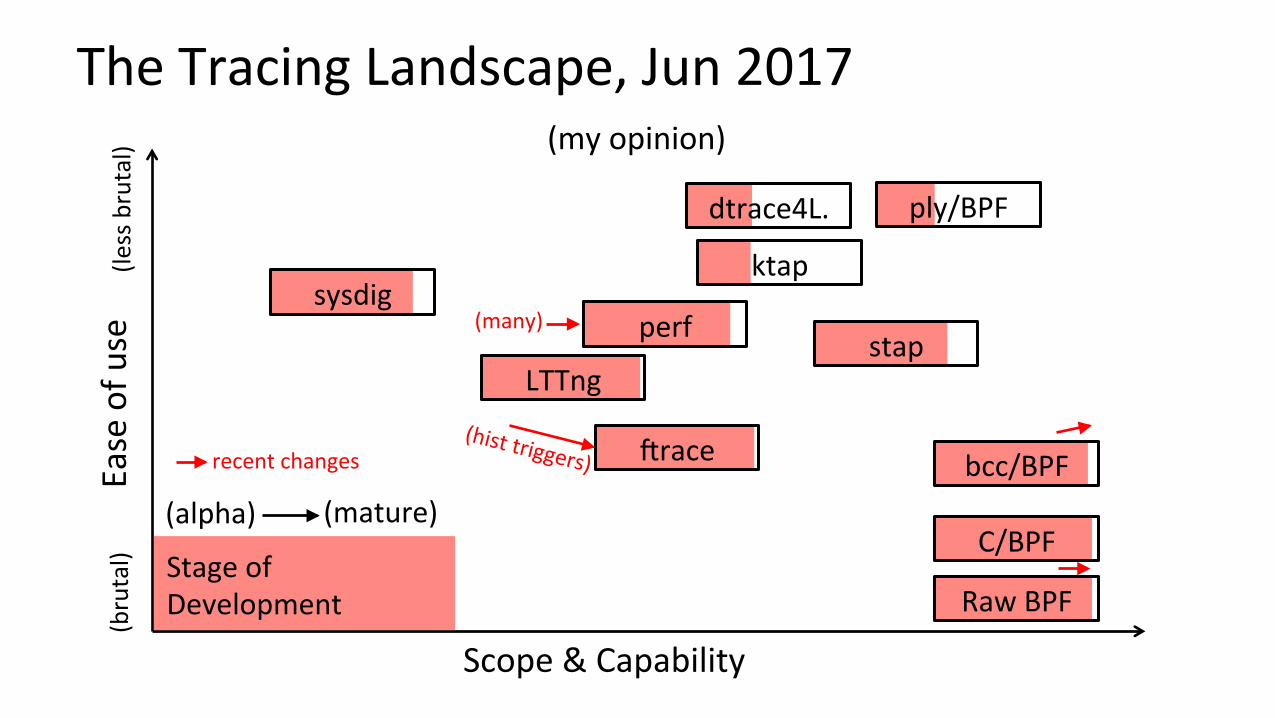
TheTracingLandscape,Jun2017
Scope&Capability
Easeofu
se sysdig
perf
Wrace
C/BPF
ktap
stap
StageofDevelopment
(myopinion)
dtrace4L.
(brutal)
(lessbrutal)
(alpha) (mature)bcc/BPF
ply/BPF
RawBPF
LTTng(histtriggers)recentchanges
(many)

BCC/BPFCLITOOLSPerformanceanalysis
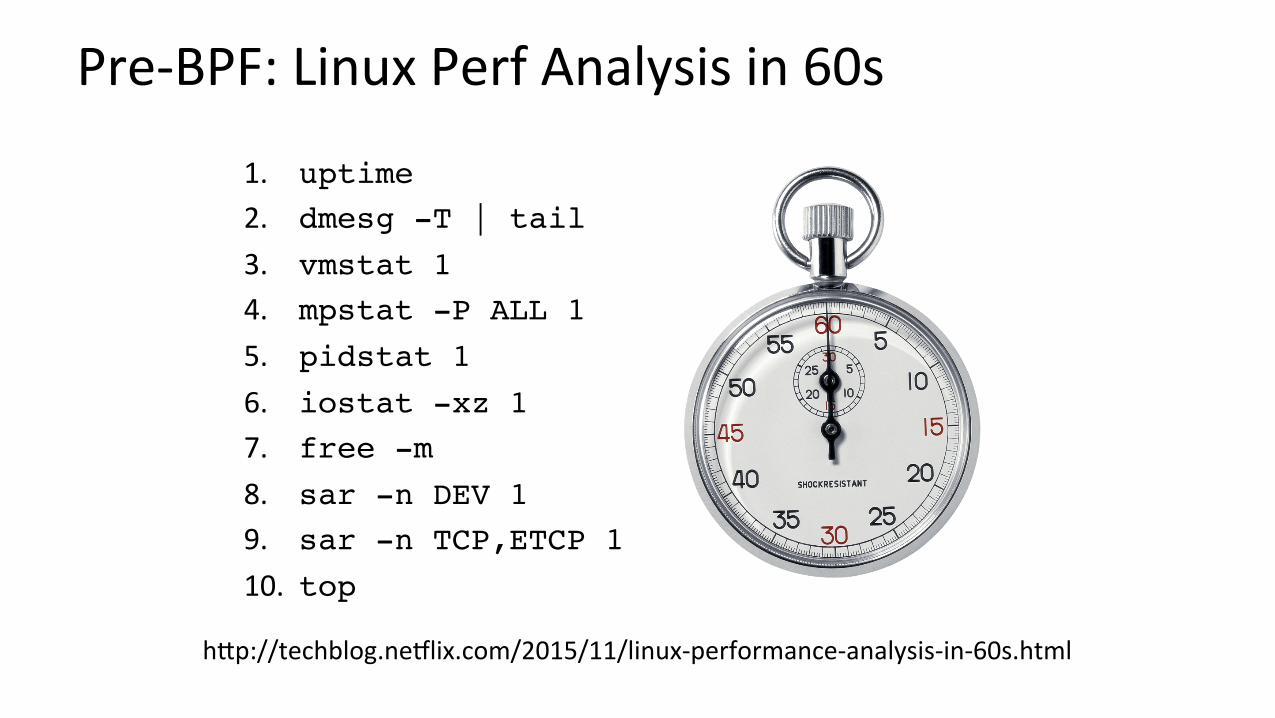
Pre-BPF:LinuxPerfAnalysisin60s
1. uptime2. dmesg -T | tail3. vmstat 14. mpstat -P ALL 15. pidstat 16. iostat -xz 17. free -m8. sar -n DEV 19. sar -n TCP,ETCP 110. top
hMp://techblog.neRlix.com/2015/11/linux-performance-analysis-in-60s.html
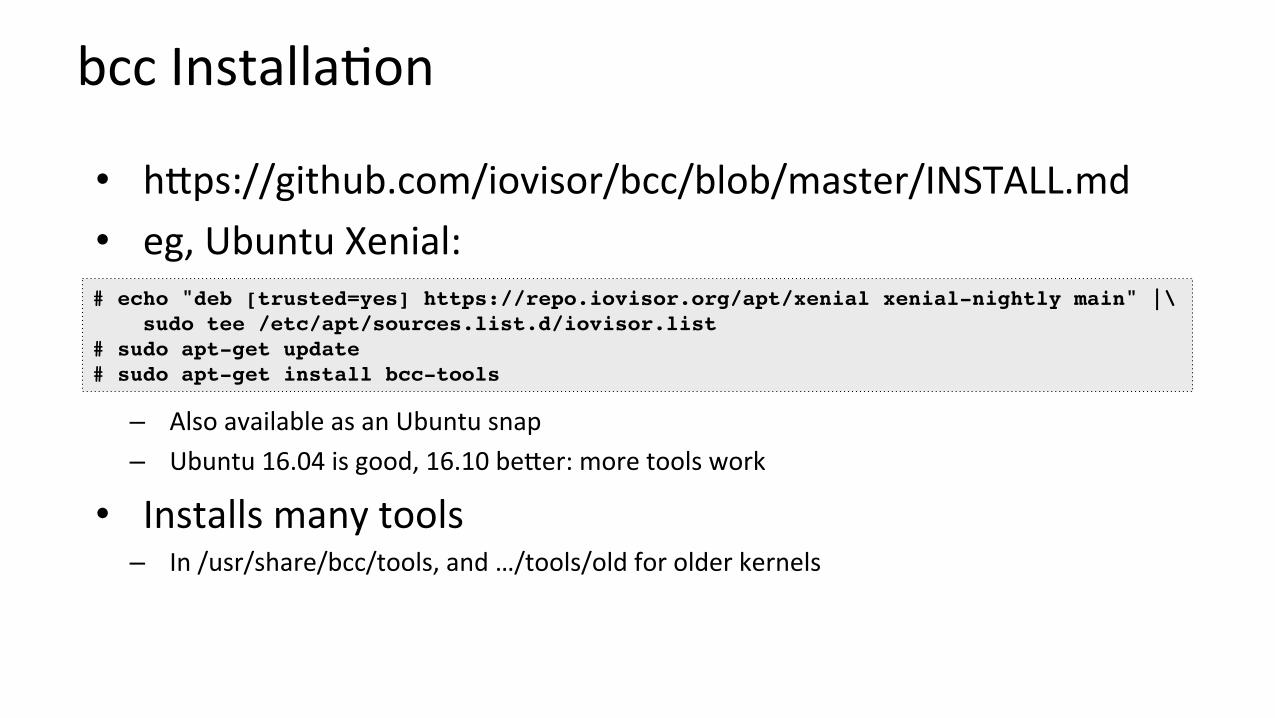
bccInstalla?on
• hMps://github.com/iovisor/bcc/blob/master/INSTALL.md• eg,UbuntuXenial:
– AlsoavailableasanUbuntusnap– Ubuntu16.04isgood,16.10beMer:moretoolswork
• Installsmanytools– In/usr/share/bcc/tools,and…/tools/oldforolderkernels
# echo "deb [trusted=yes] https://repo.iovisor.org/apt/xenial xenial-nightly main" |\ sudo tee /etc/apt/sources.list.d/iovisor.list# sudo apt-get update# sudo apt-get install bcc-tools
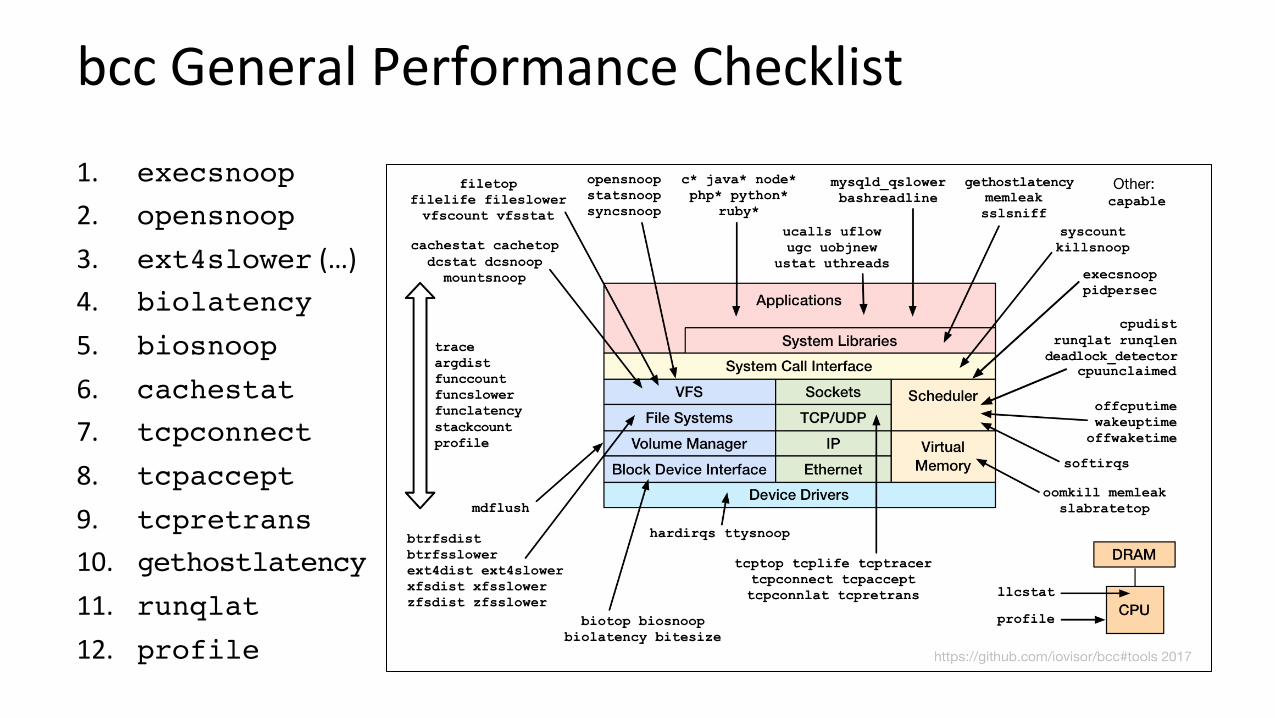
bccGeneralPerformanceChecklist
1. execsnoop2. opensnoop3. ext4slower(…)4. biolatency5. biosnoop6. cachestat7. tcpconnect8. tcpaccept9. tcpretrans10. gethostlatency11. runqlat12. profile
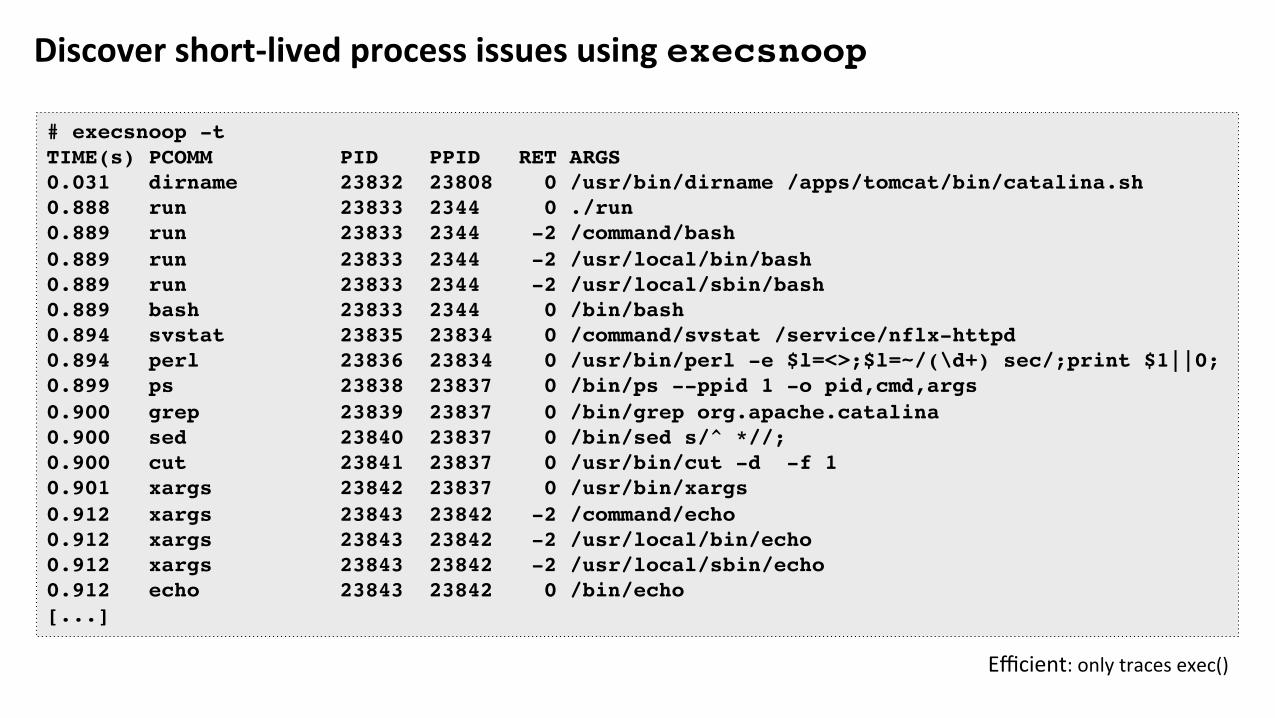
Discovershort-livedprocessissuesusingexecsnoop
# execsnoop -tTIME(s) PCOMM PID PPID RET ARGS0.031 dirname 23832 23808 0 /usr/bin/dirname /apps/tomcat/bin/catalina.sh0.888 run 23833 2344 0 ./run0.889 run 23833 2344 -2 /command/bash 0.889 run 23833 2344 -2 /usr/local/bin/bash 0.889 run 23833 2344 -2 /usr/local/sbin/bash 0.889 bash 23833 2344 0 /bin/bash 0.894 svstat 23835 23834 0 /command/svstat /service/nflx-httpd0.894 perl 23836 23834 0 /usr/bin/perl -e $l=<>;$l=~/(\d+) sec/;print $1||0;0.899 ps 23838 23837 0 /bin/ps --ppid 1 -o pid,cmd,args0.900 grep 23839 23837 0 /bin/grep org.apache.catalina0.900 sed 23840 23837 0 /bin/sed s/^ *//;0.900 cut 23841 23837 0 /usr/bin/cut -d -f 10.901 xargs 23842 23837 0 /usr/bin/xargs0.912 xargs 23843 23842 -2 /command/echo0.912 xargs 23843 23842 -2 /usr/local/bin/echo0.912 xargs 23843 23842 -2 /usr/local/sbin/echo0.912 echo 23843 23842 0 /bin/echo[...]
Efficient:onlytracesexec()
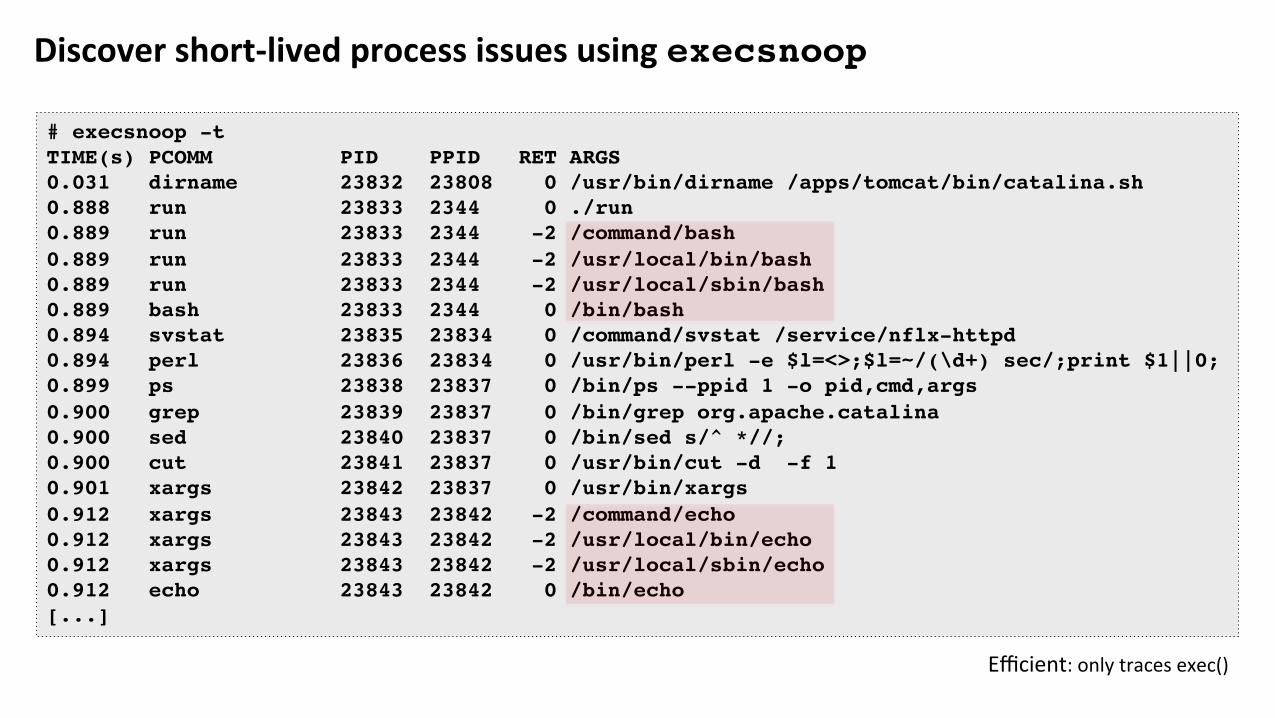
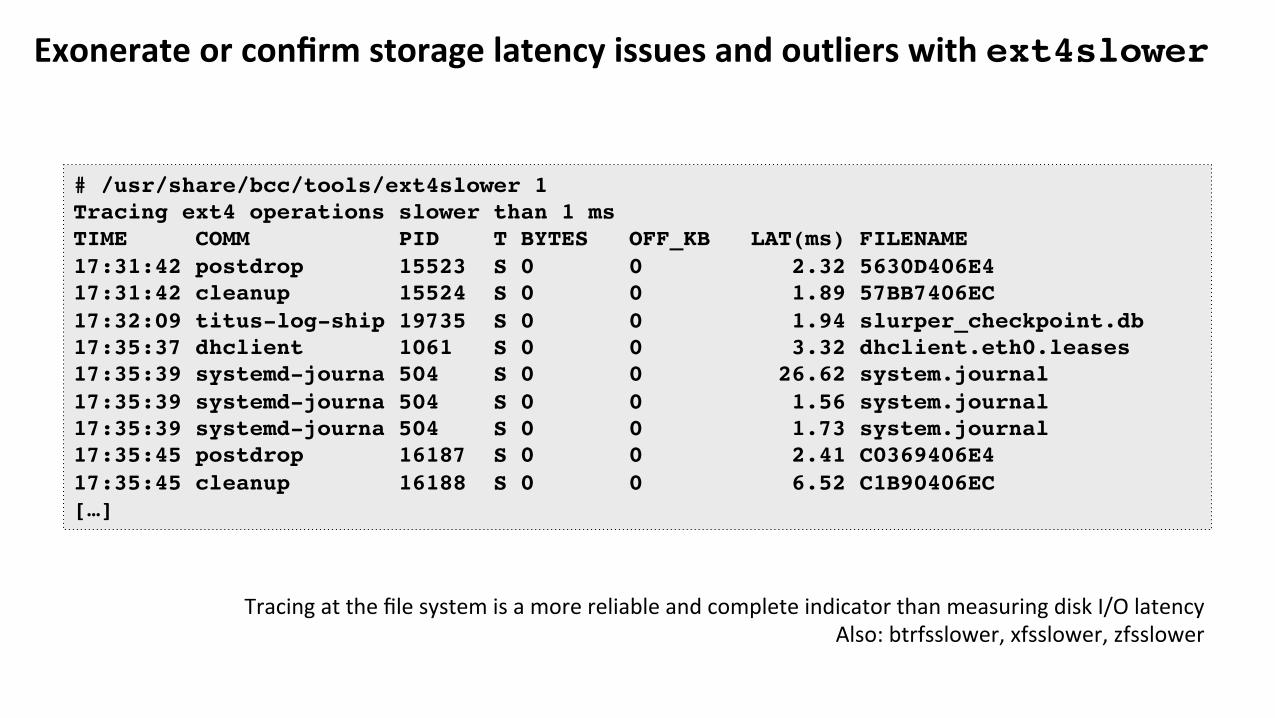
Exonerateorconfirmstoragelatencyissuesandoutlierswithext4slower
# /usr/share/bcc/tools/ext4slower 1Tracing ext4 operations slower than 1 msTIME COMM PID T BYTES OFF_KB LAT(ms) FILENAME17:31:42 postdrop 15523 S 0 0 2.32 5630D406E417:31:42 cleanup 15524 S 0 0 1.89 57BB7406EC17:32:09 titus-log-ship 19735 S 0 0 1.94 slurper_checkpoint.db17:35:37 dhclient 1061 S 0 0 3.32 dhclient.eth0.leases17:35:39 systemd-journa 504 S 0 0 26.62 system.journal17:35:39 systemd-journa 504 S 0 0 1.56 system.journal17:35:39 systemd-journa 504 S 0 0 1.73 system.journal17:35:45 postdrop 16187 S 0 0 2.41 C0369406E417:35:45 cleanup 16188 S 0 0 6.52 C1B90406EC[…]
TracingatthefilesystemisamorereliableandcompleteindicatorthanmeasuringdiskI/OlatencyAlso:btrfsslower,xfsslower,zfsslower
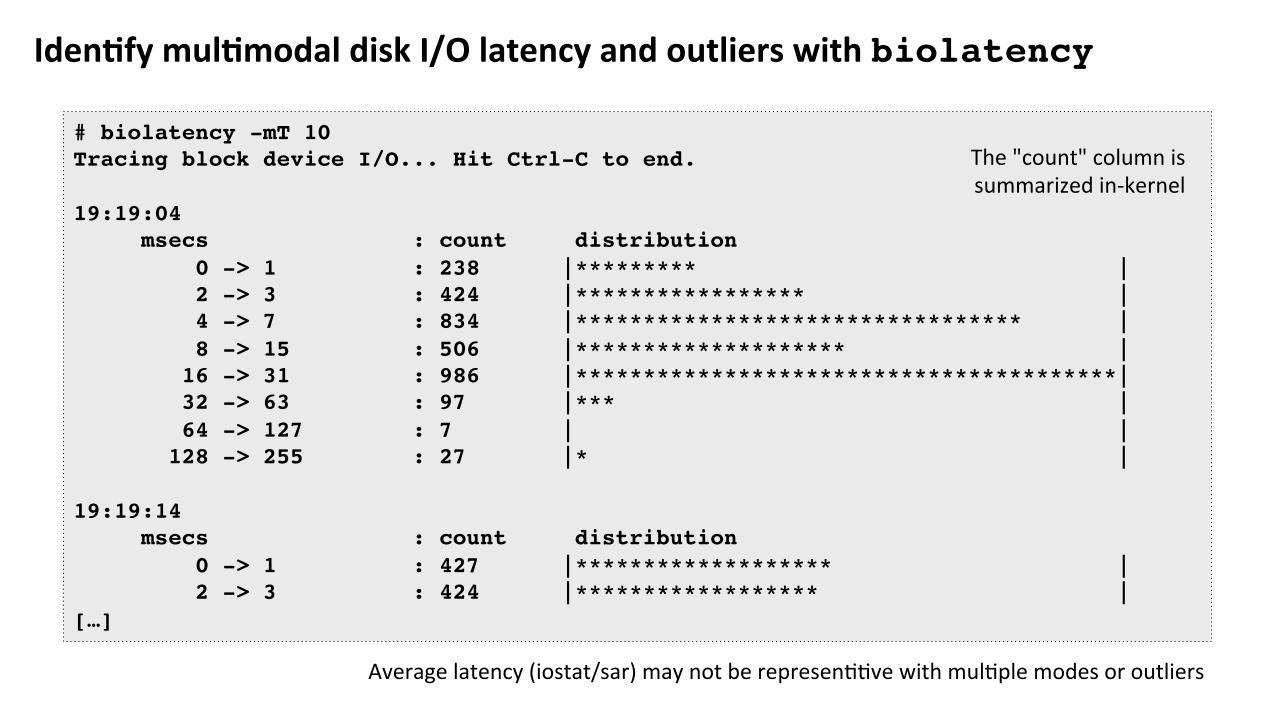
Iden:fymul:modaldiskI/Olatencyandoutlierswithbiolatency
# biolatency -mT 10Tracing block device I/O... Hit Ctrl-C to end.
19:19:04 msecs : count distribution 0 -> 1 : 238 |********* | 2 -> 3 : 424 |***************** | 4 -> 7 : 834 |********************************* | 8 -> 15 : 506 |******************** | 16 -> 31 : 986 |****************************************| 32 -> 63 : 97 |*** | 64 -> 127 : 7 | | 128 -> 255 : 27 |* |
19:19:14 msecs : count distribution 0 -> 1 : 427 |******************* | 2 -> 3 : 424 |****************** |[…]
Averagelatency(iostat/sar)maynotberepresen??vewithmul?plemodesoroutliers
The"count"columnissummarizedin-kernel
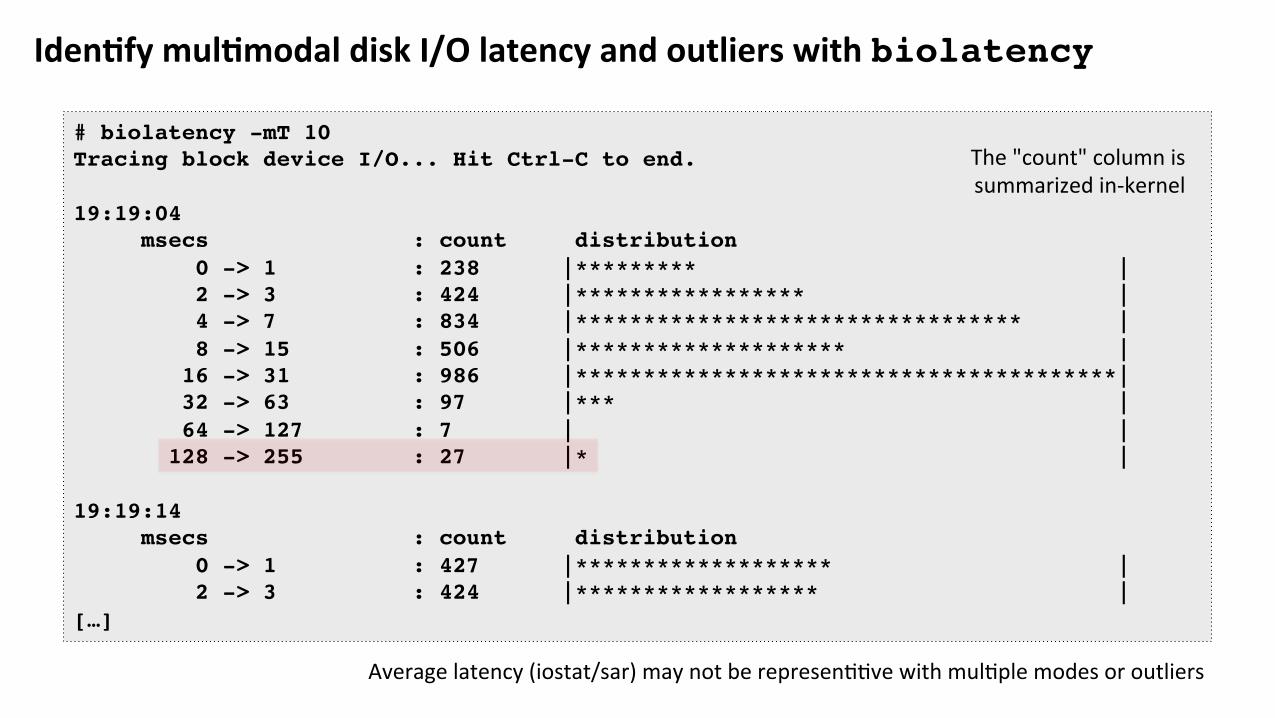
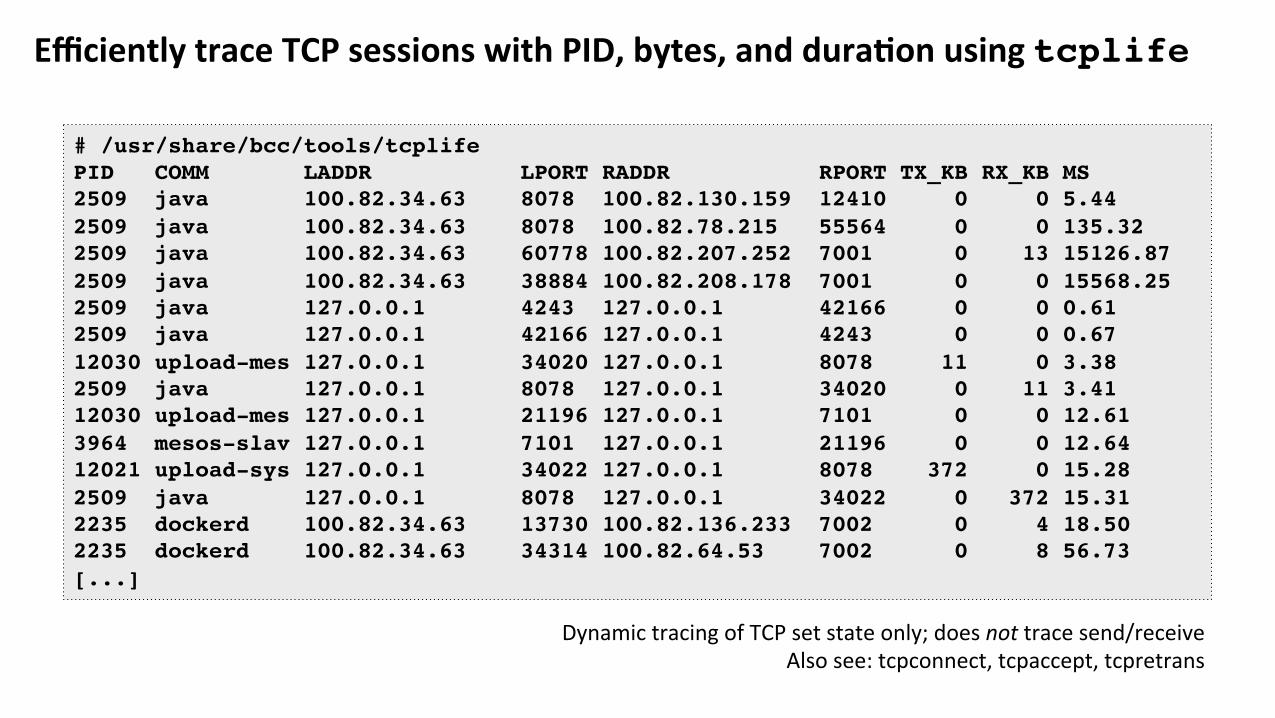
EfficientlytraceTCPsessionswithPID,bytes,anddura:onusingtcplife
# /usr/share/bcc/tools/tcplifePID COMM LADDR LPORT RADDR RPORT TX_KB RX_KB MS2509 java 100.82.34.63 8078 100.82.130.159 12410 0 0 5.442509 java 100.82.34.63 8078 100.82.78.215 55564 0 0 135.322509 java 100.82.34.63 60778 100.82.207.252 7001 0 13 15126.872509 java 100.82.34.63 38884 100.82.208.178 7001 0 0 15568.252509 java 127.0.0.1 4243 127.0.0.1 42166 0 0 0.612509 java 127.0.0.1 42166 127.0.0.1 4243 0 0 0.6712030 upload-mes 127.0.0.1 34020 127.0.0.1 8078 11 0 3.382509 java 127.0.0.1 8078 127.0.0.1 34020 0 11 3.4112030 upload-mes 127.0.0.1 21196 127.0.0.1 7101 0 0 12.613964 mesos-slav 127.0.0.1 7101 127.0.0.1 21196 0 0 12.6412021 upload-sys 127.0.0.1 34022 127.0.0.1 8078 372 0 15.282509 java 127.0.0.1 8078 127.0.0.1 34022 0 372 15.312235 dockerd 100.82.34.63 13730 100.82.136.233 7002 0 4 18.502235 dockerd 100.82.34.63 34314 100.82.64.53 7002 0 8 56.73[...]
DynamictracingofTCPsetstateonly;doesnottracesend/receiveAlsosee:tcpconnect,tcpaccept,tcpretrans
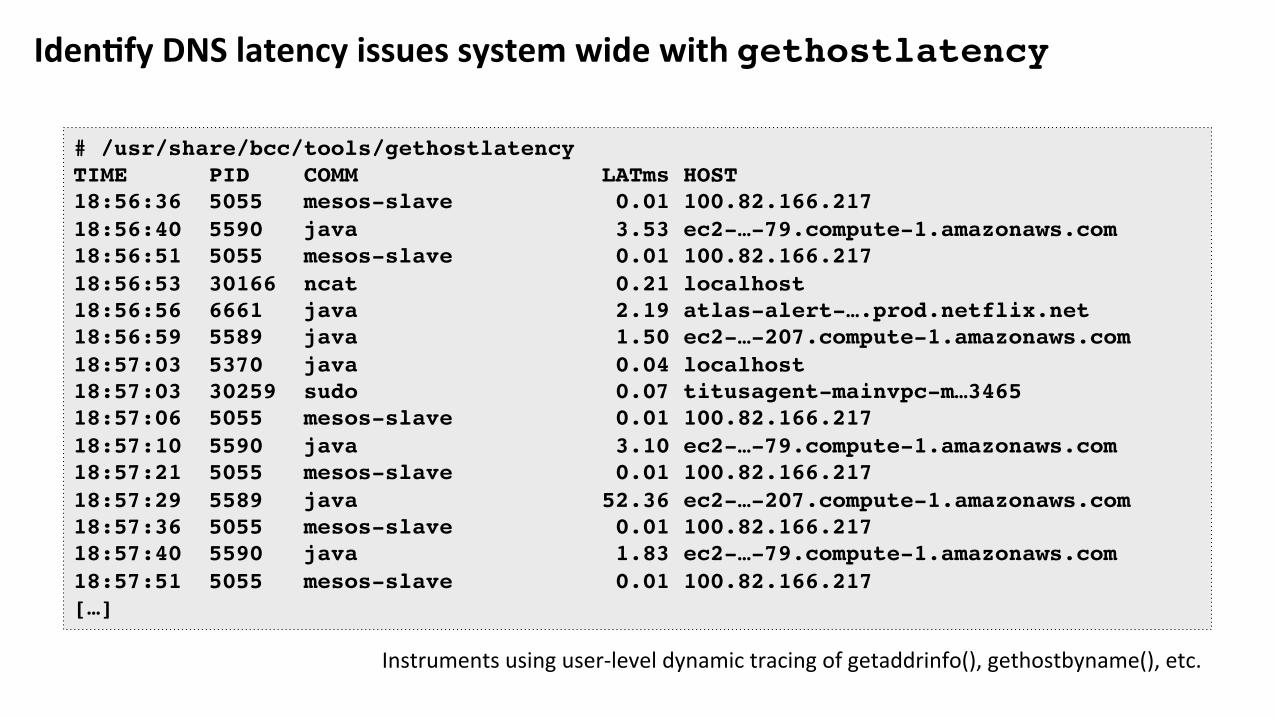
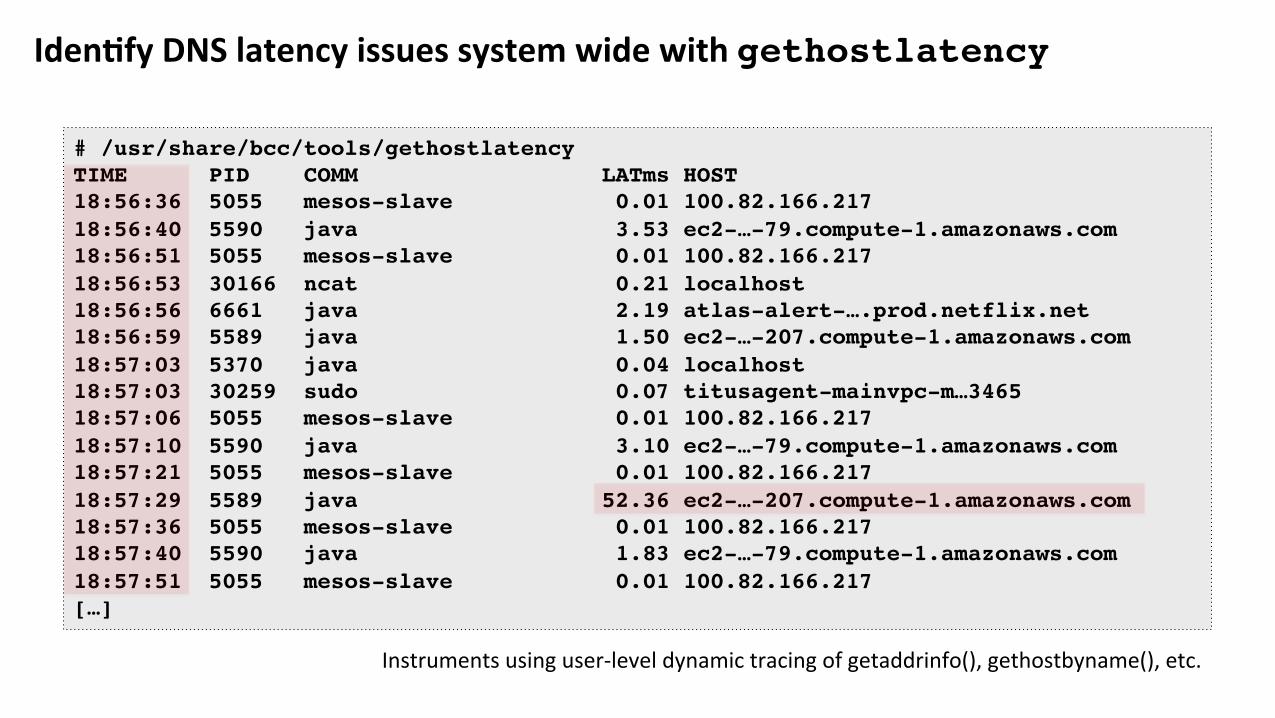
Iden:fyDNSlatencyissuessystemwidewithgethostlatency
# /usr/share/bcc/tools/gethostlatencyTIME PID COMM LATms HOST18:56:36 5055 mesos-slave 0.01 100.82.166.21718:56:40 5590 java 3.53 ec2-…-79.compute-1.amazonaws.com18:56:51 5055 mesos-slave 0.01 100.82.166.21718:56:53 30166 ncat 0.21 localhost18:56:56 6661 java 2.19 atlas-alert-….prod.netflix.net18:56:59 5589 java 1.50 ec2-…-207.compute-1.amazonaws.com18:57:03 5370 java 0.04 localhost18:57:03 30259 sudo 0.07 titusagent-mainvpc-m…346518:57:06 5055 mesos-slave 0.01 100.82.166.21718:57:10 5590 java 3.10 ec2-…-79.compute-1.amazonaws.com18:57:21 5055 mesos-slave 0.01 100.82.166.21718:57:29 5589 java 52.36 ec2-…-207.compute-1.amazonaws.com18:57:36 5055 mesos-slave 0.01 100.82.166.21718:57:40 5590 java 1.83 ec2-…-79.compute-1.amazonaws.com18:57:51 5055 mesos-slave 0.01 100.82.166.217[…]
Instrumentsusinguser-leveldynamictracingofgetaddrinfo(),gethostbyname(),etc.
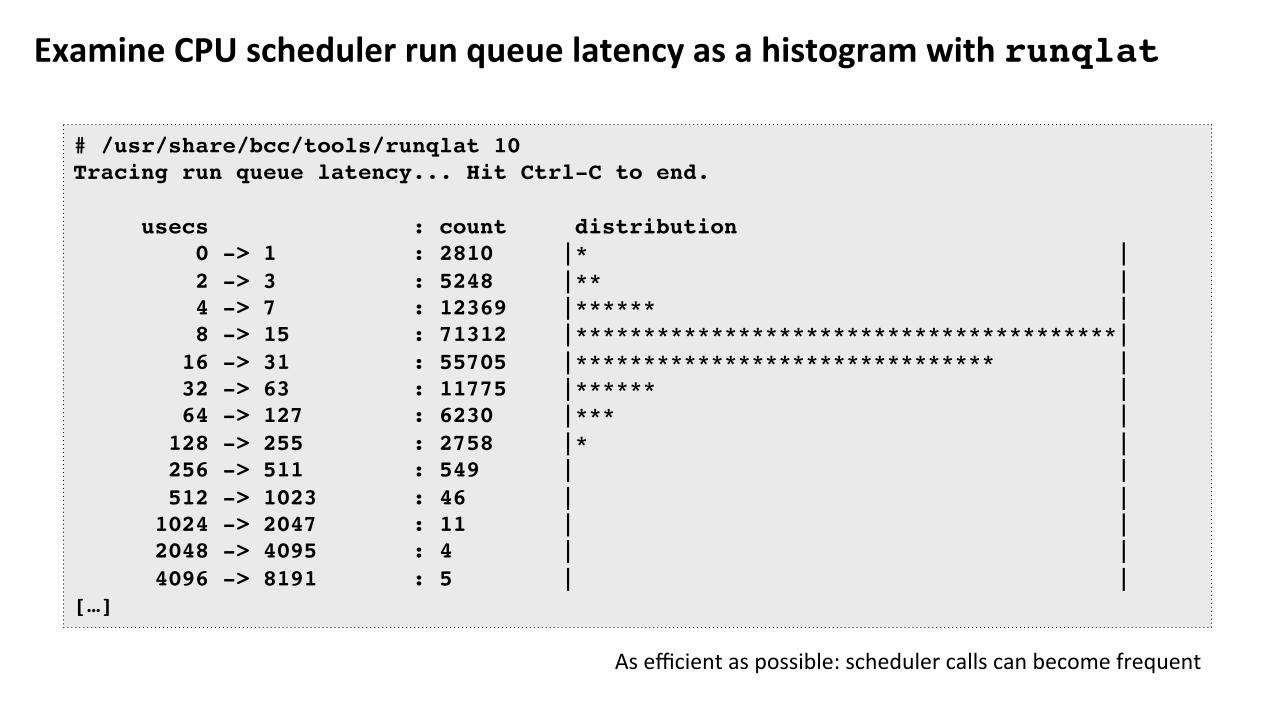
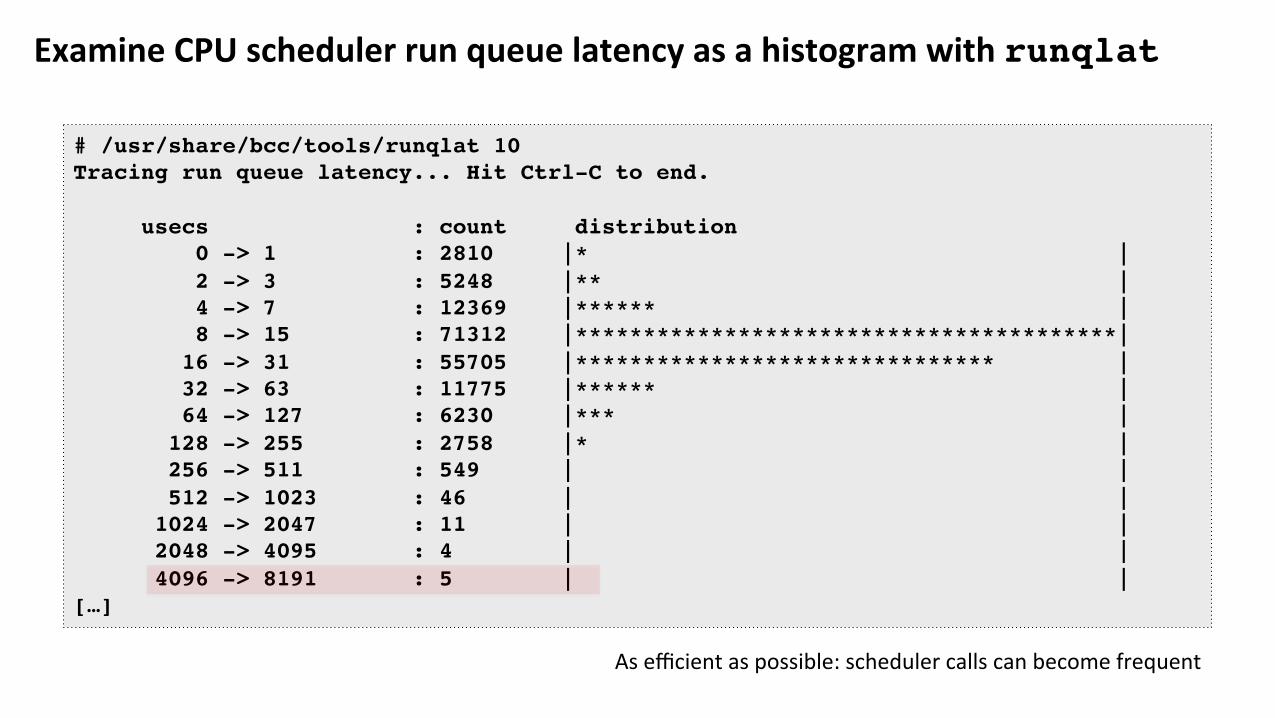
ExamineCPUschedulerrunqueuelatencyasahistogramwithrunqlat
# /usr/share/bcc/tools/runqlat 10Tracing run queue latency... Hit Ctrl-C to end.
usecs : count distribution 0 -> 1 : 2810 |* | 2 -> 3 : 5248 |** | 4 -> 7 : 12369 |****** | 8 -> 15 : 71312 |****************************************| 16 -> 31 : 55705 |******************************* | 32 -> 63 : 11775 |****** | 64 -> 127 : 6230 |*** | 128 -> 255 : 2758 |* | 256 -> 511 : 549 | | 512 -> 1023 : 46 | | 1024 -> 2047 : 11 | | 2048 -> 4095 : 4 | | 4096 -> 8191 : 5 | |[…]
Asefficientaspossible:schedulercallscanbecomefrequent
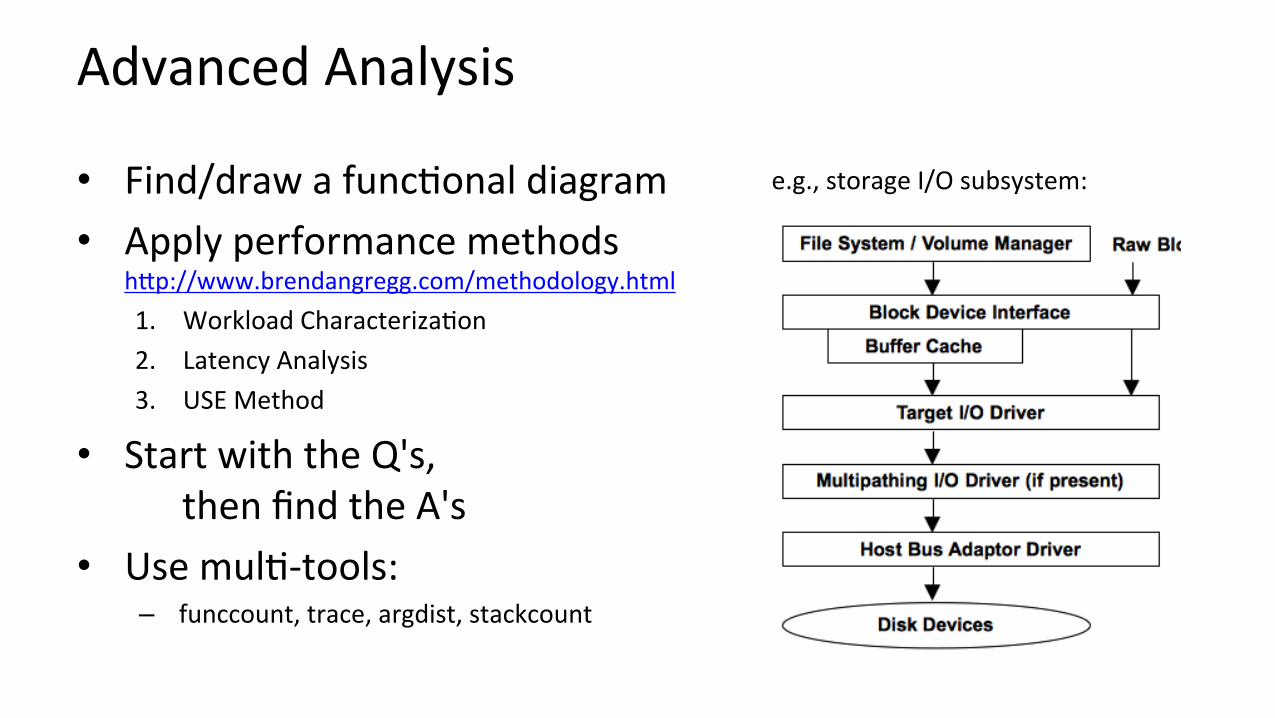
AdvancedAnalysis
• Find/drawafunc?onaldiagram• Applyperformancemethods
hMp://www.brendangregg.com/methodology.html1. WorkloadCharacteriza?on2. LatencyAnalysis3. USEMethod
• StartwiththeQ's,thenfindtheA's
• Usemul?-tools:– funccount,trace,argdist,stackcount
e.g.,storageI/Osubsystem:
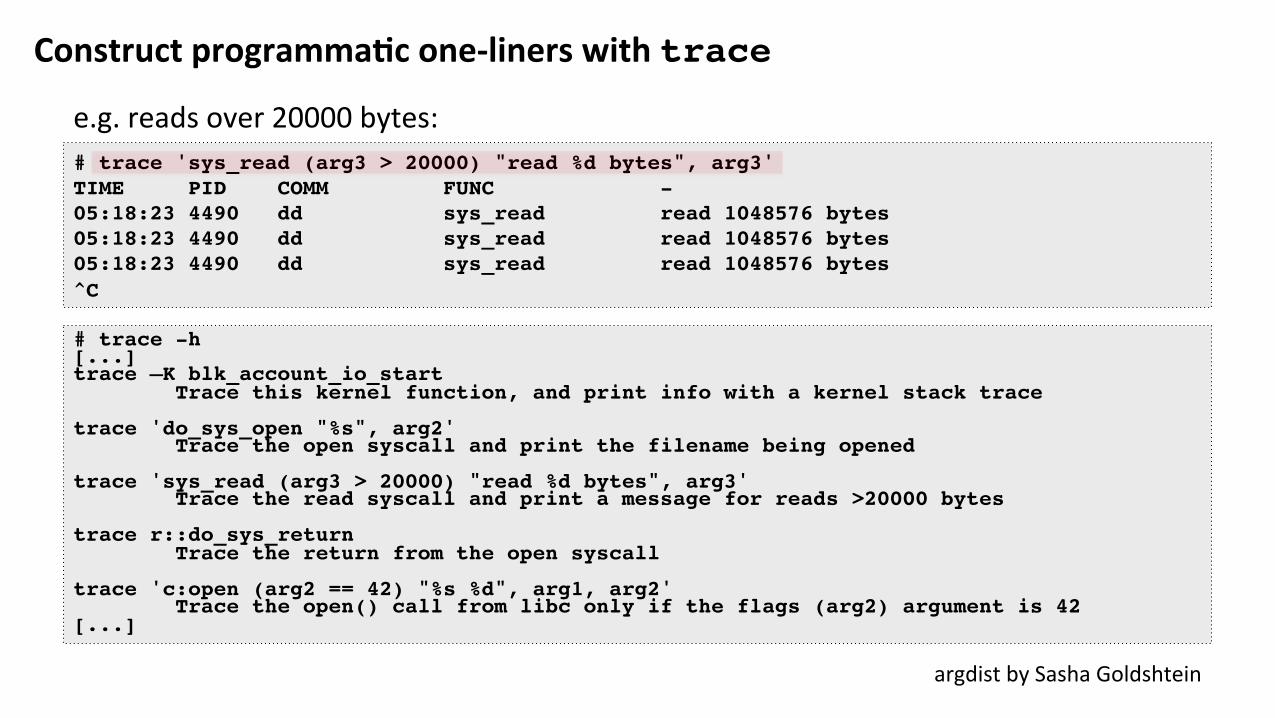
Constructprogramma:cone-linerswithtrace
# trace 'sys_read (arg3 > 20000) "read %d bytes", arg3'TIME PID COMM FUNC -05:18:23 4490 dd sys_read read 1048576 bytes05:18:23 4490 dd sys_read read 1048576 bytes05:18:23 4490 dd sys_read read 1048576 bytes^C
argdistbySashaGoldshtein
# trace -h[...]trace –K blk_account_io_start Trace this kernel function, and print info with a kernel stack trace trace 'do_sys_open "%s", arg2' Trace the open syscall and print the filename being opened trace 'sys_read (arg3 > 20000) "read %d bytes", arg3' Trace the read syscall and print a message for reads >20000 bytes trace r::do_sys_return Trace the return from the open syscall trace 'c:open (arg2 == 42) "%s %d", arg1, arg2' Trace the open() call from libc only if the flags (arg2) argument is 42[...]
e.g.readsover20000bytes:
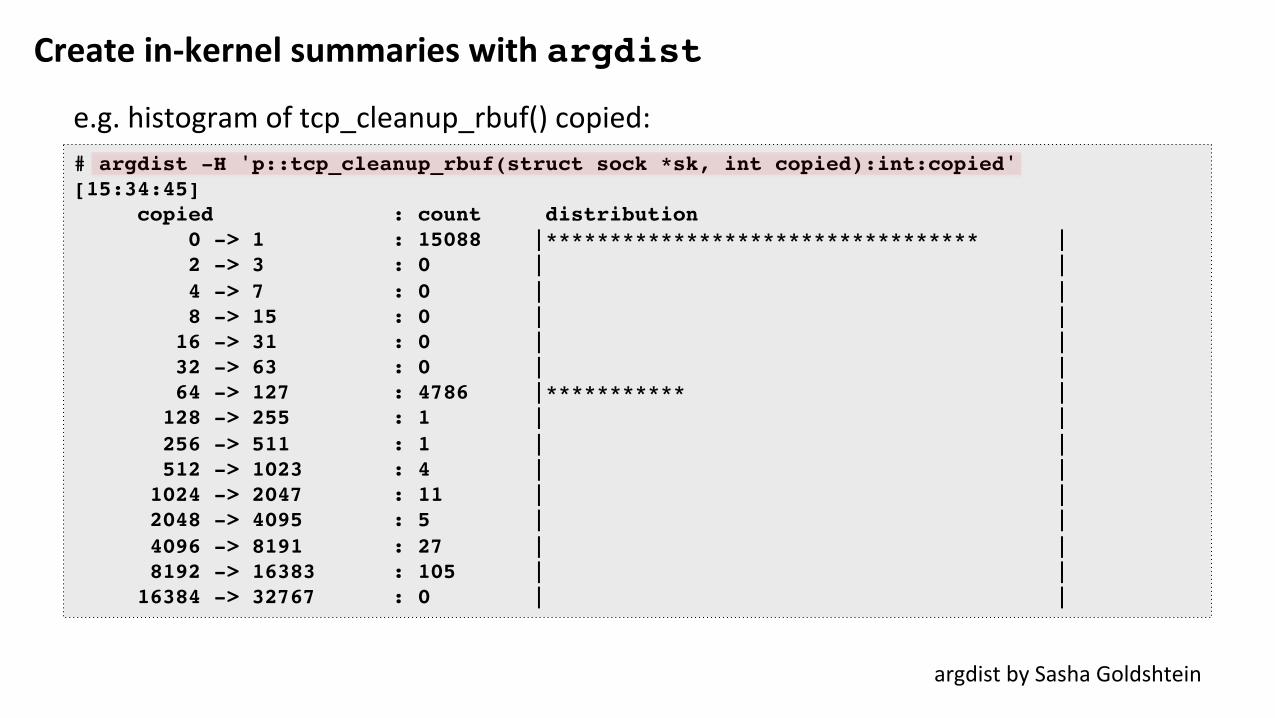
Createin-kernelsummarieswithargdist
# argdist -H 'p::tcp_cleanup_rbuf(struct sock *sk, int copied):int:copied'[15:34:45] copied : count distribution 0 -> 1 : 15088 |********************************** | 2 -> 3 : 0 | | 4 -> 7 : 0 | | 8 -> 15 : 0 | | 16 -> 31 : 0 | | 32 -> 63 : 0 | | 64 -> 127 : 4786 |*********** | 128 -> 255 : 1 | | 256 -> 511 : 1 | | 512 -> 1023 : 4 | | 1024 -> 2047 : 11 | | 2048 -> 4095 : 5 | | 4096 -> 8191 : 27 | | 8192 -> 16383 : 105 | | 16384 -> 32767 : 0 | |
argdistbySashaGoldshtein
e.g.histogramoftcp_cleanup_rbuf()copied:

BCC/BPFVISUALIZATIONSComingtoaGUInearyou

BPFmetricsandanalysiscanbeautomatedinGUIs
Flame Graphs Heat Maps Tracing Reports …
Eg,NeRlixVector(self-serviceUI):
Shouldbeopensourced;youmayalsobuild/buyyourown
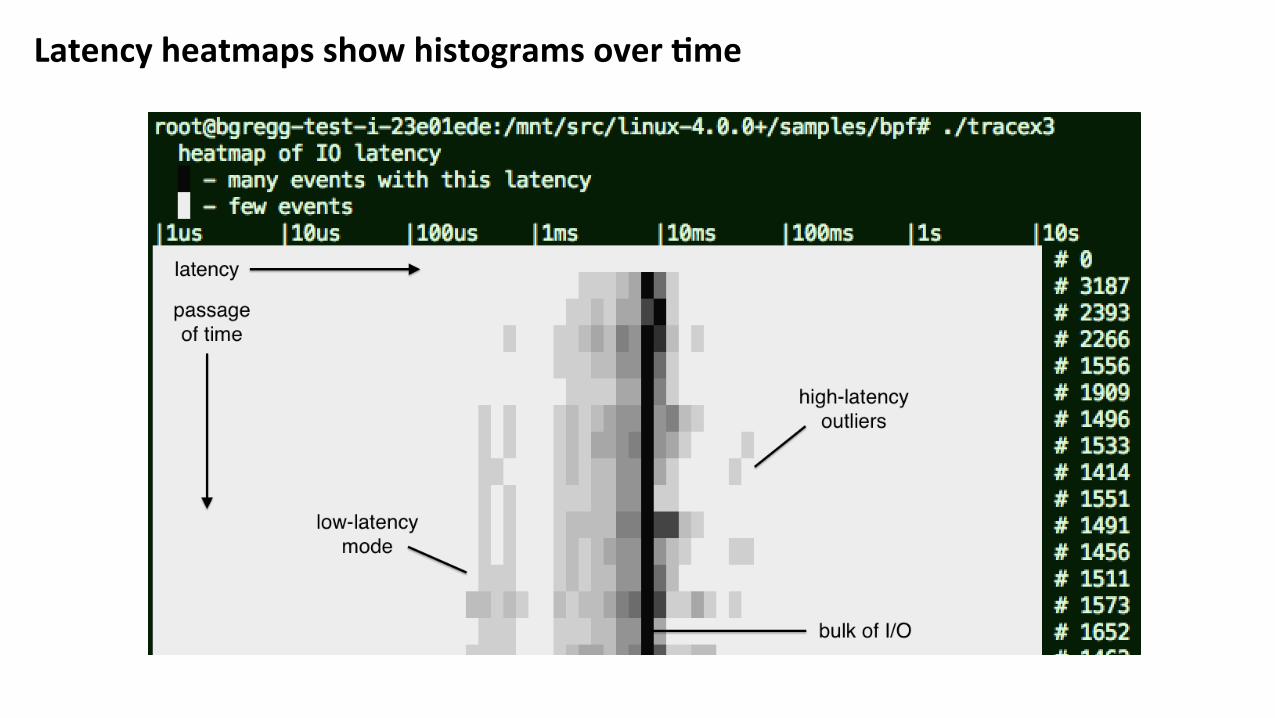
Latencyheatmapsshowhistogramsover:me
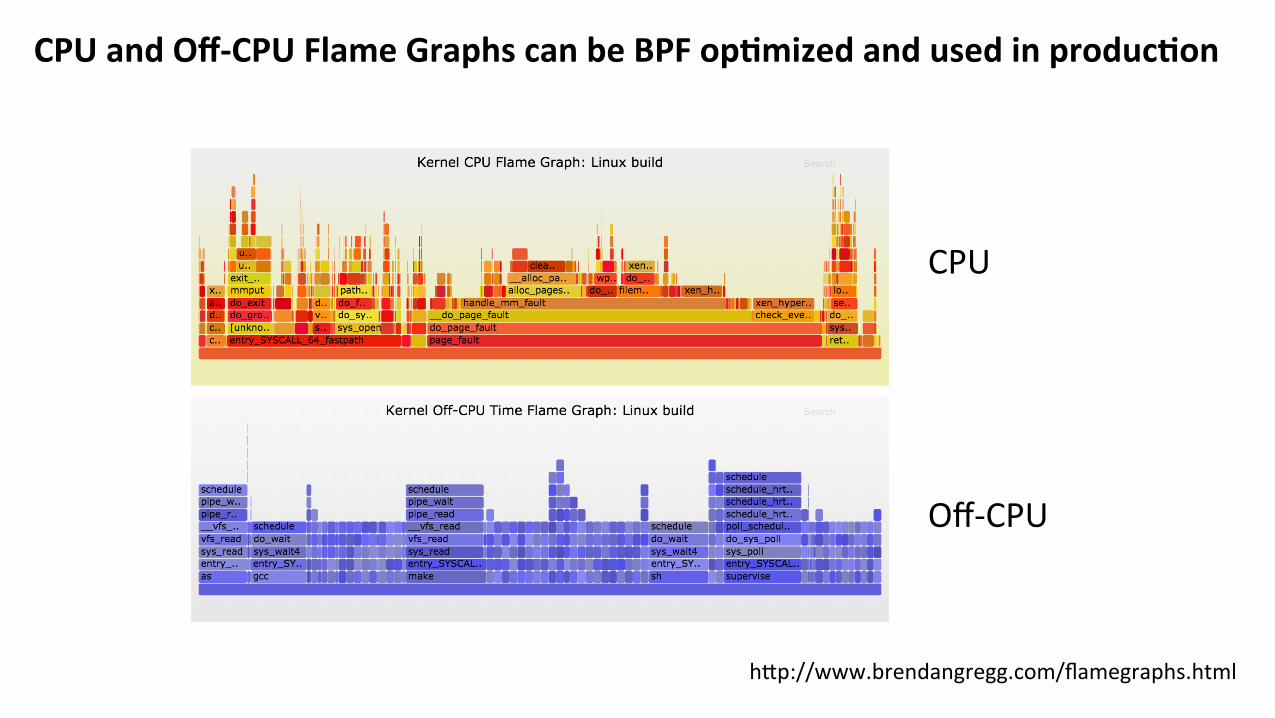
CPUandOff-CPUFlameGraphscanbeBPFop:mizedandusedinproduc:on
hMp://www.brendangregg.com/flamegraphs.html
CPU
Off-CPU
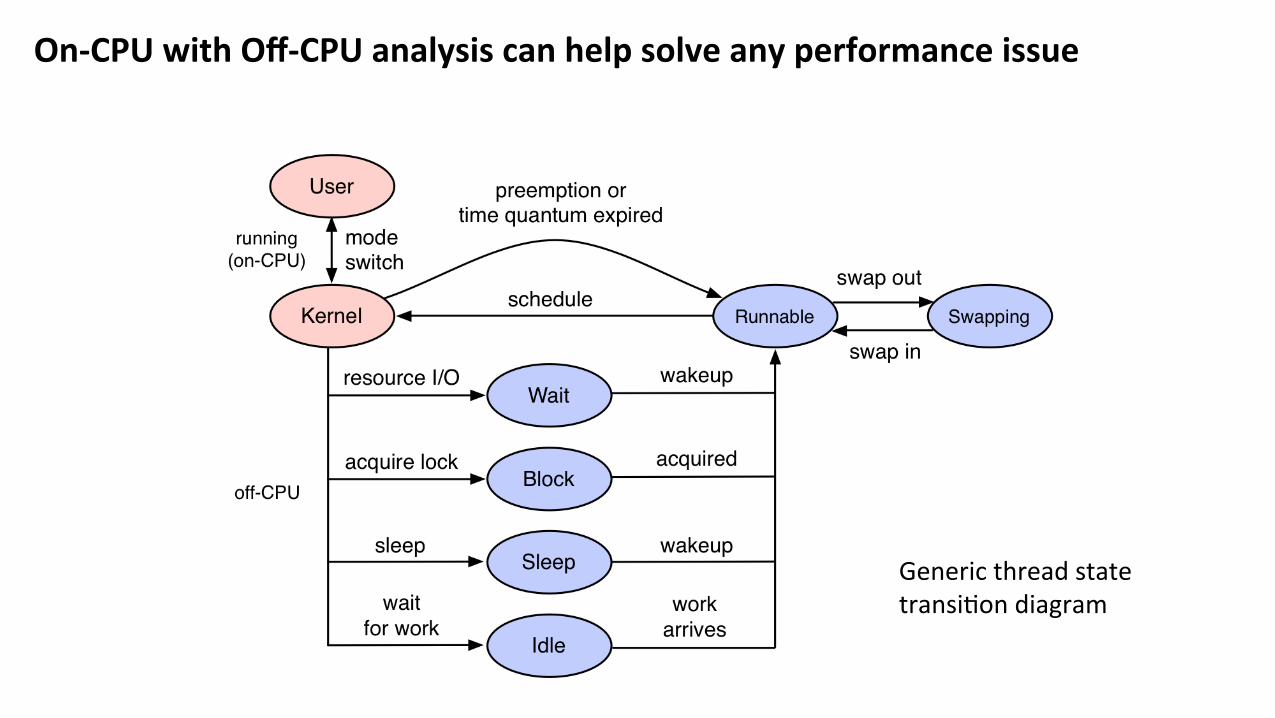
On-CPUwithOff-CPUanalysiscanhelpsolveanyperformanceissue
Genericthreadstatetransi?ondiagram
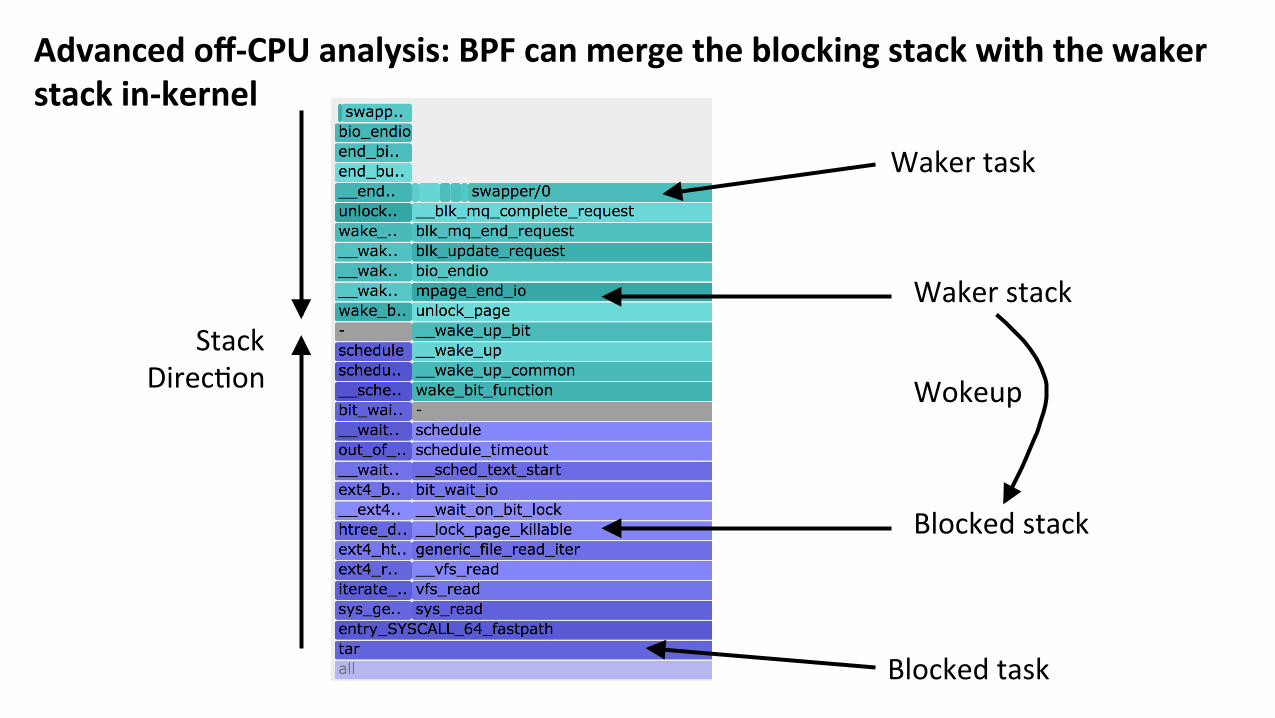
Advancedoff-CPUanalysis:BPFcanmergetheblockingstackwiththewakerstackin-kernel
Wakertask
Wakerstack
Blockedstack
Blockedtask
StackDirec?on Wokeup

FUTUREWORKbcc/BPF
Challenges
• Adop?on– Performancemonitoring/analysisproducts
• Marke?ng• Documenta?on• Training• Community• Higher-levellanguage
ply• AnewBPF-basedlanguageandtracerforLinux
– CreatedbyTobiasWaldekranz– hMps://github.com/iovisor/plyhMps://wkz.github.io/ply/
• High-levellanguage– Simpleone-liners– Shortscripts
• Indevelopment– kprobesandtracepointsonly,uprobes/perf_eventsnotyet– Successfulsofarasaproofofconcept– Notproduc?ontestedyet(bccis)
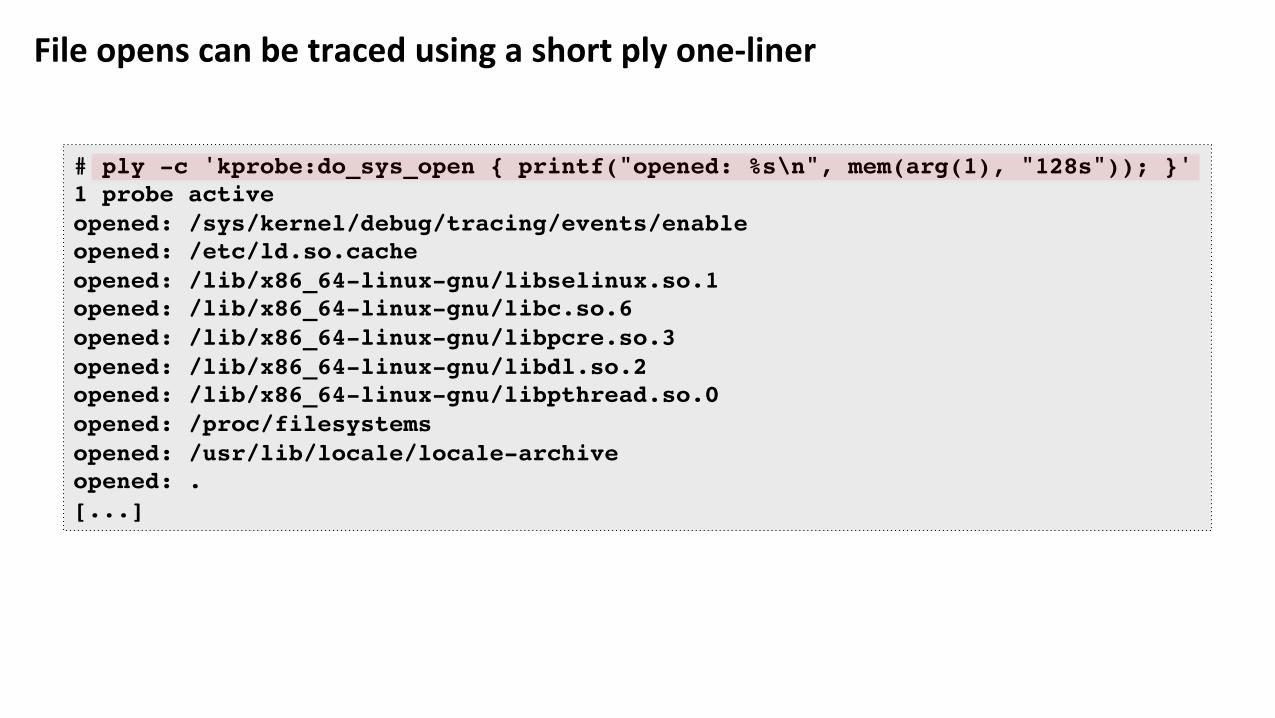
Fileopenscanbetracedusingashortplyone-liner
# ply -c 'kprobe:do_sys_open { printf("opened: %s\n", mem(arg(1), "128s")); }'1 probe activeopened: /sys/kernel/debug/tracing/events/enableopened: /etc/ld.so.cacheopened: /lib/x86_64-linux-gnu/libselinux.so.1opened: /lib/x86_64-linux-gnu/libc.so.6opened: /lib/x86_64-linux-gnu/libpcre.so.3opened: /lib/x86_64-linux-gnu/libdl.so.2opened: /lib/x86_64-linux-gnu/libpthread.so.0opened: /proc/filesystemsopened: /usr/lib/locale/locale-archiveopened: .[...]
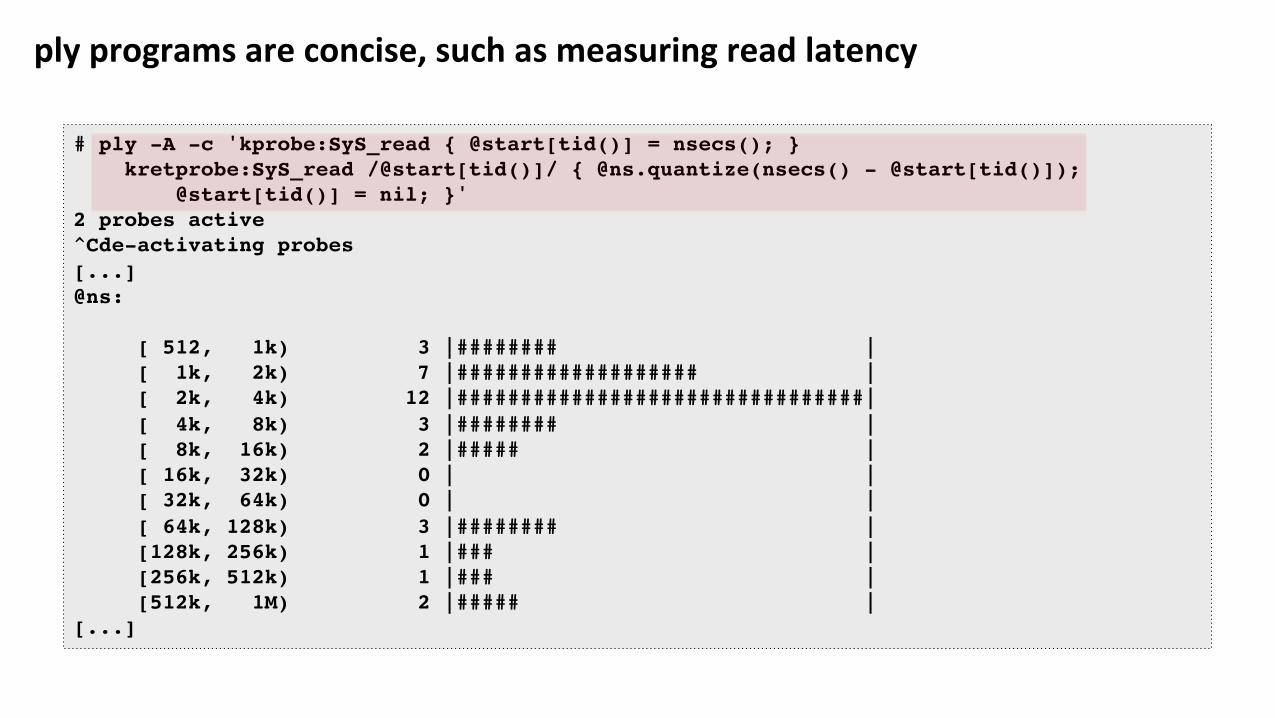
plyprogramsareconcise,suchasmeasuringreadlatency
# ply -A -c 'kprobe:SyS_read { @start[tid()] = nsecs(); } kretprobe:SyS_read /@start[tid()]/ { @ns.quantize(nsecs() - @start[tid()]); @start[tid()] = nil; }'2 probes active^Cde-activating probes[...]@ns:
[ 512, 1k) 3 |######## |[ 1k, 2k) 7 |################### |[ 2k, 4k) 12 |################################|[ 4k, 8k) 3 |######## |[ 8k, 16k) 2 |##### |[ 16k, 32k) 0 | |[ 32k, 64k) 0 | |[ 64k, 128k) 3 |######## |[128k, 256k) 1 |### |[256k, 512k) 1 |### |[512k, 1M) 2 |##### |
[...]
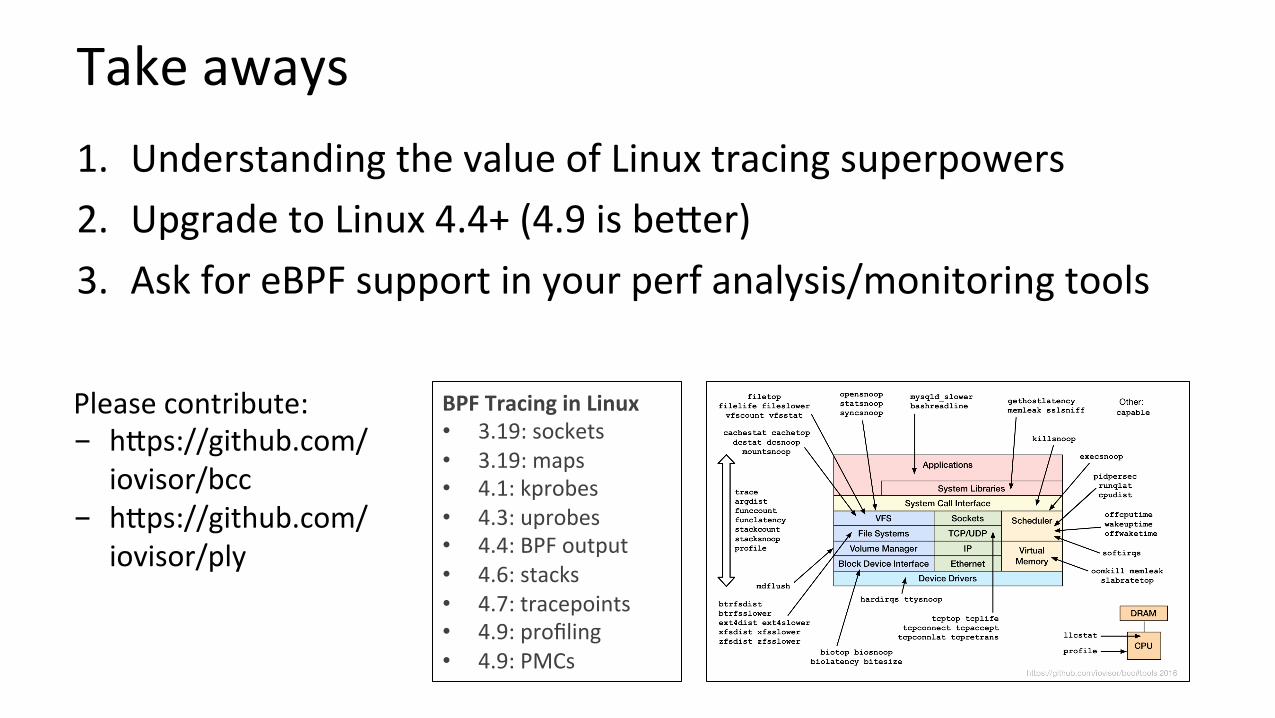
Takeaways1. UnderstandingthevalueofLinuxtracingsuperpowers2. UpgradetoLinux4.4+(4.9isbeMer)3. AskforeBPFsupportinyourperfanalysis/monitoringtools
BPFTracinginLinux• 3.19:sockets• 3.19:maps• 4.1:kprobes• 4.3:uprobes• 4.4:BPFoutput• 4.6:stacks• 4.7:tracepoints• 4.9:profiling• 4.9:PMCs
Pleasecontribute:- hMps://github.com/
iovisor/bcc- hMps://github.com/
iovisor/ply
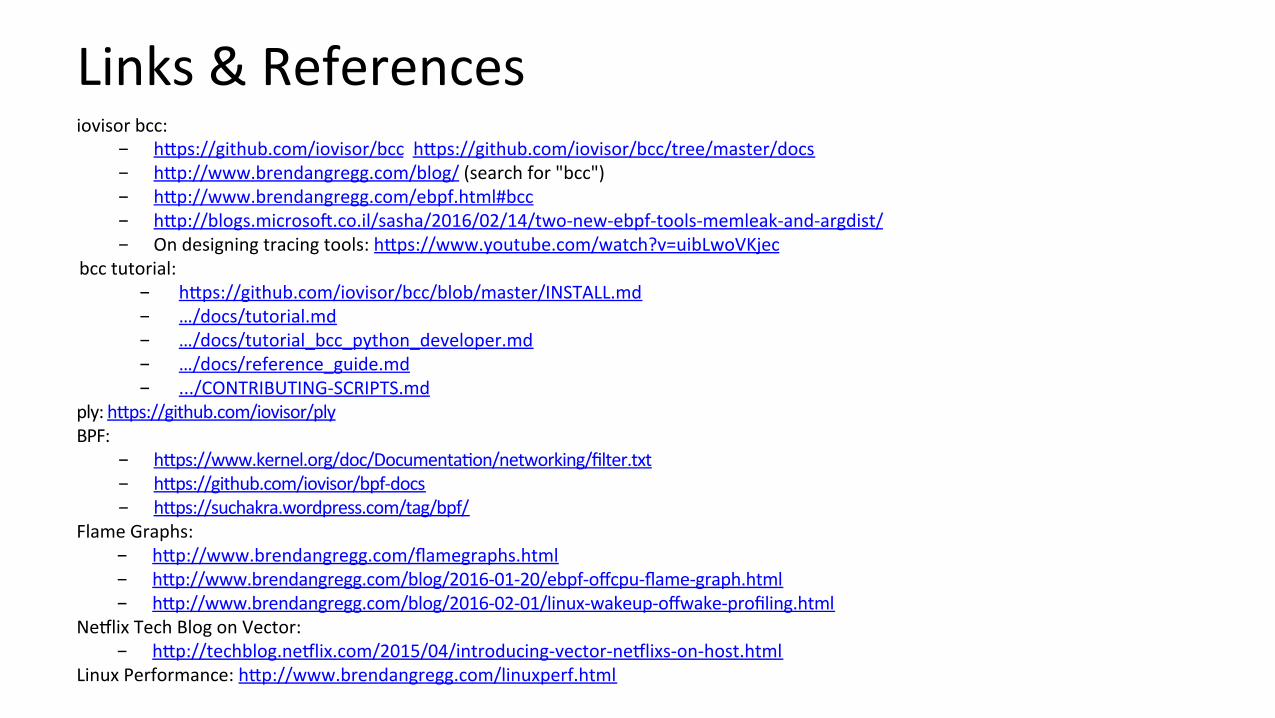
Links&Referencesiovisorbcc:
- hMps://github.com/iovisor/bcchMps://github.com/iovisor/bcc/tree/master/docs- hMp://www.brendangregg.com/blog/(searchfor"bcc")- hMp://www.brendangregg.com/ebpf.html#bcc- hMp://blogs.microsoW.co.il/sasha/2016/02/14/two-new-ebpf-tools-memleak-and-argdist/- Ondesigningtracingtools:hMps://www.youtube.com/watch?v=uibLwoVKjec
bcctutorial:- hMps://github.com/iovisor/bcc/blob/master/INSTALL.md- …/docs/tutorial.md- …/docs/tutorial_bcc_python_developer.md- …/docs/reference_guide.md- .../CONTRIBUTING-SCRIPTS.md
ply:hMps://github.com/iovisor/plyBPF:
- hMps://www.kernel.org/doc/Documenta?on/networking/filter.txt- hMps://github.com/iovisor/bpf-docs- hMps://suchakra.wordpress.com/tag/bpf/
FlameGraphs:- hMp://www.brendangregg.com/flamegraphs.html- hMp://www.brendangregg.com/blog/2016-01-20/ebpf-offcpu-flame-graph.html- hMp://www.brendangregg.com/blog/2016-02-01/linux-wakeup-offwake-profiling.html
NeRlixTechBlogonVector:- hMp://techblog.neRlix.com/2015/04/introducing-vector-neRlixs-on-host.html
LinuxPerformance:hMp://www.brendangregg.com/linuxperf.html

Thank You
Brendan Gregg Senior Performance Architect Jun 2017
– Ques?ons?– iovisorbcc:hMps://github.com/iovisor/bcc– hMp://www.brendangregg.com– hMp://slideshare.net/brendangregg– [email protected]– @brendangreggThankstoAlexeiStarovoitov(Facebook),BrendenBlanco(PLUMgrid/VMware),SashaGoldshtein(Sela),DanielBorkmann(Cisco),WangNan(Huawei),andotherBPFandbcccontributors!