Embed Size (px)
Citation preview
Life Cycle Greenhouse Gas Analysis ofNatural Gas Extraction & Delivery in the United StatesyTimothy J. Skone, P.E.Office of Strategic Energy Analysis and PlanningMay 12 2011May 12, 2011
Presented at: Cornell University Lecture Series
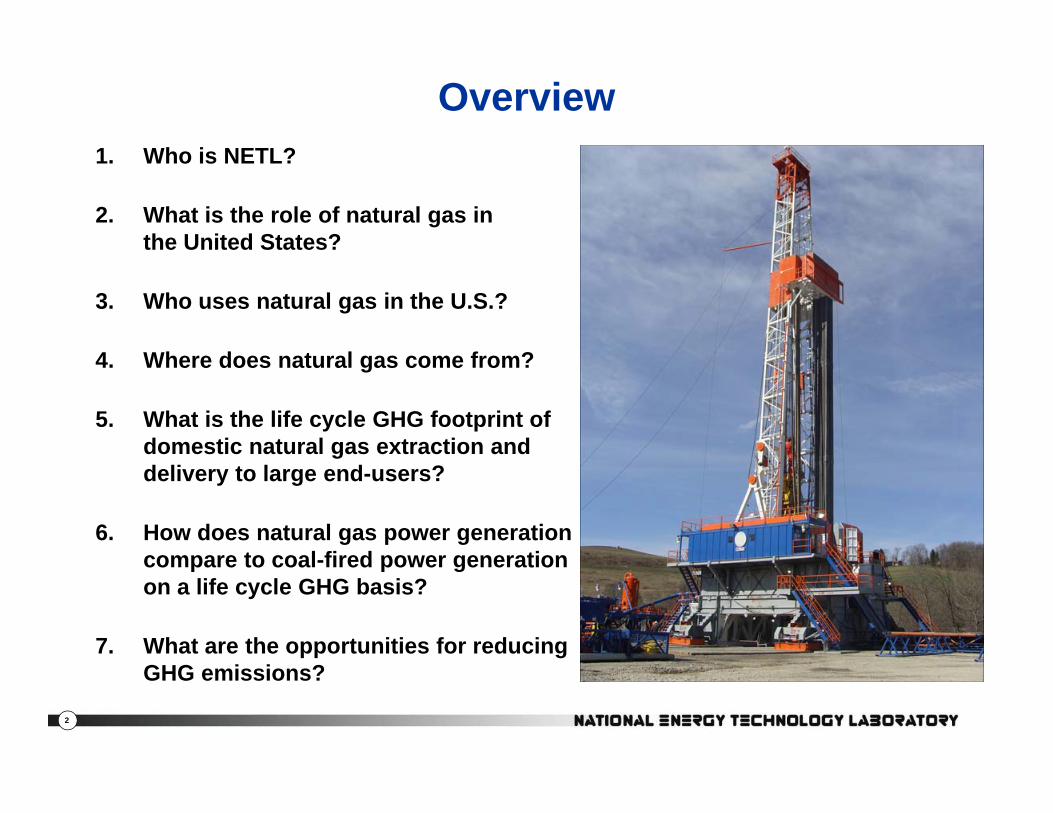
Overview1 Wh i NETL?1. Who is NETL?
2. What is the role of natural gas inthe United States?
3. Who uses natural gas in the U.S.?
4 Wh d t l f ?4. Where does natural gas come from?
5. What is the life cycle GHG footprint of domestic natural gas extraction andgdelivery to large end-users?
6. How does natural gas power generation compare to coal-fired power generationcompare to coal-fired power generationon a life cycle GHG basis?
7. What are the opportunities for reducing
2
GHG emissions?

Question #1:Who is NETL?
3
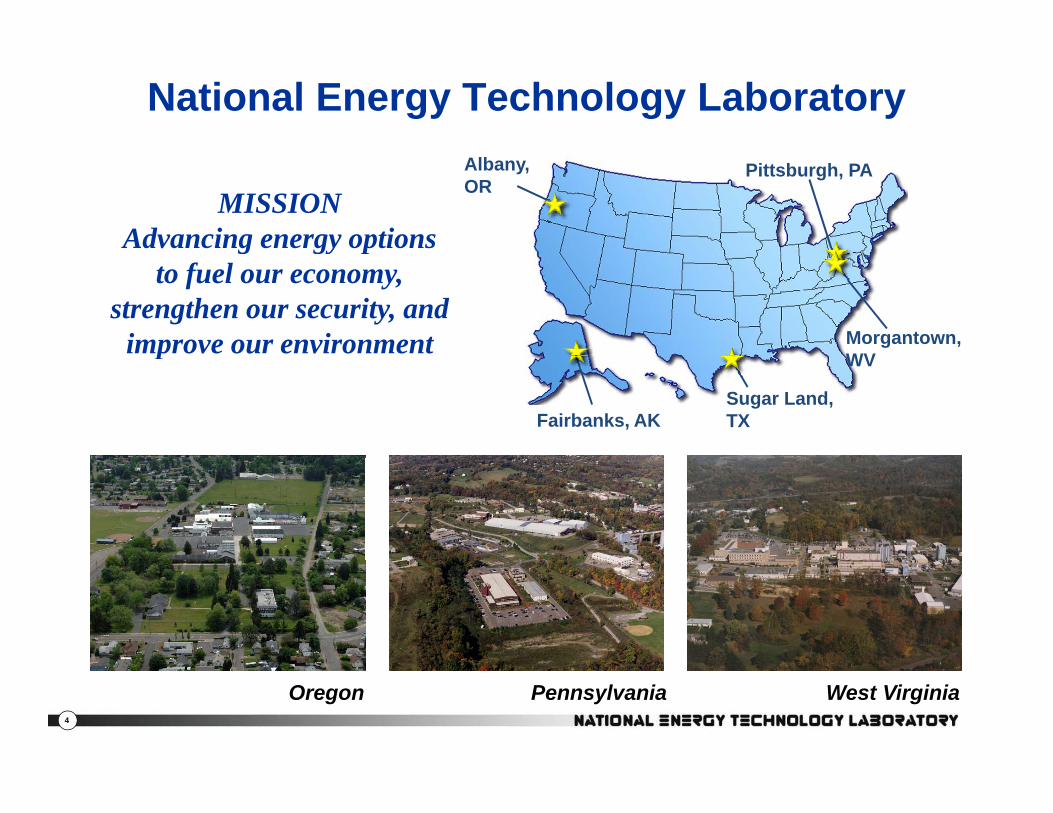
National Energy Technology Laboratory
MISSIONAdvancing energy options
Pittsburgh, PAAlbany,OR
g gy pto fuel our economy,
strengthen our security, andimprove our environment Morgantown,
WVp
WV
Fairbanks, AKSugar Land,TX
4
West VirginiaPennsylvaniaOregon

Question #2:What is the role of natural gas
in the United States?
5
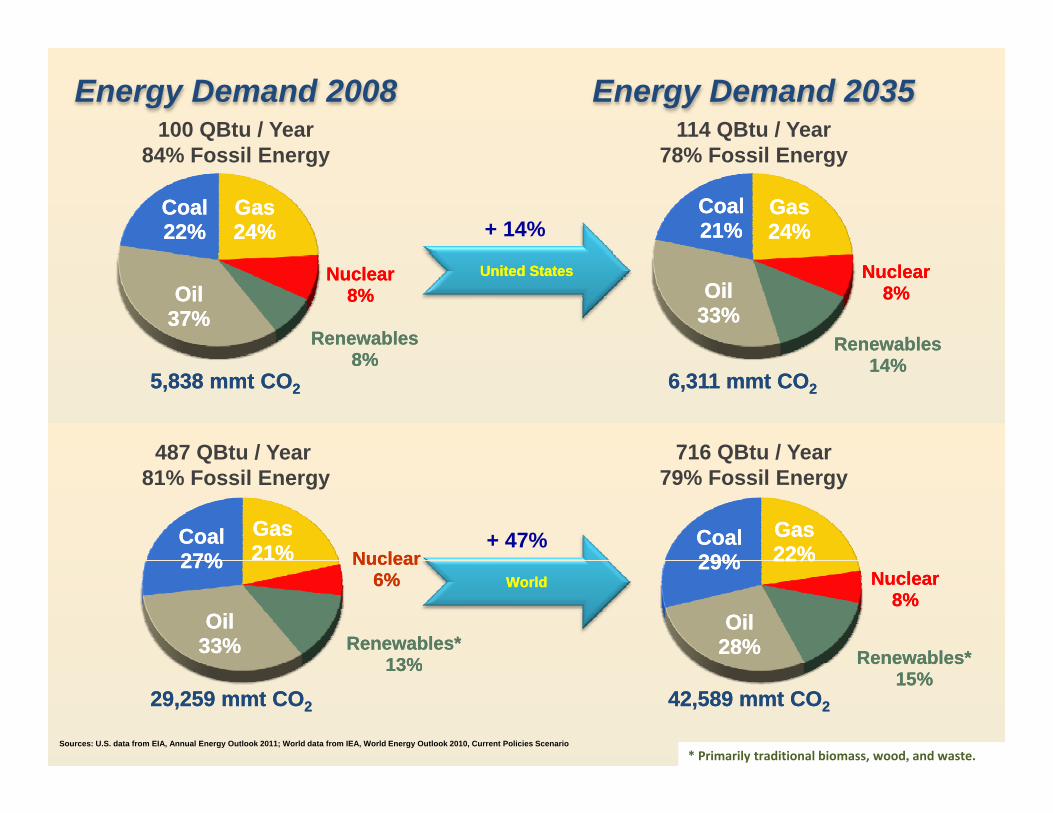
114 QBtu / Year78% F il E
Energy Demand 2008100 QBtu / Year
84% F il E
Energy Demand 2035
GasGas24%24%
CoalCoal21%21%
GasGas24%24%
CoalCoal22%22%
78% Fossil Energy
+ 14%
84% Fossil Energy
NuclearNuclear8%8%
RenewablesRenewables
OilOil33%33%
NuclearNuclear8%8%
RenewablesRenewables8%8%
OilOil37%37%
United StatesUnited States
14%14%8%8%
716 QBtu / Year487 QBtu / Year
5,838 5,838 mmtmmt COCO22 6,311 6,311 mmtmmt COCO22
GasGas22%22%
CoalCoal29%29%
GasGas21%21% NuclearNuclear
CoalCoal27%27%
716 QBtu / Year79% Fossil Energy
487 QBtu / Year 81% Fossil Energy
+ 47% 22%22%NuclearNuclear
8%8%
Renewables*Renewables*
OilOil28%28%
29%29%%% NuclearNuclear6%6%
Renewables*Renewables*13%13%
OilOil33%33%
27%27%WorldWorld
6
RenewablesRenewables15%15%
13%13%
Sources: U.S. data from EIA, Annual Energy Outlook 2011; World data from IEA, World Energy Outlook 2010, Current Policies Scenario
29,259 29,259 mmtmmt COCO22 42,589 42,589 mmtmmt COCO22
* Primarily traditional biomass, wood, and waste.

Question #3:Who uses natural gas in the United States?
7

Domestic Natural Gas Consumption Sectoral Trends and Projections: 2010 Total Consumption = 23.8 TCF
8
9Industrial
j p
Electric Power Sector Consumed 31% of U.S.
Natural Gas in 2010 (7.4 TCF)
Electric Power Sector Consumed 31% of U.S.
Natural Gas in 2010 (7.4 TCF)
7
8
t (TCF) Electric Power
Electric Power Usage Does Not Increase Above
5
6
n Cu
bic Fee
Residential
Industrial + 1.9 TCF from 2009 to 2015.
Increase Above 2010 Level Until
Year 2031
3
4
Trillion
Commercial
2
3
1997 1999 2001 2003 2005 2007 2009 2011 2013 2015 2017 2019 2021 2023 2025 2027 2029 2031 2033 2035
8
Source: EIA Annual Energy Review 2009 and Annual Energy Outlook 2011
+1.9 TCF Resurgence in Industrial Use of Natural Gas by 2015 Exceeds the Net Incremental Supply;No Increase in Natural Gas Use for Electric Power Sector Until 2031

Question #4:Where does natural gas come from?
9

Schematic Geology of OnshoreNatural Gas ResourcesNatural Gas Resources
10
Source: EIA, Today in Energy, February 14, 2011; Modified USGS Figure from Fact Sheet 0113-01; www.eia.doe.gov/todayinenergy/detail.cfm?id=110 Last Accessed May 5, 2011.

EIA Natural Gas Maps11
EIA Natural Gas MapsSource: EIA, Natural Gas Maps, http://www.eia.doe.gov/pub/oil_gas/natural_gas/analysis_publications/maps/maps.htm Last Accessed May 5, 2011.
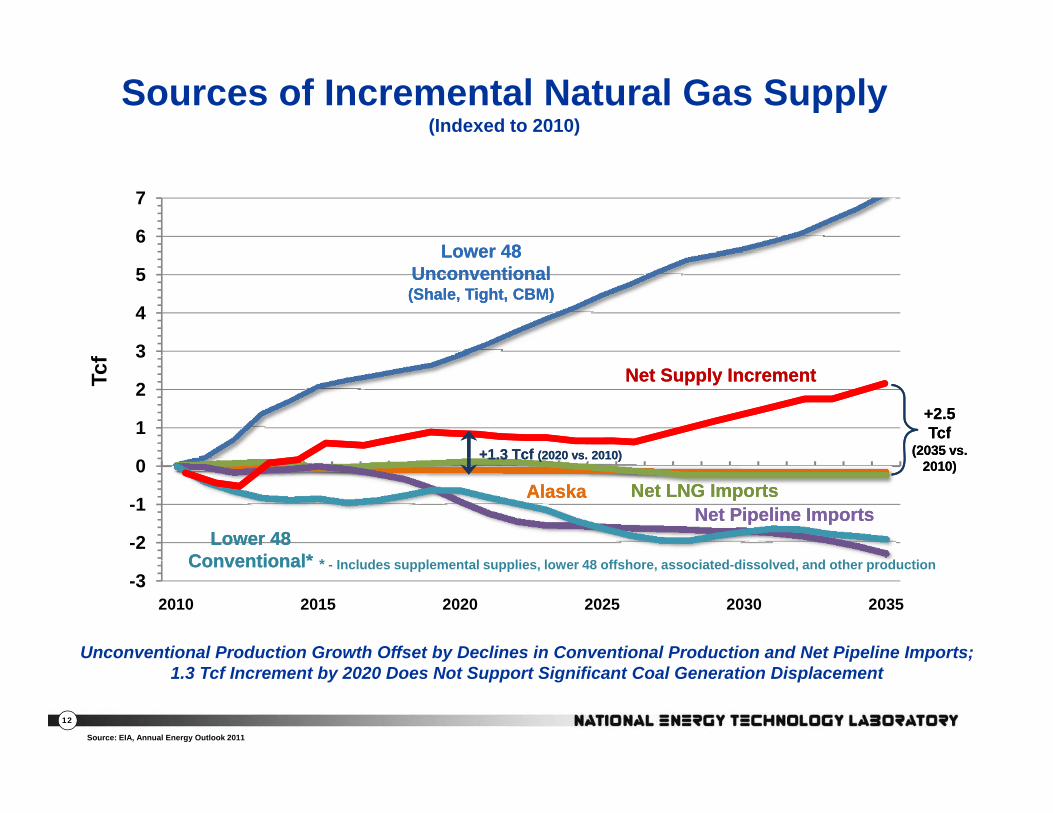
Sources of Incremental Natural Gas Supply (Indexed to 2010)
6
7
Lower 48Lower 48
3
4
5Lower 48
Unconventional(Shale, Tight, CBM)
Lower 48 Unconventional(Shale, Tight, CBM)
f
1
2
3
Tcf
Net Supply IncrementNet Supply Increment
+2.5Tcf
(2035 vs.
+2.5Tcf
(2035 vs. +1.3 Tcf (2020 vs. 2010)+1.3 Tcf (2020 vs. 2010)
-2
-1
0
Lower 48 Conventional*
Lower 48 Conventional* * I l d l t l li l 48 ff h i t d di l d d th d ti
Net LNG ImportsNet LNG ImportsNet Pipeline ImportsNet Pipeline Imports
AlaskaAlaska2010)2010)
1.3 Tcf (2020 vs. 2010)1.3 Tcf (2020 vs. 2010)
-32010 2015 2020 2025 2030 2035
ConventionalConventional * - Includes supplemental supplies, lower 48 offshore, associated-dissolved, and other production
Unconventional Production Growth Offset by Declines in Conventional Production and Net Pipeline Imports;
12
Source: EIA, Annual Energy Outlook 2011
1.3 Tcf Increment by 2020 Does Not Support Significant Coal Generation Displacement

Question #5:What is the life cycle GHG footprint of
domestic natural gas extraction and delivery to large end-users?
13
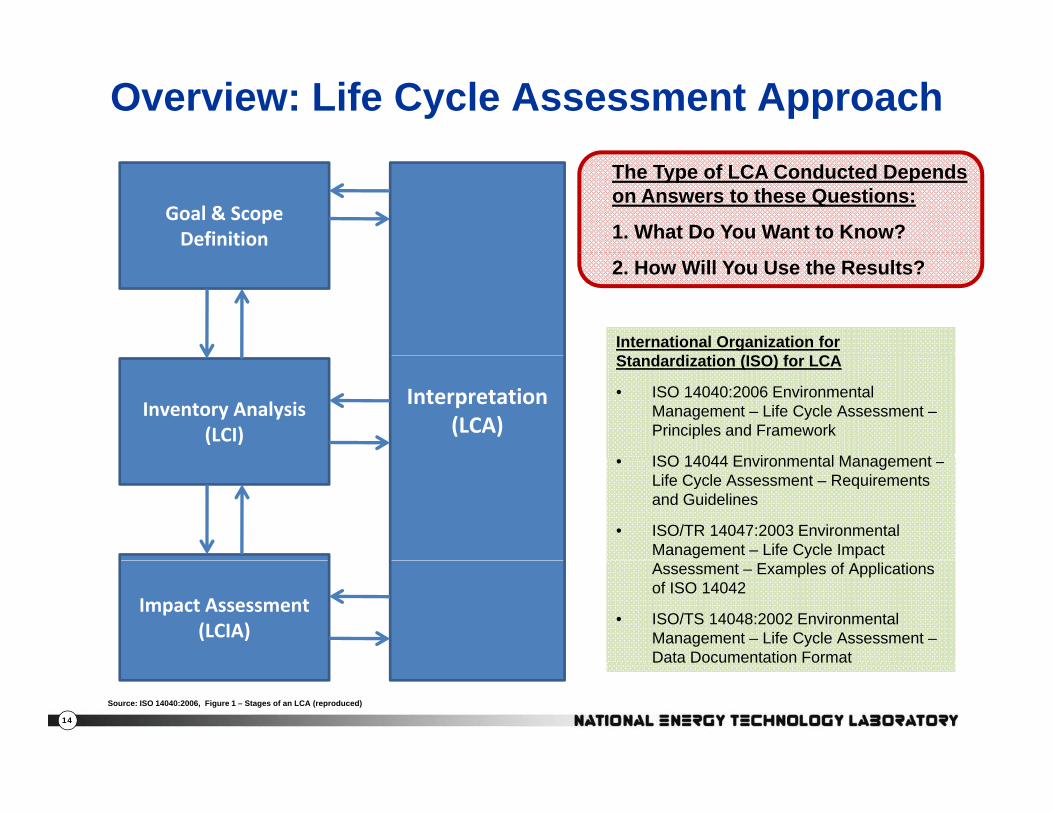
Overview: Life Cycle Assessment Approach
Goal & Scope Definition
The Type of LCA Conducted Depends on Answers to these Questions:
1. What Do You Want to Know?
International Organization for St d di ti (ISO) f LCA
2. How Will You Use the Results?
Standardization (ISO) for LCA
• ISO 14040:2006 Environmental Management – Life Cycle Assessment –Principles and Framework
ISO 14044 E i t l M t
Inventory Analysis(LCI)
Interpretation(LCA)
• ISO 14044 Environmental Management –Life Cycle Assessment – Requirements and Guidelines
• ISO/TR 14047:2003 Environmental Management – Life Cycle Impact Assessment – Examples of Applications of ISO 14042
• ISO/TS 14048:2002 Environmental Management – Life Cycle Assessment –Data Documentation Format
Impact Assessment(LCIA)
14
Source: ISO 14040:2006, Figure 1 – Stages of an LCA (reproduced)

Overview: Life Cycle Assessment Approach
The Type of LCA Conducted Dependson Answers to these Questions :
1 Wh t D Y W t t K ?1. What Do You Want to Know? The GHG footprint of natural gas, lower 48 domestic average,
extraction, processing, and delivery to a large end-user( l t)(e.g., power plant)
The comparison of natural gas used in a baseload power generation plant to baseload coal-fired power generation on a lbs CO e/MWh basislbs CO2e/MWh basis
2. How Will You Use the Results? Inform research and development activities to reduce the GHG Inform research and development activities to reduce the GHG
footprint of both energy feedstock extraction and power production in existing and future operations
15
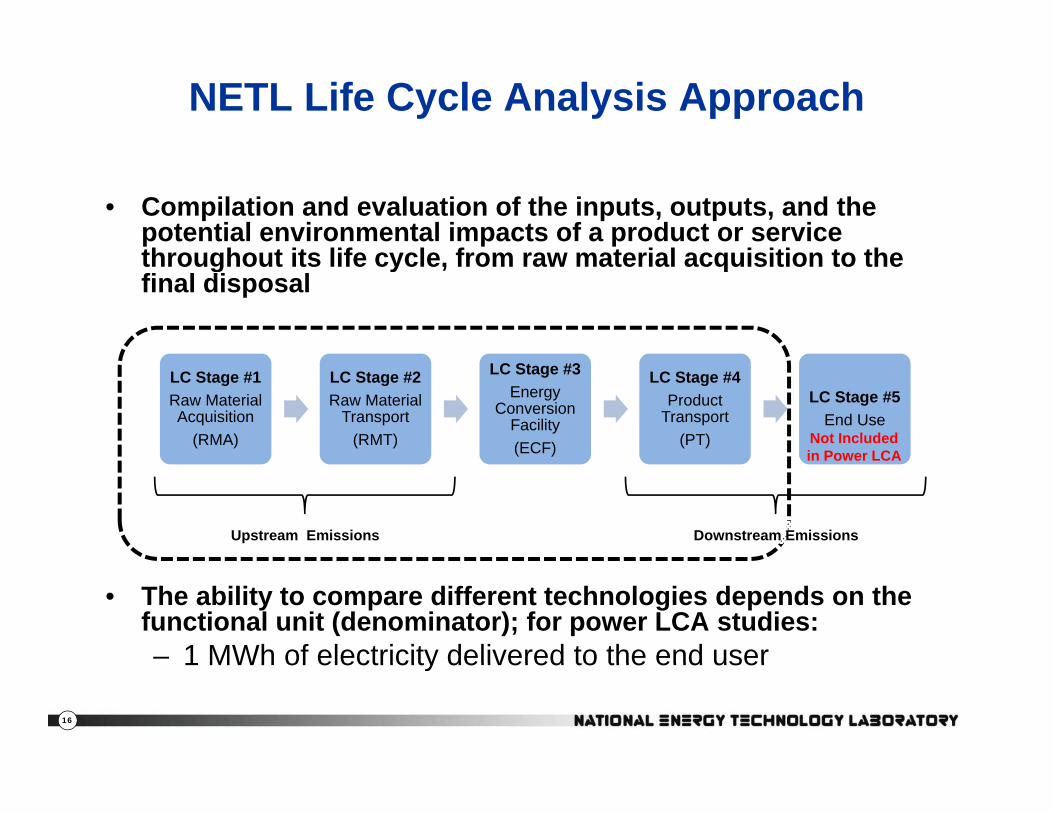
NETL Life Cycle Analysis Approach
• Compilation and evaluation of the inputs, outputs, and the potential environmental impacts of a product or service throughout its life cycle from raw material acquisition to thethroughout its life cycle, from raw material acquisition to the final disposal
LC Stage #1Raw Material Acquisition
(RMA)
LC Stage #2Raw Material
Transport(RMT)
LC Stage #3Energy
Conversion Facility(ECF)
LC Stage #4Product
Transport(PT)
LC Stage #5End Use
Not Included in Power LCA
Upstream Emissions Downstream Emissions
in Power LCA
• The ability to compare different technologies depends on the functional unit (denominator); for power LCA studies:– 1 MWh of electricity delivered to the end user
16
1 MWh of electricity delivered to the end user

NETL Life Cycle Analysis Approach for Natural Gas Extraction and Delivery StudyNatural Gas Extraction and Delivery Study
• The study boundary for “domestic natural gas extraction and delivery to large end-users” is represented byy g yLife Cycle (LC) Stages #1 and #2 only.
LC Stage #1Raw Material Acquisition
(RMA)
LC Stage #2Raw Material
Transport(RMT)
LC Stage #3Energy
Conversion Facility(ECF)
LC Stage #4Product
Transport(PT)
LC Stage #5End Use
Not Included in Power LCA
Not Included in Study Boundary for Cradle-to-Gate Energy Feedstock Profiles
Upstream Emissions Downstream Emissions
in Power LCACradle to Gate Energy Feedstock Profiles
• Functional unit (denominator) for energy feedstock profiles is:– 1 MMBtu of feedstock delivered to end user
17
(MMBtu = million British thermal units)

NETL Life Cycle Study Metrics
• Greenhouse Gases– CO2, CH4, N2O, SF6
Converted to Global Warming Potential using IPCC 2007 100-year CO2 equivalents
Converted to Global Warming Potential using IPCC 2007 100-year CO2 equivalentsCO2, C 4, 2O, S 6
• Criteria Air Pollutants– NOX, SOX, CO, PM10, Pb
• Air Emissions Species of Interest
2
CO2 = 1CH4 = 25N2O = 298
SF6 = 22,800
2
CO2 = 1CH4 = 25N2O = 298
SF6 = 22,800Air Emissions Species of Interest– Hg, NH3, radionuclides
• Solid Waste• Raw Materials
6 ,6 ,
Raw Materials– Energy Return on Investment
• Water Use– Withdrawn water consumption water returned to source– Withdrawn water, consumption, water returned to source– Water Quality
• Land UseAcres transformed greenhouse gases
18
– Acres transformed, greenhouse gases
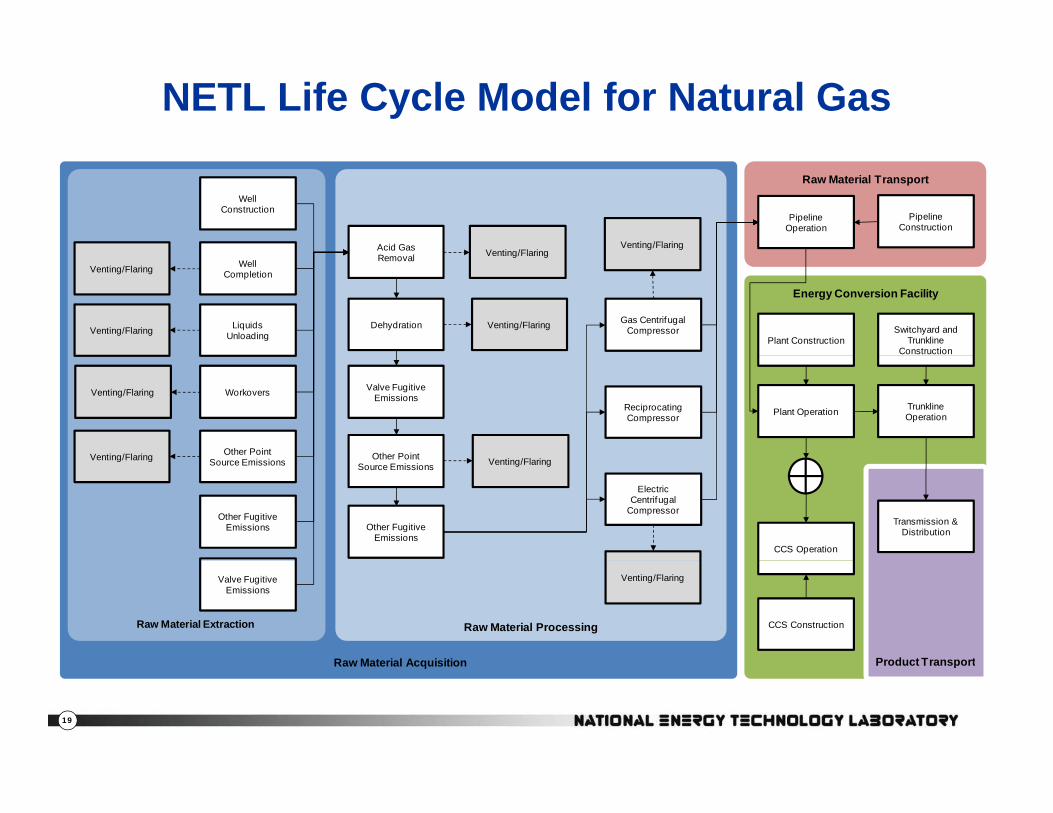
NETL Life Cycle Model for Natural Gas
PipelineOperation
Pipeline Construction
Raw Material Transport
Acid Gas Venting/Flaring
WellConstruction
Venting/Flaring
Plant ConstructionSwitchyard and
Trunkline Construction
Energy Conversion Facility
Gas CentrifugalCompressorDehydration
Removal
LiquidsUnloadingVenting/Flaring
Venting/Flaring
Venting/Flaring
WellCompletionVenting/Flaring
Plant Operation Trunkline Operation
Valve FugitiveEmissions
ReciprocatingCompressor
WorkoversVenting/Flaring
Other PointOther PointVenting/Flaring
Transmission & Distribution
CCS Operation
ElectricCentrifugal
Compressor
Other PointSource Emissions Venting/Flaring
Other FugitiveEmissions
Source EmissionsVenting/Flaring
Other FugitiveEmissions
Raw Material Acquisition Product Transport
CCS Construction
Valve Fugitive Emissions
Venting/Flaring
Raw Material Extraction Raw Material Processing
19
Raw Material Acquisition Product Transport
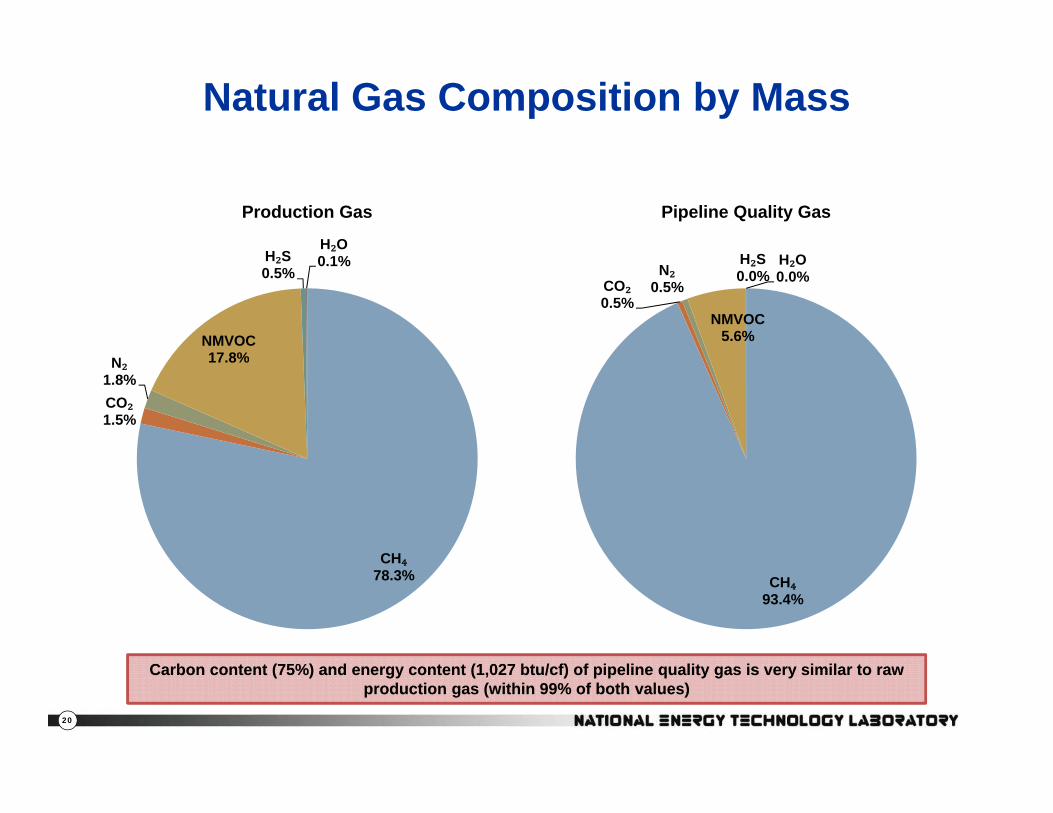
Natural Gas Composition by Mass
H SH₂O
Production Gas Pipeline Quality Gas
NMVOC17 8%
H₂S0.5%
0.1%CO₂0.5%
N₂0.5%
NMVOC5.6%
H₂S0.0%
H₂O0.0%
CO₂1.5%
N₂1.8%
17.8%
CH₄CH₄78.3% CH₄
93.4%
20
Carbon content (75%) and energy content (1,027 btu/cf) of pipeline quality gas is very similar to raw production gas (within 99% of both values)
Carbon content (75%) and energy content (1,027 btu/cf) of pipeline quality gas is very similar to raw production gas (within 99% of both values)

Natural Gas Extraction Modeling Properties
Property UnitsOnshore
Conventional Well
Onshore Associated
Well
Offshore Conventional
Well
Tight Sands -Vertical Well
Barnett Shale -
Horizontal Well
Coal Bed Methane
(CBM) Well
Natural Gas Source
Contribution to 2009 Natural Gas Mix Percent 23% 7% 13% 32% 16% 9%Estimated Ultimate Recovery (EUR), Production
Gas BCF/well 8.6 4.4 67.7 1.2 3.0 0.2
Production Rate (30-yr average) MCF/day 782 399 6,179 110 274 20
Natural Gas Extraction Well
Flaring Rate at Extraction Well Location Percent 51% 51% 51% 15% 15% 51%
Well Completion, Production Gas (prior to flaring) MCF/completion 47 47 47 4,657 11,643 63
Well Workover, Production Gas (prior to flaring) MCF/workover 3.1 3.1 3.1 4,657 11,643 63
Well Workover Number per Well Lifetime Workovers/well 1 1 1 1 1 1 3 5 3 5 3 5Well Workover, Number per Well Lifetime Workovers/well 1.1 1.1 1.1 3.5 3.5 3.5
Liquids Unloading, Production Gas (prior to flaring) MCF/episode 23.5 n/a 23.5 n/a n/a n/a
Liquids Unloading, Number per Well Lifetime Episodes/well 930 n/a 930 n/a n/a n/a
Pneumatic Device Emissions, Fugitive lb CH4/MCF 0.05 0.05 0.01 0.05 0.05 0.05
Other Sources of Emissions, Point Source(prior to flaring) lb CH4/MCF 0.003 0.003 0.002 0.003 0.003 0.003
Other Sources of Emissions, Fugitive lb CH4/MCF 0.043 0.043 0.010 0.043 0.043 0.043
21
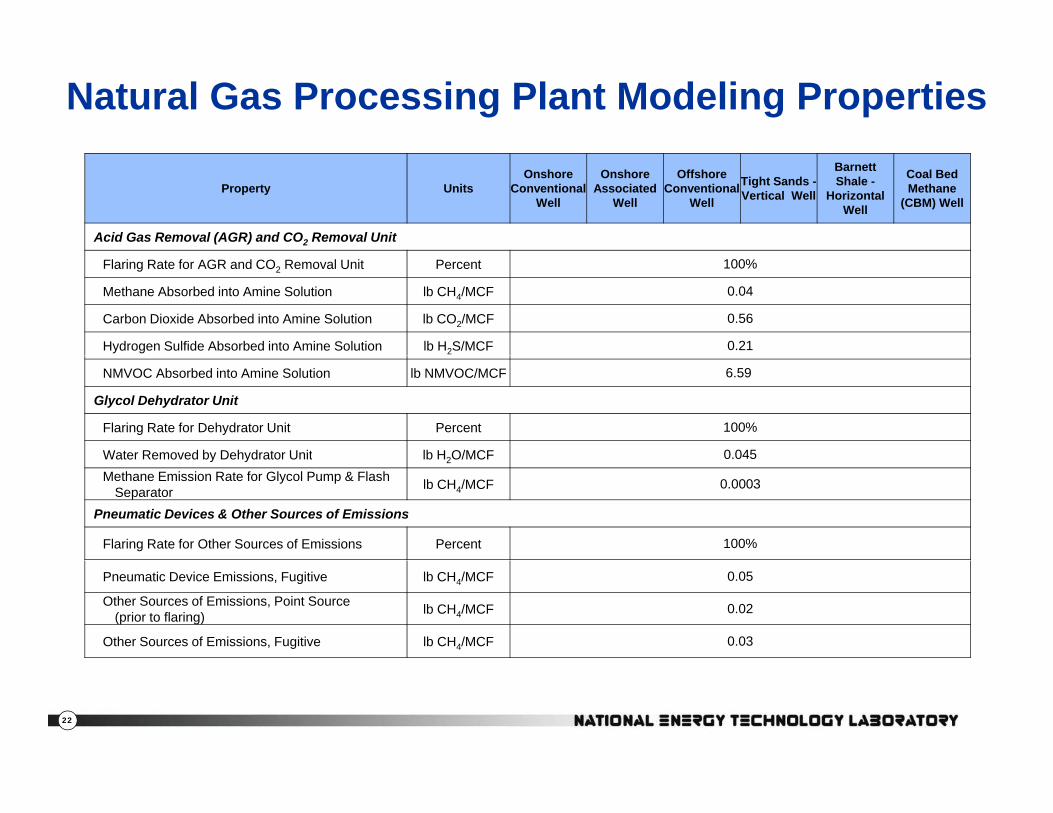
Natural Gas Processing Plant Modeling Properties
Property UnitsOnshore
Conventional Well
Onshore Associated
Well
Offshore Conventional
Well
Tight Sands -Vertical Well
Barnett Shale -
Horizontal Well
Coal Bed Methane
(CBM) Well
Acid Gas Removal (AGR) and CO2 Removal Unit
Flaring Rate for AGR and CO2 Removal Unit Percent 100%
Methane Absorbed into Amine Solution lb CH4/MCF 0.04
Carbon Dioxide Absorbed into Amine Solution lb CO2/MCF 0.56
Hydrogen Sulfide Absorbed into Amine Solution lb H2S/MCF 0.21
NMVOC Absorbed into Amine Solution lb NMVOC/MCF 6.59
Glycol Dehydrator Unit
Flaring Rate for Dehydrator Unit Percent 100%
Water Removed by Dehydrator Unit lb H2O/MCF 0.045Water Removed by Dehydrator Unit lb H2O/MCF 0.045Methane Emission Rate for Glycol Pump & Flash
Separator lb CH4/MCF 0.0003
Pneumatic Devices & Other Sources of Emissions
Flaring Rate for Other Sources of Emissions Percent 100%
Pneumatic Device Emissions, Fugitive lb CH4/MCF 0.05
Other Sources of Emissions, Point Source(prior to flaring) lb CH4/MCF 0.02
Other Sources of Emissions, Fugitive lb CH4/MCF 0.03
22
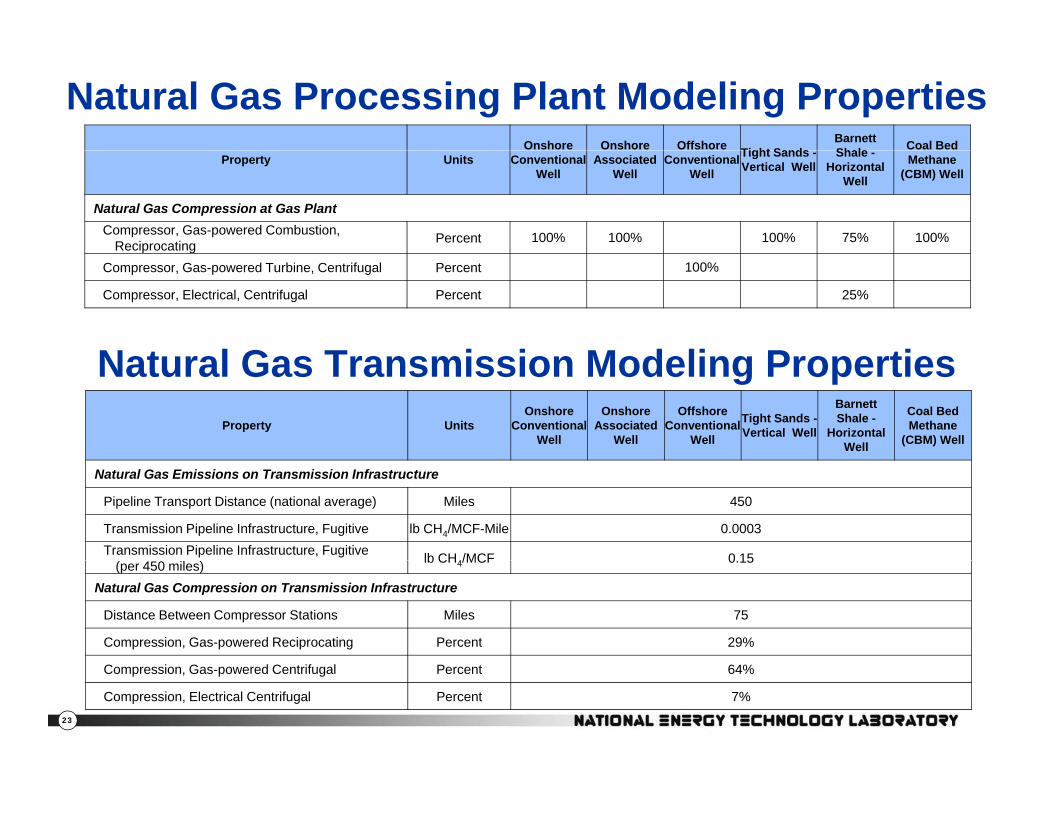
Natural Gas Processing Plant Modeling PropertiesOnshore Onshore Offshore Tight Sands
Barnett Shale Coal Bed
Property Units Conventional Well
Associated Well
Conventional Well
Tight Sands -Vertical Well
Shale -Horizontal
Well
Methane (CBM) Well
Natural Gas Compression at Gas PlantCompressor, Gas-powered Combustion,
Reciprocating Percent 100% 100% 100% 75% 100%p gCompressor, Gas-powered Turbine, Centrifugal Percent 100%
Compressor, Electrical, Centrifugal Percent 25%
N t l G T i i M d li P tiNatural Gas Transmission Modeling PropertiesProperty Units
Onshore Conventional
Well
Onshore Associated
Well
Offshore Conventional
Well
Tight Sands -Vertical Well
Barnett Shale -
Horizontal Well
Coal Bed Methane
(CBM) Well
Natural Gas Emissions on Transmission Infrastructure
Pipeline Transport Distance (national average) Miles 450
Transmission Pipeline Infrastructure, Fugitive lb CH4/MCF-Mile 0.0003Transmission Pipeline Infrastructure, Fugitive lb CH4/MCF 0 15(per 450 miles) lb CH4/MCF 0.15
Natural Gas Compression on Transmission Infrastructure
Distance Between Compressor Stations Miles 75
Compression, Gas-powered Reciprocating Percent 29%
23
Compression, Gas-powered Centrifugal Percent 64%
Compression, Electrical Centrifugal Percent 7%
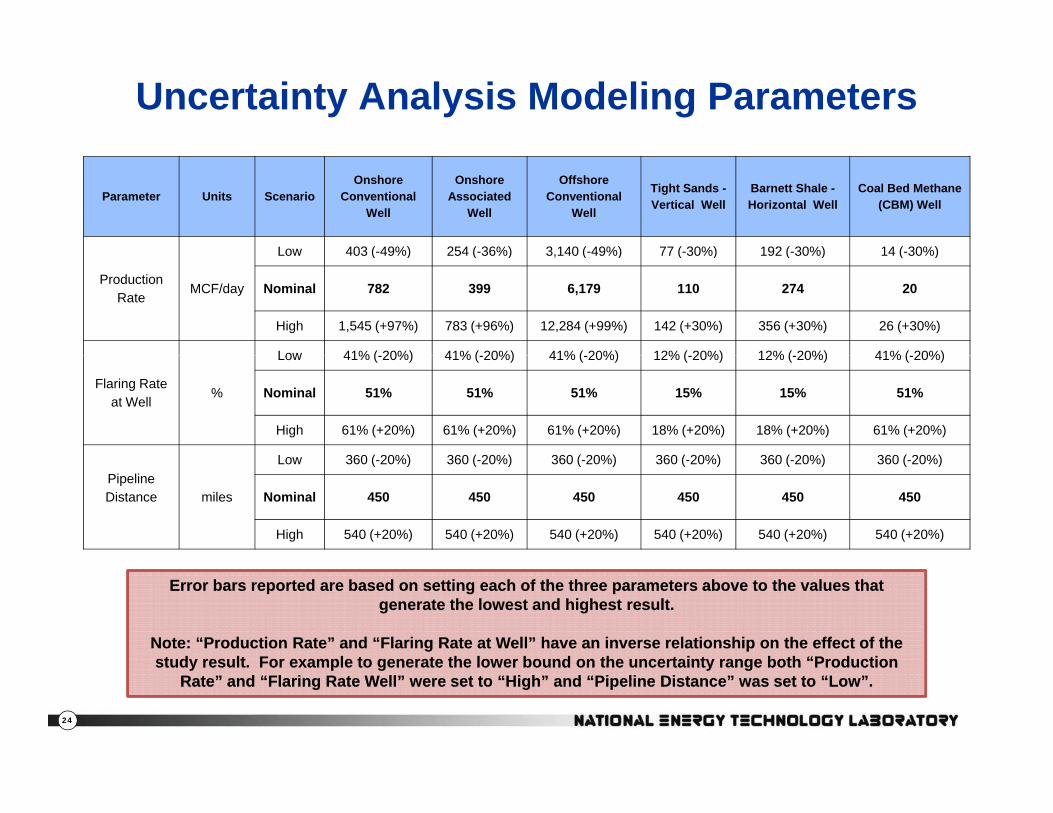
Uncertainty Analysis Modeling Parameters
Parameter Units ScenarioOnshore
Conventional Well
Onshore Associated
Well
Offshore Conventional
Well
Tight Sands -Vertical Well
Barnett Shale -Horizontal Well
Coal Bed Methane (CBM) Well
Low 403 (-49%) 254 (-36%) 3 140 (-49%) 77 (-30%) 192 (-30%) 14 (-30%)
Production Rate
MCF/day
Low 403 ( 49%) 254 ( 36%) 3,140 ( 49%) 77 ( 30%) 192 ( 30%) 14 ( 30%)
Nominal 782 399 6,179 110 274 20
High 1,545 (+97%) 783 (+96%) 12,284 (+99%) 142 (+30%) 356 (+30%) 26 (+30%)
Low 41% ( 20%) 41% ( 20%) 41% ( 20%) 12% ( 20%) 12% ( 20%) 41% ( 20%)
Flaring Rate at Well
%
Low 41% (-20%) 41% (-20%) 41% (-20%) 12% (-20%) 12% (-20%) 41% (-20%)
Nominal 51% 51% 51% 15% 15% 51%
High 61% (+20%) 61% (+20%) 61% (+20%) 18% (+20%) 18% (+20%) 61% (+20%)
Low 360 ( 20%) 360 ( 20%) 360 ( 20%) 360 ( 20%) 360 ( 20%) 360 ( 20%)Pipeline Distance miles
Low 360 (-20%) 360 (-20%) 360 (-20%) 360 (-20%) 360 (-20%) 360 (-20%)
Nominal 450 450 450 450 450 450
High 540 (+20%) 540 (+20%) 540 (+20%) 540 (+20%) 540 (+20%) 540 (+20%)
Error bars reported are based on setting each of the three parameters above to the values that generate the lowest and highest result.
Note: “Production Rate” and “Flaring Rate at Well” have an inverse relationship on the effect of the study result For example to generate the lower bound on the uncertainty range both “Production
24
study result. For example to generate the lower bound on the uncertainty range both Production Rate” and “Flaring Rate Well” were set to “High” and “Pipeline Distance” was set to “Low”.
study result. For example to generate the lower bound on the uncertainty range both Production Rate” and “Flaring Rate Well” were set to “High” and “Pipeline Distance” was set to “Low”.

Accounting for Natural Gas from Extractionthru Delivery to a Large End-User
Onshore 23%
Fugitive 1.7%Point Source 2.5%Fuel Use 6.8%
y g(Percent Mass Basis)
Onshore 23%
Associated 7%
Offshore 13%
TransportTight 32%
Processing
89%91%99%
Extraction
Shale 16%
CBM 9%
11% of Natural Gas Extracted from the Earth is Consumed for Fuel Use, Flared, or
Emitted to the Atmosphere(point source or fugitive)
11% of Natural Gas Extracted from the Earth is Consumed for Fuel Use, Flared, or
Emitted to the Atmosphere(point source or fugitive)
Natural GasResource Table
Raw Material Acquisition Raw Material Transport
Cradle-to-GateTotal:Extraction Processing
Extracted from Ground 100% N/A N/A 100%Fugitive Losses 1.1% 0.2% 0.4% 1.7%Point Source Losses (Vented or Flared) 0.1% 2.4% 0.0% 2.5%
25
Of this, 62% is Used to Power EquipmentOf this, 62% is Used to Power Equipment( e ted o a ed)Fuel Use 0.0% 5.3% 1.6% 6.8%Delivered to End User N/A N/A 89.0% 89.0%

Life Cycle GHG Results for Average Natural Gas Extraction and Delivery to a Large End-User
60
Raw Material Acquisition Raw Material Transport
y g
Domestic Average Mix = 25.2 lb CO2e/MMBtuDomestic Average Mix = 25.2 lb CO2e/MMBtu
45.8
40
50
ng P
oten
tial
Domestic Average Mix 25.2 lb CO2e/MMBtuLow = 19.6, High = 33.4
Domestic Average Mix 25.2 lb CO2e/MMBtuLow = 19.6, High = 33.4
32.2
21 8
32.3
30
year
Glo
bal W
arm
inb
CO₂e
/MM
Btu
)
Domestic Average, 25.2
19.3
16.118.0
21.8
10
20
2007
IPC
C 1
00-y (l
0Onshore23.3%
Offshore13.1%
Associated6.8%
Tight Gas32.0%
CBM8.8%
Barnett15.9%
Imported LNG0.0%
26
Conventional Unconventional
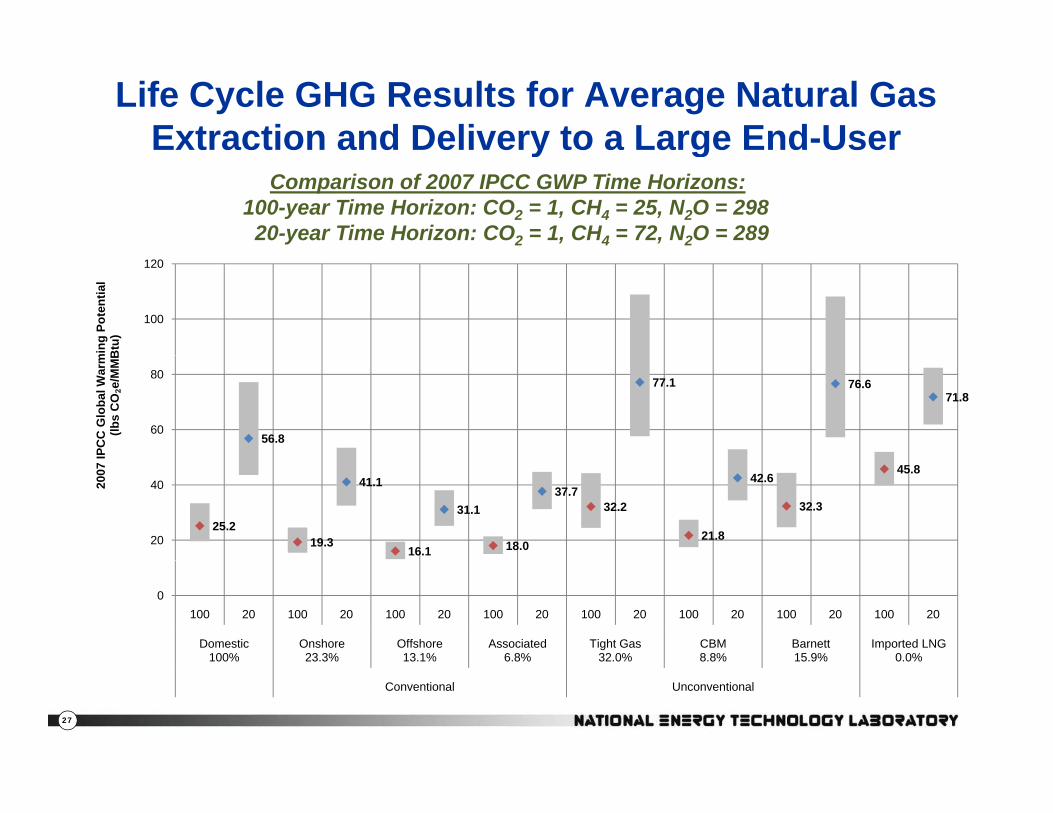
Life Cycle GHG Results for Average Natural Gas Extraction and Delivery to a Large End-Usery g
Comparison of 2007 IPCC GWP Time Horizons:100-year Time Horizon: CO2 = 1, CH4 = 25, N2O = 298
20-year Time Horizon: CO2 = 1, CH4 = 72, N2O = 289
100
120
min
g Po
tent
ial
Btu
)
56.8
77.1 76.671.8
60
80
IPC
C G
loba
l War
m(lb
s C
O₂e
/MM
B
25.219.3
41.1
16.1
31.1
18.0
37.732.2
21.8
42.6
32.3
45.8
20
402007
I
0100 20 100 20 100 20 100 20 100 20 100 20 100 20 100 20
Domestic100%
Onshore23.3%
Offshore13.1%
Associated6.8%
Tight Gas32.0%
CBM8.8%
Barnett15.9%
Imported LNG0.0%
27
Conventional Unconventional
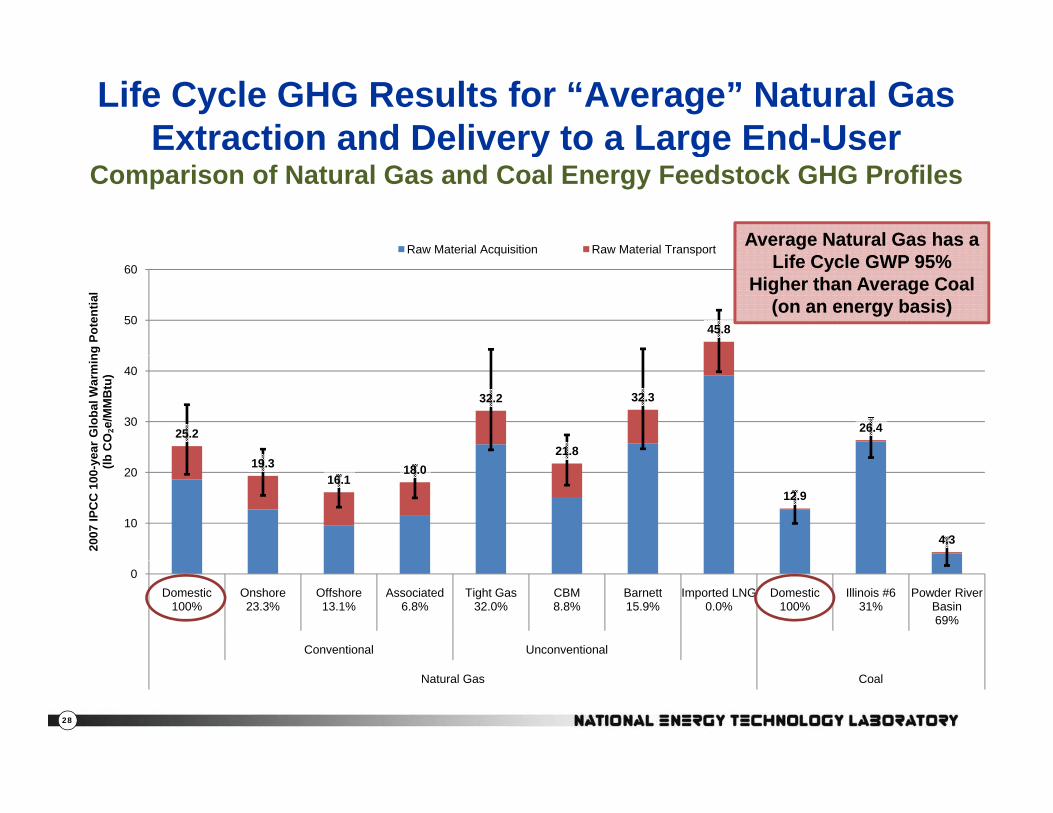
Life Cycle GHG Results for “Average” Natural Gas Extraction and Delivery to a Large End-User
Raw Material Acquisition Raw Material Transport
y gComparison of Natural Gas and Coal Energy Feedstock GHG Profiles
Average Natural Gas has a Average Natural Gas has a
45.850
60
ng P
oten
tial
Raw Material Acquisition Raw Material TransportLife Cycle GWP 95%
Higher than Average Coal (on an energy basis)
Life Cycle GWP 95% Higher than Average Coal
(on an energy basis)
25.2
32.2
21.8
32.3
26.430
40
ear
Glo
bal W
arm
inb
CO₂e
/MM
Btu
)
19.316.1
18.0
12.9
4.310
20
2007
IPC
C 1
00-y
e(lb
0Domestic
100%Onshore23.3%
Offshore13.1%
Associated6.8%
Tight Gas32.0%
CBM8.8%
Barnett15.9%
Imported LNG0.0%
Domestic100%
Illinois #631%
Powder River Basin69%
Conventional Unconventional
28
Natural Gas Coal

A Deeper Look at Unconventional Natural Gas Extraction via Horizontal Well, Hydraulic FracturingExtraction via Horizontal Well, Hydraulic Fracturing
(the Barnett Shale Model)
29
Source: NETL, Shale Gas: Applying Technology to Solve America’s Energy Challenge, January 2011
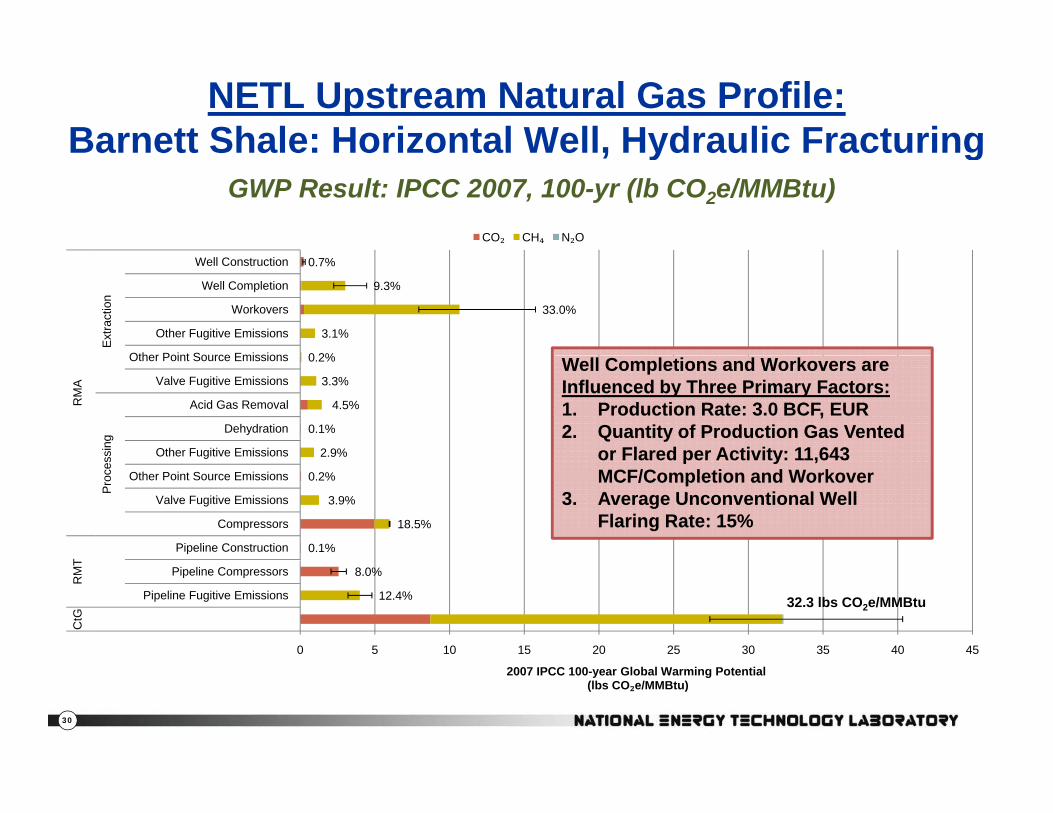
NETL Upstream Natural Gas Profile:Barnett Shale: Horizontal Well, Hydraulic Fracturing
CO₂ CH₄ N₂O
Barnett Shale: Horizontal Well, Hydraulic FracturingGWP Result: IPCC 2007, 100-yr (lb CO2e/MMBtu)
0 2%
3.1%
33.0%
9.3%
0.7%
Other Point Source Emissions
Other Fugitive Emissions
Workovers
Well Completion
Well Construction
Ext
ract
ion
2.9%
0.1%
4.5%
3.3%
0.2%
Other Fugitive Emissions
Dehydration
Acid Gas Removal
Valve Fugitive Emissions
Other Point Source Emissions
ssin
g
RM
A
Well Completions and Workovers are Influenced by Three Primary Factors:1. Production Rate: 3.0 BCF, EUR2. Quantity of Production Gas Vented
or Flared per Activity: 11,643
Well Completions and Workovers are Influenced by Three Primary Factors:1. Production Rate: 3.0 BCF, EUR2. Quantity of Production Gas Vented
or Flared per Activity: 11,643
0.1%
18.5%
3.9%
0.2%
Pipeline Construction
Compressors
Valve Fugitive Emissions
Other Point Source Emissions
g
Pro
ces
T
or Flared per Activity: 11,643 MCF/Completion and Workover
3. Average Unconventional Well Flaring Rate: 15%
or Flared per Activity: 11,643 MCF/Completion and Workover
3. Average Unconventional Well Flaring Rate: 15%
32.3 lbs CO2e/MMBtu12.4%
8.0%
0 5 10 15 20 25 30 35 40 45
Pipeline Fugitive Emissions
Pipeline Compressors
CtG
RM
T
30
2007 IPCC 100-year Global Warming Potential(lbs CO₂e/MMBtu)

NETL Upstream Natural Gas Profile:Barnett Shale: Horizontal Well, Hydraulic FracturingBarnett Shale: Horizontal Well, Hydraulic Fracturing
Sensitivity Analysis Default Value Units
11,508 lb/day
489,023 lb/episode33.0%-42.6%
Workover Vent Barnett
Prod. Rate Barnett
0.118 episodes/yr
450 miles
489,023 lb/episode
15.0 %
100 %-5 6%-6.2%
9.3%22.0%
33.0%
Processing flare rate
Extraction flaring, Barnett
Completion Vent Barnett
Pipeline Distance
Workover Frequency, Unconv.
100 %
0.001480 lb fugitives/lb processed gas
0.001210 lb fugitives/lb extracted gas
0.001119 lb fugitives/lb extracted gas
0.001089 lb fugitives/lb processed gas2.9%3.1%3.3%4.0%
-5.6%
Other Fugitive, Processing
Other Fugitive, Onshore
Pneumatic Fugitives, Onshore
Pneumatic Fugitives, Processing
Processing flare rate
g p g
25 %
7 %
13,000 feet
0.0003940 lb fugitives/lb processed gas0.2%0.7%0.8%1.0%
Other Point Vent, Processing
Well depth, Barnett
Pipeline Electric Compressor
Barnett Electric Compressor
“0%” = 32.3 lb CO2e/MMBtu Delivered; IPCC 2007, 100-yr Time Horizon
Example: A 1% increase in production rate from 11,508 lb/day to 11,623 lb/day results in a 0 426% decrease in cradle to gate GWP from 32 3 to
Example: A 1% increase in production rate from 11,508 lb/day to 11,623 lb/day results in a 0 426% decrease in cradle to gate GWP from 32 3 to
-60% -40% -20% 0% 20% 40% 60%
31
results in a 0.426% decrease in cradle-to-gate GWP, from 32.3 to 32.2 lbs CO2e/MMBturesults in a 0.426% decrease in cradle-to-gate GWP, from 32.3 to 32.2 lbs CO2e/MMBtu

Question #6:How does natural gas power generation compare to coal-fired power generation
on a life cycle GHG basis?
32
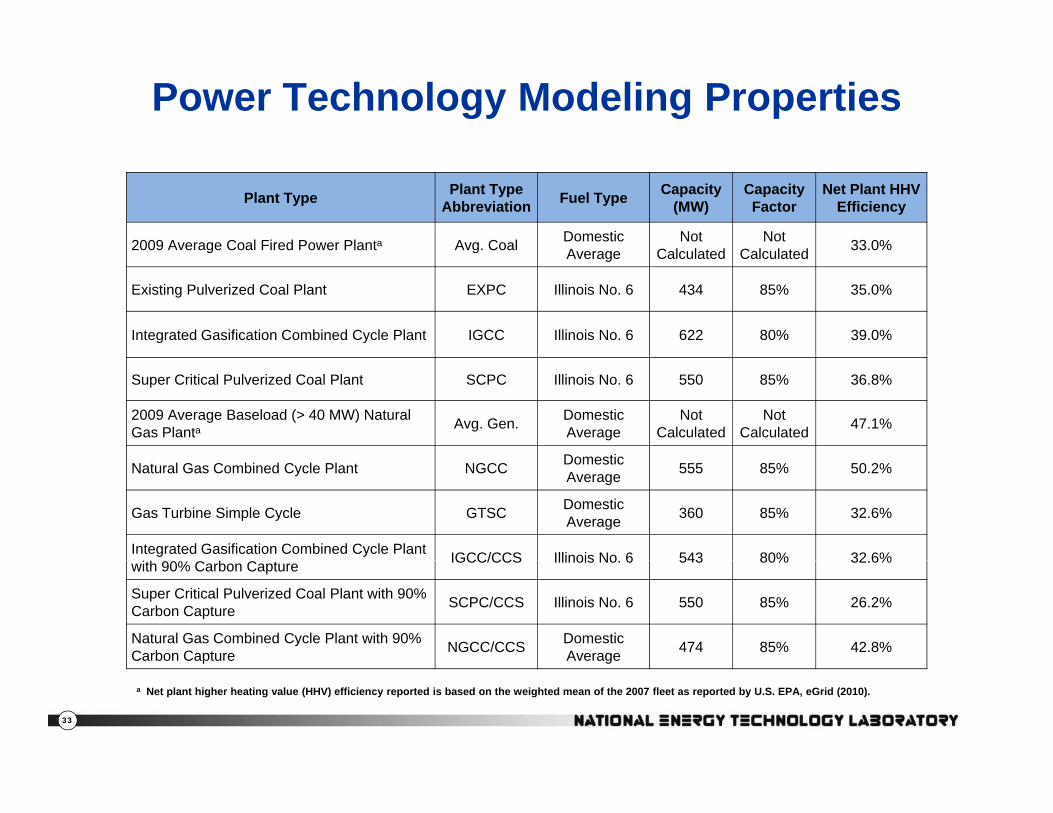
Power Technology Modeling Properties
Plant Type Plant Type Abbreviation Fuel Type Capacity
(MW) Capacity Factor
Net Plant HHV Efficiency
2009 Average Coal Fired Power Planta Avg. Coal Domestic Average
NotCalculated
NotCalculated 33.0%g g Average Calculated Calculated
Existing Pulverized Coal Plant EXPC Illinois No. 6 434 85% 35.0%
Integrated Gasification Combined Cycle Plant IGCC Illinois No. 6 622 80% 39.0%
Super Critical Pulverized Coal Plant SCPC Illinois No. 6 550 85% 36.8%
2009 Average Baseload (> 40 MW) Natural Gas Planta Avg. Gen. Domestic
AverageNot
CalculatedNot
Calculated 47.1%
DomesticNatural Gas Combined Cycle Plant NGCC Domestic Average 555 85% 50.2%
Gas Turbine Simple Cycle GTSC Domestic Average 360 85% 32.6%
Integrated Gasification Combined Cycle Plant IGCC/CCS Illinois No 6 543 80% 32 6%with 90% Carbon Capture IGCC/CCS Illinois No. 6 543 80% 32.6%
Super Critical Pulverized Coal Plant with 90% Carbon Capture SCPC/CCS Illinois No. 6 550 85% 26.2%
Natural Gas Combined Cycle Plant with 90% Carbon Capture NGCC/CCS Domestic
Average 474 85% 42.8%
33
p g
a Net plant higher heating value (HHV) efficiency reported is based on the weighted mean of the 2007 fleet as reported by U.S. EPA, eGrid (2010).

Comparison of Power Generation Technology Life Cycle GHG Footprints
3 000
Raw Material Acquisition Raw Material Transport Energy Conversion Facility Product Transport
Life Cycle GHG FootprintsRaw Material Acquisition thru Delivery to End Customer (lb CO2e/MWh)
2,453 2,461
2,085 2,100
2,500
3,000
g Po
tent
ial
Average Natural Gas Baseload Power Generationhas a Life Cycle GWP 55% Lower than
Average Coal Baseload Power Generation on a 100-year Time Horizon
Average Natural Gas Baseload Power Generationhas a Life Cycle GWP 55% Lower than
Average Coal Baseload Power Generation on a 100-year Time Horizon
1 139 1 096
1,644
1,500
2,000
ear
Glo
bal W
arm
ing
bs C
O₂e
/MW
h)
1,0411,139 1,096 1,072
473572
353500
1,000
2007
IPC
C 1
00-y
e (lb
0Avg. Coal EXPC IGCC SCPC Avg. Gen. Avg. Gen. Avg. Gen. NGCC GTSC IGCC SCPC NGCC
Domestic Mix
Illinois #6 Conv. Gas Unconv. Gas
Domestic Mix With Carbon Capture
34
Mix Gas
Coal Natural Gas
Note: EXPC, IGCC, SCPC, and NGCC (combustion) results, with and without CCS, are based on scenario specific modeling parameters; not industry average data.
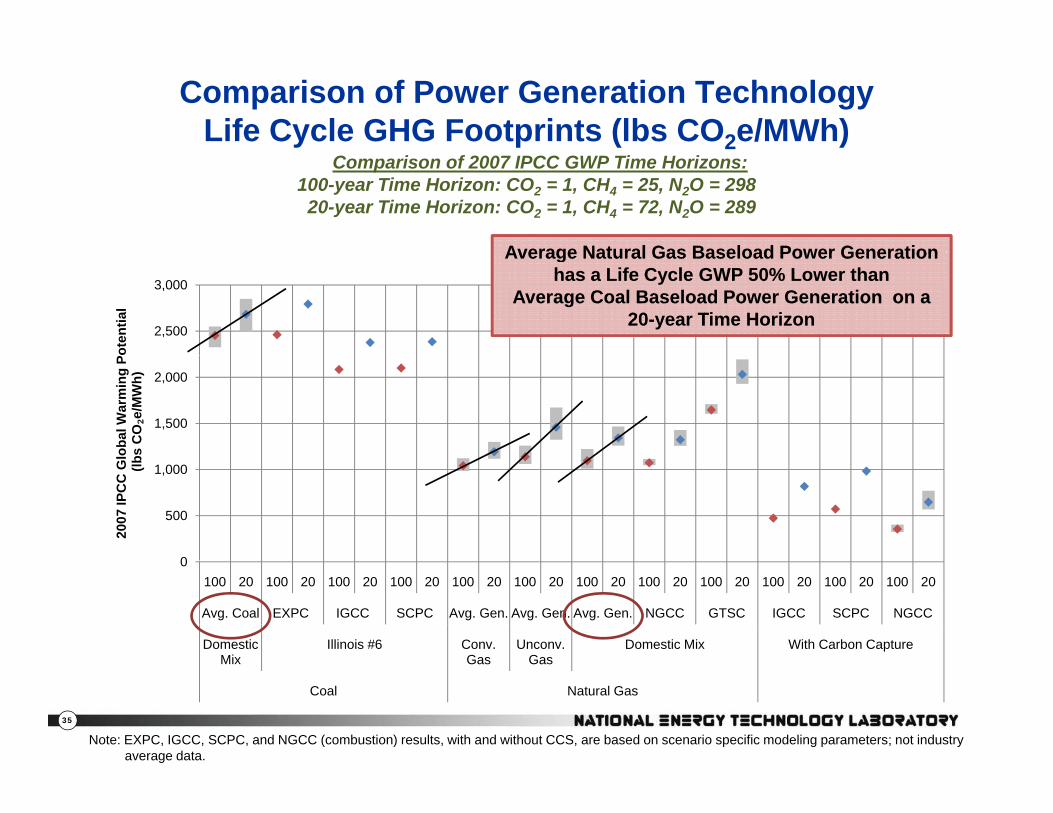
Comparison of Power Generation TechnologyLife Cycle GHG Footprints (lbs CO2e/MWh)
Average Natural Gas Baseload Power GenerationAverage Natural Gas Baseload Power Generation
Comparison of 2007 IPCC GWP Time Horizons:100-year Time Horizon: CO2 = 1, CH4 = 25, N2O = 29820-year Time Horizon: CO2 = 1, CH4 = 72, N2O = 289
2,500
3,000
oten
tial
Average Natural Gas Baseload Power Generationhas a Life Cycle GWP 50% Lower than
Average Coal Baseload Power Generation on a 20-year Time Horizon
Average Natural Gas Baseload Power Generationhas a Life Cycle GWP 50% Lower than
Average Coal Baseload Power Generation on a 20-year Time Horizon
1,500
2,000
loba
l War
min
g P
bs C
O₂e
/MW
h)
0
500
1,000
2007
IPC
C G
l(lb
0100 20 100 20 100 20 100 20 100 20 100 20 100 20 100 20 100 20 100 20 100 20 100 20
Avg. Coal EXPC IGCC SCPC Avg. Gen. Avg. Gen. Avg. Gen. NGCC GTSC IGCC SCPC NGCC
Domestic Mix
Illinois #6 Conv. Gas
Unconv. Gas
Domestic Mix With Carbon Capture
35
Mix Gas Gas
Coal Natural Gas
Note: EXPC, IGCC, SCPC, and NGCC (combustion) results, with and without CCS, are based on scenario specific modeling parameters; not industry average data.
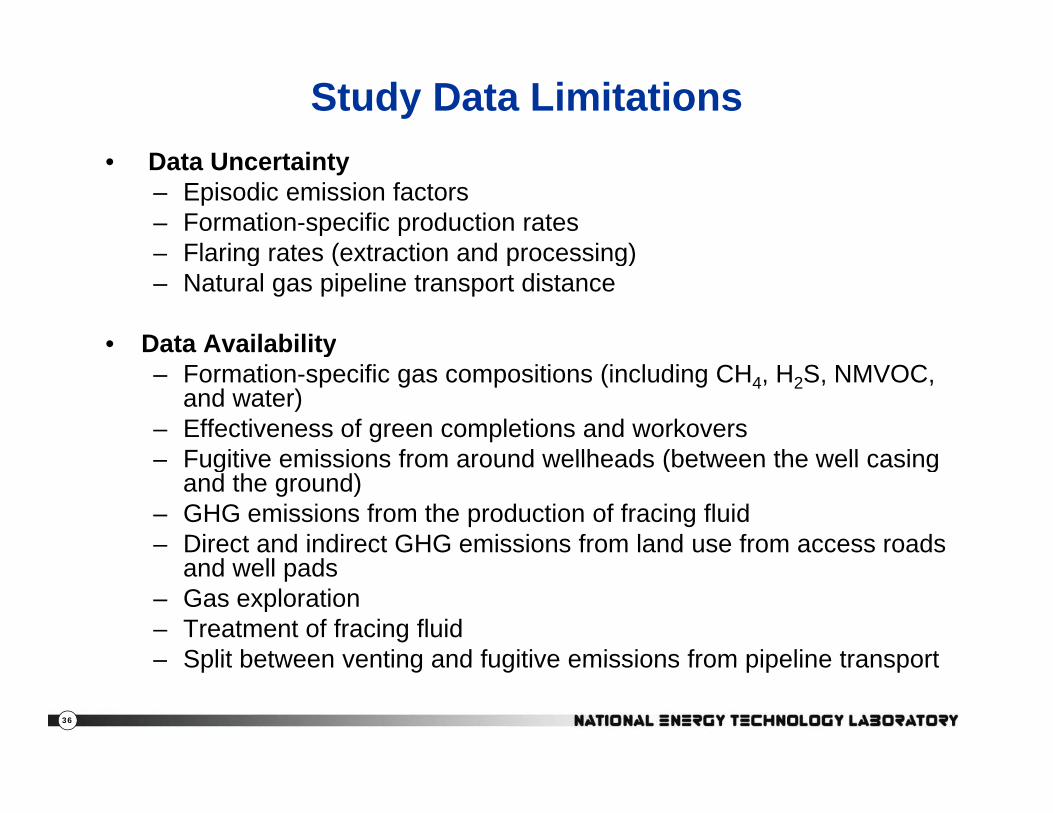
Study Data Limitations• Data Uncertainty
– Episodic emission factors– Formation-specific production rates
Flaring rates (extraction and processing)– Flaring rates (extraction and processing)– Natural gas pipeline transport distance
• Data Availabilityy– Formation-specific gas compositions (including CH4, H2S, NMVOC,
and water)– Effectiveness of green completions and workovers
Fugitive emissions from around wellheads (between the well casing– Fugitive emissions from around wellheads (between the well casing and the ground)
– GHG emissions from the production of fracing fluid– Direct and indirect GHG emissions from land use from access roads
d ll dand well pads– Gas exploration– Treatment of fracing fluid– Split between venting and fugitive emissions from pipeline transport
36
Split between venting and fugitive emissions from pipeline transport
Question #7:What are the opportunities for reducing
GHG emissions?
37

Technology Opportunities• Opportunities for Reducing the GHG Footprint of Natural Gas
Extraction and Delivery– Reduce emissions from unconventional gas well completions and
workovers• Better data is needed to properly characterize this opportunity based on
basin type, drilling method, and production rate– Improve compressor fuel efficiency– Reduce pipeline fugitive emissions thru technology and bestReduce pipeline fugitive emissions thru technology and best
management practices (collaborative initiatives)
• Opportunities for Reducing the GHG Footprint of Natural Gas and Coal-fired Power GenerationCoal-fired Power Generation– Capture the CO2 at the power plant and sequester it in a saline
aquifer or oil bearing reservoir (CO2-EOR)– Improve existing power plant efficiency– Invest in advanced power research, development, and
demonstrationAll Opportunities Need to Be Evaluated on a Sustainable Energy Basis:
Environmental Performance Economic Performance and Social Performance
38
Environmental Performance, Economic Performance, and Social Performance(e.g., energy reliability and security)

Data SourcesALL Consulting. "Coal Bed Methane Primer: New Source of Natural Gas - Environmental
Implications." 2004.American Petroleum Institute (API). "Compendium of Greenhouse Gas Emissions for the Oil
and Natural Gas Industry." 2009. htt // i / h / li t / / l d/2009 GHG COMPENDIUM df ( d Mhttp://www.api.org/ehs/climate/new/upload/2009_GHG_COMPENDIUM.pdf (accessed May 18, 2010).
Argonne National Laboratory. A White Paper Describing Produced Water from Production of Crude Oil, Natural Gas, and Coal Bed Methane. National Energy Technology Laboratory, 20042004.
—. "Transportation Technology R&D Center, DOE H2A Delivery Analysis." 2008. http://www.transportation.anl.gov/modeling_simulation/h2a_delivery_analysis/ (accessed November 11, 2008).
Arnold. Surface Production Operations: Design of gas-handling systems and facilities.p g g g yHouston, Texas: Gulf Professional Publishing, 1999.
Bylin, Carey, Zachary Schaffer, Vivek Goel, Donald Robinson, Alexandre do N. Campos, and Fernando Borensztein. Designing the Ideal Offshore Platform Methane Mitigation Strategy.Society of Petroleum Engineers, 2010.
Dennis, Scott M. "Improved Estimates of Ton-Miles." (Journal of Transportation and Statistics) 8, no. 1 (2005).
Department of Energy (DOE). "Buying an Energy-Efficient Electric Motor." U.S. Department of Energy, Industrial Technologies Program. 1996. http://www1 eere energy gov/industry/bestpractices/pdfs/mc 0382 pdf (accessed May 18
39
http://www1.eere.energy.gov/industry/bestpractices/pdfs/mc-0382.pdf (accessed May 18, 2010).
Data SourcesEnergy Information Administration (EIA). Annual Energy Outlook Early Release. U.S.
Department of Energy, Energy Information Administration, 2011.—. "Federal Gulf 2009: Distribution of Wells by Production Rate Bracket." www.eia.doe.gov.
November 2, 2010. http://www.eia.doe.gov/pub/oil_gas/petrosystem/fg_table.html ( d A il 5 2011)(accessed April 5, 2011).
—. "Natural Gas Gross Withdrawals and Production." www.eia.doe.gov. March 29, 2011. http://www.eia.doe.gov/dnav/ng/ng_prod_sum_a_EPG0_VRN_mmcf_a.htm (accessed April 5, 2011).
"Personal Communication with Damian Gaul " U S Department of Energy Energy—. Personal Communication with Damian Gaul. U.S. Department of Energy, Energy Information Administration, Natural Gas Division, Office of Oil and Gas, May 10, 2010.
—. United States Total 2008: Distribution of Wells by Production Rate Bracket. U.S. Department of Energy, Energy Information Administration, 2009.
— "United States total 2009: Distribution of Wells by Production Rate Bracket ". United States total 2009: Distribution of Wells by Production Rate Bracket. www.eia.doe.gov. December 29, 2010. http://www.eia.doe.gov/pub/oil_gas/petrosystem/us_table.html (accessed April 5, 2011).
—. "2009 U.S. Greenhouse Gas Inventory Report: Inventory of U.S. Greenhouse Gas Emissions and Sinks: 1990-2007." U.S. Environmental Protection Agency. 2009. http://www.epa.gov/climatechange/emissions/usinventoryreport.html.
Environmental Protection Agency (EPA). Background Technical Support Document -Petroleum and Natural Gas Industry. Washington, D.C.: U.S. Environmental Protection Agency, Climate Change Division, 2011.
40
Data SourcesEnvironmental Protection Agency (EPA). "Compilation of Air Pollutant Emission Factors,
Volume I: Stationary Point and Area Sources, AP-42." U.S. Environmental Protection Agency, Office of Air Quality Planning and Standards. 1995. http://www.epa.gov/ttnchie1/ap42 (accessed May 18, 2010).
I t f G h G E i i d Si k 1990 2008 W hi t D C U S—. Inventory of Greenhouse Gas Emissions and Sinks: 1990-2008. Washington, D.C.: U.S. Environmental Protection Agency, 2010.
—. "Natural Gas STAR Recommended Technologies and Practices - Gathering and Processing Sector." U.S. Environmental Protection Agency. 2010b. http://www epa gov/gasstar/documents/gathering and processing fs pdf (accessed Marchhttp://www.epa.gov/gasstar/documents/gathering_and_processing_fs.pdf (accessed March 2, 2011).
—. "Replacing Glycol Dehydrators with Desiccant Dehydrators." U.S. Environmental Protection Agency. October 2006. http://epa.gov/gasstar/documents/II_desde.pdf (accessed June 1, 2010).
Government Accountability Office (GAO). Federal Oil and Gas Leases: Opportunities Exist to Capture Vented and Flared Natural Gas, Which Would Increase Royalty Payments and Reduce Greenhouse Gases. GAO-11-34, U.S. Government Accountability Office, 2010.
—. "Natural Gas Flaring and Venting: Opportunities to Improve Data and Reduce Emissions." U S G t A t bilit Offi J l 2004U.S. Government Accountability Office. July 2004. http://www.gao.gov/new.items/d04809.pdf (accessed June 18, 2010).
GE Oil and Gas. Reciprocating Compressors. Florence, Italy: General Electric Company, 2005.Hayden, J., and D. Pursell. "The Barnett Shale: Visitors Guide to the Hottest Gas Play in the
U S " Pickering Energy Partners October 2005
41
U.S. Pickering Energy Partners. October 2005. http://www.tudorpickering.com/pdfs/TheBarnettShaleReport.pdf (accessed June 14, 2010).
Data SourcesHouston Advanced Research Center. "Natural Gas Compressor Engine Survey for Gas
Production and Processing Facilities, H68 Final Report." Houston Advanced Research Center. 2006. http://www.utexas.edu/research/ceer/GHG/files/ConfCallSupp/H068FinalReport.pdf (accessed May 18 2010)(accessed May 18, 2010).
Little, Jeff, interview by James Littlefield. Natural Gas Production Analyst (March 10, 2011).Lyle, Don. "Shales Revive Oilpatch, Gas Patch." 2011 North American Unconventional
Yearbook, November 10, 2011: 2010.NaturalGas org "Well Completion " Natural Gas org 2004NaturalGas.org. Well Completion. Natural Gas.org. 2004.
http://naturalgas.org/naturalgas/well_completion.asp#liftingwell (accessed July 1, 2010).National Energy Technology Laboratory (NETL). Cost and Performance Baseline for Fossil
Energy Plants: Volume 1. DOE/NETL-2010/1397, Pittsburgh, Pennsylvania: U.S. Department of Energy, 2010.p gy,
—. Life Cycle Analysis: Existing Pulverized Coal (EXPC) Power Plant. DOE/NETL-403/110809, Pittsburgh, Pennsylvania: U.S. Department of Energy, 2010.
—. Life Cycle Analysis: Integrated Gasification Combined Cycle (IGCC) Power Plant. DOE/NETL-403/110209, Pittsburgh, Pennsylvania: U.S. Department of Energy, 2010.
—. Life Cycle Analysis: Natural Gas Combined Cycle (NGCC) Power Plant. DOE/NETL-403/110509, Pittsburgh, Pennsylvania: U.S. Department of Energy, 2010
—. Life Cycle Analysis: Supercritical Pulverized Coal (SCPC) Power Plant. DOE/NETL-403/110609, Pittsburgh, Pennsylvania: U.S. Department of Energy, 2010.
42

Data SourcesPolasek. Selecting Amines for Sweetening Units. Bryan Research and Engineering, 2006.Steel Pipes & Tools. Steel Pipe Weight Calculator. 2009. http://www.steel-pipes-
tubes.com/steel-pipe-weight-calculator.html (accessed May 1, 2009).Swindell, Gary S. "Powder River Basin Coalbed Methane Wells – Reserves and Rates." 2007
SPE Rocky Mountain Oil & Gas Technology Symposium. Denver, Colorado: Society of Petroleum Engineers, 2007.
43

Recent NETL Life Cycle Assessment Reports
Available at http://www.netl.doe.gov/energy-analyses/:• Life Cycle Analysis: Existing Pulverized Coal (EXPC) Power Plant• Life Cycle Analysis: Integrated Gasification Combined Cycle (IGCC) Power Plant• Life Cycle Analysis: Natural Gas Combined Cycle (NGCC) Power Plant• Life Cycle Analysis: Supercritical Pulverized Coal (SCPC) Power Plant• Life Cycle Analysis: Power Studies Compilation Report
Analysis complete, report in draft form:• Life Cycle GHG Analysis of Natural Gas Extraction and Delivery• Life Cycle Assessment of Wind Power with GTSC Backup
Life Cycle Assessment of Nuclear Power• Life Cycle Assessment of Nuclear Power
Other related Life Cycle Analysis publications available on NETL web-site:• Life Cycle Analysis: Power Studies Compilation Report (Pres., LCA X Conference)• An Assessment of Gate-to-Gate Environmental Life Cycle Performance of Water-
Alternating-Gas CO2-Enhanced Oil Recovery in the Permian Basin (Report)• A Comparative Assessment of CO2 Sequestration through Enhanced Oil Recovery
and Saline Aquifer Sequestration (Presentation, LCA X Conference)
44
Contact Information
NETLNETLwww.netl.doe.gov
Office of Fossil Energywww.fe.doe.gov
Timothy J. Skone, P.E.Lead General EngineerOSEAP - Planning Team(412) 386-4495
Joe Marriott, PhDAssociateBooz Allen Hamilton(412) 386-7557
James LittlefieldAssociateBooz Allen Hamilton(412) 386-7560
45
(412) 386 [email protected]
(412) 386 [email protected]
(412) 386 [email protected]