Embed Size (px)
Citation preview
.
Inventorying Your Greenhouse Gas EmissionsInventorying Your Greenhouse Gas EmissionsExtracting Maximum Value With A Tier IVExtracting Maximum Value With A Tier IV
MethodologyMethodology
Presented by
ICF Consulting
October 2003
.
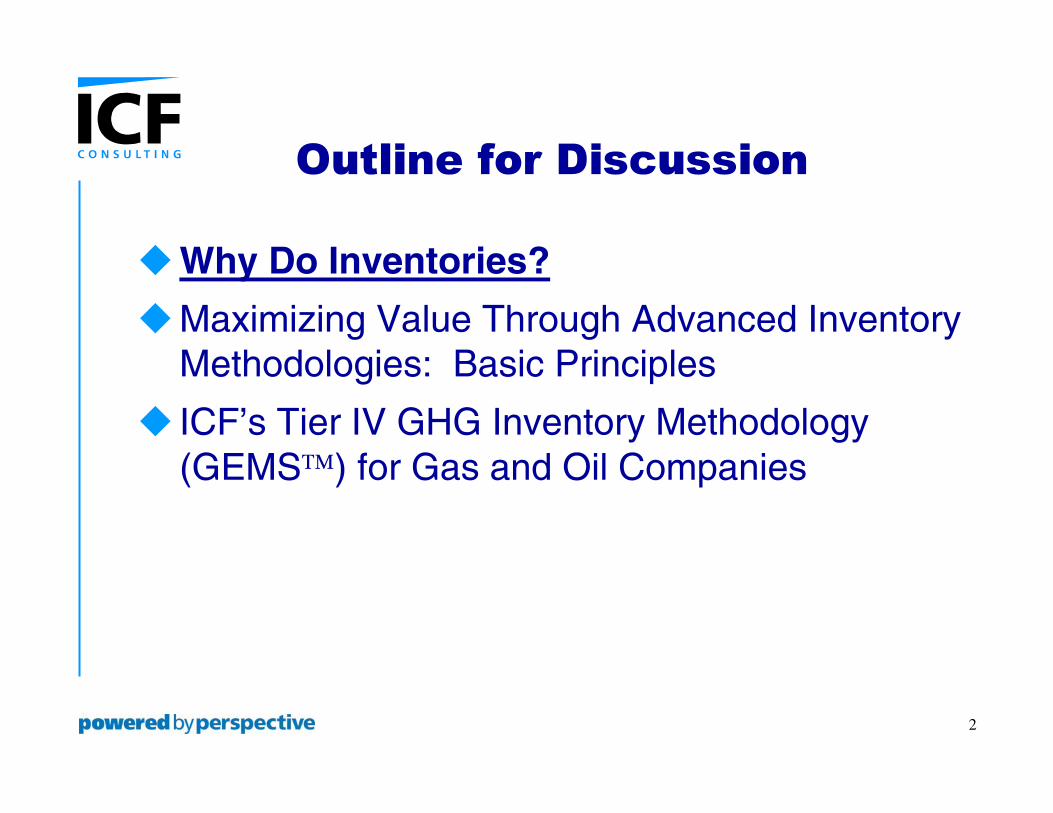
Outline for Discussion
� Why Do Inventories?
� Maximizing Value Through Advanced Inventory Methodologies: Basic Principles
� ICF’s Tier IV GHG Inventory Methodology (GEMS) for Gas and Oil Companies
2
.
Purpose of Inventories
� Establish an emissions footprint
� Report emissions
� Manage emissions
3
.
Managing Emissions
� Know sources by equipment
� Understand processes
� Know how emissions are affected by changes in processes or equipment
� Understand costs
� Compile and analyze emissions across reporting units
� Compare annual changes and reasons
4
.
Outline for Discussion
� Why Do Inventories?
� Maximizing Value Through Advanced Inventory Methodologies: Basic Principles
� ICF’s Tier IV GHG Inventory Methodology for Gas and Oil Companies
5
.
GHG Inventory System: Extract Maximum Value From Your
Investments
� Any inventory system should do more than just estimate emissions�It should automate assembly of data
�It should automate baseline and year-to-year comparisons
�It should analyze changes
�It should easily adapt to changes
� Above all, it should allow evaluation of investment opportunities
6
.
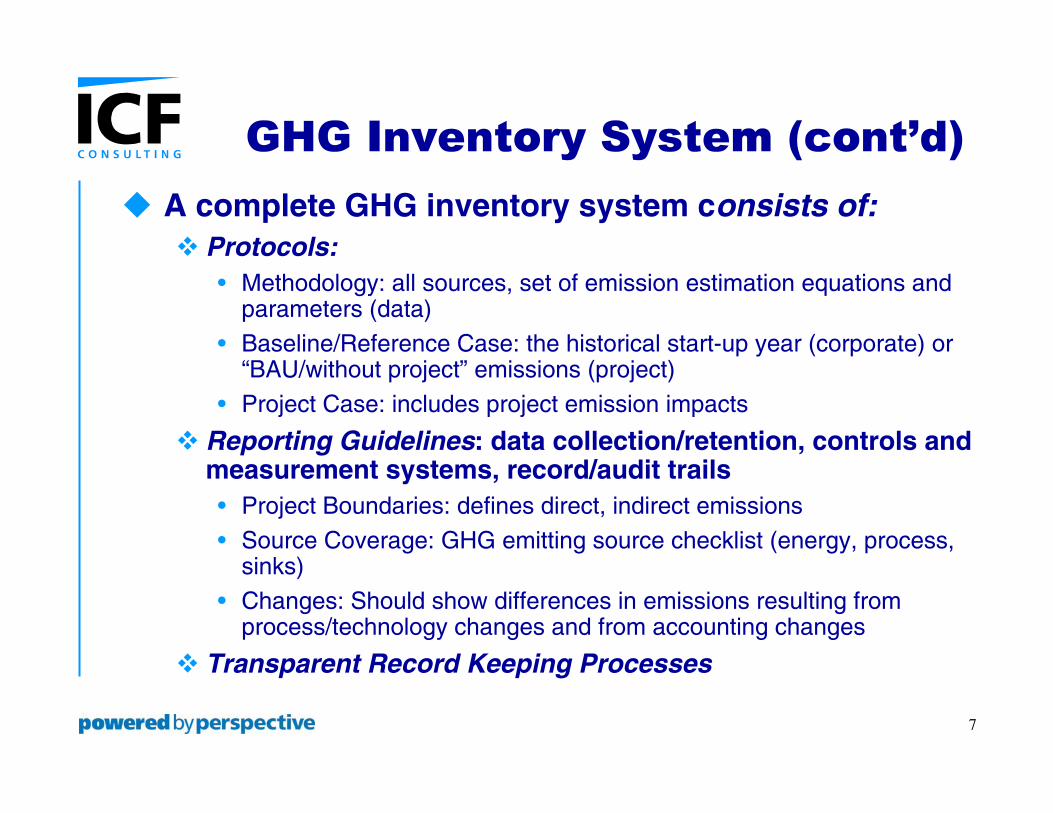
GHG Inventory System (cont’d)
� A complete GHG inventory system consists of: � Protocols:
• Methodology: all sources, set of emission estimation equations and parameters (data)
• Baseline/Reference Case: the historical start-up year (corporate) or “BAU/without project” emissions (project)
• Project Case: includes project emission impacts
� Reporting Guidelines: data collection/retention, controls and measurement systems, record/audit trails • Project Boundaries: defines direct, indirect emissions
• Source Coverage: GHG emitting source checklist (energy, process, sinks)
• Changes: Should show differences in emissions resulting from process/technology changes and from accounting changes
� Transparent Record Keeping Processes
7
.
Outline for Discussion
� Why Do Inventories?
� Maximizing Value Through Advanced Inventory Methodologies: Basic Principles
� ICF’s Tier IV GHG Inventory Methodology for Gas and Oil Companies
8
.
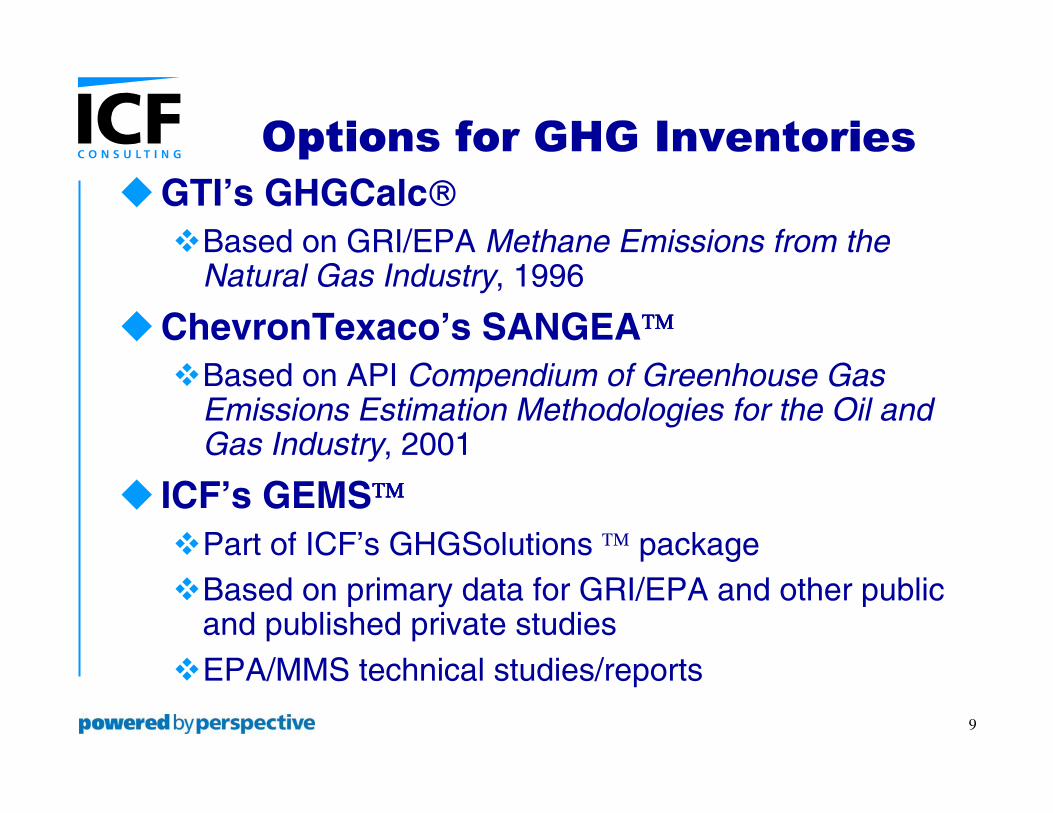
Options for GHG Inventories
� GTI’s GHGCalc�Based on GRI/EPA Methane Emissions from the
Natural Gas Industry, 1996
� ChevronTexaco’s SANGEA�Based on API Compendium of Greenhouse Gas
Emissions Estimation Methodologies for the Oil and Gas Industry, 2001
� ICF’s GEMS�Part of ICF’s GHGSolutions package �Based on primary data for GRI/EPA and other public
and published private studies�EPA/MMS technical studies/reports
9

.
What is a Tier IV Inventory?
� Tier 1 – national, top down statistics
� Tier 2 – industry, broad top down approach
� Tier 3 – more detailed industry, sources of emission by facility type, equipment
GRI/EPA 1996 factors used for this and the basis for current approaches
� Tier 4 – ICF’s unique approach based on specific technologies causing emissions within the source
Unbundles data in GRI/EPA 1996 factors and re-bundles by technology and source
10
.
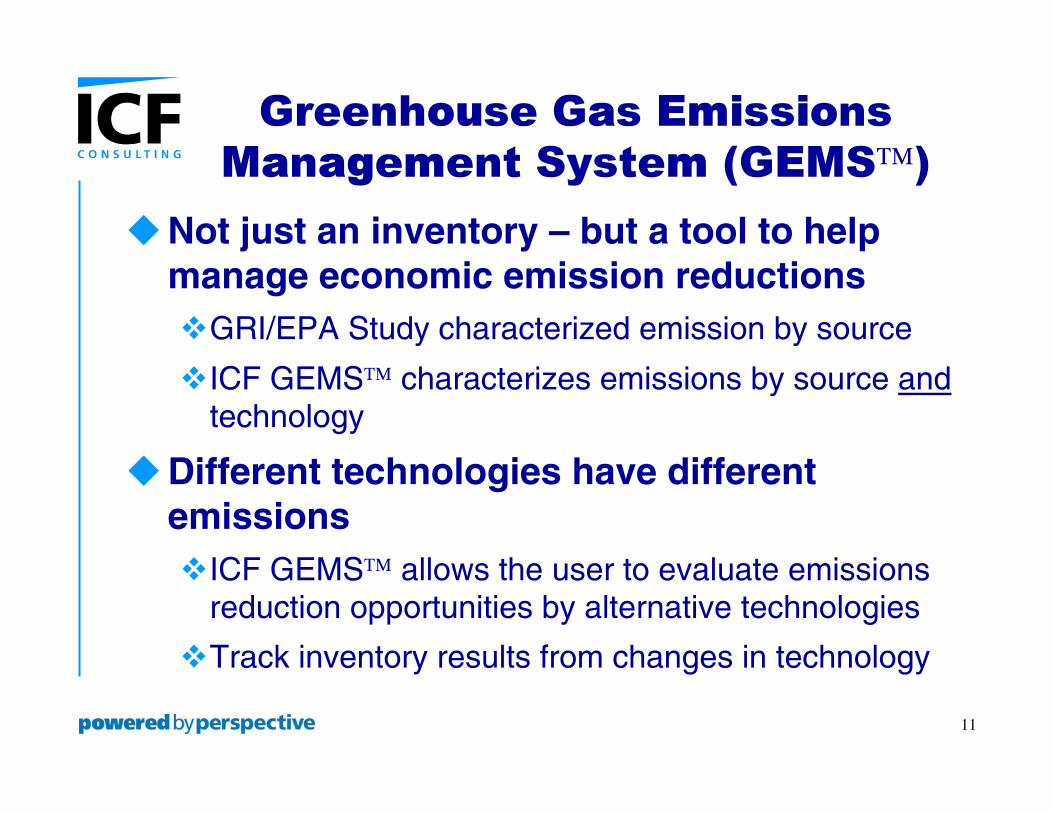
Greenhouse Gas Emissions
Management System (GEMS)
� Not just an inventory – but a tool to help manage economic emission reductions�GRI/EPA Study characterized emission by source
�ICF GEMS characterizes emissions by source and technology
� Different technologies have different emissions�ICF GEMS allows the user to evaluate emissions
reduction opportunities by alternative technologies
�Track inventory results from changes in technology
11
.
How is GEMS Assembled
� Excel workbook programs�Inventory Tool
�Compilation Tool
�Analytical Tool
�Back-up evaluation equations/data (proprietary)• Continuous Improvement Program
�Comparison Tool (in development)
�Configuration Tool (future)
� ICF configures the program for customer’s business sectors
12
.
GEMS Inventory Tool
� Excel workbook distributed to all BUs or facilities (reporting “entities”) �Stand-alone, simple user instructions
� Sources/Technologies configured for User � Choices of Data Input
�Recommended Method• Customized with field data (including defaults)
�Simple Method based on industry defaults �User Defined
13
.
STEP 4Comments
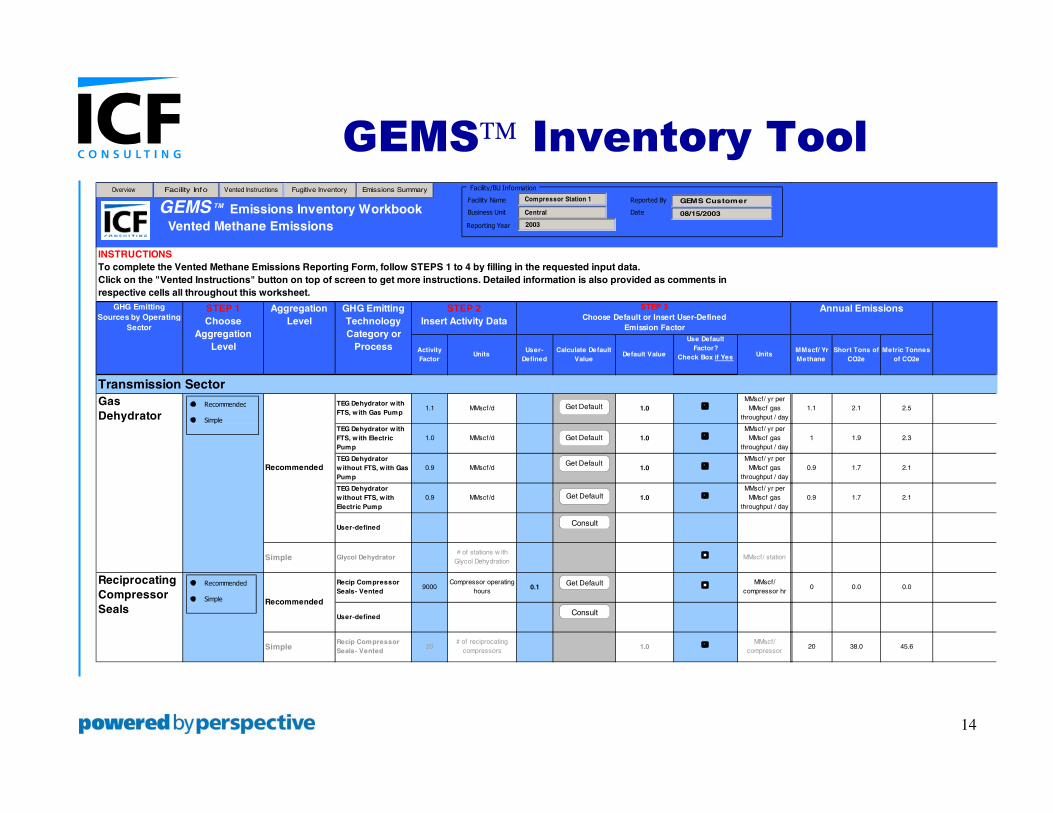
GEMS Inventory Tool
/d 1.0 /
/d 1.0 /
/d 1.0 /
/d 1.0 /
i ith Gl l i
/ i
ls0.1
/
ls20
i1.0
/
TM
g y g
g l I i
1
1
lt
i i i i i
d
lt
lt
lt
lt
y i
y
/
1
0
20
Activity Factor
Units User-
Defined Calculate Default
Value Default Value
Use Default Factor?
Check Box if Yes Units
Transmission Sector TEG Dehydrator w ith FTS, w ith Gas Pum p
1.1 MMscf
TRUE
MMscf yr per MMscf gas
throughput / day
TEG Dehydrator w ith FTS, w ith Electric Pum p
1.0 MMscf
TRUE
MMscf yr per MMscf gas
throughput / day
TEG Dehydrator w ithout FTS, with Gas Pum p
0.9 MMscf
TRUE
MMscf yr per MMscf gas
throughput / day
TEG Dehydrator w ithout FTS, with Electric Pump
0.9 MMscf
TRUE
MMscf yr per MMscf gas
throughput / day
User-defined
Simple Glycol Dehydrator # of stat ons w yco Dehydrat on
MMscf stat on
Recip Compressor Sea - Vented
9000 Compressor operating
hours MMscf
compressor hr
User-defined
Simple Recip Compressor Sea - Vented
# of rec procating compressors
TRUE
MMscf compressor
GEMS Emissions Inventory Workbook Vented Methane Emissions
INSTRUCTIONS To complete the Vented Methane Emissions Reportin Form, follow STEPS 1 to 4 b fillin in the requested input data. Click on the "Vented Instructions" button on top of screen to get more instructions. Detailed information is also provided as comments in respective cells all throughout this worksheet.
GHG Emitting Sources by Operatin
Sector
STEP 1 Choose
Aggregation Level
Aggregation Level
GHG Emitting Technology Category or
Process
STEP 2 Insert Activity Data
STEP 3 Choose Defau t or nsert User-Def ned
Emission Factor
Reciprocating Compressor Seals
Recommended
Gas Dehydrator
Recommended
Recommended
Simple
Get Defau
Consult
Overv ew Facility Info Vented Instruct ons Fugit ve Inventory Emss ons Summary Compressor Station 1
Central
GEMS Custom er
08/15/2003
2003
Recommende
Simple
Get Defau
Get Defau
Consult
Get Defau
Get Defau
Facilit /BU Informat on
Facilit Name
Business Unit
Reporting Year
Reported By
Date
MMscf Yr Methane
Short Tons of CO2e
Metric Tonnes of CO2e
1.1 2.1 2.5
1.9 2.3
0.9 1.7 2.1
0.9 1.7 2.1
0.0 0.0
38.0 45.6
Annual Emissions
14
.
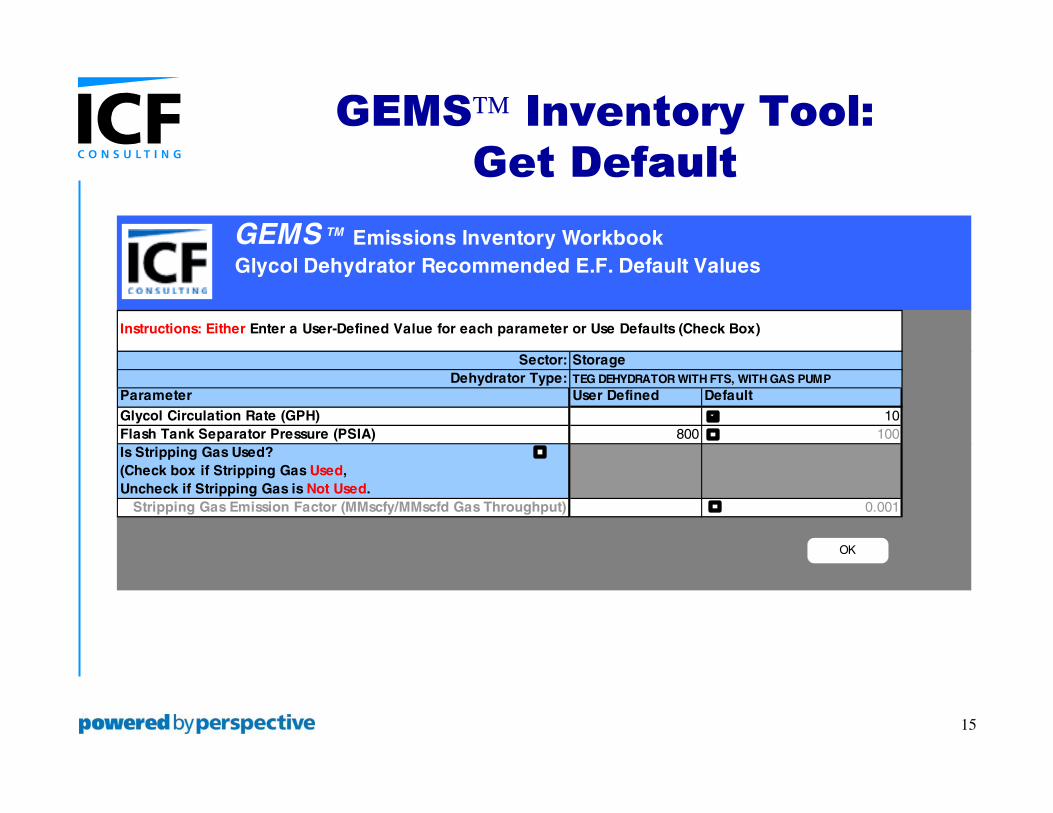
GEMS Inventory Tool:
Get Default
10 800 100
, .
/
TM
OK
Sector: Dehydrator Type:
Parameter User Defined Default Glycol Circulation Rate (GPH) Flash Tank Separator Pressure (PSIA) Is Stripping Gas Used? (Check box if Stripping Gas UsedUncheck if Stripping Gas is Not Used
Stripping Gas Emission Factor (MMscfy MMscfd Gas Throughput) 0.001
Instructions: Either Enter a User-Defined Value for each parameter or Use Defaults (Check Box)
Storage TEG DEHYDRATOR WITH FTS, WITH GAS PUMP
GEMS Emissions Inventory Workbook Glycol Dehydrator Recommended E.F. Default Values
15
.
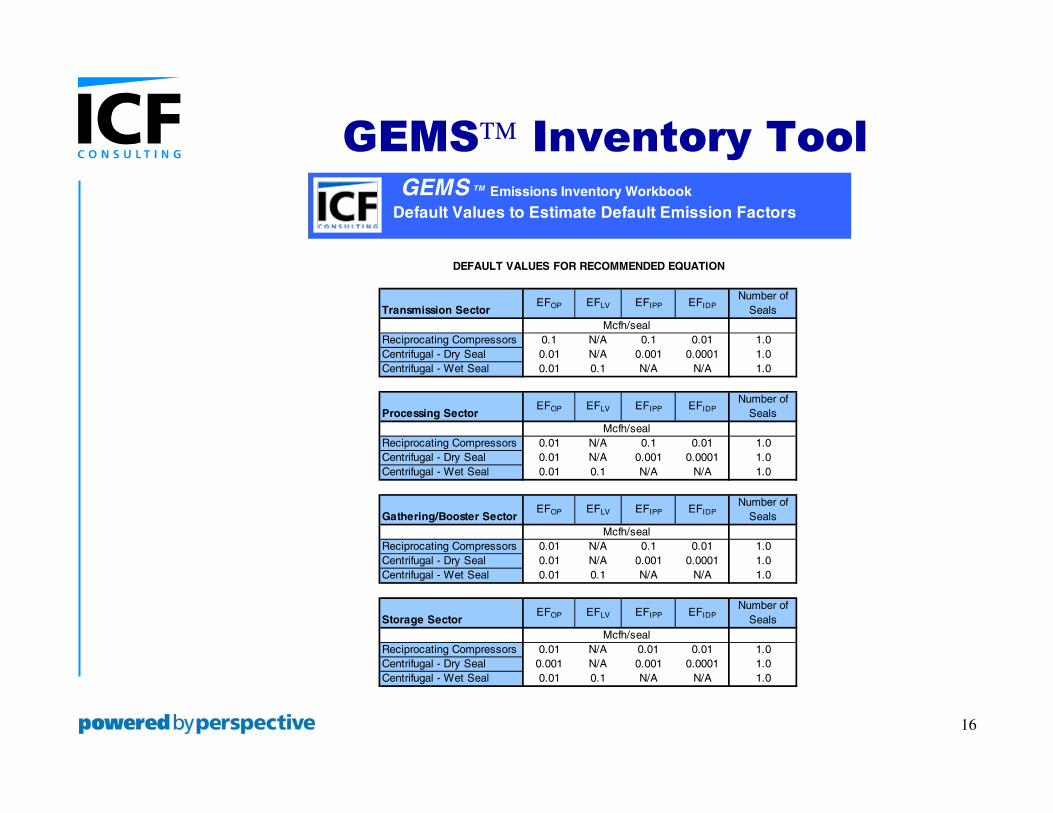
GEMS Inventory ToolTM GEMS Emissions Inventory Workbook
Default Values to Estimate Default Emission Factors
DEFAULT VALUES FOR RECOMMENDED EQUATION
EFOP EFLV EF EFIDP ls
i i N/A N/A
N/A N/A
EFOP EFLV EF EFIDP ls
i i N/A N/A
N/A N/A
EFOP EFLV EF EFIDP ls
i i N/A N/A
N/A N/A
EFOP EFLV EF EFIDP ls
i i N/A i N/A
N/A N/A
/ l
/ l
/ l
/ l
Transmission Sector IPP Number of
Sea
Rec procat ng Compressors 0.1 0.1 0.01 1.0 Centrifugal - Dry Seal 0.01 0.001 0.0001 1.0 Centrifugal - Wet Seal 0.01 0.1 1.0
Processing Sector IPP Number of
Sea
Rec procat ng Compressors 0.01 0.1 0.01 1.0 Centrifugal - Dry Seal 0.01 0.001 0.0001 1.0 Centrifugal - Wet Seal 0.01 0.1 1.0
Gathering/Booster Sector IPP Number of
Sea
Rec procat ng Compressors 0.01 0.1 0.01 1.0 Centrifugal - Dry Seal 0.01 0.001 0.0001 1.0 Centrifugal - Wet Seal 0.01 0.1 1.0
Storage Sector IPP Number of
Sea
Rec procat ng Compressors 0.01 0.01 0.01 1.0 Centr fugal - Dry Seal 0.001 0.001 0.0001 1.0 Centrifugal - Wet Seal 0.01 0.1 1.0
Mcfh sea
Mcfh sea
Mcfh sea
Mcfh sea
16
.
GEMS Compilation Tool
� Master Excel Workbook�Electronically compiles all inventories�Management report on inventories received�Exception report on missing inventories�Eleven sort options
• Company-wide • BUs • Etc
� Output Reports�Tables, bar charts, pie charts�Methane emissions and CO2 Equivalent
17
.
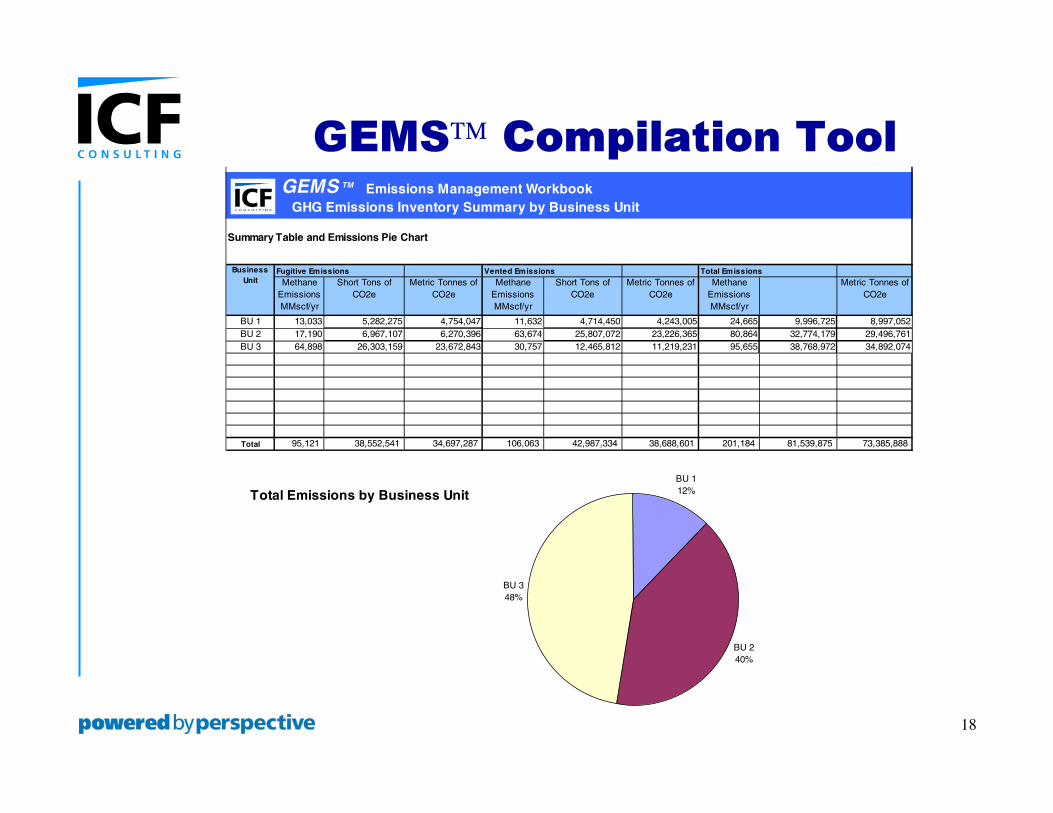
GEMS Compilation Tool
Summary Table and Emissions Pie Chart
GEMS TM Emissions Management Workbook GHG Emissions Inventory Summary by Business Unit
Business Unit
Fugitive Emissions Vented Emissions Total Emissions
Methane Short Tons of Metric Tonnes of Methane Short Tons of Metric Tonnes of Methane Metric Tonnes of Emissions CO2e CO2e Emissions CO2e CO2e Emissions CO2e MMscf/yr MMscf/yr MMscf/yr
BU 1 13,033 5,282,275 4,754,047 11,632 4,714,450 4,243,005 24,665 9,996,725 8,997,052 BU 2 17,190 6,967,107 6,270,396 63,674 25,807,072 23,226,365 80,864 32,774,179 29,496,761 BU 3 64,898 26,303,159 23,672,843 30,757 12,465,812 11,219,231 95,655 38,768,972 34,892,074
Total 95,121 38,552,541 34,697,287 106,063 42,987,334 38,688,601 201,184 81,539,875 73,385,888
BU 1
Total Emissions by Business Unit 12%
BU 3 48%
BU 2 40%
18
.
GEMS Analytical Tool
� Main Feature in Source/Technology Sort �Drop-down menus with lower emission alternatives
� Global settings�Price of natural gas (can be zero)�Value of carbon market credits (can be zero)�Capital/O&M cost indices (to update costs)�Discount rate for economics�Choices of units (e.g. metric tonnes CO2E)
� Evaluates potential emission reductions and economics
19
.
GEMS Analytical Tool Output
� Reports values of alternative(s) for inventories compiled
� Emissions reductions�Methane, CO2E
� Costs�Capital and O&M (tied to cost indices)
� Economics�Positive economics: NPV, IRR, payback
�Negative economics: break-even carbon credit
20
.
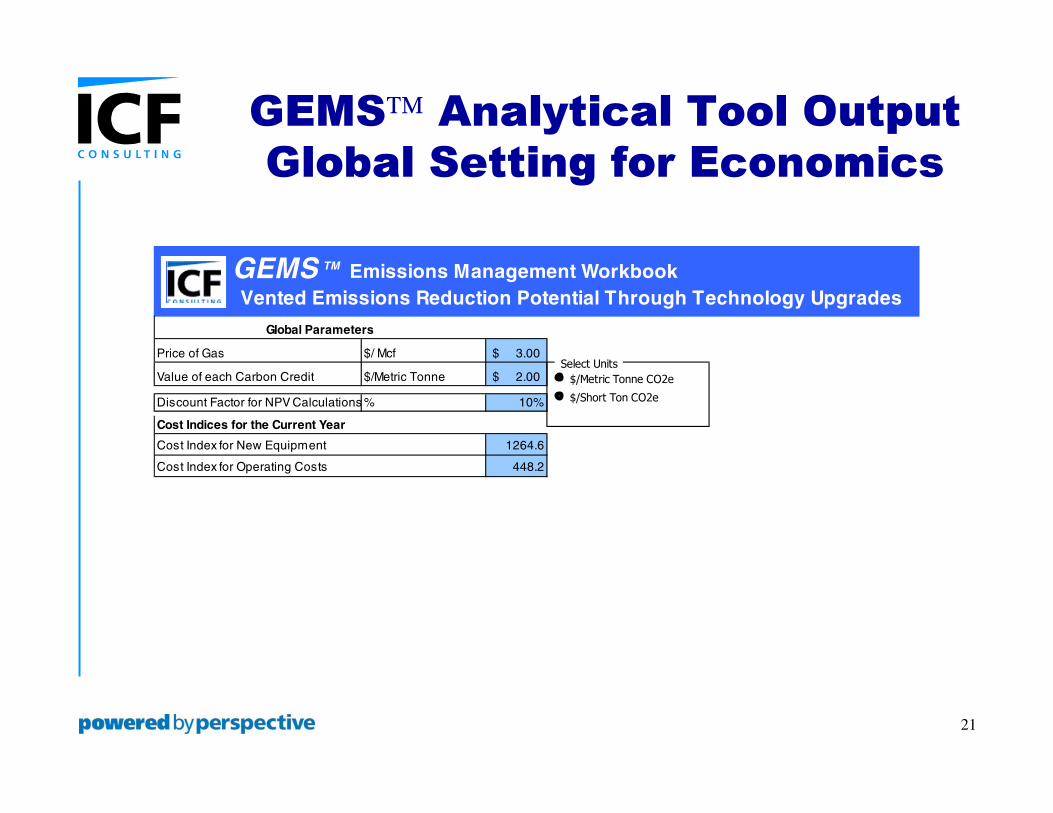
GEMS Analytical Tool Output
Global Setting for Economics
i $
$
Di l l i s %
TM
Pr ce of Gas $/ Mcf 3.00
Value of each Carbon Credit $/Metric Tonne 2.00
scount Factor for NPV Ca cu at on 10%
Cost Indices for the Current Year
Cost Index for New Equipment 1264.6
Cost Index for Operating Costs 448.2
Global Parameters
GEMS Emissions Management Workbook Vented Emissions Reduction Potential Through Technology Upgrades
Select Units
$/Metric Tonne CO2e
$/Short Ton CO2e
21
.
High-bleed devices 405# of High-bleed
devices36.90
Low-bleed devices 139# of low -bleed
devices1.30
Non-bleed isolation valves
89# of stations
w ith gasisolation valves
84.50
Pneumatic Devices
Replace with Instrument AirCalculate
CalculateReplace with Instrument Air
Replace with Instrument AirCalculate Install Flash Tank
No Change
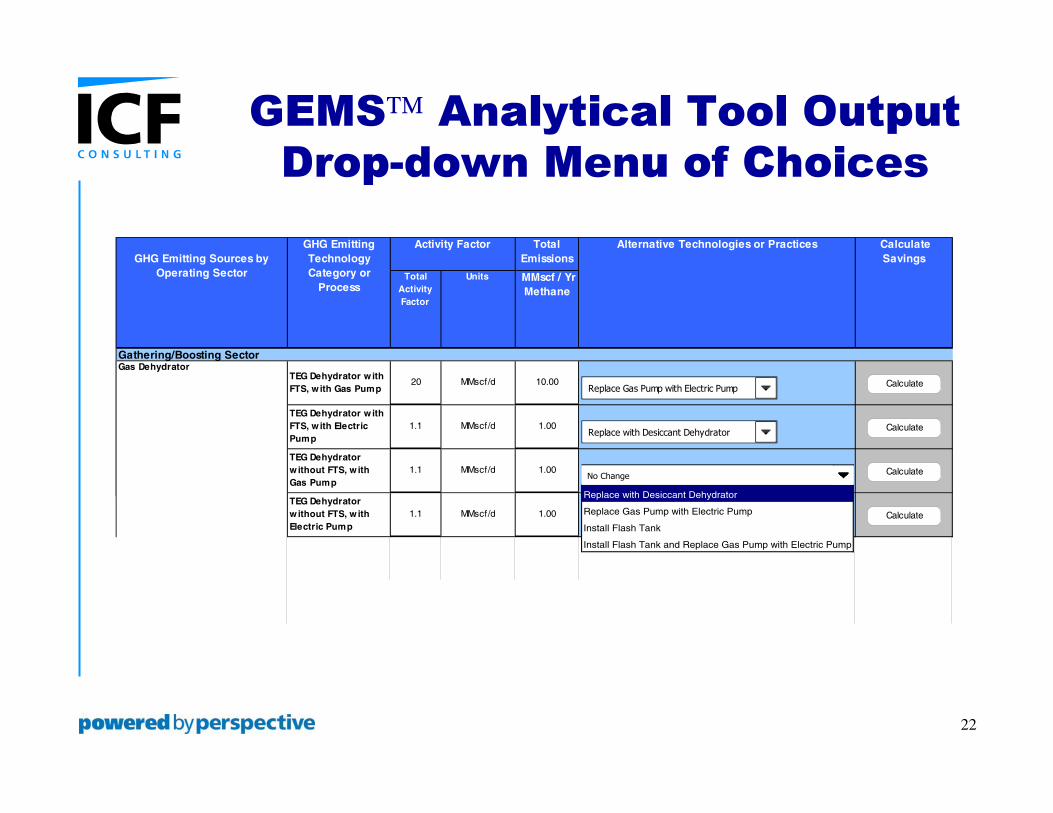
GEMS Analytical Tool Output
Drop-down Menu of Choices
/
/d
/d
/d
l
l
l
l
No Change
Total Emissions
Calculate Savings
Total Activity Factor
Units MMscf Yr Methane
Gathering/Boosting Sector
Alternative Technologies or Practices GHG Emitting Sources by
Operating Sector
GHG Emitting Technology Category or
Process
Activity Factor
TEG Dehydrator w ith FTS, w ith Gas Pum p
20 MMscf /d 10.00
TEG Dehydrator w ith FTS, w ith Electric Pum p
1.1 MMscf 1.00
TEG Dehydrator w ithout FTS, w ith Gas Pum p
1.1 MMscf 1.00
TEG Dehydrator w ithout FTS, w ith Electric Pum p
1.1 MMscf 1.00
Gas Dehydrator
Replace Gas Pump with Electric Pump Ca culate
Replace with Desiccant Dehydrator Ca culate
Ca culate
Ca culate
Replace with Desiccant Dehydrator
Replace Gas Pump with Electric Pump
Install Flash Tank
Install Flash Tank and Replace Gas Pump with Electric Pump
22
.
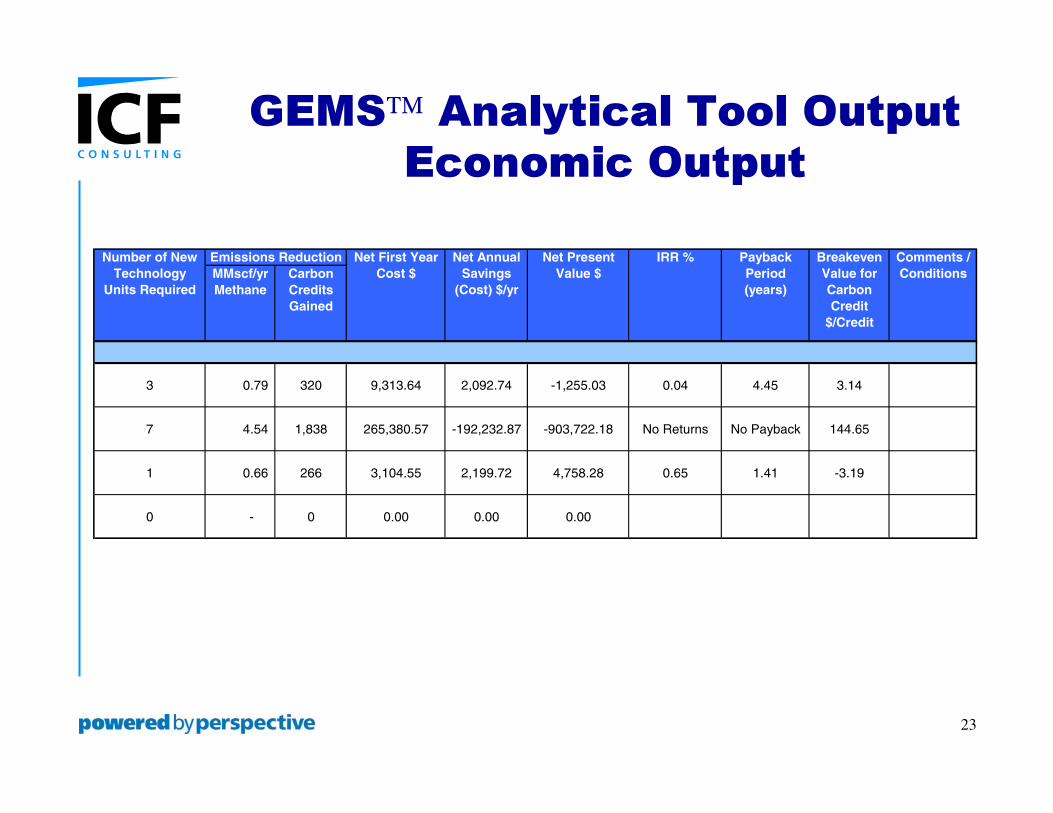
GEMS Analytical Tool Output
Economic Output
Technology Units Required
Number of New MMscf/yr Methane
Carbon Credits Gained
Emissions Reduction Cost $
Net First Year Savings
(Cost) $/yr
Net Annual Value $
Net Present IRR % Period (years)
Payback Value for Carbon Credit
$/Credit
Breakeven Conditions Comments /
3 0.79 320 9,313.64 2,092.74 -1,255.03 0.04 4.45 3.14
7 4.54 1,838 265,380.57 -192,232.87 -903,722.18 No Returns No Payback 144.65
1 0.66 266 3,104.55 2,199.72 4,758.28 0.65 1.41 -3.19
0 - 0 0.00 0.00 0.00
23
.
Bases for GEMS Analyses
� Public Information �GRI/EPA and MMS published emissions data �Gas STAR Lessons Learned Studies and
Partner Reported Opportunity Fact Sheets �Industry conference published proceedings �Technical studies, reports, briefs
� Private Sector published studies/reports �API Compendium �Vendors’ data
� Continuous improvement plan to update technologies/practices, economics
24

.
Background on ICF Consulting
25
.
ICF Consulting
� Founded 1969; now has 1000+ Employees� Offices: Canada, Asia, Brazil, Russia, UK, and
throughout the United States � Core Business Units: Energy, economics,
emergency management, environment, housing, and IT services:
� Energy Practices: Natural Gas and Oil, Power, Emissions Markets, Coal, Energy Efficiency, Risk Analysis, Billing Systems
26
.
ICF’s GHG Practice
� World’s largest with over 200 staff � Over 15 years experience in GHG issues � Expertise in over 120 countries � In-depth expertise in U.S. gas and oil sector � Greatest technical depth
� Planning, Inventory, Protocols� Monitoring, Verification� Mitigation, Valuation, & Management� Software tools
27
.
ICF Pioneered GHG Analysis
EMISSION INVENTORY & PROTOCOLS
� Corporate-wide GHG protocols for major oil/gas, cement, forest products, mining and metallurgical clients in Canada, UK, and US
� British Petroleum GHG inventory, protocols, audits
� Six official World Resources Institute/World Bank Corporate GHG Protocols
� 21 web-based GHG industry protocols for International Finance Corporation
� National GHG Inventory Methodologies (1990-Present)
� Official U.S. GHG Inventory Submission to the United Nations (1990-Present)
� Annual natural gas and oil industry methane inventory
28
.
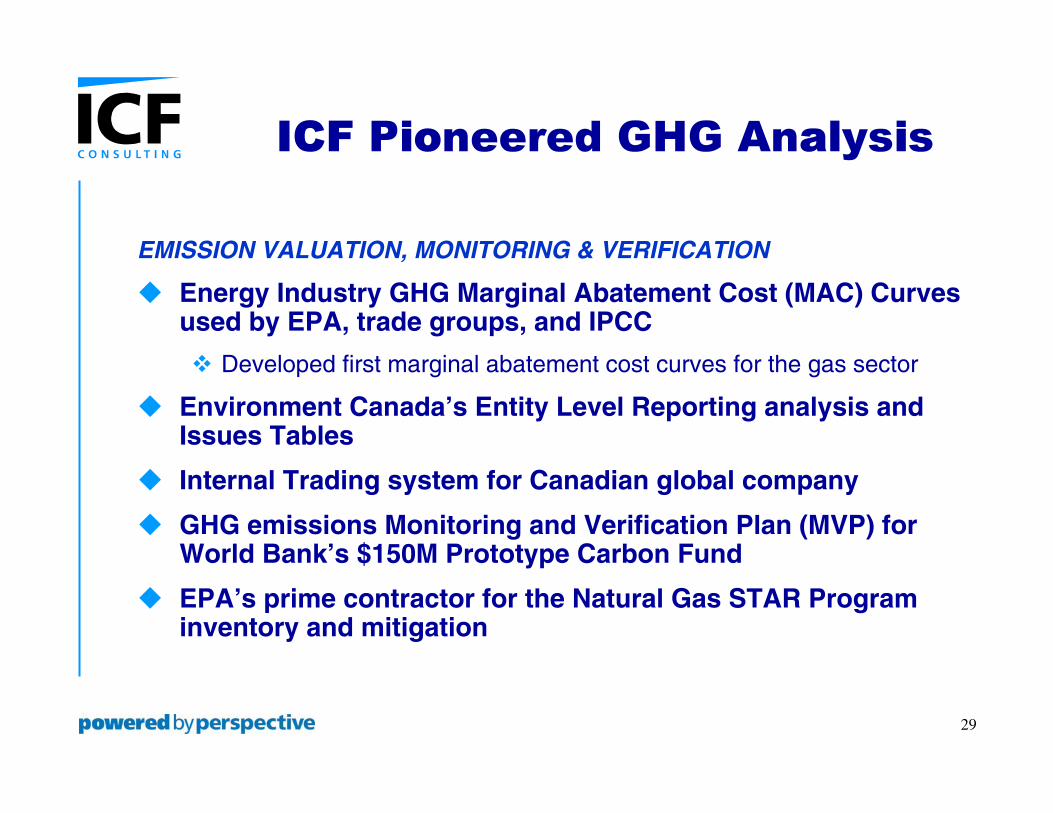
ICF Pioneered GHG Analysis
EMISSION VALUATION, MONITORING & VERIFICATION
� Energy Industry GHG Marginal Abatement Cost (MAC) Curves used by EPA, trade groups, and IPCC
� Developed first marginal abatement cost curves for the gas sector
� Environment Canada’s Entity Level Reporting analysis and Issues Tables
� Internal Trading system for Canadian global company
� GHG emissions Monitoring and Verification Plan (MVP) for World Bank’s $150M Prototype Carbon Fund
� EPA’s prime contractor for the Natural Gas STAR Program inventory and mitigation
29

.
For Further Information
Craig Ebert Zeta Rosenberg
Managing Director Vice President
9300 Lee Highway 9300 Lee Highway
Fairfax, VA 22031 Fairfax, VA 22031
703-934-3505 703-934-3949

![Greenhouse Gas Emissions and Emissions Trading in North … · 2020. 2. 23. · 2002] Stephenson-Greenhouse Gas Emissions, Kyoto and U.S. Response 45 greenhouse gas molecules. This](https://img.pdfslide.us/doc/110x75/60facf56e286b02f9b10de99/greenhouse-gas-emissions-and-emissions-trading-in-north-2020-2-23-2002-stephenson-greenhouse.jpg)