Embed Size (px)
Citation preview
ENERGY CENTEROF WISCONSIN
Report Summary210-1
Life-Cycle Energy Costs andGreenhouse Gas Emissions forGas Turbine Power
April, 2002
report report report report report
report report report report report
report report report report report
report report report report report
report report report report report
report report report report report
report report report report report
report report report report report
report report report report report
report report report report report
report report report report reportenergy center

Research Report
210-1
Life-Cycle Energy Requirements andGreenhouse Gas Emissions for
Building-Integrated PhotovoltaicsApril 2002
Prepared by
P. J. Meier and G. L. KulcinskiFusion Technology Institute
University of Wisconsin-Madison
Prepared for
595 Science DriveMadison, WI 53711-1076
Phone: 608.238.4601Fax: 608.238.8733
Email: [email protected]

ii
Copyright © 2002 Energy Center of WisconsinAll rights reserved
This report was prepared as an account of work sponsored by the Energy Center of Wisconsin (ECW). Neither ECW,participants in ECW, the organization(s) listed herein, nor any person on behalf of any of the organizations mentionedherein:
(a) makes any warranty, expressed or implied, with respect to the use of any information, apparatus, method, orprocess disclosed in this report or that such use may not infringe privately owned rights; or
(b) assumes any liability with respect to the use of, or damages resulting from the use of, any information,apparatus, method, or process disclosed in this report.
Project Manager
Craig ScheppEnergy Center of Wisconsin
Acknowledgements
This report was sponsored in part by the Energy Center of Wisconsin, the University of Wisconsin-Madison, theU.S. Department of Energy, and the Grainger Foundation.

CONTENTS
ABSTRACT ............................................................................................................................................ 1 1.0 INTRODUCTION ............................................................................................................................. 2 2.0 BACKGROUND ............................................................................................................................... 3 3.0 BUILDING-INTEGRATED PHOTOVOLTAICS ........................................................................... 4
3.1 Photovoltaic Principles.................................................................................................................. 4 3.2 PV Technologies ........................................................................................................................... 4 3.3 Building Integration ...................................................................................................................... 6 3.4 Installed Capacity and Growth ...................................................................................................... 6
4.0 METHODS OF ANALYSIS ............................................................................................................. 7 4.1 Net Energy Analysis...................................................................................................................... 7 4.2 Greenhouse Gas Emission Rate..................................................................................................... 8
5.0 PHOTOVOLTAIC LIFE-CYCLE ASSESSMENT ........................................................................ 10 5.1 System Description...................................................................................................................... 10 5.2 Energy Output ............................................................................................................................ 11 5.3 Energy Inputs and Greenhouse Gas Emissions ........................................................................... 12
5.3.1 PV Modules .......................................................................................................................... 12 5.3.2 Balance of System ................................................................................................................ 14 5.3.3 Installation, Operation and Maintenance ............................................................................ 14 5.3.4 Decommissioning and Disposal........................................................................................... 14
6.0 DISCUSSION.................................................................................................................................. 16 6.1 Net Energy Analysis.................................................................................................................... 16 6.2 Greenhouse Gas Emission Rate................................................................................................... 20 6.3 Comparison to Other Photovoltaic Studies ................................................................................. 23 6.4 Conclusions ................................................................................................................................. 23 6.5 Acknowledgments ....................................................................................................................... 24
REFERENCES ...................................................................................................................................... 25 APPENDIX A: SUMMARY CALCULATIONS FIGURES
Figure 1: Simple Photovoltaic Cell.......................................................................................................... 4 Figure 2: Photovoltaic Life-Cycle and Energy Payback Ratio ................................................................ 7 Figure 3: Three-Phase Photovoltaic System.......................................................................................... 10 Figure 4: Uni-Solar Triple Junction Amorphous Silicon Thin Film PV Cell..................................... 12 Figure 5: Life-cycle Energy Requirements............................................................................................ 16 Figure 6: Normalized Energy Requirements Comparison to Previous Work,....................................... 17 Figure 7: Energy Payback Ratio Calculation for Photovoltaics ............................................................ 18 Figure 8: Energy Payback Ratio Comparison to Previous Work,.......................................................... 18 Figure 9: Correlation of Conversion Efficiency and Insolation to EPR ................................................ 19 Figure 10: Life-cycle Emissions for Photovoltaic Electrical Energy Generation.................................. 20 Figure 11: Emissions Comparison to Previous Work, (Tonnes CO2-equiv. / GWeh)............................ 21 Figure 12: Nuclear and Renewable Emission Comparison (Tonne CO2-equiv. / GWeh)...................... 22 TABLES
Table 1A: PV Module Life-cycle Energy Requirements....................................................................... 13 Table 1B: PV Module Life-cycle Greenhouse Gas Emissions .............................................................. 13 Table 2A: BigHorn Center PV System Life-cycle Energy Requirements............................................. 15 Table 2B: BigHorn Center PV System Life-cycle Greenhouse Gas Emissions .................................... 15

1
ABSTRACT
This study performs a life-cycle assessment on a building-integrated photovoltaic (PV) power
system and evaluates the net energy payback and greenhouse gas emission rates. The system
studied utilizes 8 kilowatts (kW) of amorphous silicon PV material incorporated into standard
metal roofing panels. The PV system, located in Silverthorne, Colorado, converts sunlight to
direct current (DC) electricity at 6% efficiency.
Life-cycle assessment considers “upstream” and “downstream” processes, such as raw
materials production, fabrication of system components, transportation, installation, operation
and maintenance, and decommissioning. The energy payback ratio (EPR) is the ratio of useful
electrical output to the total energy inputs. The PV system EPR is 6, higher than gas turbine
technology (4), but lower than coal (11), fission (16), fusion (27), and wind turbine (23)
technologies.
Net energy analysis is utilized as the basis for calculating a greenhouse gas emission rate.
The PV life-cycle emits 39 tonnes of carbon dioxide equivalent for every gigawatt-hour of
electricity produced (T/GWeh). This emission rate is substantially lower than conventional
coal (974 T/GWeh) and gas turbine (464 T/GWeh) technologies, and higher than fission (15
T/GWeh), fusion (9 T/GWeh), and wind (14 T/GWeh) technologies.

2
1.0 INTRODUCTION
Studies in the 1970’s argued that the energy required to produce a photovoltaic (PV) system
was greater than the energy generated by the system over its lifetime.1 More recent studies
have revealed that current PV systems are in fact net energy producers, but they are an
expensive alternative when compared to conventional sources. Utilizing building-integrated
PV systems reduces the net system cost by replacing conventional building materials and
avoiding the cost of land acquisition. In addition, generating electricity at the point of use
avoids the cost of transmission and distribution. Perhaps most importantly, PV systems
generate electricity with minimal associated emissions by relying on solar radiation as its
source of energy.
This study performs a life-cycle assessment on a building-integrated PV system and evaluates
the net energy payback and greenhouse gas emission rates. The PV system, located in
Silverthorne, Colorado, utilizes 8 kilowatts (kW) of amorphous silicon PV material
incorporated into standard metal roofing panels. The net energy requirements and greenhouse
gas emissions from the PV system are compared against previous studies of gas turbine, coal,
fission, fusion, and wind turbine technologies.

3
2.0 BACKGROUND
The two metrics developed in this study are the life-cycle energy payback ratio (EPR) and the
life-cycle greenhouse gas emission rate. The EPR is the ratio of useful electrical output to the
total energy inputs, which is one method to evaluate the efficiency of a system. Energy
choices are typically based on economic cost and not energy efficiency; however, the EPR is
a relevant metric when considering ultimate energy resource availability in a global sense.
The EPR provides a long-term perspective on how to maximize the productivity of our
combined energy resources. This perspective is especially important in the United States,
which consumes 25% of the world’s energy annually.2
The U.S. emits almost one-quarter of the world’s anthropogenic (human generated)
greenhouse gas emissions3, in relative proportion to energy consumption. The correlation
between greenhouse gas emissions and global warming has continued to improve. Recent
observations confirm the warming of each major component of the earth’s climate: the
atmosphere, oceans, and cryosphere.4,5 Most of the warming of the last 50 years is believed to
be the result of increased greenhouse gas concentrations.6 A host of adverse impacts are
expected to accompany climatic change, including increased floods and droughts, sea-level
rise, damaged ecosystems, and increased heat-stress mortality.7
This study illustrates the greenhouse gas impact associated with electricity generation
technologies. U.S. electricity generation represents the largest single source of greenhouse
gases, contributing 40% of domestic emissions and 9% of the global emissions.2 Accordingly,
minimizing the impact of electricity generation is a key component for successful climate
change mitigation. Building-integrated PV is an emerging alternative for generating electricity
with minimal associated emissions.

4
3.400 BUILDING-INTEGRATED PHOTOVOLTAICS
3.1 Photovoltaic Principles
PV devices convert sunlight directly into electricity.8 When solar radiation (in approximately
the same spectrum as visible light) strikes a semiconductor material such as silicon, it
provides enough energy to mobilize electrons. A simple photovoltaic cell (Figure 1) consists
of two silicon layers, one doped with phosphorous to provide excess electrons (n-layer), and
one doped with boron to create an electron deficiency (p-layer).9 When the p and n layers are
connected into a circuit, electrons mobilized by incident solar radiation move across the p-n
potential, creating electricity.
Figure 1: Simple Photovoltaic Cell
3.2 PV Technologies
PV technologies were initially developed for space applications and utilized crystalline-
silicon technology. The single-crystal and multicrystalline technologies both require the
manufacture of silicon ingots that are sliced into thin wafers to create silicon solar cells.9
n-layer
p-layer
sunlight
n-layer
p-layer
sunlight

5
Crystalline PV modules provide the best available conversion efficiencies and currently
comprise nearly 90% of the PV market.10 However, the high material costs and expensive
manufacturing make it difficult for crystalline technologies to compete with conventional
electricity generation except in remote applications. For this reason, future applications of PV
will likely utilize “thin film” technology.9
Thin film PV modules have lower conversion efficiencies than crystalline wafers, but have
the advantage of cheaper manufacturing costs. The leading candidates for low-cost PV are
amorphous silicon, polycrystalline compounds, and thin-film silicon.10 Amorphous silicon
was the first thin-film material commercially available and is better suited to high volume
manufacturing than its crystalline predecessors.9 Amorphous silicon lacks perfect crystalline
geometry; consequently, electronic performance is lower than crystalline cells.9 Currently,
the best commercial modules utilize three cell layers and have conversion efficiencies around
6-7%.9
Polycrystalline compound technology provides higher conversion efficiencies than
amorphous silicon by introducing more efficient semiconductor materials. Cadmium telluride
modules currently reach efficiencies beyond 9%, and copper indium diselenide modules reach
efficiencies greater than 11%.10 Unfortunately, this technology has some disadvantages
compared to amorphous silicon, including reliance on toxic and scarce materials, and more
complicated manufacturing.9
Thin-film silicon is a promising future technology that attempts to improve on silicon
conversion efficiency while still using low-cost polycrystalline silicon. Design techniques are
utilized that trap light in silicon for total absorption, allowing for thin cells with high
efficiencies. Laboratory-scale cells have demonstrated conversion efficiencies as high as
17%.11 This technology is not yet commercially available, but may be utilized in conjunction
with amorphous silicon as early as 2002.9

6
3.3 Building Integration
When first developed for ground-based applications, large centralized PV systems were
intended to compete with conventional electricity generation. Despite continuous efficiency
improvement, the cost of generating electricity from such systems is usually considered cost
prohibitive.12 Building integration of photovoltaics began in the 1980’s, as a method to reduce
the economic and energy costs of these systems by incorporating PV modules into the
building design.13 Conventional building components, such as roofing, façade, and windows,
can be replaced with PV panels or coated with thin-film PV material. The building used as
the basis for this study utilizes amorphous silicon PV material bonded onto standing-seam
metal roof panels. This system is described in more detail in Section 5.1.
3.4 Installed Capacity and Growth
World-wide grid-connected PV applications have grown over 20% per year from 1982 to
1997.8 The United States currently has 21 megawatts (MW) of installed photovoltaic capacity
in 1999, of which approximately 0.3 MW are located in Wisconsin.13,14 Growth in PV power
in the near future is highly dependent on improvements in installed cost, availability of
government subsidy, and the future cost of competitive sources of electricity.9

7
4.0 METHODS OF ANALYSIS
4.1 Net Energy Analysis
Net Energy Analysis (NEA) is a comparison of the useful energy output of a system to the
total energy consumed by the system over its life-cycle. The PV life-cycle, shown in Figure
2, includes mining and transporting raw materials, manufacturing and transportation of PV
panels and other system components, transportation of the finished product, installation and
maintenance, and system decommissioning. NEA compares the energy inputs from each of
these phases to the useful electrical output.15 The resulting ratio of the useful energy output to
the total energy input is termed the “Energy Payback Ratio” (EPR).16
Figure 2: Photovoltaic Life-Cycle and Energy Payback Ratio
Source: NREL24
ENERGY PAYBACK RATIO =ELECTRICAL ENERGY
Σ ENERGY INPUTS
Direct Current
Inverter A/C ElectricitySunlight PV modulesSYSTEM OPERATION
PV Panels and System Components:
Engineering, Manufacturing, Transport
Installation and Maintenance
Decommissioning and Waste Disposal
Raw Materials:
Mining, Transport
Energy Input
Energy Input
Energy Input
Energy Input
PV LIFE-CYCLE
Source: NREL24
Source: NREL24
ENERGY PAYBACK RATIO =ELECTRICAL ENERGY
Σ ENERGY INPUTS
Direct Current
Inverter A/C ElectricitySunlight PV modulesSYSTEM OPERATION
PV Panels and System Components:
Engineering, Manufacturing, Transport
Installation and Maintenance
Decommissioning and Waste Disposal
Raw Materials:
Mining, Transport
Energy Input
Energy Input
Energy Input
Energy Input
Energy Input
Energy Input
Energy Input
Energy Input
PV LIFE-CYCLE

8
The output energy for a PV system can be based on actual performance data, or estimated
using the average solar insolation rate and the module conversion efficiency. The input
energy can be estimated by two methods, called Process Chain Analysis (PCA) and
Input/Output (I/O).17 PCA evaluates the material and energy flows for each process within
the system life-cycle. This methodology relies on actual data for the primary energy expended
during each step, such as the electricity (converted to primary energy) to manufacture the PV
module, or the diesel fuel consumed in transporting the completed modules to the building
site. The PCA method requires defining a system boundary for analysis. PCA cannot
practically consider the entire economy and is therefore subject to truncation error, a slight
underestimation of energy inputs.17
The Input/Output (I/O) method correlates dollar cost to energy use. The input/output model
used in this study divides the U.S. economy into 485 distinct sectors.18,19 These sectors are the
basis for a matrix, which distributes the total cost of outputs and total energy inputs of the
U.S. economy.20 The model estimates the total energy consumed directly and indirectly
throughout the economy based on the cost of goods or services procured from a given sector.
The I/O method averages prices across sectors and therefore introduces inaccuracies when the
actual energy intensity of a process differs from the sector average.
PCA is highly reliable with small truncation errors for many processes.17 However, it is
difficult to evaluate an entire life cycle using PCA, because data on energy consumption is not
always readily available. Cost data is frequently available; therefore, the input/output method
is more easily applied to many processes. In most cases, a combination of PCA and I/O is the
preferred approach to net energy analysis.17 This study utilizes PCA primarily, but relies on
the I/O method to provide estimates of energy requirements for installation, maintenance, and
decommissioning.
4.2 Greenhouse Gas Emission Rate
PV systems generate electricity using the photovoltaic effect, which in itself has no associated
emissions. However, the greenhouse gas emission rates calculated in this study incorporate

9
all components of the system life-cycle such as manufacturing, transportation, and
maintenance. As a result, non-fossil-fuel electricity systems have a greenhouse gas impact
due to their reliance on the existing fossil fuel infrastructure. Carbon dioxide, a byproduct of
fossil fuel combustion, is the most important greenhouse gas based on total global emissions.
Methane and nitrous oxide emissions occur in much smaller quantities but are respectively 21
and 310-times stronger global warming agents. Emissions of the lesser greenhouse gases are
accounted for in terms of CO2-equivalent emissions.
Net energy analysis provides a convenient and accurate basis for estimating greenhouse gas
emissions. The relationship between the type and quantity of the fuel consumed and the
resulting emissions is well established. Multiplying the individual energy inputs by a
corresponding emission factor provides greenhouse gas emission estimates for each
component of the life-cycle. The total emissions are normalized in terms of tonnes CO2-
equivalent emitted per gigawatt-hour electricity produced (T/GWeh), allowing for comparison
against alternative technologies.

10
5.0 PHOTOVOLTAIC LIFE-CYCLE ASSESSMENT
5.1 System Description
The BigHorn Center, located in Silverthorne, Colorado, is site to a building-integrated
photovoltaic (PV) system utilizing thin-film amorphous silicon technology.21 157 m2 of Uni-
Solar PV material is laminated onto the building’s south facing roof panels. Under peak
sunlight, these modules generate up to 8 kW of direct current (DC) electricity, collected at
three combiner boxes.22 Each combiner box connects to a separate inverter, which converts
the DC current to alternating current (AC) tied directly to the building’s three-phase electrical
system (Figure 3).23 The system is also grid-tied, and excess electricity may be sold to the
local utility under a net-metering agreement.24
Figure 3: Three-Phase Photovoltaic System (Source: NREL24)
Photovoltaic Panels
Loads Phase A
Loads Phase C
Loads Phase B
Utility Meter
Power Grid
Inverter A
Inverter B
Inverter C
Photovoltaic Panels
Loads Phase A
Loads Phase C
Loads Phase B
Utility Meter
Power Grid
Inverter A
Inverter B
Inverter C
Photovoltaic Panels
Loads Phase A
Loads Phase C
Loads Phase B
Utility Meter
Power Grid
Inverter A
Inverter B
Inverter C

11
5.2 Energy Output
The output of the PV life-cycle is defined as the total AC electricity generated over the
lifetime of the system. At high altitude in Colorado, the amount of solar radiation incident on
the PV modules will average about 5.3 kWh/m2-day. The output for the system is largely
controlled by the efficiency at which the modules convert this sunlight to electricity. The
Uni-Solar PV modules are factory rated to convert solar radiation to DC electricity at 5.7%
efficiency.26 At this efficiency, the BigHorn Center array could generate 17,000 kWh of DC
electricity each year (61 GJ/year) assuming optimal orientation. Approximately 10% of the
potential solar energy is unavailable due to the slightly less than optimal orientation of the
BigHorn Center PV modules.
The BigHorn Center array generates 8 kW of DC power during peak insolation; however,
electrical system losses at the inverters (converting DC to AC) and throughout the system
(line losses) reduce the available AC power by approximately 20% to 6.4 kW.22
Environmental deterioration will reduce module performance by an estimated 15% by the end
of its useful life.25 Assuming degradation occurs at a constant rate over 30 years (0.55%/yr),
the cumulative impact of module degradation will reduce the average annual output by 8%.
Therefore, the expected output for the BigHorn Center system is approximately 10,800 kWh
per year (39 GJ/year), after consideration of system losses and degradation. Over a 30-year
lifetime, the total expected energy output is 1,160 GJ.
The performance of any new PV system is somewhat uncertain. Preliminary data during
March 2001 showed the system to under-perform design expectations by about 25%. This is
not uncommon for PV systems during the first months of operation, and system performance
is expected to meet design expectations following a short period of system optimization.22
The expected 30-year output (1,160 GJ) is therefore considered to provide the best estimate of
long-term performance for this study and is used to calculate the Energy Payback Ratio in
Section 6.1.
12
5.3 Energy Inputs and Greenhouse Gas Emissions
The following sections describe the components of the PV life-cycle. Energy inputs and
greenhouse gas emissions are estimated for each component.
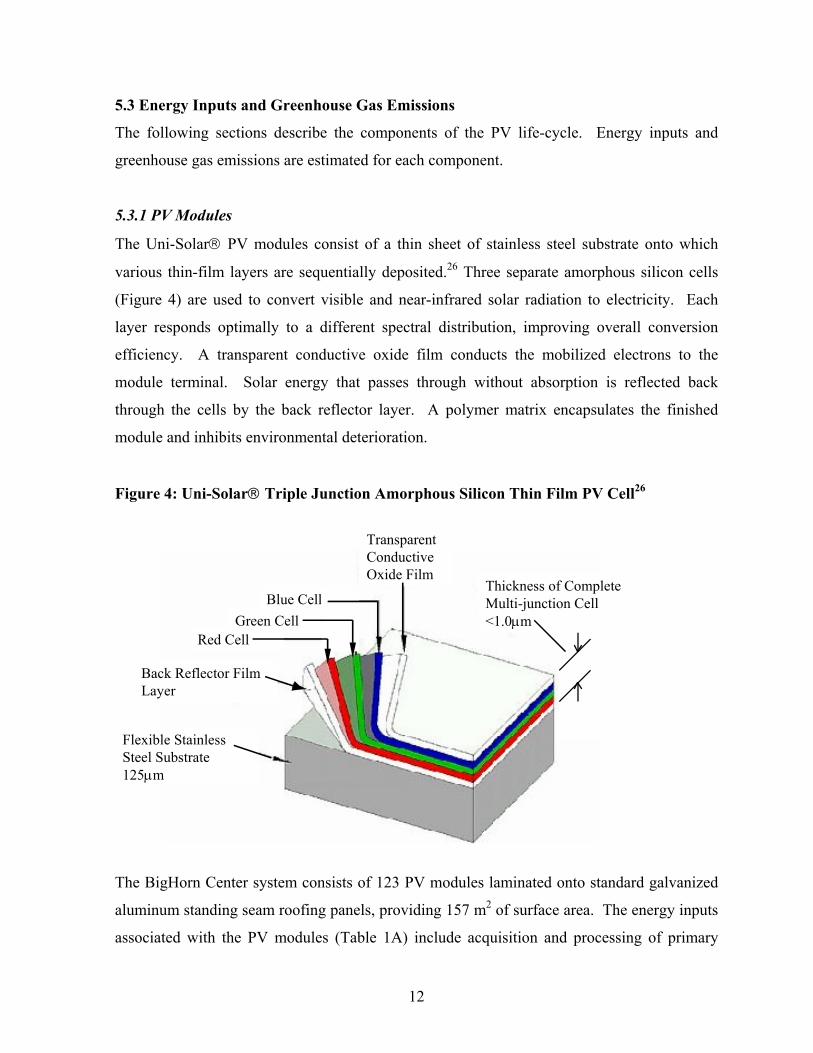
5.3.1 PV Modules
The Uni-Solar PV modules consist of a thin sheet of stainless steel substrate onto which
various thin-film layers are sequentially deposited.26 Three separate amorphous silicon cells
(Figure 4) are used to convert visible and near-infrared solar radiation to electricity. Each
layer responds optimally to a different spectral distribution, improving overall conversion
efficiency. A transparent conductive oxide film conducts the mobilized electrons to the
module terminal. Solar energy that passes through without absorption is reflected back
through the cells by the back reflector layer. A polymer matrix encapsulates the finished
module and inhibits environmental deterioration.
Figure 4: Uni-Solar Triple Junction Amorphous Silicon Thin Film PV Cell26
The BigHorn Center system consists of 123 PV modules laminated onto standard galvanized
aluminum standing seam roofing panels, providing 157 m2 of surface area. The energy inputs
associated with the PV modules (Table 1A) include acquisition and processing of primary
Flexible Stainless Steel Substrate 125µm
Back Reflector Film Layer
Red CellGreen Cell
Blue Cell
Transparent Conductive Oxide Film
Thickness of Complete Multi-junction Cell <1.0µm
Flexible Stainless Steel Substrate 125µm
Back Reflector Film Layer
Red CellGreen Cell
Blue Cell
Transparent Conductive Oxide Film
Thickness of Complete Multi-junction Cell <1.0µm
Flexible Stainless Steel Substrate 125µm
Back Reflector Film Layer
Red CellGreen Cell
Blue Cell
Transparent Conductive Oxide Film
Thickness of Complete Multi-junction Cell <1.0µm

13
materials, intermediate transportation, module manufacturing, engineering and administration,
and final transportation. The energy required to manufacture and install the roofing panels is
intentionally excluded, assuming that the building would require a similar roof regardless of
the addition of the PV system. However, the energy required to transport the module (roofing
panel and PV material) from San Diego to Silverthorne is included (1000 miles), assuming
that alternative roofing material could otherwise be obtained from Denver (70 miles). Details
on energy inputs and emissions are included in Appendix A.
Table 1A: PV Module Life-cycle Energy Requirements
Process
Energy Input
(GJ)
% of
Total Method
Materials and Manufacturing 123 73% PCA
Engineering and Administration 39 23% PCA
Finished Product Transportation 7 4% PCA
Total PV Module Energy Input 170
Greenhouse gas emissions (Table 1B) are estimated by multiplying the energy requirements
(Table 1A) by fuel-specific emission factors. Energy and emissions associated with materials
and manufacturing are based on a detailed study of a similar Uni-Solar PV module
(Keoleian and Lewis 1997).27
Table 1B: PV Module Life-cycle Greenhouse Gas Emissions
Process
Tonnes CO2-
equivalent
% of
Total
Materials and Manufacturing 7.3 73%
Engineering and Administration 2.2 22%
Finished Product Transportation 0.5 5%
Total PV Module Emissions 10.1

14
5.3.2 Balance of System
The PV system components, excluding the modules themselves, are collectively referred to as
the Balance-of-System (BOS). The BOS consists of combiner boxes, inverters, circuit
breakers, lightning arrestors, and several hundred feet of electrical wiring and conduit.22
Modules are laminated directly onto roofing panels; therefore no array support is required.
The majority of the BOS energy consumption occurs during inverter manufacturing. Lesser
energy requirements are associated with system electrical wiring. The energy associated with
remaining components is presumably small.36 The BOS energy inputs (Table 2A) are
estimated using PCA methods based on material requirements. The associated greenhouse
gas emissions are shown in Table 2B. Emissions from electricity consumption are based on
the average U.S. emissions from electricity generation.
5.3.3 Installation, Operation and Maintenance
Installing the building-integrated PV system involves mounting the roofing panels, connecting
the PV modules, and installing and connecting the BOS. A portion of the installation energy
is excluded from the NEA, assuming builders would install a similar roof regardless of the
addition of the PV system. The reliability of power conditioning equipment is the primary
consideration for determining operation and maintenance (O&M) energy requirements.28,29
This study assumes a 15-year inverter lifetime (i.e., inverters are replaced once). The energy
inputs for O&M are shown in Table 2A, and the associated greenhouse gas emissions are
shown in Table 2B.
5.3.4 Decommissioning and Disposal
Decommissioning and disposal is generally considered a negligible component of the energy
input requirements and is frequently omitted from analysis. While future recycling programs
are viable for some PV technologies,30 it is likely that amorphous silicon modules would be
disposed of at the end of their useful life. The PV modules in the BigHorn Center system
contain no toxic semiconductor materials and are therefore suitable for sanitary landfill
disposal. Energy requirements and emissions are estimated for landfilling of the PV system
components and disposing of wastes associated with manufacturing (See Tables 2A and
2B).30,31

15
Table 2A: BigHorn Center PV System Life-cycle Energy Requirements
Process
Energy Input*
(GJ)
% of
Total Method
PV Modules (See Table 1A) 169.6 82.8% PCA
Balance of System 6.9 3.4% PCA
Installation, Operation & Maintenance 24.0 11.7% I/O & PCA
Decommissioning 4.3 2.1% PCA
Total PV Life-cycle Energy Input 205 100%
*Details are included in Appendix A.
Table 2B: BigHorn Center PV System Life-cycle Greenhouse Gas Emissions
Process
Tonnes CO2-
equivalent*
% of
Total
PV Modules (See Table 1B) 10.07 80.5%
Balance of System 0.47 3.8%
Installation, Operation & Maintenance 1.67 13.4%
Decommissioning 0.30 2.4%
Total PV Life-cycle Emissions 12.5 100%
*Details are included in Appendix A.

16
6.0 DISCUSSION
6.1 Net Energy Analysis
As discussed in Section 5, a total of 205 GJ of energy is consumed throughout the life-cycle
of the PV system. These inputs are grouped into 4 categories shown in Figure 5. Almost
90% of the PV energy input is associated with system materials and construction
(installation). Most of the remainder is consumed during operation and maintenance, with a
negligible fraction consumed for decommissioning and disposal.
Figure 5: Life-cycle Energy Requirements
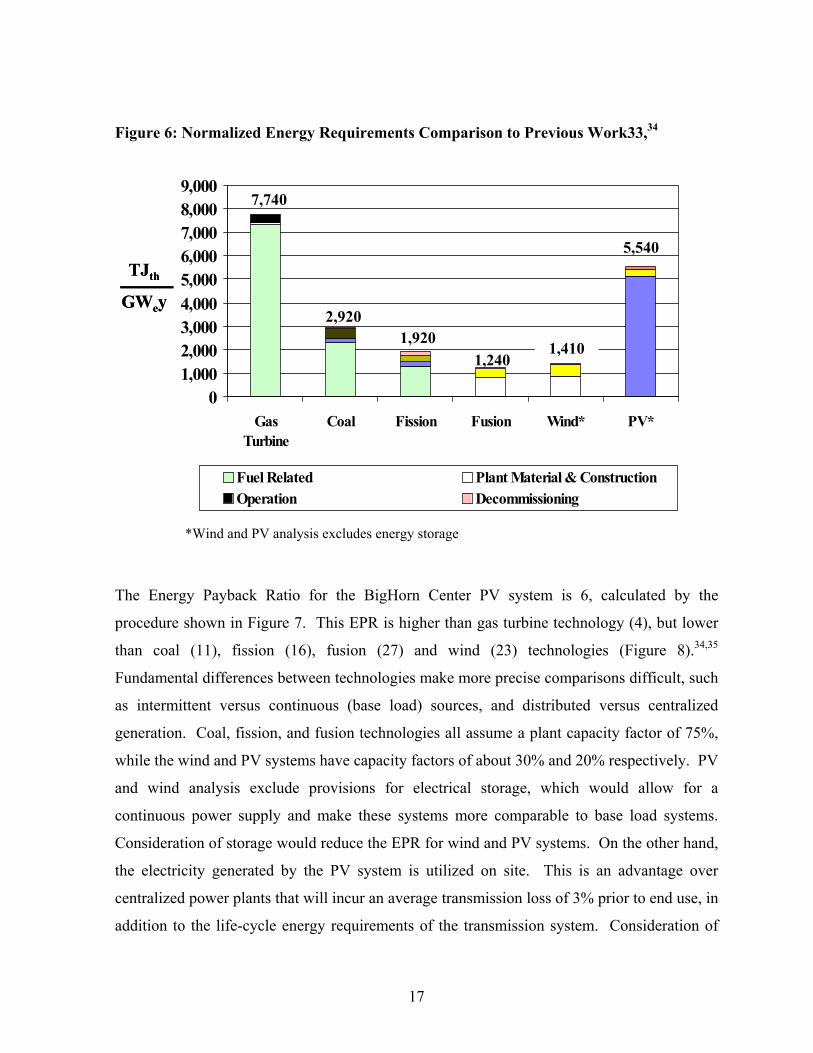
Normalizing the inputs in units of terajoules input per gigawatt-year of electric output (Figure
6) allows for comparison to alternative technologies. Materials and construction constitute
the majority of energy inputs for PV, wind and fusion technologies. Gas turbine, coal, and
fission technologies consume the majority of their energy inputs during fuel acquisition and
fuel transportation.32,33 Because PV technology relies on sunlight, there is no energy required
to procure “fuel”. Radiation that is reflected or lost to waste heat is not considered an energy
input. The analogous convention was applied to each of the technologies described in this
study (e.g., the energy in natural gas consumed at the gas turbine plant, the energy content of
coal, and the energy content of the enriched uranium at the fission plant is also excluded).
011 4
190
0
50
100
150
200
250
Fuel Related
Construction & Materials
Operation Decommission
GJth
17
Figure 6: Normalized Energy Requirements Comparison to Previous Work33,34
The Energy Payback Ratio for the BigHorn Center PV system is 6, calculated by the
procedure shown in Figure 7. This EPR is higher than gas turbine technology (4), but lower
than coal (11), fission (16), fusion (27) and wind (23) technologies (Figure 8).34,35
Fundamental differences between technologies make more precise comparisons difficult, such
as intermittent versus continuous (base load) sources, and distributed versus centralized
generation. Coal, fission, and fusion technologies all assume a plant capacity factor of 75%,
while the wind and PV systems have capacity factors of about 30% and 20% respectively. PV
and wind analysis exclude provisions for electrical storage, which would allow for a
continuous power supply and make these systems more comparable to base load systems.
Consideration of storage would reduce the EPR for wind and PV systems. On the other hand,
the electricity generated by the PV system is utilized on site. This is an advantage over
centralized power plants that will incur an average transmission loss of 3% prior to end use, in
addition to the life-cycle energy requirements of the transmission system. Consideration of
01,0002,0003,0004,0005,0006,0007,0008,0009,000
GasTurbine
Coal Fission Fusion Wind* PV*
Fuel Related Plant Material & ConstructionOperation Decommissioning
7,740
2,9201,920
1,2401,410
TJth
GWey
TJth
GWey
5,540
*Wind and PV analysis excludes energy storage

18
transmission would reduce the EPR of centralized generation relative to distributed systems
like PV.
Figure 7: Energy Payback Ratio Calculation for Photovoltaics
Figure 8: Energy Payback Ratio Comparison to Previous Work33,34
2723
16
11
4 6
0
5
10
15
20
25
30
GasTurbine
PV* Coal Fission Wind* Fusion
Ene
rgy
Payb
ack
Rat
io
*Wind and PV analysis excludes energy storage
Life-cycle Energy Inputs (GJth)Fuel Related: 0 Materials & Installation: 190Operation & Maintenance: 11Decommission: 4 Total: 205
Life-cycle Output (GJe)
Net Electrical Output: 1,164
Energy Payback Ratio (EPR) = Input
Output= 6=
205
1,164

19
The EPR for the BigHorn Center PV system is limited by the module’s 6% conversion
efficiency. Thin-film PV is an emerging technology, with conversion efficiencies potentially
exceeding 20% in the next two decades.10 In addition to conversion efficiency, the amount of
available solar energy (Figure 9) directly affects the PV output. Depending on its location
and conversion efficiency, the EPR of a comparable system could reach 22 (Figure 9).
Figure 9: Correlation of Conversion Efficiency and Insolation to EPR
0.0
5.0
10.0
15.0
20.0
25.0
5% 10% 15% 20%
Photovoltaic Module Conversion Efficiency
Ener
gy P
ayba
ck R
atio
Source: NREL
Phoenix, AZ (6 kWh/m2 -day)
Denver, CO (5 kWh/m2-day)
Madison, WI (4 kWh/m2-day)
Seattle, WA (3 kWh/m2-day)
BigHorn, 2000
0.0
5.0
10.0
15.0
20.0
25.0
5% 10% 15% 20%
Photovoltaic Module Conversion Efficiency
Ener
gy P
ayba
ck R
atio
Source: NREL
0.0
5.0
10.0
15.0
20.0
25.0
5% 10% 15% 20%
Photovoltaic Module Conversion Efficiency
Ener
gy P
ayba
ck R
atio
Source: NRELSource: NRELSource: NREL
Phoenix, AZ (6 kWh/m2 -day)
Denver, CO (5 kWh/m2-day)
Madison, WI (4 kWh/m2-day)
Seattle, WA (3 kWh/m2-day)
BigHorn, 2000

20
6.2 Greenhouse Gas Emission Rate
The energy inputs calculated for the net energy analysis provide the basis for estimating
greenhouse gas emissions. As shown in Section 5, approximately 12.5 tonnes of CO2-
equivalent greenhouse gases are emitted throughout the life-cycle of the BigHorn Center PV
system. The majority (91%) of the life-cycle greenhouse gas emissions are associated with
materials and construction (Figure 10), in direct correlation to energy consumption. The
O&M and decommissioning contribute 6% and 2% of life-cycle emissions respectively.
Figure 10: Life-cycle Emissions for Photovoltaic Electrical Energy Generation (BigHorn Center PV System)
Life-cycle Emissions
(tonnes CO2-equiv.)
0.30.8
0
11.4
0
2
4
6
8
10
12
Fuel Related
Operation & Maintenance
DecommissioningMaterials & Construction

21
Dividing life-cycle emissions by the useful electricity produced normalizes life-cycle
emissions and allows for comparison to other technologies. Figure 11 compares the PV life-
cycle emission rate to other technologies in terms of tonnes of CO2-equivalent emissions per
gigawatt-hour of electricity produced (T/GWeh). The PV emission rate of 39 tonne/GWeh is
higher than fusion (9), wind (14), and fission (15). However, because the PV conversion
efficiency relates directly to the emission rate, a comparable PV system with 12% conversion
efficiency would have an emission rate of only 19 T/GWeh.
Figure 11: Emissions Comparison to Previous Work33,34 (Tonnes CO2-equiv. / GWeh)
Unlike the net energy analysis, greenhouse gas emission rates include the fuel consumed
during plant operation. As a result, nuclear and renewable technologies have drastically lower
emission rates than the fossil fuel technologies. Coal and gas turbine technologies emit
considerable CO2 during fuel combustion, resulting in high emission rates of 970 and 460
tonne/GWeh respectively.33,34
Figure 12 compares the emissions from the nuclear and renewable technologies. Fusion,
wind, and PV technologies have similar life-cycle emission profiles. The majority of
0
200
400
600
800
1,000
1,200
NaturalGas
Coal Fission Fusion Wind* PV*
T/G
Weh
Fuel Related Plant Material & Construction
Operation Decommissioning & Disposal
*Wind and PV analysis exclude energy storage.
460
970
15 9 14 39

22
greenhouse gases for these technologies are generated from materials and construction, with
some contribution from O&M and minimal emissions from decommissioning. In contrast, the
majority of emissions from fission plants are associated with the fuel cycle. Fission also has
relatively significant emissions associated with decommissioning and waste disposal.
Figure 12: Nuclear and Renewable Emission Comparison34 (Tonne CO2-equiv. / GWeh)
Greenhouse gas emissions from nuclear and renewable technologies occur as a result of their
reliance on the U.S. fossil fuel infrastructure. The United States generates 70% of its
electricity from fossil fuels. Reducing the fossil fuel component of electricity to 50%,
comparable to some European nations, would lower the nuclear and renewable emission rates
by about 30%. For PV, the heaviest reliance on fossil fuels occurs due to the consumption of
electrical energy during manufacturing. Therefore, as the U.S. electrical generating profile
changes, so will the effective greenhouse gas emission rates.
05
1015202530354045
Fission Fusion Wind* PV*
T/ G
Weh
Fuel Related Material & Construction
Operation Decommissioning & Disposal
*Wind and PV analysis exclude energy storage.
15
9
14
39

23
6.3 Comparison to Other Photovoltaic Studies
The energy requirements for amorphous silicon PV module production is reported in the
literature between 710 to 1,980 MJ/m2 over widely varying study parameters.36 Kato and
Alsema report energy requirements of 1,180 and 1,200 MJ/m2 respectively, for modules
similar to those at the BigHorn Center.37,38 These estimates consider module production only,
and exclude final product transport, installation, maintenance, and disposal. Module
manufacturing for the BigHorn Center system required 1,100 MJ/m2 including engineering,
administration, and final transportation to site.27,36 Consideration of the remaining life-cycle
components (balance of system, installation, maintenance, and disposal) increased the
BigHorn Center energy requirements to 1300 MJ/m2 in this study. This is well within the
range of previous studies and slightly higher than reported by Alsema and Kato.
Comparing emission rates between studies is difficult due to the variance of multiple factors,
including the carbon intensity of primary energy, insolation rate, PV conversion efficiency,
and system lifetime. Alsema reports a greenhouse gas emission rate of 50 g/kWh, slightly
higher than the BigHorn Center system (39 g/kWh).37 Kato reports a greenhouse gas
emissions of 18 kg C/m2.38 This is slightly lower than the BigHorn Center, with emissions of
21 kg C/m2.
6.4 Conclusions
The energy payback ratio (EPR) for a photovoltaic (PV) electrical generating system is
controlled largely by the module conversion efficiency. The BigHorn Center PV system has
an EPR of 6, lower than coal (11), fission (16), fusion (27), and wind turbine (23)
technologies, but higher than gas turbine technologies (4). Considering future improvements
in PV conversion efficiency could increase the EPR to as high as 22 in favorable locations.
The greenhouse gas emission rate for the PV life-cycle (39 Tonnes CO2-equivalent per GWeh)
is higher than for fusion (9), wind (14), and fission (15), but drastically lower then fossil fuel
technologies (460-970). This value is also dependent on conversion efficiency. A
comparable system with 12% conversion efficiency would have an emission rate of 19
T/GWeh.

24
6.5 Acknowledgments
The authors would like to thank those who helped make this analysis possible. This work was
supported in part by the Energy Center of Wisconsin, the University of Wisconsin – Madison,
the U.S. Department of Energy, and the Grainger Foundation. Technical and background
information for the BigHorn photovoltaic system was generously provided by Joe Burdick of
Burdick Technologies Unlimited. Building performance and monitoring information was
provided by the National Renewable Energy Laboratory via Sheila Hayter, Michael Deru, the
High-Performance Buildings Initiative, and the PV for Buildings Task.

25
REFERENCES
1 Oliver, M., Jackson, T., (2001) Energy and Economic Evaluation of Building-Integrated Photovoltaics Photovoltaics. Energy. 26: pp. 431-439. 2 Energy Information Administration (April 2001) International Energy Annual 1999, DOE/EIA-0219(99). 3 Energy Information Administration (October 2000). Emissions of Greenhouse Gases in the United States 1999. (DOE/EIA-0573(99)). 4 Levitus, S., et al., (2001) Anthropogenic Warming of Earth’s Climate System. Science, Vol. 292, pp. 267-273. 5 Barnett, T., et al., (2001) Detection of Anthropogenic Climate Change in the World’s Oceans. Science, Vol. 292, pp. 270-273. 6 Intergovernmental Panel on Climate Change (2001). WG1 Third Assessment Report. via http://www.ipcc.ch/pub/spm22-01.pdf, June 20, 2001. 7 Intergovernmental Panel on Climate Change (2001). WG2 Third Assessment Report. via http://www.ipcc.ch/pub/wg3spm.pdf, June 20, 2001. 8 Jackson, T., Oliver. M., (2000) The Viability of Solar Photovoltaics. Energy Policy. 28: pp. 983-988. 9 Green, M. (2000) Photovoltaics: Technology Overview. Energy Policy. 28: pp. 989-998. 10 U.S. Department of Energy. (2000) Photovoltaics - Energy for the New Millennium: The National Photovoltaics Program Plan for 2000-2004. DOE/GO-10099-940. 11 Kazmerski, L. (1997) Photovoltaics: A Review of Cell and Module Technologies. Renewable and Sustainable Energy Reviews. 1: pp. 71-70. 12 Hanel, A. (2000) Building-Integrated Photovoltaics Review of the State of the Art. Renewable Energy World. 3,4: pp. 88-101. 13 Maycock, P. (2000) The World PV Market 2000 Shifting from Subsidy to ‘Fully Economic’?. Renewable Energy World. 3,4: pp. 59-74. 14 DePillis, A. (2001) Personal Communications, Wisconsin Department of Administration.

26
15 Tsoulfanidis, N. (1981) Energy Analysis of Coal, Fission, and Fusion Power Plants. Nuclear Technology/Fusion: 1: April, pp. 239-254. 16 White, S. (1995) Energy Balance and Lifetime Emissions From Fusion, Fission and Coal Generated Electricity. Masters of Science Thesis. University of Wisconsin – Madison. 17 Spreng, D. (1988) Net Energy Analysis and the Energy Requirements of Energy Systems. Praeger Publishers, New York. 18 Green Design Initiative, Carnegie Mellon University, via http://www.eiolca.net/, last accessed May 24, 2001. 19 Hendrickson, C., et al., (1998) Economic Input-Output Models for Environmental Life-Cycle Assessment. Environmental Science & Technology. 32: 7, pp. 184-191. 20 Casler, S. and Wilbur, S. (1984) Energy Input-Output Analysis A Simple Guide. Resources and Energy. 6: pp. 187-201. 21 Hayter, S., et al., (2000) A Case Study of the Energy Design Process Used for a Retail Application. National Renewable Energy Laboratory. Presented at the American Council for an Energy Efficient Economy. 22 Burdick, J. (2001) President, Burdick Technologies Unlimited, LLC. Personal Communications. 23 Deru, M. (2001) Personal Communications. Senior Engineer, National Renewable Energy Laboratory. 24 National Renewable Energy Laboratory. (2001) High Performance Buildings Research, via http://www.nrel.gov/buildings/highperformance/projects/bighorn/pv.html, May 29, 2001. 25 Bertsche, G. (June 14, 2001) Regional Sales Manager, United Solar Systems Corporation, Personal Communications. 26 United Solar Systems Corporation. (2001), via http://ovonic.com/unisolar.html, last accessed May 24, 2001. 27 Keoleian, G. and Lewis, G. (1997) Application of Life-cycle Energy Analysis to Photovoltaic Module Design. Progress in Photovoltaics: Research and Applications. 5: pp. 287-300. 28 Payne, A., et al., Accelerating Residential PV Expansion: Supply Analysis for Competitive Electricity Markets. Energy Policy. 29: pp. 787-800. 29 Maish, A. et al., (1997) Photovoltaics System Reliability. 26th IEEE Photovoltaic Specialist Conference, pp. 1049 -1055.

27
30 Fthenakis, V. (2000) End-of-life Management and Recycling of PV Modules. Energy Policy. 28: pp. 1051-1058. 31 Dones, R. and Frischknecht R. (1998) Life-cycle Assessment of Photovoltaic Systems: Results of Swiss Studies on Energy Chains. Progress in Photovoltaics: Research and Applications. 6: pp. 117-125. 32 White, S. and Kulcinski, G. (1998) “Birth to Death” Analysis of the Energy Payback Ratio and CO2 Gas Emission Rates from Coal, Fission, Wind, and DT Fusion Electrical Power Plants. Proceedings of the 6th IAEA Meeting on Fusion Power Plant Design and Technology, Culham, England. 33 Meier, P. and Kulcinski, G. (2000) Life-Cycle Energy Cost and Greenhouse Gas Emissions for Gas Turbine Power. Energy Center of Wisconsin Research Report 202-1. 34 White, S., Kulcinski, G. (1999) Net Energy Payback and CO2 Emissions From Wind Generated Electricity in the Midwest – A University of Wisconsin Study. Energy Center of Wisconsin, Madison, WI. 35 Meier, P. and Kulcinski, G. (2001) The Potential for Fusion Power to Mitigate U.S. Greenhouse Gas Emissions. Fusion Technology. 39: pp. 507-511. 36 Alsema, E. (2000) Energy Pay-Back Time and CO2 Emissions of PV Systems. Progress in Photovoltaics: Research and Applications. 8: pp. 17-25. 37 Alsema, E. and Niewlaar, E. (2000) Energy Viability of Photovoltaic Systems. Energy Policy. 28: pp. 999-1010. 38 Kato, K., et al., (1998)Energy Pay-Back Time and Life-cycle CO2 Emission of Residential PV Power System with Silicon PV Module. Progress in Photovoltaics: Research and Applications. 6: pp. 105-115.

SUMMARY OF DATA AND CALCULATIONS
BUILDING INTEGRATED PV LIFE-CYCLE - ENERGY REQUIREMENTS
Item GJ Reference PagePV Modules
Materials and Manufacturing 123.0 A2Engineering & Administration 39.3 A2
Finished Product Transport 7.2 A2Balance of System
Inverters 4.0 A5Wiring 2.9 A5
Installation 12.9 A6Operation and Maintenance 11.0 A6Decommissioning and Disposal 4.3 A7TOTAL LIFE-CYCLE ENERGY (GJ) 205
Energy Payback Ratio Calculation Reference PageEnergy Input (GJ) = 205 A1
Energy Output (GJ) = 1,164 A8EPR Expected = Output / Input = 5.7
BUILDING INTEGRATED PV LIFE-CYCLE - CO2-Equivalent Emissions
Item kgCO2-Equiv Reference Page
PV ModulesMaterials and Manufacturing 7,315 A3Engineering & Administration 2,221 A4
Finished Product Transport 534 A4Balance of System
Inverters 290 A5Wiring 179 A5
Installation 896.6 A6Operation and Maintenance 776.5 A6Decommissioning and Disposal 296.7 A7TOTAL LIFE-CYCLE EMISSION (tonnes) 12,508
Greenhouse Gas Emission Factor Calculation Reference PageLife-Cycle Emission (tonnes CO2) = 12.508 A1
Energy Output (GWeh) = 0.323 A8Emission Rate = Emission / Output (T/GWeh) = 38.7
A1

ENERGY INPUT REQUIREMENTS FOR PV MODULES
Unit Energy Module Area TotalGJ/m2 m2 GJ
Materials & Manufacturing1 0.782 157 123Engineering & Administration2 0.250 157 39
Transportation to Site 0.046 157 7Total Energy 170
Material & Manufacturing Energy1
Energy Per Module Area (GJ/m2)Activity Material Manufacturing Mat. Transport TotalEncapsulation 0.2119 0.1372 0.0188 0.3680Substrate 0.0256 0.0564 0.0093 0.0913Deposition Materials 0.0188 0.0925 0.0002 0.1116Busbar 0.0051 0.0000 0.0002 0.0054Back Reflector 0.0007 0.0740 -- 0.0747Grid -- 0.0342 -- 0.0342Conductive Oxide -- 0.0969 -- 0.0969Total 0.262 0.491 0.029 0.782
Transportation to Site EnergyDistance miles 928Energy Intensity3 BTU/ton Mile 4359Mass tons 1.69Transport Energy GJ 7.22Area m2 157Unit Transport Energy GJ/m2 0.046
References1. Keoleian, G. and Lewis, G. (1997) Application of Life-cycle Energy Analysis to Photovoltaic Module Design . Progress in Photovoltaics: Research and Applications. 5: pp. 287-300.2. Alsema, E. (2000) Energy pay-back time and CO 2 emissions of PV systems. Progress in Photovoltaics: Research and Applications. 8: pp. 17-25.3. Energy Information Administration (1995) Measuring Energy Efficiency in the United States' Economy: A Beginning . DOE/EIA-0555(95)/2.
A2

GREENHOUSE GAS EMISSIONS FOR PV MODULES (Page 1 of 2)
Reference Unit Emission Module Area TotalPage kg CO2/m
2 m2 kg CO2-EquivMaterials & Manufacturing A3
Material 16.7Manufacturing 27.7
Intermediate Transport 2.1Subtotal 46.5 157 7,315
Engineering & Administration A4 14.121 157 2,221Transportation to Site A4 3.394 157 534
Total Emissions 10,070
Material EmissionsUnit Energy1 Emis. Factor2,3 Unit Emission
Activity Material MJ/m2 kg CO2/MJ kg CO2/m2
Encapsulation Various 211.94 0.064 13.504Substrate Stainless Steel 25.64 0.062 1.579Deposition Materials Various 18.80 0.064 1.198Busbar Various 5.13 0.064 0.327
Back Reflector Various 0.73 0.064 0.047Grid Various -- -- --Conductive Oxide Various -- -- --
Total 16.7
Manufacturing EmissionsUnit Energy1 Emis. Factor2,3 Unit Emission
Activity MJ/m2 kg CO2/MJ kg CO2/m2
Encapsulation 137.23 0.056 7.75Substrate 56.40 0.056 3.19Deposition Materials 92.54 0.056 5.23Back Reflector 73.99 0.056 4.18Grid 34.18 0.056 1.93Conductive Oxide 96.94 0.056 5.48Total 27.75
Intermediate Transport EmissionsUnit Energy1 Emission Factor5 Unit Emission
Activity MJ/m2 kg CO2/MJ kg CO2/m2
Encapsulation 18.80 0.0738 1.39Substrate 9.28 0.0738 0.68Deposition Materials 0.24 0.0738 0.02Busbar 0.24 0.0738 0.02Back Reflector -- -- --Grid -- -- --Conductive Oxide -- -- --Total 2.11
References - See Page A4
A3

GREENHOUSE GAS EMISSIONS FOR PV MODULES (Page 2 of 2)
Engineering & Administration EmissionsUnit Energy6 Emis. Factor2,4 Unit Emission
Activity MJ/m2 kg CO2/MJ kg CO2/m2
Engineering & Administration 250 0.056 14.12
Transportation to Site EmissionsUnit Energy Emis. Factor5 Unit Emission
Activity MJ/m2 kg CO2/MJ kg CO2/m2
Transportation to Site 46 0.0738 3.39
ReferencesSources:1. Keoleian, G. and Lewis, G. (1997) Application of Life-cycle Energy Analysis to Photovoltaic Module Design. Progress in Photovoltaics: Research and Applications. 5: pp. 287-300.2. Energy Information Administration (1999) Annual Energy Review 1998 . DOE/EIA-0384(98).3. White, S. (1999) Energy Requirements and CO 2 Emissions in the Construction and Manufacture of Power Plants - Working Draft , University of Wisconsin - Madison.4. U.S. Environmental Protection Agency (1999) Inventory of U.S. Greenhouse Gas Emissions and Sinks: 1990–1997. USEPA #236-R-99-003.5. Organisation for Economic Cooperation and Development (1991) Greenhouse Gas Emissions: The Energy Dimension . OECD611990091P1.6. Alsema, E. (2000) Energy Pay-Back Time and CO 2 Emissions of PV Systems. Progress in Photovoltaics: Research and Applications. 8: pp. 17-25.
A4

BALANCE OF SYSTEM ENERGY REQUIREMENTS AND CO2-Equiv. EMISSIONS
INVERTERS
Inverter Capacity1 4000 W
Energy Intensity2 0.001 GJ/W
Number of System Inverters3 3
Energy Required 4.0 GJ
CO2 Intensity4 72.5 kg CO2/GJ
CO2-equiv. Emissions 290 kg
WIRING
AC Wiring3 100 feet
DC Wiring3 400 feet
Copper Required 24 kg
Energy Intensity5 0.12 GJ/kg
Energy Required 2.9 GJ
CO2 Intensity5 62.4 kg CO2/GJ
CO2-equiv. Emissions 179 kg
References:1. Trace Engineering. (April 9, 2001) Via: http://www.traceengineering.com.2. Alsema, E. (2000) Energy pay-back time and CO 2 emissions of PV systems. Progress in Photovoltaics: Research and Applications. 8: pp. 17-25.3. Burdick, J. (September 1,2000 - June 29, 2001) President, Burdick Technologies Unlimited, LLC. Personal Communications.4. Carnegie Mellon University (2001) Energy Input Output Life Cycle Analysis Database . Via: http://www.eiolca.net/. (Adjusted to Year 2000 Dollars).5. White, S. (1999) Energy Requirements and CO2 Emissions in the Construction and Manufacture of Power Plants - Working Draft , University of Wisconsin - Madison.
A5

INSTALLATION, OPERATION & MAINTENANCEENERGY REQUIREMENTS AND CO2-Equiv. EMISSIONS
Energy CO2-Equiv. CO2-equiv.
Cost1,2 Intensity3 Intensity3 Emission
Installation ($) GJ/$ GJ kg CO2/GJ kg
Installation (excludes roofing) 5667 0.00228 12.9 69.25 897
TOTAL 12.9 897
Energy CO2-Equiv. CO2-Equiv.
Cost1,2 Intensity3 Intensity3 Emission
OPERATION & MAINTENANCE ($) GJ/$ GJ kg CO2/GJ kg
Year 1 - System Optimization 1000 0.00228 2.3 69.25 158
Year 15 - Inverter Replacement* 4.0 290
Miscellaneous 1500 0.00315 4.7 69.55 328
TOTAL 11.0 776
*See Balance of System Page A4
References:1. Burdick, J. (September 1,2000 - June 29, 2001) President, Burdick Technologies Unlimited, LLC, Personal Communications.2. Bertsche, G. (June 14, 2001) Regional Sales Manager, Uni-Solar Corporation, Personal Communications.3. Carnegie Mellon University (2001) Energy Input Output Life Cycle Analysis Database . Via: http://www.eiolca.net/. (Adjusted to Year 2000 Dollars).
A6

DECOMMISSIONING AND DISPOSALENERGY REQUIREMENTS AND CO2-Equiv. EMISSIONS
CO2-Equiv.Energy Emission
Item GJ (kg)Decommissioning1 2.59 179.32Transportation 0.257 18.94Disposal 1.455 98.39Total Decom. and Disposal 4.30 296.7
TRANSPORTATIONTransport Transport Transport Transport
Mass Intensity2 Energy* Emis. Fctr6 EmissionComponent kg GJ/kg GJ kg CO2/GJ kg CO2
Decommission1
DisposalModules 1535 0.00015 0.233 73.80 17.23Inverter 48 0.00015 0.007 73.80 0.54Wiring 24 0.00015 0.004 73.80 0.27
Manufacturing Solid Waste4 77 0.00015 0.012 73.80 0.86Manufacturing Chemical Waste5 4 0.00015 0.001 73.80 0.05
Total 0.257 18.94* Assumes 30-mile transport distance.
DISPOSALDisposal Disposal Disposal Disposal
Mass Intensity3,4 Energy Emis. Fctr3,4 EmissionComponent kg GJ/kg GJ kg CO2/GJ kg CO2Disposal
Modules 1535 0.00072 1.11 70.763 78.61Inverter 48 0.00072 0.03 70.763 2.46Wiring 24 0.00072 0.02 70.763 1.23
Manufacturing Solid Waste4 77 0.00072 0.06 70.763 3.93Manufacturing Chemical Waste5 4 0.05804 0.24 51.397 12.17
1.455 98.39
References and Notes:
1. Decommissioning energy and emissions estimated as 20% of installation energy and emissions.2. Energy Information Administration (1995) Measuring Energy Efficiency in the United States' Economy: A Beginning. DOE/EIA-0555(95)/2.3. Fthenakis, V. (2000) End-of-life management and recycling of PV modules. Energy Policy. 28: pp. 1051- 1058.4. Carnegie Mellon University (2001) Energy Input Output Life Cycle Analysis Database . Via: http://www.eiolca.net/. (Adjusted to Year 2000 Dollars).5. Dones, R. and Frischknecht, R. (1998) Life-cycle Assessment of Photovoltaic Systems: Results of Swiss Studies on Energy Chains. Progress in Photovoltaics: Research and Applications. 6: pp. 117-125.6. Organisation for Economic Cooperation and Development (1991) Greenhouse Gas Emissions: The Energy Dimension. OECD611990091P1.
A7

LIFE-CYCLE ENERGY OUTPUT
OUTPUT ESTIMATIONPeak Output1 8 kW
Electrical System Efficiency1 80%
Degradation Losses2 7.6%
Lifetime 30 years
Life-cycle Output3,4 323,434 kWh
Life-cycle Output 1,164 GJ
Life-cycle Output 0.323 GWeh
Life-cycle Output 3.69E-05 GW-full power year
References and Notes:1. Burdick, J. (September 1, 2000 - June 29, 2001) President, Burdick Technologies Unlimited, LLC, Personal Communications.2. Based on a 15% total degradation over 30 year module lifetime. Bertsche, G. (June 14, 2001) Regional Sales Manager, United Solar Systems Corporation, Personal Communications.3. Output estimation based on 5 peak hours per day in Colorado (Burdick).4. (8 kW) x 80% x (5 hr/day) x (365 day/yr) x (1 - 7.6%) (30 yr) = 323,434 kWh
A8

ENERGY CENTEROF WISCONSIN
595 Science Drive
Madison, WI 53711
Phone: 608.238.4601
Fax: 608.238.8733
Email: [email protected]
www.ecw.org
Printed on Plainfield Plus,
a recycled chlorine-free stock
containing 20% post-consumer waste.