Embed Size (px)
Citation preview
VERSION 1
Greenhouse gas emissions and fossil energy usefrom poultry supply chains
Guidelines for assessment
http://www.fao.org/partnerships/leap MJ752-E

VERSION 1
Greenhouse gas emissions and fossil energy use from poultry supply chains
Guidelines for assessment
The designations employed and the presentation of material in this informationproduct do not imply the expression of any opinion whatsoever on the part of theFood and Agriculture Organization of the United Nations (FAO) concerning the legalor development status of any country, territory, city or area or of its authorities, orconcerning the delimitation of its frontiers or boundaries. The mention of specificcompanies or products of manufacturers, whether or not these have been patented,does not imply that these have been endorsed or recommended by FAO in preferenceto others of a similar nature that are not mentioned.
The views expressed in this information product are those of the author(s) and do notnecessarily reflect the views or policies of FAO.
ISBN 978-92-5-109496-9
© FAO, 2016
FAO encourages the use, reproduction and dissemination of material in this informationproduct. Except where otherwise indicated, material may be copied, downloaded andprinted for private study, research and teaching purposes, or for use in non-commercialproducts or services, provided that appropriate acknowledgement of FAO as the sourceand copyright holder is given and that FAO’s endorsement of users’ views, products orservices is not implied in any way.
All requests for translation and adaptation rights, and for resale and other commercialuse rights should be made via www.fao.org/contact-us/licence-request or addressed [email protected].
FAO information products are available on the FAO website (www.fao.org/publications)and can be purchased through [email protected]
Recommended CitationFAO. 2016. Greenhouse gas emissions and fossil energy use from poultry supply chains: Guidelines for assessment. Livestock Environmental Assessment and Performance Partnership. FAO, Rome, Italy.
These document will be regularly updated. To verify if this version is the most recent, please visit page http://www.fao.org/partnerships/leap/publications/en/
iii
Table of contents
Foreword vii
Acknowledgements ix
Abbreviations and acronyms xiii
Glossary xv
Summary of Recommendations for the LEAP guidance xxxv
PART 1OVERVIEW AND GENERAL PRINCIPLES 1
1. INTENDED USERS AND OBJECTIVES 3
2. SCOPE 4
2.1 Environmental impact categories addressed in the guidelines 4
2.2 Application 4
3. STRUCTURE AND CONVENTIONS 6
3.1 Structure 6
3.2 Presentational conventions 6
4. ESSENTIAL BACKGROUND INFORMATION AND PRINCIPLES 8
4.1 A brief introduction to LCA 8
4.2 Environmental impact categories 8
4.3 Normative references 9
4.4 Non-normative references 10
4.5 Guiding principles 11
5. LEAP AND THE PREPARATION PROCESS 13
5.1 Development of sector-specific guidelines 14
5.2 Poultry TAG and the preparation process 14
5.3 Period of validity 15
6. BACKGROUND INFORMATION ON POULTRY SUPPLY CHAINS 16
6.1 Background and context 16
6.2 Diversity of poultry production systems 176.2.1 Backyard production 18
6.2.2 Intermediate production 18
6.2.3 Large-scale production 19
6.2.4 Egg-laying chickens 19
6.2.4 Meat-producing chickens 21
6.3 Multi-functionality of poultry supply chains 22
6.4 Overview of global emission from poultry supply chains 23
iv
PART 2METHODOLOGY FOR QUANTIFICATION OF GREENHOUSE GAS EMISSIONS AND FOSSIL ENERGY USE OF POULTRY PRODUCTS 25
7. DEFINITION OF PRODUCTS AND PRODUCTION SYSTEMS 27
7.1 Products description 27
7.2 Life cycle stages: modularity 27
8. GOAL AND SCOPE DEFINITION 28
8.1 Goal of the LCA study 28
8.2 Scope of the LCA 28
8.3 Functional units and reference flows 29
8.4 System boundary 318.4.1 General / Scoping analysis 31
8.4.2 Criteria for system boundary 32
8.4.3 Material contribution and thresholds 32
8.4.4 Time boundary for data 33
8.4.5 Capital goods 35
8.4.6 Ancillary activities 35
8.4.7 Delayed emissions 35
8.4.8 Carbon Offsets 35
8.5 Impact categories 35
9. MULTI-FUNCTIONAL PROCESSES AND ALLOCATION 36
9.1 General principles 36
9.2 A decision tree to guide methodology choices 37
9.3 Application of general principles for poultry systems and processes 409.3.1 Meat production 41
9.3.2 Egg production 41
9.3.3 Allocation of manure / litter exported off-farm 41
9.3.4 Multi-functional manufacturing facilities 43
10. COMPILING AND RECORDING INVENTORY DATA 44
10.1 General principles 44
10.2 Requirements and guidance for the collection of data 4510.2.1 Requirements and guidance for the collection of primary data 46
10.2.2 Requirements and guidance for the collection and use of secondary data 47
10.2.3 Approaches for addressing data gaps in LCI 48
10.3 Data quality assessment 4910.3.1 Data quality rules 49
103.2 Data quality indicators 49
10.4 Uncertainty analysis and related data collection 5010.4.1 Secondary activity data 50
10.4.2 Default/proxy data 50
10.4.3 Inter- and intra-annual variability in emissions 50
v
11. LIFE CYCLE INVENTORY 51
11.1 Overview 51
11.2 Cradle to farm gate 5111.2.1 Feed assessment 52
11.2.2 Animal population and production 55
11.2.3 Manure production and management 56
11.2.4 Emissions from other farm-related inputs 60
11.2.5 By-products and waste 61
11.3 Transportation 61
11.4 Inclusion and treatment of land-use change impacts 62
11.5 Biogenic and soil carbon sequestration 62
11.6 Primary processing stage 62
11.7 Multi-functional examples 6311.7.1 On-site energy generation 63
11.7.2 Effect of mass and economic value of different components of an average US broiler leaving an abattoir on allocation calculations 65
12. INTERPRETATION OF LCA RESULTS 66
12.1 Identification of key issues 66
12.2 Characterizing uncertainty 6712.2.2 Sensitivity analysis 68
12.2.3 Normalization 68
12.3 Conclusions, recommendations and limitations 6812.3.1 Use and comparability of results 69
12.4 Good practice in reporting LCA results 69
12.5 Report elements and structure 69
12.6 Critical review 70
REFERENCES 71
APPENDICES
APPENDIX 1: LCI DATA TO BE COLLECTED 79
APPENDIX 2: LITERATURE REVIEW 96
APPENDIX 3: EXAMPLE CALCULATION OF ALLOCATION FOR LAYING OPERATION WITH MANURE AS A CO-PRODUCT 102

vii
Foreword
The methodology developed in these draft guidelines aims to introduce a harmo-nized international approach to the assessment of the environmental performance of poultry supply chains in a manner that takes account of the specificity of the various production systems involved. It aims to increase understanding of poul-try supply chains and help improve their environmental performance. The guide-lines are a product of the Livestock Environmental Assessment and Performance (LEAP) Partnership, a multi-stakeholder initiative whose goal is to improve the environmental sustainability of the livestock sector through better metrics and data.
The livestock sector has expanded rapidly in recent decades, and growth is projected to continue as a result of sustained demand, especially in developing countries. The poultry sector, which includes chicken, turkeys, guinea fowl, geese, quails, ducks and pigeons, is dynamic and growing. In 2011, global poultry production of meat and eggs was estimated to be over 90 million tonnes of meat and 65 million tonnes of shelled eggs, growing at an annual rate of around 3.5 and 2 percent per year, respectively (FAO, 2012). Expanding populations, greater purchasing power and increasing urbanization have been strong drivers of that growth. The poultry sector continues to be very di-verse in structural terms. Along with large-scale commercial operations, there contin-ues to be traditional small-scale, rural and family-based poultry systems, which play a crucial role in sustaining livelihoods. Increasing demand for poultry products is also set to put additional pressure on natural resources. This is of particular concern since the livestock sector already has a major impact on natural resources, using about 35 percent of total cropland and about 20 percent of green water for feed production (Macleod et al., 2013). Globally, poultry-related emissions account for about 600 million tonnes of CO2 equivalent per year, with about half coming from feed production (Macleod et al., 2013). There is growing interest, including from the poultry sector itself, in measuring and improving the environmental performance of poultry supply chains.
In the development of these draft guidelines, the following objectives were re-garded as key:
• to develop a harmonized, science-based approach founded on a consensus among the sector’s stakeholders;
• to recommend a scientific, but at the same time practical, approach that builds on existing or developing methodologies;
• to promote an approach to assessment suitable for a wide range of poultry supply chains; and
• to identify the principal areas where ambiguity or differing views exist as to the right approach.
These guidelines underwent a public review. The purpose of the review was to strengthen the advice provided and ensure it meets the needs of those seeking to im-prove performance through sound assessment practice. The present document is not intended to remain static. It will be updated and improved as the sector evolves and more stakeholders become involved in LEAP, and as new methodological frame-works and data become available. The development and inclusion of guidance on the evaluation of additional environmental impacts is viewed as a critical next step.
viii
The strength of the guidelines developed within the LEAP Partnership for the various livestock subsectors stems from the fact that they represent a coordinated cross-sectoral and international effort to harmonize measurement approaches. Ide-ally, harmonization will lead to greater understanding, transparent application and communication of metrics, and, importantly for the sector, real and measurable im-provement in performance.
Rogier Schulte, Teagasc - The Agriculture and Food Development Authority, Government of Ireland (2015 LEAP chair)
Lalji Desai, World Alliance of Mobile Indigenous People (2014 LEAP chair)Frank Mitloehner, University of California, Davis (2013 LEAP chair)Henning Steinfeld, Food and Agriculture Organization of the United Nations,
(LEAP co-chair)
ix
Acknowledgements
AUTHORSHIP AND DEVELOPMENT PROCESSThese guidelines are a product of the LEAP Partnership. Three groups contributed to their development: an ad hoc Technical Advisory Group (TAG), the LEAP Sec-retariat and the LEAP Steering Committee.
The TAG on poultry conducted the background research and developed the core technical content of the guidelines. The poultry TAG was composed of: Greg Thoma (Leader, University of Arkansas), Stephen Wiedemann (FSA Consulting, International Egg Commission, International Poultry Council, Australian Chick-en Meat Federation, Australia), Julio Cesar Pascale Palhares (Embrapa Pecuária Sudeste, Brazil), Md Abu Saleque (International Network for Family Poultry De-velopment, Bangladesh), Masayuki Kanzaki (Japan Environmental Management Association for Industry, Japan), Ayao Missohou (Ecole Inter-Etats des Sciences et Médecine Vétérinaires de Dakar, Senegal), Ilias Kyriazakis (University of New-castle, International Poultry Council, International Egg Commission, British Poul-try Council, United Kingdom), Jason Gittins (ADAS, United Kingdom) and Jamie Burr (Tyson Foods Inc., United States).
The LEAP Secretariat coordinated and facilitated the work of the TAG, guided and contributed to content development and ensured coherence among the various guidelines. The LEAP secretariat, hosted at the Food and Agriculture Organization (FAO) of the United Nations, was composed of: Pierre Gerber (Coordinator), Ali-son Watson (LEAP Manager until Dec 2013), Camillo De Camillis (LEAP manager since Feb 2014), Carolyn Opio (Technical officer), Félix Teillard (Technical officer) and Aimable Uwizeye (Technical officer).
The LEAP Steering Committee provided overall guidance for the activities of the Partnership and helped review and cleared the guidelines for public release. During development of the guidelines the LEAP Steering Committee was composed of:
Steering committee membersMonikka Agarwal (World Alliance of Mobile Indigenous People, in LEAP since Oct 2014), Douglas Brown (World Vision), Giuseppe Luca Capodieci (The Euro-pean Livestock And Meat Trading Union, International Meat Secretariat), Camillo De Camillis (FAO, LEAP manager since Feb 2014), Richard de Mooij (The Euro-pean Livestock And Meat Trading Union, International Meat Secretariat), Elsa Del-combel (Government of France), Lalji Desai (World Alliance of Mobile Indigenous People, 2014 LEAP Chair), Pierre Gerber (FAO, LEAP secretariat coordinator until Jan 2015), Mathias Ginet (Government of France, in LEAP since Oct 2014), Jan Grenz (Bern University of Applied Sciences, Government of Switzerland, in LEAP until Mar 2014), Vincent Guyonnet (International Egg Commission), Dave Harrison (International Meat Secretariat), Matthew Hooper (Government of New Zealand), Hsin Huang (International Meat Secretariat), Delanie Kellon (Interna-tional Dairy Federation), Lionel Launois (Government of France), Pablo Manza-no (International Union for Conservation of Nature), Nicolas Martin (European Feed Manufacturers’ Federation, The International Feed Industry Federation), Ian
x
McConnel (World Wide Fund for Nature, in LEAP since Jan 2015), Paul Melville (Government of New Zealand), Paul McKiernan (Government of Ireland), Frank Mitloehner (University of California, Davis, The International Feed Industry Fed-eration, 2013 LEAP Chair), Anne-Marie Neeteson-van Nieuwenhoven (Inter-national Poultry Council), Frank O’Mara (Teagasc - The Agriculture and Food Development Authority, Government of Ireland), Antonio Onorati (International Planning Committee for World Food Sovereignty) Carolyn Opio (FAO, LEAP secretariat coordinator since Jan 2015), Lara Sanfrancesco (International Poultry Council), Fritz Schneider (Bern University of Applied Sciences, Government of Switzerland, in LEAP until Feb 2015), Rogier Schulte (Teagasc - The Agriculture and Food Development Authority, Government of Ireland, 2015 LEAP chair), Henning Steinfeld (FAO, LEAP Partnership co-chair), Nico van Belzen (Interna-tional Dairy Federation), Elsbeth Visser (Government of the Netherlands), Alison Watson (FAO, LEAP manager until Dec 2013), Bryan Weech (World Wide Fund for Nature, in LEAP until 2014), Geert Westenbrink (Government of the Nether-lands) and Hans-Peter Zerfas (World Vision).
Observers and advisersAlejandro Acosta (FAO, Global Agenda For Sustainable Livestock, in LEAP since Feb 2015), Rudolph De Jong (International Wool Textile Organization, in LEAP until Oct 2014), Jeroen Dijkman (FAO, Global Agenda For Sustainable Livestock, in LEAP until Jan 2015), Matthias Finkbeiner (International Organization for Standardization), Neil Fraser (FAO, Global Agenda For Sustainable Livestock), Michele Galatola (European Commission, Directorate-General for Environment), James Lomax (United Nations Environment Programme), Llorenç Milà i Canals (United Nations Environment Programme), Paul Pearson (International Council of Tanners, in LEAP since Feb. 2015), Erwan Saouter (European Commission, Joint Research Centre), Sonia Valdivia (United Nations Environment Programme) and Elisabeth van Delden (International Wool Textile Organization).
Although not directly responsible for the preparation of these guidelines, the LEAP TAGs on feed and small ruminants indirectly contributed to this technical document.
MULTI-STEP REVIEW PROCESSThe initial draft guidelines developed by the TAG over 2013 went through an exter-nal peer review before being revised and submitted for public review.
Laura Drauker (World Resource Institute), Christel Cederberg (SIK and Chalm-ers University of Technology, Gothenburg) John Kazer (Carbon Trust, London) peer reviewed these guidelines in late 2013.
The LEAP Secretariat reviewed this technical guidance before its submission for both external peer review and public review. The LEAP Steering Committee also reviewed the guidelines at various stages of their development and provided addi-tional feedback before clearing their release for public review.
The public review was announced at the 1st Annual Meeting of the LEAP Part-nership on 6 March 2014 and lasted until 31 July 2014. The review period was also announced to the public through an article published on the FAO website. The sci-entific community working on the accounting of greenhouse gas (GHG) emissions from livestock was alerted through the Livestock and Climate Change Mitigation in
xi
Agriculture Discussion group on the forum of the Mitigation of Climate Change in Agriculture (MICCA) Programme. Experts in life cycle assessment (LCA) were in-formed through an issue of the United Nations Environment Programme (UNEP)/Society for Environmental Toxicology and Chemistry (SETAC) Life Cycle Initia-tive newsletter and through announcements and reminders circulated via the mail-ing list on LCA held by PRé Consultants. The LEAP Secretariat also publicized the 2014 LEAP public review through oral speeches in the Product Environmental Footprint (PEF) World Forum and other regional conferences. The following have participated in the public review and contributed to improving the quality of this technical document: Anne-Marie Neeteson on behalf of the International Poultry Council, Xavier Vergé and Raymond Desjardins (University of Guelph, Canada, Agriculture and Agri-Food Canada), Michael Binder International Feed Industry Federation/EU Association of Specialty Feed Ingredients and their Mixtures), Vin-cent Guyonnet on behalf of the International Egg Commission, Bo Weidema (2.-0 LCA consultants, Denmark), Florence Scarsi on behalf of the French Ministry of Ecology, Sustainable Development and Energy, Adrian Leip, Hanna Tuomisto, Luca Zampori, Erwin Schau, Erwan Saouter and David Pennington (European Commission, Joint Research Centre).
SPONSORS, ADVISORY AND NETWORKINGFAO is very grateful for all valuable contributions provided at various levels by LEAP partners.
Particular gratitude goes to the following countries that have continually sup-ported the Partnership through funding and often in-kind contributions: France, Ireland, the Netherlands, New Zealand, and Switzerland.
Particularly appreciated were the in-kind contributions from the following civil society organizations and non-governmental organizations represented in the Steering Committee: the International Planning Committee for Food Sovereignty, the International Union for Conservation of Nature, The World Alliance of Mobile Indigenous People, World Vision and the World Wildlife Fund.
The following international organizations and companies belonging to the LEAP private sector cluster also played a major role by actively supporting the project via funding and/or in-kind contributions: the International Dairy Federation, the International Egg Commission, the International Feed Industry Federation, the In-ternational Meat Secretariat, the International Poultry Council, the International Council of Tanners, the International Wool and Textile Organization, FEDIOL, the International Federation for Animal Health, DSM Nutritional Products AG and Novus International.
Substantial in-kind contribution came from FAO staff and the MICCA Pro-gramme.
Last but not least, the LEAP Partnership is also grateful for the advisory pro-vided by the International Organization for Standardization (ISO), UNEP and the European Commission, and is glad to network with the World Organisation for Animal Health and the Global Agenda for Sustainable Livestock.

xiii
Abbreviations and acronyms
CFP Carbon footprint of a productCHP Combined heat and powerCO2e Carbon dioxide equivalentFAO Food and Agriculture Organization of the United NationsGHG Greenhouse GasGWP Global Warming PotentialILCD International Reference Life Cycle Data SystemIPCC Intergovernmental Panel on Climate ChangeISO International Organization for StandardisationLCA Life Cycle AssessmentLCI Life Cycle InventoryLCIA Life Cycle Impact AssessmentLEAP Livestock Environmental Assessment and Performance PartnershipLUC Land-Use ChangeME Metabolizable EnergyPAS Publicly Available SpecificationPCR Product Category RulesPEF Product Environmental FootprintPDF Probability Density FunctionsSETAC Society for Environmental Toxicology and Chemistry TAG Technical Advisory GroupUNEP United Nations Environment ProgrammeUNFCCC United Nations Framework Convention on Climate ChangeWBCSD World Business Council for Sustainable DevelopmentWRI World Resource InstituteVS Volatile solids

xv
Glossary
Terms relating to feed and food supply chains
Annual forage Forage established annually, usually with annual plants, and generally involves soil disturbance, removal of existing vegeta-tion, and other cultivation practices.
Animal by-product
Livestock production output classified in the European Union in three categories mostly due to the risk associated to the bo-vine spongiform encephalopathy.
Cold chain Refers to a system for distributing products in which the goods are constantly maintained at low temperatures (e.g. cold or frozen storage and transport), as they move from producer to consumer.
Combined heat and power (CHP)
Simultaneous generation in one process of useable thermal en-ergy together with electrical and/or mechanical energy.
Compound feed/concentrate
Mixtures of feed materials, which may contain additives for use as animal feed in the form of complete or complementary feedstuffs.
Cropping Land on which the vegetation is dominated by large-scale pro-duction of crops for sale (e.g. maize, wheat, and soybean pro-duction).
Crop product Product from a plant, fungus or algae cultivation system that can either be used directly as feed or as raw material in food or feed processing.
Crop residues Materials left in an agricultural field after the crop has been harvested.
Crop rotation Growing of crops in a seasonal sequence to prevent diseases, maintain soil conditions and optimize yields.
Cultivation Activities related to the propagation, growing and harvesting of plants including activities to create favourable conditions for their growing.
Retail packaging Containers and packaging that reach consumers.
xvi
Feed (feeding stuff)
Any single or multiple materials, whether processed, semi-processed or raw, which is intended to be fed directly to food producing animals. - Codex Alimentarius, Code of practice on good animal feed-ing CAC/RCP 54 (FAO/WHO Codex Alimentarius, 2008).
Feed additive Any intentionally added ingredient not normally consumed as feed by itself, whether or not it has nutritional value, which af-fects the characteristics of feed or animal products. Note: Micro-organisms, enzymes, acidity regulators, trace el-ements, vitamins and other products fall within the scope of this definition depending on the purpose of use and method of administration. - Codex Alimentarius, Code of practice on good animal feed-ing CAC/RCP 54 (FAO/WHO Codex Alimentarius, 2008).
Feed conversion ratio
Measure of the efficiency with which an animal converts feed into tissue, usually expressed in terms of kg of feed per kg of output (e.g. live weight or protein).
Feed digestibility Determines the relative amount of ingested feed that is actually absorbed by an animal and therefore the availability of feed energy or nutrients for growth, reproduction, etc.
Feed ingredient A component part or constituent of any combination or mix-ture making up a feed, whether or not it has a nutritional value in the animal’s diet, including feed additives. Ingredients are of plant, animal or aquatic origin, or other organic or inorganic substances.- Codex Alimentarius, Code of practice on good animal feed-ing CAC/RCP 54 (FAO/WHO Codex Alimentarius, 2008).
Fodder Harvested forage fed intact to livestock, which can include fresh and dried forage.
Forage crop Crops, annual or biennial, grown to be used for grazing or harvested as a whole crop for feed.
Conserved forage Conserved forage saved for future use. Forage can be con-served in situ (e.g. stockpiling) or harvested, preserved and stored (e.g. hay, silage or haylage).
Medicated feed Any feed which contains veterinary drugs as defined in the Codex Alimentarius Commission Procedural Manual.- Codex Alimentarius, Code of practice on good animal feed-ing CAC/RCP 54 (FAO/WHO Codex Alimentarius, 2008).
xvii
Natural or cross ventilation
Limited use of fans for cooling; frequently a building’s sides can be opened to allow air circulation.
Natural pasture Natural ecosystem dominated by indigenous or naturally oc-curring grasses and other herbaceous species used mainly for grazing by livestock and wildlife.
Packing Process of packing products in the production or distribution stages.
Primary packag-ing materials
Packaging in direct contact with the product. See also: Retail packaging
Production unit A group of activities (and the necessary inputs, machinery and equipment) in a processing facility or a farm that are needed to produce one or more co-products. Examples are the crop fields in an arable farm, the potential multiple animal herds that are common in small holder operations (sheep, goats deer, dairy cattle, suckling cattle or even rearing of heifers, produc-tion of milk, etc.), or the individual processing lines in a manu-facturing facility.
Raw material Primary or secondary material used to produce a product.
Secondary pack-aging materials
Additional packaging, not contacting the product, which may be used to contain relatively large volumes of primary pack-aged products or transport the product safely to its retail or consumer destination.
Silage Forage harvested and preserved (at high moisture contents generally greater than 500 g kg-1) by organic acids produced during partial anaerobic fermentation.
Volatile solids Volatile solids (VS) are the organic material in livestock ma-nure and consist of both biodegradable and non-biodegradable fractions. VS are measured as the fraction of sludge combusted at 550 degrees Celsius after 2 hours.
xviii
Terms relating to poultry supply chains
Breeding hen Female parent bird producing fertile eggs for commercial poultry meat and egg production.
Breeding overhead
Animals dedicated to reproduction rather than to production, i.e. animals needed to maintain herd/flock size.
Broiler Chicken reared for meat.
Chicken meat processing
A general term for further processing needed after dressing (e.g. cutting, selection, cooking)
Cull birds Birds that are euthanized before the end of the normal produc-tive period. These may include birds that are diseased, injured, defective (e.g. physical abnormalities,) or those that do not conform to the expected breed or production standards (e.g. birds with stunted growth, non-laying hens). These animals are disposed of after euthanasia and do not enter the human food supply.
Dressed parts Items divided or removed from carcasses or gutted chickens.
Dressing Removal of parts not to be offered as edible products. Cutting up chickens into product parts.
Free-range eggs Are produced by hens raised outdoors or with outdoor access if weather permits. Shelter is provided during bad weather and as protection from predators. While having continuous access to fresh food and water, these hens may forage for wild plants and insects and are sometimes referred to as pasture-fed hens. They are also provided with indoor floor space, nest space, and perches.
Gutted chicken A bird whose viscera (excluding kidneys), cloaca, trachea, and oesophagus have been removed. Inclusion of caudal portion is arbitrary.
Layer / Laying hen
Bird kept for production of eggs intended for human con-sumption.
Volières systems Systems offering the hens a relatively complex environment where they can move very freely. The layers can move to sev-eral open stories in the system where they can find food, water, nests and perches, and of course there is a large open space on the floor for scratching.
xix
Organic eggs Eggs produced according to national/international organic standards covering various areas such as feeding practices, animal husbandry and housing system. Organic eggs are pro-duced by hens fed on products grown without most conven-tional pesticides, fungicides, herbicides or commercial fertil-izers. Antibiotics are prohibited. Hens must be free range.
Repackaging facility
A facility where products are repackaged into smaller units without additional processing in preparation for retail sale.
Retail cuts Cuts of meat for retail sale (e.g. breast/thigh meat, wings, livers).
Rendering A process that converts animal tissue, bones and blood into stable, value-added materials.
Spent hen Adult female poultry at the end of their productive life.
Stocking density Area available to poultry, normally defined as birds per square meter, or on a weight basis as kg per square meter.
System, caged Birds are housed in indoor cages in groups of various sizes.
System, cage-free or barn
Birds are free to roam indoors, sometimes on multiple floor levels (aviary system). Flooring may consist of litter and/or other material such as slats or mesh.
System, free range
System where animals can range outdoors. The definition of ‘range’ is variable depending on individual country require-ments.
System, large-scale indoor
Birds are free to roam indoors over the floor, with litter, but cannot go outdoors. Birds may also be housed on tiered mesh structures with belts for manure removal.
System, organic In addition to providing free-range conditions, these systems adhere to local country standards for organic production.
System, Village Village systems allow free-range birds to scavenge for food. Birds may also be fed compound feed/concentrate rations.
Tunnel ventilation Fans located at the building ends provide axial airflow.
xx
Terms relating to environmental accounting and environmental assessment
Acidification Impact category that addresses impacts due to acidifying substances in the environment. Emissions of nitrogen oxides (NOx), ammonia (NH3) and sulphur oxides (SOx) lead to re-leases of hydrogen ions (H+) when the gases are mineralized. The protons contribute to the acidification of soils and water when they are released in areas where the buffering capacity is low. Acidification may result to forest decline and lake acidi-fication.- Adapted from Product Environmental Footprint (PEF) Guide (European Commission, 2013)
Activity data Data on the magnitude of human activity resulting in emis-sions or removals taking place during a given period of time (UNFCCC, n.d.).
Allocation Partitioning the input or output flows of a process or a prod-uct system between the product system under study and one or more other product systems. - ISO 14044:2006, 3.17 (ISO, 2006c)
Anthropogenic Relating to, or resulting from the influence of human beings on nature.
Attributional modelling approach
System modelling approach in which inputs and outputs are attributed to the functional unit of a product system by linking and/or partitioning the unit processes of the system according to a normative rule.- Global Guidance Principles for Life Cycle Assessment Data-bases (UNEP/SETAC Life Cycle Initiative, 2011)
Background system
The background system consists of processes on which no or, at best, indirect influence may be exercised by the decision maker for which an LCA is carried out. Such processes are called “background processes.” - Global Guidance Principles for Life Cycle Assessment Data-bases (UNEP/SETAC Life Cycle Initiative, 2011)
Biogenic carbon Carbon derived from biomass.- ISO/TS 14067:2013, 3.1.8.2 (ISO, 2013a)
xxi
Biomass Material of biological origin excluding material embedded in geological formations and material transformed to fossilized material, and excluding peat.- ISO/TS 14067:2013, 3.1.8.2 (ISO, 2013a)
Capital goods Capital goods are final products that have an extended life and are used by the company to manufacture a product; provide a service; or sell, store, and deliver merchandise. In financial ac-counting, capital goods are treated as fixed assets or as plant, property, and equipment. Examples of capital goods include equipment, machinery, buildings, facilities, and vehicles.- Technical Guidance for Calculating Scope 3 Emissions, Chapter 2 (WRI and WBCSD, 2011b)
Carbon dioxide equivalent (CO2e)
Unit for comparing the radiative forcing of a greenhouse gas (GHG) to that of carbon dioxide.- ISO/TS 14067:2013, 3.1.3.2 (ISO, 2013a)
Carbon footprint of a product (CFP)
Sum of greenhouse gas emissions and removals in a product system, expressed as carbon dioxide equivalents (CO2e) and based on a life cycle assessment using the single impact cat-egory of climate change.- ISO/TS 14067:2013, 3.1.1.1 (ISO, 2013a)
Carbon storage Carbon removed from the atmosphere and stored as carbon.- ISO 16759:2013, 3.1.4 (ISO, 2013b)
Characterization Calculation of the magnitude of the contribution of each clas-sified input/output to their respective impact categories, and aggregation of contributions within each category. This re-quires a linear multiplication of the inventory data with char-acterization factors for each substance and impact category of concern. For example, with respect to the impact category ‘cli-mate change’, CO2 is chosen as the reference substance and kg CO2-equivalents as the reference unit.- Adapted from: Product Environmental Footprint (PEF) Guide (European Commission, 2013)
Characterization factor
Factor derived from a characterization model that is applied to convert an assigned life cycle inventory analysis result to the common unit of the category indicator.- ISO 14044:2006, 3.37 (ISO, 2006c)
xxii
Classification Assigning the material/energy inputs and outputs tabulated in the Life Cycle Inventory to impact categories according to each substance’s potential to contribute to each of the impact categories considered.- Adapted from: Product Environmental Footprint (PEF) Guide (European Commission, 2013)
Combined production
A multifunctional process in which production of the various outputs can be independently varied. For example in a back-yard system the number of poultry and swine can be set inde-pendently.
Comparative assertion
Environmental claim regarding the superiority or equivalence of one product versus a competing product that performs the same function.- ISO 14044:2006, 3.6 (ISO, 2006c).
Comparison A comparison of two or more products regarding the results of their life cycle assessment as according to these guidelines and not including a comparative assertion.
Consequential data modelling
System modelling approach in which activities in a product system are linked so that activities are included in the product system to the extent that they are expected to change as a con-sequence of a change in demand for the functional unit.- Global Guidance Principles for Life Cycle Assessment Data-bases (UNEP/SETAC Life Cycle Initiative, 2011).
Consumable Ancillary input that is necessary for a process to occur but that does not form a tangible part of the product or co-products arising from the processNote 1: Consumables differ from capital goods in that they have an expected life of one year or less, or a need to replenish on a one year or less basis (e.g. lubricating oil, tools and other rapidly wearing inputs to a process).Note 2: Fuel and energy inputs to the life cycle of a product are not considered to be consumables.- PAS 2050:2011, 3.10 (BSI, 2011).
Co-production A generic term for multi-functional processes; either com-bined- or joint-production.
Co-products Any of two or more products coming from the same unit pro-cess or product system.- ISO 14044:2006, 3.10 (ISO, 2006c)
xxiii
Cradle to gate Life-cycle stages from the extraction or acquisition of raw ma-terials to the point at which the product leaves the organisation undertaking the assessment.- PAS 2050:2011, 3.13 (BSI, 2011)
Critical review Process intended to ensure consistency between a life cycle as-sessment and the principles and requirements of the Interna-tional Standards on life cycle assessment.- ISO 14044:2006, 3.45 (ISO, 2006c)
Critical review report
Documentation of the critical review process and findings, in-cluding detailed comments from the reviewer(s) or the criti-cal review panel, as well as corresponding responses from the practitioner of the LCA study.- ISO 14044:2006, 3.7 (ISO, 2006c)
Cut-off criteria Specification of the amount of material or energy flow or the level of environmental significance associated with unit pro-cesses or product system to be excluded from a study.- ISO 14044:2006, 3.18 (ISO, 2006c)
Data quality Characteristics of data that relate to their ability to satisfy stat-ed requirements.- ISO 14044:2006, 3.19 (ISO, 2006c)
Dataset (both LCI dataset and LCIA dataset)
A document or file with life cycle information of a specified product or other reference (e.g. site, process), covering de-scriptive metadata and quantitative life cycle inventory and/or life cycle impact assessment data, respectively.- International Reference Life Cycle Data System (ILCD) Handbook: General guide for Life Cycle Assessment - De-tailed guidance (European Commission, 2010b)
Delayed emissions
Emissions that are released over time, e.g. through prolonged use or final disposal stages, versus a single, one-time emission.- Adapted from: Product Environmental Footprint (PEF) Guide (European Commission, 2013).
Direct Land-Use Change (dLUC)
Change in human use or management of land within the prod-uct system being assessed.- ISO/TS 14067:2013, 3.1.8.4 (ISO, 2013a)
Direct energy Energy used on farms for livestock production activities (e.g. lighting, heating).
xxiv
Downstream Occurring along a product supply chain after the point of re-ferral. - Product Environmental Footprint (PEF) Guide (European Commission, 2013)
Drainage basin Area from which direct surface runoff from precipitation drains by gravity into a stream or other water body. Note 1: The terms ‘watershed’, ‘drainage area’, ‘catchment’, ‘catchment area’ or ‘river basin’ are sometimes used for the concept of ‘drainage basin’.Note 2: Groundwater drainage basin does not necessarily cor-respond in area to surface drainage basin.Note 3: The geographical resolution of a drainage basin should be determined at the goal and scope stage: it may regroup dif-ferent sub drainage basins.- ISO 14046:2014, 3.1.8 (ISO, 2014)
Economic value Average market value of a product at the point of production possibly over a 5-year time frame.- Adapted from: PAS 2050:2011, 3.17 (BSI, 2011)Note 1: Where barter is in place, the economic value of the commodity traded can be calculated on the basis of the market value and amount of the commodity exchanged.
Eco-toxicity Environmental impact category that addresses the toxic im-pacts on an ecosystem, which damage individual species and change the structure and function of the ecosystem. Eco-toxic-ity is a result of a variety of different toxicological mechanisms caused by the release of substances with a direct effect on the health of the ecosystem.- Adapted from: Product Environmental Footprint (PEF) Guide (European Commission, 2013)
Elementary flow Material or energy entering the system being studied that has been drawn from the environment without previous human transformation, or material or energy leaving the system being studied that is released into the environment without subse-quent human transformation.- ISO 14044:2006, 3.12 (ISO, 2006c).
Emission factor Amount of GHG emitted, expressed as carbon dioxide equiv-alent and relative to a unit of activity (e.g. kg CO2e per unit input) (Adapted from: UNFCCC, n.d.).Note: Emission factor data is obtained from secondary data sources.
xxv
Emissions Release of substance to air and discharges to water and land.
Environmental impact
Any change to the environment, whether adverse or beneficial, wholly or partially resulting from an organization’s activities, products or services.- ISO/TR 14062:2002, 3.6 (ISO, 2002).
Eutrophication Excess of nutrients (mainly nitrogen and phosphorus) in water or soil, from sewage outfalls and fertilized farmland. In water, eutrophication accelerates the growth of algae and other vegetation in water. The degradation of organic mate-rial consumes oxygen resulting in oxygen deficiency and, in some cases, fish death. Eutrophication translates the quantity of substances emitted into a common measure expressed as the oxygen required for the degradation of dead biomass. In soil, eutrophication favours nitrophilous plant species and modifies the composition of the plant communities.- Adapted from: Product Environmental Footprint (PEF) Guide (European Commission, 2013)
Extrapolated data
Refers to data from a given process that is used to represent a similar process for which data is not available, on the assump-tion that it is reasonably representative.- Product Environmental Footprint (PEF) Guide (European Commission, 2013).
Final product Goods and services that are ultimately consumed by the end user rather than used in the production of another good or service.- Product Life Cycle Accounting and Reporting Standard (WRI and WBCSD, 2011a).
Foreground system
The foreground system consists of processes that are under the control of the decision maker for which an LCA is carried out. They are called ‘foreground processes’.- Global Guidance Principles for Life Cycle Assessment Data-bases (UNEP/SETAC Life Cycle Initiative, 2011)
Functional unit Quantified performance of a product system for use as a refer-ence unit.- ISO 14044:2006, 3.20 (ISO, 2006c).It is essential that the functional unit allows comparisons that are valid where the compared objects (or time series data on the same object, for benchmarking) are comparable.
xxvi
GHG removal Mass of a GHG removed from the atmosphere.- ISO/TS 14067:2013, 3.1.3.6 (ISO, 2013a)
Global Warming Potential (GWP)
Characterization factor describing the radiative forcing impact of one mass-based unit of a given GHG relative to that of car-bon dioxide over a given period of time.- ISO/TS 14067:2013, 3.1.3.4 (ISO, 2013a)
Greenhouse gases (GHGs)
Gaseous constituent of the atmosphere, both natural and an-thropogenic, that absorbs and emits radiation at specific wave-lengths within the spectrum of infrared radiation emitted by the Earth’s surface, the atmosphere and clouds.- ISO 14064-1:2006, 2.1 (ISO, 2006d)
Human toxicity – cancer
Impact category that accounts for the adverse health effects on human beings caused by the intake of toxic substances through inhalation of air, food/water ingestion, penetration through the skin insofar as they are related to cancer.- Product Environmental Footprint (PEF) Guide (European Commission, 2013)
Human toxicity – non-cancer
Impact category that accounts for the adverse health effects on human beings caused by the intake of toxic substances through inhalation of air, food/water ingestion, penetration through the skin insofar as they are related to non-cancer effects that are not caused by particulate matter/respiratory inorganics or ionizing radiation.- Product Environmental Footprint (PEF) Guide (European Commission, 2013)
Indirect Land-Use Change (iLUC)
Change in the use or management of land which is a conse-quence of direct land-use change, but which occurs outside the product system being assessed.- ISO/TS 14067:2013, 3.1.8.5, ISO (2013a)
Impact category Class representing environmental issues of concern to which life cycle inventory analysis results may be assigned.- ISO 14044:2006, 3.39 (ISO, 2006c).
Impact category indicator
Quantifiable representation of an impact category.- ISO 14044:2006, 3.40 (ISO, 2006c)
Infrastructure Synonym for capital good.
xxvii
Input Product, material or energy flow that enters a unit process.- ISO 14044:2006, 3.21 (ISO, 2006c)
Ionizing radiation, human health
Impact category that accounts for the adverse health effects on human health caused by radioactive releases.- Product Environmental Footprint (PEF) Guide (European Commission, 2013)
Intermediate product
Output from a unit process that is input to other unit pro-cesses that require further transformation within the system.- ISO 14044:2006, 3.23 (ISO, 2006c)
Joint production A multi-functional process that produces various outputs, such as meat and eggs in backyard systems. Production of the different goods cannot be independently varied, or only varied within a very narrow range.
Land occupation Impact category related to use (occupation) of land area by activities, such as agriculture, roads, housing and mining.- Adapted from: Product Environmental Footprint (PEF) Guide (European Commission, 2013)
Land-use change Change in the purpose for which land is used by humans (e.g. between crop land, grass land, forestland, wetland, industrial land).- PAS 2050:2011, 3.27 (BSI, 2011)
Life cycle Consecutive and interlinked stages of a product system, from raw material acquisition or generation from natural resources to final disposal.- ISO 14044:2006, 3.1 (ISO, 2006c)
Life Cycle Assessment (LCA)
Compilation and evaluation of the inputs, outputs and the po-tential environmental impacts of a product system throughout its life cycle.- ISO 14044:2006, 3.2 (ISO, 2006c)
Life cycle GHG emissions
Sum of GHG emissions resulting from all stages of the life cycle of a product and within the specified system boundaries of the product.- PAS 2050:2011, 3.30 (BSI, 2011)
Life Cycle Impact Assessment (LCIA)
Phase of LCA aimed at understanding and evaluating the mag-nitude and significance of the potential impacts for a product system throughout the life cycle of the product.- Adapted from: ISO 14044:2006, 3.4 (ISO, 2006c).
xxviii
Life Cycle Inventory (LCI)
Phase of LCA involving the compilation and quantification of inputs and outputs for a product throughout its life cycle.- ISO 14046:2014, 3.3.6 (ISO, 2014)
Life Cycle Interpretation
Phase of LCA in which the findings of either the inventory analysis or the impact assessment, or both, are evaluated in re-lation to the defined goal and scope in order to reach conclu-sions and recommendations.- ISO 14044:2006, 3.5 (ISO, 2006c)
Material contribution
Contribution from any one source of GHG emissions of more than 1 percent of the anticipated total GHG emissions associ-ated with the product being assessed. Note: A materiality threshold of 1 percent has been established to ensure that very minor sources of life cycle GHG emissions do not require the same treatment as more significant sources.- PAS 2050:2011, 3.31 (BSI, 2011)
Multi- functionality
If a process or facility provides more than one function, i.e. if it delivers several goods and/or services (‘co-products’), it is ‘multi-functional’. In these situations, all inputs and emissions linked to the process must be partitioned between the product of interest and the other co-products in a principled manner.- Product Environmental Footprint (PEF) Guide (European Commission, 2013)
Normalization After the characterization step, normalization is an optional step in which the impact assessment results are multiplied by normalization factors that represent the overall inventory of a reference unit (e.g. a whole country or an average citizen). Nor-malized impact assessment results express the relative shares of the impacts of the analysed system in terms of the total contri-butions to each impact category per reference unit. When dis-playing the normalized impact assessment results of the differ-ent impact topics next to each other, it becomes evident which impact categories are affected most and least by the analysed system. Normalized impact assessment results reflect only the contribution of the analysed system to the total impact poten-tial, not the severity/relevance of the respective total impact. Normalized results are dimensionless, but not additive.- Product Environmental Footprint (PEF) Guide (European Commission, 2013)
xxix
Offsetting Mechanism for compensating for all or for a part of the carbon footprint of a product through the prevention of the release of, reduction in, or removal of an amount of greenhouse gas emis-sions in a process outside the boundary of the product system.- ISO/TS 14067:2013, 3.1.1.4 (ISO, 2013a)
Output Product, material or energy flow that leaves a unit process.- ISO 14044:2006, 3.25 (ISO, 2006c)
Ozone depletion Impact category that accounts for the degradation of strato-spheric ozone due to emissions of ozone-depleting substances, for example long-lived chlorine and bromine containing gases (e.g. chlorofluorocarbons, hydrochlorofluorocarbons, Ha-lons).- Product Environmental Footprint (PEF) Guide (European Commission, 2013)
Particulate matter Impact category that accounts for the adverse health effects on human health caused by emissions of particulate matter (PM) and its precursors (NOx, SOx, NH3).- Product Environmental Footprint (PEF) Guide (European Commission, 2013)
Photochemical ozone formation
Impact category that accounts for the formation of ozone at the ground level of the troposphere caused by photochemical oxidation of Volatile Organic Compounds (VOCs) and carbon monoxide (CO) in the presence of nitrogen oxides (NOx) and sunlight. High concentrations of ground-level tropospheric ozone damage vegetation, human respiratory tracts and man-made materials through reaction with organic materials.- Product Environmental Footprint (PEF) Guide (European Commission, 2013)
Primary data Quantified value of a unit process or an activity obtained from a direct measurement or a calculation based on direct measure-ments at its original source.- ISO 14046:2014, 3.6.1 (ISO, 2014)
Primary activity data
Quantitative measurement of activity from a product’s life cycle that, when multiplied by the appropriate emission fac-tor, determines the GHG emissions arising from a process. Examples of primary activity data include the amount of en-ergy used, material produced, service provided or area of land affected.- PAS 2050:2011, 3.34 (BSI, 2011)
xxx
Product(s) Any goods or service.- ISO 14046:2014, 3.5.9 (ISO, 2014)
Product category Group of products that can fulfil equivalent functions.- ISO 14046:2014, 3.5.9 (ISO, 2014)
Product category rules (PCR)
Set of specific rules, requirements and guidelines for develop-ing Type III environmental declarations for one or more prod-uct categories.- ISO 14025:2006, 3.5 (ISO, 2006a)
Product system Collection of unit processes with elementary and product flows, performing one or more defined functions, and which models the life cycle of a product.- ISO 14044:2006, 3.28 (ISO, 2006c)
Proxy data Data from a similar activity that is used as a stand-in for the given activity. Proxy data can be extrapolated, scaled up, or customised to represent the given activity. For example, using a Chinese unit process for electricity production in an LCA for a product produced in Viet Nam.- Product Life Cycle Accounting and Reporting Standard (WRI and WBCSD, 2011ba)
Reference flow Measure of the outputs from processes in a given product sys-tem required to fulfil the function expressed by the functional unit.- ISO 14044:2006, 3.29 (ISO, 2006c)
Releases Emissions to air and discharges to water and soil.- ISO 14044:2006, 3.30 (ISO, 2006c)
Reporting Presenting data to internal management or external users, such as regulators, shareholders, the general public or specific stakeholder groups.- Adapted from: ENVIFOOD Protocol (Food SCP RT, 2013).
xxxi
Residue or Residual
Substance that is not the end product (s) that a production pro-cess directly seeks to produce.- Communication from the European Commission 2010/C 160/02 (European Commission, 2010a)More specifically, a residue is any material without economic value leaving the product system in the condition as it created in the process, but which has a subsequent use. There may be value-added steps beyond the system boundary, but these ac-tivities do not impact the product system calculations. Note 1: Materials with economic value are considered prod-ucts. Note 2: Materials whose economic value is both negligible relative to the annual turnover of the organization, and is also entirely determined by the production costs necessary not to turn such materials in waste streams are to be considered as residues from an environmental accounting perspective.Note 3: Those materials whose relative economic value vola-tility is high in the range of positive and negative value, and whose average value is negative are residues from an envi-ronmental accounting perspective. Materials economic value volatility is possibly calculated over a 5-year time frame at the regional level.
Resource depletion
Impact category that addresses use of natural resources renew-able or non-renewable, biotic or abiotic.- Product Environmental Footprint (PEF) Guide (European Commission, 2013)
Secondary data Data obtained from sources other than a direct measurement or a calculation based on direct measurements at the original source.- ISO 14046:2014, 3.6.2 (ISO, 2014) Secondary data are used when primary data are not available or it is impractical to obtain primary data. Some emissions, such as methane from litter management, are calculated from a model, and are therefore considered secondary data.
Sensitivity analysis
Systematic procedures for estimating the effects of the choices made regarding methods and data on the outcome of a study.- ISO 14044:2006, 3.31 (ISO, 2006c)
Sink Physical unit or process that removes a GHG from the atmo-sphere.- ISO 14064-1:2006, 2.3 (ISO, 2006d)
xxxii
Soil Organic Matter (SOM)
The measure of the content of organic material in soil. This de-rives from plants and animals and comprises all of the organic matter in the soil exclusive of the matter that has not decayed.- Product Environmental Footprint (PEF) Guide (European Commission, 2013)
System boundary Set of criteria specifying which unit processes are part of a product system.- ISO 14044:2006, 3.32 (ISO, 2006c)
System expansion Expanding the product system to include additional functions related to co-products.
Temporary carbon storage
Phenomenon that occurs when a product “reduces the GHGs in the atmosphere” or creates “negative emissions”, by remov-ing and storing carbon for a limited amount of time.- Product Environmental Footprint (PEF) Guide (European Commission, 2013)
Tier-1 method Simplest method that relies on single default emission factors (e.g. kg methane per animal).
Tier-2 method A more complex approach that uses detailed country-specific data (e.g. gross energy intake and methane conversion factors for specific livestock categories).
Tier-3 method Method based on sophisticated mechanistic models that ac-count for multiple factors such as diet composition, product concentration from rumen fermentation, and seasonal varia-tion in animal and feed parameters.
Uncertainty analysis
Systematic procedure to quantify the uncertainty introduced in the results of a life cycle inventory analysis due to the cu-mulative effects of model imprecision, input uncertainty and data variability.- ISO 14044:2006, 3.33 (ISO, 2006c)
Unit process Smallest element considered in the life cycle inventory analysis for which input and output data are quantified.- ISO 14044:2006, 3.34 (ISO, 2006c)
Upstream Occurring along the supply chain of purchased goods/services prior to entering the system boundary.- Product Environmental Footprint (PEF) Guide (European Commission, 2013)
xxxiii
Waste Substances or objects that the holder intends or is required to dispose of.- ISO 14044:2006, 3.35 (ISO, 2006c)Note 1: Deposition of manure on a land where quantity and availability of soil nutrients such as nitrogen and phosphorus exceed plant nutrient requirement is considered as a waste management activity from an environmental accounting per-spective. Derogation is only possible whereas evidences prove that soil is poor in terms of organic matter and there is no other way to build up organic matter. See also: Residual and Economic value.
Water body Entity of water with definite hydrological, hydrogeomorpho-logical, physical, chemical and biological characteristics in a given geographical area (e.g. lakes, rivers, groundwater, seas, icebergs, glaciers and reservoirs).Note 1: In case of availability, the geographical resolution of a water body should be determined at the goal and scope stage: it may regroup different small water bodies.- ISO 14046:2014, 3.1.7 (ISO, 2014)
Water use Use of water by human activity.Note 1: Use includes, but is not limited to, any water with-drawal, water release or other human activities within the drainage basin impacting water flows and/or quality, including in-stream uses such as fishing, recreation and transportation.Note 2: The term ‘water consumption’ is often used to describe water removed from, but not returned to, the same drainage basin. Water consumption can be because of evaporation, tran-spiration, integration into a product, or release into a different drainage basin or the sea. Change in evaporation caused by land-use change is considered water consumption (e.g. reser-voir). The temporal and geographical coverage of the water footprint assessment should be defined in the goal and scope.- ISO 14046:2014, 3.2.1 (ISO, 2014)
Water withdrawal Anthropogenic removal of water from any water body or from any drainage basin, either permanently or temporarily.- ISO 14046:2014, 3.2.2 (ISO, 2014)
xxxiv
Weighting Weighting is an additional, but not mandatory, step that may support the interpretation and communication of the results of the analysis. Impact assessment results are multiplied by a set of weighting factors, which reflect the perceived relative im-portance of the impact categories considered. Weighted impact assessment results can be directly compared across impact cat-egories, and also summed across impact categories to obtain a single-value overall impact indicator. Weighting requires mak-ing value judgements as to the respective importance of the impact categories considered. These judgements may be based on expert opinion, social science methods, cultural/political viewpoints, or economic considerations.- Adapted from: Product Environmental Footprint (PEF) Guide (European Commission, 2013)
xxxv
Summary of Recommendations for the LEAP guidance
ENVIRONMENTAL PERFORMANCE OF POULTRY SUPPLY CHAINS: GUIDELINES FOR QUANTIFICATIONThe methodology developed in these guidelines aims to introduce a harmonised in-ternational approach to the assessment of the environmental performance of poultry supply chains in a manner that takes account of the specificity of the various produc-tion systems involved. It aims to increase understanding of poultry supply chains and to help improve their environmental performance. The guidelines are a product of the Livestock Environmental Assessment and Performance (LEAP) Partnership, a multi-stakeholder initiative whose goal is to improve the environmental sustainability of the livestock sector through better methods, metrics and data.
The table below summarises the major recommendations of the technical advi-sory group for performance of lifecycle assessment to evaluate environmental per-formance of poultry supply chains. It is intended to provide a condensed overview and information on location of specific guidance within the document.
LEAP guidance uses a precise language to indicate which provisions of the guide-lines are requirements, which are recommendations, and which are permissible or allowable options that intended user may choose to follow. The term “shall” is used in this guidance to indicate what is required. The term “should” is used to indicate a recommendation, but not a requirement. The term “may” is used to indicate an option that is permissible or allowable. In addition, as general rule, assessments and guidelines claiming to be aligned with the present LEAP guidelines should flag and justify with reasoning any deviations.
xxxvi
Topic Summary recommendation Section
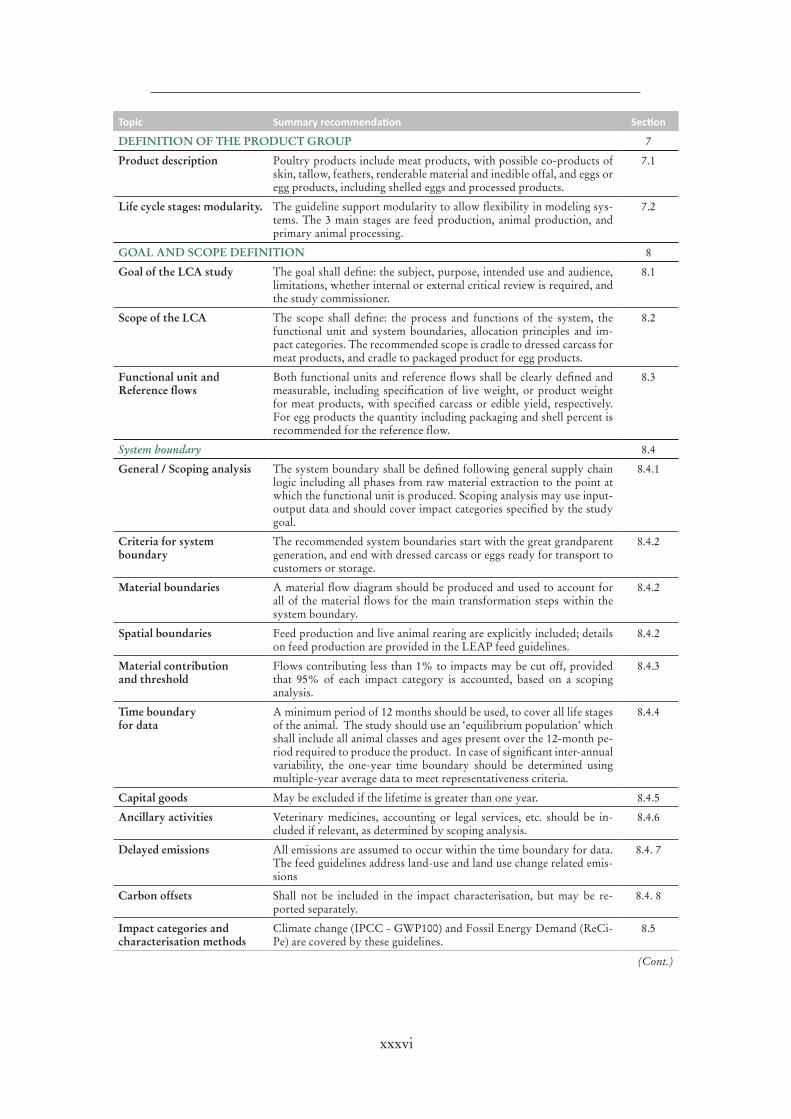
DEFINITION OF THE PRODUCT GROUP 7
Product description Poultry products include meat products, with possible co-products of skin, tallow, feathers, renderable material and inedible offal, and eggs or egg products, including shelled eggs and processed products.
7.1
Life cycle stages: modularity. The guideline support modularity to allow flexibility in modeling sys-tems. The 3 main stages are feed production, animal production, and primary animal processing.
7.2
GOAL AND SCOPE DEFINITION 8
Goal of the LCA study The goal shall define: the subject, purpose, intended use and audience, limitations, whether internal or external critical review is required, and the study commissioner.
8.1
Scope of the LCA The scope shall define: the process and functions of the system, the functional unit and system boundaries, allocation principles and im-pact categories. The recommended scope is cradle to dressed carcass for meat products, and cradle to packaged product for egg products.
8.2
Functional unit and Reference flows
Both functional units and reference flows shall be clearly defined and measurable, including specification of live weight, or product weight for meat products, with specified carcass or edible yield, respectively. For egg products the quantity including packaging and shell percent is recommended for the reference flow.
8.3
System boundary 8.4
General / Scoping analysis The system boundary shall be defined following general supply chain logic including all phases from raw material extraction to the point at which the functional unit is produced. Scoping analysis may use input-output data and should cover impact categories specified by the study goal.
8.4.1
Criteria for system boundary
The recommended system boundaries start with the great grandparent generation, and end with dressed carcass or eggs ready for transport to customers or storage.
8.4.2
Material boundaries A material flow diagram should be produced and used to account for all of the material flows for the main transformation steps within the system boundary.
8.4.2
Spatial boundaries Feed production and live animal rearing are explicitly included; details on feed production are provided in the LEAP feed guidelines.
8.4.2
Material contribution and threshold
Flows contributing less than 1% to impacts may be cut off, provided that 95% of each impact category is accounted, based on a scoping analysis.
8.4.3
Time boundary for data
A minimum period of 12 months should be used, to cover all life stages of the animal. The study should use an ‘equilibrium population’ which shall include all animal classes and ages present over the 12-month pe-riod required to produce the product. In case of significant inter-annual variability, the one-year time boundary should be determined using multiple-year average data to meet representativeness criteria.
8.4.4
Capital goods May be excluded if the lifetime is greater than one year. 8.4.5
Ancillary activities Veterinary medicines, accounting or legal services, etc. should be in-cluded if relevant, as determined by scoping analysis.
8.4.6
Delayed emissions All emissions are assumed to occur within the time boundary for data. The feed guidelines address land-use and land use change related emis-sions
8.4. 7
Carbon offsets Shall not be included in the impact characterisation, but may be re-ported separately.
8.4. 8
Impact categories and characterisation methods
Climate change (IPCC - GWP100) and Fossil Energy Demand (ReCi-Pe) are covered by these guidelines.
8.5
(Cont.)
xxxvii
Topic Summary recommendation Section
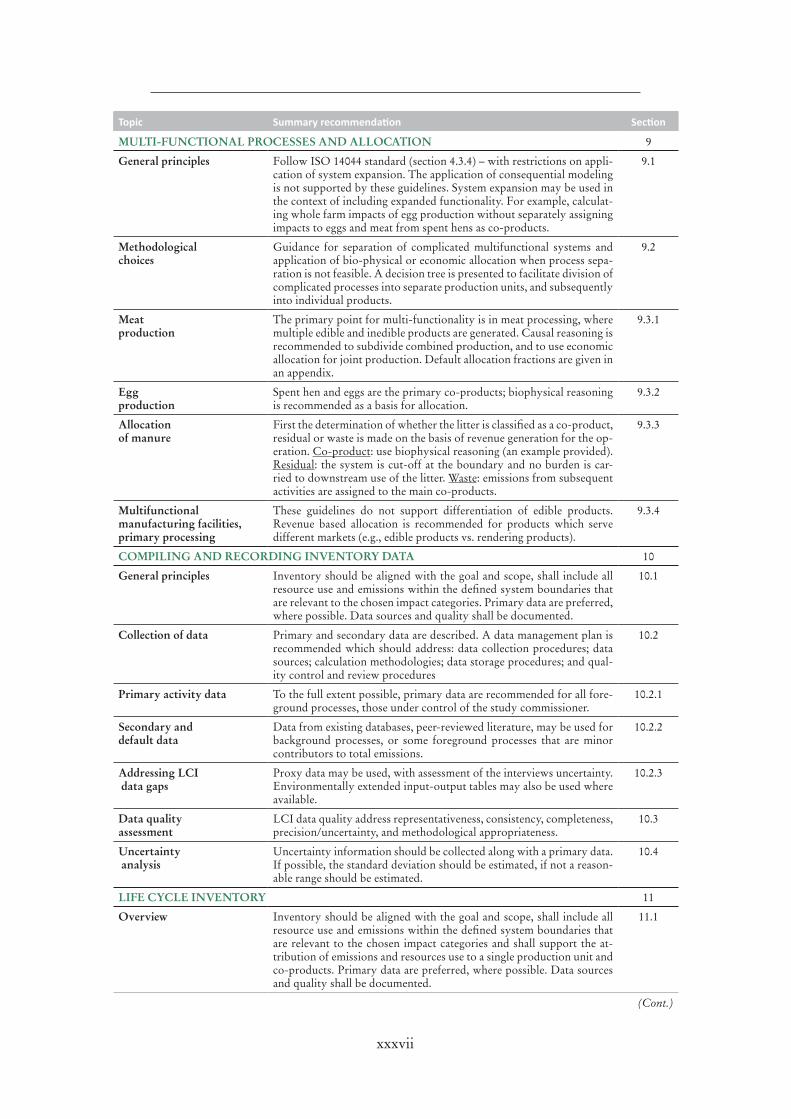
MULTI-FUNCTIONAL PROCESSES AND ALLOCATION 9
General principles Follow ISO 14044 standard (section 4.3.4) – with restrictions on appli-cation of system expansion. The application of consequential modeling is not supported by these guidelines. System expansion may be used in the context of including expanded functionality. For example, calculat-ing whole farm impacts of egg production without separately assigning impacts to eggs and meat from spent hens as co-products.
9.1
Methodological choices
Guidance for separation of complicated multifunctional systems and application of bio-physical or economic allocation when process sepa-ration is not feasible. A decision tree is presented to facilitate division of complicated processes into separate production units, and subsequently into individual products.
9.2
Meat production
The primary point for multi-functionality is in meat processing, where multiple edible and inedible products are generated. Causal reasoning is recommended to subdivide combined production, and to use economic allocation for joint production. Default allocation fractions are given in an appendix.
9.3.1
Egg production
Spent hen and eggs are the primary co-products; biophysical reasoning is recommended as a basis for allocation.
9.3.2
Allocation of manure
First the determination of whether the litter is classified as a co-product, residual or waste is made on the basis of revenue generation for the op-eration. Co-product: use biophysical reasoning (an example provided). Residual: the system is cut-off at the boundary and no burden is car-ried to downstream use of the litter. Waste: emissions from subsequent activities are assigned to the main co-products.
9.3.3
Multifunctional manufacturing facilities, primary processing
These guidelines do not support differentiation of edible products. Revenue based allocation is recommended for products which serve different markets (e.g., edible products vs. rendering products).
9.3.4
COMPILING AND RECORDING INVENTORY DATA 10
General principles Inventory should be aligned with the goal and scope, shall include all resource use and emissions within the defined system boundaries that are relevant to the chosen impact categories. Primary data are preferred, where possible. Data sources and quality shall be documented.
10.1
Collection of data Primary and secondary data are described. A data management plan is recommended which should address: data collection procedures; data sources; calculation methodologies; data storage procedures; and qual-ity control and review procedures
10.2
Primary activity data To the full extent possible, primary data are recommended for all fore-ground processes, those under control of the study commissioner.
10.2.1
Secondary and default data
Data from existing databases, peer-reviewed literature, may be used for background processes, or some foreground processes that are minor contributors to total emissions.
10.2.2
Addressing LCI data gaps
Proxy data may be used, with assessment of the interviews uncertainty. Environmentally extended input-output tables may also be used where available.
10.2.3
Data quality assessment
LCI data quality address representativeness, consistency, completeness, precision/uncertainty, and methodological appropriateness.
10.3
Uncertainty analysis
Uncertainty information should be collected along with a primary data. If possible, the standard deviation should be estimated, if not a reason-able range should be estimated.
10.4
LIFE CYCLE INVENTORY 11
Overview Inventory should be aligned with the goal and scope, shall include all resource use and emissions within the defined system boundaries that are relevant to the chosen impact categories and shall support the at-tribution of emissions and resources use to a single production unit and co-products. Primary data are preferred, where possible. Data sources and quality shall be documented.
11.1
(Cont.)
xxxviii
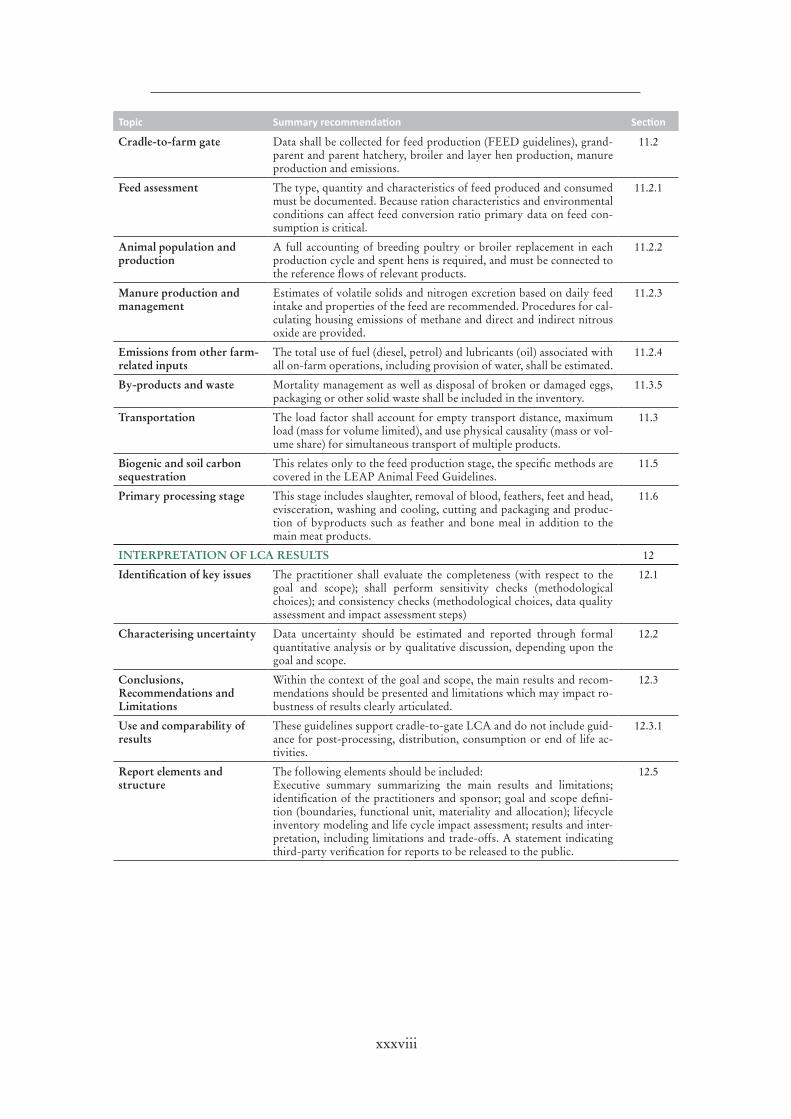
Topic Summary recommendation Section
Cradle-to-farm gate Data shall be collected for feed production (FEED guidelines), grand-parent and parent hatchery, broiler and layer hen production, manure production and emissions.
11.2
Feed assessment The type, quantity and characteristics of feed produced and consumed must be documented. Because ration characteristics and environmental conditions can affect feed conversion ratio primary data on feed con-sumption is critical.
11.2.1
Animal population and production
A full accounting of breeding poultry or broiler replacement in each production cycle and spent hens is required, and must be connected to the reference flows of relevant products.
11.2.2
Manure production and management
Estimates of volatile solids and nitrogen excretion based on daily feed intake and properties of the feed are recommended. Procedures for cal-culating housing emissions of methane and direct and indirect nitrous oxide are provided.
11.2.3
Emissions from other farm-related inputs
The total use of fuel (diesel, petrol) and lubricants (oil) associated with all on-farm operations, including provision of water, shall be estimated.
11.2.4
By-products and waste Mortality management as well as disposal of broken or damaged eggs, packaging or other solid waste shall be included in the inventory.
11.3.5
Transportation The load factor shall account for empty transport distance, maximum load (mass for volume limited), and use physical causality (mass or vol-ume share) for simultaneous transport of multiple products.
11.3
Biogenic and soil carbon sequestration
This relates only to the feed production stage, the specific methods are covered in the LEAP Animal Feed Guidelines.
11.5
Primary processing stage This stage includes slaughter, removal of blood, feathers, feet and head, evisceration, washing and cooling, cutting and packaging and produc-tion of byproducts such as feather and bone meal in addition to the main meat products.
11.6
INTERPRETATION OF LCA RESULTS 12
Identification of key issues The practitioner shall evaluate the completeness (with respect to the goal and scope); shall perform sensitivity checks (methodological choices); and consistency checks (methodological choices, data quality assessment and impact assessment steps)
12.1
Characterising uncertainty Data uncertainty should be estimated and reported through formal quantitative analysis or by qualitative discussion, depending upon the goal and scope.
12.2
Conclusions, Recommendations and Limitations
Within the context of the goal and scope, the main results and recom-mendations should be presented and limitations which may impact ro-bustness of results clearly articulated.
12.3
Use and comparability of results
These guidelines support cradle-to-gate LCA and do not include guid-ance for post-processing, distribution, consumption or end of life ac-tivities.
12.3.1
Report elements and structure
The following elements should be included:Executive summary summarizing the main results and limitations; identification of the practitioners and sponsor; goal and scope defini-tion (boundaries, functional unit, materiality and allocation); lifecycle inventory modeling and life cycle impact assessment; results and inter-pretation, including limitations and trade-offs. A statement indicating third-party verification for reports to be released to the public.
12.5

PART 1
OVERVIEW AND GENERAL PRINCIPLES

3
Greenhouse gas emissions and fossil energy use from poultry supply chains
1. Intended users and objectives
The methodology and guidance developed here can be used by stakeholders in all countries and across the entire range of poultry production systems. In developing the guidelines, it was assumed that the primary users will be individuals or organiza-tions with a good working knowledge of LCA. The main purpose of the guidelines is to provide a sufficient definition of calculation methods and data requirements to enable consistent application of LCA across differing poultry supply chains.
This guidance is relevant to a wide range of livestock stakeholders including: • livestock producers who wish to develop inventories of their on-farm resourc-
es and assess the performance of their production systems; •supply chain partners, such as feed producers, farmers and processors, seeking
a better understanding of the environmental performance of products in their production processes; and
•policy makers interested in developing accounting and reporting specifica-tions for livestock supply chains.
The benefits of this approach include:• the use of a recognized, robust and transparent methodology developed to
take account of the nature of poultry supply chains;• the identification of supply chain hotspots and opportunities to improve and
reduce environmental impact;• the identification of opportunities to increase efficiency and productivity;• the ability to benchmark performance internally or against industry standards; • the provision of support for reporting and communication requirements; and•awareness raising and supporting action on environmental sustainability.
4
Greenhouse gas emissions and fossil energy use from poultry supply chains
2. Scope
2.1 ENVIRONMENTAL IMPACT CATEGORIES ADDRESSED IN THE GUIDELINESThese guidelines cover only the following environmental impact categories: climate change and fossil energy use. This document does not provide support for the as-sessment of comprehensive environmental performance, nor the social or economic aspects of poultry supply chains.
The LEAP Animal Feed Guidelines cover additional impact categories: acidifica-tion, eutrophication, phosphorus depletion and land use. These categories may be reported for the life cycle stages of poultry products. It is intended that in future these guidelines will be updated to include multiple categories, if enough reliable data become available to justify the changes.
In the LEAP Animal Feed Guidelines, GHG emissions from direct land-use change is analysed and recorded separately from GHG emissions from other sourc-es. There are two reasons for doing this. The first relates to the time frame, as emis-sions attributed to land-use change may have occurred in the past or may be set to occur in the future. Secondly, there is much uncertainty and debate about the best method for calculating direct land-use change.
Regarding land use, the LEAP Animal Feed Guidelines divided land areas into two categories: arable land and grassland. Appropriate indicators were included in the guidelines, as they provide important information about the use of a finite resource (land) but also about follow-on impacts on soil degradation, biodiversity, carbon sequestration or loss, water depletion. Nevertheless, users wishing to spe-cifically relate land use to follow-on impacts will need to collect and analyse addi-tional information on production practices and local conditions.
2.2 APPLICATIONSome flexibility in methodology is desirable to accommodate the range of possible goals and special conditions arising in different sectors. This document strives for a pragmatic balance between flexibility and rigorous consistency across scales, geo-graphic locations and project goals.
A more strict prescription on the methodology, including allocation and accept-able data sources, is required for product labelling or comparative performance claims. Users are referred to ISO 14025:2006 (ISO, 2006a) for more information and guidance on comparative claims of environmental performance.
These LEAP guidelines are based on the attributional approach to life cycle ac-counting. The approach refers to process-based modelling, intended to provide a static representation of average conditions.
Due to the limited number of environmental impact categories covered here, results should be presented in conjunction with other environmental metrics to understand the wider environmental implications, either positive or negative. It should be noted that comparisons between final products should only be based on a full LCA. Users of these guidelines shall not employ results to claim overall envi-ronmental superiority of some poultry production systems and products.
5
Greenhouse gas emissions and fossil energy use from poultry supply chains
The methodology and guidance developed in the LEAP Partnership is not in-tended to create barriers to trade or contradict any World Trade Organization re-quirements.
6
Greenhouse gas emissions and fossil energy use from poultry supply chains
3. Structure and conventions
3.1 STRUCTURE This document adopts the main structure of ISO 14040:2006 (ISO, 2006b) and the four main phases of LCA: goal and scope definition, inventory analysis, impact assessment and interpretation. Figure 1 presents the general relationship between the phases of an LCA study defined by ISO 14040:2006 and the steps needed to complete a GHG inventory in conformance with this guidance. Part 2 of this meth-odology sets out the following:
•Section 7 outlines the operational areas to which these guidelines apply.•Section 8 includes requirements and guidance to help users define the goals
and scope, and system boundary of an LCA.•Section 9 presents the principles for handling multiple co-products and
includes requirements and guidance to help users select the most appropriate allocation method to address common processes in their product inventory.
•Section 10 presents requirements and guidance on the collection and assess-ment of the quality of inventory data as well as on identification, assessment and reporting on inventory uncertainty.
•Section 11 outlines key requirements, steps, and procedures involved in quan-tifying GHG emissions and other environmental impact inventory results in the studied supply chain.
•Section 12 provides guidance on interpretation and reporting of results and summarizes the various requirements and best practices in reporting.
A glossary intended to provide a common vocabulary for practitioners has been included. Additional information is presented in the appendices.
Users of this methodology should also refer to other relevant guidelines where necessary and indicated. The LEAP poultry guidelines are not intended to stand alone, but are meant to be used in conjunction with the LEAP Animal Feed Guide-lines. Relevant guidance developed under the LEAP Partnership and published in in other documents will be specifically cross-referenced to enable ease of use. For example, specific guidance for calculating associated emissions for feed is contained in the LEAP Animal Feed Guidelines.
3.2 PRESENTATIONAL CONVENTIONSThese guidelines are explicit in indicating which requirements, recommendations, and permissible or allowable options users may choose to follow.
The term “shall” is used to indicate what is required for an assessment to con-form to these guidelines.
The term “should” is used to indicate a recommendation, but not a requirement.The term “may” is used to indicate an option that is permissible or allowable.Commentary, explanations and general informative material (e.g. notes) are pre-
sented in footnotes and do not constitute a normative element. Examples illustrating specific areas of the guidelines are presented in boxes.
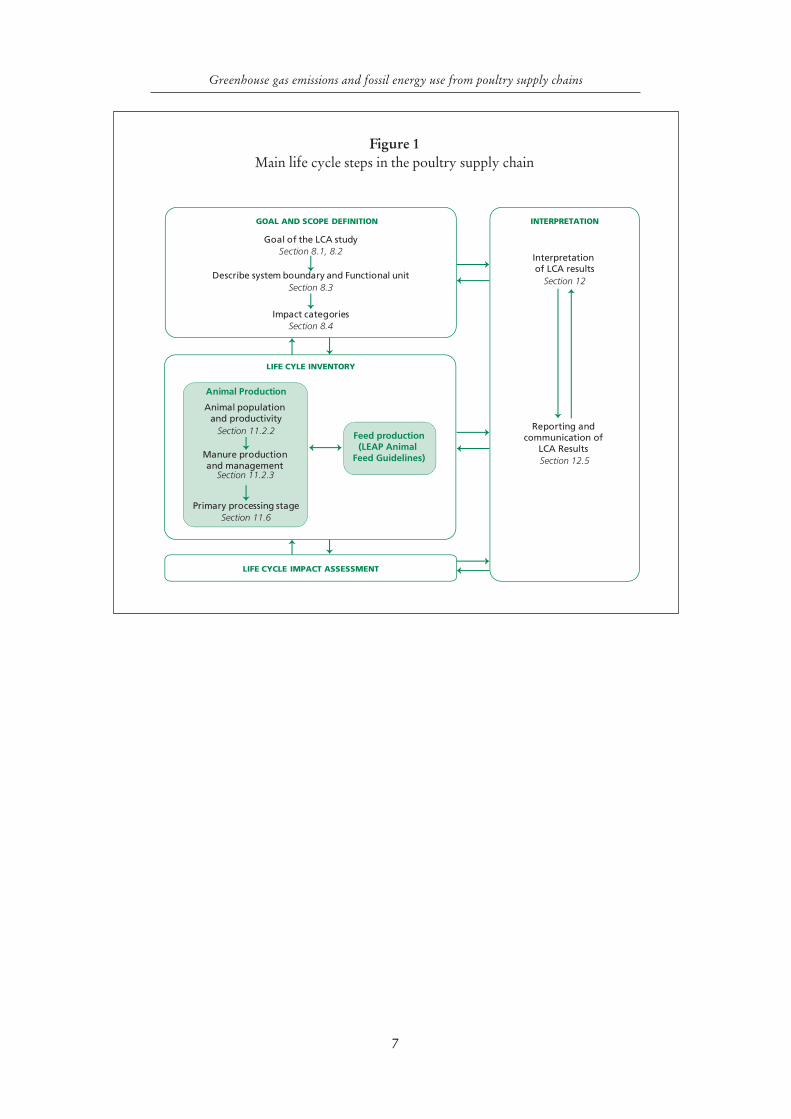
7
Greenhouse gas emissions and fossil energy use from poultry supply chains
Figure 1 Main life cycle steps in the poultry supply chain
INTERPRETATION
Reporting and communication of
LCA Results Section 12.5
Interpretation of LCA results
Section 12
GOAL AND SCOPE DEFINITION
Describe system boundary and Functional unitSection 8.3
Impact categoriesSection 8.4
Goal of the LCA studySection 8.1, 8.2
Manure production and management
Primary processing stageSection 11.6
Section 11.2.3
Animal population and productivity
Section 11.2.2
Animal Production
LIFE CYLE INVENTORY
LIFE CYCLE IMPACT ASSESSMENT
Feed production(LEAP Animal
Feed Guidelines)
8
Greenhouse gas emissions and fossil energy use from poultry supply chains
4. Essential background informationand principles
4.1 A BRIEF INTRODUCTION TO LCALCA is recognized as one of the most complete and widely used methodological frame-works for assessing the environmental impact of products and processes. LCA can be used as a decision support tool within environmental management. ISO 14040:2006 defines LCA as a “compilation and evaluation of the inputs, outputs and the potential environmental impacts of a product system throughout its life cycle”. In other words, LCA provides quantitative, confirmable, and manageable process models to evaluate production processes, analyse options for innovation and improve understanding of complex systems. LCA can identify processes and areas where process changes stem-ming from research and development can significantly contribute to reducing environ-mental impacts. According to ISO14040:2006, LCA consist of four phases (Figure 1):
• goal and scope definition, including appropriate metrics (e.g. GHG emissions,water consumption, hazardous materials generated and/or quantity of waste);
• life cycle inventories (LCIs), i.e. the collection of data that identify the systeminputs and outputs and discharges to the environment;
• performance of impact assessment, i.e. the application of characterization fac-tors to the LCI emissions that normalizes groups of emissions to a commonmetric, such as global warming potential reported in carbon dioxide equiva-lents (CO2 e); and
• analysis and interpretation of results.
4.2 ENVIRONMENTAL IMPACT CATEGORIESLife Cycle Impact Assessment (LCIA) aims at understanding and evaluating the magnitude and significance of potential environmental impacts for a product sys-tem throughout the life cycle of the product (ISO 14040:2006). The selection of environmental impacts is a mandatory step of LCIA and this selection shall be justi-fied and consistent with the goal and scope of the study (ISO 14040:2006). Impacts can be modelled at different levels in the environmental cause-effect chain linking elementary flows of the LCI to midpoint and endpoint impact categories (Figure 2).
A distinction must be made between midpoint impacts, which characterize im-pacts in the middle of the environmental cause-effect chain, and endpoint impacts, which characterize impacts at the end of the environmental cause-effect chain. End-point methods provide indicators at, or close to, an area of protection. Usually three areas of protection are recognized: human health, ecosystems and resources. The aggregation at endpoint level and at the areas of protection level is an optional phase of the assessment according to ISO 14044:2006.
Climate change is an example of a midpoint impact category. The results of the LCI are the amounts of GHG emissions per functional unit. Based on a radiative forcing model, characterization factors, known as global warming potentials, spe-cific to each GHG, can be used to aggregate all of the emissions to the same mid-point impact category indicator, (kg of CO2e per functional unit).
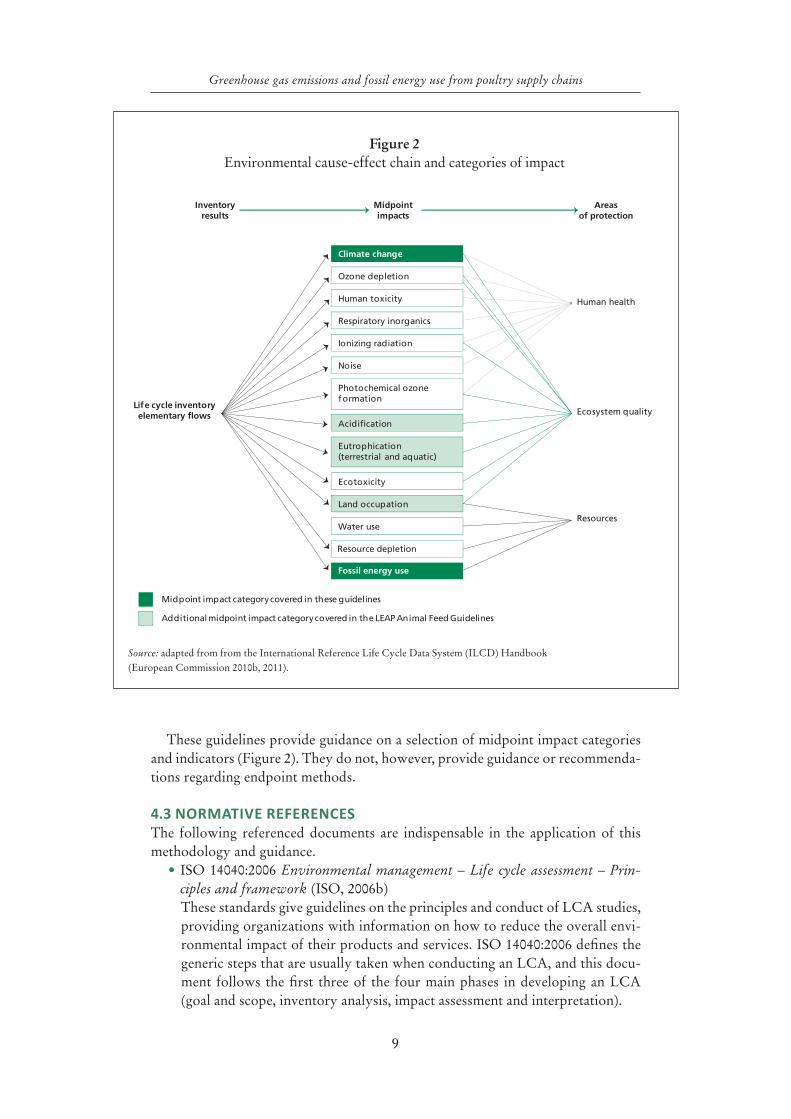
9
Greenhouse gas emissions and fossil energy use from poultry supply chains
Life cycle inventoryelementary flows Ecosystem quality
Human health
Resources
Climate change
Ozone depletion
Human toxicity
Respiratory inorganics
Ionizing radiation
Noise
Photochemical ozone formation
Acidification
Eutrophication(terrestrial and aquatic)
Land occupation
Fossil energy use
Ecotoxicity
Water use
Inventoryresults
Midpointimpacts
Midpoint impact category covered in these guidelines
Additional midpoint impact category covered in the LEAP Animal Feed Guidelines
Areasof protection
Resource depletion
These guidelines provide guidance on a selection of midpoint impact categories and indicators (Figure 2). They do not, however, provide guidance or recommenda-tions regarding endpoint methods.
4.3 NORMATIVE REFERENCESThe following referenced documents are indispensable in the application of this methodology and guidance.
•ISO 14040:2006 Environmental management – Life cycle assessment – Prin-ciples and framework (ISO, 2006b)These standards give guidelines on the principles and conduct of LCA studies, providing organizations with information on how to reduce the overall envi-ronmental impact of their products and services. ISO 14040:2006 defines the generic steps that are usually taken when conducting an LCA, and this docu-ment follows the first three of the four main phases in developing an LCA (goal and scope, inventory analysis, impact assessment and interpretation).
Figure 2 Environmental cause-effect chain and categories of impact
Source: adapted from from the International Reference Life Cycle Data System (ILCD) Handbook (European Commission 2010b, 2011).
10
Greenhouse gas emissions and fossil energy use from poultry supply chains
•ISO14044:2006 Environmental management – Life cycle assessment – Require-ments and guidelines (ISO, 2006c)ISO 14044:2006 specifies requirements and provides guidelines for LCA in-cluding: definition of the goal and scope of the LCA, the LCI, the LCIA, the life cycle interpretation, reporting and critical review of the LCA, limitations of the LCA, relationship between the LCA phases, and conditions for use of value choices and optional elements.
4.4 NON-NORMATIVE REFERENCES•ISO 14025:2006 Environmental labels and declarations – Type III environ-
mental declarations – Principles and procedures (ISO, 2006a)ISO 14025:2006 establishes the principles and specifies the procedures for de-veloping Type III environmental declaration programmes and Type III en-vironmental declarations. It specifically establishes the use of the ISO 14040 series of standards in the development of Type III environmental declaration programmes and Type III environmental declarations. Type III environmental declarations are primarily intended for use in busi-ness-to-business communication, but their use in business-to-consumer com-munication is not precluded under certain conditions.
• ISO/TS 14067:2013 Greenhouse gases – Carbon footprint of products – Require-ments and guidelines for quantification and communication (ISO, 2013a)ISO/TS 14067:2013 specifies the principles, requirements and guidelines for the quantification and communication of the carbon footprint of a product. It is based on ISO 14040:2006 and ISO 14044:2006 for quantification, and ISO 14020:2000 (ISO, 2000), ISO 14024:1999 (ISO, 1999) and ISO 14025:2006, which deal with environmental labels and declarations, for communication.
•Product Life Cycle Accounting and Reporting Standard (WRI and WBCSD, 2011a)This standard from the World Resources Institute (WRI) and the World Business Council for Sustainable Development (WBCSD) provides a frame-work to assist users in estimating the total GHG emissions associated with the life cycle of a product. It is broadly similar in its approach to the ISO standards, although it puts more emphasis on analysis, tracking changes over time, reduction options and reporting. Like PAS2050:2011 (see below), this standard excludes impacts from the production of infrastructure, but whereas PAS2050:2011 includes ‘operation of premises’, such as retail lighting or office heating, the Product Life Cycle Accounting and Reporting Standard does not.
•ENVIFOOD Protocol, Environmental Assessment of Food and Drink Proto-col (Food SCP RT, 2013) The Protocol was developed by the European Food Sustainable Consumption Round Table to support a number of environmental instruments for use in communication and the identification of environmental improvement options. The Protocol might be the baseline for developing communication methods, product category rules (PCRs), criteria, tools, datasets and assessments.
•International Reference Life Cycle Data System (ILCD) Handbook: - Gen-eral guide for Life Cycle Assessment - Detailed guidance (European Commis-sion, 2010b). The ILCD Handbook was published in 2010 by the European Commission Joint Research Centre and provides detailed guidance for LCA based on ISO
11
Greenhouse gas emissions and fossil energy use from poultry supply chains
14040:2006 and 14044:2006. It consists of a set of documents, including a gen-eral guide for LCA, and specific guides for LCI and LCIA.
•Product Environmental Footprint (PEF) Guide (European Commission, 2013) This Guide is a general method to measure and communicate the potential life cycle environmental impact of a product, developed by the European Commission primarily to highlight the discrepancies in environmental per-formance information.
•BPX-30-323-0 General principles for an environmental communication on mass market products - Part 0: General principles and methodological frame-work (AFNOR, 2011)This is a general method developed by the ADEME-AFNOR stakeholder platform to measure and communicate the potential life cycle environmental impact of a product. It was developed under request of the French Govern-ment, again with the purpose of highlighting the discrepancies in environ-mental performance information. Food production specific guidelines are also available, along with a large set of product specific rules on livestock products.
•PAS 2050:2011 Specification for the assessment of life cycle greenhouse gas emissions of goods and services (BSI, 2011)PAS 2050:2011 is a Publicly Available Specification (PAS), i.e. a not standard spec-ification. An initiative of the United Kingdom sponsored by the Carbon Trust and the Department for Environment, Food and Rural Affairs, PAS 2050:2011 was published through the British Standards Institution (BSI) and uses BSI methods for agreeing on a PAS. It is designed for applying LCA over a wide range of prod-ucts in a consistent manner for industry users, focusing solely on the carbon foot-print indicator. PAS 2050:2011 has many elements in common with the ISO 14000 series methods but also a number of differences, some of which limit choices for analysts (e.g. exclusion of capital goods and setting materiality thresholds).
4.5 GUIDING PRINCIPLESFive guiding principles support users in their application of this sector-specific methodology. These principles are consistent across the methodologies developed within the LEAP Partnership. They apply to all the steps, from goal and scope defi-nition, data collection and LCI modelling, through to reporting. Adhering to these principles ensures that any assessment made in accordance with the methodology prescribed is carried out in a robust and transparent manner. The principles can also guide users when making choices not specified by the guidelines.
The principles are adapted from ISO 14040:2006, the Product Environmental Footprint (PEF) Guide, the Product Life Cycle Accounting and Reporting Standard, PAS 2050:2011, the ILCD Handbook and ISO/TS 14067:2013, and are intended to guide the accounting and reporting of GHG emissions and fossil energy use.
Accounting and reporting of GHG emissions and other environmental impacts from poultry supply chains shall accordingly be based on the following principles:
Life cycle perspective“LCA considers the entire life cycle of a product, from raw material extraction and acquisition, through energy and material production and manufacturing, to use and end of life treatment and final disposal. Through such a systematic over-view and perspective, the shifting of a potential environmental burden between life
12
Greenhouse gas emissions and fossil energy use from poultry supply chains
cycle stages or individual processes can be identified and possibly avoided” (ISO 14040:2006, 4.1.2).
Relative approach and functional unitLCA is a relative approach, which is structured around a functional unit. This func-tional unit defines what is being studied. All subsequent analyses are then relative to that functional unit, as all inputs and outputs in the LCI and consequently the LCIA profile are related to the functional unit (ISO 14040:2006, 4.1.4).
RelevanceData, accounting methodologies and reporting shall be appropriate to the decision-making needs of the intended users. Information should be reported in a way that is easily understandable to the intended users.
CompletenessQuantification of the product environmental performance shall include all environmen-tally relevant material/energy flows and other environmental interventions as required for adherence to the defined system boundaries, the data requirements, and the impact assessment methods employed (Product Environmental Footprint (PEF) Guide).
ConsistencyData that are consistent with these guidelines shall be used throughout the inventory to allow for meaningful comparisons and reproducibility of the outcomes over time. Any deviation from these guidelines shall be reported, justified and documented.
AccuracyBias and uncertainties shall be reduced as far as practicable. Sufficient accuracy shall be achieved to enable intended users to make decisions with reasonable confidence as to the reliability and integrity of the reported information.
Iterative approachLCA is an iterative technique. The individual phases of an LCA use results of the other phases. The iterative approach within and between the phases contributes to the comprehensiveness and consistency of the study and the reported results (ISO 14040:2006, 4.1.5).
Transparency“Due to the inherent complexity in LCA, transparency is an important guiding principle in executing LCAs, in order to ensure a proper interpretation of the re-sults” (ISO 14040:2006, 4.1.6).
Priority of scientific approach“Decisions within an LCA are preferably based on natural science. If this is not possible, other scientific approaches (e.g. from social and economic sciences) may be used or international conventions may be referred to. If neither a scientific basis exists nor a justification based on other scientific approaches or international con-ventions is possible, then, as appropriate, decisions may be based on value choices” (ISO 14040:2006, 4.1.8).
13
Greenhouse gas emissions and fossil energy use from poultry supply chains
5. LEAP and the preparation process
LEAP is a multi-stakeholder initiative launched in July 2012 with the goal of im-proving the environmental performance of livestock supply chains. Hosted by FAO, LEAP brings together the private sector, governments, civil society represen-tatives and leading experts who have a direct interest in the development of science-based, transparent and pragmatic guidance to measure and improve the environ-mental performance of livestock products.
Demand for livestock products is projected to grow 1.3 percent per year until 2050, driven by global population growth and increasing wealth and urbanization (Alexandratos and Bruinsma, 2012). According to Poultry International and Egg Industry, the demand for poultry products is projected to grow by 1.9 percent per year until 2022 (WATT, 2014). Against the background of climate change and in-creasing competition for natural resources, this projected growth places significant pressure on the livestock sector to perform in a more sustainable way. The identifi-cation and promotion of the contributions that the sector can make towards more efficient use of resources and better environmental outcomes is also important.
Currently, many different methods are used to assess the environmental impacts and performance of livestock products. This causes confusion and makes it difficult to compare results and set priorities for continuing improvement. With increasing demands in the marketplace for more sustainable products there is also the risk that debates about how sustainability is measured will distract people from the task of driving real improvement in environmental performance. There is also the danger that labelling or private standards based on poorly developed metrics could lead to erroneous claims and comparisons.
The LEAP Partnership addresses the urgent need for a coordinated approach to developing clear guidelines for environmental performance assessment based on international best practices. The scope of LEAP is not to propose new standards but to produce detailed guidelines that are specifically relevant to the livestock sec-tor, and refine guidance for existing standards. LEAP is a multi-stakeholder part-nership bringing together the private sector, governments and civil society. These three groups have an equal say in deciding work plans and approving outputs from LEAP, thus ensuring that the guidelines produced are relevant to all stakeholders, widely accepted and supported by scientific evidence.
With this in mind, the first three TAGs of LEAP were formed in early 2013 to develop guidelines for assessing the environmental performance of small ruminants (goats and sheep), animal feeds and poultry supply chains.
The work of LEAP is challenging but vitally important to the livestock sector. The diversity and complexity of livestock farming systems, products, stakeholders and environmental impacts can only be matched by the willingness of the sector’s practitioners to work together to improve performance. LEAP provides the essen-tial backbone of robust measurement methods to enable assessment, understanding and improvement in practice. More background information on the LEAP Partner-ship can be found at www.fao.org/partnerships/leap/en/
14
Greenhouse gas emissions and fossil energy use from poultry supply chains
5.1 DEVELOPMENT OF SECTOR-SPECIFIC GUIDELINESSector-specific guidelines for assessing the environmental performance of the live-stock sector are a key aspect of the LEAP Partnership work programme. Such guidelines take into account the nature of the livestock supply chain under inves-tigation and are developed by a team of experts with extensive experience in LCA and livestock supply chains.
The benefit of a sector-specific approach is that it gives guidance on the applica-tion of LCA to users and provides a common basis from which to evaluate resource use and environmental impacts.
Sector-specific guidelines may also be referred to as supplementary require-ments, product rules, sector guidance, PCRs or product environmental footprint (PEF) category rules, although each programme will prescribe specific rules to en-sure conformity and avoid conflict with any existing parent standard.
The first set of sector-specific guidelines addresses small ruminants, poultry and animal feeds. The former two place emphasis on climate-related impacts, while the LEAP Animal Feed Guidelines address a broader range of environmental categories. LEAP is also considering developing guidance for the assessment of other animal com-modities and wider environmental impacts, such as biodiversity, water and nutrients.
5.2 POULTRY TAG AND THE PREPARATION PROCESSThe poultry TAG of the LEAP Partnership was formed at the start of 2013. The team included nine selected experts in poultry supply chains, as well as leading LCA researchers and experienced industry practitioners. Their backgrounds, com-plementary between products, systems and regions, allowed them to understand and address different interest groups and ensure credible representation. The TAG was led by Dr Greg Thoma of the University of Arkansas, USA.
The role of the TAG was to:•review existing methodologies and guidelines for the assessment of GHG
emissions from livestock supply chains and identify gaps and priorities for further work;
•develop methodologies and sector specific guidelines for the LCA of GHG emissions from poultry supply chains; and
•provide guidance on future work needed to improve the guidelines and encourage greater uptake of LCA of GHG emissions from poultry supply chains.
The TAG met for its first workshop from 12-14 February 2013. The TAG con-tinued to work via email and teleconferences before holding a second workshop from 5-7 September 2013 in Rome. The nine experts in the TAG were drawn from seven countries: Australia, Bangladesh, Brazil, Japan, Senegal, United Kingdom and the United States.
As a first step, existing studies and associated methods were reviewed by the TAG to assess whether they offered a suitable framework and orientation for a sec-tor-specific approach. This avoids confusion and unnecessary duplication of work through the development of potentially competing standards or approaches. The review also followed established procedures set by the overarching international guidance sources listed in Section 4.3.
Eighteen studies addressing aspects of the poultry meat or egg supply chains were identified by the TAG. The selection of these studies for background review
15
Greenhouse gas emissions and fossil energy use from poultry supply chains
in support of the development of these guidelines was driven by the availability of full LCA studies in the poultry sector. The purpose was to determine the range of methodological choices that have been used. The intention was to carry out the broadest possible evaluation, and for this reason peer-reviewed articles, theses and dissertations, and conference proceedings were included in the process. These sources allowed for an evaluation of the methodological consistencies and differ-ences for global systems. A review of these studies can be found in Appendix 2. After the evaluation, it was concluded that no existing approach or study set out comprehensive guidance for quantifying GHG emissions and fossil energy demand across the supply chain and that the TAG would need to undertake further work to reach consensus on more detailed guidance. The Japanese Carbon Footprint Prod-uct Category Rules, including PA-CN-01 for eggs and PA-CP-01 for chicken meat, have however acted as an important guiding instrument in the development of the methodology and guidance offered here (JEMAI, 2011a; 2011b).
5.3 PERIOD OF VALIDITY It is intended that these guidelines will be periodically reviewed to ensure the va-lidity of information and methodologies on which it relies. Because there is not currently a mechanism in place to ensure such review, users are invited to visit the LEAP website (www.fao.org/partnerships/leap) for the latest version.
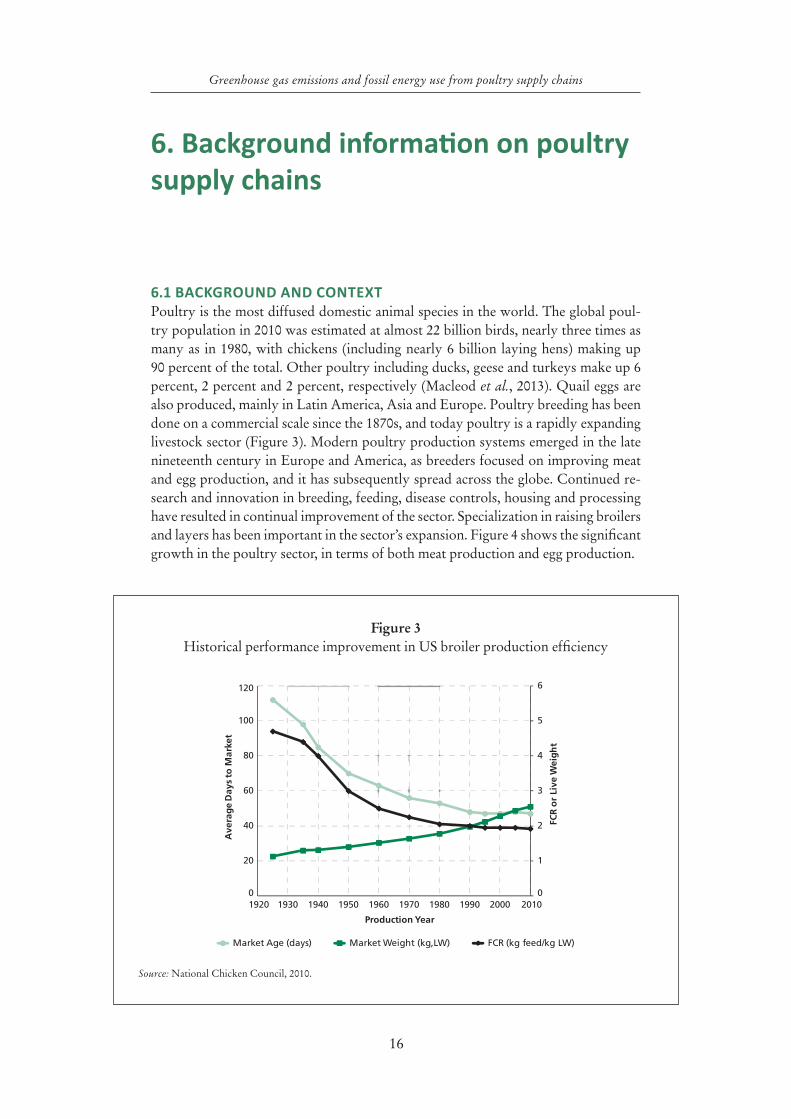
16
Greenhouse gas emissions and fossil energy use from poultry supply chains
6. Background information on poultry supply chains
6.1 BACKGROUND AND CONTEXT Poultry is the most diffused domestic animal species in the world. The global poul-try population in 2010 was estimated at almost 22 billion birds, nearly three times as many as in 1980, with chickens (including nearly 6 billion laying hens) making up 90 percent of the total. Other poultry including ducks, geese and turkeys make up 6 percent, 2 percent and 2 percent, respectively (Macleod et al., 2013). Quail eggs are also produced, mainly in Latin America, Asia and Europe. Poultry breeding has been done on a commercial scale since the 1870s, and today poultry is a rapidly expanding livestock sector (Figure 3). Modern poultry production systems emerged in the late nineteenth century in Europe and America, as breeders focused on improving meat and egg production, and it has subsequently spread across the globe. Continued re-search and innovation in breeding, feeding, disease controls, housing and processing have resulted in continual improvement of the sector. Specialization in raising broilers and layers has been important in the sector’s expansion. Figure 4 shows the significant growth in the poultry sector, in terms of both meat production and egg production.
0
1
2
3
4
5
6
0
20
40
60
80
100
120
1920 1930 1940 1950 1960 1970 1980 1990 2000 2010
FCR
or
Live
Wei
gh
t
Ave
rag
e D
ays
to M
arke
t
Production Year
Market Age (days) Market Weight (kg,LW) FCR (kg feed/kg LW)
Figure 3Historical performance improvement in US broiler production efficiency
Source: National Chicken Council, 2010.
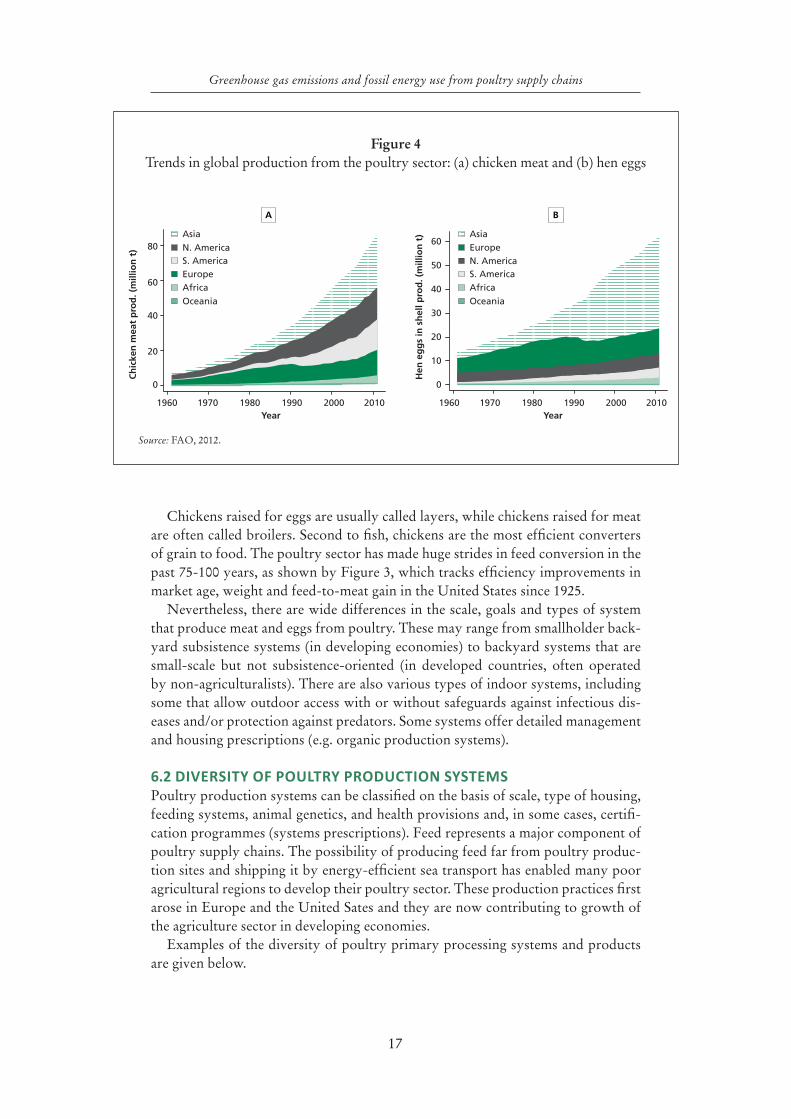
17
Greenhouse gas emissions and fossil energy use from poultry supply chains
Figure 4Trends in global production from the poultry sector: (a) chicken meat and (b) hen eggs
Source: FAO, 2012.
Chickens raised for eggs are usually called layers, while chickens raised for meat are often called broilers. Second to fish, chickens are the most efficient converters of grain to food. The poultry sector has made huge strides in feed conversion in the past 75-100 years, as shown by Figure 3, which tracks efficiency improvements in market age, weight and feed-to-meat gain in the United States since 1925.
Nevertheless, there are wide differences in the scale, goals and types of system that produce meat and eggs from poultry. These may range from smallholder back-yard subsistence systems (in developing economies) to backyard systems that are small-scale but not subsistence-oriented (in developed countries, often operated by non-agriculturalists). There are also various types of indoor systems, including some that allow outdoor access with or without safeguards against infectious dis-eases and/or protection against predators. Some systems offer detailed management and housing prescriptions (e.g. organic production systems).
6.2 DIVERSITY OF POULTRY PRODUCTION SYSTEMS Poultry production systems can be classified on the basis of scale, type of housing, feeding systems, animal genetics, and health provisions and, in some cases, certifi-cation programmes (systems prescriptions). Feed represents a major component of poultry supply chains. The possibility of producing feed far from poultry produc-tion sites and shipping it by energy-efficient sea transport has enabled many poor agricultural regions to develop their poultry sector. These production practices first arose in Europe and the United Sates and they are now contributing to growth of the agriculture sector in developing economies.
Examples of the diversity of poultry primary processing systems and products are given below.
0
10
30
20
40
50
60
0
20
40
60
80
1960 1970 1980 1990 2000 2010Year
1960 1970 1980 1990 2000 2010Year
Hen
eg
gs
in s
hel
l pro
d. (
mill
ion
t)Asia
AfricaEurope
Oceania
S. AmericaN. America
Asia
Africa
Europe
Oceania
S. AmericaN. America
Ch
icke
n m
eat
pro
d. (
mill
ion
t)
A B
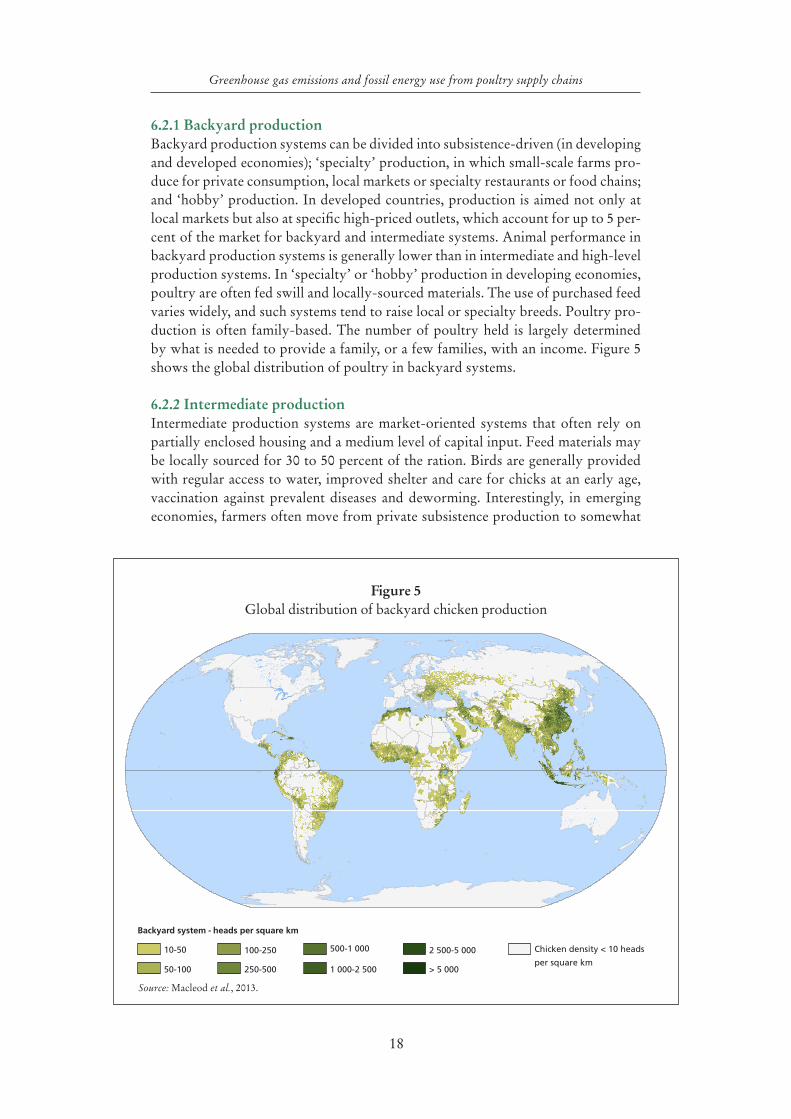
18
Greenhouse gas emissions and fossil energy use from poultry supply chains
6.2.1 Backyard productionBackyard production systems can be divided into subsistence-driven (in developing and developed economies); ‘specialty’ production, in which small-scale farms pro-duce for private consumption, local markets or specialty restaurants or food chains; and ‘hobby’ production. In developed countries, production is aimed not only at local markets but also at specific high-priced outlets, which account for up to 5 per-cent of the market for backyard and intermediate systems. Animal performance in backyard production systems is generally lower than in intermediate and high-level production systems. In ‘specialty’ or ‘hobby’ production in developing economies, poultry are often fed swill and locally-sourced materials. The use of purchased feed varies widely, and such systems tend to raise local or specialty breeds. Poultry pro-duction is often family-based. The number of poultry held is largely determined by what is needed to provide a family, or a few families, with an income. Figure 5 shows the global distribution of poultry in backyard systems.
6.2.2 Intermediate production Intermediate production systems are market-oriented systems that often rely on partially enclosed housing and a medium level of capital input. Feed materials may be locally sourced for 30 to 50 percent of the ration. Birds are generally provided with regular access to water, improved shelter and care for chicks at an early age, vaccination against prevalent diseases and deworming. Interestingly, in emerging economies, farmers often move from private subsistence production to somewhat
Backyard system - heads per square km
10-50
50-100
100-250
250-500
500-1 000
1 000-2 500
2 500-5 000
> 5 000
Chicken density < 10 heads
per square km
Figure 5Global distribution of backyard chicken production
Source: Macleod et al., 2013.
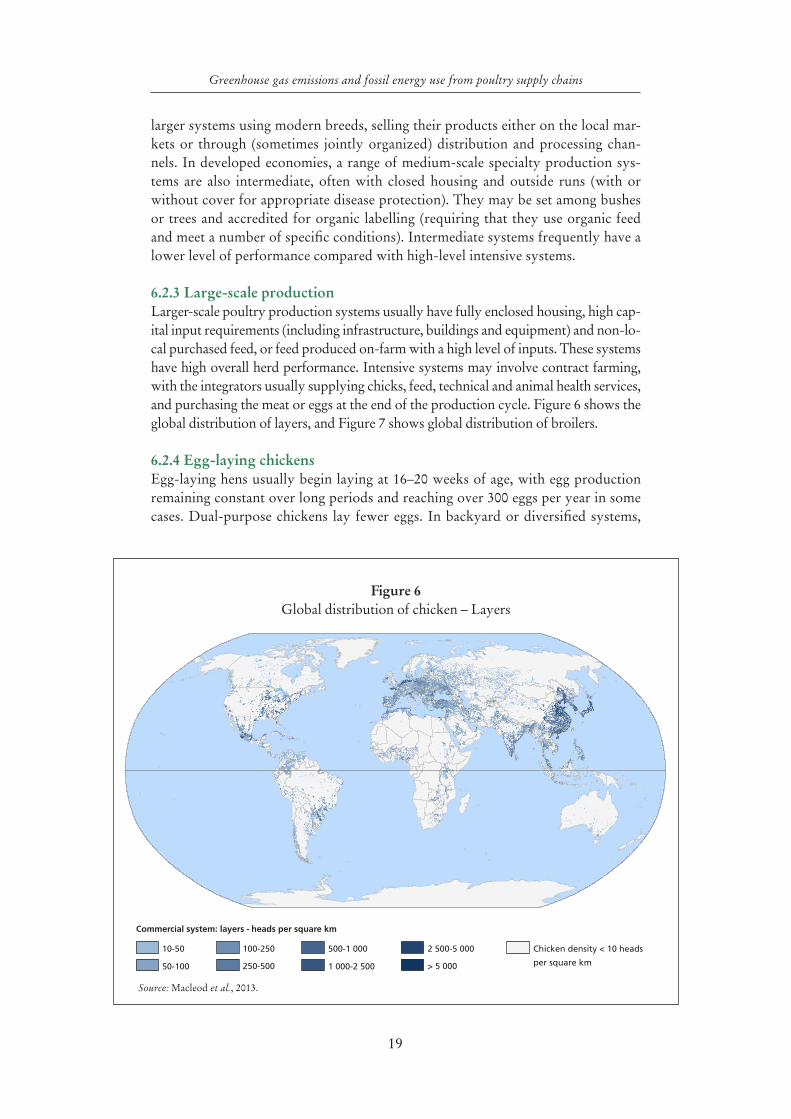
19
Greenhouse gas emissions and fossil energy use from poultry supply chains
larger systems using modern breeds, selling their products either on the local mar-kets or through (sometimes jointly organized) distribution and processing chan-nels. In developed economies, a range of medium-scale specialty production sys-tems are also intermediate, often with closed housing and outside runs (with or without cover for appropriate disease protection). They may be set among bushes or trees and accredited for organic labelling (requiring that they use organic feed and meet a number of specific conditions). Intermediate systems frequently have a lower level of performance compared with high-level intensive systems.
6.2.3 Large-scale productionLarger-scale poultry production systems usually have fully enclosed housing, high cap-ital input requirements (including infrastructure, buildings and equipment) and non-lo-cal purchased feed, or feed produced on-farm with a high level of inputs. These systems have high overall herd performance. Intensive systems may involve contract farming, with the integrators usually supplying chicks, feed, technical and animal health services, and purchasing the meat or eggs at the end of the production cycle. Figure 6 shows the global distribution of layers, and Figure 7 shows global distribution of broilers.
6.2.4 Egg-laying chickensEgg-laying hens usually begin laying at 16–20 weeks of age, with egg production remaining constant over long periods and reaching over 300 eggs per year in some cases. Dual-purpose chickens lay fewer eggs. In backyard or diversified systems,
Commercial system: layers - heads per square km
Chicken density < 10 heads
per square km
10-50
50-100
100-250
250-500
500-1 000
1 000-2 500
2 500-5 000
> 5 000
Figure 6Global distribution of chicken – Layers
Source: Macleod et al., 2013.
20
Greenhouse gas emissions and fossil energy use from poultry supply chains
which often have high mortality rates for day-old chicks from disease and preda-tion, surviving hens may live for five or more years. Environmental controls, such as air flow and lighting are often used to mimic natural conditions in egg-laying systems. For example, the duration of the light phase is initially increased to prompt the beginning of egg laying at 16–20 weeks of age and then mimics summer day length, which stimulates the hens to continue laying all year round (under natural conditions, egg production usually decreases and stops with decreasing length of daylight). In breeds that produce only in the warmer months, LCIA shall account for the non-productive months too.
Examples of laying systems include:•Backyard systems: Backyard systems can best be described as a small farming
system in which a sufficient number of hens are raised to provide eggs for a single family or to sell at local farmers’ markets. The system is typically similar to the free-range laying hen system below, but on a smaller scale.
•Free-range laying hens: Free-range poultry farming allows chickens to roam freely for a part of the day, although they are usually confined in sheds to pro-tect them from predators at night or when necessary due to bad weather. Exces-sive heat, cold or damp can have harmful effects on free-range poultry and their productivity. Free-range farmers also have less control than farmers using cages over what food their chickens eat. This can lead to lower productivity.
•Organic laying hens: In organic egg-laying systems, chickens are also free range. All organic production systems require that rations are organically produced according to regional or national standards and regulations. Organic systems also restrict or ban the routine use of yolk colorants, medications (including antibiotics) and synthetic amino acids.
•Conventional cages: Most hens in many countries are reared in cages that house from three to eight hens. Cages are usually constructed of solid metal or mesh, and floors are meshed to allow the faeces to drop through and eggs to roll onto an egg-collecting conveyor belt. The cages are arranged in long rows and multiple tiers, often with cages back-to-back. In farms using cages for egg production, there are more birds per unit area, allowing for greater productiv-ity and lower feed costs. Feed and water are often provided by automatic feed-ing and watering systems. In many modern systems, the birds’ environment is closely controlled through computerized systems.
•Enriched cages for laying hens: Enriched cages for egg-laying hens are designed to meet animal welfare concerns over conventional cages while main-taining part of their economic benefit. Enriched cages provide some facilities, such as scratch areas and separate nesting areas or perches in an effort to pro-vide conditions similar to free-range systems.
•Egg products systems: Birds in these operations are typically housed in con-ventional cages. In some cases, birds may be housed in the new enriched cage system. The only difference is the close proximity to the site where these eggs are either packed (shell eggs) or broken (processing for liquid or dry pow-ders). These systems are common in the United States, but less so elsewhere.
•Post-farm processes: These are carried out in egg packing and grading plants where shell eggs may be washed, categorized by weight and packed, and egg processing plants that produce a wide range of egg products, liquid and dry powders.
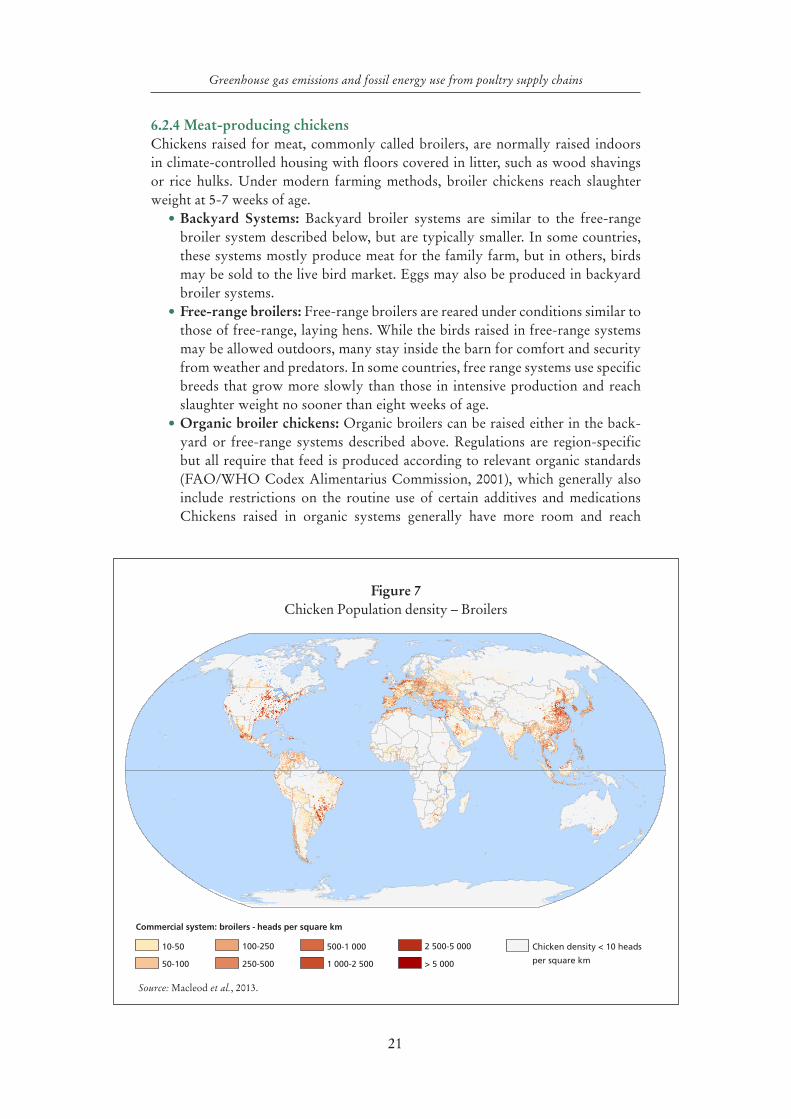
21
Greenhouse gas emissions and fossil energy use from poultry supply chains
6.2.4 Meat-producing chickensChickens raised for meat, commonly called broilers, are normally raised indoors in climate-controlled housing with floors covered in litter, such as wood shavings or rice hulks. Under modern farming methods, broiler chickens reach slaughter weight at 5-7 weeks of age.
•Backyard Systems: Backyard broiler systems are similar to the free-range broiler system described below, but are typically smaller. In some countries, these systems mostly produce meat for the family farm, but in others, birds may be sold to the live bird market. Eggs may also be produced in backyard broiler systems.
•Free-range broilers: Free-range broilers are reared under conditions similar to those of free-range, laying hens. While the birds raised in free-range systems may be allowed outdoors, many stay inside the barn for comfort and security from weather and predators. In some countries, free range systems use specific breeds that grow more slowly than those in intensive production and reach slaughter weight no sooner than eight weeks of age.
•Organic broiler chickens: Organic broilers can be raised either in the back-yard or free-range systems described above. Regulations are region-specific but all require that feed is produced according to relevant organic standards (FAO/WHO Codex Alimentarius Commission, 2001), which generally also include restrictions on the routine use of certain additives and medications Chickens raised in organic systems generally have more room and reach
Commercial system: broilers - heads per square km
Chicken density < 10 heads
per square km
10-50
50-100
100-250
250-500
500-1 000
1 000-2 500
2 500-5 000
> 5 000
Figure 7Chicken Population density – Broilers
Source: Macleod et al., 2013.
22
Greenhouse gas emissions and fossil energy use from poultry supply chains
slaughter age later. Specific regulations and labelling requirements for organic chickens usually preclude their being fed or treated with antibiotics.
•Modern broiler production: Broilers are normally raised in large, open or fully enclosed barns, some of them up to 182 meters long and 20 meters wide. Some modern broilers are also grown in multi-tier, large group colony units in which the broilers are kept on a mesh or plastic floor from one day old until time of slaughter. (Manure is removed via belts underneath the colony units.). The floors of the houses are covered with litter consisting of wood chips, rice hulks or peanut shells. Barns are frequently equipped with automatic systems to deliver feed and water. They have ventilation and heaters, which may be com-puter-operated to closely control the environment inside the barn. Older barn houses are equipped with curtain walls that can be rolled up in good weather to admit natural light and fresh air. Modern barns are completely enclosed and use tunnel ventilation in which several fans are used to pull air through the barn to maintain fresh air and control temperature. A wide variety of management systems are used, with low- to high-level optimization of living conditions.
•Post-farm processes: These are carried out in integrated abattoirs where poul-try are slaughtered and processed into a very wide range of meat products and co-products. The latter include feathers and blood (for meal and pharmaceuti-cal products), tallow (for soap or biofuel), internal organs and meat waste (for pet food) and material for rendering (for fertilizer).
A large number of secondary processing systems also exist and no attempt is made to describe them here. Examples include transforming meat into specialist cuts or into final processed products, such as cooked meals pre-packed for retailers.
6.3 MULTI-FUNCTIONALITY OF POULTRY SUPPLY CHAINSFarmers keep poultry with many objectives in mind. Poultry plays an important role in the food security and livelihoods of farmers by providing meat and eggs for their consumption, as well as income from the sale of poultry products. At the global level, poultry production often takes place in less favoured regions and in poor, remote areas where alternative sources of income may be difficult to find. This means that in many cases the future of rural areas is closely dependent on the viability of the local poultry sector.
Poultry production in Europe and the United States developed from similar humble origins and by following similar poor-to-rich trajectory, the poultry sector is expected to make a significant contribution to economic growth in the Southern Hemisphere over the next 10 to 20 years.
Smallholder poultry production systems are multi-functional. While the first ob-jective of the poultry sector is to produce meat and eggs, it also delivers a number of other valuable commodities, such as chicken manure, or litter, which is sought after as a natural fertilizer. In most Asian countries, for example, the price of chicken manure varies from US$5 to US$10 per tonne (IAEA, 2008) and it reaches almost US$30 per tonne in the United States. In some countries, chicken manure is also sold pelletized and burned as renewable fuel for electricity generation either on or off farm.
Poultry serves important social functions in different regions of the world. Chickens represent a valuable source of income for women in rural areas and they are often used as dowry and as religious offerings.
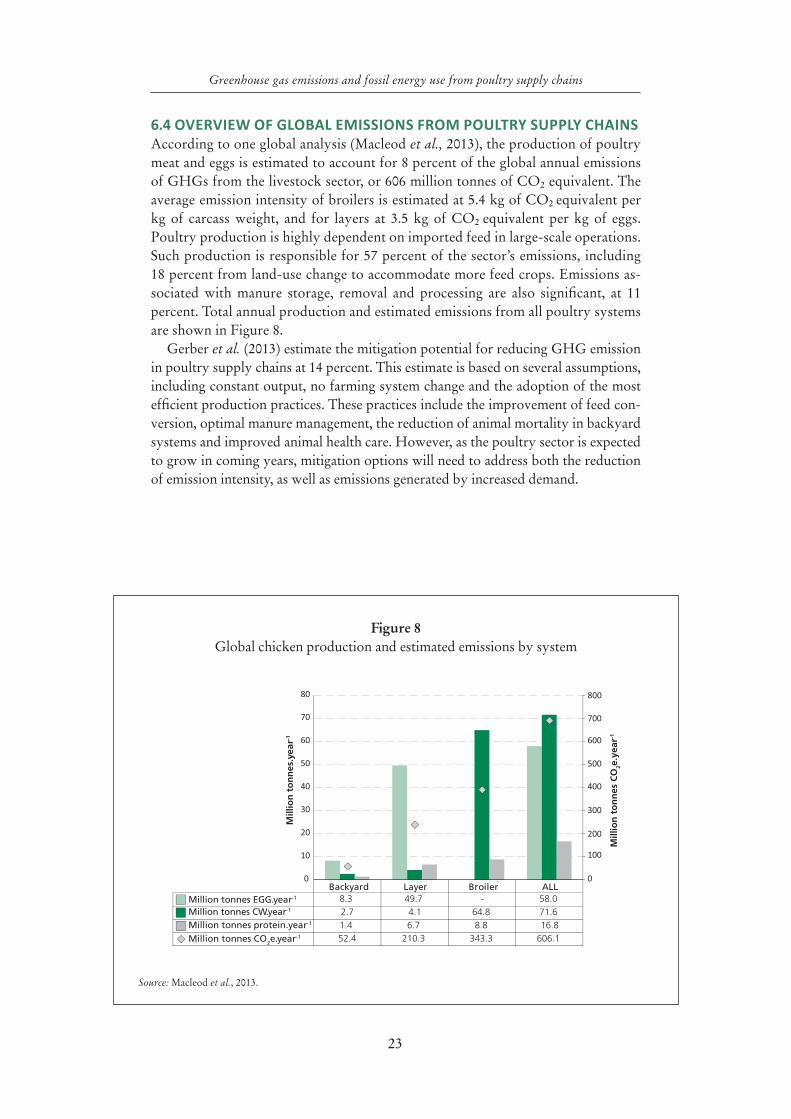
23
Greenhouse gas emissions and fossil energy use from poultry supply chains
6.4 OVERVIEW OF GLOBAL EMISSIONS FROM POULTRY SUPPLY CHAINSAccording to one global analysis (Macleod et al., 2013), the production of poultry meat and eggs is estimated to account for 8 percent of the global annual emissions of GHGs from the livestock sector, or 606 million tonnes of CO2 equivalent. The average emission intensity of broilers is estimated at 5.4 kg of CO2 equivalent per kg of carcass weight, and for layers at 3.5 kg of CO2 equivalent per kg of eggs. Poultry production is highly dependent on imported feed in large-scale operations. Such production is responsible for 57 percent of the sector’s emissions, including 18 percent from land-use change to accommodate more feed crops. Emissions as-sociated with manure storage, removal and processing are also significant, at 11 percent. Total annual production and estimated emissions from all poultry systems are shown in Figure 8.
Gerber et al. (2013) estimate the mitigation potential for reducing GHG emission in poultry supply chains at 14 percent. This estimate is based on several assumptions, including constant output, no farming system change and the adoption of the most efficient production practices. These practices include the improvement of feed con-version, optimal manure management, the reduction of animal mortality in backyard systems and improved animal health care. However, as the poultry sector is expected to grow in coming years, mitigation options will need to address both the reduction of emission intensity, as well as emissions generated by increased demand.
Backyard Layer Broiler ALLMillion tonnes EGG.year-1 8.3 49.7 - 58.0 Million tonnes CW.year-1 2.7 4.1 64.8 71.6 Million tonnes protein.year-1 1.4 6.7 8.8 16.8Million tonnes CO2e.year-1 52.4 210.3 343.3 606.1
0
100
200
300
400
500
600
700
800
0
10
20
30
40
50
60
70
80
Mill
ion
to
nn
es C
O2e
.yea
r-1
Mill
ion
to
nn
es.y
ear-1
Figure 8Global chicken production and estimated emissions by system
Source: Macleod et al., 2013.

PART 2
METHODOLOGY FOR QUANTIFICATION OF GREENHOUSE GAS EMISSIONS AND FOSSIL ENERGY USE OF POULTRY PRODUCTS

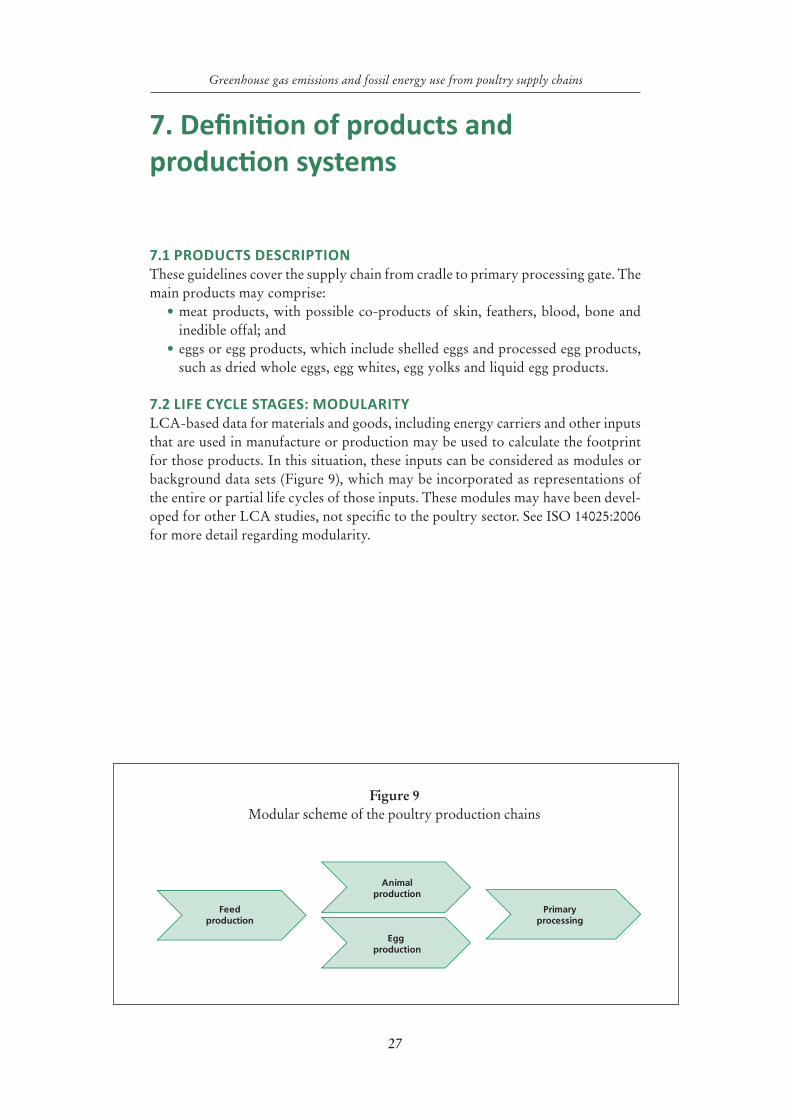
27
Greenhouse gas emissions and fossil energy use from poultry supply chains
Figure 9 Modular scheme of the poultry production chains
Feedproduction
Animalproduction
Egg production
Primaryprocessing
7. Definition of products and production systems
7.1 PRODUCTS DESCRIPTION These guidelines cover the supply chain from cradle to primary processing gate. The main products may comprise:
•meat products, with possible co-products of skin, feathers, blood, bone and inedible offal; and
•eggs or egg products, which include shelled eggs and processed egg products, such as dried whole eggs, egg whites, egg yolks and liquid egg products.
7.2 LIFE CYCLE STAGES: MODULARITYLCA-based data for materials and goods, including energy carriers and other inputs that are used in manufacture or production may be used to calculate the footprint for those products. In this situation, these inputs can be considered as modules or background data sets (Figure 9), which may be incorporated as representations of the entire or partial life cycles of those inputs. These modules may have been devel-oped for other LCA studies, not specific to the poultry sector. See ISO 14025:2006 for more detail regarding modularity.
28
Greenhouse gas emissions and fossil energy use from poultry supply chains
8. Goal and scope definition
8.1 GOAL OF THE LCA STUDYThe first step when initiating an LCA is to clearly set the goal or statement of purpose. This statement describes the goal pursued and the intended use of results. Numerous reasons for performing an LCA exist. LCAs can be used, for exam-ple, to serve the goal of GHG emission management by determining the carbon footprint of products and understanding the GHG emission hotspots to prioritize emission-reduction opportunities along supply chains. However, LCAs can go be-yond a carbon footprint and include other environmental impact categories, such as eutrophication, and provide detailed information on a product’s environmental performance. They can also serve performance tracking goals and set progress and improvement targets. LCAs could also be used to support reporting on the envi-ronmental impacts of products. However, these guidelines are not intended for the comparison of products or labelling of environmental performance.
It is of paramount importance that the goal and scope be given careful consider-ation because these decisions define the overall context of the study. A clearly ar-ticulated goal helps ensure that aims, methods and results are aligned. For example, fully quantitative studies will be required for benchmarking or reporting, but some-what less rigour may be required for hotspot analysis.
Interpretation is an iterative process occurring at all steps of the LCA and ensuring that calculation approaches and data match the goal of the study (Figure 1 and Section 12). Interpretation includes completeness checks, sensitivity checks, consistency checks and uncertainty analyses. The conclusions (reported or not) drawn from the results and their interpretation shall be strictly consistent with the goal and scope of the study.
Seven aspects shall be addressed and documented during the goal definition (ILCD Handbook):
•subject of the analysis and properties of the assessed system: organization, location(s), dimensions, products, sector and position in the value chain;
•purpose for performing the study and decision context; • intended use of the results: will the results be used internally for decision mak-
ing or shared externally with third parties?• limitations due to the method, assumptions and choice of impact categories,
particularly those related to broad study conclusions associated with exclu-sion of impact categories;
• target audience of the results;•comparative studies to be disclosed to the public and need for critical review;
and•commissioner of the study and other relevant stakeholders.
8.2 SCOPE OF THE LCA The scope is defined in the first phase of an LCA, as an iterative process with the goal definition. It states the depth and breadth of the study. The scope shall identify the product system or process to be studied, the functions of the system, the func-tional unit, the system boundaries, the allocation principles and the impact categories.
29
Greenhouse gas emissions and fossil energy use from poultry supply chains
The scope should be defined so that the breadth, depth and detail of the study are com-patible and sufficient to achieve the stated goal. While conducting an LCA of livestock products, the scope of the study may need to be modified as information is collected to reflect data availability and techniques or tools for filling data gaps. Specific guidance is provided in the subsequent sections. It is also recognized that the scope definition will affect the data collection for the LCI, as described in more detail in Section 10.1.
These guidelines refer only to two environmental impact categories: climate change, characterized through GHG emissions and reported as CO2e; and fossil en-ergy use, reported in megajoules (MJ). The guidelines therefore should not be used to provide an indicator of overall environmental effects of the production systems and products. Care is needed in the reporting and communication of the results of assessments based on these guidelines to avoid misinterpretation of the scope and application of the results.
The recommended scope for studies following these guidelines encompasses for meat products: cradle to dressed carcass; and for egg products: cradle to packaged product, whether the product is shelled eggs or any other egg product (liquid eggs or dry egg powders).
8.3 FUNCTIONAL UNITS AND REFERENCE FLOWS Both functional units and reference flows provide references to which input and out-put data are normalized in a mathematical sense. Both functional units and reference flows shall be clearly defined and measurable (ISO 14044: 2006). A functional unit describes the quantified performance of the function(s) delivered by a final product. Reference flows provide a quantitative reference for intermediate products.
Livestock products are characterized by a large variety of uses (see ENVIFOOD Protocol, 6.2.2.2) and the functions they deliver change according to their use In addition, many livestock products might be both intermediate products and final products. For example, farmers can distribute eggs directly to consumers or supply them for processing. For these reasons, and to ensure consistency across assess-ments conducted at the sectorial level, livestock products are not classified in final and intermediate products in these guidelines, and accordingly, no differentiation is made between functional units and reference flows.
Recommended functional units/reference flows for different main product types are given in Table 1. Where meat is the product type, the functional unit/reference flow when the bird leaves the farm is live weight, and when the product leaves the meat processing plant it is the weight of product (meat-product weight) destined for human consumption. In many Western countries with commercial processing plants, the product weight has traditionally been identified as carcass weight at the stage of leaving the meat processing plant. Carcass weight generally refers to the weight of the carcass after removal of the feathers, head, feet and internal organs, including the digestive tract (and sometimes some surplus fat). However, there are other edible parts (e.g. edible offal and meat from other organs and feet in some countries) that are in-creasingly being captured and should be included in the edible yield where they are destined for human consumption. In developing countries, the meat processing site may vary from ‘backyard’ to processing plants or cottage industry processing (some-times termed ‘wet market’), and a higher proportion of the bird should be extracted for human consumption. Note that the ‘product weight’ includes bone retained with-in the animal parts for human consumption. Where primary data for ‘product weight’
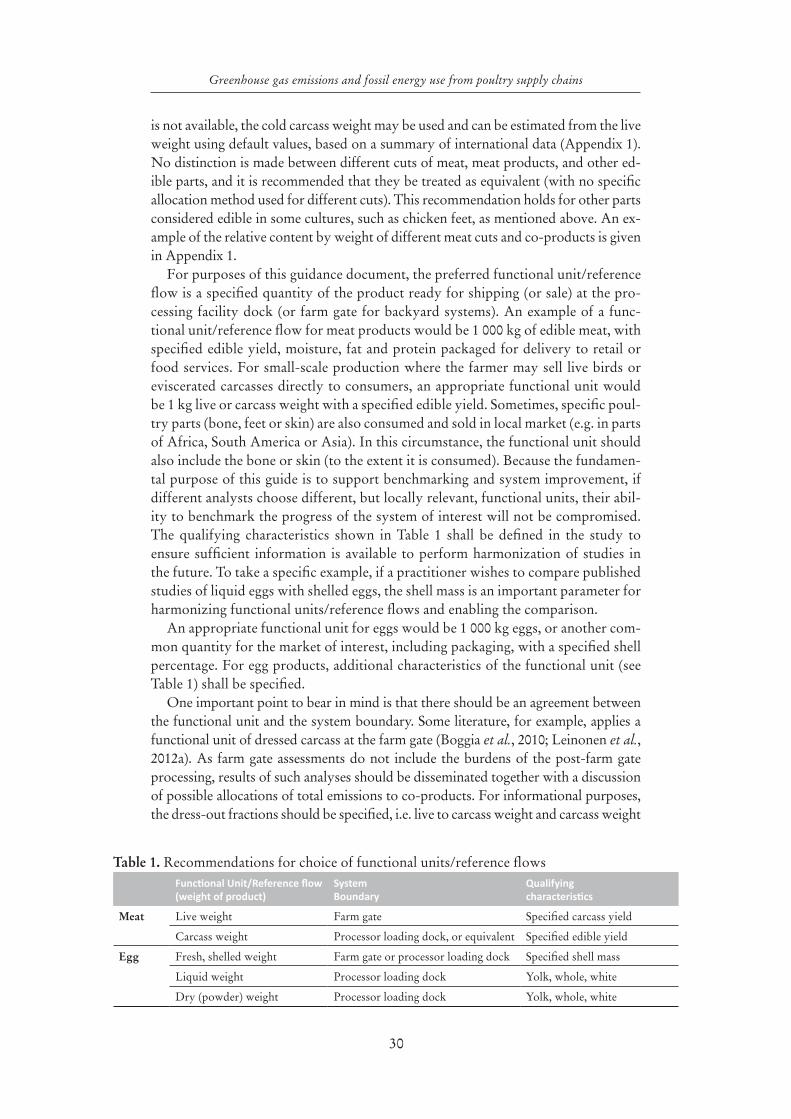
30
Greenhouse gas emissions and fossil energy use from poultry supply chains
is not available, the cold carcass weight may be used and can be estimated from the live weight using default values, based on a summary of international data (Appendix 1). No distinction is made between different cuts of meat, meat products, and other ed-ible parts, and it is recommended that they be treated as equivalent (with no specific allocation method used for different cuts). This recommendation holds for other parts considered edible in some cultures, such as chicken feet, as mentioned above. An ex-ample of the relative content by weight of different meat cuts and co-products is given in Appendix 1.
For purposes of this guidance document, the preferred functional unit/reference flow is a specified quantity of the product ready for shipping (or sale) at the pro-cessing facility dock (or farm gate for backyard systems). An example of a func-tional unit/reference flow for meat products would be 1 000 kg of edible meat, with specified edible yield, moisture, fat and protein packaged for delivery to retail or food services. For small-scale production where the farmer may sell live birds or eviscerated carcasses directly to consumers, an appropriate functional unit would be 1 kg live or carcass weight with a specified edible yield. Sometimes, specific poul-try parts (bone, feet or skin) are also consumed and sold in local market (e.g. in parts of Africa, South America or Asia). In this circumstance, the functional unit should also include the bone or skin (to the extent it is consumed). Because the fundamen-tal purpose of this guide is to support benchmarking and system improvement, if different analysts choose different, but locally relevant, functional units, their abil-ity to benchmark the progress of the system of interest will not be compromised. The qualifying characteristics shown in Table 1 shall be defined in the study to ensure sufficient information is available to perform harmonization of studies in the future. To take a specific example, if a practitioner wishes to compare published studies of liquid eggs with shelled eggs, the shell mass is an important parameter for harmonizing functional units/reference flows and enabling the comparison.
An appropriate functional unit for eggs would be 1 000 kg eggs, or another com-mon quantity for the market of interest, including packaging, with a specified shell percentage. For egg products, additional characteristics of the functional unit (see Table 1) shall be specified.
One important point to bear in mind is that there should be an agreement between the functional unit and the system boundary. Some literature, for example, applies a functional unit of dressed carcass at the farm gate (Boggia et al., 2010; Leinonen et al., 2012a). As farm gate assessments do not include the burdens of the post-farm gate processing, results of such analyses should be disseminated together with a discussion of possible allocations of total emissions to co-products. For informational purposes, the dress-out fractions should be specified, i.e. live to carcass weight and carcass weight
Table 1. Recommendations for choice of functional units/reference flowsFunctional Unit/Reference flow (weight of product)
System Boundary
Qualifying characteristics
Meat Live weight Farm gate Specified carcass yield
Carcass weight Processor loading dock, or equivalent Specified edible yield
Egg Fresh, shelled weight Farm gate or processor loading dock Specified shell mass
Liquid weight Processor loading dock Yolk, whole, white
Dry (powder) weight Processor loading dock Yolk, whole, white
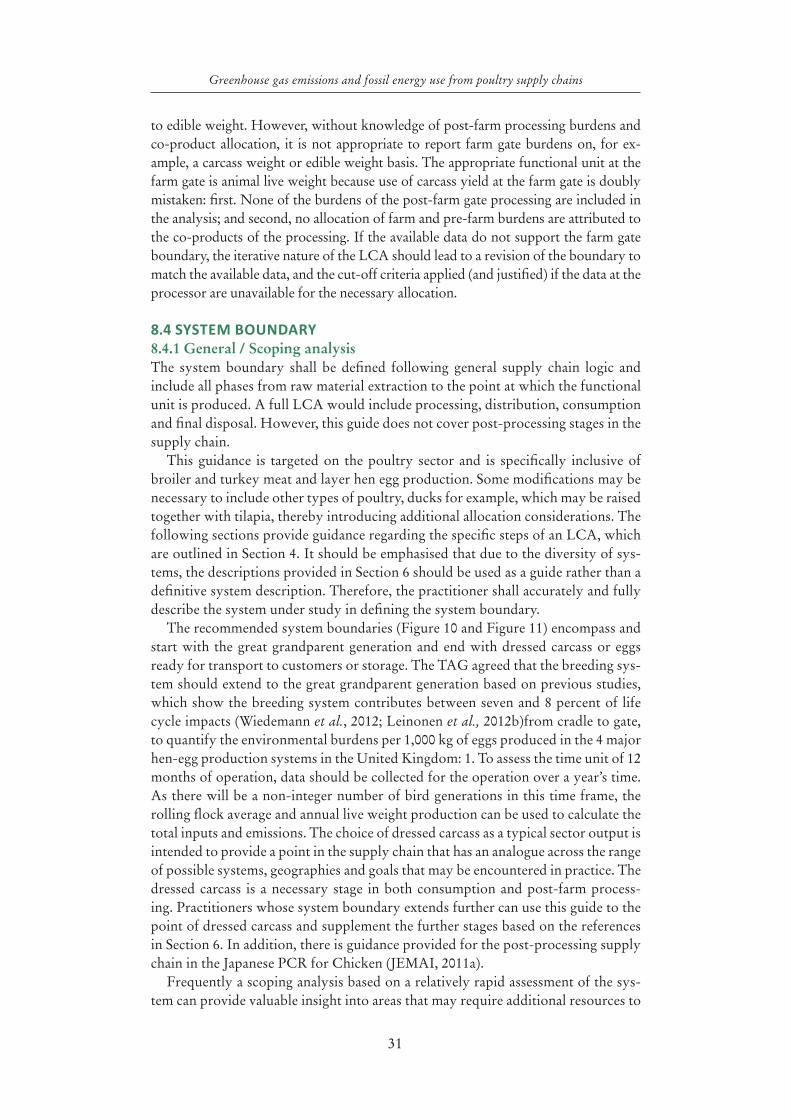
31
Greenhouse gas emissions and fossil energy use from poultry supply chains
to edible weight. However, without knowledge of post-farm processing burdens and co-product allocation, it is not appropriate to report farm gate burdens on, for ex-ample, a carcass weight or edible weight basis. The appropriate functional unit at the farm gate is animal live weight because use of carcass yield at the farm gate is doubly mistaken: first. None of the burdens of the post-farm gate processing are included in the analysis; and second, no allocation of farm and pre-farm burdens are attributed to the co-products of the processing. If the available data do not support the farm gate boundary, the iterative nature of the LCA should lead to a revision of the boundary to match the available data, and the cut-off criteria applied (and justified) if the data at the processor are unavailable for the necessary allocation.
8.4 SYSTEM BOUNDARY 8.4.1 General / Scoping analysisThe system boundary shall be defined following general supply chain logic and include all phases from raw material extraction to the point at which the functional unit is produced. A full LCA would include processing, distribution, consumption and final disposal. However, this guide does not cover post-processing stages in the supply chain.
This guidance is targeted on the poultry sector and is specifically inclusive of broiler and turkey meat and layer hen egg production. Some modifications may be necessary to include other types of poultry, ducks for example, which may be raised together with tilapia, thereby introducing additional allocation considerations. The following sections provide guidance regarding the specific steps of an LCA, which are outlined in Section 4. It should be emphasised that due to the diversity of sys-tems, the descriptions provided in Section 6 should be used as a guide rather than a definitive system description. Therefore, the practitioner shall accurately and fully describe the system under study in defining the system boundary.
The recommended system boundaries (Figure 10 and Figure 11) encompass and start with the great grandparent generation and end with dressed carcass or eggs ready for transport to customers or storage. The TAG agreed that the breeding sys-tem should extend to the great grandparent generation based on previous studies, which show the breeding system contributes between seven and 8 percent of life cycle impacts (Wiedemann et al., 2012; Leinonen et al., 2012b)from cradle to gate, to quantify the environmental burdens per 1,000 kg of eggs produced in the 4 major hen-egg production systems in the United Kingdom: 1. To assess the time unit of 12 months of operation, data should be collected for the operation over a year’s time. As there will be a non-integer number of bird generations in this time frame, the rolling flock average and annual live weight production can be used to calculate the total inputs and emissions. The choice of dressed carcass as a typical sector output is intended to provide a point in the supply chain that has an analogue across the range of possible systems, geographies and goals that may be encountered in practice. The dressed carcass is a necessary stage in both consumption and post-farm process-ing. Practitioners whose system boundary extends further can use this guide to the point of dressed carcass and supplement the further stages based on the references in Section 6. In addition, there is guidance provided for the post-processing supply chain in the Japanese PCR for Chicken (JEMAI, 2011a).
Frequently a scoping analysis based on a relatively rapid assessment of the sys-tem can provide valuable insight into areas that may require additional resources to
32
Greenhouse gas emissions and fossil energy use from poultry supply chains
establish accurate information for the assessment. A scoping analysis can be con-ducted using secondary data to provide an overall estimate of the system’s impact. Furthermore, based on existing literature reviews relating to the poultry sector (Ap-pendix 2), it is relatively clear that for production systems the following factors are extremely important to assess with high accuracy: the ration, the feed conversion efficiency and manure production and management. Depending upon the particular operation under study, additional effects may be observed. In the post-farm supply chain, energy efficiency at the processing and manufacturing stages, as well as an accurate assessment of transportation modes and distances is important.
8.4.2 Criteria for system boundaryMaterial system boundaries. A flow diagram of all assessed processes should be drawn that indicates where processes were cut off. For the main transformation steps within the system boundary, it is recommended that a material flow diagram is produced and used to account for all of the material flows, (e.g. within the processing stage, the live weight is defined and shall equate the sum of the mass of the products produced).
Spatial system boundaries: The cradle-to-farm-gate stage includes feed and animal components. The LCA of feeds is covered in detail in the LEAP Animal Feed Guide-lines and covers the cradle-to-animal-mouth (beak) stage for all feed sources, including raw materials, inputs, production, harvesting, storage, loss and feeding. The LEAP An-imal Feed Guidelines covers all emissions associated with land use and land-use change.
These guidelines cover all inputs and emissions in the poultry supply chain not covered by the LEAP Animal Feed Guidelines, i.e. emissions associated with poul-try production and management. Management includes accounting for the utiliza-tion of excreta, where it is important to avoid double counting, if excreta represent a direct input for feed production. The estimation of manure emissions from trans-port and application is included in the LEAP Animal Feed Guidelines. These guide-lines include accounting for breeding stock, as well as those animals used directly for meat and egg production. This may involve more than one farm if animals are traded between farms prior to processing.
The primary processing stage is limited to animal slaughter, which may be done in the backyard, village slaughter unit or abattoir, for meat processing to produce the functional unit. For shelled eggs, if they are washed, packaging and refrigeration until the time of shipment is included. For other egg products, processing includes all steps required to produce the functional unit. For example, dried whole eggs would include all the packaging, as well as the energy required to pasteurize, and/or dry and refrigerate the eggs. All transportation steps within and between the cradle to primary processing gate are included.
8.4.3 Material contribution and thresholdsLCA requires tremendous amounts of data and information. Managing this infor-mation is an important aspect of performing LCAs, and all projects have limited resources for data collection. In principle, all LCA practitioners attempt to include all relevant exchanges in the inventory. Some exchanges are clearly more important in their relative contribution to the impact categories of the study, and significant effort is required to reduce the uncertainty associated with these exchanges. In de-termining whether or not to expend significant project resources to reduce the un-certainty of small flows, cut-off criteria may be adopted (Section 8.2).
33
Greenhouse gas emissions and fossil energy use from poultry supply chains
Exchanges that contribute less than 1 percent of mass or energy flow may be cut off from further evaluation, but should not be excluded from the inventory. Larger thresholds shall be explicitly documented and justified by the project goal and scope definition. A minimum of 95 percent of the impact for each category shall be accounted for. Inputs to the system that contribute less than 1 percent of the environmental signifi-cance for a specific unit process (activity) in the system can be included with an estimate from a scoping analysis (Section 8.2). The scoping analysis can also provide an estimate of the total environmental impact to evaluate against the 95 percent minimum.
For some exchanges that have small mass or energy contributions there still may be a significant impact in one of the environmental categories. Additional effort should be expended to reduce the uncertainty associated with these flows. Lack of knowl-edge regarding the existence of exchanges that are relevant for a particular system is not considered a cut-off issue but rather a modelling mistake. The application of cut-off criteria in an LCA is not intended to support the exclusion of known exchanges, it is intended to help guide the expenditure of resources towards the reduction of uncertainty associated with those exchanges that matter the most in the system.
8.4.4 Time boundary for data For poultry products, a minimum period of 12 months should be used, if this is able to cover all life stages of the animal through to the specified endpoint of the analy-
Figure 10 Schematic of egg and egg products production system
Source: processes outside of the dashed line are excluded from the recommended system. Grey shading indicates waste treat-ment for which emissions shall be included in the system calculations. When manure has significant economic value for the farmer, it is considered a co-product. See Section 9.3.3 for detailed explanation.
Fertile EggsGreat
Grandparent Farm
Grandparent Farm
Parent Farm
Ration
Pesticides
Water
Fuels/energy
Hatchery
Pullet Rearing
Egg Product
Operation
Shelled Egg
Operation
INPUTS TO LAYINGSYSTEM
EGG PRODUCTION
Packaging
Egg Grading
Hatchery
Distribution
Retail Outlet
Food Service Outlet
PROCESSING
Human Consumption
Hatchery
BREEDING
Supplements
Animal Meals(if allowed)
Crops
Egg Washing
Cold Storage
Processing Liquid Product
Dry Product
BY PRODUCT MANAGEMENT
Spent Hens
Final Disposal (e.g. landfill)
Re-use(fertilizer, meal)
Manure/Litter
Damaged eggs and
Shell
Cull
Further Processing
Manure/Litter
MULTI-FUNCTIONAL
MULTI-FUNCTIONAL
Wastewater Treatment
Egg Grading
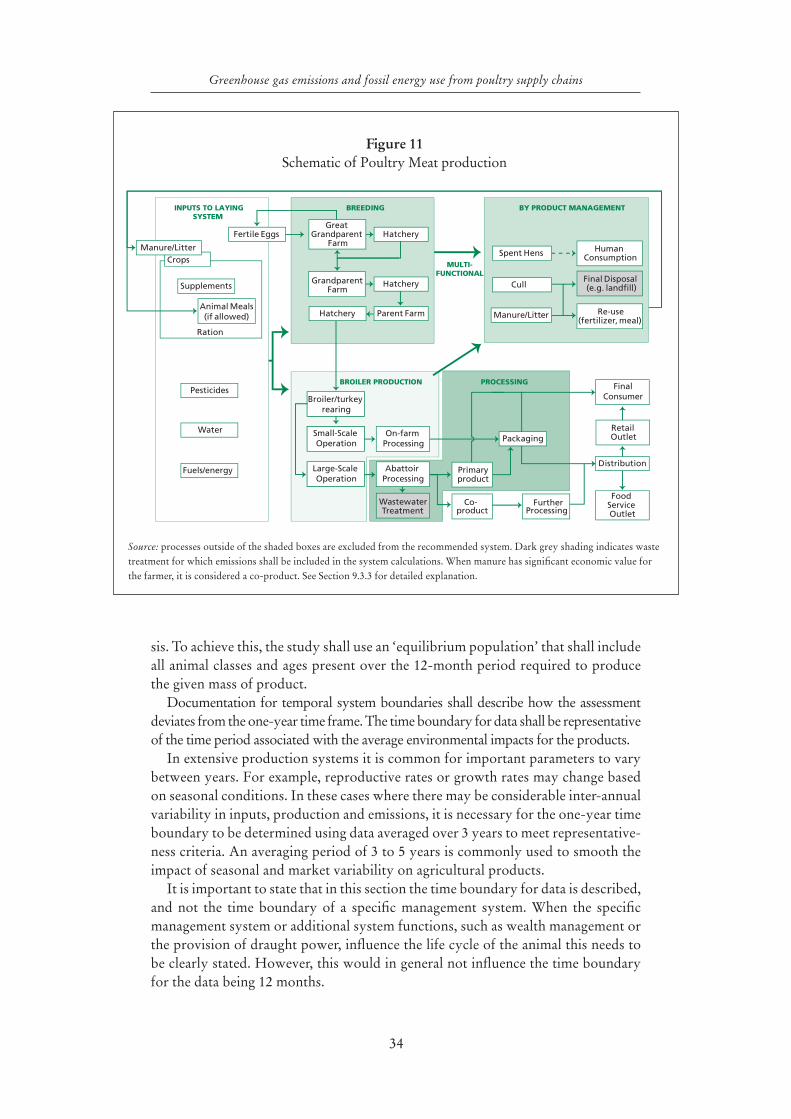
34
Greenhouse gas emissions and fossil energy use from poultry supply chains
sis. To achieve this, the study shall use an ‘equilibrium population’ that shall include all animal classes and ages present over the 12-month period required to produce the given mass of product.
Documentation for temporal system boundaries shall describe how the assessment deviates from the one-year time frame. The time boundary for data shall be representative of the time period associated with the average environmental impacts for the products.
In extensive production systems it is common for important parameters to vary between years. For example, reproductive rates or growth rates may change based on seasonal conditions. In these cases where there may be considerable inter-annual variability in inputs, production and emissions, it is necessary for the one-year time boundary to be determined using data averaged over 3 years to meet representative-ness criteria. An averaging period of 3 to 5 years is commonly used to smooth the impact of seasonal and market variability on agricultural products.
It is important to state that in this section the time boundary for data is described, and not the time boundary of a specific management system. When the specific management system or additional system functions, such as wealth management or the provision of draught power, influence the life cycle of the animal this needs to be clearly stated. However, this would in general not influence the time boundary for the data being 12 months.
Figure 11 Schematic of Poultry Meat production
Source: processes outside of the shaded boxes are excluded from the recommended system. Dark grey shading indicates waste treatment for which emissions shall be included in the system calculations. When manure has significant economic value for the farmer, it is considered a co-product. See Section 9.3.3 for detailed explanation.
Broiler/turkey rearing
Small-Scale Operation
Large-Scale Operation
BROILER PRODUCTION
Packaging
Distribution
Retail Outlet
FinalConsumer
Food Service Outlet
PROCESSING
Abattoir Processing
Primaryproduct
Co-product
Further Processing
Wastewater Treatment
On-farm Processing
Fertile EggsGreat
Grandparent Farm
Grandparent Farm
Parent Farm
Ration
Pesticides
Water
Hatchery
INPUTS TO LAYINGSYSTEM
Hatchery
Hatchery
BREEDING
Supplements
Animal Meals(if allowed)
Crops
BY PRODUCT MANAGEMENT
Manure/Litter
MULTI-FUNCTIONAL
Human ConsumptionSpent Hens
Final Disposal (e.g. landfill)
Re-use(fertilizer, meal)
Manure/Litter
Cull
Fuels/energy
35
Greenhouse gas emissions and fossil energy use from poultry supply chains
8.4.5 Capital goodsThe production of capital goods (buildings and machinery) with a lifetime greater than one year may be excluded in the LCI. All consumables and at least those capi-tal goods whose life span is below one year should be included for assessment, un-less it falls below the 1 percent cut-off threshold noted in Section 8.4.3.
8.4.6 Ancillary activitiesEmissions from ancillary inputs (e.g. veterinary medicines, servicing, employee commutes, executive air travel, accounting or legal services) may be included if rel-evant. To determine if these activities are relevant, an input-output analysis can be used as part of a scoping analysis.
8.4.7 Delayed emissionsAll emissions associated with products to the primary processing stage are assumed to occur within the time boundary for data, generally of one year (Section 8.4.4). Delayed emissions from soil and vegetation are considered in the LEAP Animal Feed Guidelines. The PAS 2050:2011 provides additional guidance regarding de-layed emissions calculations for interested practitioners.
8.4.8 Carbon OffsetsOffsets shall not be included in the carbon footprint. However, they may be report-ed separately as ‘additional information’. If reported, details for the methodology and assumptions need to be clearly documented.
8.5 IMPACT CATEGORIESThese guidelines are primarily based on an assessment of GHG emissions. The total GHG emissions for individual gases are summed along the system boundary. Indi-vidual gases are then multiplied by the relevant characterization factor to convert them all into a common unit of carbon dioxide equivalents (kg CO2e). The characterization factors shall be based on the global warming potentials of the specific gases over a 100-year time horizon, using the most recent Intergovernmental Panel on Climate Change (IPCC) factors, which can be found in the latest IPCC guidance documentation. Be-cause characterization factors change as our understanding evolves, it is important to note in the report documentation what specific sources were used for them.
The fossil energy use should also be calculated, since all inputs of fossil fuels shall be determined as part of the data collection requirements for assessing GHG emis-sions. This is captured in the impact category called ‘cumulative energy demand’ and sub-category of non-renewable energy resources, and uses the higher heating value of the fuel for its characterization factor (Frischknecht, Heijungs and Hofstetter, 1998). It shall account for the embodied primary energy for the production and combustion of the various energy sources and may draw on recognized databases, such as ecoin-vent (Frischknecht and Rebitzer, 2005). Fossil energy demand for the production and use of electricity, which will be specific for a particular country, shall also be included.
The LCA of products should account for a range of resource use and environ-mental impact categories. It is intended that in future these guidelines will be up-dated to include multiple categories.
36
Greenhouse gas emissions and fossil energy use from poultry supply chains
9. Multi-functional processes and allocation
One of the challenges in LCA has always been associated with the proper assign-ment (allocation) of shared inputs and emissions to the multiple products from multi-functional processes (e.g. live birds and eggs at a backyard farm gate; or ener-gy, water use and emissions allocated between several dissimilar products produced at a manufacturing plant). The choice of the method for handling co-production often has a significant impact on the final distribution of impacts across the co-products. Whichever procedure is adopted shall be documented and explained, and include a sensitivity analysis of the choice on the results. As far as feasible, multi-functional procedures should be applied consistently within and among the data sets. For situations where system separation or expansion is not used, the allocated inputs and outputs should equal unallocated inputs and outputs.
9.1 GENERAL PRINCIPLES The ISO 14044:2006 standard gives the following guidelines for LCA practitioners with respect to practices for handling multi-functional production:
Step 1: Wherever possible, allocation should be avoided by:a. dividing the unit process to be allocated into two or more sub-processes and
collecting the input and output data related to these sub-processes; orb. expanding the product system to include the additional functions related to
the co-products.Step 2: Where allocation cannot be avoided, the inputs and outputs of the sys-
tem should be partitioned between its different products or functions in a way that reflects the underlying physical relationships between them. In other words the allocation should reflect the way in which the inputs and outputs are affected by quantitative changes in the products or functions delivered by the system.
Step 3: Where physical relationship alone cannot be established or used as the basis for allocation, the inputs should be allocated between the products and func-tions in a way that reflects other relationships between them. For example, input and output data might be allocated between co-products in proportion to their eco-nomic value.
Where allocation of inputs is required (e.g. the allocation of process energy be-tween poultry meat and other products not meant for human consumption), the al-location procedures should follow the ISO 14044:2006 allocation hierarchy. When allocation choices significantly affect the results, a sensitivity analysis shall be per-formed to ensure the robustness of conclusions.
Below is a list of commonly used procedures for addressing multi-functional processes in attributional studies:
•biophysical causality, arising from underlying biological or physical relation-ships between the co-products, such as material or energy balances;
•physical properties, such as mass, or protein or energy content; and•economic value (revenue share) based on market prices of the products.
37
Greenhouse gas emissions and fossil energy use from poultry supply chains
9.2 A DECISION TREE TO GUIDE METHODOLOGY CHOICES A decision tree diagram to help with decisions on the appropriate methodology for dealing with co-products is given in Figure 12. It uses a three-stage approach, and the principles involved in working through it are as follows:
Stage 1: Avoid allocation by subdividing the processing system.A production unit is defined here as a group of activities (along with the inputs, machinery and equipment) in a processing facility or a farm that are needed to pro-duce one or more co-products. Examples are the crop fields in a farm; the different animal herds (poultry, fattening pigs, sows, piglets); or the individual processing lines in a manufacturing facility.
In the first stage (ISO step 1a subdivision), all processes and activities of a farm/processing facility are subdivided based on the following characteristics:
flow 1.a. Inputs/activities that can be directly assigned to a single co-product should be assigned to that co-product (e.g. packaging and post-processing storage for meat products, or rendering energy require-ments in the post-exsanguination phase at the processing plant).
flow 1.b. Inputs/activities that can be assigned to single production units and that may provide multiple co-products should be assigned to the specific production unit (e.g. input of pesticides for corn are as-signed to the ‘corn production unit’ of a farm with multiple crops; or energy inputs for a specific barn operation or manufacturing fa-cility; or feed for a specific animal, which may yield multiple prod-ucts, in a farm operation with several species).
flow 1.c. Inputs/activities of a non-specific nature in a farm or processing facility, such as heating, ventilation, climate control and internal transport in a manufacturing facility or farm that cannot be direct-ly attributed to specific production units. For example, energy to pump drinking water for multiple animal species in a small-scale, multispecies operation would be categorized as non-specific. It may be possible for these inputs to be assigned to each production unit in proportion to the causal relationship that determines in-creased need for each input, such as weight, volume or area (trans-port, roads, buildings) or revenue (office and accounting).
Stage 2: Attribute combined production to separate production units.In theory, all combined production systems are separable where sufficiently detailed data exist and they should normally follow path 1a. Nevertheless, situations exist where this is impractical, and in the next stage, (stage 2 in Figure 12) the non-specific processes should be attributed to production units on the basis of the ISO steps 1b, 2 and 3. For example, in backyard systems it may be that poultry, cattle, sheep and swine are all raised in a single production unit. In this situation, farm overhead operations that cannot be explicitly assigned to an individual species should be handled using the criteria in Box 2. For most large-scale poultry production systems, the 1b path to Box 3 will be followed, as the inputs and outputs in single-species systems are clearly as-signed to the single production unit and its activities/operations and multiple products.
System expansion: ISO step 1b: As part of the harmonization effort behind these guidelines, the range of allocation options in the application of LCA are restricted
38
Greenhouse gas emissions and fossil energy use from poultry supply chains
to poultry systems and exclude the application of system expansion by means of substitution. Furthermore, its use is limited to situations in which “expanding the product system to include the additional functions related to the co-products” is acceptable within the goal and scope of the study (ISO 14044:2006). This implies, for laying operations for example, that the GHG emissions can only be attributed to the combined multiple outputs of spent layers (as meat) and eggs, and that nei-ther product receives a separately identified impact. For benchmarking operations, this is an entirely appropriate perspective; the overall reduction of impacts for the multifunctional system can be easily monitored and managed. The alternative, the consequential use of system expansion using an avoided burden calculated through substitution is not compliant with these guidelines.
Allocation: ISO step 2: When system expansion is not possible, the second question is whether a physical allocation is possible. The condition imposed by these guidelines here is that the products should have similar physical properties and serve similar goals or markets. Alternatively, known processing or biophysical relationships can be used to assign inputs and outputs of a single production unit to each product (ISO 14044:2006, 4.3.4.2, Step 2). For example, if feed is provided to multiple animal species, the animal growth requirements may be used to apportion the shared feed between the species. The result of this stage will be a splitting of some inventory flows between the production units, and if the resultant process is multifunctional, these inventory flows will be allocated to single co-products in the next step of the procedure (Box 3 in Figure 12).
If inputs in a multiple production system benefit all products and cannot be spe-cifically assigned to production units, the allocation should be preferably based on a mechanistic algorithm or physical property (flow 2b in Figure 12).
Allocation: ISO step 3: When physical allocation is not possible or allowed, the last option is economic allocation. As with physical allocation, the result of this step will be a splitting of some inventory flows between the production units, and if the resultant unit process is still multifunctional, these inventory flows will be allocated to single co-products in the next stage of the procedure (Box 3 in Figure 12).
Stage 3: Split single production units into individual co-products.After stages 1 and 2, all inputs and operations will have been attributed to the sin-gle production unit, or already to a single product. An inventory table is made for the production unit. Stage 3 guides the assignment of inputs and emissions from a single production unit to each co-product produced by the unit. If there is only a single product at this stage, the process is complete. The same rule holds as the one defined above for production units, so system expansion (without substitution) should be applied in situations where supported by the goal and scope definition. Any flow arising from 2a will follow this path. When system expansion is not used, the remaining outputs shall be classified as co-products, residual products or wastes.
Outputs of a production process are considered as residual flows (3f) if:• they are sold in the condition in which they are created in the process and do
not contribute revenue to the owner; • they are included in value-added steps beyond the boundary of the poultry
system under study, but these activities do not impact the poultry system cal-culations in these guidelines.
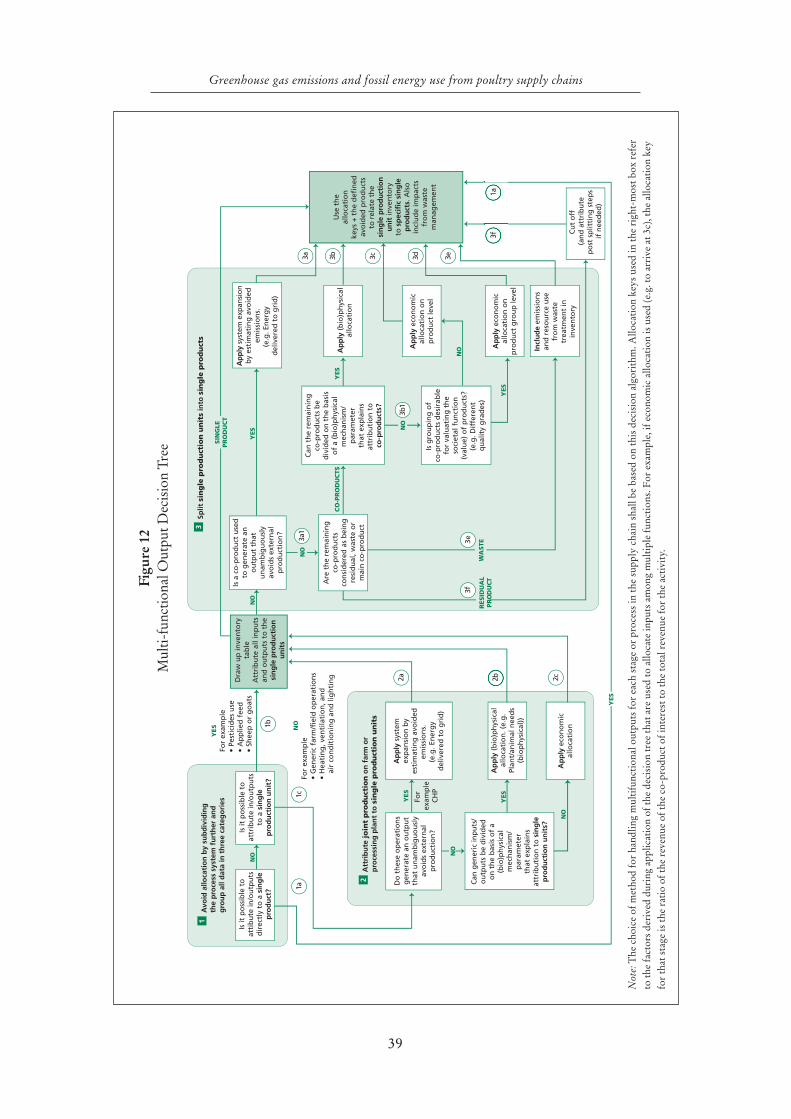
39
Greenhouse gas emissions and fossil energy use from poultry supply chains
Figu
re 1
2M
ulti-
func
tiona
l Out
put D
ecis
ion
Tree
2b
Is it
po
ssib
le t
oat
trib
ute
in/o
utp
uts
to a
sin
gle
pro
du
ctio
n u
nit
?
YES
For
exam
ple
CH
P
Dra
w u
p in
ven
tory
tab
leA
ttri
bu
te a
ll in
pu
tsan
d o
utp
uts
to
th
esi
ng
le p
rod
uct
ion
un
its
Do
th
ese
op
erat
ion
sg
ener
ate
an o
utp
ut
that
un
amb
igu
ou
sly
avo
ids
exte
rnal
pro
du
ctio
n?
Ap
ply
sys
tem
exp
ansi
on
by
esti
mat
ing
avo
ided
emis
sio
ns.
(e
.g. E
ner
gy
del
iver
ed t
o g
rid
)
NO
Can
gen
eric
inp
uts
/o
utp
uts
be
div
ided
on
th
e b
asis
of
a(b
io)p
hys
ical
mec
han
ism
/p
aram
eter
that
exp
lain
sat
trib
uti
on
to
sin
gle
pro
du
ctio
n u
nit
s?
NO
Ap
ply
eco
no
mic
allo
cati
on
YES
Ap
ply
(b
io)p
hys
ical
allo
cati
on
. (e.
g.
Plan
t/an
imal
nee
ds
(bio
ph
ysic
al))
NO
Is a
co
-pro
du
ct u
sed
to g
ener
ate
ano
utp
ut
that
un
amb
igu
ou
sly
avo
ids
exte
rnal
pro
du
ctio
n?
YES
Ap
ply
sys
tem
exp
ansi
on
by
esti
mat
ing
avo
ided
emis
sio
ns.
(e.g
. En
erg
y d
eliv
ered
to
gri
d)
NO
Are
th
e re
mai
nin
gco
-pro
du
cts
con
sid
ered
as
bei
ng
resi
du
al, w
aste
or
mai
n c
o-p
rod
uct
CO
-PR
OD
UC
TS
Can
th
e re
mai
nin
gco
-pro
du
cts
be
div
ided
on
th
e b
asis
of
a (b
io)p
hys
ical
mec
han
ism
/ p
aram
eter
that
exp
lain
sat
trib
uti
on
to
co
-pro
du
cts?
RESID
UA
LP
RO
DU
CT
WA
STE
Cu
t o
ff
(an
d a
ttri
bu
tep
ost
sp
litti
ng
ste
ps
if n
eed
ed)
Incl
ud
e em
issi
on
san
d r
eso
urc
e u
sefr
om
was
tetr
eatm
ent
inin
ven
tory
YES
Ap
ply
(b
io)p
hys
ical
allo
cati
on
NO
NO
Is g
rou
pin
g o
f co
-pro
du
cts
des
irab
lefo
r va
luat
ing
th
eso
ciet
al f
un
ctio
n(v
alu
e) o
f p
rod
uct
s?(e
.g. D
iffe
ren
t q
ual
ity
gra
des
)
Ap
ply
eco
no
mic
allo
cati
on
on
pro
du
ct g
rou
p le
vel
Y
ES
Is it
po
ssib
le t
oat
tib
ute
in/o
utp
uts
dir
ectl
y to
a s
ing
lep
rod
uct
?
NO
YES
1a
1b
1c
2a 2c
3a 3b 3c 3d 3e
3f
3b1
3a1
3e3f
1a
SIN
GLE
PR
OD
UC
T
Avo
id a
lloca
tio
n b
y su
bd
ivid
ing
th
e p
roce
ss s
yste
m f
urt
her
an
dg
rou
p a
ll d
ata
in t
hre
e ca
teg
ori
es
Att
rib
ute
jo
int
pro
du
ctio
n o
n f
arm
or
pro
cess
ing
pla
nt
to s
ing
le p
rod
uct
ion
un
its
1
2
Split
sin
gle
pro
du
ctio
n u
nit
s in
to s
ing
le p
rod
uct
s3
Use
th
e al
loca
tio
nke
ys +
th
e d
efin
edav
oid
ed p
rod
uct
sto
rel
ate
the
sin
gle
pro
du
ctio
nu
nit
inve
nto
ry
to s
pec
ific
sin
gle
pro
du
cts.
Als
oin
clu
de
imp
acts
fro
m w
aste
man
agem
ent
Ap
ply
eco
no
mic
allo
cati
on
on
pro
du
ct le
vel
YES
For
exam
ple
• Pe
stic
ides
use
• A
pp
lied
fee
d•
Shee
p o
r g
oat
s
NO
For
exam
ple
• G
ener
ic f
arm
/fiel
d o
per
atio
ns
• H
eati
ng
, ven
tila
tio
n, a
nd
air
con
dit
ion
ing
an
d li
gh
tin
g
Not
e: T
he c
hoic
e of
met
hod
for
hand
ling
mul
tifu
ncti
onal
out
puts
for
each
sta
ge o
r pr
oces
s in
the
supp
ly c
hain
sha
ll be
bas
ed o
n th
is d
ecis
ion
algo
rith
m. A
lloca
tion
key
s us
ed in
the
righ
t-m
ost b
ox r
efer
to
the
fact
ors
deri
ved
duri
ng a
pplic
atio
n of
the
deci
sion
tree
that
are
use
d to
allo
cate
inpu
ts a
mon
g m
ulti
ple
func
tion
s. F
or e
xam
ple,
if e
cono
mic
allo
cati
on is
use
d (e
.g. t
o ar
rive
at 3
c), t
he a
lloca
tion
key
fo
r th
at s
tage
is th
e ra
tio
of th
e re
venu
e of
the
co-p
rodu
ct o
f int
eres
t to
the
tota
l rev
enue
for
the
acti
vity
.
40
Greenhouse gas emissions and fossil energy use from poultry supply chains
Residual products will not receive any allocated emissions, nor will they contrib-ute emissions to the main co-products of the production unit. However, it is useful to track residual flows for the purpose of understanding the mass balance for the production unit.
An output of a production process shall be considered as waste if the production unit incurs a cost for treatment or removal. Waste has to be treated and/or disposed of and these emissions shall be included in the inventory. For the poultry sector, the most common process in this category is wastewater treatment at manufacturing facilities, and in some cases litter sent to a landfill. Litter/manure is discussed below (Section 9.3.3).
Co-products, i.e. not residual or waste, are subject to allocation, leading to flows 3b, 3c and 3d in Figure 12. Assignment to these flows depends upon whether bio-physical or mechanistic allocation or an allocation based on physical characteristics, is possible or allowed under these guidelines (3b), or whether an economic alloca-tion at a single product (3c) or product group level (3d) is applied.
Following the ISO standard, the preferred approach is to identify a straightfor-ward mechanistic algorithm (e.g. when energy inputs in the process are directly cor-related with mass flow), or biophysical relationship that can be used to assign inputs and emissions to each co-product. The condition for determining whether physical characteristic-based allocation (e.g. energy or protein content) is appropriate is that the products should have similar physical properties and serve similar functions or markets. When physical allocation is not feasible (interactions are too complex to accurately define a mechanistic relationship) or is not allowed (dissimilar properties or markets), the last option is economic allocation.
In the case of economic allocation, one option (flow 3d) is grouping a number of co-products and performing the allocation with some co-products at the group level instead of the single product level. This option is relevant for the various edible meat components (e.g. carcass cuts and edible offal), which shall be grouped before allocation between them and other inedible co-products, such as renderables.
9.3 APPLICATION OF GENERAL PRINCIPLES FOR POULTRY SYSTEMS AND PROCESSESTo make these general ISO requirements operational for allocation in the poul-try production life cycle, the ISO steps were applied in these situations: combined and joint production processes, such as farms and food processing plants that have multiple products and for manure. Table 2 summarizes the allocation procedures supported by this guidance.
Allocation procedures shall be uniformly applied to similar inputs and outputs of the system under consideration. For example, if allocation is made to usable products (e.g. intermediate or discarded products) leaving the system, then the allo-cation procedure shall be similar to the allocation procedure used for such products entering the system. For example, in a backyard poultry system where other animal species are also present, the unit process created will very likely have an output product identified for each of the animal species, and it is necessary to assign the inputs and emissions of this combined production system separately to each spe-cies (product of the farm). The decision tree provides guidance on methodological approaches suitable for assigning inputs and emissions of the overall unit process to the individual products. Where choice of allocation can have a significant effect
41
Greenhouse gas emissions and fossil energy use from poultry supply chains
on results, more than one method shall be used to illustrate the effects of choice of allocation methodology.
9.3.1 Meat productionFor broilers, there are two points of separation into multiple products: the breeding stage where spent hens are sent to processing for human consumption, or cull hens sent to the pet food sector; and hatchlings that are grown out as broilers. How-ever, the primary point of separation of multiple products is at the processing stage, where chicken meat, bone and feather meals, as well as tallow and rendering prod-ucts are generated. As indicated above, there are several approaches for handling this multi-functionality. As discussed below, the recommendation of this guidance is to apply causal reasoning for all situations of co-production, i.e. subdivision ac-cording to physical causalities for combined production and economic allocation for joint production. However, because of the potential sensitivity of this method-ological choice, if information is available, system expansion and a mass allocation should also be examined to determine the robustness of the results to the choice of allocation methodology. If the breeding stage is considered as a background system, for which secondary data is used, then the first multi-functional issue will already have been accounted for in the secondary data. For situations in which breeding is within the foreground system, the application of biophysical allocation for spent hens based on the proportion of total energy requirements for growth and egg/hatchling production should be used.
9.3.2 Egg productionFor egg production systems, eggs and spent layers represent the primary co-products of the laying system. As with breeding phase, the preferred approach for handling this co-production is to use biophysical allocation for spent hens based on the proportion of total energy requirements for growth and egg production. Previous studies have shown that the choice of allocation method for spent hens from laying systems has only a minor effect on the reported environmental impacts of egg production (Wi-edemann and McGahan, 2011; Leinonen et al., 2012b)from cradle to gate, to quantify the environmental burdens per 1,000 kg of eggs produced in the 4 major hen-egg pro-duction systems in the United Kingdom: 1. Alternate methodological approaches for handling co-production at this stage include: economic or revenue allocation; protein mass for products edible by humans; and carcass and egg mass.
9.3.3 Allocation of manure / litter exported off-farm This discussion follows the decision tree presented above. The first determination that shall be made is the classification of manure as either a co-product, waste or residual. This results in a separation of the system where all post-farm emissions from use of the manure are assigned to that use, while all on-farm management is assigned to the main product(s) from the farm (live birds, eggs, or both) for which the previous allocation procedures apply.
Co-product: When manure is a valuable output of the farm, and if the system of manure production cannot be separated from the system of animal production, then the full supply chain emissions to the farm gate shall be shared by all the co-products. Following the recommendations provided in Figure 12, the first method for allocation is to apply a biophysical approach based on the energy for digestion
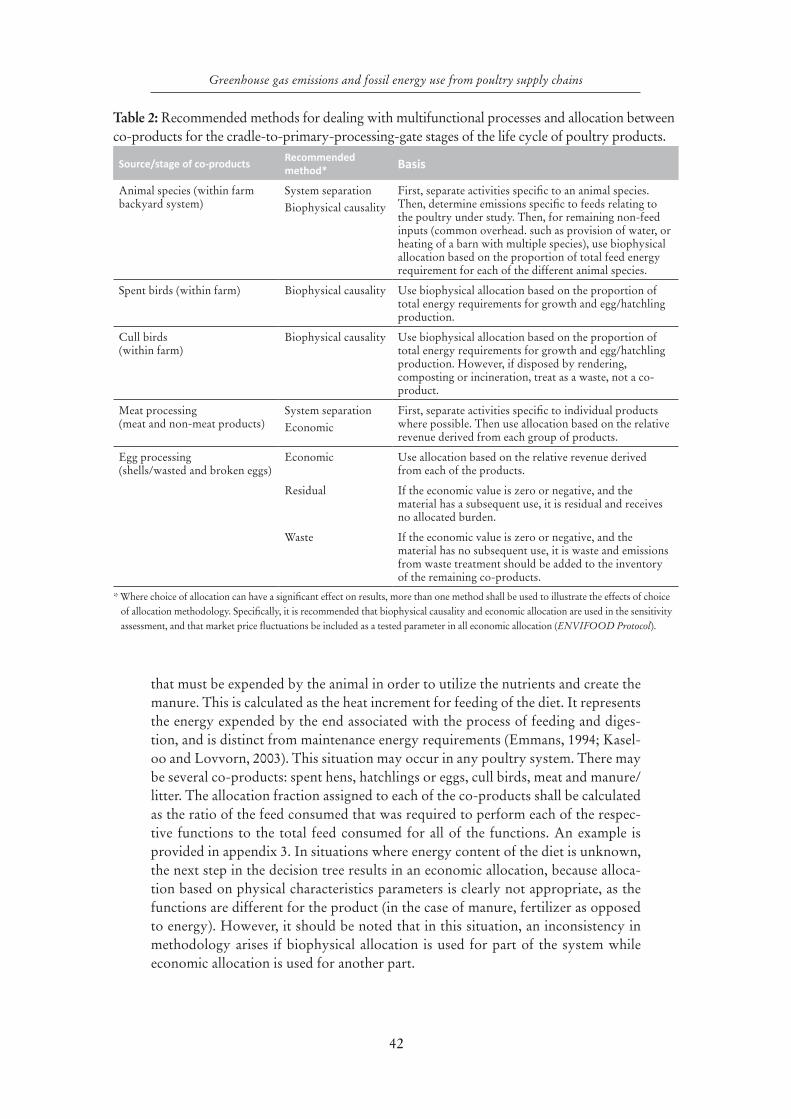
42
Greenhouse gas emissions and fossil energy use from poultry supply chains
that must be expended by the animal in order to utilize the nutrients and create the manure. This is calculated as the heat increment for feeding of the diet. It represents the energy expended by the end associated with the process of feeding and diges-tion, and is distinct from maintenance energy requirements (Emmans, 1994; Kasel-oo and Lovvorn, 2003). This situation may occur in any poultry system. There may be several co-products: spent hens, hatchlings or eggs, cull birds, meat and manure/litter. The allocation fraction assigned to each of the co-products shall be calculated as the ratio of the feed consumed that was required to perform each of the respec-tive functions to the total feed consumed for all of the functions. An example is provided in appendix 3. In situations where energy content of the diet is unknown, the next step in the decision tree results in an economic allocation, because alloca-tion based on physical characteristics parameters is clearly not appropriate, as the functions are different for the product (in the case of manure, fertilizer as opposed to energy). However, it should be noted that in this situation, an inconsistency in methodology arises if biophysical allocation is used for part of the system while economic allocation is used for another part.
Table 2: Recommended methods for dealing with multifunctional processes and allocation between co-products for the cradle-to-primary-processing-gate stages of the life cycle of poultry products.
Source/stage of co-productsRecommended method* Basis
Animal species (within farm backyard system)
System separation Biophysical causality
First, separate activities specific to an animal species. Then, determine emissions specific to feeds relating to the poultry under study. Then, for remaining non-feed inputs (common overhead. such as provision of water, or heating of a barn with multiple species), use biophysical allocation based on the proportion of total feed energy requirement for each of the different animal species.
Spent birds (within farm) Biophysical causality Use biophysical allocation based on the proportion of total energy requirements for growth and egg/hatchling production.
Cull birds (within farm)
Biophysical causality Use biophysical allocation based on the proportion of total energy requirements for growth and egg/hatchling production. However, if disposed by rendering, composting or incineration, treat as a waste, not a co-product.
Meat processing (meat and non-meat products)
System separationEconomic
First, separate activities specific to individual products where possible. Then use allocation based on the relative revenue derived from each group of products.
Egg processing (shells/wasted and broken eggs)
Economic Use allocation based on the relative revenue derived from each of the products.
Residual If the economic value is zero or negative, and the material has a subsequent use, it is residual and receives no allocated burden.
Waste If the economic value is zero or negative, and the material has no subsequent use, it is waste and emissions from waste treatment should be added to the inventory of the remaining co-products.
* Where choice of allocation can have a significant effect on results, more than one method shall be used to illustrate the effects of choice of allocation methodology. Specifically, it is recommended that biophysical causality and economic allocation are used in the sensitivity assessment, and that market price fluctuations be included as a tested parameter in all economic allocation (ENVIFOOD Protocol).
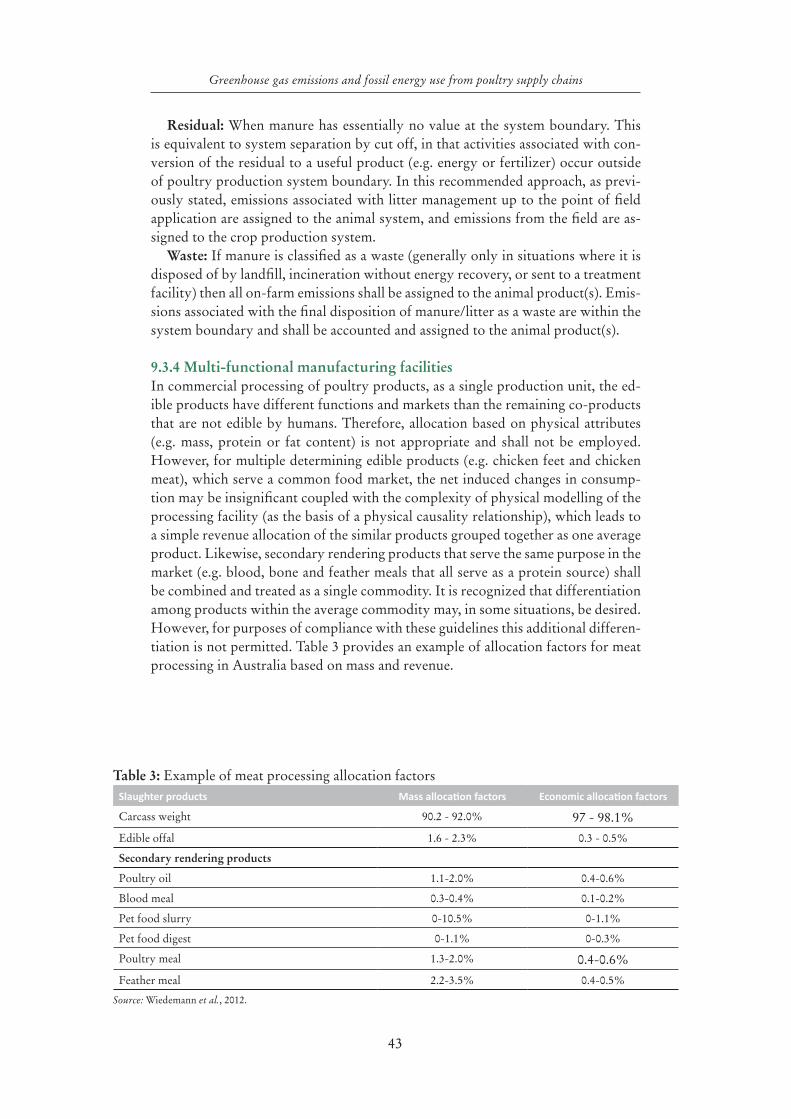
43
Greenhouse gas emissions and fossil energy use from poultry supply chains
Residual: When manure has essentially no value at the system boundary. This is equivalent to system separation by cut off, in that activities associated with con-version of the residual to a useful product (e.g. energy or fertilizer) occur outside of poultry production system boundary. In this recommended approach, as previ-ously stated, emissions associated with litter management up to the point of field application are assigned to the animal system, and emissions from the field are as-signed to the crop production system.
Waste: If manure is classified as a waste (generally only in situations where it is disposed of by landfill, incineration without energy recovery, or sent to a treatment facility) then all on-farm emissions shall be assigned to the animal product(s). Emis-sions associated with the final disposition of manure/litter as a waste are within the system boundary and shall be accounted and assigned to the animal product(s).
9.3.4 Multi-functional manufacturing facilitiesIn commercial processing of poultry products, as a single production unit, the ed-ible products have different functions and markets than the remaining co-products that are not edible by humans. Therefore, allocation based on physical attributes (e.g. mass, protein or fat content) is not appropriate and shall not be employed. However, for multiple determining edible products (e.g. chicken feet and chicken meat), which serve a common food market, the net induced changes in consump-tion may be insignificant coupled with the complexity of physical modelling of the processing facility (as the basis of a physical causality relationship), which leads to a simple revenue allocation of the similar products grouped together as one average product. Likewise, secondary rendering products that serve the same purpose in the market (e.g. blood, bone and feather meals that all serve as a protein source) shall be combined and treated as a single commodity. It is recognized that differentiation among products within the average commodity may, in some situations, be desired. However, for purposes of compliance with these guidelines this additional differen-tiation is not permitted. Table 3 provides an example of allocation factors for meat processing in Australia based on mass and revenue.
Table 3: Example of meat processing allocation factorsSlaughter products Mass allocation factors Economic allocation factors
Carcass weight 90.2 - 92.0% 97 - 98.1%Edible offal 1.6 - 2.3% 0.3 - 0.5%
Secondary rendering products
Poultry oil 1.1-2.0% 0.4-0.6%
Blood meal 0.3-0.4% 0.1-0.2%
Pet food slurry 0-10.5% 0-1.1%
Pet food digest 0-1.1% 0-0.3%
Poultry meal 1.3-2.0% 0.4-0.6%Feather meal 2.2-3.5% 0.4-0.5%
Source: Wiedemann et al., 2012.
44
Greenhouse gas emissions and fossil energy use from poultry supply chains
10. Compiling and recording inventory data
10.1 GENERAL PRINCIPLESThe compilation of the inventory data should be aligned with the goal and scope of the LCA. The LEAP guidelines are intended to provide LCA practitioners with prac-tical advice for a range of potential study objectives. This is in recognition of the fact that studies may wish to assess poultry supply chains ranging from individual farms, to integrated production systems, to regional, national, or sectoral levels. When eval-uating the data collection requirements for the project, it is necessary to consider the influence of the project scope. In general these guidelines recommend collection of primary activity data for foreground processes, those processes generally being con-sidered as under the control or direct influence of the study commissioner. However, it is recognized that for projects with a larger scope, such as sectoral analyses at the national scale, the collection of primary data for all foreground processes may be im-practical. In such situations, or when an LCA is conducted for policy analysis, fore-ground systems may be modelled using data obtained from secondary sources, such as national statistical databases, peer-reviewed literature or other reputable sources.
An inventory of all materials, energy resource inputs and outputs, including products, co-products and emissions, for the product supply chain under study shall be compiled. The data recorded in relation to this inventory shall include all processes and emissions occurring within the system boundary of that product.
As far as possible primary inventory data shall be collected for all resources used and emissions associated with each life cycle stage included within the defined sys-tem boundaries. For processes where the practitioner does not have direct access to primary data (background processes), secondary data can be used. When possible, data collected directly from suppliers should be used for the most relevant products they supply. If secondary data are more representative or appropriate than primary data for foreground processes (to be justified and reported), secondary data shall also be used for these foreground processes.
For agricultural systems, two main differences exist compared to industrial sys-tems. First, production may not be static from year to year, and second, some inputs and outputs are very difficult to measure. Consequently, the inventory stage of an agricultural LCA is far more complex than most industrial processes, and may re-quire extensive modelling to define the inputs and outputs of the system. For this reason, agricultural studies often rely on a far smaller sample size and are often presented as ‘case studies’ rather than ‘industry averages’. For agricultural systems, many foreground processes shall be modelled or estimated rather than measured. Assumptions made during the inventory development are critical to the results of the study and need to be carefully explained in the study methodology. To clarify the nature of the inventory data, it is useful to differentiate between ‘measured’ and ‘modelled’ foreground system LCI data. For a layer operation, measured fore-ground system data may include fuel use and bird numbers, while modelled fore-ground system data may include manure quantity and characteristics.
45
Greenhouse gas emissions and fossil energy use from poultry supply chains
The LCA practitioner shall demonstrate that the following aspects in data collec-tion have been taken into consideration when carrying out the assessment (adapted from ISO14044:2006):
•representativeness: qualitative assessment of the degree to which the data set reflects the true population of interest. Representativeness covers the follow-ing three dimensions:a. temporal representativeness: age of data and the length of time over which
data was collected;b. geographical representativeness: geographical area from which data for unit
processes was collected to satisfy the goal of the study;c. technology representativeness: specific technology or technology mix;
•precision: measure of the variability of the data values for each data expressed (e.g. standard deviation);
•completeness: percentage of flow that is measured or estimated;•consistency: qualitative assessment of whether the study methodology is
applied uniformly to the various components of the analysis;•reproducibility: qualitative assessment of the extent to which information
about the methodology and data values would allow an independent practi-tioner to reproduce the results reported in the study;
•sources of the data; •uncertainty of the information (e.g. data, models and assumptions).For significant processes, the LCA practitioner shall document data sources, data
quality and any efforts made to improve data quality.
10.2 REQUIREMENTS AND GUIDANCE FOR THE COLLECTION OF DATATwo types of data may be collected and used in performing LCAs:
•Primary data: defined as directly measured or collected data representative of processes at a specific facility or for specific processes within the product supply chain.
•Secondary data: defined as information obtained from sources other than direct measurement of the inputs and outputs (or purchases and emissions) from pro-cesses included in the life cycle of the product (PAS 2050:2011, 3.41). Second-ary data are used when primary data of higher quality are not available or it is impractical to obtain. Some emissions, such as methane from litter management, are calculated from a model, and are therefore considered secondary data.
For projects where significant primary data is to be collected, a data management plan is a valuable tool for managing data and tracking the process of the LCI data set creation, including metadata documentation. The data management plan should include (WRI and WBCSD, 2011b, Appendix C):
•description of data collection procedures;•data sources;•calculation methodologies;•data transmission, storage and backup procedures; and •quality control and review procedures for data collection, input and handling
activities, data documentation and emissions calculations.The recommended hierarchy of criteria for acceptance of data is: •primary data collected as part of the project that have a documented Quality
Assessment (Section 11.3);
46
Greenhouse gas emissions and fossil energy use from poultry supply chains
•data from previous projects that have a documented Quality Assessment; •data published in peer-reviewed journals or from generally accepted LCA
databases, such as those described by the Database Registry project of the UNEP/SETAC Life Cycle Initiative;
•data presented at conferences or otherwise publicly available (e.g. internet sources); and
•data from industrial studies or reports.
10.2.1 Requirements and guidance for the collection of primary dataIn general, primary data shall, to the fullest extent feasible, be collected for all fore-ground processes and for the main contributing sources of GHG emissions. Fore-ground processes, here defined as those processes under the direct control of, or significantly influenced by, the study commissioner, are depicted in Figure 10 and Figure 11 within the boundaries denoted as a ‘Production’, ‘Processing’ and ‘By-product management’. Some foreground processes are impractical to measure for an LCA (e.g. methane emissions from litter management). In cases like this, when a model is used to estimate the emission, the input data used for the model shall be measured. In practice, this means that for farm-level studies, the ration and its char-acteristics as well as the observed feed conversion ratio are required to provide es-timates of the volatile solids and nitrogen content of the litter, which in turn can be used to estimate the methane and nitrous oxide emissions from litter management.
For most large-scale systems, the production of the ration may be considered a background process, while for many small-scale systems, it may be fully integrated into the production system. In addition, the breeding system, from great-grandpar-ents through parents, may be considered a background operation for most production systems. Appendix 1 provides secondary data from the literature for the background breeding system. Clearly, for analyses of the breeding system itself, these operations would be considered in the foreground, and primary data shall be obtained.
The practicality of measured data for all foreground processes is also related to the scale of the project. For example, if a national-scale evaluation of the poultry sector is planned, it is impractical to collect farm-level data from all poultry pro-ducers. In these cases, aggregated data from national statistical databases or other sources (e.g. trade organizations) may be used for foreground processes. In every case, clear documentation of the data collection process and data quality documen-tation to ensure compatibility with the study goal and scope shall be incorporated into the report.
It is known from prior work (Appendix 2) what the hotspots are, thus second-ary data for these stages of the supply chain should not be used. Specifically in the poultry sector, the major cereal and protein grains shall be representative of the actual production used for the region under study. Macleod et al. (2013) report that, globally, for chicken meat, feed production contributes 78 percent of emissions, direct on-farm energy use 8 percent, post-farm processing and transport of meat 7 percent and manure storage and processing 6 percent. They report that for eggs, feed production contributes 69 percent of emissions, direct on-farm energy use 4 percent, post-farm processing and transport of meat 6 percent and manure storage and processing 20 percent. The local conditions relevant to manure management emissions shall be considered. Workbooks that provide a template for primary data collection are included as Appendix 1.
47
Greenhouse gas emissions and fossil energy use from poultry supply chains
10.2.2 Requirements and guidance for the collection and use of secondary dataSecondary data refers to LCI data sets generally available from existing third-party databases, government or industry association reports, peer-reviewed literature or other sources. It is normally used for background system processes, such as elec-tricity or diesel fuel, which may be consumed by foreground system processes. When using secondary data it is necessary to selectively choose the data sets that will be incorporated into the analysis. Specifically, LCI for goods and services con-sumed by the foreground system should be geographically and technically relevant. An assessment of the quality of these data sets (Section 10.2.3) for use in the specific application should be made and included in the documentation of the data quality analysis.
Where primary data are unavailable and where inputs or processes make a mi-nor contribution to total environmental impacts, secondary or default data may be used. However, geographic relevance should be considered. For example, if default data are used for a minor input, such as a pesticide, the source of production should be determined and a transportation component added to the estimated emissions to account for its delivery from site of production to site of use. Similarly, where there is an electricity component related to an input, an electricity emission factor for the country or site of use should be used that accounts for the energy grid mix.
In all cases, given the known importance of the contribution of the ration to the environmental impacts of poultry production, it is imperative that secondary data used for the ration be relevant to the supply chain under study. For exam-ple, in evaluating a broiler production system in China, the use of proxy LCI for maize produced in the United States would only be suitable as secondary data if it is known that the operation being studied imports its maize from the United States.
Secondary data should only be used for foreground processes if primary data are unavailable, if the process is not environmentally significant, or if the goal and scope permit secondary data from national databases or equivalent sources. All sec-ondary data should satisfy the following requirements:
•They shall be as current as possible and collected within the past 5-7 years. However, if only older data is available, documentation of the data quality is necessary and determination of the sensitivity of the study results to these data shall be investigated and reported.
•They should be used only for processes in the background system. When available, sector-specific data shall be used instead of proxy LCI data.
•They shall fulfil the data quality requirements specified in this guide (Section 3.4).
•They should, where available, be sourced following the data sources provided in this guide (e.g. Section 11.2.2 for animal assessment and in Appendices 1 and 3.
•They may only be used for foreground processes if specific data are unavail-able or the process is not environmentally significant. However, if the quality of available specific data is considerably lower, and the proxy or average data sufficiently represents the process, then proxy data shall be used.
An assessment of the quality of these data sets for use in the specific application should be made and included in the documentation of the data quality analysis.
48
Greenhouse gas emissions and fossil energy use from poultry supply chains
10.2.3 Approaches for addressing data gaps in LCIData gaps exist when there is no primary or secondary data available that are suf-ficiently representative of the given process in the product’s life cycle. LCI data gaps can result in inaccurate and erroneous results (Reap et al., 2008). When missing LCI data is set to zero, the result is biased towards lower environmental impacts (Huijbregts et al., 2001).
Several approaches have been used to bridge data gaps, but none are considered standard LCA methodology (Finnveden et al., 2009). As much as possible, the LCA practitioner shall attempt to fill data gaps by collecting the missing data. However, data collection is time-consuming, expensive and often not feasible. This section provides additional guidance on filling data gaps with proxy and estimated data, and is primarily targeted at LCA practitioners. Proxy data is never recommended for use in foreground systems as discussed elsewhere in this guidance.
The use of proxy data sets, i.e. LCI data sets that are the most similar to a pro-cess or product for which data is available, is common. This technique relies on the practitioner’s judgment, and is therefore, arguably, arbitrary (Huijbregts et al., 2001). Using the average of several proxy data sets, instead of a single data set, has been suggested as a means to reduce uncertainty as has bridging data gaps by ex-trapolating from another related data set (Mila i Canals et al., 2011). For example, data from broiler production could be extrapolated to turkey production based on expert knowledge of differences in feed requirements, feed conversion ratios and excreta characteristics. While the use of proxy data sets is the simplest solution, it also has the highest uncertainty. Extrapolation methods require expert knowledge and are more difficult to apply, but provide more accurate results.
For countries where environmentally extended economic input-output tables have been produced, a hybrid approach can also be used to bridge data gaps. In this approach, the monitor value of the missing input is analysed through the input-output tables and then used as a proxy LCI data set. This approach is subject to uncertainty and has been criticised (Finnveden et al., 2009).
Any data gaps shall be filled using the best available secondary or extrapolated data. The contribution of such data, including gaps in secondary data, shall not ac-count for more than 20 percent of the overall contribution to each emission factor impact category considered. When such proxy data are utilized it shall be reported and justified. When possible, an independent peer review of proxy data sets by ex-perts should be sought, especially when they approach the 20 percent cut-off point of overall contribution to each emission factor, as errors in extrapolation at this point can be significant. Panel members should have sufficient expertise to cover the breadth of LCI data that is being developed from proxy data sets.
In line with the guidance on data quality assessment, any assumptions made in filling data gaps, along with the anticipated effect on the product inventory final results, shall be documented. If possible, the use of such gap-filling data should be accompanied by data quality indicators, such as a range of values or statistical measures that convey information about the possible error associated with using the chosen method.
49
Greenhouse gas emissions and fossil energy use from poultry supply chains
10.3 DATA QUALITY ASSESSMENTLCA practitioners shall assess data quality by using data quality indicators. Gener-ally, data quality assessment can indicate how representative the data are as well as their quality. Assessing data quality is important for a number of reasons. It improves the inventory’s data content for the proper communication and interpretation of re-sults, and informs users about the possible uses of the data. Data quality refers to characteristics of data that relate to their ability to satisfy stated requirements (ISO 14040:2006). Data quality covers various aspects, such as technological, geographical and temporal representativeness, as well as the completeness and precision of the in-ventory data. This section describes how the data quality shall be assessed.
10.3.1 Data quality rulesCriteria for assessing LCI data quality can be structured by representativeness (tech-nological, geographical and temporal), completeness regarding the impact category coverage in the inventory, precision and uncertainty of the collected or modelled in-ventory data, and methodological appropriateness and consistency. Representative-ness addresses how well the collected inventory data represents the ‘true’ inventory of the process for which they are collected regarding technology, geography and time. For data quality, the representativeness of the LCI data is a key component, and primary data gathered shall adhere to the data quality criteria of technological, geographical and temporal representativeness. Table 4 presents a summary of selected requirements for data quality. Any deviations from the requirements shall be docu-mented. Data quality requirements shall apply to both primary and secondary data. For LCA studies using actual farm data and targeted at addressing farmer behaviour, ensuring that farms surveyed are representative and the data collected is of good qual-ity and well managed is more important than a detailed uncertainty assessment.
103.2 Data quality indicatorsData quality indicators define the standard for the data to be collected. These stan-dards relate to issues such as representativeness, age and system boundaries. During the data collection process, data quality of activity data, emission factors, and/or direct emissions data shall be assessed using the data quality indicators.
Data collected from primary sources should be checked for validity by ensuring consistency of units for reporting and conversion, as well as material balances to ensure that, for example, all incoming materials are accounted in products leaving the processing facility.
Table 4: Overview of selected requirements for data qualityIndicator Requirements/data quality rules
Technological representativeness
The data gathered shall represent the processes under consideration.
Geographical representativeness:
If multiple units are under consideration for the collection of primary data, the data gathered shall, at a minimum, represent a local region, such as EU-27.Data should be collected respecting geographic relevance to the defined goal and scope of the analysis.
Temporal representativeness
Primary data gathered shall be representative for the past three years and 5-7 years for secondary data sources.The representative time period on which data is based shall be documented.
50
Greenhouse gas emissions and fossil energy use from poultry supply chains
Secondary data for background processes can be obtained from different sources (e.g. the ecoinvent database). In this situation, the data quality information provid-ed by the database manager should be evaluated to determine if it requires modifi-cation for the study underway (e.g. if the use of European electricity grid processes in other areas will increase the uncertainty of those unit processes).
10.4 UNCERTAINTY ANALYSIS AND RELATED DATA COLLECTION Data with high uncertainty can negatively impact the overall quality of the inven-tory. The collection of data for the uncertainty assessment and understanding un-certainty is crucial for the proper interpretation of results (Section 12) and reporting and communication (Section 12.4). The Product life cycle accounting and reporting standard provides additional guidance on quantitative uncertainty assessment that includes a spreadsheet to assist in the calculations.
The following guidelines shall apply for all studies intended for distribution to third parties and should be followed for internal studies intended for process im-provement:
•small whenever data are gathered, data should also be collected for the uncer-tainty assessment.
•small gathered data should be presented as a best estimate or average value, with an uncertainty indication in the form a standard deviation (where plus and minus twice the standard deviation indicates the 95 percent confidence interval) and an assessment if data follow a normal distribution.
•small when a large set of data is available, the standard deviation should be calculated directly from this data. For single data points, the bandwidth shall be estimated. In both cases, the calculations or assumptions for estimates shall be documented.
10.4.1 Secondary activity dataSee Section 10.2.2 and Appendix 1.
10.4.2 Default/proxy dataSee Section 10.2.2 and Appendix 1.
10.4.3 Inter- and intra-annual variability in emissions Agricultural processes are highly susceptible to year-to-year variations in weather patterns. This is particularly true for crop yields, but these variations may also affect feed conversion ratios when environmental conditions are severe enough to have an impact on an animal’s performance. Depending on the goal and scope definition for the study, additional information may be warranted to capture and identify either seasonal or inter-annual variability in the efficiency of the product system.
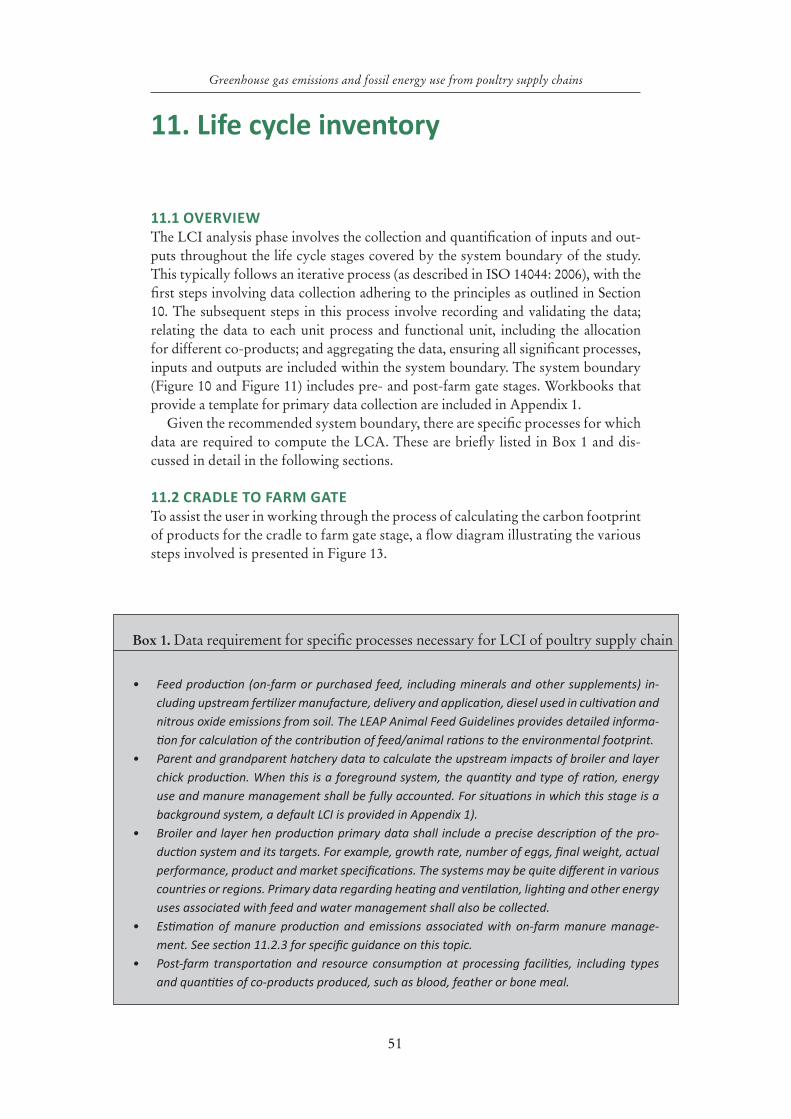
51
Greenhouse gas emissions and fossil energy use from poultry supply chains
11. Life cycle inventory
11.1 OVERVIEWThe LCI analysis phase involves the collection and quantification of inputs and out-puts throughout the life cycle stages covered by the system boundary of the study. This typically follows an iterative process (as described in ISO 14044: 2006), with the first steps involving data collection adhering to the principles as outlined in Section 10. The subsequent steps in this process involve recording and validating the data; relating the data to each unit process and functional unit, including the allocation for different co-products; and aggregating the data, ensuring all significant processes, inputs and outputs are included within the system boundary. The system boundary (Figure 10 and Figure 11) includes pre- and post-farm gate stages. Workbooks that provide a template for primary data collection are included in Appendix 1.
Given the recommended system boundary, there are specific processes for which data are required to compute the LCA. These are briefly listed in Box 1 and dis-cussed in detail in the following sections.
11.2 CRADLE TO FARM GATE To assist the user in working through the process of calculating the carbon footprint of products for the cradle to farm gate stage, a flow diagram illustrating the various steps involved is presented in Figure 13.
Box 1. Data requirement for specific processes necessary for LCI of poultry supply chain
• Feed production (on-farm or purchased feed, including minerals and other supplements) in-cluding upstream fertilizer manufacture, delivery and application, diesel used in cultivation and nitrous oxide emissions from soil. The LEAP Animal Feed Guidelines provides detailed informa-tion for calculation of the contribution of feed/animal rations to the environmental footprint.
• Parent and grandparent hatchery data to calculate the upstream impacts of broiler and layer chick production. When this is a foreground system, the quantity and type of ration, energy use and manure management shall be fully accounted. For situations in which this stage is a background system, a default LCI is provided in Appendix 1).
• Broiler and layer hen production primary data shall include a precise description of the pro-duction system and its targets. For example, growth rate, number of eggs, final weight, actual performance, product and market specifications. The systems may be quite different in various countries or regions. Primary data regarding heating and ventilation, lighting and other energy uses associated with feed and water management shall also be collected.
• Estimation of manure production and emissions associated with on-farm manure manage-ment. See section 11.2.3 for specific guidance on this topic.
• Post-farm transportation and resource consumption at processing facilities, including types and quantities of co-products produced, such as blood, feather or bone meal.
52
Greenhouse gas emissions and fossil energy use from poultry supply chains
At the cradle to farm gate stage, previous research has shown that the largest source of GHG emissions is feed production (Wiedemann and McGahan, 2011; Wiedemann et al., 2012; Leinonen et al., 2012a; 2012b). Manure management also contributes to emissions, and is directly related to feed quality and the quantity of feed consumed. Clearly, an important first step is to define the feed types used and their feed quality characteristics.
The cradle to farm gate stage can be separated into three main processes of raw material acquisition, water and feed production, and their use for animal produc-tion. Most raw material acquisition is associated with the production of feeds. Note that these guidelines provide limited information related to poultry feeds as these are covered in the LEAP Animal Feed Guidelines. Thus, poultry feed information presented in this document is largely for context and because of the strong linkages between feeds and animal production. For animal feeds derived from annual and perennial plant types, the inputs of fertilizers, manures and lime are often signifi-cant sources of GHG emissions. When annual crops are used for feed, the fuel (e.g. for tillage, harvest and transport), crop residues (that produce nitrous oxide emis-sions) and land-use change components are also important contributors to GHG emissions. For highly processed feeds (e.g. compound feed and concentrates) there may also be significant energy use and emissions during their processing and stor-age. Readers are referred to the LEAP Animal Feed Guidelines for detailed guid-ance for estimating the cradle-to-beak impact of the ration.
Supplying water to animals is essential for their survival, and energy inputs are often required for the provision of water (e.g. for pumping and circulation) and/or its transport. Background processes from existing databases can be used when water is purchased from a municipal source. If local well water is used, the pumping power can be estimated with the following equation:
Ph = q.ρ.g.h/(3.6e6) (1)
Where Ph = fluid power (kW), q = pumping rate (m3/h), ρ = fluid density (1 000 kg/m3 for water), g = gravity (9.8m/s2), h = differential head (m), which is approxi-mately the depth of the well plus the additional elevation necessary to deliver the water to the birds. The power required for the motor is the fluid power divided by the motor efficiency, η, typically 60-70 percent:
P= P_h/η (2)
For electric pumps, the total energy consumption is estimated as P*pumping hours.There is also a small contribution to resource use and GHG emissions associated
with the production and provision of animal health inputs, which may include treat-ments for infectious diseases, internal and external parasites, reproductive and meta-bolic diseases, and mineral deficiencies. These materials are likely below the material-ity cut off and can be estimated using secondary or proxy data from extant databases.
11.2.1 Feed assessmentThis section refers to identifying the type, quantity and characteristics of feed, which relates to both upstream impacts (the domain of the LEAP Animal Feed Guidelines) and downstream impacts from manure management, which is the domain of this
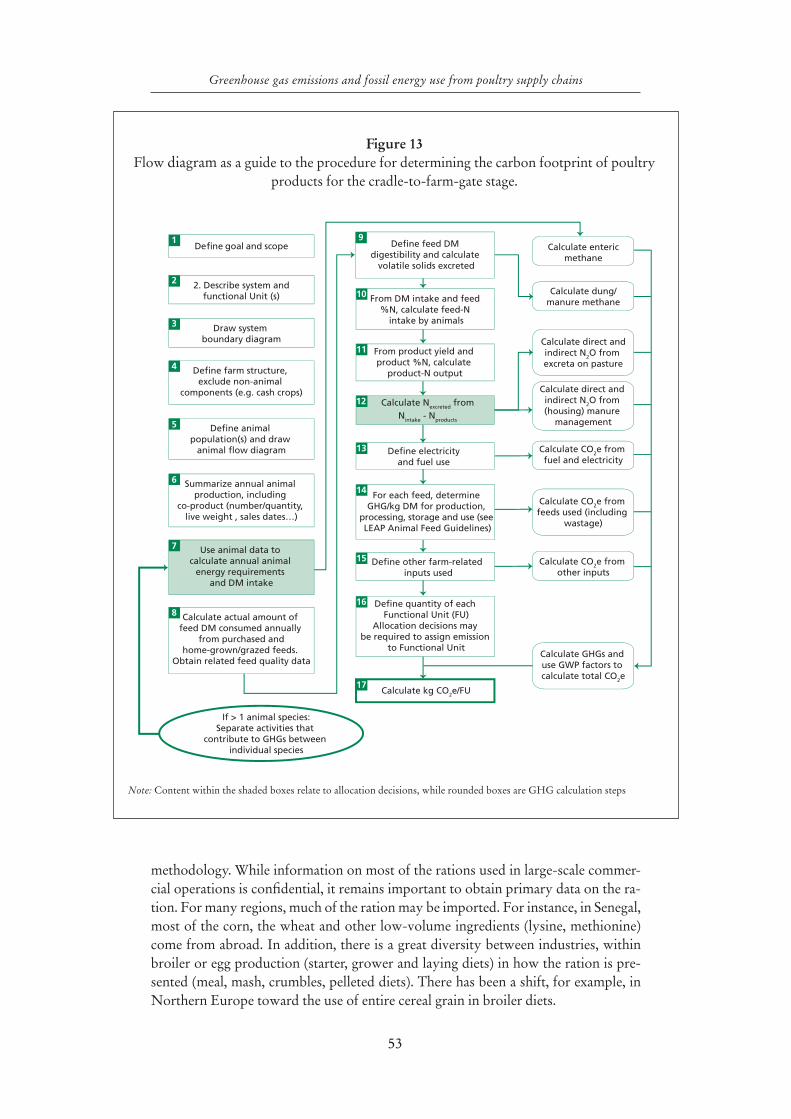
53
Greenhouse gas emissions and fossil energy use from poultry supply chains
Figure 13 Flow diagram as a guide to the procedure for determining the carbon footprint of poultry
products for the cradle-to-farm-gate stage.
Note: Content within the shaded boxes relate to allocation decisions, while rounded boxes are GHG calculation steps
Define goal and scope
2. Describe system andfunctional Unit (s)
Draw system boundary diagram
Define farm structure, exclude non-animal
components (e.g. cash crops)
Define animal population(s) and draw
animal flow diagram
Summarize annual animal production, including
co-product (number/quantity, live weight , sales dates…)
Use animal data to calculate annual animal
energy requirements and DM intake
If > 1 animal species: Separate activities that
contribute to GHGs between individual species
Calculate actual amount of feed DM consumed annually
from purchased andhome-grown/grazed feeds.
Obtain related feed quality data
Define feed DM digestibility and calculate
volatile solids excreted
From DM intake and feed %N, calculate feed-N
intake by animals
From product yield and product %N, calculate
product-N output
Calculate Nexcreted fromNintake - Nproducts
Define electricity and fuel use
For each feed, determine GHG/kg DM for production,
processing, storage and use (see LEAP Animal Feed Guidelines)
Define other farm-related inputs used
Define quantity of each Functional Unit (FU)
Allocation decisions may be required to assign emission
to Functional Unit
Calculate direct andindirect N2O from excreta on pasture
Calculate CO2e from fuel and electricity
Calculate CO2e from feeds used (including
wastage)
Calculate CO2e from other inputs
Calculate GHGs and use GWP factors to calculate total CO2e
Calculate entericmethane
Calculate kg CO2e/FU
Calculate direct and indirect N2O from (housing) manure
management
Calculate dung/manure methane
1
2
3
4
5
6
7
8
12
9
10
11
13
14
15
16
17
methodology. While information on most of the rations used in large-scale commer-cial operations is confidential, it remains important to obtain primary data on the ra-tion. For many regions, much of the ration may be imported. For instance, in Senegal, most of the corn, the wheat and other low-volume ingredients (lysine, methionine) come from abroad. In addition, there is a great diversity between industries, within broiler or egg production (starter, grower and laying diets) in how the ration is pre-sented (meal, mash, crumbles, pelleted diets). There has been a shift, for example, in Northern Europe toward the use of entire cereal grain in broiler diets.
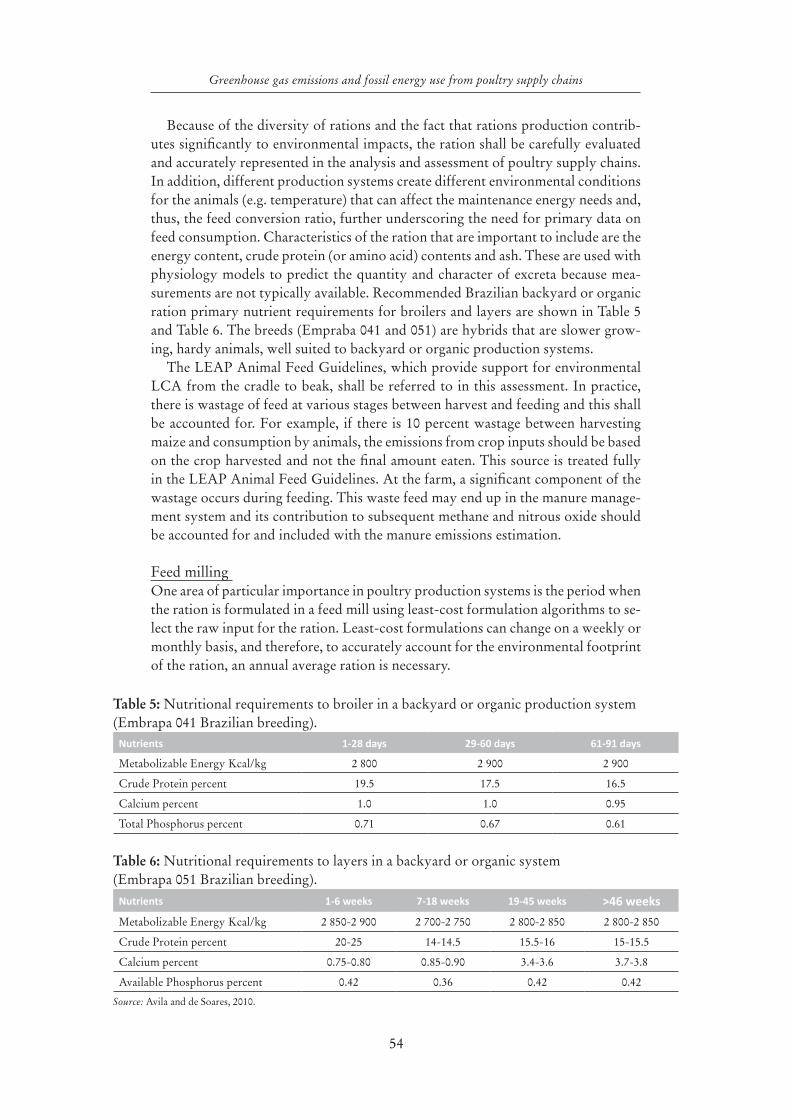
54
Greenhouse gas emissions and fossil energy use from poultry supply chains
Because of the diversity of rations and the fact that rations production contrib-utes significantly to environmental impacts, the ration shall be carefully evaluated and accurately represented in the analysis and assessment of poultry supply chains. In addition, different production systems create different environmental conditions for the animals (e.g. temperature) that can affect the maintenance energy needs and, thus, the feed conversion ratio, further underscoring the need for primary data on feed consumption. Characteristics of the ration that are important to include are the energy content, crude protein (or amino acid) contents and ash. These are used with physiology models to predict the quantity and character of excreta because mea-surements are not typically available. Recommended Brazilian backyard or organic ration primary nutrient requirements for broilers and layers are shown in Table 5 and Table 6. The breeds (Empraba 041 and 051) are hybrids that are slower grow-ing, hardy animals, well suited to backyard or organic production systems.
The LEAP Animal Feed Guidelines, which provide support for environmental LCA from the cradle to beak, shall be referred to in this assessment. In practice, there is wastage of feed at various stages between harvest and feeding and this shall be accounted for. For example, if there is 10 percent wastage between harvesting maize and consumption by animals, the emissions from crop inputs should be based on the crop harvested and not the final amount eaten. This source is treated fully in the LEAP Animal Feed Guidelines. At the farm, a significant component of the wastage occurs during feeding. This waste feed may end up in the manure manage-ment system and its contribution to subsequent methane and nitrous oxide should be accounted for and included with the manure emissions estimation.
Feed milling One area of particular importance in poultry production systems is the period when the ration is formulated in a feed mill using least-cost formulation algorithms to se-lect the raw input for the ration. Least-cost formulations can change on a weekly or monthly basis, and therefore, to accurately account for the environmental footprint of the ration, an annual average ration is necessary.
Table 5: Nutritional requirements to broiler in a backyard or organic production system (Embrapa 041 Brazilian breeding).
Nutrients 1-28 days 29-60 days 61-91 days
Metabolizable Energy Kcal/kg 2 800 2 900 2 900
Crude Protein percent 19.5 17.5 16.5
Calcium percent 1.0 1.0 0.95
Total Phosphorus percent 0.71 0.67 0.61
Table 6: Nutritional requirements to layers in a backyard or organic system (Embrapa 051 Brazilian breeding).
Nutrients 1-6 weeks 7-18 weeks 19-45 weeks >46 weeks
Metabolizable Energy Kcal/kg 2 850-2 900 2 700-2 750 2 800-2 850 2 800-2 850
Crude Protein percent 20-25 14-14.5 15.5-16 15-15.5
Calcium percent 0.75-0.80 0.85-0.90 3.4-3.6 3.7-3.8
Available Phosphorus percent 0.42 0.36 0.42 0.42
Source: Avila and de Soares, 2010.
55
Greenhouse gas emissions and fossil energy use from poultry supply chains
In addition, poultry nutritionists require specific nutrient composition of the ra-tion. Milling processes can change characteristics of feeds, specifically, their digest-ibility and potentially crude protein content. It is therefore important to determine that the ration specified in the LCA matches both the poultry nutrition require-ments, and that the milling process model, chosen from LEAP Animal Feed Guide-lines, is appropriate to provide the required ration characteristics. Careful reference to the LEAP Animal Feed Guidelines is important to assure that appropriate feed burdens are captured for the system under study. It may occur that a more expen-sive formulation results in lower excretion and GHG emissions, and the cost of environmental management will be decreased.
Computing emissions To the extent feasible, emissions from the ration should be calculated based on guid-ance in the LEAP Animal Feed Guidelines. For most large-scale operations, ra-tions represent a significant fraction of the environmental footprint, and therefore it is critical that the emissions accurately represent the actual production practices followed for their creation. Specifically, the source of the feed (local, regional or imported) shall be representative of the feeds provided. When feeds are imported, it is necessary to follow the protocol in the LEAP Animal Feed Guidelines to calcu-late the environmental burden of production and delivery to the exporting country port. The estimate of specific transport distances, from the exporting to importing country shall be accounted as specified in the LEAP Animal Feed Guidelines docu-mentation. These emissions can be combined directly with production and post-farm emissions to calculate the supply chain totals. In practice, most diet decisions are based on least-cost formulation. However, an LCA could illustrate the emission impacts made by changes to rations. In some cases, it is more cost effective to have a slightly less efficient feed conversion.
11.2.2 Animal population and productionMost models used for the calculation of feed requirements derive intake from the energy requirements for growth, reproduction, egg production and maintenance. This requires data on relevant animal numbers and productivity. Information re-garding mortality losses and the number of live birds or eggs produced over a year is necessary for baseline evaluation. Specific information requirements will depend on the facility type, grandparent and parent production, and the specific type of pro-duction under study (e.g. large-scale versus small-scale or caged versus free range).
To account for total GHG emissions over a one-year time period, it is necessary to define the animal population associated with the production of the products. This requires accounting for breeding poultry, pullet or broiler replacement for each barn production cycle, and spent hens that are not required for maintenance of the flock and sold for meat. The benefit of having a methodology and primary seasonal or monthly data is that the effects of improvement in animal productiv-ity on reducing the carbon footprint of products can be determined; e.g. achieving the market weight earlier means less feed is consumed and the maintenance feed requirement is reduced relative to the feed needed to achieve a given level of animal production.
56
Greenhouse gas emissions and fossil energy use from poultry supply chains
Animal enteric methane emissions According to the IPCC, insufficient information exists regarding enteric methane emissions from poultry (IPPC, 2006, Volume 4, Chapter 10). However, two studies, from Taiwan and Malaysia report enteric methane from poultry ranging from 0.015 to 2 g methane/head/year (Wang and Huang, 2005; Yusuf and Noor, 2012), which should be used as default emission factors.
11.2.3 Manure production and managementBiological principlesFrom an animal physiology perspective, the characteristics of the excreta are de-fined by the characteristics of the ration and the efficiency of its conversion into the product of interest (meat or eggs). The digestibility and ash content that char-acterize the fraction of the ration that is not available to support metabolic needs are particularly relevant. The crude protein content of the ration and the protein deposition rate define the nitrogen content in the excreta. Poultry litter may have additional material such as straw added (with additional carbon, phosphorus and nitrogen), which affects the emissions from the subsequent management system.
Manure productionThe first step to estimating manure GHG emissions is to estimate manure excre-tion and specifically, the mass of volatile solids (VS) and nitrogen (N) excreted in manure. Manure volatile solids and nitrogen excretion may be estimated by using information collected from poultry producers, i.e. daily feed intake and the proper-ties of the diet, or by applying the default excretion values for poultry (ASAE, 2005; IPCC, 2006, Volume 4, Chapter 10).
For non-laying hens, nitrogen excretion is calculated by:
NE-PH =FIPH.CCP (1-NRF) ≡ g N⁄phase (3)
6.25
Where: NE-PH = Nitrogen excretion per bird-phase, breeding, hatchery, or broil-er (grams of nitrogen per bird-phase); FIPH = Feed intake per bird-phase. (as fed); CCP = Concentration of crude protein of total ration (as fed); NRF = retention factor for nitrogen (fraction dietary nitrogen retained in bird– broilers: 0.602; turkey toms and hens: 0.588 (ASAE, 2005). Equation 1 shall be summed over all the growth phases over the course of one year’s operation.
For laying hens not gaining body weight, nitrogen excretion may be calculated by:
NE-PH =FI.CCP ((0.0182 EGGwt)(EGGprod)) ≡ g N⁄day (4)
6.25
Where: NE = total nitrogen excretion per hen per day (grams nitrogen per hen per day); FI = Feed intake per day (as fed); CCP = Concentration of crude protein of total ration (g of protein/ g of feed (as fed)); Eggwt = Egg weight (grams – typi-cal 60g for light layer strains and 63g for heavy layer strains); Eggprod = Number of eggs that are produced per day (eggs / hen / day – typical value, 0.8 (ASAE, 2005). Annual excretion shall be estimated from the animal population, excretion per bird per day and 365 days/year.
57
Greenhouse gas emissions and fossil energy use from poultry supply chains
Volatile solids excretion (kg) may be predicted using the feed intake, digestibility of the diet and ash content in the manure using the following formula:
VS = FIPH (1 - DMD)(1 - A) ≡ Kg VS N⁄phase (5)
Where: FIPH = Feed intake per bird-phase (kg, as fed); DMD = Diet digestibility expressed as a fraction (default value of 0.8); A = Ash content of manure (default value approx. 0.1). Volatile solids shall be summed across all production phases dur-ing one year’s operation.
Manure management systemsManure emissions shall be estimated at each point in the manure management sys-tem following a mass balance approach. Emission sources are shown in Figure 14 for chicken production utilizing housing systems. Two factors relating to the flow of spent litter are required: i) a partitioning factor between directly applied spent litter and stored spent litter; and ii) a partitioning factor between spent litter applied in regions susceptible to leaching and runoff.
a) Housing emissions – MethaneManure methane) emissions may be estimated using the following general formula:
CH4 = VS (BO) (MCF) (ρ) ≡ Kg CH4 ⁄day (6)
Where: VS = volatile solids excretion (kg/day); Bo = emissions potential - m3 CH4/kg VS (provided in IPCC – (IPCC, 2006, Volume 4, Chapter 10) – 0.36 for developed countries); MCF = Integrated methane conversion factor (default value of 1.5-2 percent for poultry housed on litter); ρ = density of methane (0.662 kg CH4/m3).
b) Housing emissions – Nitrous OxideDirect nitrous oxide emissions from manure management in the shed can be calcu-lated by:
N2O = NE (EFMMS) ( 44 ) ≡ Kg N2O ⁄day (7)28
Where: N2O = Nitrous oxide emissions from manure management (kg/day); NE = nitrogen excretion (kg/day – if nitrogen excretion is based on equation (3), then the N2O emissions will be per phase rather than per day); EFMMS = the emission factor for the relevant manure management system; the factor 44/28 is to convert mass of N2O-N to mass of N2O. If multiple management systems are used, or if the nitro-gen excretion varies significantly throughout the year, then these factors shall be ac-counted in the analysis. This formula is sensitive to the estimated nitrogen excretion and the emission factor applied. Recommended emission factors from the IPCC are reported in Table 7.
Free-range poultry systems use a different manure management system and re-quire different emission factors. In the free-range system, a proportion of manure is deposited indoors on litter or slats and the remainder is deposited outdoors.
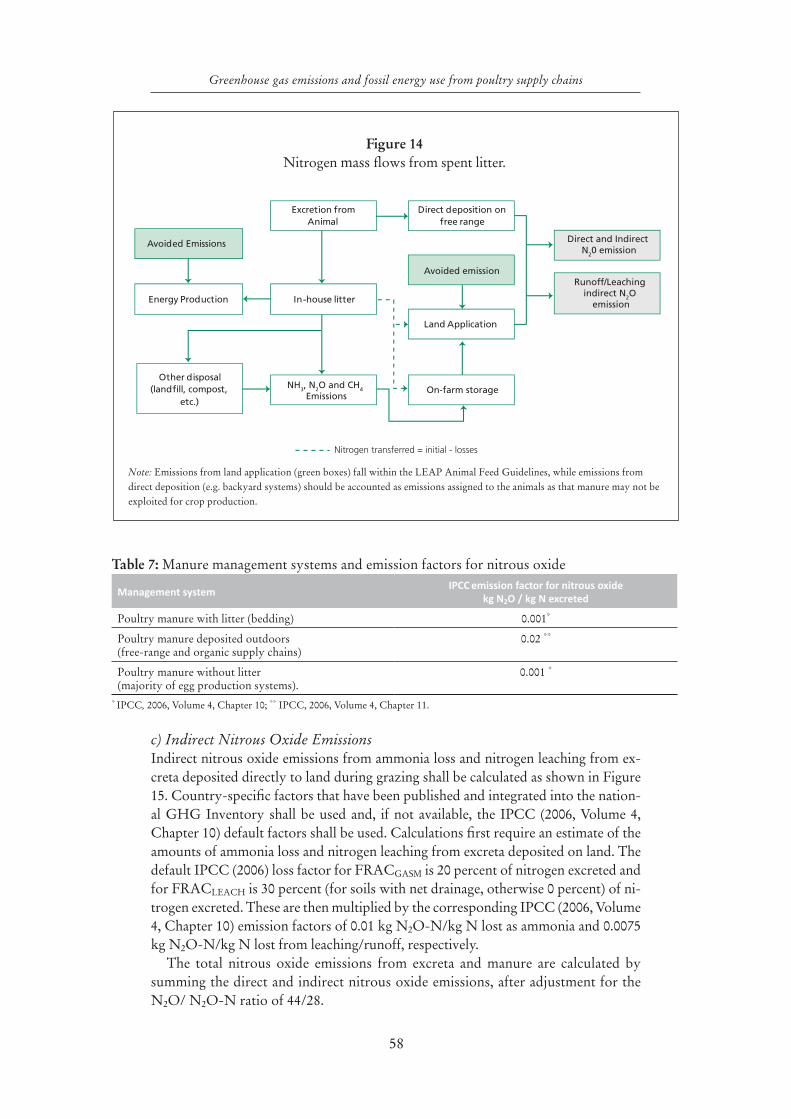
58
Greenhouse gas emissions and fossil energy use from poultry supply chains
c) Indirect Nitrous Oxide EmissionsIndirect nitrous oxide emissions from ammonia loss and nitrogen leaching from ex-creta deposited directly to land during grazing shall be calculated as shown in Figure 15. Country-specific factors that have been published and integrated into the nation-al GHG Inventory shall be used and, if not available, the IPCC (2006, Volume 4, Chapter 10) default factors shall be used. Calculations first require an estimate of the amounts of ammonia loss and nitrogen leaching from excreta deposited on land. The default IPCC (2006) loss factor for FRACGASM is 20 percent of nitrogen excreted and for FRACLEACH is 30 percent (for soils with net drainage, otherwise 0 percent) of ni-trogen excreted. These are then multiplied by the corresponding IPCC (2006, Volume 4, Chapter 10) emission factors of 0.01 kg N2O-N/kg N lost as ammonia and 0.0075 kg N2O-N/kg N lost from leaching/runoff, respectively.
The total nitrous oxide emissions from excreta and manure are calculated by summing the direct and indirect nitrous oxide emissions, after adjustment for the N2O/ N2O-N ratio of 44/28.
Figure 14 Nitrogen mass flows from spent litter.
Note: Emissions from land application (green boxes) fall within the LEAP Animal Feed Guidelines, while emissions from direct deposition (e.g. backyard systems) should be accounted as emissions assigned to the animals as that manure may not be exploited for crop production.
Avoided Emissions
Energy Production In-house litter
Other disposal (landfill, compost,
etc.)
Land Application
NH3, N2O and CH4 Emissions
On-farm storage
Excretion from Animal
Direct deposition on free range
Direct and Indirect N20 emission
Runoff/Leaching indirect N2O
emission
Avoided emission
Nitrogen transferred = initial - losses
Table 7: Manure management systems and emission factors for nitrous oxide
Management systemIPCC emission factor for nitrous oxide
kg N2O / kg N excreted
Poultry manure with litter (bedding) 0.001*
Poultry manure deposited outdoors (free-range and organic supply chains)
0.02 **
Poultry manure without litter (majority of egg production systems).
0.001 *
* IPCC, 2006, Volume 4, Chapter 10; ** IPCC, 2006, Volume 4, Chapter 11.
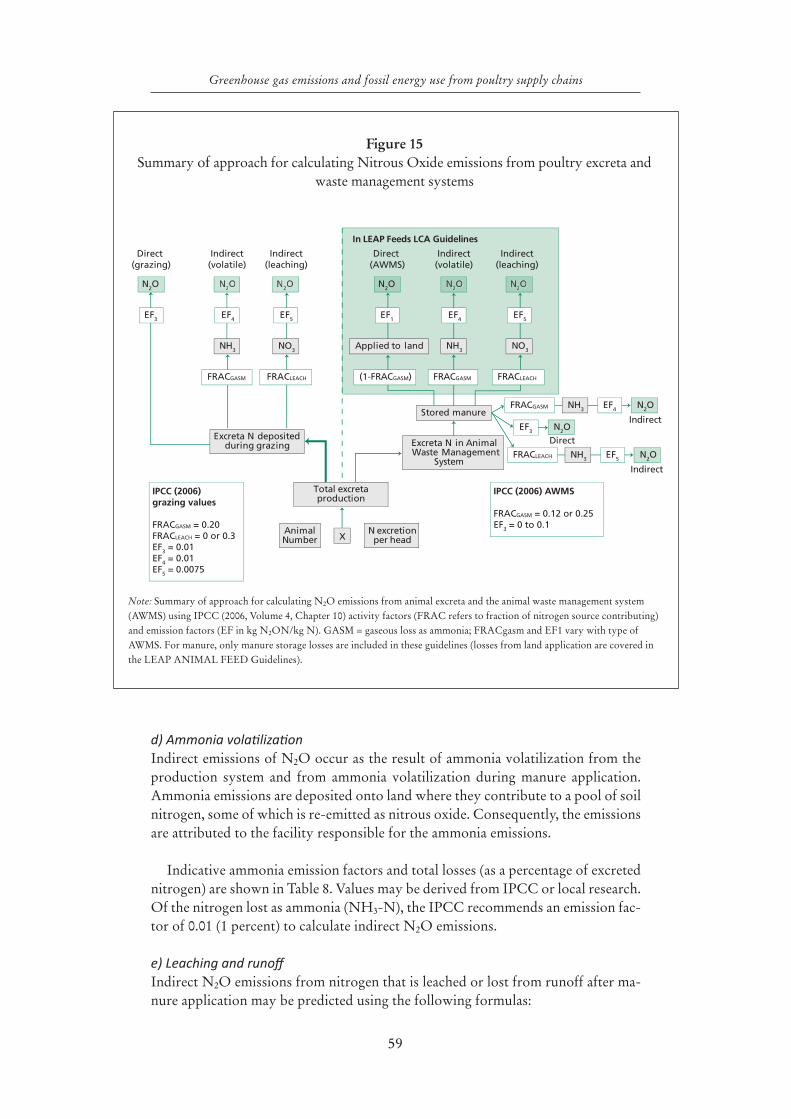
59
Greenhouse gas emissions and fossil energy use from poultry supply chains
d) Ammonia volatilization Indirect emissions of N2O occur as the result of ammonia volatilization from the production system and from ammonia volatilization during manure application. Ammonia emissions are deposited onto land where they contribute to a pool of soil nitrogen, some of which is re-emitted as nitrous oxide. Consequently, the emissions are attributed to the facility responsible for the ammonia emissions.
Indicative ammonia emission factors and total losses (as a percentage of excreted nitrogen) are shown in Table 8. Values may be derived from IPCC or local research. Of the nitrogen lost as ammonia (NH3-N), the IPCC recommends an emission fac-tor of 0.01 (1 percent) to calculate indirect N2O emissions.
e) Leaching and runoffIndirect N2O emissions from nitrogen that is leached or lost from runoff after ma-nure application may be predicted using the following formulas:
Figure 15 Summary of approach for calculating Nitrous Oxide emissions from poultry excreta and
waste management systems
Note: Summary of approach for calculating N2O emissions from animal excreta and the animal waste management system (AWMS) using IPCC (2006, Volume 4, Chapter 10) activity factors (FRAC refers to fraction of nitrogen source contributing) and emission factors (EF in kg N2ON/kg N). GASM = gaseous loss as ammonia; FRACgasm and EF1 vary with type of AWMS. For manure, only manure storage losses are included in these guidelines (losses from land application are covered in the LEAP ANIMAL FEED Guidelines).
N2O N2O N2ON2O N2O
NH3
EF3 EF4
Excreta N depositedduring grazing
Total excretaproduction
AnimalNumber
N excretionper headX
FRACGASM FRACGASM
Direct (grazing)
Indirect(volatile)
Indirect(leaching)
FRACGASM NH3 EF4
EF3
Indirect
Direct
FRACLEACH
In LEAP Feeds LCA Guidelines
Excreta N in AnimalWaste Management
System
Stored manure
EF5
N2O N2O
N2O
N2O
N2ON2O N2O
EF1 EF4
Direct (AWMS)
Indirect(volatile)
Indirect(leaching)
FRACLEACH
NO3 NH3 NO3
IPCC (2006)grazing values
FRACGASM = 0.20FRACLEACH = 0 or 0.3EF3 = 0.01EF4 = 0.01EF5 = 0.0075
IPCC (2006) AWMS
FRACGASM = 0.12 or 0.25EF3 = 0 to 0.1
EF5
(1-FRACGASM)
Applied to land
FRACLEACH NH3 EF5
Indirect
N2O
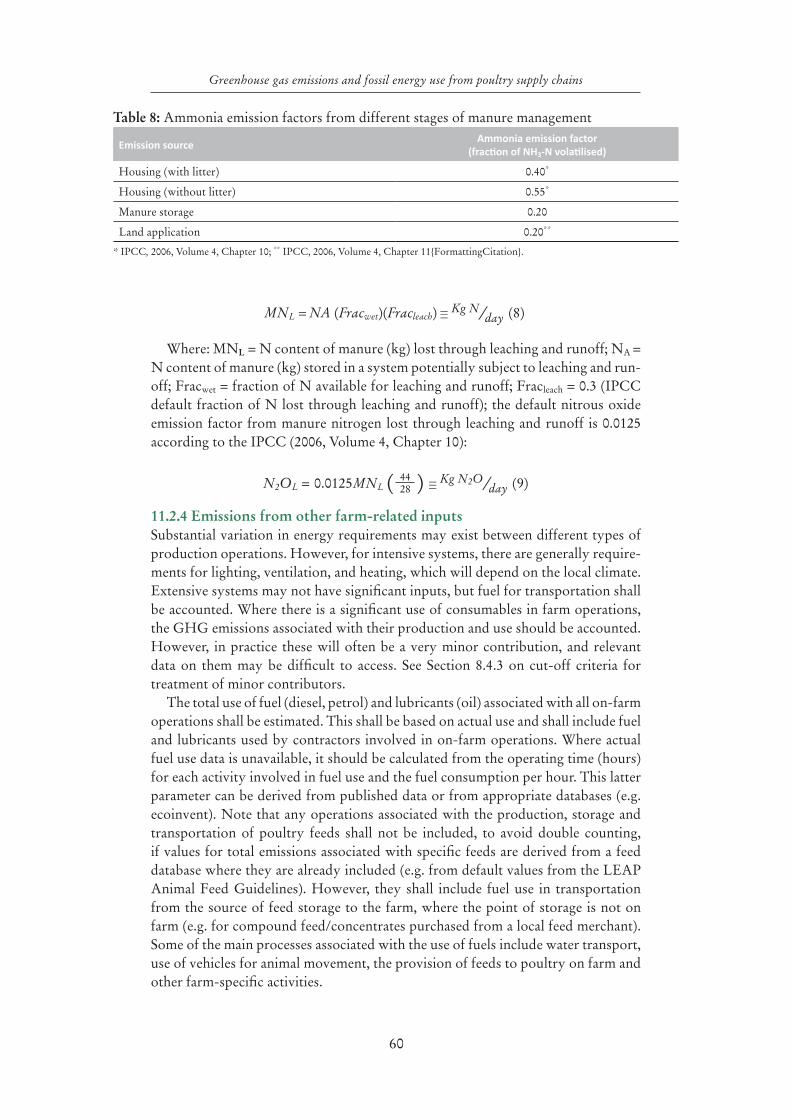
60
Greenhouse gas emissions and fossil energy use from poultry supply chains
MNL = NA (Fracwet)(Fracleach) ≡ Kg N ⁄day (8)
Where: MNL = N content of manure (kg) lost through leaching and runoff; NA = N content of manure (kg) stored in a system potentially subject to leaching and run-off; Fracwet = fraction of N available for leaching and runoff; Fracleach = 0.3 (IPCC default fraction of N lost through leaching and runoff); the default nitrous oxide emission factor from manure nitrogen lost through leaching and runoff is 0.0125 according to the IPCC (2006, Volume 4, Chapter 10):
N2OL = 0.0125MNL ( 44 ) ≡ Kg N2O ⁄day (9)28
11.2.4 Emissions from other farm-related inputs Substantial variation in energy requirements may exist between different types of production operations. However, for intensive systems, there are generally require-ments for lighting, ventilation, and heating, which will depend on the local climate. Extensive systems may not have significant inputs, but fuel for transportation shall be accounted. Where there is a significant use of consumables in farm operations, the GHG emissions associated with their production and use should be accounted. However, in practice these will often be a very minor contribution, and relevant data on them may be difficult to access. See Section 8.4.3 on cut-off criteria for treatment of minor contributors.
The total use of fuel (diesel, petrol) and lubricants (oil) associated with all on-farm operations shall be estimated. This shall be based on actual use and shall include fuel and lubricants used by contractors involved in on-farm operations. Where actual fuel use data is unavailable, it should be calculated from the operating time (hours) for each activity involved in fuel use and the fuel consumption per hour. This latter parameter can be derived from published data or from appropriate databases (e.g. ecoinvent). Note that any operations associated with the production, storage and transportation of poultry feeds shall not be included, to avoid double counting, if values for total emissions associated with specific feeds are derived from a feed database where they are already included (e.g. from default values from the LEAP Animal Feed Guidelines). However, they shall include fuel use in transportation from the source of feed storage to the farm, where the point of storage is not on farm (e.g. for compound feed/concentrates purchased from a local feed merchant). Some of the main processes associated with the use of fuels include water transport, use of vehicles for animal movement, the provision of feeds to poultry on farm and other farm-specific activities.
Table 8: Ammonia emission factors from different stages of manure management
Emission sourceAmmonia emission factor
(fraction of NH3-N volatilised)
Housing (with litter) 0.40*
Housing (without litter) 0.55*
Manure storage 0.20
Land application 0.20**
* IPCC, 2006, Volume 4, Chapter 10; ** IPCC, 2006, Volume 4, Chapter 11{FormattingCitation}.
61
Greenhouse gas emissions and fossil energy use from poultry supply chains
The total amount of use of a particular fuel type is then multiplied by the relevant country-specific GHG emission factor (which accounts for production and use of fuel: see third-party databases for secondary life cycle inventory and in some cases geographically specific data sets). The process for calculating fuel-related emissions also applies to electricity. Thus, all electricity use associated with farm activities (excluding feed production and storage where they are included within the emission factor for feeds) shall be estimated. This includes electricity for water recirculation, ventilation and lighting. Country-specific emission factors for electricity produc-tion and use shall be applied according to the electricity source. This would typical-ly be the national or regional average and would account for the mix of renewable and non-renewable energy sources used for the electricity grid mix.
The final on-farm results are calculated on the basis of the cumulative inventory the inputs and emissions each converted the appropriate impact category based on the characterization factors (e.g. for climate change due to electricity, the total an-nual number of kilowatt-hours of electricity consumed is multiplied by the national emission factor-kilograms CO2e/kilowatt-hour). Once each of the inventories has been converted to the appropriate impact category metric, they are summed and divided by the total annual production to be reported on a per functional unit basis.
11.2.5 By-products and wasteThe management of wastes other than manure shall also be accounted. In particular, the management of mortalities and broken/damaged eggs should be included in the inventory. Waste materials, such as disposed packaging or other solid waste, shall also be accounted.
11.3 TRANSPORTATIONEstimating environmental impacts of transportation entails two allocation issues: allocation of empty transport distance of transport means and allocation of the load fraction of transportation means.
Fuel consumption from transport can be estimated using a) the fuel cost method, b) the fuel consumption method, or c) the tonne-kilometre method (Appendix 1). Transport distances may be estimated from routes and mapping tools or obtained from navigation software. The allocation of empty transport distance (backhaul) is often done already in the background models used for deriving the secondary LCI data for transportation. However, if primary data for transport should be derived, the LCA user should make an estimate of the empty transport distance. It is good practice to provide a best estimate with a corresponding uncertainty, per the re-quirement in section 10.4.
Allocation of empty transport kilometres shall be done on the basis of the average load factor of the transport that is representative for the transport under study. If no supporting information is collected, 100 percent empty return should be assumed.
If products are transported by a vehicle, resource use and emissions of the vehicle shall be allocated to the transported products. A means of transport has a maximum load, expressed as tonnage. However the maximum weight can only be achieved if density of the loaded goods allows.
Allocations of transport emissions to transported products shall be performed on the basis of mass share, unless the density of the transported product is signifi-cantly lower than average so that the volume restricts the maximum load.
62
Greenhouse gas emissions and fossil energy use from poultry supply chains
11.4 INCLUSION AND TREATMENT OF LAND-USE CHANGE IMPACTSThe reader is referred to the LEAP Animal Feed Guidelines for additional detail. GHG emissions associated with land-use change should be separately accounted and reported. PAS 2050:2011 provides additional guidance.
11.5 BIOGENIC AND SOIL CARBON SEQUESTRATIONBiogenic and soil carbon sequestration can be important for some poultry systems. However, since this relates only to the feed production stage, the specific methods are covered in the LEAP Animal Feed Guidelines. As these guidelines note, bio-genic and soil carbon sequestration shall be included in the final GHG emissions value. Where no data relating to soil carbon sequestration are available, the LEAP Animal Feed guidelines provide default values for temperate climate. The last op-tion is to assume zero change in soil carbon.
11.6 PRIMARY PROCESSING STAGEThis stage of the poultry value chain includes: slaughter, removal of blood and feathers, feet and head, evisceration, washing and cooling, cutting and packaging as well as production and management of numerous by-products such as feather and bone meal in addition to the main meat products. For operations that include rendering, the energy requirements can be significant. Other inputs that shall be included at this phase are electricity for refrigeration and water and chemicals for equipment cleaning. The following processes shall be evaluated:
• transport of live birds or eggs (if applicable) to the processing site from the farm gate;
•production, delivery and consumption of materials used in processing (e.g. cleaning chemicals and packaging materials);
•other purchased inputs or ingredients;• freshwater usage and wastewater treatment (quantity of water, chemicals,
energy);•releases resulting from background processes, including chemical and ingre-
dients production, refrigerant manufacturing and losses and other emissions sources;
•energy consumption: electricity, natural gas, on-site energy production; and•waste management that has environmental impacts (e.g. landfill disposal of
solid waste and wastewater treatment).
Calculating GHG emissions from meat processingCalculation of GHG emissions shall account for resource use, wastewater process-ing and the associated GHG emission factors. Electricity and other energy use shall account for total embodied emissions relevant to the country where the primary processing occurs. Data on wastewater quantity and composition is used with the GHG emission factors for the method of wastewater processing (2006, Volume 4, Chapter 10) to calculate GHG emissions. An example is presented in Box 2. Total GHG emissions shall be allocated between the various co-products as outlined in Section 9.3.4.
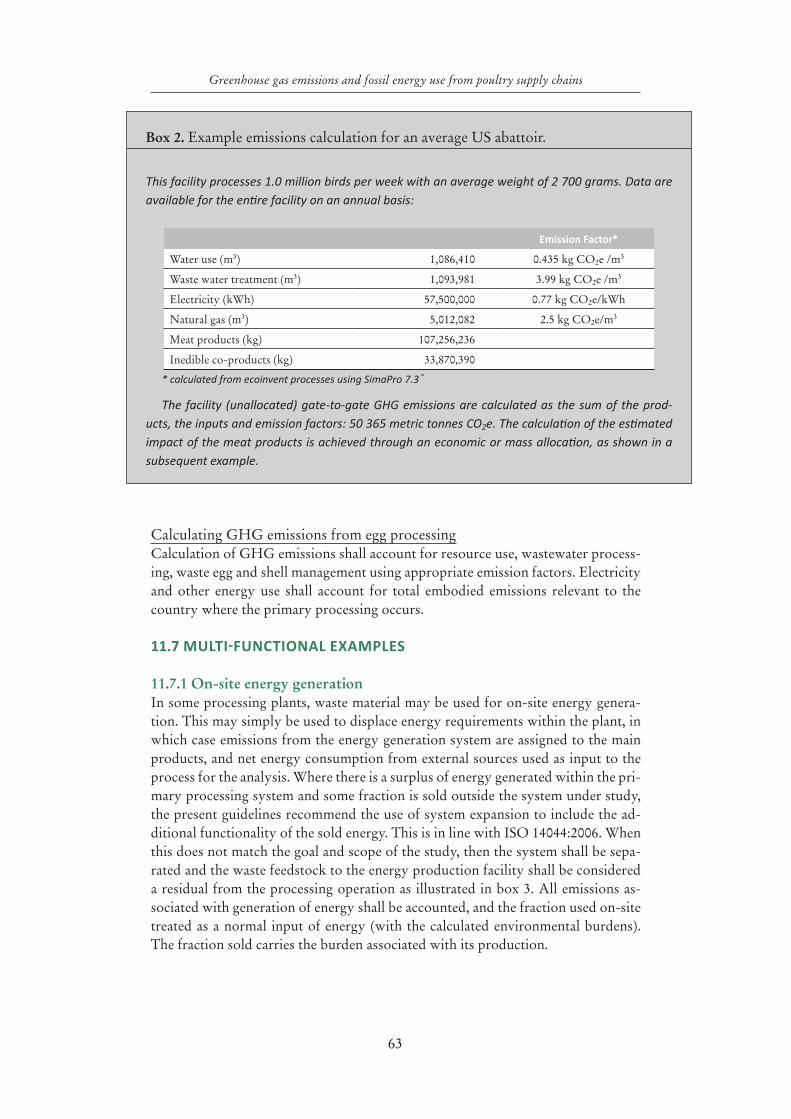
63
Greenhouse gas emissions and fossil energy use from poultry supply chains
Calculating GHG emissions from egg processingCalculation of GHG emissions shall account for resource use, wastewater process-ing, waste egg and shell management using appropriate emission factors. Electricity and other energy use shall account for total embodied emissions relevant to the country where the primary processing occurs.
11.7 MULTI-FUNCTIONAL EXAMPLES
11.7.1 On-site energy generationIn some processing plants, waste material may be used for on-site energy genera-tion. This may simply be used to displace energy requirements within the plant, in which case emissions from the energy generation system are assigned to the main products, and net energy consumption from external sources used as input to the process for the analysis. Where there is a surplus of energy generated within the pri-mary processing system and some fraction is sold outside the system under study, the present guidelines recommend the use of system expansion to include the ad-ditional functionality of the sold energy. This is in line with ISO 14044:2006. When this does not match the goal and scope of the study, then the system shall be sepa-rated and the waste feedstock to the energy production facility shall be considered a residual from the processing operation as illustrated in box 3. All emissions as-sociated with generation of energy shall be accounted, and the fraction used on-site treated as a normal input of energy (with the calculated environmental burdens). The fraction sold carries the burden associated with its production.
Box 2. Example emissions calculation for an average US abattoir.
This facility processes 1.0 million birds per week with an average weight of 2 700 grams. Data are available for the entire facility on an annual basis:
Emission Factor*
Water use (m3) 1,086,410 0.435 kg CO2e /m3
Waste water treatment (m3) 1,093,981 3.99 kg CO2e /m3
Electricity (kWh) 57,500,000 0.77 kg CO2e/kWh
Natural gas (m3) 5,012,082 2.5 kg CO2e/m3
Meat products (kg) 107,256,236
Inedible co-products (kg) 33,870,390
* calculated from ecoinvent processes using SimaPro 7.3®
The facility (unallocated) gate-to-gate GHG emissions are calculated as the sum of the prod-ucts, the inputs and emission factors: 50 365 metric tonnes CO2e. The calculation of the estimated impact of the meat products is achieved through an economic or mass allocation, as shown in a subsequent example.
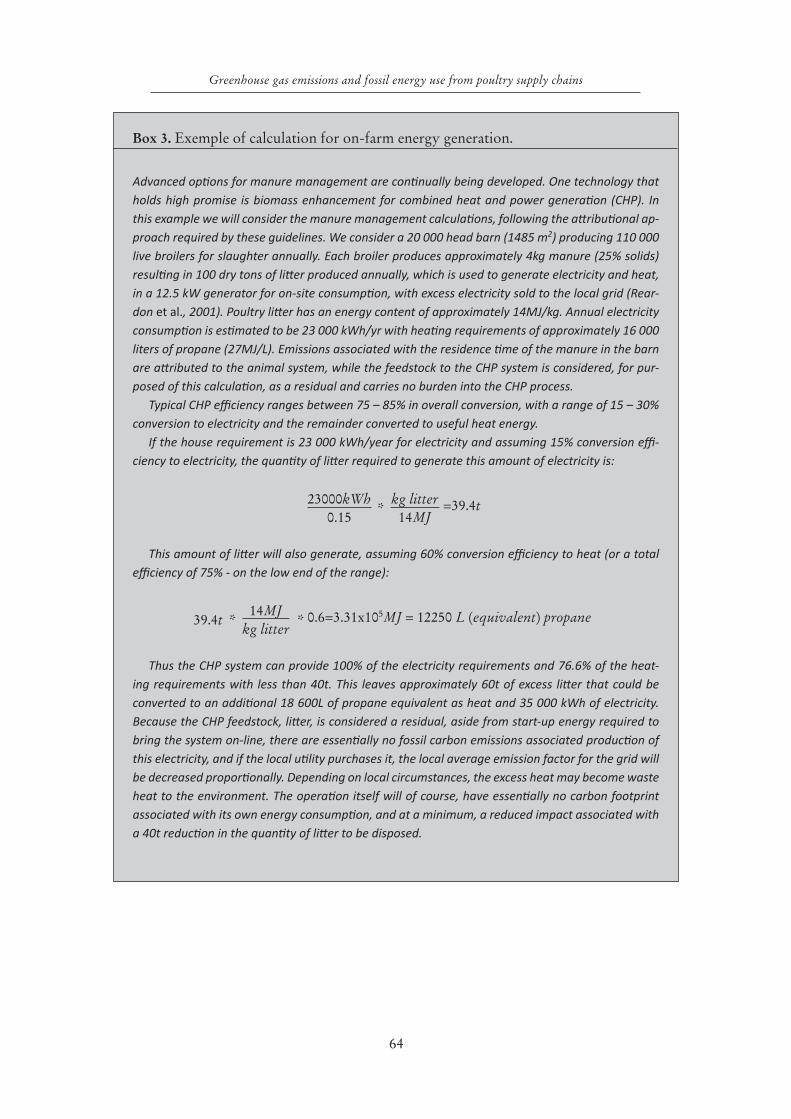
64
Greenhouse gas emissions and fossil energy use from poultry supply chains
Box 3. Exemple of calculation for on-farm energy generation.
Advanced options for manure management are continually being developed. One technology that holds high promise is biomass enhancement for combined heat and power generation (CHP). In this example we will consider the manure management calculations, following the attributional ap-proach required by these guidelines. We consider a 20 000 head barn (1485 m2) producing 110 000 live broilers for slaughter annually. Each broiler produces approximately 4kg manure (25% solids) resulting in 100 dry tons of litter produced annually, which is used to generate electricity and heat, in a 12.5 kW generator for on-site consumption, with excess electricity sold to the local grid (Rear-don et al., 2001). Poultry litter has an energy content of approximately 14MJ/kg. Annual electricity consumption is estimated to be 23 000 kWh/yr with heating requirements of approximately 16 000 liters of propane (27MJ/L). Emissions associated with the residence time of the manure in the barn are attributed to the animal system, while the feedstock to the CHP system is considered, for pur-posed of this calculation, as a residual and carries no burden into the CHP process.
Typical CHP efficiency ranges between 75 – 85% in overall conversion, with a range of 15 – 30% conversion to electricity and the remainder converted to useful heat energy.
If the house requirement is 23 000 kWh/year for electricity and assuming 15% conversion effi-ciency to electricity, the quantity of litter required to generate this amount of electricity is:
23000kWh*
kg litter =39.4t0.15 14MJ
This amount of litter will also generate, assuming 60% conversion efficiency to heat (or a total efficiency of 75% - on the low end of the range):
39.4t *14MJ
* 0.6=3.31x10⁵MJ = 12250 L (equivalent) propanekg litter
Thus the CHP system can provide 100% of the electricity requirements and 76.6% of the heat-ing requirements with less than 40t. This leaves approximately 60t of excess litter that could be converted to an additional 18 600L of propane equivalent as heat and 35 000 kWh of electricity. Because the CHP feedstock, litter, is considered a residual, aside from start-up energy required to bring the system on-line, there are essentially no fossil carbon emissions associated production of this electricity, and if the local utility purchases it, the local average emission factor for the grid will be decreased proportionally. Depending on local circumstances, the excess heat may become waste heat to the environment. The operation itself will of course, have essentially no carbon footprint associated with its own energy consumption, and at a minimum, a reduced impact associated with a 40t reduction in the quantity of litter to be disposed.
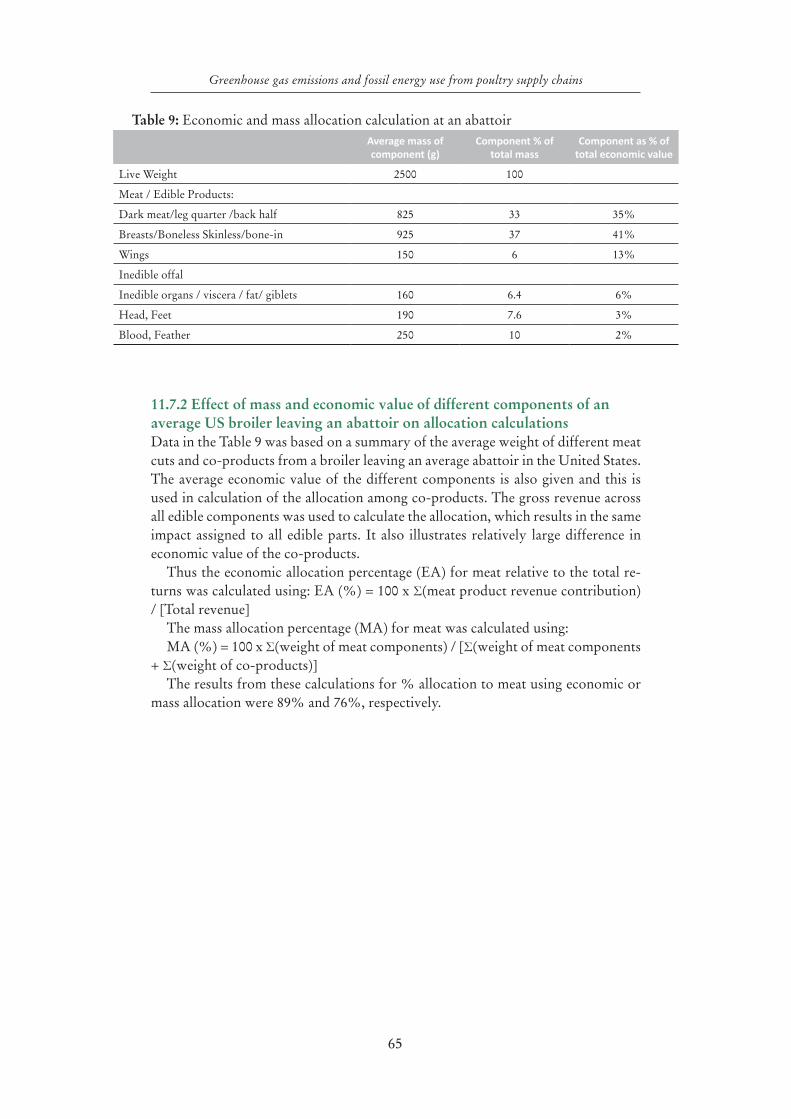
65
Greenhouse gas emissions and fossil energy use from poultry supply chains
11.7.2 Effect of mass and economic value of different components of an average US broiler leaving an abattoir on allocation calculationsData in the Table 9 was based on a summary of the average weight of different meat cuts and co-products from a broiler leaving an average abattoir in the United States. The average economic value of the different components is also given and this is used in calculation of the allocation among co-products. The gross revenue across all edible components was used to calculate the allocation, which results in the same impact assigned to all edible parts. It also illustrates relatively large difference in economic value of the co-products.
Thus the economic allocation percentage (EA) for meat relative to the total re-turns was calculated using: EA (%) = 100 x Σ(meat product revenue contribution) / [Total revenue]
The mass allocation percentage (MA) for meat was calculated using:MA (%) = 100 x Σ(weight of meat components) / [Σ(weight of meat components
+ Σ(weight of co-products)] The results from these calculations for % allocation to meat using economic or
mass allocation were 89% and 76%, respectively.
Table 9: Economic and mass allocation calculation at an abattoirAverage mass of component (g)
Component % of total mass
Component as % of total economic value
Live Weight 2500 100
Meat / Edible Products:
Dark meat/leg quarter /back half 825 33 35%
Breasts/Boneless Skinless/bone-in 925 37 41%
Wings 150 6 13%
Inedible offal
Inedible organs / viscera / fat/ giblets 160 6.4 6%
Head, Feet 190 7.6 3%
Blood, Feather 250 10 2%
66
Greenhouse gas emissions and fossil energy use from poultry supply chains
12. Interpretation of LCA results
Interpretation of the results of the study serves two purposes (ILCD Handbook):At all steps of the LCA, the calculation approaches and data shall match the goals and
quality requirements of the study. In this sense, interpretation of results may inform an iterative improvement of the assessment until all goals and requirements are met.
The second purpose of the interpretation is to develop conclusions and recom-mendations, for example in support of environmental performance improvements. The interpretation entails three main elements detailed in the following subsections: ‘Identification of important issues’, ‘Characterizing uncertainty’ and ‘Conclusions, limitations and recommendations’.
12.1 IDENTIFICATION OF KEY ISSUES Identifying important issues encompasses the identification of most important im-pact categories, and life cycle stages, and the sensitivity of results to methodological choices.
The first step is to determine the life cycle stage processes and elementary flows that contribute most to the LCIA results, as well as the most relevant impact cat-egories.
Secondly, the extent to which methodological choices such as system boundaries, cut-off criteria, data sources and allocation choices affect the study outcomes shall be assessed, especially the life cycle stages having the most important contribution. In addition, any explicit exclusion of supply chain activities, including those that are excluded as a result of cut-off criteria, shall be documented in the report. Tools that should be used to assess the robustness of the footprint model include ILCD Handbook):
•Completeness checks: Evaluate the LCI data to confirm that it is consistent with the defined goals, scope, system boundaries and quality criteria, and that the cut-off criteria have been met. This includes: completeness of process, i.e. at each supply chain stage, the relevant processes or emissions contributing to the impact have been included; and exchanges, i.e. all significant energy or material inputs and their associated emissions, have been included for each process.
•Sensitivity checks: Assess the extent to which the results are determined by specific methodological choices and the impact of implementing alternative, defensible choices where these are identifiable. This is particularly important with respect to allocation choices. It is useful to structure sensitivity checks for each phase of the study: goal and scope definition, the LCI model and impact assessment.
•Consistency checks: Ensure that the principles, assumptions, methods and data have been applied consistently with the goal and scope throughout the study. In particular, ensure that the following are addressed: (i) the data qual-ity along the life cycle of the product and across production systems; (ii) the methodological choices (e.g. allocation methods) across production systems; and (iii) the application of the impact assessments steps with the goal and scope.
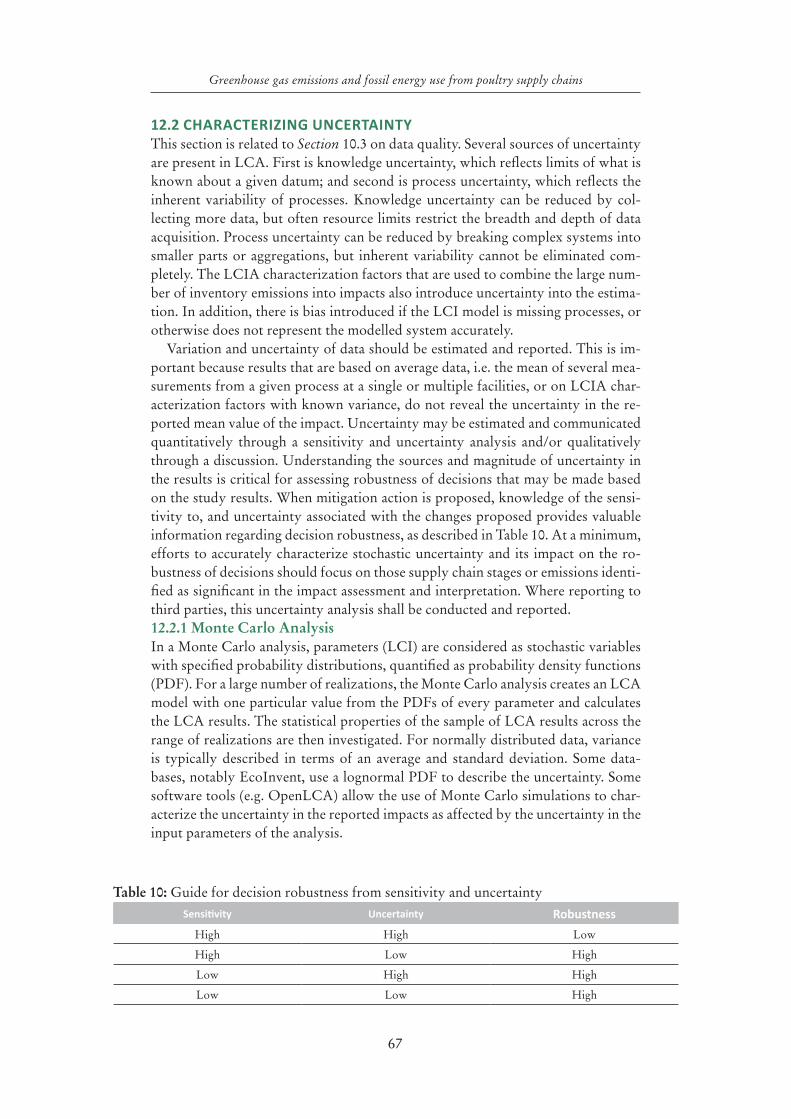
67
Greenhouse gas emissions and fossil energy use from poultry supply chains
12.2 CHARACTERIZING UNCERTAINTY This section is related to Section 10.3 on data quality. Several sources of uncertainty are present in LCA. First is knowledge uncertainty, which reflects limits of what is known about a given datum; and second is process uncertainty, which reflects the inherent variability of processes. Knowledge uncertainty can be reduced by col-lecting more data, but often resource limits restrict the breadth and depth of data acquisition. Process uncertainty can be reduced by breaking complex systems into smaller parts or aggregations, but inherent variability cannot be eliminated com-pletely. The LCIA characterization factors that are used to combine the large num-ber of inventory emissions into impacts also introduce uncertainty into the estima-tion. In addition, there is bias introduced if the LCI model is missing processes, or otherwise does not represent the modelled system accurately.
Variation and uncertainty of data should be estimated and reported. This is im-portant because results that are based on average data, i.e. the mean of several mea-surements from a given process at a single or multiple facilities, or on LCIA char-acterization factors with known variance, do not reveal the uncertainty in the re-ported mean value of the impact. Uncertainty may be estimated and communicated quantitatively through a sensitivity and uncertainty analysis and/or qualitatively through a discussion. Understanding the sources and magnitude of uncertainty in the results is critical for assessing robustness of decisions that may be made based on the study results. When mitigation action is proposed, knowledge of the sensi-tivity to, and uncertainty associated with the changes proposed provides valuable information regarding decision robustness, as described in Table 10. At a minimum, efforts to accurately characterize stochastic uncertainty and its impact on the ro-bustness of decisions should focus on those supply chain stages or emissions identi-fied as significant in the impact assessment and interpretation. Where reporting to third parties, this uncertainty analysis shall be conducted and reported.12.2.1 Monte Carlo AnalysisIn a Monte Carlo analysis, parameters (LCI) are considered as stochastic variables with specified probability distributions, quantified as probability density functions (PDF). For a large number of realizations, the Monte Carlo analysis creates an LCA model with one particular value from the PDFs of every parameter and calculates the LCA results. The statistical properties of the sample of LCA results across the range of realizations are then investigated. For normally distributed data, variance is typically described in terms of an average and standard deviation. Some data-bases, notably EcoInvent, use a lognormal PDF to describe the uncertainty. Some software tools (e.g. OpenLCA) allow the use of Monte Carlo simulations to char-acterize the uncertainty in the reported impacts as affected by the uncertainty in the input parameters of the analysis.
Table 10: Guide for decision robustness from sensitivity and uncertaintySensitivity Uncertainty Robustness
High High Low
High Low High
Low High High
Low Low High
68
Greenhouse gas emissions and fossil energy use from poultry supply chains
12.2.2 Sensitivity analysisChoice-related uncertainties arise from a number of methodologies, including modelling principles, system boundaries and cut-off criteria, choice of footprint impact assessment methods and other assumptions related to time, technology and geography. Unlike the LCI and characterization factors, they are not amenable to statistical description. However, the sensitivity of the results to these choice-related uncertainties can be characterized through scenario assessments (e.g. comparing the footprint derived from different allocation choices) and/or uncertainty analysis (e.g. Monte Carlo simulations).
In addition to choice-related sensitivity evaluation, the relative sensitivity of spe-cific activities (LCI datasets) measures the percentage change in impact arising from a known change in an input parameter (Hong et al., 2010).
12.2.3 NormalizationAccording to ISO 14044:2006, normalization is an optional step in impact assess-ment. Normalization is a process in which an impact associated with the functional unit is compared against an estimate of the entire regional impacts in that category (Sleeswijk et al., 2008). For example, livestock supply chains have been estimated to contribute 14.5 percent of global anthropogenic GHG emissions (Gerber et al., 2013). Similar assessments can be made at regional or national scales, provided that there exists a reasonably complete inventory of all emissions in that region that contribute to the impact category. Normalization provides an additional degree of insight into those areas in which significant improvement would result in notable advances for the region in question, and can help decision makers to focus on sup-ply chain hotspots whose improvement will bring about the greatest relative envi-ronmental benefit.
12.3 CONCLUSIONS, RECOMMENDATIONS AND LIMITATIONSThe final part of interpretation is to draw conclusions derived from the results, pose answers to the questions raised in the goal and scope definition stage, and recom-mend appropriate actions to the intended audience, within the context of the goal and scope, and explicitly accounting for limitations to robustness, uncertainty and applicability.
Conclusions derived from the study should summarize supply chain hotspots derived from the contribution analysis and the improvement potential associated with possible management interventions. Conclusions should be given in the strict context of the stated goal and scope of the study, and any limitation of the goal and scope can be discussed a posteriori in the conclusions.
As required under ISO 14044:2006, if the study is intended to support compara-tive assertions, i.e. claims asserting difference in the merits of products based the study results, then it is necessary to fully consider whether differences in method or data quality used in the model of the compared products impair the comparison. Any inconsistencies in functional units, system boundaries, allocation, and data quality or impact assessment shall be evaluated and communicated.
Recommendations are based on the final conclusion of the LCA study. They shall be logical, reasonable, plausibly founded and strictly relate to the goal of the study. Recommendations shall be given jointly with limitations to avoid their mis-interpretation beyond the scope of the study.
69
Greenhouse gas emissions and fossil energy use from poultry supply chains
12.3.1 Use and comparability of resultsIt is important to note that these guidelines refer only to a partial LCA, Where results are required for products throughout the whole life cycle, it is necessary to link this analysis with relevant methods for secondary processing through to con-sumption and waste stages (e.g. EPD 2012; PAS 2395: 2014). Results from the appli-cation of these guidelines cannot be used to represent the whole life cycle of poultry products. However, they can be used to identify hotspots in the cradle-to-primary-processing stages, which are major contributors to emissions across the whole life cycle, and assess potential GHG reduction strategies. In addition, the functional units recommended are intermediary points in the supply chains for virtually all poultry sector products and therefore will not be suitable for a full LCA. However, they can provide valuable guidance to practitioners to the point of divergence from the system into different types of products.
12.4 GOOD PRACTICE IN REPORTING LCA RESULTSThe LCA results and interpretation shall be fully and accurately reported, without bias and consistent with the goal and scope of the study. The type and format of the report should be appropriate to the scale and objectives of the study, and the language should be accurate and understandable by the intended user so as to mini-mize the risk of misinterpretation.
The description of the input data and assessment methods shall be included in the report in sufficient detail and transparency to clearly show the scope, limita-tions and complexity of the analysis. The selected allocation method used shall be documented, and any variation from the recommendations in these guidelines shall be justified.
The report should include an extensive discussion of the limitations related to ac-counting for a non-comprehensive number of impact categories and outputs. This discussion should address:
•possible positive or negative impacts on other (non-GHG) environmental criteria;
•possible positive or negative environmental impacts (e.g. on biodiversity, land-scape, carbon sequestration); and
•multi-functional outputs other than production (e.g. economic, social, nutri-tional);
If intended for the public domain, a communication plan shall be developed to establish accurate communication that is adapted to the target audience and defen-sible.
12.5 REPORT ELEMENTS AND STRUCTUREThe following elements should be included in the LCA report:
•executive summary typically targeting a non-technical audience (e.g. decision makers) and including key elements of goal and scope of the system studied and the main results and recommendations, while clearly presenting assump-tions and limitations;
• identification of the LCA study, including name, date, responsible organiza-tion or researchers, objectives and reasons for the study and intended users;
•goal of the study, its intended applications, targeted audience and methodol-ogy, including consistency with these guidelines;
70
Greenhouse gas emissions and fossil energy use from poultry supply chains
• functional unit and reference flows, including overview of species, geographi-cal location and regional relevance of the study;
•system boundary and unit stages (e.g. to farm gate and farm gate to primary processing gate);
•materiality criteria and cut-off thresholds;•allocation method(s) and justification, if different from the recommendations
in these guidelines;•description of inventory data, its representativeness, averaging periods (if
used) and assessment of quality of data;•description of assumptions or value choices made for the production and pro-
cessing systems, with justification;• feed intake and application of LEAP Animal Feed Guidelines, including
description of emissions and removals (if estimated) for land-use change;•LCI modelling and calculating LCI results;•results and interpretation of the study and conclusions;•description of the limitations and any trade-offs; and• if intended for the public domain, a statement as to whether or not the study
was subject to independent third-party verification.
12.6 CRITICAL REVIEWInternal review and iterative improvement should be carried out for any LCA study. In addition, if the results are intended to be released to the public, third-party verification and/or external critical review shall be undertaken (and should be undertaken for internal studies) to ensure that:
• the methods used to carry out the LCA are consistent with these guidelines and are scientifically and technically valid;
• the data and assumptions used are appropriate and reasonable;• interpretations take into account the complexities and limitations inherent in
LCA studies for on-farm and primary processing; and• the report is transparent, free from bias and sufficient for the intended user(s).The critical review shall be undertaken by an individual or panel with appropri-
ate expertise, for example, qualified reviewers from agricultural industry or govern-ment or non-government officers with experience in the assessed supply chains and LCA. Independent reviewers are highly preferable.
The panel report and critical review statement and recommendations shall be included in the study report if publicly available.
71
Greenhouse gas emissions and fossil energy use from poultry supply chains
References
AFNOR. 2011. BPX-30-323-0 General principles for an environmental communi-cation on mass market products - Part 0: General principles and methodological framework. Saint-Denis, France, ADEME-AFNOR.
Alexandratos N. & Bruinsma, J. 2012. World agriculture towards 2030/2050: the 2012 revision. ESA Working paper No. 12-3. Rome, FAO.
ASAE (American Society of Agricultural Engineers). 2005. Manure Production and Characteristics, Standard D384.2. St Joseph, MI, ASAE.
Avila, V.S., & de Soares, J.P.G. 2010. Produção de ovos em sistema orgânico. Brazil, Embrapa Agrobiologia.
Bengtsson, J. & Seddon, J. 2013. Cradle to retailer or quick service restaurant gate life cycle assessment of chicken products in Australia. Journal of Cleaner Produc-tion41: 291–300.
Boggia, A., Paolotti, L. & Castellini, C. 2010a. Environmental impact evaluation of conventional, organic and organic-plus poultry production systems using life cycle assessment. World’s Poultry Science Journal, 66: 95–114.
BSI. 2011. PAS 2050-2011 Specification for the measurement of the embodied green-house gas emissions in products and services. London, British Standards Institu-tion.
Da Silva, V.P., Soares, S.R. & de Alvarenga, R.A. 2008a. Brazilian poultry : a study of production and supply chains for the accomplishment of a LCA study. In T. Nemecek & G. Gaillard, eds. Proceedings of the 6th International Conference on LCA in the Agri-Food Sector – Towards a sustainable management of the Food chain. November 12–14, 2008, Zurich, Switzerland, Agroscope Reckenholz-Tän-ikon Research Station ART.
Da Silva, V.P., Soares, S.R. & de Alvarenga, R.A. 2008b. Cradle to gate study of two differing Brazilian poultry production systems. In T. Nemecek & G. Gail-lard, eds. Proceedings of the 6th International Conference on LCA in the Agri-Food Sector – Towards a sustainable management of the Food chain. November 12–14, 2008, Zurich, Switzerland, Agroscope Reckenholz-Tänikon Research Sta-tion ART.
Da Silva, V.P., Cherubini, E. & Soares, S.R. 2012. Comparison of two production scenarios of chickens consumed in France. In M.S. Corson & H.M.G. der Werf, eds. Proceedings of the 8th International Conference on Life Cycle Assessment in the Agri-Food Sector (LCA Food 2012), 1–4 October 2012, Saint Malo, France, pp. 20-25. Rennes, France, INRA.
Dekker, S.E.M. 2012. Exploring ecological sustainability in the production chain of organic eggs. Wageningen University.
Dekker, S.E.M., de Boer, I.J.M., Arnink, A.J.A. & Groot Koerkamp, P.W.G. 2008. Environmental hotspot identification of organic egg production. In T. Nemecek & G. Gaillard, eds. Proceedings of the 6th International Conference on LCA in the Agri-Food Sector – Towards a sustainable management of the Food chain. November 12–14, 2008, Zurich, Switzerland, Agroscope Reckenholz-Tänikon Research Station ART.
72
Greenhouse gas emissions and fossil energy use from poultry supply chains
Dekker, S.E.M., de Boer, I.J.M., Vermeij, I., Aarnink, A.J.A., & Groot Koerkamp, P.W.G. 2011. Ecological and economic evaluation of Dutch egg production sys-tems. Livestock Science, 139: 109–121.
Dekker, S.E.M., de Boer, I.J.M., van Krimpen, M., Aarnink, A.J.A., and Groot Koerkamp, P.W.G. 2013. Effect of origin and composition of diet on ecological impact of the organic egg production chain. Livestock Science, 151: 271–283.
European Commission. 2010a. Communication from the European Commission 2010/C 160/02.
European Commission. 2010b. International Reference Life Cycle Data System (ILCD) Handbook: General guide for Life Cycle Assessment - Detailed guid-ance. European Commission Joint Research Centre. Luxembourg, Publications office of the European Union.
European Commission. 2010c. ILCD Handbook: Analysis of existing Environ-mental Impact Assessment methodologies for use in Life Cycle Assessment. Euro-pean Commission Joint Research Centre. Luxembourg, Publications office of the European Union, Luxembourg.
European Commission. 2013. Product Environmental Footprint (PEF) Guide. An-nex II to the Recommendations of the Commission on the use of common meth-ods to measure and communicate the life cycle environmental performance of products and organizations. European Commission Joint Research Centre. Lux-emburg, Publications Office of the European Union.
FAO/WHO Codex Alimentarius Commission. 2002. Organically Produced Foods. Rome, FAO/WHO (available at www.fao.org/docrep/005/y2772e/y2772e0b.htm#bm11.2.1).
FAO/WHO Codex Alimentarius Commission. 2008. Codex Alimentarius Code of Practice on Good Animal feeding. CAC/RCP 54-2004, adopted in 2004, amended in 2008. Rome, FAO/WHO.
FAO. 2012. FAOSTAT. Online statistical database (available at http://faostat.fao.org).
Finnveden, G., Hauschild, M.Z., Ekvall, T., Guinée, J.B., Heijungs, R., Hell-weg, S., Koehler, A., Pennington, D. & Suh, S. 2009. Recent developments in Life Cycle Assessment. Journal of Environmental Management, 91:1–21. doi: 10.1016/j.jenvman.2009.06.018
Food SCP RT. 2013. ENVIFOOD Protocol, Environmental Assessment of Food and Drink Protocol. European Food Sustainable Consumption and Production Round Table (SCP RT), Working Group 1, Brussels, Belgium.
Frischknecht, R., Heijungs, R. & Hofstetter, P. 1998. Einstein’s lessons for energy accounting in LCA. International Journal of Life Cycle Assessment, 3(5):266 – 272.
Frischknecht, R. & Rebitzer, G. 2005. The ecoinvent database system: a com-prehensive web-based LCA database. Journal of Cleaner Production, 13: 1 337–1 343.
Frischknecht, R., Jungbluth, N., Althaus, H.-J., Doka, G., Dones, R., Heck, T., Hellweg, S., Hischier, R., Nemecek, T., Rebitzer, G. & Spielmann, M. 2004: The ecoinvent Database: Overview and Methodological Framework. Int. J. Life Cycle Assess.,10 (1): 3-9 http://dx.doi.org/10.1065/lca2004.10.181.1
Gerber, P. J., Steinfeld, H., Henderson, B., Mottet, A., Opio, C., Dijkman, J., Falcucci, A. and Tempio, G. 2013. Tackling climate change through livestock – A global assessment of emissions and mitigation opportunities. Rome, FAO,
73
Greenhouse gas emissions and fossil energy use from poultry supply chains
Hong, J., Shaked, S., Rosenbaum, R.K. & Jolliet, O. 2010. Analytical uncertainty propagation in life cycle inventory and impact assessment: Application to an auto-mobile front panel. International Journal of Life Cycle Assessment, 15: 499–510.
Huijbregts, M.A.J, Norris, G., Bretz, R., Ciroth, A., Maurice, B., von Bahr, B., Weidema, B. & de Beaufort, A. S. H. 2001. Framework for modelling data un-certainty in life cycle inventories. International Journal of Life Cycle Analysis, 6: 127-132.
IAEA (International Atomic Energy Agency). 2008. Guidelines for Sustainable Manure Management in Asian Livestock Production Systems. Animal Produc-tion and Health Section Joint FAO/IAEA Division of Nuclear Techniques in Food and Agriculture, Vienna, IAEA.
IPCC. 2006. 2006 IPCC Guidelines for National Greenhouse Gas Inventories, Vol-ume 4: Agriculture, Forestry and Other Land Use. Prepared by the National Greenhouse Gas Inventories Programme, Eggleston H.S., Buendia L., Miwa K., Ngara T. and Tanabe K. (eds). Institute for Global Environmental Strategies, Japan (available at: www.ipcc-nggip.iges.or.jp/public/2006gl/vol4.htm).
ISO. 1999. ISO 14024:1999 Environmental labels and declarations -- Type I envi-ronmental labelling -- Principles and procedures. Geneva, Switzerland.
ISO. 2000. ISO 14020:2000 Environmental labels and declarations -- General prin-ciples. Geneva, Switzerland.
ISO. 2002. ISO/TR 14062:2002 Environmental management -- Integrating envi-ronmental aspects into product design and development. Geneva, Switzerland.
ISO. 2006a. ISO 14025:2006 Environmental labels and declarations -- Type III en-vironmental declarations - Principles and procedures. Geneva, Switzerland.
ISO. 2006b. ISO 14040:2006 Environmental Management -- Life Cycle Assessment - Principles and Framework. Geneva, Switzerland.
ISO. 2006c. ISO 14044:2006 Environmental management -- Life cycle assessment - Requirements and Guidelines. Geneva, Switzerland.
ISO. 2006d. ISO 14064-1: Greenhouse gases -- Part 1: Specification with guidance at the organization level for quantification and reporting of greenhouse gas emis-sions and removals. Geneva, Switzerland.
ISO. 2013a. ISO/TS 14067:2013 Greenhouse gases: Carbon footprint of products -- Requirements and guidelines for quantification and communication. Geneva, Switzerland.
ISO. 2013b. ISO 16759:2013 Graphic technology -- Quantification and commu-nication for calculating the carbon footprint of print media products. Geneva, Switzerland.
ISO. 2014. ISO 14046: 2014 Environmental management – Water footprint – Prin-ciples, requirements and guidelines. Geneva, Switzerland.
JEMAI. 2011a. PA-CP-01 Chicken. Product Category Rule, Carbon Footprint of Product Communication Program. Japan Environmental Management Associa-tion for Industry (available at http://www.cms-cfp-japan.jp/english/pcr/pcrs.html).
JEMAI. 2011a. PA-CN-01 Market poultry eggs. Product Category Rule, Carbon Footprint of Product Communication Program. Japan Environmental Manage-ment Association for Industry (available at http://www.cms-cfp-japan.jp/eng-lish/pcr/pcrs.html).
Katajajuuri, J.-M., Grönroos, J. & Usva, K. 2008. Environmental impacts and related options for improving the chicken meat supply chain. In T. Nemecek &
74
Greenhouse gas emissions and fossil energy use from poultry supply chains
G. Gaillard, eds. Proceedings of the 6th International Conference on LCA in the Agri-Food Sector – Towards a sustainable management of the Food chain. November 12–14, 2008, Zurich, Switzerland, Agroscope Reckenholz-Tänikon Research Station ART.
Leinonen, I., Williams, A.G., Wiseman, J., Guy, J. & Kyriazakis, I. 2012a. Pre-dicting the environmental impacts of chicken systems in the United Kingdom through a life-cycle assessment: broiler production systems. Poultry Science, 91(1): 8-25.
Leinonen, I., Williams, A.G., Wiseman, J., Guy, J. & Kyriazakis, I. 2012b. Pre-dicting the environmental impacts of chicken systems in the United Kingdom through a life-cycle assessment: egg production systems. Poultry Science, 91(1): 26–40.
Lesschen, J.P., van den Berg, M., Westhoek, H.J., Witzke, H.P. & Oenema, O. 2011. Greenhouse gas emission profiles of European livestock sectors. Animal Feed Science and Technology, 166-167: 16–28.
Macleod, M., Gerber, P., Mottet, A., Tempio, G., Falucci, A., Opio, C., Vellinga, T., Henderson, B., and Steinfield, H. 2013. Greenhouse gas emissions from pig and chicken supply chains - A global life cycle assessment. Rome, FAO.
Mila i Canals, L., Sim, S., Azapagic, A., Doka, G., Frischknecht, R., Jefferies, D., King, H., Mutel, C., Nemecek, T., Roches, A., Stichnothe, H., Thoma, G. & Williams, A. 2011. Approaches for Addressing Life Cycle Assessment Data Gaps for 22 Bio-based Products. Journal of Industrial Ecology, 15: 707–725.
National Chicken Council. 2010. U.S. Broiler Performance (available at http://www.nationalchickencouncil.org/about-the-industry/statistics/u-s-broiler-per-formance/)
Opio, C., Gerber, P., MacLeod, B., Falcucci, A., Henderson, B., Mottet, A. Tem-pio, G. & Steinfeld, H. 2013. Greenhouse gas emissions from ruminant supply chains: A global life cycle assessment. Rome, FAO.
Palm, D. 2010. Product Category Rules for the assessment of the environmental performance of meat of fresh or chilled poultry (UN CPC 2112) and meat of fro-zen poultry (UN CPC 2114). Environmental Product Declaration.Pelletier, N. 2008. Environmental performance in the US broiler poultry sector. Agricultural Systems, 98: 67–73.
Reap, J., Roman, F., Duncan, S. & Bras, B. 2008. A survey of unresolved prob-lems in life cycle assessment. The International Journal of Life Cycle Assessment, 13(5): 374-388.
Sleeswijk, A. W., van Oers, L. F., Guinée, J. B., Struijs, J., & Huijbregts, M. A. 2008. Normalisation in product life cycle assessment: An LCA of the global and European economic systems in the year 2000. Science of the total environment, 390(1): 227-240.
UNEP/SETAC Life Cycle Initiative. 2011. Global Guidance Principles for Life Cycle Assessment Databases. A basis for greener processes and products. Paris, UNEP
UNFCCC. (n.d.) GHG data definitions (available at http://unfccc.int/ghg_data/online_help/definitions/items/3817.php).
Vergé, X.P.C., Dyer, J.A., Desjardins, R.L. & Worth, D. 2009. Long-term trends in greenhouse gas emissions from the Canadian poultry industry. Journal of Applied Poultry Research, 18: 12.
75
Greenhouse gas emissions and fossil energy use from poultry supply chains
Vergé, X.P.C., Dyer, J.A., Worth, D.E., Smith, W.N., Desjardins, R.L. & McCon-key, B.G. 2012. A greenhouse gas and soil carbon model for estimating the carbon footprint of livestock production in Canada. Animals, 2: 437-454 doi:10.3390/ani2030437.
Wang, S. & Huang, D. 2005. Assessment of Greenhouse Gas Emissions from Poul-try Enteric Fermentation. Asian Australasian Journal of Animal Sciences, 18; 873–878.
WATT. 2014. World executive guide to world poultry trends 2014. Watt Global Me-dia (available at http://www.poultrytrends.com).
Weiss, F. & Leip, A. 2012. Greenhouse gas emissions from the EU livestock sector: a life cycle assessment carried out with the CAPRI model Agriculture. Ecosystems and the Environment, 149: 124–34.
Wiedemann, S.G. & McGahan, E.J. 2011. Environmental assessment of an egg production supply chain using life cycle assessment. Final project report for the Australian Egg Corporation Limited.
Wiedemann, S.G., McGahan, E. & Poad, P. 2012. Using life cycle assessment to quantify the environmental impact of chicken meat production. Publication, No.12/029. Canberra, Rural Industries Research and Development.
WRI and WBCSD. 2011a. Product Life Cycle Accounting and Reporting Standard. Washington DC.
WRI and WBCSD. 2011b. Technical Guidance for Calculating Scope 3 Emissions. Supplement to the Corporate Value Chain (Scope 3) Accounting and Reporting Standard. Washington DC.
Yusuf, R., Noor, Z., Abba, A., Abu Hassan, M.A. & Mohd Din, M.F. 2012. Green-house gas emissions: quantifying methane emissions from livestock. American Journal of Engineering and Applied Sciences, 5: 1–8.


APPENDICES

79
Greenhouse gas emissions and fossil energy use from poultry supply chains
Appendix 1
LCI data to be collected
Primary data on the following items should be collected when feasible:
INPUTS FOR MEAT AND EGG PRODUCTION:Background breeding systemFor operations with the primary function of providing eggs, which can be hatched as chicks to become either laying hens or broilers, if primary data are available they should be used. However, normative reference information has been provided for the life cycle inventory associated with the background production system of broiler and layer chicks. The following information is required:
Inputs: •annual quantity of materials and fuels used at parent/grandparent farms;•electricity, natural gas and other fuels; •water (e.g. process water, tap water, well water; and• feed rations (type and quantity).Outputs:•annual number of hatched day-old chicks produced by breeding hens;• type and quantity of waste;•solid waste to landfill, incineration or recycled.•manure / litter •quantity and characteristics (see Section 10.2.3);•management technology; if multiple systems exist, include fraction treated by
each system; •emissions of methane and nitrous oxide arising from litter management; and•wastewater discharge.
Commercial broiler and egg production Day-old chicks from the breeding system:
Inputs:•annual quantity of materials and fuels used at broiler farm;•electricity, natural gas and other fuels;•water (e.g. industrial water, tap water, well-water); and• feed rations (type and quantity).Outputs:•annual number and live weight of broilers produced; •annual number of eggs and weight produced; • type and quantity of waste; and•solid waste to landfill, incineration or recycled;•manure / litter •quantity and characteristics (see Section 10.2.3);•management technology (if multiple systems exist, include fraction treated by
each system);
80
Greenhouse gas emissions and fossil energy use from poultry supply chains
•emissions of methane and nitrous oxide arising from litter management; and•wastewater discharge.
Slaughtering processInputs:
•number and weight of live animals processed;•annual quantity of materials and fuels used; •electricity, natural gas and other fuels; •water (e.g. industrial water, tap water, well-water,); and•chemicals, soaps, disinfectants.
Outputs:•Annual production of gutted carcasses;•Annual production of other co-products (non-human edible viscera, etc.)•Type and quantity of waste;•Solid waste to landfill, incineration or recycled;•Wastewater discharge.
Dressing processInputs:
•Number and weight of whole carcasses processed;•Annual quantity of materials and fuels used; •Electricity, natural gas and other fuels; •Water (process water, tap water, well-water, etc.)•Chemicals, soaps, disinfectants.
Outputs: •Weight of “dressed parts” for study functional unit;•Annual production of all co-products (edible by humans, but not included in
functional unit);•Annual production of other co-products (viscera not edible by humans, etc.)•Type and quantity of waste;•Solid waste to landfill, incineration or recycled;•Wastewater discharge.
Egg grading and processing:Inputs:
•Number of eggs and weight processed;•Annual quantity of materials and fuels used; •Electricity, natural gas and other fuels; •Water (process water, tap water, well-water, etc.);•Chemicals, soaps, disinfectants.
Outputs:•Weight of functional units (eggs and /or egg products);•Type and quantity of waste;•Solid waste to landfill, incineration or recycled;•Wastewater discharge;
81
Greenhouse gas emissions and fossil energy use from poultry supply chains
CALCULATION METHOD FOR FUEL CONSUMPTION DURING TRANSPORTFuel consumption methodCollect data on “fuel consumption [L]” for each mode of transport. Calculate GHG emissions [kg-CO2e] by multiplying fuel consumption [L] by “life cycle GHG emissions related to supply and use of fuel” [kg-CO2e/L] (secondary data – emission factor for each fuel) for each type of fuel.
Fuel cost methodCollect data on “fuel expense [$/yr]” and “average fuel price [$/L]” for each mode of transport. Calculate GHG emissions [kg-CO2e] by multiplying fuel consumption [fuel expense/ average fuel price] by “life cycle GHG emissions related to supply and use of fuel” [kg-CO2e/L] (secondary data– emission factor for each fuel) for each type of fuel.
Tonne-kilometre methodCollect data on loading ratio [percent] and transport load (transport tonne-kilometre) [t-km] for each mode of transport. Calculate life cycle GHG emissions [kg-CO2e] by multiplying the transport load (transport tonne-kilometre) [t-km] by the “life cycle GHG emissions related to fuel consumption per transport tonne-kilometre” [kg-CO2e/t-km] (secondary data– emission factor for each fuel) for dif-ferent transport loads for each mode of transport.
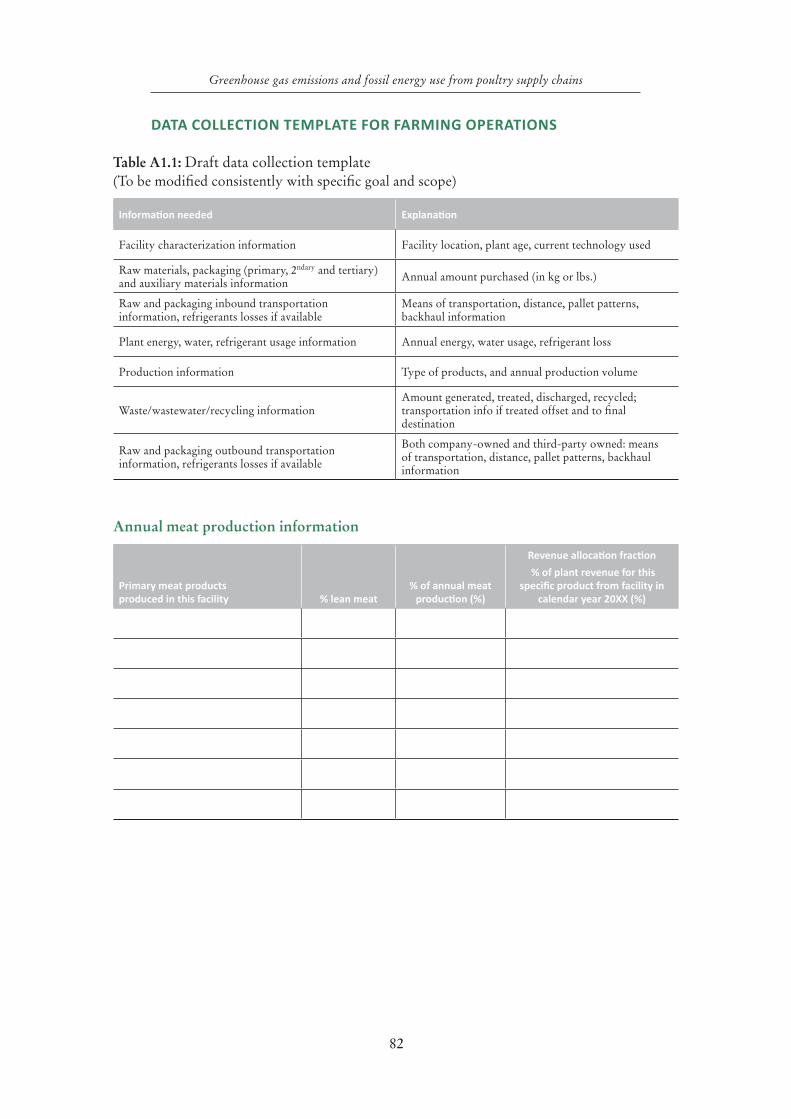
82
Greenhouse gas emissions and fossil energy use from poultry supply chains
DATA COLLECTION TEMPLATE FOR FARMING OPERATIONS
Table A1.1: Draft data collection template (To be modified consistently with specific goal and scope)
Information needed Explanation
Facility characterization information Facility location, plant age, current technology used
Raw materials, packaging (primary, 2ndary and tertiary) and auxiliary materials information Annual amount purchased (in kg or lbs.)
Raw and packaging inbound transportation information, refrigerants losses if available
Means of transportation, distance, pallet patterns, backhaul information
Plant energy, water, refrigerant usage information Annual energy, water usage, refrigerant loss
Production information Type of products, and annual production volume
Waste/wastewater/recycling informationAmount generated, treated, discharged, recycled; transportation info if treated offset and to final destination
Raw and packaging outbound transportation information, refrigerants losses if available
Both company-owned and third-party owned: means of transportation, distance, pallet patterns, backhaul information
Annual meat production information
Primary meat products produced in this facility % lean meat
% of annual meat production (%)
Revenue allocation fraction
% of plant revenue for this specific product from facility in
calendar year 20XX (%)
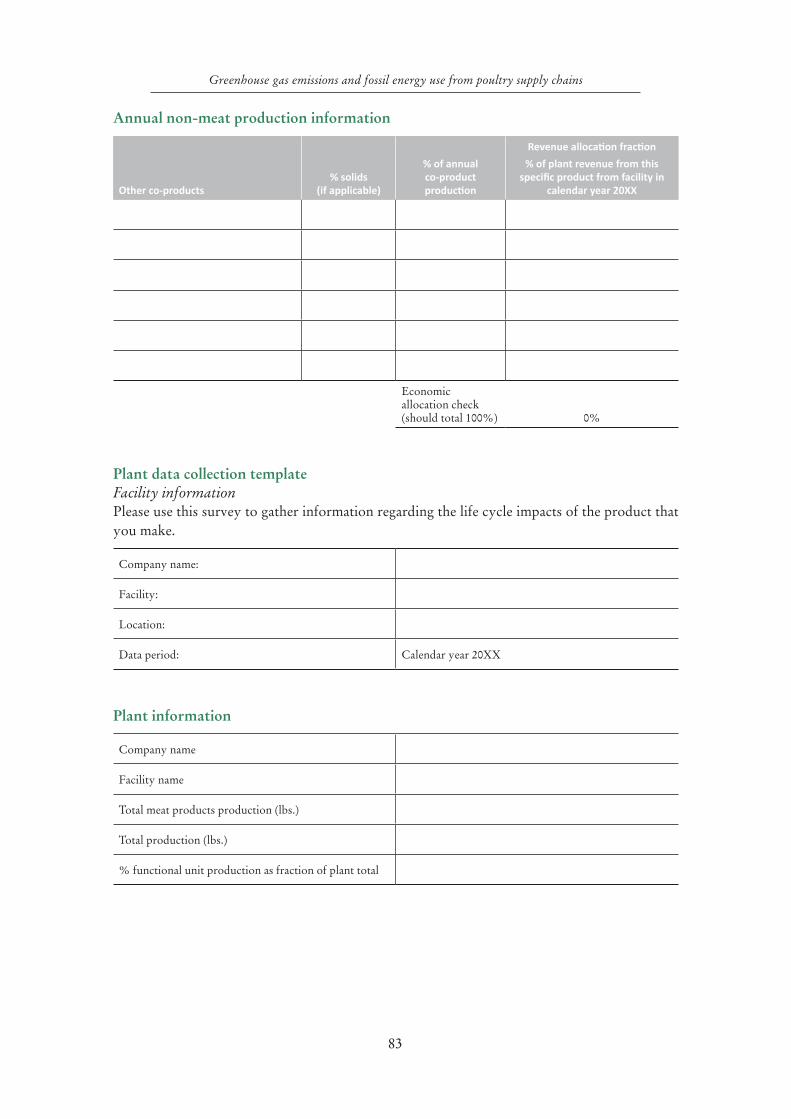
83
Greenhouse gas emissions and fossil energy use from poultry supply chains
Annual non-meat production information
Other co-products% solids
(if applicable)
% of annual co-product production
Revenue allocation fraction
% of plant revenue from this specific product from facility in
calendar year 20XX
Economic allocation check (should total 100%) 0%
Plant data collection templateFacility informationPlease use this survey to gather information regarding the life cycle impacts of the product that you make.
Company name:
Facility:
Location:
Data period: Calendar year 20XX
Plant information
Company name
Facility name
Total meat products production (lbs.)
Total production (lbs.)
% functional unit production as fraction of plant total
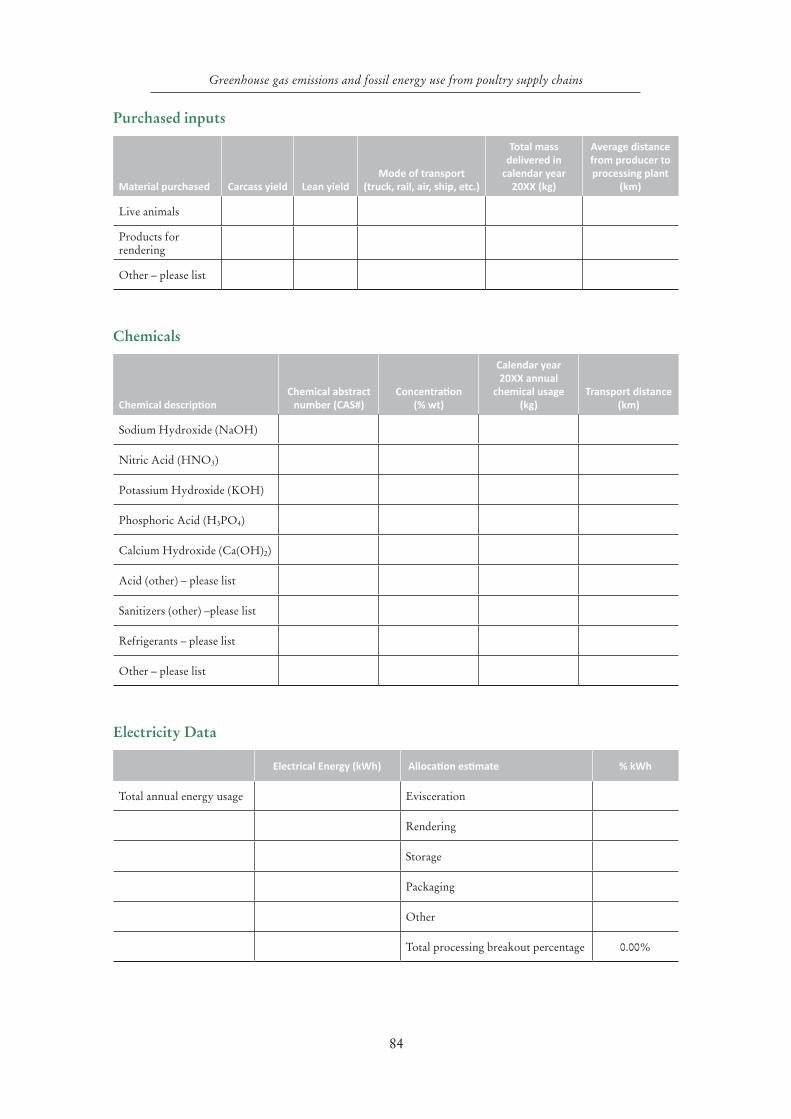
84
Greenhouse gas emissions and fossil energy use from poultry supply chains
Purchased inputs
Material purchased Carcass yield Lean yieldMode of transport
(truck, rail, air, ship, etc.)
Total mass delivered in
calendar year 20XX (kg)
Average distance from producer to processing plant
(km)
Live animals
Products for rendering
Other – please list
Chemicals
Chemical descriptionChemical abstract
number (CAS#)Concentration
(% wt)
Calendar year 20XX annual
chemical usage (kg)
Transport distance (km)
Sodium Hydroxide (NaOH)
Nitric Acid (HNO3)
Potassium Hydroxide (KOH)
Phosphoric Acid (H3PO4)
Calcium Hydroxide (Ca(OH)2)
Acid (other) – please list
Sanitizers (other) –please list
Refrigerants – please list
Other – please list
Electricity Data
Electrical Energy (kWh) Allocation estimate % kWh
Total annual energy usage Evisceration
Rendering
Storage
Packaging
Other
Total processing breakout percentage 0.00%
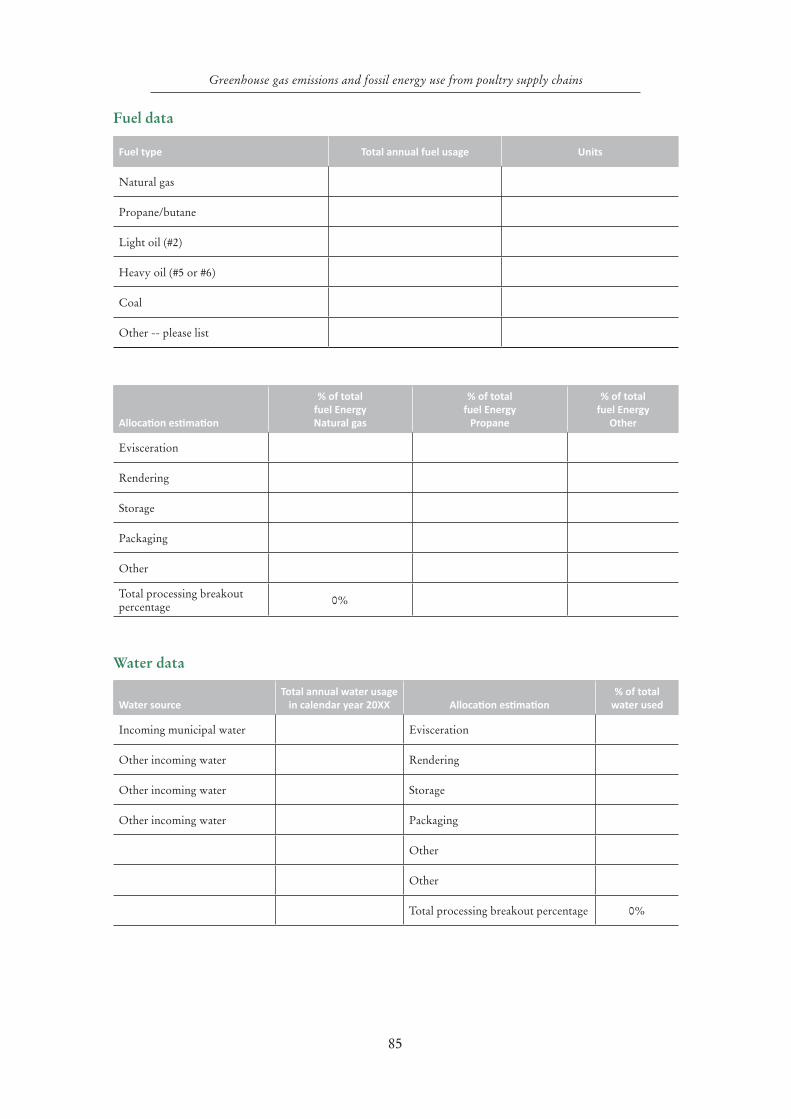
85
Greenhouse gas emissions and fossil energy use from poultry supply chains
Fuel data
Fuel type Total annual fuel usage Units
Natural gas
Propane/butane
Light oil (#2)
Heavy oil (#5 or #6)
Coal
Other -- please list
Allocation estimation
% of total fuel Energy Natural gas
% of total fuel Energy
Propane
% of total fuel Energy
Other
Evisceration
Rendering
Storage
Packaging
Other
Total processing breakout percentage 0%
Water data
Water sourceTotal annual water usage
in calendar year 20XX Allocation estimation% of total
water used
Incoming municipal water Evisceration
Other incoming water Rendering
Other incoming water Storage
Other incoming water Packaging
Other
Other
Total processing breakout percentage 0%
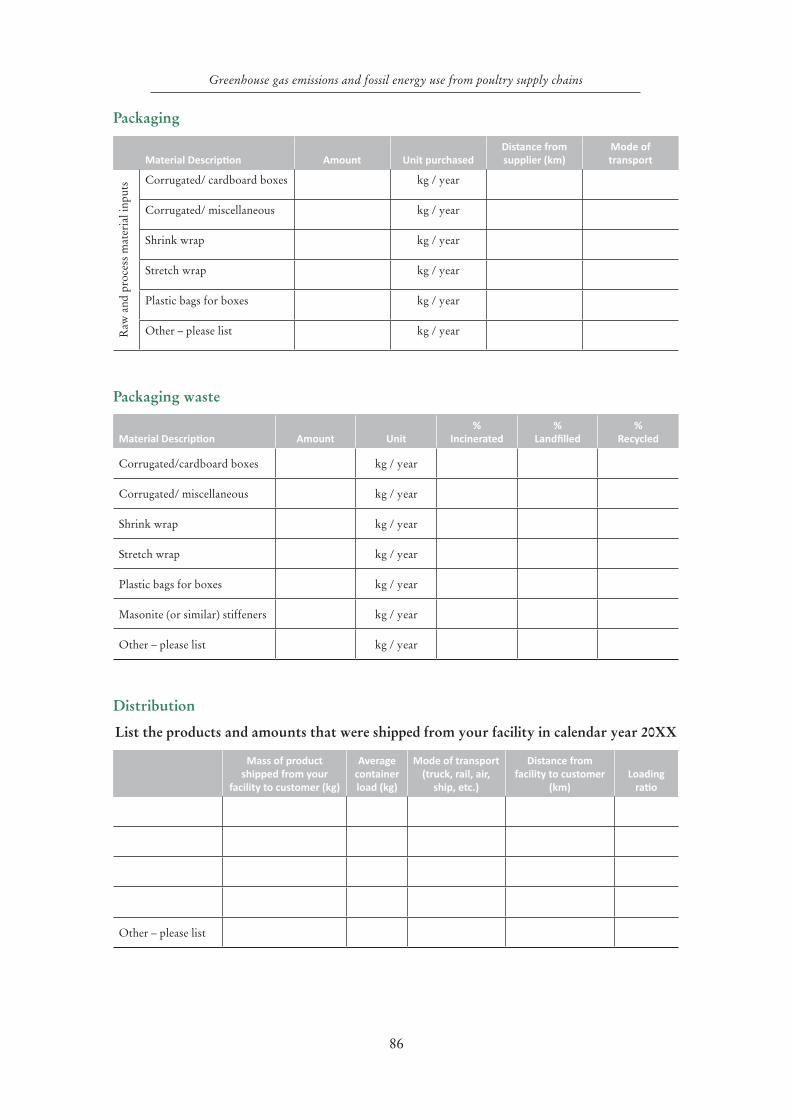
86
Greenhouse gas emissions and fossil energy use from poultry supply chains
Packaging
Material Description Amount Unit purchasedDistance from supplier (km)
Mode of transport
Raw
and
pro
cess
mat
eria
l inp
uts Corrugated/ cardboard boxes kg / year
Corrugated/ miscellaneous kg / year
Shrink wrap kg / year
Stretch wrap kg / year
Plastic bags for boxes kg / year
Other – please list kg / year
Packaging waste
Material Description Amount Unit%
Incinerated%
Landfilled%
Recycled
Corrugated/cardboard boxes kg / year
Corrugated/ miscellaneous kg / year
Shrink wrap kg / year
Stretch wrap kg / year
Plastic bags for boxes kg / year
Masonite (or similar) stiffeners kg / year
Other – please list kg / year
Distribution
List the products and amounts that were shipped from your facility in calendar year 20XX
Mass of product shipped from your
facility to customer (kg)
Average container load (kg)
Mode of transport (truck, rail, air,
ship, etc.)
Distance from facility to customer
(km)Loading
ratio
Other – please list
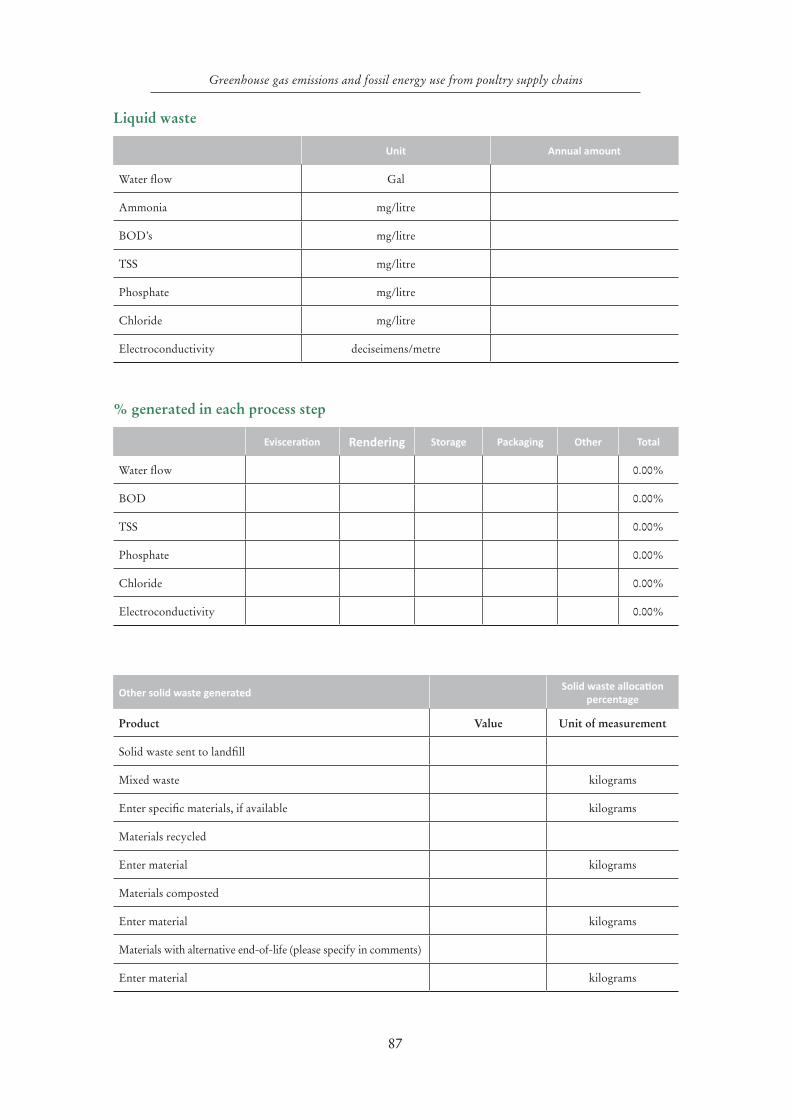
87
Greenhouse gas emissions and fossil energy use from poultry supply chains
Liquid waste
Unit Annual amount
Water flow Gal
Ammonia mg/litre
BOD’s mg/litre
TSS mg/litre
Phosphate mg/litre
Chloride mg/litre
Electroconductivity deciseimens/metre
% generated in each process step
Evisceration Rendering Storage Packaging Other Total
Water flow 0.00%
BOD 0.00%
TSS 0.00%
Phosphate 0.00%
Chloride 0.00%
Electroconductivity 0.00%
Other solid waste generated Solid waste allocation
percentage
Product Value Unit of measurement
Solid waste sent to landfill
Mixed waste kilograms
Enter specific materials, if available kilograms
Materials recycled
Enter material kilograms
Materials composted
Enter material kilograms
Materials with alternative end-of-life (please specify in comments)
Enter material kilograms
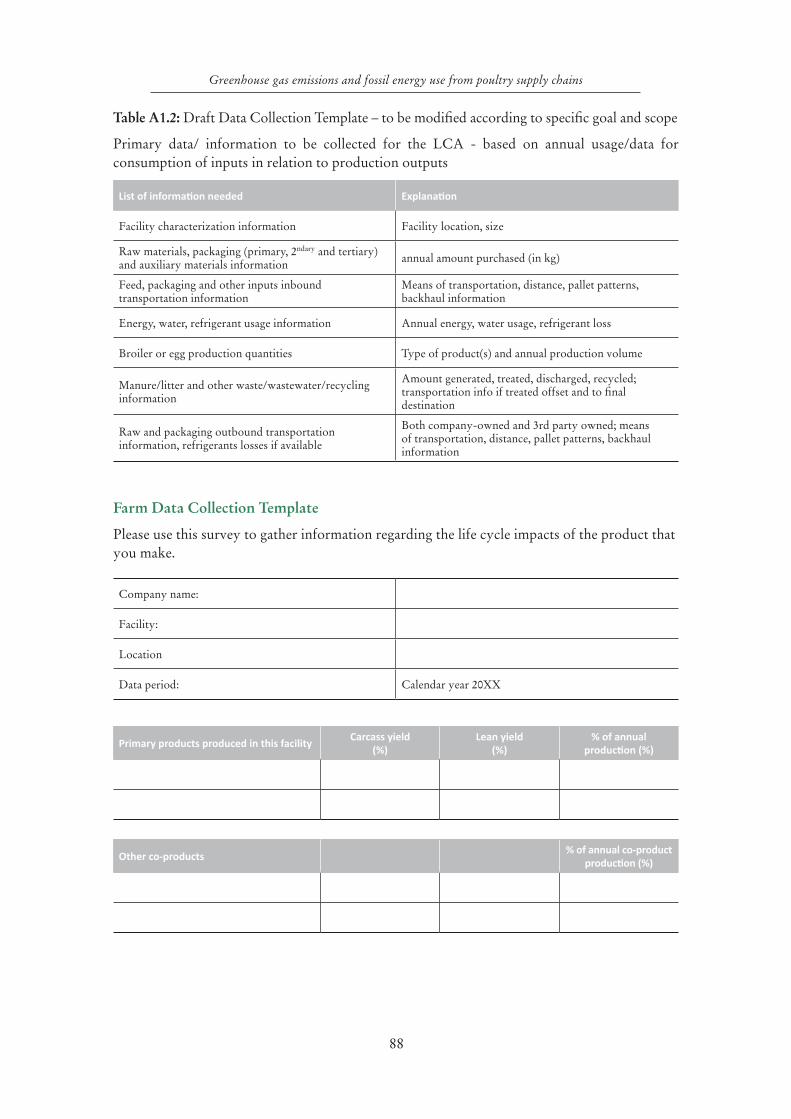
88
Greenhouse gas emissions and fossil energy use from poultry supply chains
Table A1.2: Draft Data Collection Template – to be modified according to specific goal and scope
Primary data/ information to be collected for the LCA - based on annual usage/data for consumption of inputs in relation to production outputs
List of information needed Explanation
Facility characterization information Facility location, size
Raw materials, packaging (primary, 2ndary and tertiary) and auxiliary materials information annual amount purchased (in kg)
Feed, packaging and other inputs inbound transportation information
Means of transportation, distance, pallet patterns, backhaul information
Energy, water, refrigerant usage information Annual energy, water usage, refrigerant loss
Broiler or egg production quantities Type of product(s) and annual production volume
Manure/litter and other waste/wastewater/recycling information
Amount generated, treated, discharged, recycled; transportation info if treated offset and to final destination
Raw and packaging outbound transportation information, refrigerants losses if available
Both company-owned and 3rd party owned; means of transportation, distance, pallet patterns, backhaul information
Farm Data Collection Template
Please use this survey to gather information regarding the life cycle impacts of the product that you make.
Company name:
Facility:
Location
Data period: Calendar year 20XX
Primary products produced in this facilityCarcass yield
(%)Lean yield
(%)% of annual
production (%)
Other co-products% of annual co-product
production (%)
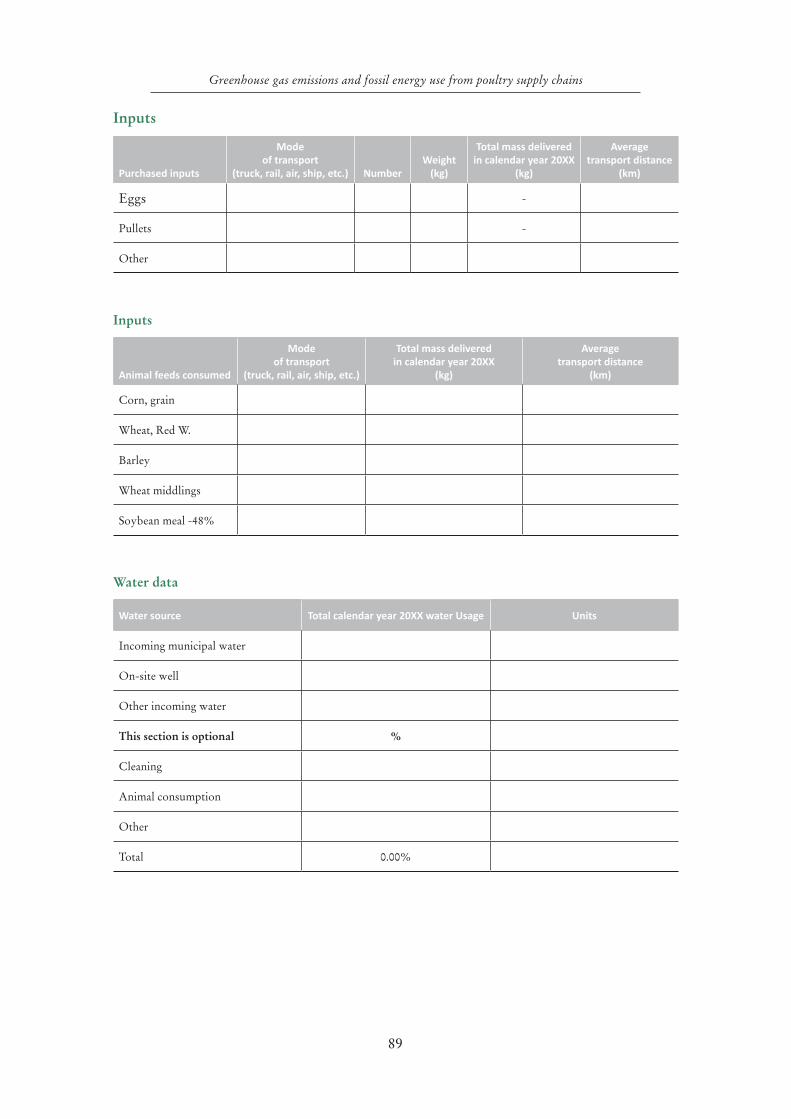
89
Greenhouse gas emissions and fossil energy use from poultry supply chains
Inputs
Purchased inputs
Mode of transport
(truck, rail, air, ship, etc.) NumberWeight
(kg)
Total mass delivered in calendar year 20XX
(kg)
Average transport distance
(km)
Eggs -
Pullets -
Other
Inputs
Animal feeds consumed
Mode of transport
(truck, rail, air, ship, etc.)
Total mass delivered in calendar year 20XX
(kg)
Average transport distance
(km)
Corn, grain
Wheat, Red W.
Barley
Wheat middlings
Soybean meal -48%
Water data
Water source Total calendar year 20XX water Usage Units
Incoming municipal water
On-site well
Other incoming water
This section is optional %
Cleaning
Animal consumption
Other
Total 0.00%
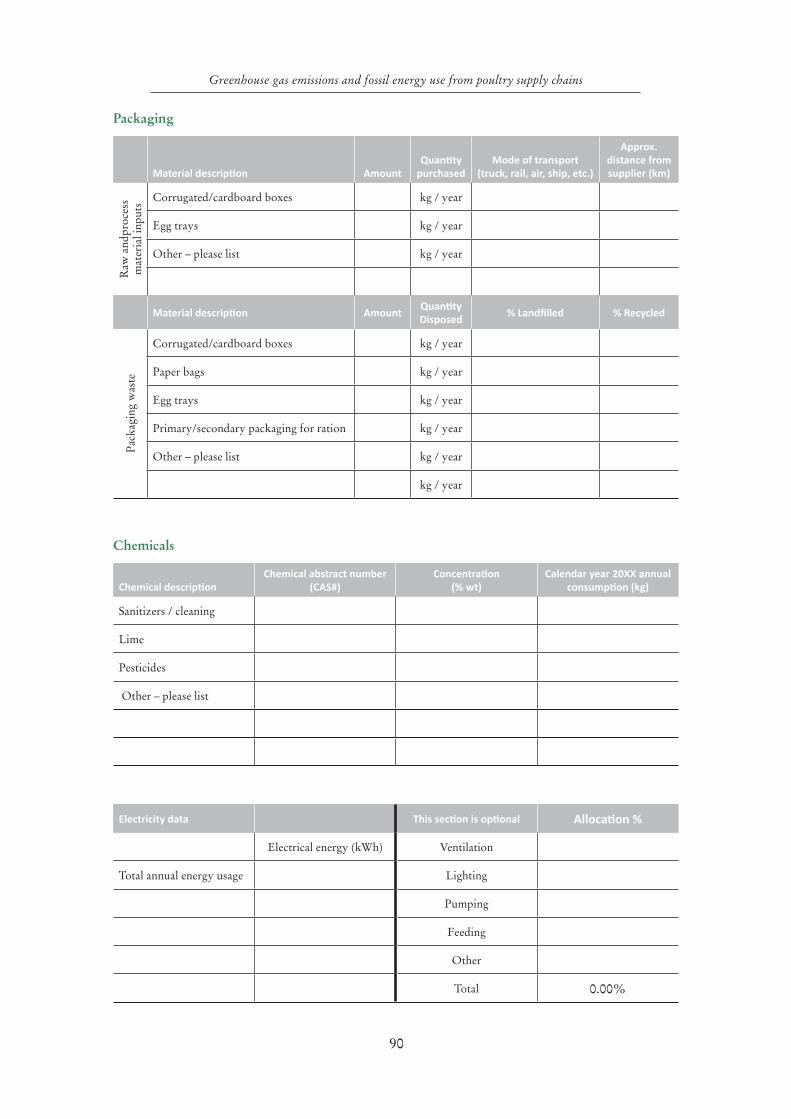
90
Greenhouse gas emissions and fossil energy use from poultry supply chains
Packaging
Material description AmountQuantity
purchasedMode of transport
(truck, rail, air, ship, etc.)
Approx. distance from supplier (km)
Raw
and
proc
ess
m
ater
ial i
nput
s Corrugated/cardboard boxes kg / year
Egg trays kg / year
Other – please list kg / year
Material description AmountQuantity Disposed
% Landfilled % Recycled
Pac
kagi
ng w
aste
Corrugated/cardboard boxes kg / year
Paper bags kg / year
Egg trays kg / year
Primary/secondary packaging for ration kg / year
Other – please list kg / year
kg / year
Chemicals
Chemical descriptionChemical abstract number
(CAS#)Concentration
(% wt)Calendar year 20XX annual
consumption (kg)
Sanitizers / cleaning
Lime
Pesticides
Other – please list
Electricity data This section is optional Allocation %
Electrical energy (kWh) Ventilation
Total annual energy usage Lighting
Pumping
Feeding
Other
Total 0.00%
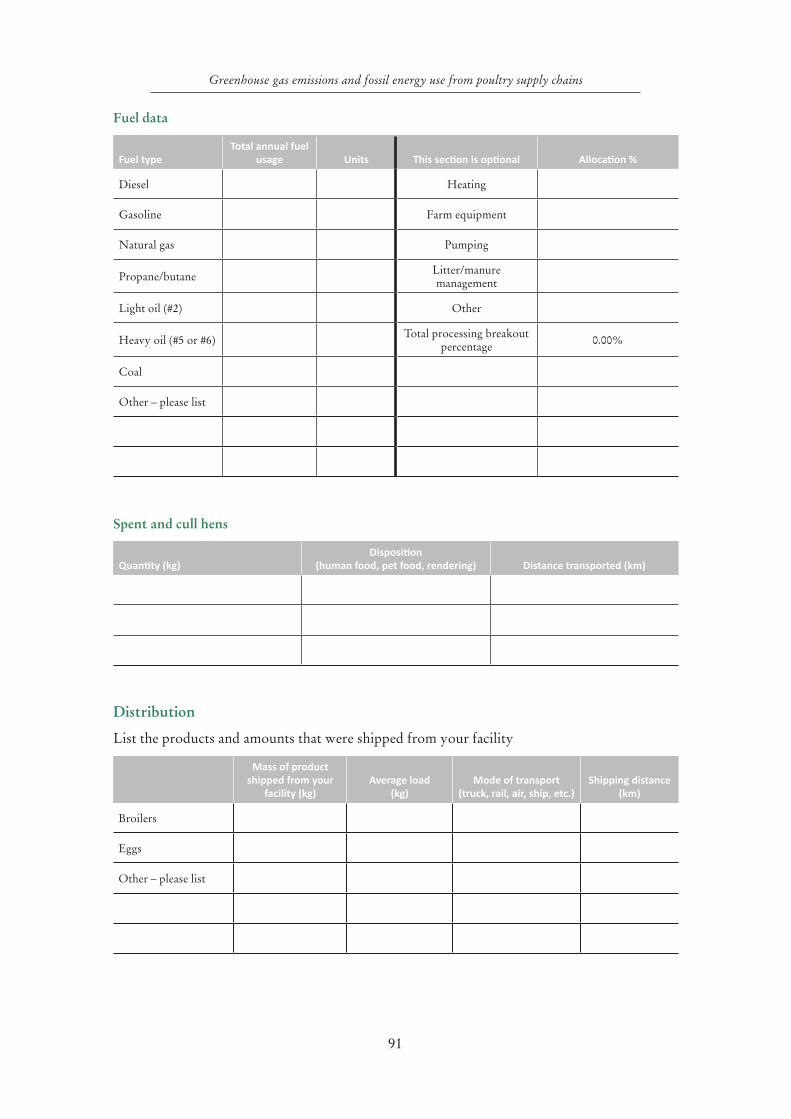
91
Greenhouse gas emissions and fossil energy use from poultry supply chains
Fuel data
Fuel typeTotal annual fuel
usage Units This section is optional Allocation %
Diesel Heating
Gasoline Farm equipment
Natural gas Pumping
Propane/butane Litter/manure management
Light oil (#2) Other
Heavy oil (#5 or #6) Total processing breakout percentage 0.00%
Coal
Other – please list
Spent and cull hens
Quantity (kg) Disposition
(human food, pet food, rendering) Distance transported (km)
Distribution
List the products and amounts that were shipped from your facility
Mass of product shipped from your
facility (kg)Average load
(kg)Mode of transport
(truck, rail, air, ship, etc.)Shipping distance
(km)
Broilers
Eggs
Other – please list
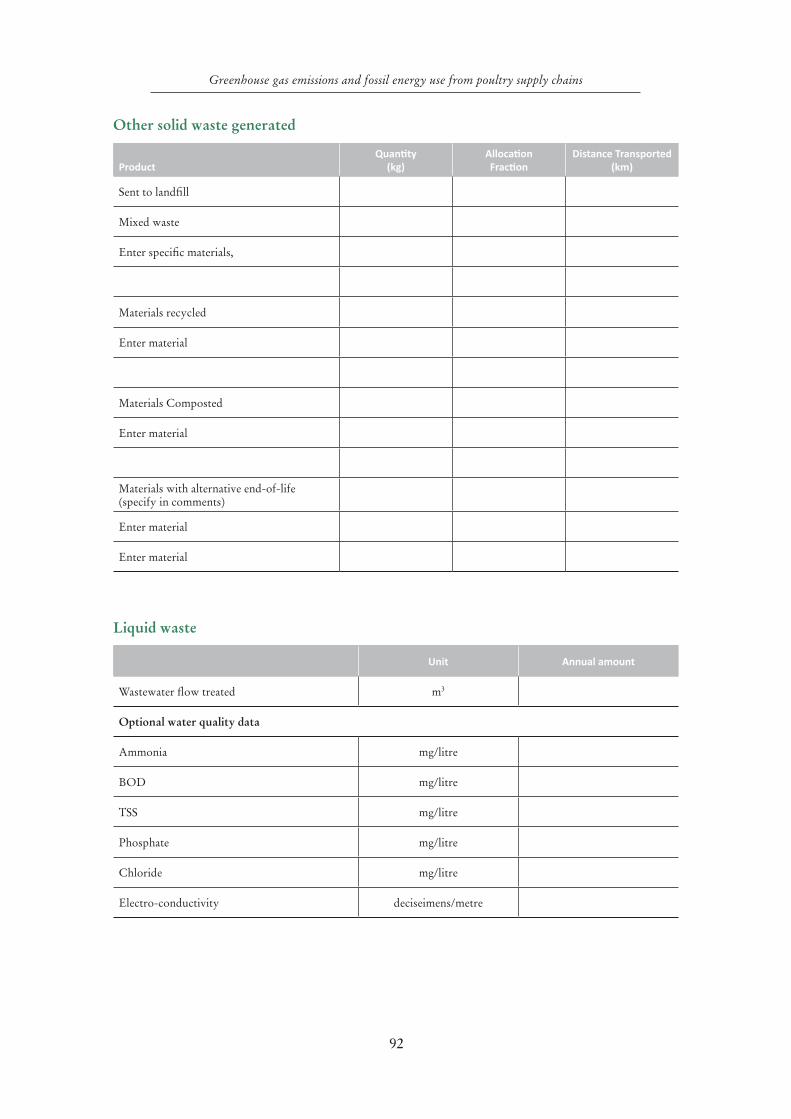
92
Greenhouse gas emissions and fossil energy use from poultry supply chains
Other solid waste generated
ProductQuantity
(kg)Allocation Fraction
Distance Transported (km)
Sent to landfill
Mixed waste
Enter specific materials,
Materials recycled
Enter material
Materials Composted
Enter material
Materials with alternative end-of-life (specify in comments)
Enter material
Enter material
Liquid waste
Unit Annual amount
Wastewater flow treated m3
Optional water quality data
Ammonia mg/litre
BOD mg/litre
TSS mg/litre
Phosphate mg/litre
Chloride mg/litre
Electro-conductivity deciseimens/metre
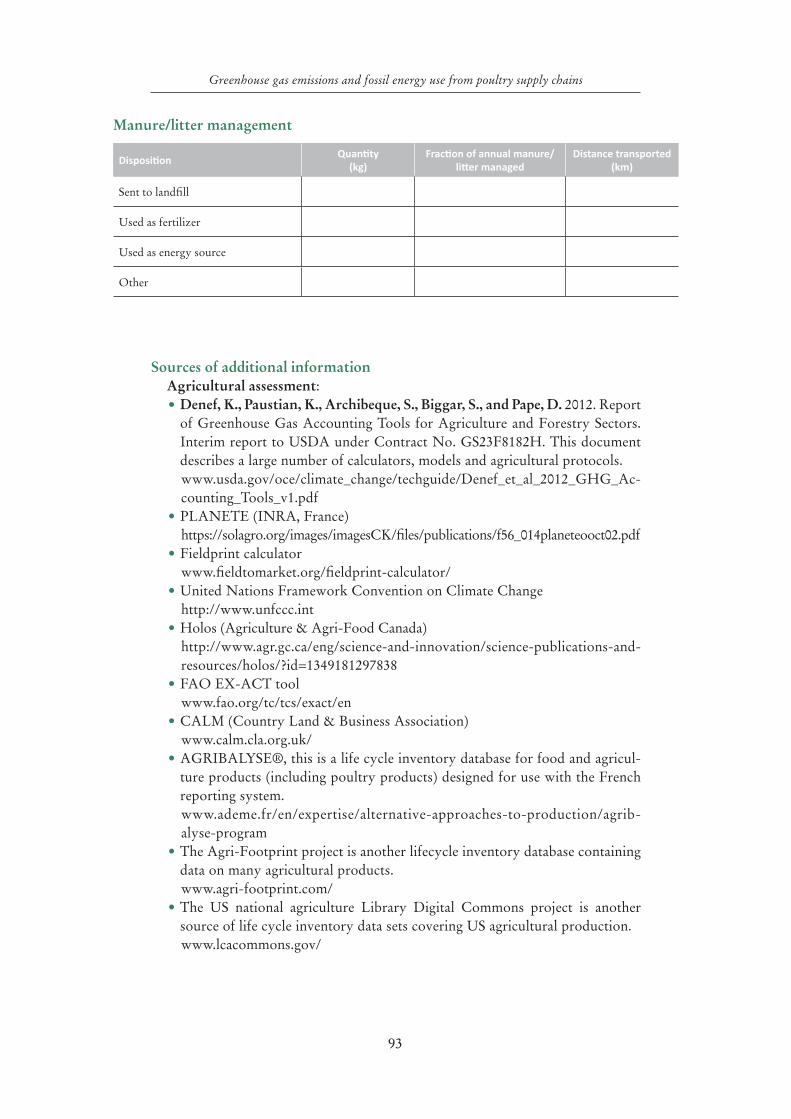
93
Greenhouse gas emissions and fossil energy use from poultry supply chains
Manure/litter management
DispositionQuantity
(kg)Fraction of annual manure/
litter managedDistance transported
(km)
Sent to landfill
Used as fertilizer
Used as energy source
Other
Sources of additional informationAgricultural assessment: •Denef, K., Paustian, K., Archibeque, S., Biggar, S., and Pape, D. 2012. Report
of Greenhouse Gas Accounting Tools for Agriculture and Forestry Sectors. Interim report to USDA under Contract No. GS23F8182H. This document describes a large number of calculators, models and agricultural protocols. www.usda.gov/oce/climate_change/techguide/Denef_et_al_2012_GHG_Ac-counting_Tools_v1.pdf
•PLANETE (INRA, France)https://solagro.org/images/imagesCK/files/publications/f56_014planeteooct02.pdf
•Fieldprint calculator www.fieldtomarket.org/fieldprint-calculator/
•United Nations Framework Convention on Climate Change http://www.unfccc.int
•Holos (Agriculture & Agri-Food Canada) http://www.agr.gc.ca/eng/science-and-innovation/science-publications-and-resources/holos/?id=1349181297838
•FAO EX-ACT tool www.fao.org/tc/tcs/exact/en
•CALM (Country Land & Business Association) www.calm.cla.org.uk/
•AGRIBALYSE®, this is a life cycle inventory database for food and agricul-ture products (including poultry products) designed for use with the French reporting system. www.ademe.fr/en/expertise/alternative-approaches-to-production/agrib-alyse-program
•The Agri-Footprint project is another lifecycle inventory database containing data on many agricultural products. www.agri-footprint.com/
•The US national agriculture Library Digital Commons project is another source of life cycle inventory data sets covering US agricultural production. www.lcacommons.gov/
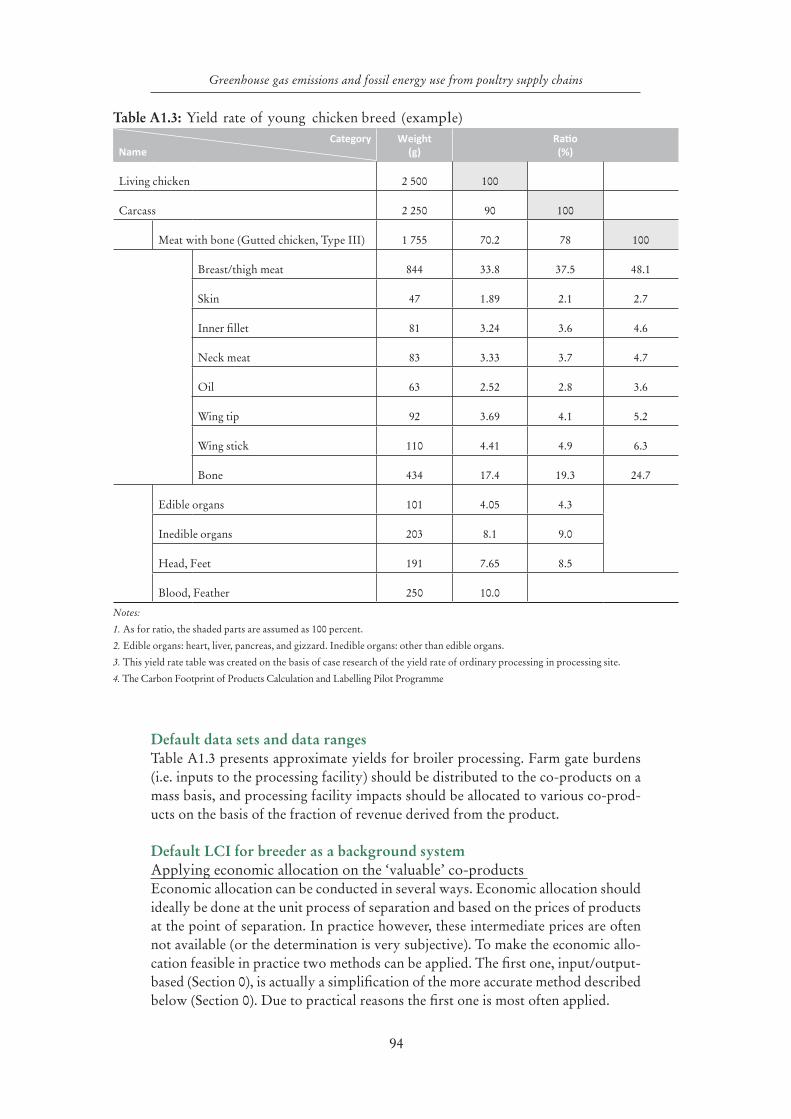
94
Greenhouse gas emissions and fossil energy use from poultry supply chains
Table A1.3: Yield rate of young chicken breed (example)Category
NameWeight
(g)Ratio (%)
Living chicken 2 500 100
Carcass 2 250 90 100
Meat with bone (Gutted chicken, Type III) 1 755 70.2 78 100
Breast/thigh meat 844 33.8 37.5 48.1
Skin 47 1.89 2.1 2.7
Inner fillet 81 3.24 3.6 4.6
Neck meat 83 3.33 3.7 4.7
Oil 63 2.52 2.8 3.6
Wing tip 92 3.69 4.1 5.2
Wing stick 110 4.41 4.9 6.3
Bone 434 17.4 19.3 24.7
Edible organs 101 4.05 4.3
Inedible organs 203 8.1 9.0
Head, Feet 191 7.65 8.5
Blood, Feather 250 10.0
Notes:
1. As for ratio, the shaded parts are assumed as 100 percent.
2. Edible organs: heart, liver, pancreas, and gizzard. Inedible organs: other than edible organs.
3. This yield rate table was created on the basis of case research of the yield rate of ordinary processing in processing site.
4. The Carbon Footprint of Products Calculation and Labelling Pilot Programme
Default data sets and data rangesTable A1.3 presents approximate yields for broiler processing. Farm gate burdens (i.e. inputs to the processing facility) should be distributed to the co-products on a mass basis, and processing facility impacts should be allocated to various co-prod-ucts on the basis of the fraction of revenue derived from the product.
Default LCI for breeder as a background systemApplying economic allocation on the ‘valuable’ co-products Economic allocation can be conducted in several ways. Economic allocation should ideally be done at the unit process of separation and based on the prices of products at the point of separation. In practice however, these intermediate prices are often not available (or the determination is very subjective). To make the economic allo-cation feasible in practice two methods can be applied. The first one, input/output-based (Section 0), is actually a simplification of the more accurate method described below (Section 0). Due to practical reasons the first one is most often applied.
95
Greenhouse gas emissions and fossil energy use from poultry supply chains
Input/output analysis on processing facility levelThe most straightforward and often-encountered simplification is to apply allo-cation on the basis of an input/output analysis of the overall processing facility or group of facilities, i.e. overall input/output process. This means that the total inputs and related LCI data (at the operation and upstream) are divided over the products on the basis of their relative contribution to the overall revenue. In fact this method is not precise enough because differences in processing after separation can cause differences in resource inputs and emissions and valorisation of the co-products. If the environmental inputs and emissions and the valorisation are similar and especially if the majority of the impacts take place before separation, so that the additional impacts after separation are relatively small, economic-based attribution will not change very much. Under these conditions the input/output analysis on processing facility level gives a rather good estimate for the more precise economic allocation method starting at the specific unit process and then including the life steps afterwards.
Economic allocation at the specific separation process The method should in principle not be applied if the ‘after separation processes’ differ significantly between the co-products, regarding resource inputs, emissions or valorization (relatively to pre- processing steps). Here, a more precise economic allocation based on resource inputs and emissions per co-product production route and associated economic valorization provides significantly different results. Since there is a high need for conducting this allocation of which a part of the data is very hard to obtain, input/output-based data are sometimes suggested.
96
Greenhouse gas emissions and fossil energy use from poultry supply chains
Appendix 2
Literature review
This document was prepared as part of the UN FAO partnership for Livestock En-vironmental Assessment and Performance Partnership (LEAP) technical advisory group for poultry. The intention of this document is to provide an overview assess-ment existing studies and associated methods that have used life cycle assessment for evaluation of poultry meat and egg supply chains. 18 studies have been identi-fied addressing aspects of the poultry supply chain or egg supply chain (Bengts-son & Seddon, 2013; Boggia et al, 2010; da Silva et al, 2012; da Silva et al, 2008a; da Silva et al., 2008b; Dekker et al., 2008; Dekker et al., 2013; Dekker et al., 2011; Dekker, 2012; Ellingsen and Aanondsen, 2006; Katajajuuri et al., 2008; Leinonen et al., 2012a, 2012b; Lesschen et al, 2011; Marino et al., 2011; Palm, 2010; Pelletier, 2008; JEMAI 2011a, 2011b; Verge et al, 2009; Weiss & Leip, 2012; Wiedemann et al, 2010; Wiedemann et al, 2012; Wiedemann and McGahan, 2011; Williams et al, 2006). In the remainder of this document will identify the common approaches as well as point out differences in methodological and modelling choices.
GOAL AND SCOPEThe goal and scope of the studies range from hotspot identification (Bengtsson and Seddon, 2013); (Wiedemann and McGahan, 2011; Wiedemann et al., 2012) to com-modity analysis (Williams et al., 2006) to benchmarking for understanding and op-portunities for improvement (Katajajuuri et al., 2008; Wiedemann et al., 2012); (Wie-demann and McGahan, 2011), with several studies that targeted a comparison of pro-duction methods – including other protein sources as well has organic and free-range production and other alternate production methods (Boggia et al., 2010; Lesschen et al., 2011; Leinonen et al., 2012b; Weiss and Leip, 2012; Bengtsson and Seddon, 2013, Dekker et al., 2008, 2011, 2013; Leinonen et al., 2012a). In developing the draft guid-ance and methodology, it was considered important to allow sufficient flexibility to encompass this range of potential reasons for conducting an LCA of poultry or eggs.
GEOGRAPHIC REGIONThere are a number of studies focused on either individual countries in Europe or the EU27 (Williams et al., 2006; Dekker et al., 2008; Katajajuuri et al., 2008; Boggia et al., 2010; Lesschen et al., 2011; da Silva et al., 2012; Leinonen et al., 2012b; Weiss and Leip, 2012), the United States (Pelletier, 2008), Brazil (da Silva et al., 2008a; b), and Australia (Wiedemann and McGahan, 2011; Wiedemann et al., 2012; Bengtsson and Seddon, 2013). In reviewing these publications, there do not seem to be signifi-cant differences driven by geographic location, aside from the need for life cycle inventory data that are relevant to that location.
MATERIALITY The question of materiality is related to the cut-off criteria chosen for each study. ISO 14044: 2006 (ISO, 2006), PAS 2050:2011 (BSI, 2011), and PCRs all provide guidance regarding life cycle inventory or emissions impacts which should not be neglected. Only
97
Greenhouse gas emissions and fossil energy use from poultry supply chains
two of the documents reviewed, one for meat (Pelletier, 2008), and one for eggs (Dekker et al., 2008) make specific mention of cut-off criteria. The Environmental Product Dec-laration PCR states that 99 percent of ingredients must be declared a product declaration (Palm, 2010). The Japanese PCR (JEMAI, 2011b) indicates that when cut-off criteria are employed, the cut-off range shall be clearly reported and it shall be stated that cut-off GHG emissions are within 5 percent of the total life cycle GHG emissions (presumably this also applies to other impact categories, although this is not explicitly stated).
FUNCTIONAL UNITThe majority of published studies on poultry meat have specified the functional unit as specified weight chicken meat at the farm or processor gate. Some studies have mixed the system boundary and functional unit by stating a functional unit of a specified weight of edible carcass or simply carcass at the farm gate (Williams et al., 2006; Boggia et al., 2010; Leinonen et al., 2012b; Weiss and Leip, 2012), al-though the definition of edible is not unequivocally defined. Two studies included downstream processing to the point of purchase by the consumer (Katajajuuri et al., 2008; Bengtsson and Seddon, 2013). The studies from da Silva et al. (2008b, 2012) specified a functional unit either a ton of whole chicken, chilled or frozen and delivered to the port of entry. The Environmental Product Declaration PCR refers to 1 kg of meat and associated packaging as the functional unit, specifying ‘pure’ meat exclusive of any inedible portions (Palm, 2010). The Japanese PCR specifies 100 g of product as functional unit, thus allowing flexibility with regard to the in-clusion or exclusion of bones, skin, and fat (JEMAI, 2011a).
For eggs, the functional unit for all but one study is a specified mass of eggs at the farm gate; Williams et al. (2006) used 20 000 eggs as a functional unit.
SYSTEM BOUNDARIESThe system boundary for most of the meat studies is from cradle to farm gate. The definition of ‘cradle’ is variable; for some studies it includes three generations of breeding stock (Williams et al., 2006; Leinonen et al., 2012b; Bengtsson and Seddon, 2013)from cradle to gate, to quantify the environmental burdens per 1,000 kg of eggs produced in the 4 major hen-egg production systems in the United Kingdom: 1; the remainder of the studies either did not specify the upstream boundary or included one generation of breeding plus the hatchery.
The Environmental Product Declaration PCR defines only three primary stages: upstream, core processes, and downstream (Palm, 2010). Upstream processes in-clude feed production, breeding farm, including manure management; core pro-cesses include production (farms, packaging and distribution); downstream pro-cesses include retail, consumer, and end of life for packaging, but not consumer waste. The Japanese PCR (JEMAI, 2011a) is not specific regarding the number of breeding generations to include within the production system boundary. However, it does include analysis of the consumption stage including cooking, dishwashing, food residue and waste container disposal.
ANCILLARY ACTIVITIESThis could include items in the life cycle such as, technical advisors, accounting, legal, corporate overhead (potentially air travel), and workers’ commutes. Only one paper was explicit regarding ancillary activities where corporate and overhead
98
Greenhouse gas emissions and fossil energy use from poultry supply chains
burdens were included (Bengtsson and Seddon, 2013) and it included supporting facilities, but not business travel. The Environmental Product Declaration PCR re-quires that maintenance activities with a frequency of less than three years should be included, that business travel may be included, but that workers’ daily commutes are excluded (Palm, 2010). The Japanese PCR does not explicitly mention ancillary activities.
BIOGENIC CARBON/METHANEFew of the studies mentioned biogenic carbon, only one treats biogenic methane differently from fossil methane by assigning global warming potential 24 to account for the fact that the carbon dioxide decay product in the atmosphere was biogenic in origin (Wiedemann et al., 2012). The Environmental Product Declaration PCR provides for separate, optional reporting of biogenic carbon dioxide (Palm, 2010). The Japanese PCR (JEMAI, 2011a) does not mention biogenic carbon.
SOIL CARBON / SEQUESTRATIONOnly one study comparing livestock greenhouse gas emissions in Europe included soil carbon sequestration for grasslands and crops (Weiss and Leip, 2012). Lesschen et al. (2011) discussed but did not account for soil carbon sequestration in their analysis. The Environmental Product Declaration PCR provides for optional re-porting in this category (Palm, 2010), while the Japanese PCR explicitly excludes soil carbon accounting because it states there is no internationally agreed protocol in this regard.
LAND USEIndirect land-use change was not accounted for in any of the studies; however di-rect land-use change for recent (less than 20 years) conversion was included on a country specific basis (in particular for palm and soy) in several studies (da Silva et al., 2008a, 2012; Leinonen et al., 2012a; b; Weiss and Leip, 2012)from cradle to gate, to quantify the environmental burdens per 1,000 kg of eggs produced in the 4 major hen-egg production systems in the United Kingdom: 1. Three studies accounted for land occupation, but did not explicitly mention land-use change (Williams et al., 2006; Dekker et al., 2008; Boggia et al., 2010). The PAS 2050:2011 (BSI, 2011) method for accounting for land-use change has been adopted by the ENVIFOOD Protocol (Food SCP RT, 2013).
DELAYED EMISSIONSNone of the studies mentioned delayed emissions. This refers to activities or ma-terials for which emissions are postponed; sometimes well into the 100-year time horizon that is frequently adopted for greenhouse gas emissions. Examples include packaging disposed in landfills, or materials such as leather (for which there may not be an analogue in the poultry sector).
CAPITAL GOODSThere is a range of approaches in accounting for capital infrastructure. It is either not mentioned or excluded in the majority of studies. Some studies did count, to some extent, infrastructure in the supply chain (Williams et al., 2006; Dekker et al., 2008; Leinonen et al., 2012a; b)from cradle to gate, to quantify the environmental
99
Greenhouse gas emissions and fossil energy use from poultry supply chains
burdens per 1,000 kg of eggs produced in the 4 major hen-egg production systems in the United Kingdom: 1. The actual extent of inclusion is not completely clear from the studies. For example, one reports inclusion of infrastructure for machin-ery but not for fertilizer or fuel manufacture and delivery – apparently suggesting that foreground machinery is included, but background system infrastructure is not. The Environmental Product Declaration PCR states that if the lifetime of an item is greater than three years, then it is to be excluded from the inventory (Palm, 2010). The Japanese PCR (JEMAI, 2011a) does not provide specific guidance on infrastructure.
HANDLING MULTIFUNCTIONAL PROCESSESThe two predominant choices for allocation are economic value and system expan-sion. However some other approaches are taken, including mass allocation, gross chemical energy content, and physical/cost relationships. One study used a rea-soned, but arguably arbitrary, system separation (Lesschen et al., 2011).
LITTER/MANUREMost of the studies accounted for an offset credit, based on the available nutrient content of manure as a displacement for inorganic fertilizers. Recent studies (Wi-edemann et al., 2012) which included electricity production from litter used system expansion of the grid mix in the United Kingdom.
PROCESSINGOnly the Japanese PCR (JEMAI, 2011a) provides detail regarding this stage. It pro-vides default values for different parts of the chicken. This has been reproduced in Section 0.
REFERENCESBengtsson, J. & Seddon, J. 2013. Cradle to retailer or quick service restaurant gate
life cycle assessment of chicken products in Australia. Journal of Cleaner Produc-tion, 41: 291–300.
Boggia, A., Paolotti, L. & Castellini, C. 2010. Environmental impact evaluation of conventional, organic and organic-plus poultry production systems using life cycle assessment. World’s Poultry Science Journal, 66: 95–114.
BSI. 2011. PAS 2050-2011 Specification for the measurement of the embodied green-house gas emissions in products and services. London.
Da Silva, V.P., Soares, S.R. & de Alvarenga, R.A. 2008a. Brazilian poultry : a study of production and supply chains for the accomplishment of a LCA study. In T. Nemecek & G. Gaillard, eds. Proceedings of the 6th International Conference on LCA in the Agri-Food Sector – Towards a sustainable management of the Food chain. November 12–14, 2008, Zurich, Switzerland, Agroscope Reckenholz-Tän-ikon Research Station ART.
Da Silva, V.P., Soares, S.R. & de Alvarenga, R.A. 2008b. Cradle to gate study of two differing Brazilian poultry production systems. In T. Nemecek & G. Gail-lard, eds. Proceedings of the 6th International Conference on LCA in the Agri-Food Sector – Towards a sustainable management of the Food chain. November 12–14, 2008, Zurich, Switzerland, Agroscope Reckenholz-Tänikon Research Sta-tion ART.
100
Greenhouse gas emissions and fossil energy use from poultry supply chains
Da Silva, V.P., Cherubini, E. & Soares, S.R. 2012. Comparison of two production scenarios of chickens consumed in France. In M.S. Corson & H.M.G. der Werf, eds. Proceedings of the 8th International Conference on Life Cycle Assessment in the Agri-Food Sector (LCA Food 2012), 1–4 October 2012, Saint Malo, France, pp. 20-25. Rennes, France, INRA
Dekker, S.E.M. 2012. Exploring ecological sustainability in the production chain of organic eggs. Wageningen University.
Dekker, S.E.M., de Boer, I.J.M., Arnink, A.J.A. & Groot Koerkamp, P.W.G. 2008. Environmen-tal hotspot identification of organic egg production. In T. Nemecek & G. Gaillard, eds. Proceedings of the 6th International Conference on LCA in the Agri-Food Sector – Towards a sustainable management of the Food chain. November 12–14, 2008, Zurich, Switzerland, Agroscope Reckenholz-Tänikon Research Station ART.
Dekker, S.E.M., de Boer, I.J.M., Vermeij, I., Aarnink, A.J.A., & Groot Koerkamp, P.W.G. 2011. Ecological and economic evaluation of Dutch egg production sys-tems. Livestock Science, 139: 109–121.
Dekker, S.E.M., de Boer, I.J.M., van Krimpen, M., Aarnink, A.J.A., and Groot Koerkamp, P.W.G. 2013. Effect of origin and composition of diet on ecological impact of the organic egg production chain. Livestock Science, 151: 271–283.
Ellingsen, H., & Aanondsen, S.A. 2006. Environmental impacts of wild caught cod and farmed salmon—a comparison with chicken. International Journal of Life Cycle Assessment, 1:60–65. doi: 10.1065/lca2006.01.236.
Food SCP RT. 2013. ENVIFOOD Protocol, Environmental Assessment of Food and Drink Protocol. European Food Sustainable Consumption and Production Round Table (SCP RT), Working Group 1, Brussels, Belgium.
ISO. 2006c. ISO 14044:2006 Environmental management -- Life cycle assessment - Requirements and Guidelines. Geneva, Switzerland.
JEMAI. 2011a. PA-CP-01 Chicken. Product Category Rule, Carbon Footprint of Product Communication Program. Japan Environmental Management Asso-ciation for Industry (available at http://www.cms-cfp-japan.jp/english/pcr/pcrs.html).
JEMAI. 2011a. PA-CN-01 Market poultry eggs. Product Category Rule, Carbon Footprint of Product Communication Program. Japan Environmental Manage-ment Association for Industry (available at http://www.cms-cfp-japan.jp/eng-lish/pcr/pcrs.html).
Katajajuuri, J.-M., Grönroos, J. & Usva, K. 2008.. Environmental impacts and related options for improving the chicken meat supply chain. In T. Nemecek & G. Gaillard, eds. Proceedings of the 6th International Conference on LCA in the Agri-Food Sector – Towards a sustainable management of the Food chain. November 12–14, 2008, Zurich, Switzerland, Agroscope Reckenholz-Tänikon Research Station ART.
Leinonen, I., Williams, A.G., Wiseman, J., Guy, J. & Kyriazakis, I. 2012a. Predict-ing the environmental impacts of chicken systems in the United Kingdom through a life-cycle assessment: broiler production systems. Poultry Science, 91(1): 8-25.
Leinonen, I., Williams, A.G., Wiseman, J., Guy, J. & Kyriazakis, I. 2012b. Pre-dicting the environmental impacts of chicken systems in the United Kingdom through a life-cycle assessment: egg production systems. Poultry Science, 91(1): 26–40.
101
Greenhouse gas emissions and fossil energy use from poultry supply chains
Lesschen, J.P., van den Berg, M., Westhoek, H.J., Witzke, H.P. & Oenema, O. 2011. Greenhouse gas emission profiles of European livestock sectors. Animal Feed Science and Technology, 166-167: 16–28.
Marino, C.T., Otero, W.G., Rodrigues, P.H.M., DiCostanzo, A., Millen, D.D., Pacheco, R.L.D., DiLorenzo, N., Martins, C.L. and Arrigoni, M.D.B., 2011. Effects of adding polyclonal antibody preparations on ruminal fermentation pat-terns and digestibility of cows fed different energy sources. Journal of animal science, 89(10), pp.3228-3235.
Palm, D. 2010. Product Category Rules for the assessment of the environmental per-formance of meat of fresh or chilled poultry (UN CPC 2112) and meat of frozen poultry (UN CPC 2114). Environmental Product Declaration.
Pelletier, N. 2008. Environmental performance in the US broiler poultry sector. Ag-ricultural Systems, 98: 67–73.
Vergé, X.P.C., Dyer, J.A., Desjardins, R.L. & Worth, D. 2009. Long-term trends in greenhouse gas emissions from the Canadian poultry industry. Journal of Applied Poultry Research, 18: 12.
Weiss, F. & Leip, A. 2012. Greenhouse gas emissions from the EU livestock sector: a life cycle assessment carried out with the CAPRI model Agriculture. Ecosystems and the Environment, 149: 124–34.
Wiedemann, S.G. & McGahan, E.J. 2011. Environmental assessment of an egg production supply chain using life cycle assessment. Final project report. A report for the Australian Egg Corporation Limited.
Wiedemann, S.G., McGahan, E. & Poad, P. 2012. Using life cycle assessment to quantify the environmental impact of chicken meat production. Publication, No.12/029. Canberra, Rural Industries Research and Development.
102
Greenhouse gas emissions and fossil energy use from poultry supply chains
Appendix 3
Example calculation of allocation for laying operation with manure as a co-product
We consider a laying operation with 1000 layers. The replacement rate for laying hens is 35% such that for a flock average of 1000 birds, 350 are sent to slaughter an-nually. In this example, we do not consider mortality, as only spent hens are includ-ed in calculation of the allocation fraction. In this case there are 3 co-products of the operation: the main product, eggs, spent hens sent to slaughter, and manure which is sold to a nearby power plant as supplemental fuel for electricity production. A biophysical / causal basis for the allocation among the co-products is adopted based on the feed consumed for each activity. Numerous studies have investigated the par-titioning of feed energy between growth (meat production) and egg (or hatchling) production (Byerly et al., 1980; de Almeida Brainer et al., 2012; Gous and Nonis, 2010; Keshavarz and Nakajima, 1995; Sakomura et al., 2003; Spratt et al., 1990). The NRC (1994) reports the following equation for metabolizable energy requirement in kcal per hen per day:
ME =W0.75 (173 -1.95T)+5.5∆W+2.07EM (1)
Where W is the hen weight (kg), T is the temperature (0C), ΔW is the change in body weight (g/day) and EM is the egg mass produced per day. Thus the ME re-quirement is partitioned into maintenance, growth and production. There are some reported variations in the partitioning reported in the literature, and if specific rela-tionships exist for the particular genetic line under study, those relationships may be substituted – for example, Romero et al. (2009)144 hens were caged and randomly assigned to 1 of 2 feed allocation treatments (72 birds each report a temperature term of (111.95 – 0.36T), gain term of 3.36 (kcal ME/day per g/d of gain) and egg production partition coefficient of 2.10 (kcal ME/day per g/d egg mass).
Emmans (1994) describes an energy partitioning scheme in which the mainte-nance energy is further partitioned into basal metabolism, feeding and digestion, and protein and lipid synthesis. For purposes of the allocation calculation, in par-ticular regarding manure, the energy of feeding and digestion are relevant. This en-ergy is called the heat increment of maintenance feeding (HIM) and Emmans (1994) demonstrates that it can be shown to be primarily a function of the feed not the animal, and thus the following relationship is applicable across species:
HIM (kJ) = wd FOM + wuUN + wmMTHE (2)
Where: HIM= heat increment of maintenance feeding, wd = 3.8 kJ/g FOM; FOM = faecal organic matter (g/d); wu = 29.2 kJ/g urine nitrogen; UN = urine nitro-gen (g N/day); wm = 0.616 kJ/kJ methane; MTHE = methane production (kJ/day).
103
Greenhouse gas emissions and fossil energy use from poultry supply chains
For non-ruminants, the methane term is considered negligible. Note that this is not equivalent to energy content in faeces, but rather an estimate of the utilisation of feed energy for the purpose of processing the feed into useful nutrients and creating the excreta. At a maintenance diet, defined as one in which there is no protein or lipid deposition (i.e. no growth), the quantity of urine nitrogen must be DCP/6.25, where DCP = digestible crude protein, since by definition no nitrogen is retained (there will be catabolic conversion in the animal, rather than simple passing of the dietary protein, but the net retention, at maintenance diet, must be zero). The FOM can be estimated from the organic matter digestibility as: FOM = (1-D) OM, where OM is organic matter in the diet. During growth and production, additional feed will be consumed above that required for maintenance, and the same relationships can be applied as an approximation of the heat increment for feeding. Thus the FOM is derived from organic matter digestibility, and would include passage of undigested proteins in the feed. The estimate of urine nitrogen based on amount of digestible crude protein will also approximate urine protein in the absence of mea-sured values of urea nitrogen in the combined faeces.
Using the NRC relationship for metabolizable energy requirement and a typical production cycle: Phase 1 from first laying to maximum production at 36 weeks (assumed 88% in this example); Phase 2 with declining egg production until forced moulting at 65 weeks, followed by an increased production back to 80% through the productive life of the animal (assumed 100 weeks), when the spent animals are sent for slaughter. Mortality does not enter into the calculation of the allocation fraction, but is accounted in the final calculations as waste stream. For this scenario, the average spent hen weight was 3.3 kg and thus the ME requirement for weight gain is [3300-60 (hatchling weight)]*5.5kcal/g gain = 17820 kcal and the ME re-quirement for egg mass produced in 100 weeks is [23.3 kg]*2.07kcal/g = 48231 kcal.
The calculation for the heat increment of feeding, in order to determine the al-location to manure, is outlined for the corn grain as follows (the HIF is calculated for each feed ingredient, then summed as indicated in the Table A3.1):
The mass of corn (g/d) consumed per day where DFI is the daily feed intake (g/d) of the ration. The protein (g/d) provided by the corn, is partially digested and in the absence of nitrogen retention information, is assumed to be processed by the animal and excreted in the urine, (g N/day). FOM is calculated as the sum of undigested material (undigested protein + undigested non-protein organic matter):
, where the first term is undigested protein and the second term accounts for 88% digestibility of the non-protein components of the remaining organic matter fraction of the corn grain. The heat increment for feeding, for purposes of these guidelines, is considered the energy required to produce the excreta (physiologi-cally speaking, of course, the purpose is to break down the feed ingredients so that they can be absorbed and used by the animal). The total feed consumed over a full cycle of the barn (100 weeks in this case), is needed so that the ME for the HIF can be calculated on the same basis as the egg and meat production. In this case, the feed consumption per bird over the production cycle is 84 kg (1162178 kJ of ME). The HIF is then 0.091*1162178/4.184 = 25276 kcal (4.184 kJ = 1 kcal). Finally the alloca-tion factors for the three co-products are:
It is important that for cyclic operation that data are collected for a sufficient period that all phases are accounted in the analysis. The allocation factors are used to assign the whole operation emissions to the three co-products.
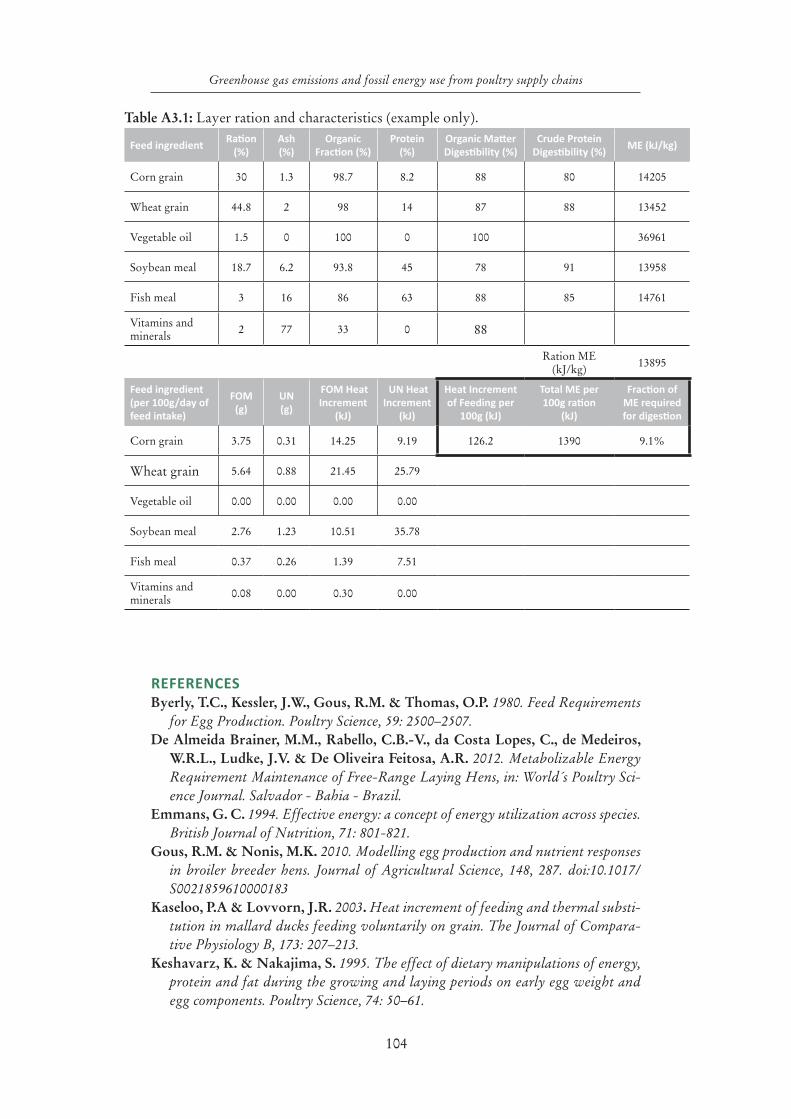
104
Greenhouse gas emissions and fossil energy use from poultry supply chains
Table A3.1: Layer ration and characteristics (example only).
Feed ingredientRation
(%)Ash (%)
Organic Fraction (%)
Protein (%)
Organic Matter Digestibility (%)
Crude Protein Digestibility (%)
ME (kJ/kg)
Corn grain 30 1.3 98.7 8.2 88 80 14205
Wheat grain 44.8 2 98 14 87 88 13452
Vegetable oil 1.5 0 100 0 100 36961
Soybean meal 18.7 6.2 93.8 45 78 91 13958
Fish meal 3 16 86 63 88 85 14761
Vitamins and minerals 2 77 33 0 88
Ration ME (kJ/kg) 13895
Feed ingredient (per 100g/day of feed intake)
FOM (g)
UN (g)
FOM Heat Increment
(kJ)
UN Heat Increment
(kJ)
Heat Increment of Feeding per
100g (kJ)
Total ME per 100g ration
(kJ)
Fraction of ME required for digestion
Corn grain 3.75 0.31 14.25 9.19 126.2 1390 9.1%
Wheat grain 5.64 0.88 21.45 25.79
Vegetable oil 0.00 0.00 0.00 0.00
Soybean meal 2.76 1.23 10.51 35.78
Fish meal 0.37 0.26 1.39 7.51
Vitamins and minerals 0.08 0.00 0.30 0.00
REFERENCESByerly, T.C., Kessler, J.W., Gous, R.M. & Thomas, O.P. 1980. Feed Requirements
for Egg Production. Poultry Science, 59: 2500–2507.De Almeida Brainer, M.M., Rabello, C.B.-V., da Costa Lopes, C., de Medeiros,
W.R.L., Ludke, J.V. & De Oliveira Feitosa, A.R. 2012. Metabolizable Energy Requirement Maintenance of Free-Range Laying Hens, in: World´s Poultry Sci-ence Journal. Salvador - Bahia - Brazil.
Emmans, G. C. 1994. Effective energy: a concept of energy utilization across species. British Journal of Nutrition, 71: 801-821.
Gous, R.M. & Nonis, M.K. 2010. Modelling egg production and nutrient responses in broiler breeder hens. Journal of Agricultural Science, 148, 287. doi:10.1017/S0021859610000183
Kaseloo, P.A & Lovvorn, J.R. 2003. Heat increment of feeding and thermal substi-tution in mallard ducks feeding voluntarily on grain. The Journal of Compara-tive Physiology B, 173: 207–213.
Keshavarz, K. & Nakajima, S. 1995. The effect of dietary manipulations of energy, protein and fat during the growing and laying periods on early egg weight and egg components. Poultry Science, 74: 50–61.
105
Greenhouse gas emissions and fossil energy use from poultry supply chains
NRC (National Research Council). 1994. Nutrient Requirements of Poultry, 9th ed. Washington, D.C.
Romero, L.F., Zuidhof, M.J., Renema, R. A., Naeima, A. & Robinson, F.E. 2009. Characterization of energetic efficiency in adult broiler breeder hens. Poultry Science, 88: 227–35. doi:10.3382/ps.2008-00141
Sakomura, N., Silva, R., Couto, H., Coon, C. & Pacheco, C. 2003. Modeling metabolizable energy utilization in broiler breeder pullets. Poultry Science, 82: 419–427. doi:10.1093/ps/82.3.419
Spratt, R.S., Bayley, H.S., McBride, B.W. & Leeson, S. 1990. Energy Metabolism of Broiler Breeder Hens: 1. The Partition of Dietary Energy Intake. Poultry Sci-ence, 69: 1339–1347.

VERSION 1
Greenhouse gas emissions and fossil energy usefrom poultry supply chains
Guidelines for assessment
http://www.fao.org/partnerships/leap I6421EN/1/11.16