Embed Size (px)
Citation preview
64 ArcUser Winter 2008 www.esri.com
Learning More about Hurricanes
By Joseph J. Kerski, Ph.D. ESRI Education Industry Curriculum Development Manager
What You Will Need• An Internet connection• WinZip (www.winzip.com) or another zipping
utility• Sample data from ArcUser Online
Description File Name
All Hurricanes haralll020.shp
Major Landfalling Hurricanes
hurmjrl020.shp
North American Atlas—Populated Places Data
pop000x_shp
Boundaries for States and Countries
bound_p.shp.
Table 1: Files in the sample dataset
This exercise takes data downloaded from the National Atlas of the United States Web site and further investigates North Atlantic hurricanes using even more powerful tools than those available from the National Atlas Web site. These tools are supplied by ArcExplorer—Java Edition for Education (AEJEE; pronounced “edgy”), ESRI’s free, lightweight but powerful GIS program that runs on both Windows and Macintosh computers.
Getting Dataset and SoftwareTo get started, download the sample data for this exercise from ArcUser Online (www.esri.com/arcuser). Go to the Table of Contents for the Winter 2008 issue, locate this article, and click on the link Get Sample Dataset. The hurricane data is from the National Atlas site. Create a folder called hurricane_analysis and unzip the sample dataset into it. The dataset contains four shapefiles that are described in Table 1. Now download AEJEE from www. esri.com/software/arcexplorer/download-education.html and install it locally.
Getting Started 1. Start AEJEE.2. Select the Add Data button and navigate to
the hurricane_analysis folder. 3. Add the bound_p.shp, hurmjrl020.shp, and
pop_pnt.shp files.4. Save the map and name it hurricanes_2.
AEJEE gives it an AXL (Extended ArcXML) file extension.
5. The AEJEE interface has buttons that access basic tools for zooming in, zooming out, and panning. The button with a globe icon will
zoom the display out to the full extent of the data. Use the Zoom In tool to go to the eastern side of North America, just north of South America.
6. Right-click (or control-click on a Macintosh computer) on each map layer, select Rename, select the existing text, type in the new name, and press Enter to rename that map layer. Rename pop_pnt to Cities, hurmjrl020 to Major Hurricanes, and bound_p.shp to States and Countries.
Symbolizing DataWith a desktop GIS, the map can be symbolized to meet specific needs. 1. Right-click on the States and Countries layer
and choose Properties. Click on the Symbols tab.
2. From the drop down next to Draw Features Using, choose Unique Symbols.
3. Under Field for Values, choose NAME. Under Color Scheme, choose Pastels. Click Apply, then OK.
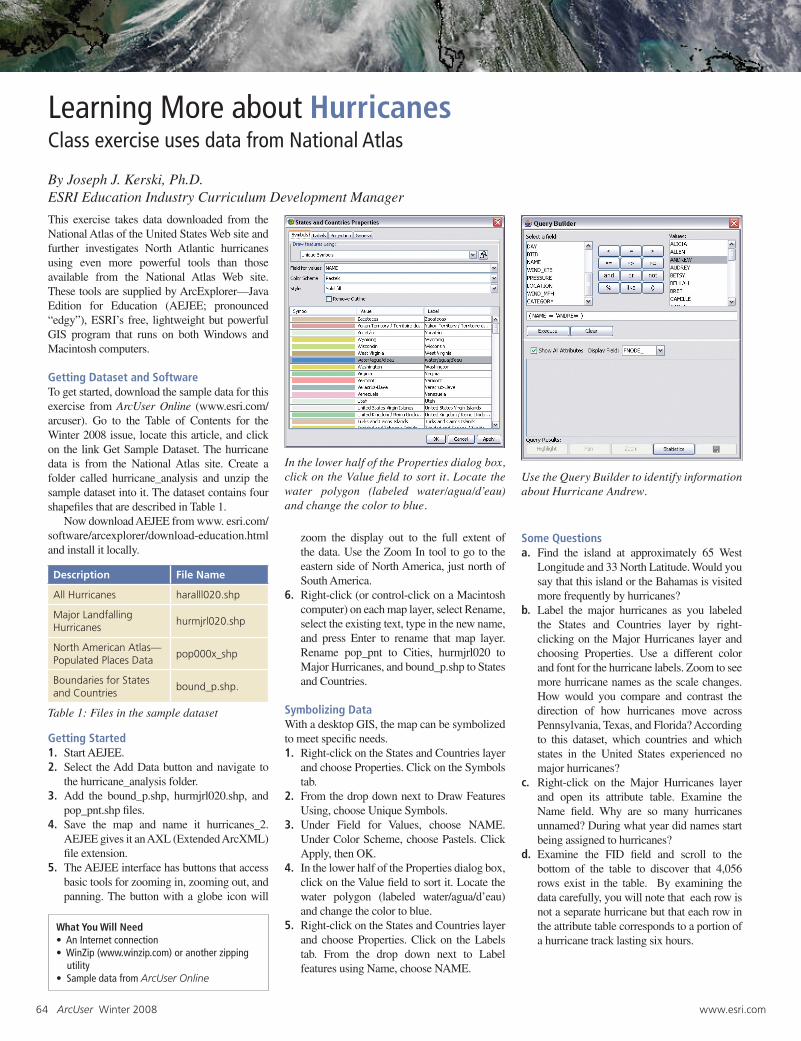
4. In the lower half of the Properties dialog box, click on the Value field to sort it. Locate the water polygon (labeled water/agua/d’eau) and change the color to blue.
5. Right-click on the States and Countries layer and choose Properties. Click on the Labels tab. From the drop down next to Label features using Name, choose NAME.
In the lower half of the Properties dialog box, click on the Value field to sort it. Locate the water polygon (labeled water/agua/d’eau) and change the color to blue.
Use the Query Builder to identify information about Hurricane Andrew.
Some Questionsa. Find the island at approximately 65 West
Longitude and 33 North Latitude. Would you say that this island or the Bahamas is visited more frequently by hurricanes?
b. Label the major hurricanes as you labeled the States and Countries layer by right-clicking on the Major Hurricanes layer and choosing Properties. Use a different color and font for the hurricane labels. Zoom to see more hurricane names as the scale changes. How would you compare and contrast the direction of how hurricanes move across Pennsylvania, Texas, and Florida? According to this dataset, which countries and which states in the United States experienced no major hurricanes?
c. Right-click on the Major Hurricanes layer and open its attribute table. Examine the Name field. Why are so many hurricanes unnamed? During what year did names start being assigned to hurricanes?
d. Examine the FID field and scroll to the bottom of the table to discover that 4,056 rows exist in the table. By examining the data carefully, you will note that each row is not a separate hurricane but that each row in the attribute table corresponds to a portion of a hurricane track lasting six hours.
Class exercise uses data from National Atlas
www.esri.com ArcUser Winter 2008 65
Education
A previous article, “Blowing in the Wind—North Atlantic hurricane analysis using Web GIS,” described how students could explore the nature of hurricanes by mapping GIS data online at the National Atlas of the United States Web site. This article continues with that exploration, this time using free desktop GIS software.
SUMMARY
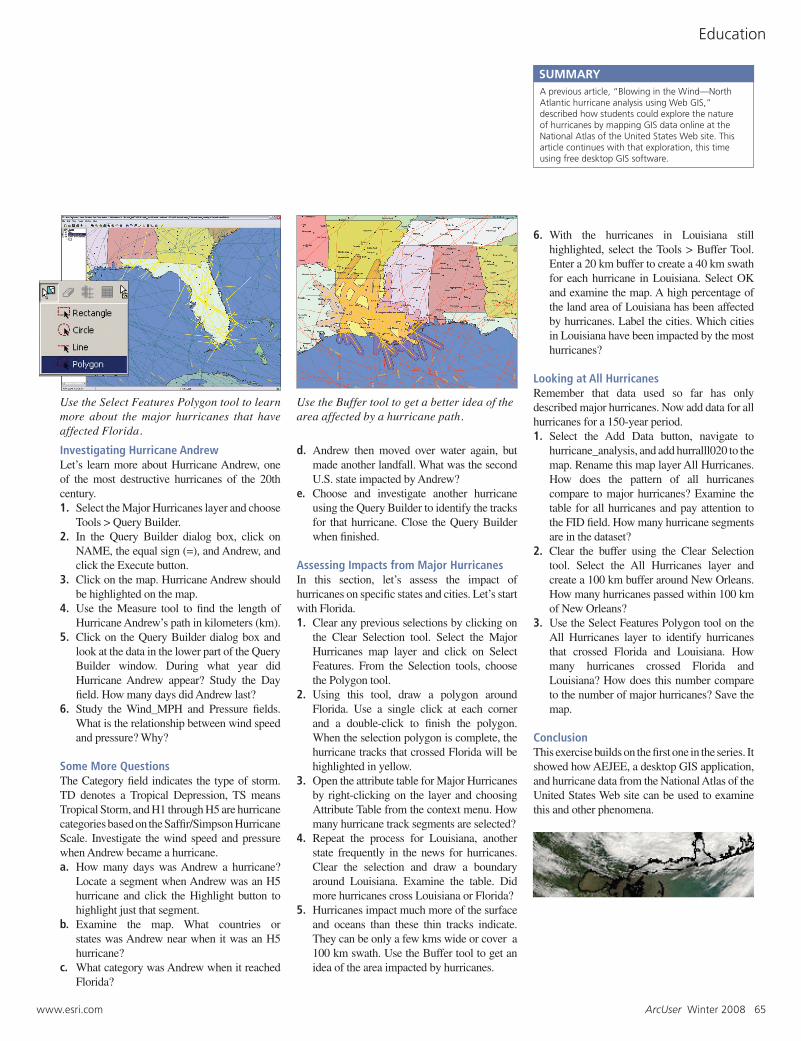
Use the Buffer tool to get a better idea of the area affected by a hurricane path.
Investigating Hurricane AndrewLet’s learn more about Hurricane Andrew, one of the most destructive hurricanes of the 20th century. 1. Select the Major Hurricanes layer and choose
Tools > Query Builder. 2. In the Query Builder dialog box, click on
NAME, the equal sign (=), and Andrew, and click the Execute button.
3. Click on the map. Hurricane Andrew should be highlighted on the map.
4. Use the Measure tool to find the length of Hurricane Andrew’s path in kilometers (km).
5. Click on the Query Builder dialog box and look at the data in the lower part of the Query Builder window. During what year did Hurricane Andrew appear? Study the Day field. How many days did Andrew last?
6. Study the Wind_MPH and Pressure fields. What is the relationship between wind speed and pressure? Why?
Some More QuestionsThe Category field indicates the type of storm. TD denotes a Tropical Depression, TS means Tropical Storm, and H1 through H5 are hurricane categories based on the Saffir/Simpson Hurricane Scale. Investigate the wind speed and pressure when Andrew became a hurricane.a. How many days was Andrew a hurricane?
Locate a segment when Andrew was an H5 hurricane and click the Highlight button to highlight just that segment.
b. Examine the map. What countries or states was Andrew near when it was an H5 hurricane?
c. What category was Andrew when it reached Florida?
Use the Select Features Polygon tool to learn more about the major hurricanes that have affected Florida.
d. Andrew then moved over water again, but made another landfall. What was the second U.S. state impacted by Andrew?
e. Choose and investigate another hurricane using the Query Builder to identify the tracks for that hurricane. Close the Query Builder when finished.
Assessing Impacts from Major HurricanesIn this section, let’s assess the impact of hurricanes on specific states and cities. Let’s start with Florida. 1. Clear any previous selections by clicking on
the Clear Selection tool. Select the Major Hurricanes map layer and click on Select Features. From the Selection tools, choose the Polygon tool.
2. Using this tool, draw a polygon around Florida. Use a single click at each corner and a double-click to finish the polygon. When the selection polygon is complete, the hurricane tracks that crossed Florida will be highlighted in yellow.
3. Open the attribute table for Major Hurricanes by right-clicking on the layer and choosing Attribute Table from the context menu. How many hurricane track segments are selected?
4. Repeat the process for Louisiana, another state frequently in the news for hurricanes. Clear the selection and draw a boundary around Louisiana. Examine the table. Did more hurricanes cross Louisiana or Florida?
5. Hurricanes impact much more of the surface and oceans than these thin tracks indicate. They can be only a few kms wide or cover a 100 km swath. Use the Buffer tool to get an idea of the area impacted by hurricanes.
6. With the hurricanes in Louisiana still highlighted, select the Tools > Buffer Tool. Enter a 20 km buffer to create a 40 km swath for each hurricane in Louisiana. Select OK and examine the map. A high percentage of the land area of Louisiana has been affected by hurricanes. Label the cities. Which cities in Louisiana have been impacted by the most hurricanes?
Looking at All HurricanesRemember that data used so far has only described major hurricanes. Now add data for all hurricanes for a 150-year period.1. Select the Add Data button, navigate to
hurricane_analysis, and add hurralll020 to the map. Rename this map layer All Hurricanes.How does the pattern of all hurricanes compare to major hurricanes? Examine the table for all hurricanes and pay attention to the FID field. How many hurricane segments are in the dataset?
2. Clear the buffer using the Clear Selection tool. Select the All Hurricanes layer and create a 100 km buffer around New Orleans. How many hurricanes passed within 100 km of New Orleans?
3. Use the Select Features Polygon tool on the All Hurricanes layer to identify hurricanes that crossed Florida and Louisiana. How many hurricanes crossed Florida and Louisiana? How does this number compare to the number of major hurricanes? Save the map.
ConclusionThis exercise builds on the first one in the series. It showed how AEJEE, a desktop GIS application, and hurricane data from the National Atlas of the United States Web site can be used to examine this and other phenomena.