Embed Size (px)
Citation preview
Learning Analytics in Higher Education A review of UK and international practice Full report
April 2016
AuthorsNiall SclaterAlice PeasgoodJoel Mullan
“Learning Analytics in Higher Education: A review of UK and international practice”
© Jisc
Published under the CC BY 4.0 licence
creativecommons.org/licenses/by/4.0/
Contents
Executive summary 4Use and impact of learning analytics: lessons from the case studiesAnalytics have been perceived positively by studentsConclusions
81011
1. Introduction 12Motivations for use of student dataBenefits for learners Developments in the UK
121313
2. Learning analytics: a new and rapidly developing field 15Defining learning analyticsCan analytics predict academic success?
1515
3. How learning analytics works 17Data sourcesTechnical infrastructure
1718
4 Findings and impact – lessons from the case studies 21What impact has student data analytics had?Predictive learning analytics models – are they accurate?Alternatives to predictive modelsHow have analytics been used? Student perceptions
2223242526
5. Case Study Summaries 27A. Traffic lights and interventions: Signals at Purdue UniversityB. Analysing use of the VLE at the University of Maryland, Baltimore CountyC. Identifying at-risk students at New York Institute of TechnologyD. Fine-grained analysis of student data at California State UniversityE. Transferring predictive models to other institutions from Marist CollegeF. Enhancing retention at Edith Cowan UniversityG. Early Alert at the University of New England H. Developing an ‘analytics mind-set’ at the Open UniversityI. Predictive analytics at Nottingham Trent UniversityJ. Analysing social networks at the University of WollongongK. Personalised pathway planning at Open Universities Australia
2728293031323334353637
References 38
4
Executive summary
Every time a student interacts with their university – be
that going to the library, logging into their virtual learning
environment or submitting assessments online – they
leave behind a digital footprint. Learning analytics is the
process of using this data to improve learning and teaching.
Learning Analytics refers to the measurement, collection,
analysis and reporting of data about the progress of
learners and the contexts in which learning takes place.
Using the increased availability of big datasets around
learner activity and digital footprints left by student
activity in learning environments, learning analytics take
us further than data currently available can.
This report documents the emerging uses of learning
analytics in the United States, Australia and the United
Kingdom. Through a series of eleven case studies it
presents an overview of the evidence currently available
of the impact that analytics are having on teaching and
learning – and highlights some of the opportunities for
the UK higher education sector. Given the current focus
on teaching excellence in the higher education sector, it
will be of interest to policy makers and institutional
leaders alike.
A survey of Vice chancellors published last year by PA
Consulting suggests Vice chancellors perceive the UK to
be lagging behind, with 60% believing that the important
innovations in student data analytics are taking place
primarily overseas.
However, the UK is now starting to wake up to the
possibilities that learning analytics provides. In their
recent report, From Bricks to Clicks, the Higher Education
Commission concluded that analytics had “enormous
potential to improve the student experience at university”
and recommended that all institutions consider
introducing an appropriate learning analytics system.
Jisc is currently working with 50 universities in the UK to
set up a national learning analytics service for higher and
further education. This is the first time learning analytics
has been deployed at a national level anywhere in the
world, creating a unique opportunity for the UK to lead
the world in the development of learning analytics.
Although, learning analytics is still at a relatively early stage
of development there is convincing evidence from early
adopters that learning analytics will help to improve
outcomes.
The case studies presented in this report are a snapshot
of some of the most prominent institution level learning
analytics initiatives worldwide. Together they provide
evidence that:
» researchers have demonstrated the validity of the
predictive models used by learning analytics systems
» the interventions carried out with students have
been effective
» there are other benefits to taking a more data-driven
approach to higher education provision
Learning Analytics in Higher Education
Executive summary
5Learning Analytics in Higher Education
Executive summary
Extrapolating from current practice, in the UK and
internationally, we anticipate that learning analytics could
make significant contributions in the following areas:
1. As a tool for quality assurance and quality
improvement - with many teaching staff using data to
improve their own practice, and many institutions
proactively using learning analytics as a diagnostic
tool on both an individual level (e.g. identifying issues)
and a systematic level (e.g. informing the design of
modules and degree programmes).
In our response to the Higher Education Green Paper,
we outlined how learning analytics could contribute to
the Teaching Excellence Framework. In the first instance
we expect that learning analytics data could be used
by institutions as part of their submission of evidence
to support applications for the higher levels of TEF. In
the medium term, we will explore with the sector whether
learning analytics data might be used to create
appropriate new metrics.
Similarly, we envisage learning analytics data will also
be useful for institutions in demonstrating compliance
with the new quality assurance arrangements being
developed in England, which will require more regular
review of outcomes and evidence of action taken by
institutions to deal with issues.
2. As a tool for boosting retention rates – with
institutions using analytics to identify at risk students
– and intervening with advice and support – at an
earlier stage than would otherwise be possible.
3. As a tool for assessing and acting upon differential
outcomes among the student population – with
analytics being used to closely monitor the engagement
and progress of sub-groups of students, such as BME
students or students from low participation areas,
relative to the whole student body, prior to assessment
results being made available. Additional support can
be provided to identified individuals from
underperforming groups to improve attainment. At
the University of Derby, analytics are already being used
to ensure that decision making on supporting black
and minority ethnic (BME) students is evidence-based.
4. As an enabler for the development and introduction
of adaptive learning – i.e. personalised learning delivered
at scale, whereby students are directed to learning
materials on the basis of their previous interactions
with, and understanding of, related content and tasks.
6 Learning Analytics in Higher Education
Executive summary
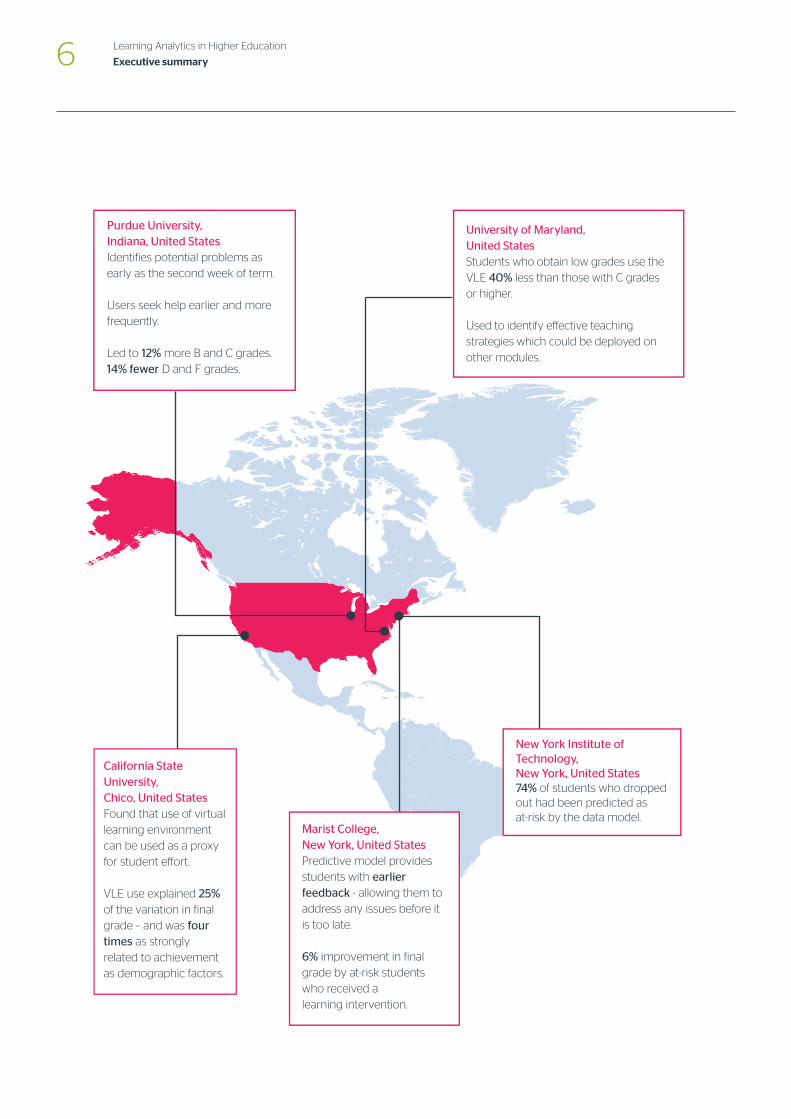
University of Maryland,United StatesStudents who obtain low grades use the VLE 40% less than those with C grades or higher.
Used to identify e�ective teaching strategies which could be deployed on other modules.
Purdue University,Indiana, United StatesIdentifies potential problems as early as the second week of term.
Users seek help earlier and more frequently.
Led to 12% more B and C grades. 14% fewer D and F grades.
California State University,Chico, United StatesFound that use of virtual learning environment can be used as a proxy for student e�ort.
VLE use explained 25% of the variation in final grade – and was four times as strongly related to achievement as demographic factors.
New York Institute of Technology,New York, United States74% of students who dropped out had been predicted as at-risk by the data model.
Marist College,New York, United StatesPredictive model provides students with earlier feedback - allowing them to address any issues before it is too late.
6% improvement in final grade by at-risk students who received a learning intervention.
7Learning Analytics in Higher Education
Executive summary
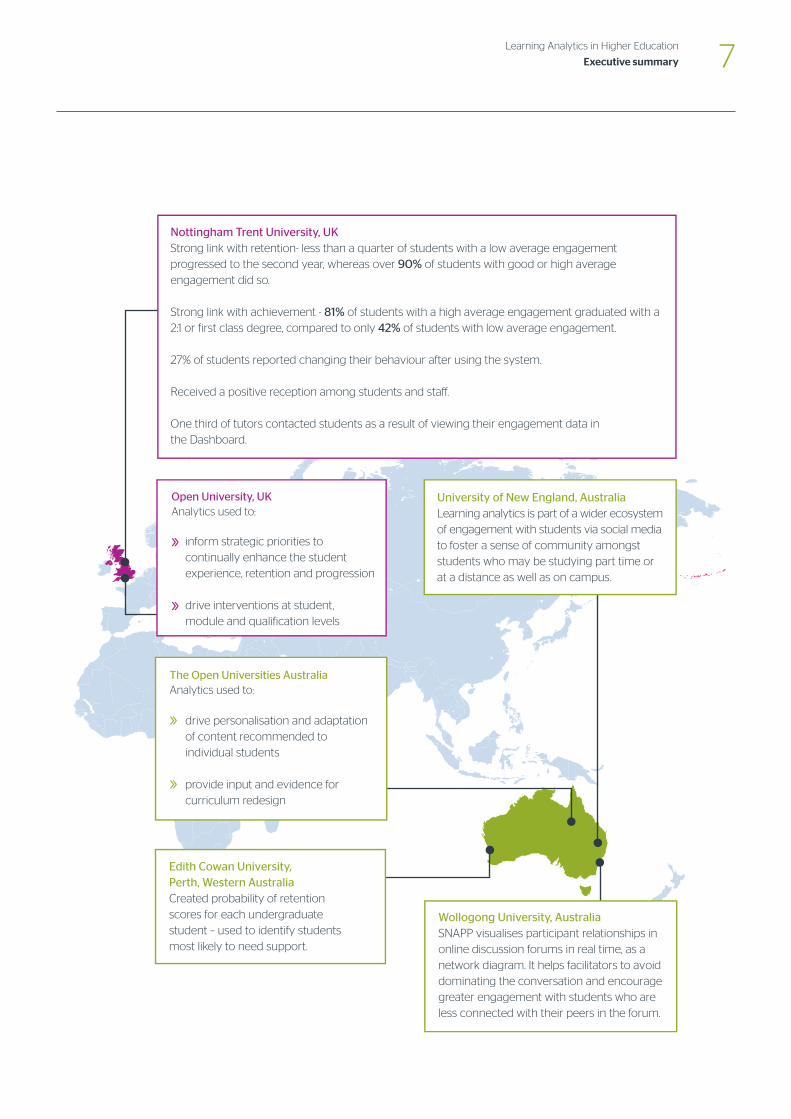
Edith Cowan University,Perth, Western AustraliaCreated probability of retention scores for each undergraduate student – used to identify students most likely to need support.
Nottingham Trent University, UKStrong link with retention- less than a quarter of students with a low average engagement progressed to the second year, whereas over 90% of students with good or high average engagement did so.
Strong link with achievement - 81% of students with a high average engagement graduated with a 2:1 or first class degree, compared to only 42% of students with low average engagement.
27% of students reported changing their behaviour after using the system.
Received a positive reception among students and sta�.
One third of tutors contacted students as a result of viewing their engagement data in the Dashboard.
Open University, UK Analytics used to:
»
»
inform strategic priorities to continually enhance the student experience, retention and progression
drive interventions at student, module and qualification levels
The Open Universities Australia Analytics used to:
»
»
drive personalisation and adaptation of content recommended to individual students
provide input and evidence for curriculum redesign
Wollogong University, AustraliaSNAPP visualises participant relationships in online discussion forums in real time, as a network diagram. It helps facilitators to avoid dominating the conversation and encourage greater engagement with students who are less connected with their peers in the forum.
University of New England, AustraliaLearning analytics is part of a wider ecosystem of engagement with students via social media to foster a sense of community amongst students who may be studying part time or at a distance as well as on campus.
8
Use and impact of learning analytics: lessons from the case studies
(1) Improving the quality of teaching Analytics have been used to improve teachingThe value of dashboards for enhancing teaching or future
course provision is also highlighted by the studies. At the
University of Wollongong, Australia, social network analysis
revealed interaction patterns that arise in forums that are
too facilitator-centric.
At the University of Maryland, it was found that innovations
which led to improvements in student performance on one
course appeared to lead them to also perform better in
subsequent courses.
Meanwhile learning analytics can furnish teaching staff with
better information on the quality of the educational content
and activities they are providing, and on their teaching and
assessment processes, to enable its continual enhancement.
Obtaining better data on the student experience potentially
enables an institution to identify and address issues of
concern to learners such as inadequate feedback. Universities
are reporting that these interventions can help to build
better relationships between students and staff.
Analytics can be used by lecturers and tutors to monitor
the performance of their students while the module is taking
place; they can then adapt their teaching if, for example,
they identify that students are struggling with a particular
topic. Other analytics on student data takes place
retrospectively, enabling future cohorts of students to benefit
from enhancements to educational content and processes.
Wider benefitsThe roll out of learning analytics may have broader
institutional impacts on learning, teaching and student
support. At The Open University the aim is develop an
‘analytics mindset’ across the institution and to base
decision making increasingly on evidence. At Nottingham
Trent too it is reported that the project has helped to extend
a culture of data-driven decision making across the University.
Implementing learning analytics is often one strand of a wider
institutional strategy, although even a small scale pilot can
generate increased awareness and discussion around issues
such as retention. In some implementations good practice
has been identified at the individual tutor or module level
that was previously invisible within the wider institution.
Thus analytics can have beneficial effects beyond the
immediate aims of the project, and can be part of a cultural
change towards more evidence based decision making.
Dashboards may have other benefits beyond the retention
of students and the enhancement of teaching: at Nottingham
Trent the Dashboard is reported to have helped build
better relations between learners and personal tutors.
(2) Boosting retentionA better understanding of data about learners and their
learning can help universities to tackle high attrition rates,
which result in adverse impacts on the lives of those affected,
and wasted expense for the institutions.
Analytics can identify struggling students earlierBy merging information known about individuals in advance,
such as their prior qualifications, with data accumulated
about their educational progress, learners likely to withdraw
can be identified earlier than in the past. At Purdue University
in the United States, for example, problems are identified
as early as the second week in the semester, something
which simply was not possible before.
Student data analytics can be used to be predict which
students will not progress to the next academic year. At
New York Institute of Technology (NYIT), approximately
three out of every four students who do not return to
their studies the following year had been predicted as at
risk by the model. Similarly, analysis of data from
Nottingham Trent University showed that less than a
quarter of students with a low average engagement
score progressed from the first to the second year, whereas
over 90% of students with good or high average
engagement scores did so.
Learning Analytics in Higher Education
Use and impact of learning analytics: lessons from the case studies
9Learning Analytics in Higher Education
Use and impact of learning analytics: lessons from the case studies
Analytics have had a positive impact on retentionOnce an at-risk student has been identified, personalised
interventions such as advice or support from a tutor can
then be taken to help to try to retain those students.
Some examples of interventions include student-facing
dashboards which contain tools that show the student’s
progress relative to their own goals or to the rest of the
cohort. In some cases, this is found to motivate students,
although other examples indicate, perhaps unsurprisingly,
that the more confident and successful students tend to
use the tools to a greater extent than struggling students.
At the University of New England for example attrition
was cut from 18% to 12% during early trials of their
Automated Wellness Engine.
The Signals project at Purdue University is one of the
earliest and most frequently cited learning analytics
implementations. Later projects have refined the modelling
techniques, developed intervention strategies or transferred
predictive models to other contexts. Use of the Signals system
led to at 14% reduction in the number of D and F grades.
(3) Enabling students to take control of their own learningGiving students better information on how they are
progressing and what they need to do to meet their
educational goals is another important application for
learning analytics.
Meanwhile some universities are providing analytics-
based systems to help students to select future modules,
building on data about their career choices, aptitudes and
grades for previous modules to provide optimum pathways
through their studies.
10
Analytics have been perceived positively by students
Learners overall seem to like having better data provided
to them on their progress. 89% of students in one survey
at Purdue considered Signals a positive experience, while
74% said their motivation was increased by using it. At
Nottingham Trent some learners report that seeing their
own engagement is a positive spur to stay engaged. Indeed,
NTU have reported that the provision of learning analytics
is now expected by students.
Objections by students to the use of their data for learning
analytics are not widely reported in the case studies or in
other literature. In the UK, the National Union of Students
has been largely positive about developments in this area,
described learning analytics as having “massive power and
potential to tackle some of the problems and challenges that
currently exist in UK higher education.”
Learning Analytics in Higher Education
Analytics have been perceived positively by students
Learning analytics can provide students with an opportunity to take control of their own learning, give them a better idea of their current performance in real-time and help them to make informed choices about what to study.
11Learning Analytics in Higher Education
Conclusions
Conclusions
Learning analytics is still at a relatively early stage of
development, but the processes for developing its use, and
ensuring the authenticity and validity of the findings, are
developing rapidly. Although not yet well understood yet
across the sector, there is convincing evidence that
learning analytics will help to develop more student-focussed
provision of higher education, and provide data and tools
that institutions will be able to use for continuous
improvement. We believe that continued investment in
learning analytics by the UK higher education sector will
lead to better outcomes for students, universities and wider
society.
Learning analytics has the potential to transform the way we measure impact and outcomes in learning environments – enabling providers to develop new ways of achieving excellence in teaching and learning, and providing students with new information to make the best choices about their education. The UK should grasp this opportunity to lead the world in the development and use of learning analytics.
12
1. Introduction
The use of data mining and business intelligence software
to analyse their customers and products is now key to
the survival and expansion of organisations across many
sectors. In higher education large datasets exist about
learners, their learning and the environments in which
they study. Universities are however only beginning to
understand how to exploit this to enhance the educational
experience for their students. While there are some
promising examples in the UK, this country is slipping
behind the US and Australia in particular, where the new
discipline of learning analytics is gaining increasing
prominence among educators and policy makers.
Motivations for use of student dataA number of drivers make it imperative for universities to
obtain value from the rich data sources they are building
up about their learners. Much of the impetus for learning
analytics worldwide comes from increasingly stretched
university budgets and a need for evidence based
prioritisation of spending. While student fee income has
to some extent alleviated financial pressures in English
higher education, strong incentives remain to deploy
resources spent on learning and teaching as efficiently
and effectively as possible. Meanwhile students, as
consumers, will increasingly, and justifiably, expect to be able
to see evidence that their fees are being spent appropriately.
Many universities have unacceptably high attrition rates,
resulting in adverse impacts on the lives of those affected,
and wasted expense for the institutions. There is a resulting
drain on the economy, not least by increasing the number
of student loans which may never be paid back.
By merging information known about individuals in advance,
such as their prior qualifications, with data accumulated
about their educational progress, learners likely to withdraw
can be identified earlier than in the past. Personalised
interventions such as advice from a tutor can then be
taken to help to try to retain those students. Better retention
helps in numerous ways, not least in reducing the necessary
expenditure on marketing and recruitment, and improving
individual universities’ positions in league tables
(Arnold, 2010).
While not all institutions have problems with retention,
educators are likely to have an interest in maximising the
academic performance of their students and enhancing
the overall experience of attending their institutions. This
of course is likely ultimately to impact on league table
positions and reputation, and thus improve recruitment.
Learning analytics can furnish teachers with information on
the quality of the educational content and activities they
are providing, and on their teaching and assessment
processes. Some analytics are used by lecturers to
monitor the performance of their students while the
module is taking place; they can then adapt their teaching if
for example they identify that students are struggling with
Learning Analytics in Higher Education
1. Introduction
Across business, industry, government and other areas of human endeavour, vast amounts of data are being accumulated and processed to develop understanding of people’s activities, and to optimise organisational processes and outputs.
13Learning Analytics in Higher Education
1. Introduction
a particular topic. Other analytics on student data takes
place subsequently, enabling future cohorts of students to
benefit from enhancements to educational content and
processes.
Benefits for learnersLearners themselves, particularly when beginning higher
education, often have little idea of how they are performing
in comparison with others, have gaps in prerequisite
knowledge, and lack key study skills. Giving students
better information on how they are progressing and what
they need to do to meet their educational goals is an
important application for learning analytics. This has the
potential to transform their learning and their understanding
of how they learn by giving continual formative feedback
as they progress through their studies. It also enables
them to compare themselves to peers, adding a competitive
element (an important motivator for many students) and
a check that they are keeping up with the group or with
the progress of successful students in previous cohorts.
Meanwhile some universities provide analytics based
systems to help students select future modules, building
on data about their career choices, aptitudes and grades
for previous modules to provide optimum pathways through
their studies.
Adaptive learning systems are emerging to help students
develop skills and knowledge in a more personalised and
self paced way. These too may depend on data about a
student’s aptitude and performance, together with fine
grained details of their clickstream, enabling the educational
content to be tailored to their level of understanding as
they progress through it. While these systems may be
inappropriate for certain aspects of higher education,
particularly the development of higher order research
and communication skills, they are set to revolutionise
the teaching of basic skills and the provision of educational
content. This data can also provide better understanding
for educators of how their content is being used and how
effective it is, and enable its continual enhancement. The
student activity data can in turn be aggregated and
combined with other educational data to give a richer
picture of the effectiveness of learning programmes at
successively higher levels in institutions, to programme
managers, deans, senior management and ultimately
education authorities and government.
Developments in the UKA number of institutions in the UK are deploying learning
analytics in different ways and for a variety of reasons. A
study was commissioned by Jisc in late 2014 which analysed
the innovations in learning analytics in the UK (Sclater,
2014). The research found that early adopters were driven
by a desire to enhance the student learning experience
for reasons such as improving achievement and reducing
the number of resits, providing better feedback, and
empowering students to become more reflective learners.
Some institutions had significant issues with retention
and saw learning analytics as a way to identify students
at risk of dropout; for others retention was not a significant
problem. Providing students themselves with better
information on their progress was also mentioned as
being an important driver.
An issue several institutions raised was the requirement
to provide information on the attendance of foreign students
to UK Visas and Immigration. This required capturing
attendance data in various ways, which can be an effective
proxy for student engagement and hence bring the
additional benefit of being able to identify students, both
foreign and local, who are struggling. Another clear
external driver mentioned by some institutions was the
National Student Survey; obtaining better data on the student
experience potentially enables an institution to identify
and address issues of concern to learners such as the
provision of feedback. Manchester Metropolitan University
attributed a nine per cent increase in student satisfaction
over two years to its efforts to reorganise its curriculum
based on better analysis of student requirements.
14
Learning analytics is seen by some universities as a way
of enhancing teaching, in particular by encouraging more
timely marking of student work, and helping to build
better relationships between students and staff. For several
institutions the focus was on putting the analytics tools in
the hands of staff who work directly with learners, and
providing them with actionable insights into student
performance. At Nottingham Trent University it was found
that tutors were putting effort into supporting students
who requested help but missing those who most needed
it. A key aim of learning analytics there was to help identify
students at risk before it was too late to intervene.
A number of institutions mention varying levels of
achievement among different ethnic groups or genders
and describe how they are using analytics to identify and
attempt to provide additional support to individuals from
underperforming groups. The University of Derby used
analytics to ensure that its decision making on supporting
black and minority ethnic (BME) students was evidence-
based. It developed a handbook of good practice for
academic staff which appeared to have improved the
performance of BME students. Nottingham Trent aimed
to develop more fine-grained understanding of the factors
which lead to a particular minority struggling. A group
may have more difficulties with one subject than another,
and individuals within a group do not necessarily conform
to its characteristics, so the aim was to develop a highly
personalised approach to the provision of student support.
As well as a few high profile institution level deployments
there are various examples of small scale initiatives in UK
higher education to analyse data on students and their
learning activities. These often fail to scale up, however
interest among senior management in the potential of
learning analytics to address strategic issues appears to
be growing rapidly. A recent study by the UK Heads of
Elearning Forum (HeLF) of 53 institutions found that the
main focus of interest around learning analytics in UK
universities is on retention and the enhancement of
learning, with equal importance being placed on both.
The same study found that nearly half of the institutions
surveyed have not implemented learning analytics at all,
roughly a third are working towards implementation and
a fifth have partially implemented it. The report also mentions
that three quarters of senior management had limited
understanding of the benefits of learning analytics and
that awareness and understanding vary widely across
departments within institutions (Newland et all, 2015).
Learning Analytics in Higher Education
1. Introduction
15Learning Analytics in Higher Education
2. Learning analytics: a new and rapidly developing field
2. Learning analytics: a new and rapidly developing field
Defining learning analyticsLearning analytics combines expertise from different
academic disciplines such as educational data mining
and predictive modelling. In 2007, Campbell et al discussed
the opportunities for ‘academic analytics’ to address some
of the growing challenges in US higher education such as
poor retention rates. Learning analytics began to coalesce
as a discipline its own right around 2010 (Ferguson, 2012),
while academic analytics is now regarded as being more
concerned with aspects of institutional business such as
recruitment, and less related to learning itself. The Society
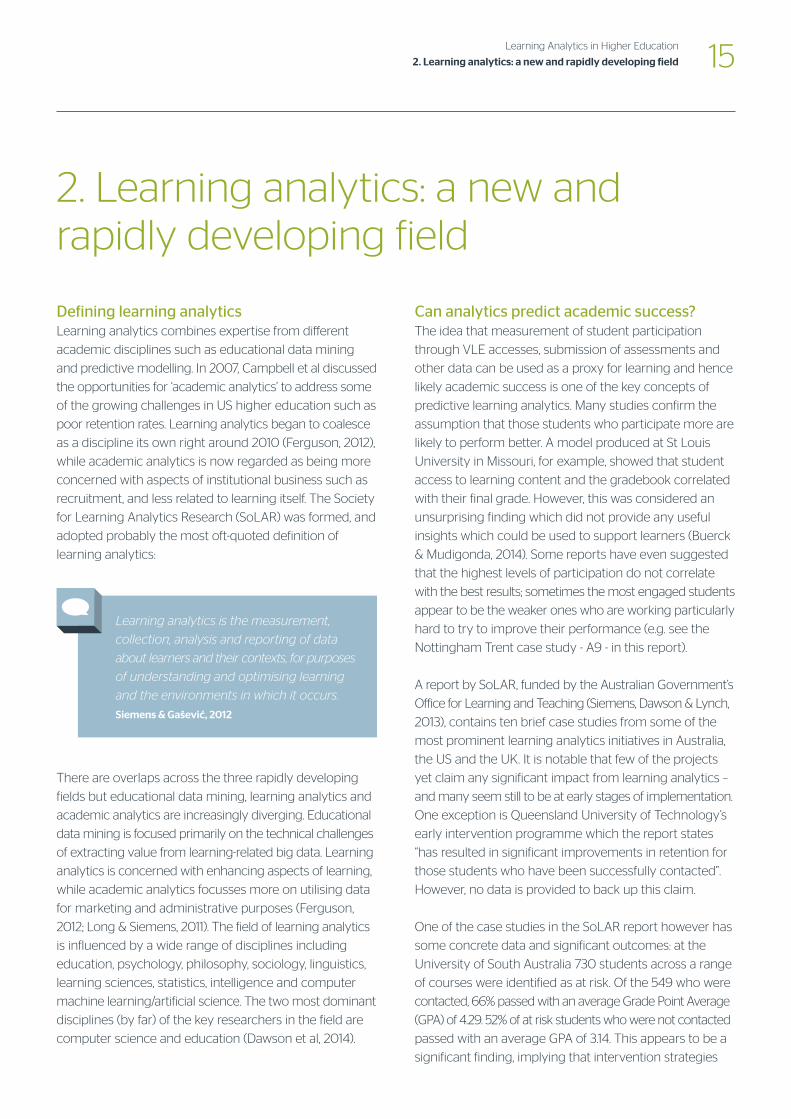
for Learning Analytics Research (SoLAR) was formed, and
adopted probably the most oft-quoted definition of
learning analytics:
There are overlaps across the three rapidly developing
fields but educational data mining, learning analytics and
academic analytics are increasingly diverging. Educational
data mining is focused primarily on the technical challenges
of extracting value from learning-related big data. Learning
analytics is concerned with enhancing aspects of learning,
while academic analytics focusses more on utilising data
for marketing and administrative purposes (Ferguson,
2012; Long & Siemens, 2011). The field of learning analytics
is influenced by a wide range of disciplines including
education, psychology, philosophy, sociology, linguistics,
learning sciences, statistics, intelligence and computer
machine learning/artificial science. The two most dominant
disciplines (by far) of the key researchers in the field are
computer science and education (Dawson et al, 2014).
Can analytics predict academic success?The idea that measurement of student participation
through VLE accesses, submission of assessments and
other data can be used as a proxy for learning and hence
likely academic success is one of the key concepts of
predictive learning analytics. Many studies confirm the
assumption that those students who participate more are
likely to perform better. A model produced at St Louis
University in Missouri, for example, showed that student
access to learning content and the gradebook correlated
with their final grade. However, this was considered an
unsurprising finding which did not provide any useful
insights which could be used to support learners (Buerck
& Mudigonda, 2014). Some reports have even suggested
that the highest levels of participation do not correlate
with the best results; sometimes the most engaged students
appear to be the weaker ones who are working particularly
hard to try to improve their performance (e.g. see the
Nottingham Trent case study - A9 - in this report).
A report by SoLAR, funded by the Australian Government’s
Office for Learning and Teaching (Siemens, Dawson & Lynch,
2013), contains ten brief case studies from some of the
most prominent learning analytics initiatives in Australia,
the US and the UK. It is notable that few of the projects
yet claim any significant impact from learning analytics –
and many seem still to be at early stages of implementation.
One exception is Queensland University of Technology’s
early intervention programme which the report states
“has resulted in significant improvements in retention for
those students who have been successfully contacted”.
However, no data is provided to back up this claim.
One of the case studies in the SoLAR report however has
some concrete data and significant outcomes: at the
University of South Australia 730 students across a range
of courses were identified as at risk. Of the 549 who were
contacted, 66% passed with an average Grade Point Average
(GPA) of 4.29. 52% of at risk students who were not contacted
passed with an average GPA of 3.14. This appears to be a
significant finding, implying that intervention strategies
Learning analytics is the measurement,
collection, analysis and reporting of data
about learners and their contexts, for purposes
of understanding and optimising learning
and the environments in which it occurs.
Siemens & Gašević, 2012
16 Learning Analytics in Higher Education
2. Learning analytics: a new and rapidly developing field
with struggling students could be extremely important
for institutions: if you are identified as at risk but left alone
you are not only considerably more likely to fail but your
result is likely to be much worse too. The dearth of such
data overall in the literature and rigorous, empirical,
replicable studies however makes it difficult yet to justify
any grand claims for the impact of learning analytics. The
case studies provided in this report highlight the work of
some of the leading institutions which have provided
evidence of effectiveness.
Papamitsiou & Economides (2014) attempt systematically
to analyse the empirical evidence for learning analytics
and data mining by examining the literature on case
studies between 2008 and 2013. They identified 209 relevant
papers in international journals and conferences but
narrowed these down to forty based on the number of
citations, the degree of innovation, the quality of the
methodology and adequate presentation of the findings.
From this they created an analysis of the strengths,
weaknesses, opportunities and threats identified in the
literature.
» Strengths include large volumes of available
educational data, the ability to use powerful, pre-
existing algorithms, the availability of multiple
visualisations for staff and students, increasingly
precise models for adaptation and personalisation of
learning, and growing insight into learning strategies
and behaviours
» Weaknesses are the potential misinterpretation of
the data, a lack of coherence in the sheer variety of
data sources, a lack of significant results from
qualitative research, overly complex systems and
information overload
» Opportunities include using open linked data to help
increase compatibility across systems, improving
self-reflection, self-awareness and learning through
intelligent systems, and the feeding of learning analytics
results to other systems to help decision making
» Threats discussed are ethical and data privacy issues,
“over-analysis” and the lack of generalisability of the
results, possibilities for misclassification of patterns,
and contradictory findings
17Learning Analytics in Higher Education
3. How learning analytics works
3. How learning analytics works
Data sourcesMuch of this is ‘big data’, datasets which are regarded as
being too large for standard database systems to handle
(Manyika et al., 2011). The main source being used for
learning analytics is the VLE, where students increasingly
have to go to view timetables, assessments and course
information, access learning materials, interact with others
through forums, and submit assignments. The use of the
VLE varies considerably across modules, courses and
institutions. Where it is used as the primary means of course
delivery in for example distance learning programmes or
MOOCs it is likely to provide a rich source of data.
Learning analytics can still however provide useful insight
on student engagement in courses which do not use a
VLE. The second major data source is the student information
system (SIS), which contains data about students such as
their prior qualifications, socio-economic status, ethnic group,
module selections and grades obtained to date. This is all
potentially valuable information to bring together with
VLE activity data in order to predict academic performance.
Data from the VLE and SIS is frequently supplemented by
other information. In some institutions attendance monitoring
systems are in place which record campus visits by students
or their presence in particular locations such as lecture
halls, libraries and refectories. This can be captured from
swipe cards, proximity cards and other entry systems, or
from accesses to institutional Wi-Fi services by students.
Library data too can be added to the mix. Information such
as a students’ library visits, records of book borrowing and
access to electronic journals is provided to personal tutors in
some institutions on dashboards for facilitating conversations
with individuals or groups. For example analytics of
historical data for a module may show that success is
associated with frequent access to library resources. If
analytics on the current cohort show that fewer students
than expected have so far visited the library, an instructor
can bring this to the group’s attention, with the intention of
modifying the students’ behaviour. They can back up
their suggestions with evidence from previous students.
Main data sources being used by UK universitiesIn the UK the main data sources being used or planned for
use by institutions are the VLE, SIS, and library systems. The
SIS may include much useful information such as details of a
student’s financial situation, the number of hours they spend
working, and their prior academic attainment. End of module
surveys and other questionnaires completed by students can
provide a rich source of data for learning analytics too.
Attendance monitoring and swipe card access to buildings,
lecture capture and media streaming systems are also being
considered (Newland et al, 2015). Wherever digital
technologies are deployed in the learning process, data
can potentially be captured from those systems to help
understand student engagement, to provide additional
assistance to students who require it, or to inform
enhancements to the content. Other examples include:
» E-book platforms which record learners’ interactions
with the materials, monitoring frequency of use, the
pages they access and even the annotations they
make to the text
» Intelligent tutoring systems which assess student
understanding, and adapt the content provided to
them accordingly
As educational activity moves online, and content accessed by students is increasingly digital in format, the data sources available to analyse learning are expanding.
18 Learning Analytics in Higher Education
3. How learning analytics works
» Videos, including those captured from traditional lectures,
those recorded specifically by lecturers for online
teaching, and other educational videos. Again the data
can show to what extent students are engaging with the
materials. One study has even suggested the optimum
length for a video clip, based on the amount of time
most users will watch a clip for before moving on
» Serious games, used to motivate learners and
encourage deeper engagement, providing useful
information about the choices they make and a large
amount of clickstream data, showing how they
interact with the software
Learners not only consume content provided by their
institutions but also create increasing amounts of data
themselves, again potentially valuable in assessing their
engagement and progress. As well as assignments and
examination responses, students may write blogs, develop
e-portfolios and create video or audio content or software,
all of which can be processed automatically. End of module
questionnaires and other survey data can also be valuable
sources of data for learning analytics.
Jisc is developing a student app for learning analytics,
influenced by some of the increasingly popular fitness
monitoring software applications such as Google Fit. This
enables students to set targets for their study activities, record
them and compare their progress and results with others.
Use of the app itself provides yet more data which can be
used to refine algorithms for predictions of student success.
Technical infrastructureOne issue for institutions wishing to invest in learning
analytics is the nascent state of the relevant technologies
and the lack of consolidation in the marketplace. A battle
for commercial dominance is taking place between vendors
of VLEs (e.g. Blackboard), SISs (e.g. Tribal), business
intelligence and visualisation software (e.g. IBM Cognos,
Tableau, Qlikview) and emerging bespoke learning
analytics packages (e.g. Civitas Learning). The HeLF
survey (Newlands et al, 2015) found that institutions were
considering a great variety of different solutions, including
their own in-house developments. This echoes Jisc’s
findings of very little common ground in the systems
being deployed for learning analytics across the thirteen
leading institutions it interviewed (Sclater, 2014).
One of the main requests coming from the higher
education community in the UK was for a basic learning
analytics solution which institutions could use to start to
experiment with learning analytics.
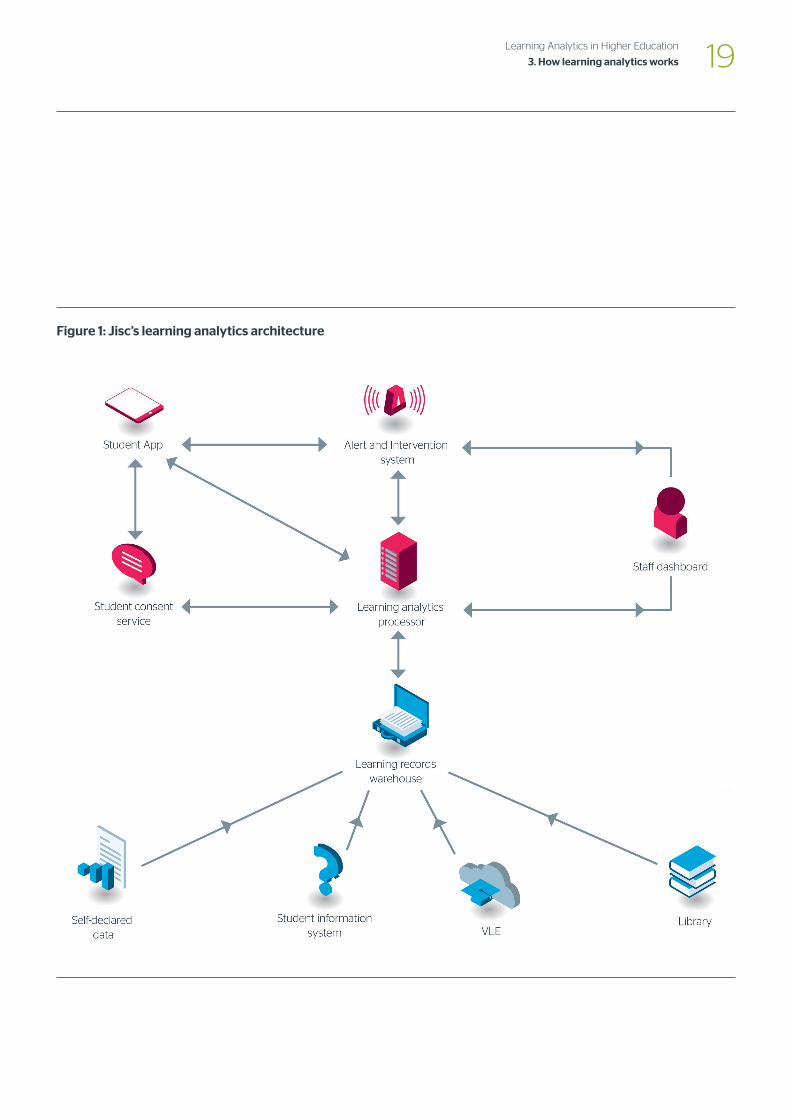
The resulting architecture is shown in Figure 1 opposite.
This shows how data from sources such as the VLE, the
SIS, library systems and students’ own ‘self-declared’ data
feed into the learning analytics warehouse. At the heart
of the architecture is the learning analytics processor
where predictive analytics are carried out, and lead to
action coordinated by the alert and intervention system.
Visualisations of the analytics for staff are available in a
series of dashboards, and a student app allows learners
to view their own data and compare it with others.
The student app provides students with data on how
their engagement and attainment compare with those of
other students, enabling them to plan and set targets for
their learning and to receive positive reinforcement through
the app when they meet these targets. Meanwhile a
student consent service helps to ensure privacy by
enabling students to give their permissions for data
capture and use.
This software is being provided freely to institutions for
the first two years as a combination of commercial and
open source systems, hosted as an open, multi-tenanted,
cloud-based solution. This allows institutions to share the
same highly scalable architecture but maintain complete
control over their own data. They can also select individual
components if they do not wish to deploy the whole solution.
19Learning Analytics in Higher Education
3. How learning analytics works
Figure 1: Jisc’s learning analytics architecture
20
The benefits of an open collaborative approachThere are a number of advantages in institutions working
together through this open approach:
1. With IT directors reportedly being bombarded with
approaches from vendors to select their analytics
systems, a suite of nationally tried and tested products
can help institutions in their procurement decisions
2. Jisc is able to negotiate better rates for products which
are provided to multiple institutions under the architecture
3. The predictive models can be made available for
inspection openly and transparently, facilitating
greater trust by end users than closed commercial
models. There may also be opportunities for a trusted
broker to validate proprietary metrics and algorithms
on behalf of the sector.
4. Expertise can be shared across institutions in many
ways e.g. the identification of appropriate metrics, the
development of predictive models, and the
deployment of the systems themselves. At the
moment innovations are happening on a small scale,
often at departmental level, and experience is not
being shared adequately, resulting in duplication and
a waste of resource.
5. Universities which decide to outsource aspects of their
learning analytics provision require contracts with
service providers to ensure compliance with data
protection legislation. Jisc is working with institutions
and suppliers to provide guidance and draw up model
contracts, reducing costs and the burden on institutions
6. There is potential to share learning analytics data
anonymously with other universities in order to benefit
from cross-institutional comparisons and benchmarking
7. Student data can be handled under rigorous
compliance with data protection legislation, building
confidence among stakeholders that the possibility of
security breaches is minimised
8. Any commercial exploitation of the data could be
handled under strict conditions, agreed by the
universities, ensuring appropriate anonymisation and
avoiding the surrendering of data ownership to purely
commercial entities which do not have the interests of
learners at heart
9. New products can be integrated with the architecture
easily, encouraging competition and innovation from
commercial providers, and boosting the overall
market for learning analytics solutions
The Jisc initiative is being watched with interest in other
countries, particularly in North America, Australasia and a
few European countries, notably the Netherlands and
France. No other country has yet put in place a national
infrastructure for learning analytics, however the
Predictive Analytics Reporting (PAR) framework in the US
has been set up to share data, analyses and findings
across institutions. One of its main achievements has
been the creation of a set of common data definitions,
defining common variables across US higher education
institutions. It has now built up a database of two million
de-identified student records, which it claims can identify
at-risk students with 90 per cent confidence (PAR, 2015).
Learning Analytics in Higher Education
3 How learning analytics works
21Learning Analytics in Higher Education
4. Findings and impact – lessons from the case studies
4. Findings and impact – lessons from the case studies
Various universities in Australia and Canada are also rapidly
gaining experience in analysing data about students and
their learning at an institutional level, particularly with the
aim of enhancing retention. Documented case studies in
other countries elsewhere in the world, other than in the
UK, are scarce.
The brief case studies presented in this chapter report on
institution (or multi-institution) level deployments of learning
analytics. They represent some of the most prominent
examples of innovations taking place in the field worldwide;
five are from the USA, four from Australia and two from
the UK. Most provide evidence either for the effectiveness
of the methodology or of the intervention strategy. Full
versions of the case studies are included in the appendices:
The following abbreviations are used for each of the
institutions and their associated case studies:
1. Purdue - Traffic lights and interventions: Signals at
Purdue University
2. UMBC - Analysing use of the VLE at the University of
Maryland, Baltimore County
3. NYIT - Identifying at-risk students at New York Institute
of Technology
4. CSU - Fine grained analysis of student data at
California State University
5. Marist - Transferring predictive models to other
institutions from Marist College
6. ECU - Enhancing retention at Edith Cowan University
7. UNE - Early Alert at the University of New England
8. OU - Developing an ‘analytics mind set’ at the Open
University
9. NTU - Predictive analytics at Nottingham Trent
University
10. Wollongong - Analysing social networks at the
University of Wollongong
11. OUA - Personalised pathway planning at Open
Universities Australia
Reflecting the current emphasis in the field on identifying
students at risk of attrition, and hence enhancing retention,
most of the case studies concentrate on predictive analytics.
Learning analytics is not however solely concerned with
reducing attrition rates, and here the Australians are engaged
in some of the most interesting innovations. One of the
studies relates to the use of social network analysis to
enhance learning and teaching at Wollongong. Another
examines how analytics can be used to help students
plan pathways through their modules at Open
Universities Australia (OUA).
Most of the large scale, systematic implementations of learning analytics to date are in the USA.
22
What impact has student data analytics had?The early identification of at-risk students is an aim
common to most of these initiatives. At Purdue problems
are identified as early as the second week in the semester,
something which simply was not possible before Signals.
However, interventions with students deemed to be at risk
may have unintended consequences. At Marist it is accepted
that the analytics might have encouraged some to withdraw
from courses who would not ultimately have failed.
Analysing the data may help to discover factors relating
to student success which can then be revealed to future
cohorts to encourage them to change their behaviour.
For example students who obtain D or F grades at UMBC
use the VLE around 40% less than those with C grades or
higher, a finding which remains constant, year after year.
The caveat here is that the more confident or successful
students may tend to use the VLE more than struggling
students, so correlation between VLE usage and grades
has to be interpreted with caution. CSU found that analysing
the type of activity within the VLE gave more useful results
than bulk data about VLE use in general. However providing
students with the profile of a successful learner may help
to encourage the right behaviours.
The value of dashboards for enhancing teaching or future
course provision is also mentioned by some of the studies.
At Wollongong, social network analysis revealed interaction
patterns that arise in forums such as discussions that were
too facilitator-centric. Analytics also helped identify a
particularly effective teaching strategy using a specific
VLE tool at UMBC. Here too, interestingly, it was found
that innovations which led to improvements in student
performance on one course appeared to lead them to
perform better in subsequent courses as well.
Dashboards may have other benefits beyond the retention
of students and the enhancement of teaching: at NTU the
Dashboard is reported to have helped build better relations
between learners and personal tutors, and its provision is
now expected by students. At UNE too, learning analytics is
part of a wider ecosystem of engagement with students
via social media to foster a sense of community amongst
those who may be studying part time or at a distance as
well as on campus. Qualitative feedback from students
also shows that sharing their experiences of study increases
their motivation.
Implementing learning analytics is often one strand of a
wider institutional strategy, although even a small scale
pilot can generate increased awareness and discussion
around issues such as retention. In some implementations
good practice has been identified at the individual tutor
or module level that was previously invisible within the
wider institution. Thus analytics can have beneficial effects
beyond the immediate aims of the project, and can be
part of a cultural change towards more evidence based
decision making. This is highlighted at NTU, where analytics
is giving the University insight into ways to improve
processes in many aspects of institutional business. At NTU
too it is reported that the project has helped to extend a
culture of data-driven decision making across the University.
At the OU the aim is develop an ‘analytics mindset’ across
the institution and to base decision making increasingly
on evidence.
It is important to note that many of the implementations
described in these case studies are at a relatively early
stage. Processes for reviewing the use of learning
analytics, modifying the way it is used institutionally and
ensuring the authenticity and validity of the findings, are
not well-represented here. Also, there may be wider
implications for each institution, as staff learn how to use
evidence in their day to day activities and reveal opportunities
and challenges which were previously hidden.
Learning Analytics in Higher Education
4. Findings and impact – lessons from the case studies
23
Predictive learning analytics models – are they accurate?Development of predictive modelsAt this early stage in the development of learning analytics,
the creation and refinement of predictive models is one
of the main activities being undertaken by institutions.
Some implementations are explicitly based upon educational
principles or an ethos consistent with the institution’s
aims e.g. programmes at OU and the UNE. Others appear
to be based upon a normative or deficit model, identifying
behaviours that do not match the cohort or expectations
of the course. Predictive models use a range of mathematical
approaches to analyse factors that were chosen as likely
indicators of students at risk of attrition (NYIT, CSU). These
factors were identified from staff experience, from published
literature about retention, and by training models based
upon data available within the institution.
Bringing in the knowledge at an early stage of specialist
staff who will be taking interventions can be essential: at
NYIT the expertise of counselling staff who support students
was deployed to help define the model for identifying
at-risk students.
Data sourcesWhile the student is learning, the VLE can generate large
volumes of detailed data; the challenge then is to identify
which measures are useful and link them to student
behaviours and success. Other data, such as library access,
attendance at class and submission of assignments is helpful
in giving a more rounded picture. Simple measures such as
a drop off in a student’s use of the VLE, or a change in mood
evidenced by their choice of emoticons on the student
dashboard, as shown at UNE, may be sufficient to indicate
where support is needed.
At NYIT data on previous students was used to train the
model using four different mathematical approaches.
Extensive work was carried out at ECU to identify which
student variables predicted attrition using their own
institutional data, a decision based upon an extensive review
of the literature and other models. NTU calculates
engagement scores from VLE access, library usage, door
access card swipes and assignment submissions. A number
of the institutions describe how they plan to extend and
develop their models by adding more data in subsequent
versions.
Many predictive systems use demographic and pre-
enrolment data in their models. When designing a model
to identify new students at risk, the lack of data about each
student’s behaviour is a problem that may be addressed by
modelling across cohorts. Other data sources can be
gathered from direct contact with the student, such as
student surveys or data about the student’s financial situation
or emotional state. A major challenge is the analysis of
fragmentary data from multiple sources. Each item of
information may have contextual idiosyncrasies and interact
with other information in multiple ways (e.g. Personalised
Adaptive Study Success - PASS at OUA). Meanwhile some
models incorporate semantic or other qualitative data to
enhance the validity of the model.
Key metrics usedThe review identifies some of the most common and
most important metrics to predict student success.
» At Purdue the Signals’ predictive algorithm is based on
performance, effort, prior academic history and student
characteristics. At NYIT key risk factors include grades,
the major subject and the student’s certainty in their
choice of major subject, and financial data such as
parental contribution to fees
Learning Analytics in Higher Education
4. Findings and impact – lessons from the case studies
24
» John Whitmer at CSU finds that variables relating to a
student’s current effort (particularly use of the VLE)
are much better predictors of success than their
historical or demographic data. This is confirmed by
NTU, which finds engagement in current studies to be
a stronger predictor of success than the student’s
background characteristics
» Similarly at Marist College the most important
predictor of future academic success was found to be
partial contributions to the final grade. In other words,
with every assignment handed in or test taken, the
predictions of final grade become more accurate, and
“a student with average intelligence who works hard is
just as likely to get a good grade as a student that has
above-average intelligence but does not exert any
effort” (Pistilli & Arnold, 2010)
Whitmer also finds that predictions of student success are
more accurate when using multiple demographic variables
than single ones. He suggests too that predictive analytics
is better performed on categories of usage (e.g. engagement
or assessment) than at the level of individual VLE tools.
His analysis of CSU students finds that Total hits is the
strongest predictor of student success, with Assessment
hits coming a close second, again appearing to confirm the
finding from other studies that what you do as a student
is a more important predictor of your future academic
success than who you are or what you did in the past.
So how valid are the models? Do they successfully predict attrition and academic achievement? Many implementations test the models thoroughly against
historical data from the institution. Much of the work in
developing the models concerns the weighting of risk factors
and adjustment of parameters to optimise the match with
student behaviour. Generally, the greater the range of data
sources and the more options tested, the more valid the
resulting models, though research at CSU and Marist shows
that some data sources make minimal impact on
the predictions.
At NYIT recall of the model is 74%; in other words,
approximately three out of every four students who do
not return to their studies the following year had been
predicted as at-risk by the model. This high recall factor is
reported to be due to the choice of model, careful testing
of alternatives and the inclusion of a wider range of data
than other similar models: financial and student survey data
were included in the model as well as pre-enrolment data.
Although many institutions developed their own specific
models rather than adopting those developed elsewhere,
a key finding of the Open Academic Analytics Initiative
led by Marist College is that the predictive models developed
at one institution can be transferred to very different
institutions while retaining most of their predictive abilities.
Open Analytics is a movement within the analytics
community which may offer an effective approach in future.
Alternatives to predictive modelsSocial network analysisIn contrast to predictive analytics, other systems aim to
increase the effectiveness of student engagement in
real-time. For example, Social Networks Adapting Pedagogical
Practice - SNAPP at Wollongong - focusses upon the quality
of discussion in online forums, as these are a common feature
of courses. The underlying principle is that greater
engagement in discussion leads to enhanced student
success. Social network analysis is used to visualise
interactions between participants in forums, showing
patterns typical of an active peer to peer discussion or less
desirable patterns of isolation or dominant individuals. This
can inform learning design and the staff development of
forum facilitators.
Personalisation of learningPersonalisation of learning, and guiding the student along
a learning pathway that meets their specific needs, are other
uses for learning analytics. Here, the data is used to generate
recommendations for learning activities, to indicate progress
towards learning outcomes and to route the student into
alternative modules, depending upon their current situation.
PASS at OUA aims to personalise the study experience
Learning Analytics in Higher Education
4. Findings and impact – lessons from the case studies
25
for each student, especially the path through the
curriculum. A combination of statistical and qualitative data
is drawn from the student profile, learning profile and
curriculum profile, as well as data from discussion forums
and responses to open-ended questions.
How have analytics been used? Dashboards and interventionsSome of the institutions profiled are still at the stage of
reporting on the development of metrics and the rolling
out of their initiatives. However it is only when actions are
taken with students on the basis of the data that the true
value of learning analytics can become clear, so those studies
which report on interventions and their effectiveness are of
particular interest.
In the cases using predictive analytics, the output is
commonly a dashboard or alert system for staff with
responsibility for supporting students. Many of these
work in real-time on a daily or weekly cycle to identify
students at risk of attrition, so staff can make proactive
interventions to support those students. Interventions are
usually initiated by an email or text message from staff to
student, although some systems enable staff to put indicators
onto the student’s home page. Generally, proactive support
from staff is more effective than waiting for students to ask
for help. There are, however, some issues reported, such as
students who appeared to be ‘immune’ to intervention and
others who feel that interventions are demotivating or
confusing, especially when communicated multiple times
across a range of media (Purdue).
At the OU, a range of dashboards, tools and on-demand
reports is being developed for students and staff at all levels
within the University, working over timescales from days
to months or years, in terms of organisational and curriculum
change. At OUA customisable dashboards are provided
for students, facilitators and instructional designers. Some
of the dashboards reported on in these studies show a
surprising amount of detail: at NYIT support staff can see
whether each student is predicted to return to their studies
the following year, the percentage confidence in that
prediction from the model and the reasons for the prediction
– this then provides a basis for discussion with the student.
However, complex data visualisations, dashboards and
other support for learners may not be necessary. Marist’s
experience of directing at-risk students to a sophisticated
support environment suggests that simply making them
aware that they are at risk may suffice. Apparently confirming
that a simple notification may be all that is required, at Purdue
it has been found that students who use Signals seek help
earlier and more frequently.
There are also appears to be an impact on grades for
those students who are able to view data on their
engagement and progress. At UMBC students who used
a tool to compare their VLE activity with that of other
students were 1.92 times more likely to be awarded grade
C or higher compared with students who did not use it.
Another reported positive impact on grades was at Marist
where on one course there was a significant improvement
in final grade (6%) with those at-risk students who were
subject to an intervention compared with the control group
who were not. Some improvements to retention as a result
of interventions are also documented in the case studies.
At UNE for example attrition was cut from 18% to 12% during
early trials of the Automated Wellness Engine.
The role of teaching and support staff Involving the support staff in the problem definition for
the implementation is helpful in ensuring that the technical
and organisational systems are developed in parallel. At
CSU, the support staff team was reorganised to establish
new roles and working practices alongside the new
dashboard designed to support that work. The impact
upon support staff of increased workload due to an alerting
system needs to be considered, especially at busy times
such as induction.
Learning Analytics in Higher Education
4. Findings and impact – lessons from the case studies
26 Learning Analytics in Higher Education
4. Findings and impact – lessons from the case studies
The expertise of student-facing staff is important to ensure
that interventions are appropriate and genuinely helpful
to the student. At the OU, student support staff use
learning analytics to inform proactive interventions across
the cohort, based upon agreed criteria, in addition to reactive
support and other existing initiatives.
At Purdue, students are given feedback through traffic lights,
however human mediation is considered important as
well, though: messages are tailored by the instructors.
This is important too at NTU, where tutors are prompted
to contact students when their engagement drops off.
Student perceptionsSome examples include student-facing dashboards which
contain tools that show the student’s progress relative to
their own goals or to the rest of the cohort. In some cases,
this is found to motivate students, although other examples
indicate that the more confident and successful students
tend to use the tools to a greater extent than struggling
students. In one case study, the increased student
performance due to the use of analytics on one course
appears to impact upon the same student’s performance
on subsequent courses.
Learners overall seem to like having better data provided
to them on their progress. 89% of students in one survey
at Purdue considered Signals a positive experience, while
74% said their motivation was increased by using it. At NTU
some learners report that seeing their own engagement is a
positive spur to stay engaged. Objections by students to
the use of their data for learning analytics are not widely
reported in the case studies or in other literature.
In many cases, the organisational culture is an important
factor in the acceptance and uptake of learning analytics.
Ethical and privacy issues are addressed in a variety of
ways, depending upon the institutional context. In particular,
it is reported to be helpful to involve students and staff in
the approval and adoption of open and transparent
codes of practice and policies for the use of learning
analytics. These policies can be supported using existing
institutional governance and consultation structures. A Policy
for the Ethical Use of Student Data was agreed with students
and staff at the OU through the usual governance and
consultation channels. Openness and transparency are
key principles, which take this policy beyond the legal
requirements. At NTU, transparency and a close partnership
approach with students are regarded as having been critical
to the success of the initiative, and have addressed ethical
concerns about the use of student data.
27Learning Analytics in Higher Education
5. Case study summaries
5. Case study summaries
A. Traffic lights and interventions: Signals at Purdue University
The institutional aim at Purdue University, Indiana was to
use business intelligence to enhance student success at a
course level, thus increasing retention and graduation rates.
The Signals system aims to help students understand their
progress early enough to be able to seek help and either
increase their likely grade or take a different path.
Signals mines data from the SIS, the VLE and the
gradebook to produce a ‘traffic light’ indicator showing
how at risk each student is considered to be. A range of
interventions can then be taken by the instructor. The
predictive algorithm is based on student performance
(points earned so far), effort (interaction with the VLE),
prior academic history and student characteristics (e.g.
age or credits attempted). These components are
weighted and fed into the algorithm which produces the
appropriate traffic signal. Red indicates a high likelihood
of being unsuccessful, yellow potential problems, and
green a high likelihood of success.
Potential problems are identified as early as the second week
in the semester. Instructors can then decide to intervene in
various ways such as posting the signal on the student’s
home page, emailing them, texting them or arranging a
meeting. Positive feedback is sent as a green traffic signal,
which the instructor can reinforce with a positive message.
Negative feedback can be sent with a warning message.
Signals was evaluated on student performance, measured
by final grades, and behaviour, indicated by interactions with
the VLE and help-seeking behaviour. Using two semesters of
data it was seen that, in those courses which deployed
Signals, there were consistently higher levels of Cs and Ds
obtained than Ds and Fs. Meanwhile students receiving the
automated interventions sought help earlier and more
frequently than those who did not receive them.
Results were monitored for two years, and appeared
promising. In a biology course, the signals pilot produced
12% more B and C grades than among students not involved
in the pilot, and 14% fewer D and F grades. There was also
a 14% increase in students withdrawing early enough for their
grade point average (GPA) scores to be unaffected. It also
appeared that when students became aware of their risk
level, they tended to alter their behaviour, with resulting
improvements to their performance. Students in pilot groups
sought help earlier and more frequently than those not taking
part. Even after the interventions stopped, these students
were seeking assistance 30% more often than those in the
control group.
A key benefit of Signals was that students who used Signals
took greater advantage of subject help desks and additional
tutoring sessions, which were often poorly-attended. Signals
also appeared to improve communication between students
and instructors. Instructors meanwhile agreed that students
tended to show improvements in engagement after using
Signals, and were thinking about their assignments earlier.
Learners’ opinions on Signals were also sought. More than
1,500 students were surveyed anonymously across five
semesters to gather feedback on their use of Signals. Most
felt that the automated messages and warnings sent to
them were a type of personal communication with their
instructor, which reduced their feelings of “being just a
number”. They found the messages and the traffic lights
informative and helpful in changing their behaviour, and
would have liked even more detailed information on how
to improve.
The full case studies, with references, are at http://bit.ly/1WczdOn
28
B. Analysing use of the VLE at the University of Maryland, Baltimore CountyThe University of Maryland, Baltimore County (UMBC), a
public research university with 12,000 students, had
growing VLE usage but no evidence that it was improving
learning. An institutional research project was carried out
to investigate the correlations between VLE data and final
grades and how best to use the predictions to support
students. The research also explored potential interventions
and how to identify effective teaching practices from the data.
As a first step, it was found that students with C grades or
higher used the VLE 39% more than lower scoring peers.
If lower performing students had been made aware of the
difference in VLE use, would they have changed their habits?
To help answer this the Check My Activity (CMA) tool was
developed for students to compare their own VLE activity
on a course with a summary of the whole cohort’s activity.
After a pilot, the tool was rolled out across the institution,
with a publicity campaign and a link from the VLE gradebook.
In one year there were 45 000 visits to the CMA tool page.
In a cohort of students new to UMBC, 92% used the VLE
and of those 91.5% used the CMA tool. Those who used the
tool were 1.92 times more likely to get a grade C or higher
than those who did not use it. The students may be paying
attention to feedback from the CMA tool that they might
not hear or accept directly from a member of staff.
Additionally the tool may be able to build on students’
“obsessive status-checking tendencies” to provide them
with frequent feedback (which is not cost-effective if staff
are involved). As a note of caution, there may be an inherent
bias, in that successful students tend to adopt new tools
to a greater extent than struggling students.
Examination of the VLE log files in more detail revealed
one instructor who had particularly high levels of student
participation. He used Blackboard’s ‘adaptive release’ feature,
so students had to take quizzes about course content before
they could access the assignments. Students on the adaptive
release sections typically scored 20% higher than on other
sections. Also, when those students moved onto their next
course they performed better than those who had not used
adaptive release. So analytics revealed effective learning
design and a generalisable conclusion: effective
implementation of a VLE tool on a prerequisite course
may lead to enhanced performance not just in that course,
but in subsequent courses. It was suggested as well that
particular types of VLE activity may encourage better
engagement, which in turn results in better grades.
Future developments have been suggested, in particular
a consent process to address privacy concerns by adding
two checkboxes to the tool: ‘It’s ok to track my usage of this
site’ and ‘It’s ok to follow up with me for an informational
interview’. Other planned enhancements include a view
of the frequency and duration of VLE tool usage compared
with others; and alerts sent to individuals when their VLE
activity drops below the level commensurate with their
target grade (modelled from the rest of the cohort). Also
it is intended to provide a facility to allow students to share
the information with staff, and to give them permission to
intervene when their VLE activity drops below a certain level.
Learning Analytics in Higher Education
5. Case study summaries
29
C. Identifying at-risk students at New York Institute of TechnologyNew York Institute of Technology (NYIT) is a private higher
education institution with 13,000 students in the USA and
overseas. By developing its own predictive model in
collaboration with counselling staff, NYIT has been able to
identify at-risk students with a high degree of accuracy.
The aim was to increase retention of students in the first
year of their studies by creating a model to identify those
most in need of support, and to provide information about
each student’s situation that would assist support counsellors
in their work. The process included mining the data, running
the analytics and producing the output in a format that
was helpful to the counselling staff. There were two reasons
for this approach: however powerful the predictive model,
it would be useless unless the counselling staff were willing
and able to incorporate it into their day-to-day work; and
the model needed to work quickly and automatically,
without time-consuming manual intervention.
The problem definition originated from the users: the
counselling staff responsible for supporting students. An
external IT solution provider worked with NYIT staff to identify
the relevant data, deploy and evaluate the model. The
design process was an iterative cycle, with NYIT counselling
staff involved at each stage. The model was built in-house
at NYIT, so the database, prediction models and front end
used by the counsellors were all on the same platform.
The model used four data sources: admission application
data, registration/placement test data, a survey completed
by all students, and financial data. The latter was included
because it was known to influence student completion rates.
The model was trained on a set of records from previous
NYIT students. In total, 372 variants of four mathematical
approaches were compared, to see which performed the
best in modelling the risk as a function of the other attributes
(incoming grades, finance, etc).
The models were tested for precision and recall, which
measure the match between the actual and predicted
student behaviour. The best version of the model had
74% recall and 55% precision. This compares very favourably
with a similar model developed independently at Western
Kentucky University (WKU), which had a 30% recall. The
WKU model was based only upon pre-enrolment data. The
enhanced recall of the NYIT model however is considered
to be due to the inclusion of financial and student survey data
and the type of model used. It means that for every four
students not returning to study the following year, three of
those students will have been correctly predicted as at risk
by this model.
The results were shown on a dashboard designed with
and for the student support staff. It is a simple table, with
one line for each student, showing whether they are
predicted to return to their studies the following year, the
percentage confidence in that prediction from the model
and, importantly, the reasons for the prediction. The
counsellor then has the basis for a conversation with
each student about their situation and future plans.
Learning Analytics in Higher Education
5. Case study summaries
30
D. Fine grained analysis of student data at California State UniversityJohn Whitmer’s doctoral research project examined student
activity on a course at California State University, Chico.
This is a mid-sized campus in the North West of the state
which had 14,640 full-time students in 2010. Whitmer,
now Director for Platform Analytics and Research for
Blackboard, analysed the complete population of 377
students on a course which had recently been redesigned
to integrate much deeper use of learning technology. His
research attempted a more fine-grained approach to the
factors leading to student success than the cruder measures
used by some other researchers. He believed that existing
learning analytics initiatives tended to ignore most of the
data in the VLE and there was minimal justification for why
some variables were included and not others. He grouped
VLE use measures into broader categories e.g. he categorised
posting to a discussion as an engagement activity. He also
looked at nine student characteristic variables including
gender, whether in a minority racial/ethnic group, income,
high school grades, and whether the student was the first
in family to attend college.
Whitmer points out that earlier studies consistently found
that combinations of student characteristics correlated
much better with student success than single demographic
variables do. In other words, if the student’s ethnicity/race,
income level and gender are used, the predictions should
be considerably more accurate than simply using one of
these variables. Seven of the nine student characteristic
variables were found to be statistically significant. However
VLE use was a better predictor of student success than
the demographic and enrolment data traditionally used
to identify at-risk students. It was also found that use of
individual VLE tools varied widely between students but
that there was less dispersed use within the categories which
had been defined i.e. administration, assessment, content
and engagement. Whitmer recommends therefore that
predictive analytics should not be performed at the level
of individual tools.
Total Hits is the strongest predictor of student success, with
Assessment Activity Hits coming a close second. In his
conclusions Whitmer suggests that using total VLE hits is
an excellent starting point for predictive modelling and
early warning systems. A multivariate regression was carried
out using all the above variables except Total Hits. It was
found that these explained 25% of the variation in final
grade. Including all the student characteristic variables in
the analysis added another 10% to the predictive
relationship with course grade.
Overall Whitmer made the not unexpected finding that
use of the VLE is related to student achievement. What
his research does do though is to quantify the difference
the various types of VLE usage can make, and therefore
enable instructors to monitor the efforts of their students
and have at-risk students flagged to them. He found that
VLE variables were more than four times as strongly
related to achievement as demographic ones. VLE use is
a proxy for student effort which is why it is such a strong
predictor of final grade. It suggests that what students do
on a course is more important than their background or
previous results. Another finding was that VLE use is less
effective for at-risk students: there was a 25% reduction in
impact from VLE use by at-risk students (based on
under-represented minority status and income)
compared with not at-risk students.
Learning Analytics in Higher Education
5. Case study summaries
31
E. Transferring predictive models to other institutions from Marist CollegeThe Open Academic Analytics Initiative (OAAI) led by
Marist College, a liberal arts institution in New York State,
developed an open source early alert solution for higher
education. The predictive model was successfully transferred
to different institutions, and intervention strategies to help
at-risk students were evaluated. The technologies are
now being deployed at UK universities as part of Jisc’s
learning analytics architecture. The initial predictive models
were based on data from Marist College. Building on Purdue’s
approach, data sources included demographic details
such gender and age, aptitude data such as high school
scores, and various aspects of VLE usage. The models
were deployed at two community colleges and two state
universities with high numbers of ethnic minority students
with low retention rates, to investigate how portable the
models were and the effectiveness of the interventions
with at-risk students.
Researchers discovered that the three most significant
metrics for predicting student success were marks on
the course so far, grade point average and current
academic standing. The model was trained with data
from Marist College and rolled out to the partner colleges
and universities. It was found to transfer well, with around
75% of at risk students being identified in three out of the
four institutions. The researchers expected a much larger
difference in how the institutions compared with Marist,
given the difference in student cohorts, type of institution
and teaching practices. They believe that theirs was the
first project to identify partial contributions to the
student’s final grade, as entered in the VLE gradebook
tool, as the key indicator for determining at risk students.
This enables instructors to take action much earlier in the
semester than has been done previously.
Reports were produced showing the students deemed to
be at risk, who were then subjected to one of two different
intervention strategies. The first group was sent a message
stating that they were at risk of not completing the course,
and providing guidance on how they could improve their
chances. The second was directed to the online support
environment where open educational resources were
provided in areas such as study skills, time management
and stress reduction, as well as subject specific content in
algebra, statistics, writing and researching. There were
also mentoring opportunities from peers and support
staff. Both interventions involved standardised text which
becomes more serious in tone with every message.
Two different cohorts of 1,739 and 696 students in 2012 were
divided into three groups: students who were sent a message,
those who were directed to the support environment and
a control group which received no interventions. No
differences were found between the two treatment
groups overall however there was a 6% improvement in
final grade for those subjected to an intervention over the
control group in one course. Another finding was that
withdrawal rates were larger in the intervention group
than among control subjects. The differences may be
explained by students preferring to withdraw early rather
than running the risk of failing later. The Marist researchers
conclude that the predictive model helps to provide students
with earlier feedback on their progress, allowing them to
address any issues before it is too late. They also note that
there are some students who appear to be “immune” to
interventions. They found that very few students who
failed to respond to the first intervention improved after
the second or third.
Learning Analytics in Higher Education
5. Case study summaries
32
F. Enhancing retention at Edith Cowan UniversityEdith Cowan University (ECU) in Perth, Western Australia
has a diverse student population, largely from non-traditional
backgrounds. The strategic priorities are to maintain a strong
track record in teaching quality, and to focus on supporting
students in order to improve retention, via an institution-
wide predictive learning analytics initiative, Connect for
Success (C4S). The C4S technology automatically identifies
students likely to need support. The organisational system
enables support staff to contact a large number of students
and manage a series of interventions for each one. A phased
programme over two to three years included governance,
control processes, organisation, communications and risk
management. This allowed time for the development of the
technologies and a change management process to support
staff involved and to establish new roles in the student-
facing teams.
The University invested in extensive work to identify which
student variables were most effective in predicting attrition.
Although the research review identified some common
factors in student attrition at other institutions (including
grades, university entrance scores and language skills),
the reasons for students leaving or staying are multi-faceted
and the factors may be interdependent. Hence ECU
decided it was important to gather and analyse institution-
specific data to accurately identify students most likely to
need support. Statistical models were developed for the
first three semesters of a student’s time at ECU, based on
over 200 student variables. The models used data from
ECU’s SIS, including demographic and progress information,
split into undergraduate and postgraduate courses. In total,
six models were developed to predict retention. As a result,
ECU has a probability score for each new and continuing
student enrolled in an undergraduate course.
The predictive model identifies students who may require
support, in a regular report. This is triaged by two staff who
make sure that no student is contacted twice or too often.
Personalised emails are then sent to the identified students
offering assistance. If students do not reply to the initial
email, they are contacted by telephone with a similar
message. A dashboard enables support staff to log and
manage contacts and support for each student. They can
create an action plan, agreed with the student, which may
include referrals to specialist support services, other
appointments or interventions.
Critical success factors included: trained and knowledgeable
support staff, partnerships with institutional stakeholders,
knowledge of clear roles and boundaries with other ECU
services, procedures that work (on a day-to-day basis), and
strong executive support. The challenges included: integrity
of the data (manual collation was involved in the early
stages, interpretation of it was an issue), resourcing the
programme at peak times (for example during
Orientation), integration of information systems at an
institutional level, and ‘student suspicion’.
Around 700 students were contacted via email and/or
telephone and given the opportunity to opt into a case-
management initiative to support their studies. 20 per cent
of students opted in, which the institution reports is in line
with take-up rates for similar programmes at other universities.
Learning Analytics in Higher Education
5. Case study summaries
33
G. Early alert at the University of New EnglandThe University of New England, New South Wales, Australia
has around 18,000 students, with high numbers of part-time
and external or mixed mode undergraduates. 20% of
students are of low socio-economic status. The main driver
was the need to identify students who were struggling, so
they could be offered timely support. Previously, identification
of students who were ‘at risk’ tended to occur after they
had failed to submit an assignment or attend a class. It
was also difficult to observe the many students who were
off-campus. The aim was to develop a “dynamic, systematic
and automated process that would capture the learning
wellbeing status of all students”. There were three strands:
e-MotionEvery student has a set of emoticons and a text box on
their student portal page. They can opt in to record how
they are feeling each day (happy, neutral, unhappy, very
unhappy), linked to their current module. All students
recording a negative emotion are contacted within 24
hours by the Student Support Team. 17%-20% of students
recording ‘unhappy’ or ‘very unhappy’ are case managed
by the team. Of those, 33% require multiple contacts.
The VibeStudents’ comments in the text box alongside the
emoticons are aggregated into a word cloud, which is
updated every ten minutes, so the entire student cohort
can see what their peers are saying. This word cloud acts
as a barometer for student wellbeing and normalises
student experience, because the larger the word, the
greater the number of students experiencing the same
thing. The text entries on each student’s portal page also
give the support team a daily update on the issues and
concerns of the students.
The Automated Wellness Engine (AWE)Analyses data from seven corporate systems every night
and runs a model based upon thirty-four triggers identified
as suggesting at-risk behaviour. These indicators are
based upon behaviours, not demographics. Data sources
include e-Motion student input, class attendance, previous
study history, prior results, assignment submissions, and
access patterns for the student online portal and other
university websites. Previous AWE scores are also included.
Both daily time series and trend analysis are used to
assess a score for intervention. So, even if a student does
not provide direct input via e-motion, the AWE can still
run the model. Each morning, the student support staff
dashboard is updated to identify which students need
support. An automated email is used in the first instance,
followed by phone calls and other support as necessary.
During initial trials of the AWE, attrition was cut from 18%
to 12%. Qualitative feedback from students showed that
Early Alert was successful in increasing the student’s sense
of belonging to a community, and that sharing their
experiences of study increased their motivation. Feedback
from students has been “overwhelmingly positive”, showing
that they value the proactive support. Other aspects of the
system are successful in motivating students with automated
feedback to the cohort, rather than direct staff intervention.
The value of learning analytics within a wider social media
strategy is another important feature of Early Alert. A sense of
community and the presence of support staff as routine (not
just for times of crisis) is built through multiple channels. The
staff use Facebook, Instagram and a blog to communicate
with students on a daily basis, as well as using the AWE to
intervene when necessary. Students seem to be more
receptive to intervention because they know the staff
by name.
Learning Analytics in Higher Education
5. Case study summaries
34
H. Developing an ‘analytics mind-set’ at the Open UniversityThe Open University, UK has over 200,000 students studying
part time degree, postgraduate and sub-degree qualifications.
The institution is investing heavily in a strategic learning
analytics programme to enhance student success by
embedding evidence based decision making at all levels. Due
to funding changes, retention on a qualification has become
a strategic issue for the institution; retaining students is
particularly demanding when they are geographically
scattered, studying part-time and typically take several
years to obtain a degree.
The University is developing its institutional capabilities in
ten key areas to strengthen the foundations for the effective
deployment of learning analytics. These are organised into
three main strands: the availability of data, the analysis and
creation of insight, and processes that impact upon student
success. At the macro level, aggregation of information
about the student learning experience informs strategic
priorities to enhance continually the student experience,
retention and progression. At the micro level, analytics are
used to drive short, medium and long-term interventions
at the student, module and qualification levels. One of the
aims is to develop an ‘analytics mind-set’ throughout the
University, so staff incorporate evidence-based decision
making into their routine work.
Understanding the impact of interventions is a major goal.
Within the University there is a wide variety of interventions.
Previously, it was difficult to identify how a single intervention
impacted upon student success, so the learning analytics
strategy is intended to create a more coherent picture.
Data is drawn from the SIS, VLE and other platforms.
Multiple dashboards, reports and tools are under
development to provide easy access to analytics outputs
for a range of users, including senior management, student
support staff, academics and students. The support staff
dashboard for example enables staff to manage a structured
programme of interventions. A student dashboard will
enable students to track their progress and make better
choices about their study path. Predictive analytics are
being developed to model student progression at individual
module level and institutional level, based upon previous
cohorts on similar modules.
At the curriculum level, faculty staff use analytics to inform
updates to the learning design and assessment of modules.
Analytics can also identify successful learning designs,
enabling the sharing of best practice. The University sees
the use of learning analytics as an ethical process, with
the focus on the student as an active participant. The ‘Policy
for the Ethical use of Student Data for Learning Analytics’
goes beyond legal requirements. This approach also
recognises that however good the models, a student is
more than a set of data, so there will always be aspects of
the student experience that lie outside the domain of learning
analytics. The pilot projects and study support
implementation are not yet at a stage to produce clear
evidence of effectiveness. The key factors that impact upon
student success are now understood sufficiently well to
inform priorities in strategic planning. The impacts of the
various interventions will take some time to appear and
interpret, given the complexity and scale of the activities
being undertaken.
Learning Analytics in Higher Education
5. Case study summaries
35
I. Predictive analytics at Nottingham Trent UniversityIn one of the most prominent learning analytics initiatives
in the UK, Nottingham Trent University (NTU) has
implemented an institution-wide dashboard to enhance
the academic experience of its 28,000 students by facilitating
dialogue between students and staff. The specific goals
were: to enhance retention, to increase a sense of belonging
to a community, and to improve attainment.
Earlier institutional research found that up to a third of
students had considered leaving at some point during
their first year. These ‘doubters’ were less confident, less
engaged, formed weaker relationships with peers and
tutors, and were ultimately more likely to withdraw early.
Tutors were supporting students who asked for help,
rather than the ‘doubters’ who most needed it, but did
not ask. There are four key dashboard features designed
in response to these goals: students and staff see precisely
the same information; the dashboard sends an email alert
to tutors when student engagement stops for two weeks;
the dashboard enables tutors to make notes about agreed
actions as they work with students; and demographic data
is not included, only data about student engagement
whilst on course. The tool itself is easy to use, with low
impact on academic time for training and use; this was
important for its adoption.
Demographic data was deliberately not used in the model,
because a student can only alter their behaviour, not their
background, and the dashboard is there to motivate students.
Each student receives one of five engagement ratings:
High, Good, Partial, Low and Not Fully Enrolled. The
dashboard enables students to check their engagement
against their peers, and tutors to discuss the students’
performance with them. Two visualisation charts show a
progress line indicating engagement, comparing
individual students with the rest of the cohort, and
showing the student’s engagement rating. The tutor can
drill down to the level below the rating to gain a better
understanding of the student’s recent engagement.
The pilot showed that greater engagement was positively
related with both progression and attainment, based on
four courses. Analysis of a far larger dataset for first year
students, showed that a student’s engagement was a far
more important predictor of progression than data such
as background characteristics or entry qualifications. For final
year students there was a strong association between
engagement and a final degree classification: 81% of students
with a high average engagement graduated with a 2:1 or
first class honours degree, whereas only 42% of students
with a low average engagement did.
In a survey of first year students, 27% said that they had
changed their behaviour in response to data on the
dashboard. Some students did more academic activities,
e.g. independent learning, although this is not measured
in the dashboard. Others competed to have the highest
engagement score. There is a possibility of bias however
here, because the dashboard may help those students
who are already articulate and engaged. NTU will be exploring
these issues in much more detail in the coming years.
Another impact is that tutors are changing how they work
with students because of the analytics. They find that the
improved information on individuals allows them to target
their interventions more appropriately. Most tutors in the
initial pilot used the dashboard once per week with a minimal
impact on their workload; one third of tutors contacted
students as a result of viewing their engagement data.
Learning Analytics in Higher Education
5. Case study summaries
36
J. Analysing social networks at the University of WollongongThe University of Wollongong, New South Wales, Australia
is a public research university with over 30,000 students.
The central premise of the Social Networks Adapting
Pedagogical Practice initiative (SNAPP) is that collaborative
learning is important to promote student understanding.
SNAPP analyses conversations in online student discussion
forums to show patterns and relationships in real time as
social network diagrams. Typically, these forums are
moderated by the instructor whilst students tackle specific
learning tasks or have general conversations about the
subject or administrative issues. The timing and quality of
interventions by the instructor can have a significant
impact on the student learning experience. Some of
these forums may have hundreds of participants, making
it difficult for an instructor to keep track of the activity.
Instructors can track the evolution of the relationships by
comparing diagrams over time. The SNAPP software can
be used a diagnostic tool to help instructors identify
students who are isolated from the main discussion, or to
see how the overall pattern is progressing (Are a few
students dominating? What is the extent of peer discussion?)
Because it operates in real time, this gives the instructor
an opportunity to intervene in the discussion. Instructors
may also use the visualisation to reflect upon the learning
design and perhaps redesign the task for a future cohort.
Although intended primarily to facilitate real-time
intervention, teachers predominantly used SNAPP for
reflection after course completion. This was helpful for
professional development, because the network patterns
indicate different styles of moderation, e.g. if an instructor
responds to individual students rather than encouraging
wider discussion. In real time, SNAPP was felt to be useful
for identifying isolated students, especially in large forums
at busy times. Some instructors showed SNAPP network
diagrams to their student groups, as a part of a discussion
about how to contribute to an online forum.
It was recommended that SNAPP should be promoted as
a reflective teaching tool and that the importance of
learning design in professional development should be
emphasised. It was felt that there needed to be a greater
awareness of common interaction patterns among staff,
and a greater understanding of how to intervene, as a
facilitator, in a discussion which shows undesirable
patterns of social interaction.
The SNAPP project revealed a strong correlation between
students’ ‘learning orientations’ and the types of forums
that that they frequent. For example, those with a strong
learning orientation preferred discussions about learning
and resource-sharing. Students with a performance
orientation focussed on administrative and assessment
forum discussions.
The SNAPP software is a web browser extension which
automatically extracts data from the selected forum and
displays the relationships as social network maps. SNAPP
targets student interaction data as an indicator of
engagement and creates a isualisation system that works
across multiple third-party platforms and versions. This
approach could be used to add other nctionalities to a VLE.
Learning Analytics in Higher Education
5. Case study summaries
37Learning Analytics in Higher Education
5. Case study summaries
K. Personalised pathway planning at Open Universities AustraliaOpen Universities Australia (OUA) is a distance education
consortium owned by seven Australian universities. Study
materials are entirely or partly online, or with a mix of print,
CD and DVD. Qualifications are offered as modular courses.
Students can choose how many units they study at the same
time but planning a route through the modules necessary
for a qualification can be difficult. Personalised Adaptive
Study Success (PASS) enables personalisation of the study
experience for each student, especially in terms of their path
through the curriculum. It aims to support struggling students
by suggesting alternative modules, more appropriate to their
needs, as well as offering support. Students at risk are
also identified.
In a traditional linear path through the curriculum, poor
performance on one module impacts upon student
outcomes for subsequent modules, and a struggling
student may not have an opportunity to catch up with the
rest of the cohort. In contrast, PASS supports a personalised
and adaptive learning path. A student with a weakness in
a particular topic can study extra modules to strengthen
that area before re-taking the original module. PASS can
recommend an alternative study path at any point where
the student is deemed to require help.
PASS draws upon data from a wide range of sources,
including customer relationship management systems at
OUA and partner universities, the learning management
system and the curriculum profiles for each unit and
program. In essence, the analysis is based upon three
profiles: the student profile (location, socio-demographic
factors, prior knowledge etc.), the learning profile (use of
online content, assessment, online forums etc.) and the
curriculum profile (requirements of the module and
program, alternative paths etc.) A combination of
statistical and qualitative data is analysed by the learning
analytics engine, which feeds into the reporting engine
and into the personalisation and adaptation engine
(producing recommendations and other feedback for
students and tutors). This is intended to enable intervention
at the micro, meso and macro level, for example, suggesting
an extra mathematics module to a student or providing
evidence for redesigning a section of the curriculum.
PASS uses the output from a learning analytics engine to
inform a personalisation and adaptation engine, and a
reporting engine. The personalisation and adaptation engine
feeds recommendations for content and activities to the
student dashboard in the online learning environment.
Dashboards are provided for students, facilitators and
instructional designers. These can be customised by adding
and moving tiles with different functions, such as summaries,
recommendations and alerts.
One of the conclusions of the project is that the preparation
of stakeholders for applying insights from learning analytics
in meaningful ways is vital. A major challenge for this project
was the interaction and fragmentation of information as well
as its contextual idiosyncrasies. The models combined
numerical and qualitative data to build a more rounded
picture of the learner’s situation. In particular, semantically
rich data from discussion forums and responses to open-
ended assessments, for example, enable a better
understanding of learners’ knowledge and needs.
38
Signals: Applying Academic Analytics. EDUCAUSE
Review. Arnold, K. (2010, March 3). er.educause.edu/
articles/2010/3/signals-applying-academic-analytics
A resource-constrained approach to implementing
analytics in an institution of higher education: An
experience report. Journal of Learning Analytics, 1(1),
129–139. Buerck, J. P., & Mudigonda, S. P. (2014). epress.lib.
uts.edu.au/journals/index.php/JLA/article/view/3244
Academic analytics: A new tool for a new era. EDUCAUSE
review 42, 40. Campbell, J. P., DeBlois, P. B. & Oblinger, D.
G. (2007) er.educause.edu/articles/2007/7/academic-
analytics-a-new-tool-for-a-new-era
Current state and future trends: A citation network
analysis of the learning analytics field. Proceedings of
the Fourth International Conference on Learning
Analytics And Knowledge 231–240. ACM. Dawson, S.,
Gašević, D., Siemens, G. & Joksimovic, S. (2014)
dl.acm.org/citation.cfm?id=2567585
Data Mining Group (2015) PMML 4.1 – General
Structure. dmg.org/pmml/v4-1/GeneralStructure.html
Learning analytics: drivers, developments and
challenges. International Journal of Technology
Enhanced Learning, 4(5/6), 304. Ferguson, R. (2012)
http://oro.open.ac.uk/36374/
From Bricks to Clicks: the Potential of Data and Analytics in
Higher Education. Policy Connect. Higher Education
Commission (2016)
IMSGlobal (2015) Caliper Analytics Background.
https://www.imsglobal.org/activity/caliperram
Penetrating the Fog: Analytics in Learning and Education.
EDUCAUSE Review. Long, P. & Siemens, G. (2015)
http://net.educause.edu/ir/library/pdf/ERM1151.pdf
Big data: The next frontier for innovation, competition,
and productivity. McKinsey Global Institute. Manyika, J.,
Chui, M., Brown, B., Bughin, J., Dobbs, R., Roxburgh, C. and
Byers, A.H. (2011, May) mckinsey.com/insights/business_
technology/big_data_the_next_frontier_for_innovation
Learning Analytics in UK HE 2015: A HeLF Survey Report.
Heads of eLearning Forum. Newland, B., Martin, L., Ringan,
N. (2015). helfuk.blogspot.co.uk/2015/10/uk-he-learning-
analytics-survey-2015.html
Learning Analytics and Educational Data Mining in
Practice: A Systematic Literature Review of Empirical
Evidence. Journal of Educational Technology & Society 17,
49–64. Papamitsiou, Z. & Economides, A. A. (2014)
ifets.info/journals/17_4/4.pdf
In Practice: Purdue Signals: Mining Real-Time Academic
Data to Enhance Student Success. About Campus. Vol 15,
Issue 3, Pages 1-32. Wiley. Pistilli, M. D. & Arnold, K. E.
(2010, July/Aug).
Our Approach. PAR Framework. PAR (2015)
parframework.org/about-par/our-approach/
Learning analytics: the current state of play in UK higher
and further education. Jisc. Sclater, N. (2014, November).
repository.jisc.ac.uk/5657/1/Learning_analytics_report.pdf
Improving the Quality and Productivity of the Higher
Education Sector: Policy and Strategy for Systems-Level
Deployment of Learning Analytics. 1–32. Society for
Learning Analytics Research. Siemens, G., Dawson, S. &
Lynch, G. (2013) solaresearch.org/Policy_Strategy_
Analytics.pdf
Guest Editorial - Learning and Knowledge Analytics.
Educational Technology & Society, 15 (3), 1–2. Siemens,
G., & Gašević, D. (2012) ifets.info/journals/15_3/1.pdf
Tin Can API. xAPI (2014) http://tincanapi.com
References
Learning Analytics in Higher Education
References

39

Jisc
One Castlepark
Tower Hill
Bristol, BS2 0JA
0203 697 5800
Share our vision to make the UK the most digitally advanced education and research nation in the worldjisc.ac.uk