Embed Size (px)
Citation preview
Welcome to the Era of Big Data and Predictive
Analytics in Higher Education
Ellen Wagner
WICHE Cooperative for Educational Technologies
Joel Hartman
University of Central Florida
The Focus of this Session
This session will present an introduction to the emerging and evolving topics of “Big Data” and predictive analytics particularly as they apply to higher education and the use of data to improve student persistence and outcomes.
An overview of Big Data, an introduction to the Predictive Analytics Reporting (PAR) Framework, and an institution’s perspective on these issues along with their implementation of analytics will be presented.
Postsecondary Education and
the “New Normal”
• Unprecedented demands for Accountability, Efficiency, Effectiveness
• Increased expectations for greater transparency
• A recognition that shared services are more than just a good idea that somebody else should do
• More competition than ever before.
We Can Run…But We Can’t Hide
• New Approaches to the New Normal: 2012 Higher Education Legislative Recap in the West (Nov 27, 2012) (http://www.wiche.edu/info/publications/PI-2012PolicyInsights )
• Notable issues: postsecondary finance, including attempts to implement a new wave of outcomes-based funding; completion, accountability and major governance changes.
• Specific issues include adult learners, workforce development, and the implementation of Common Core Standards.
• Tight budgets will continue to impact higher ed leading to an increased focus on productivity and flexibility for institutions and students
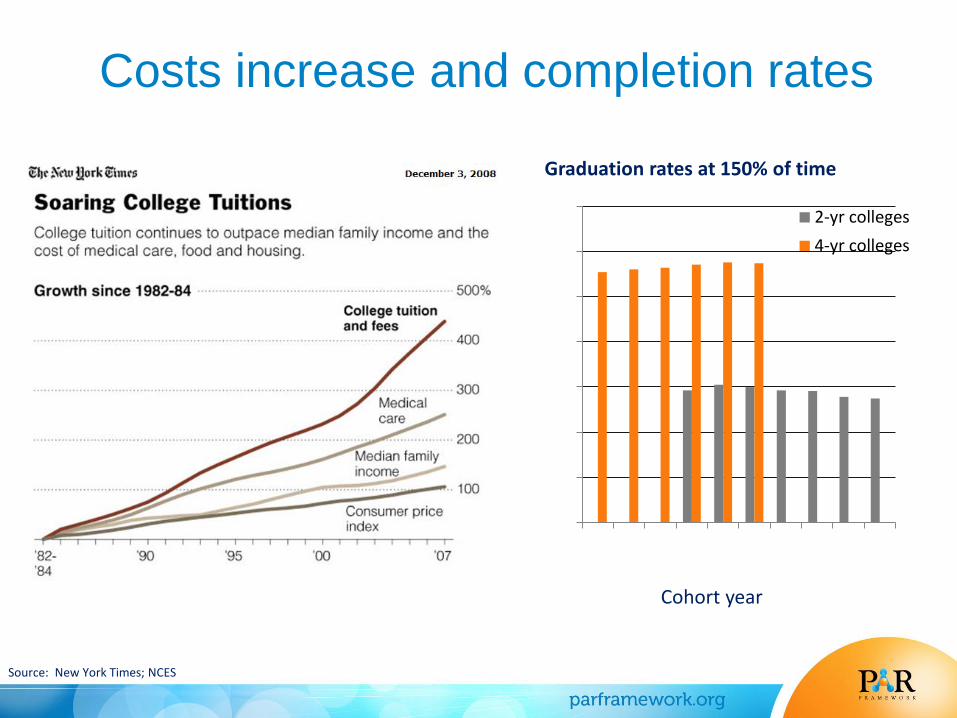
Costs increase and completion rates
Source: New York Times; NCES
0
10
20
30
40
50
60
70
19
96
19
97
19
98
19
99
20
00
20
01
20
02
20
03
20
04
20
05
2-yr colleges
4-yr colleges
Graduation rates at 150% of time
Cohort year
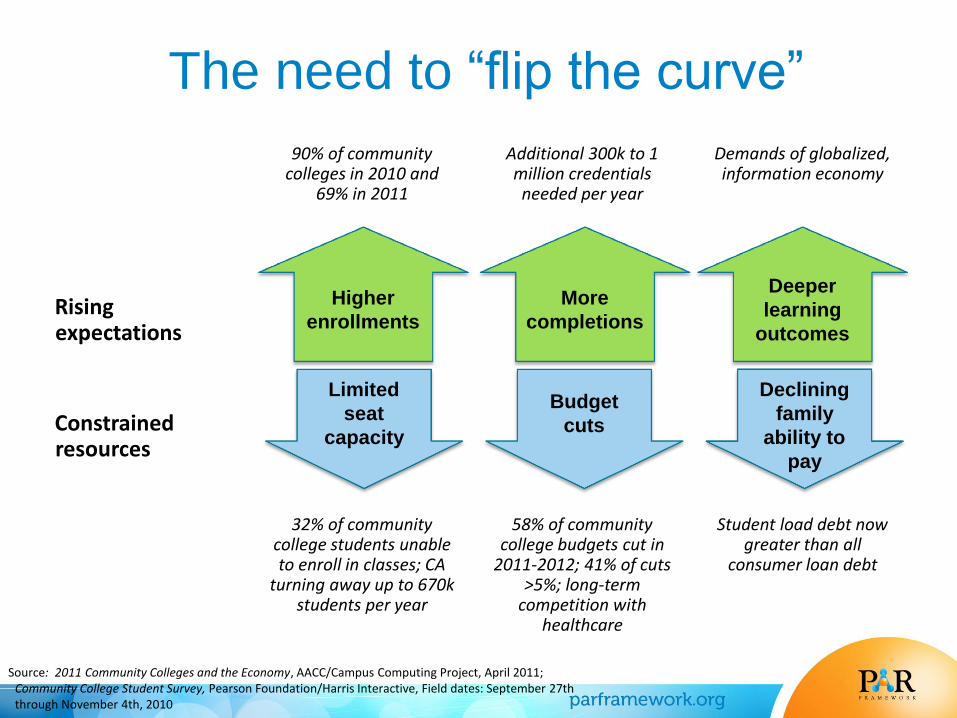
The need to “flip the curve”
Higher
enrollments
More
completions
Deeper
learning
outcomes
Rising expectations
Constrained resources
Source: 2011 Community Colleges and the Economy, AACC/Campus Computing Project, April 2011; Community College Student Survey, Pearson Foundation/Harris Interactive, Field dates: September 27th through November 4th, 2010
Limited
seat
capacity
Budget
cuts
Declining
family
ability to
pay
90% of community colleges in 2010 and
69% in 2011
Additional 300k to 1 million credentials needed per year
Demands of globalized, information economy
32% of community college students unable to enroll in classes; CA
turning away up to 670k students per year
58% of community college budgets cut in
2011-2012; 41% of cuts >5%; long-term
competition with healthcare
Student load debt now greater than all
consumer loan debt
Innovation and Educational
Transformation
• The term innovation derives from the Latin word innovare "to renew or change."
• Innovation generally refers to the creation of better or more effective products, processes, technologies, or ideas that affect markets, governments, and society.
• Technologies frequently featured in today’s mix of solutions for solving problem and promoting innovation
Tech Trend and Analytics
• Data Warehouses and “the Cloud” make it possible to collect, manage and maintain massive numbers of records.
• Sophisticated technology platforms provide computing power necessary for grinding through calculations and turning the mass of numbers into meaningful patterns.
• Data mining uses descriptive and inferential statistics —moving averages, correlations, and regressions, graph analysis, market basket analysis, and tokenization – to look inside those patterns for actionable information.
• Predictive techniques, such as neural networks and decision trees, help anticipate behavior and events.
Why the Emergence of “Big Data”?
• Expectations for accountability to stakeholders
• Demands for evidence to guide and support decision-making
• Finding metrics that matter to institutions AND individuals
• Technology platforms provide a means to the end.
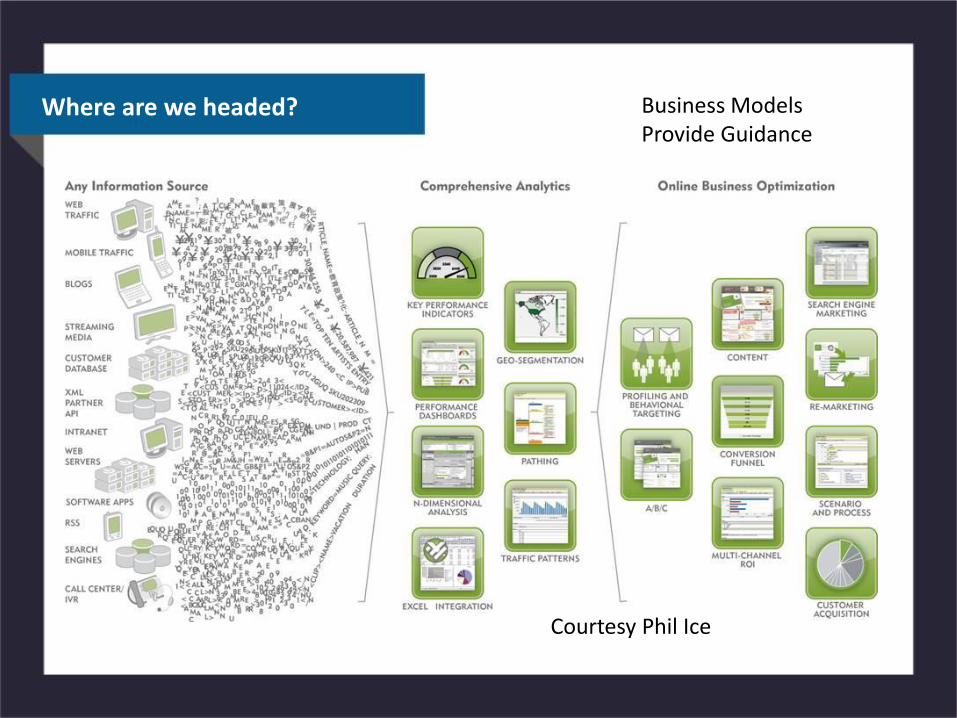
Where are we headed? Business Models Provide Guidance
Courtesy Phil Ice
Big Data and Analytics and
Frameworks, Oh, My
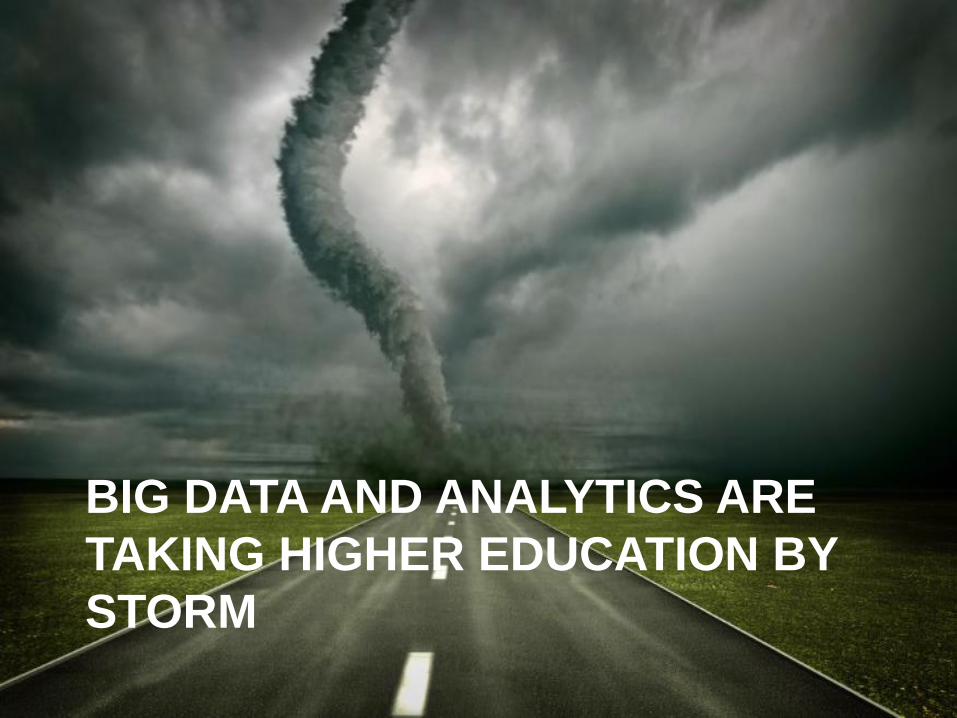
BIG DATA AND ANALYTICS ARE
TAKING HIGHER EDUCATION BY
STORM
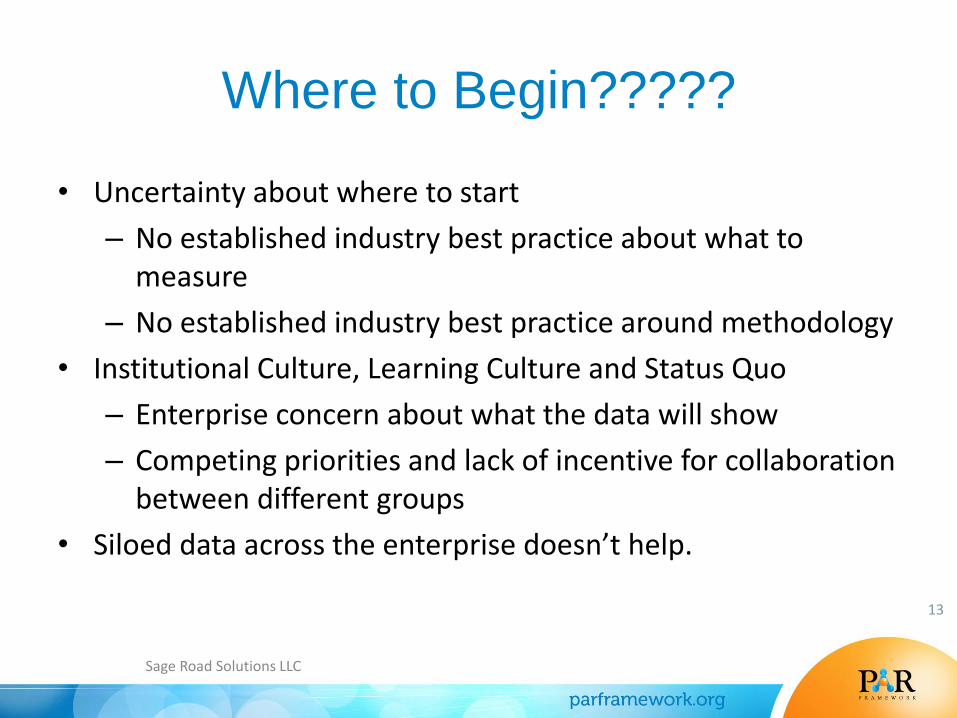
Where to Begin?????
• Uncertainty about where to start
– No established industry best practice about what to measure
– No established industry best practice around methodology
• Institutional Culture, Learning Culture and Status Quo
– Enterprise concern about what the data will show
– Competing priorities and lack of incentive for collaboration between different groups
• Siloed data across the enterprise doesn’t help.
13
Sage Road Solutions LLC
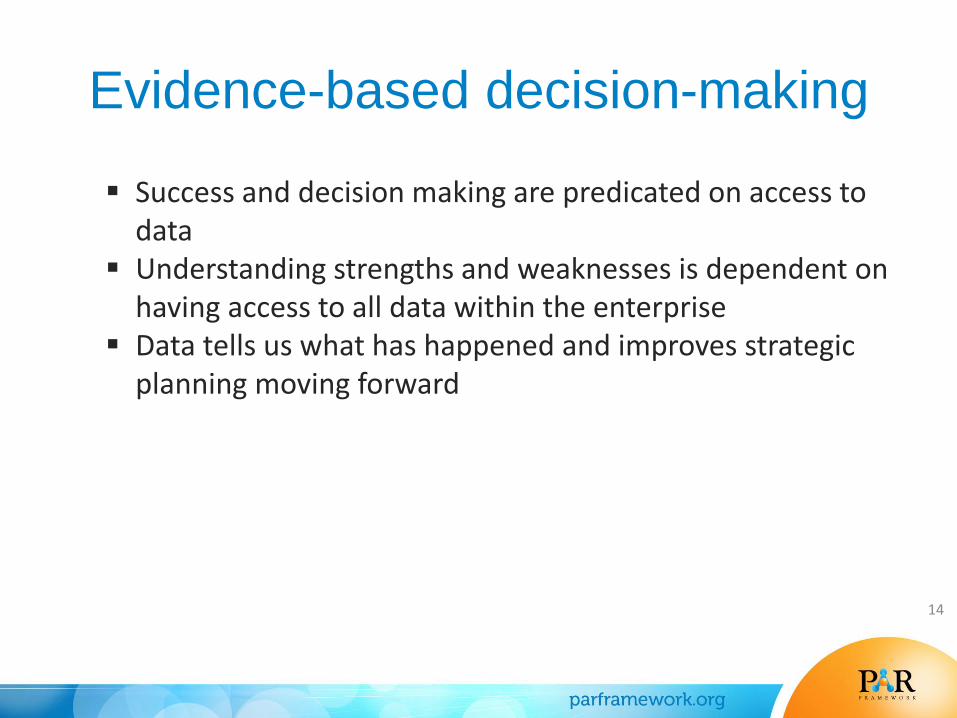
Evidence-based decision-making
Success and decision making are predicated on access to data
Understanding strengths and weaknesses is dependent on having access to all data within the enterprise
Data tells us what has happened and improves strategic planning moving forward
14
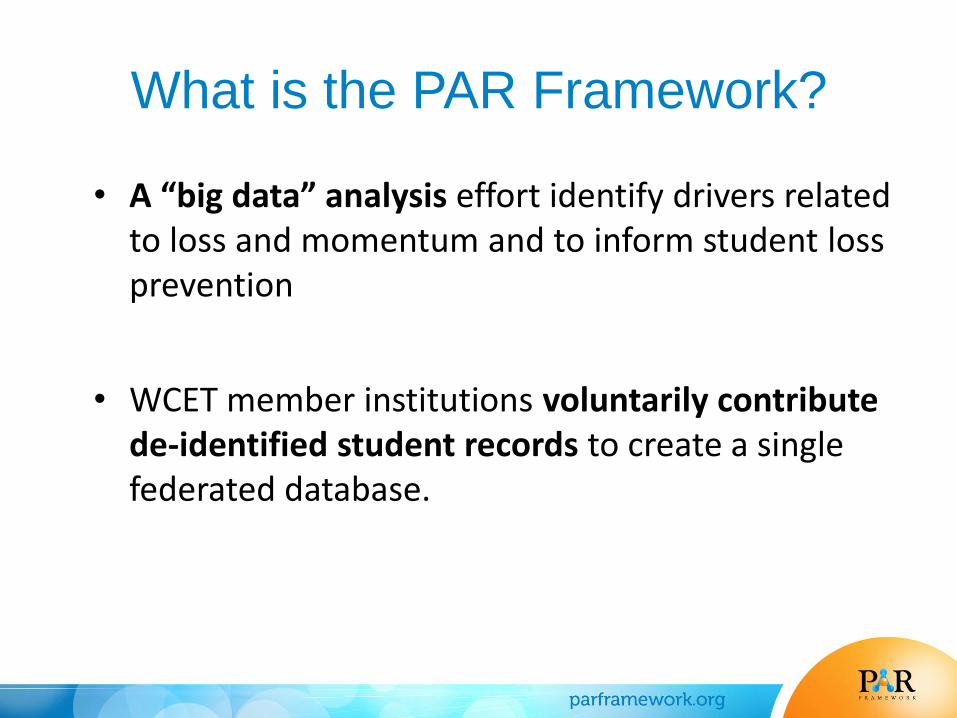
What is the PAR Framework?
• A “big data” analysis effort identify drivers related to loss and momentum and to inform student loss prevention
• WCET member institutions voluntarily contribute de-identified student records to create a single federated database.
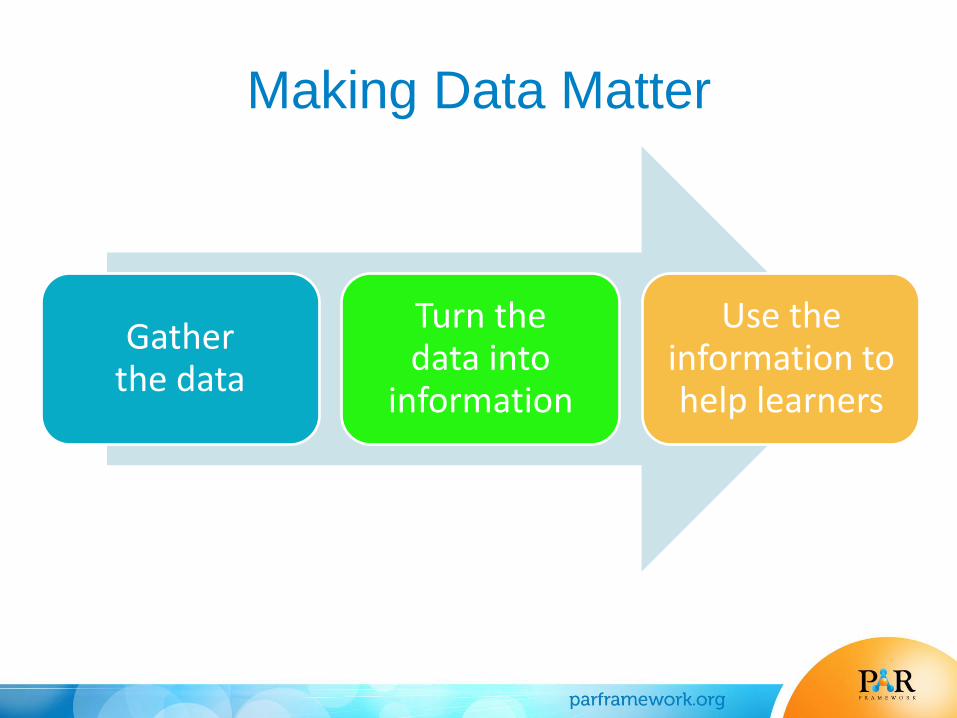
Making Data Matter
Gather the data
Turn the data into
information
Use the information to help learners
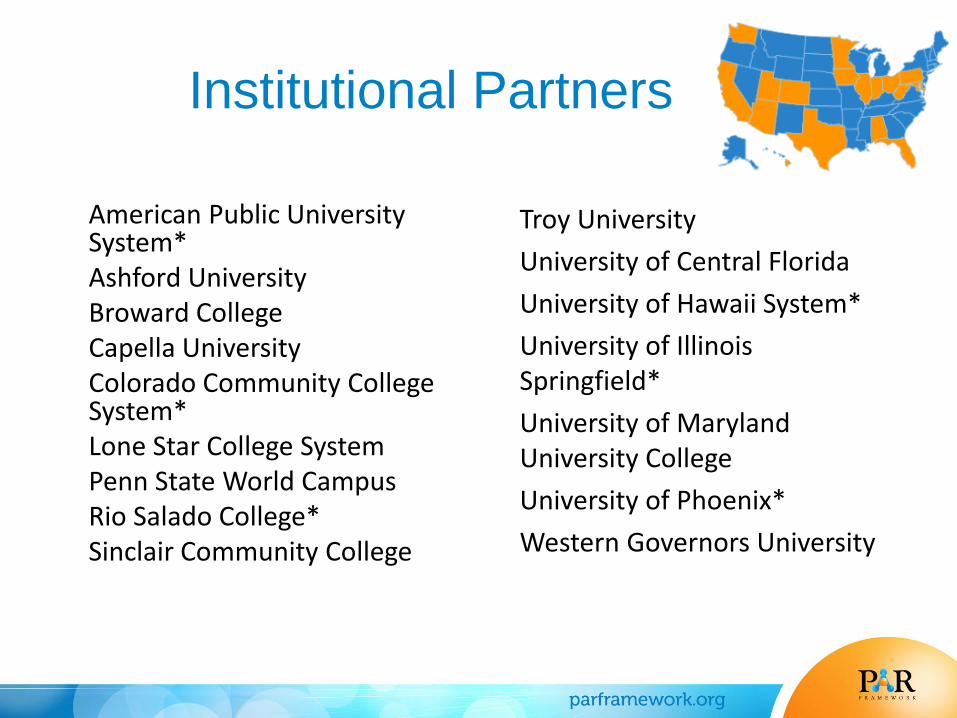
Institutional Partners
American Public University System* Ashford University Broward College Capella University Colorado Community College System* Lone Star College System Penn State World Campus Rio Salado College* Sinclair Community College
Troy University
University of Central Florida
University of Hawaii System*
University of Illinois Springfield*
University of Maryland University College
University of Phoenix*
Western Governors University
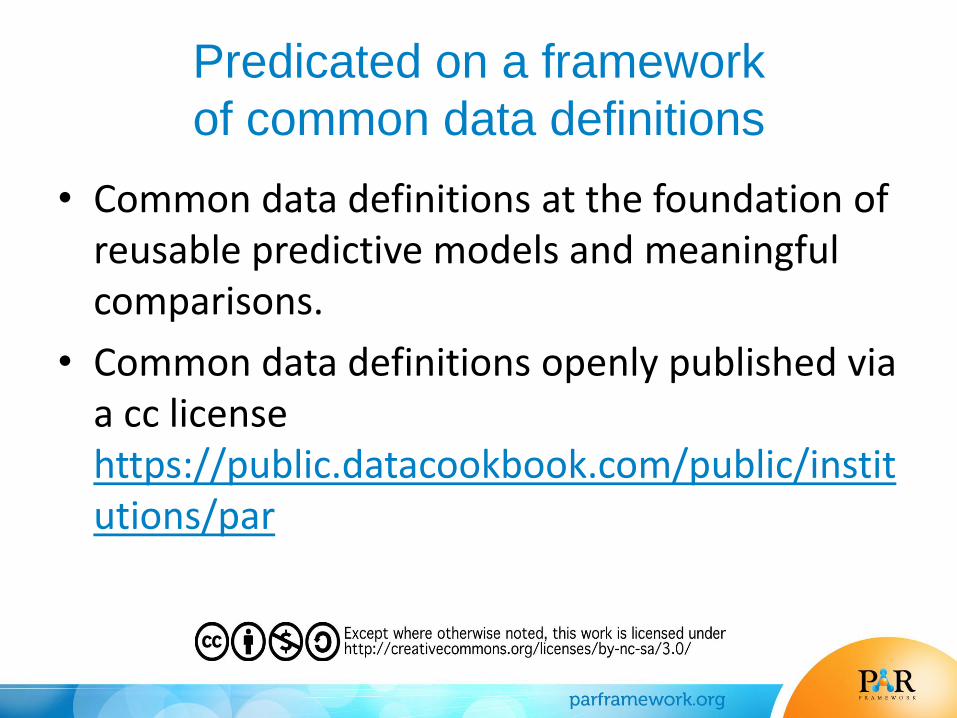
Predicated on a framework
of common data definitions
• Common data definitions at the foundation of reusable predictive models and meaningful comparisons.
• Common data definitions openly published via a cc license https://public.datacookbook.com/public/institutions/par
Multi-institutional data
Institutional Data
College Data
Program Data
Classroom/Instructor
Data
Student Data
LMS DATA
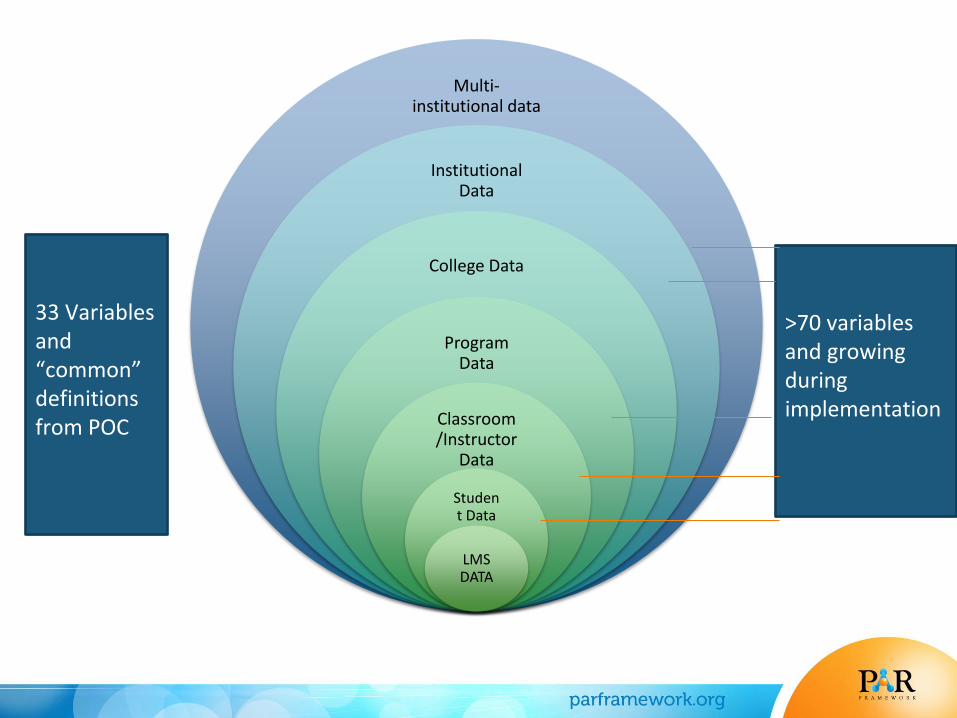
33 Variables and “common” definitions from POC
>70 variables and growing during implementation
24
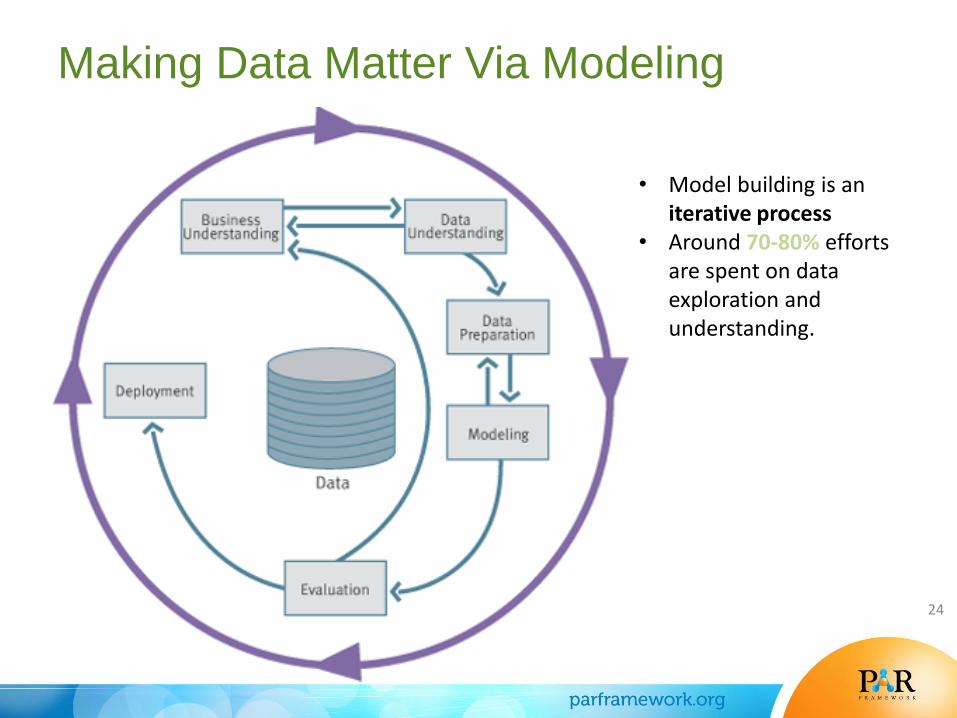
Making Data Matter Via Modeling
• Model building is an iterative process
• Around 70-80% efforts are spent on data exploration and understanding.
What are we going to DO with what we’ve learned????
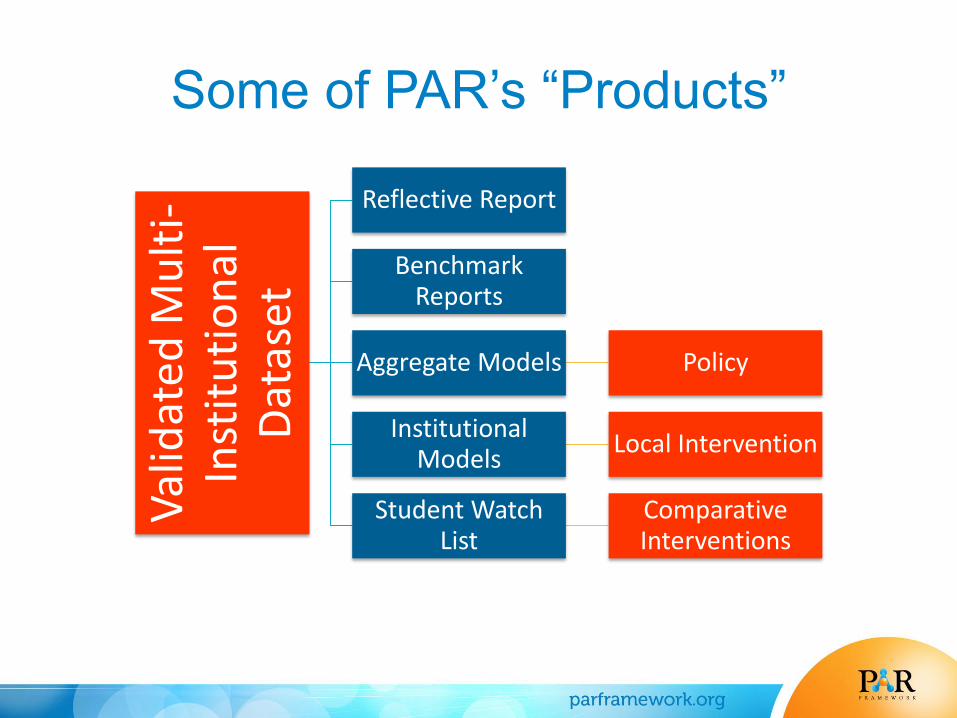
Some of PAR’s “Products”
Val
idat
ed M
ult
i-In
stit
uti
on
al
Dat
aset
Reflective Report
Benchmark Reports
Aggregate Models Policy
Institutional Models
Local Intervention
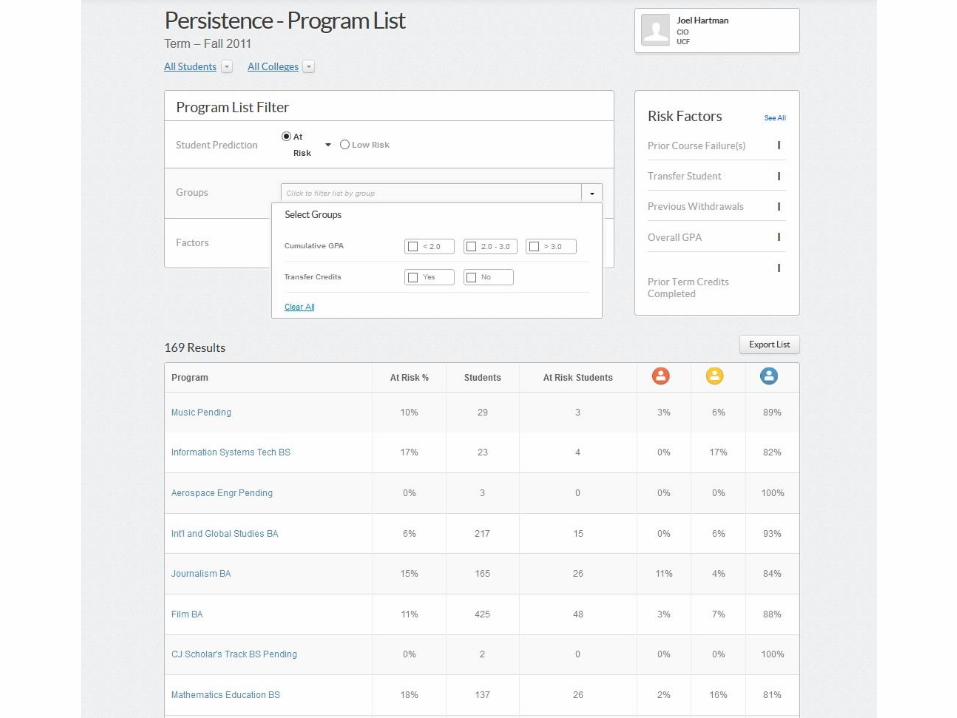
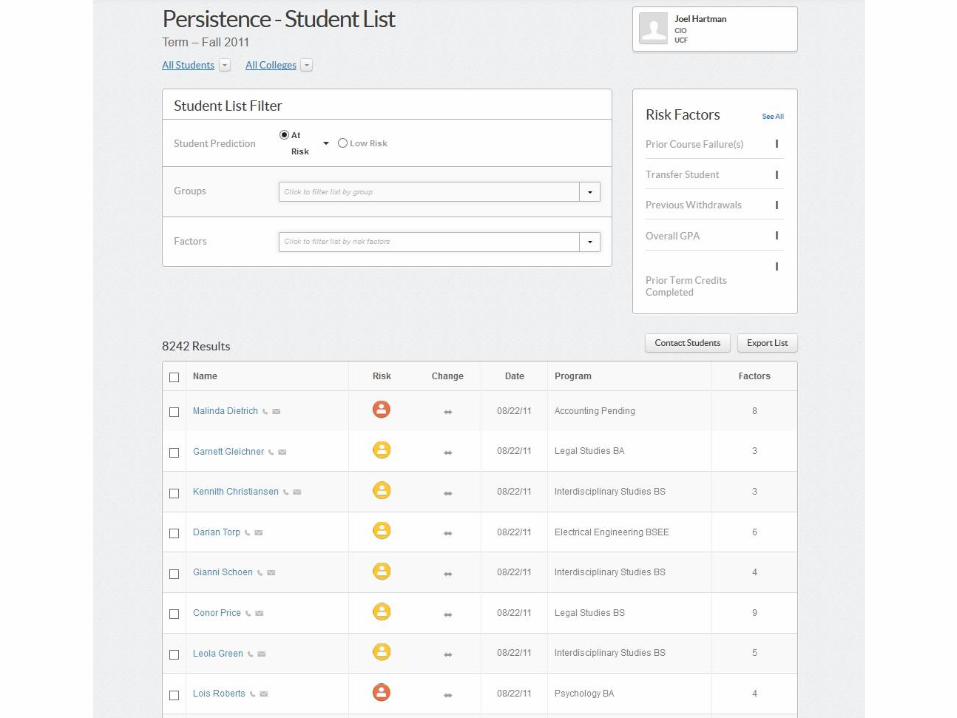
Student Watch List
Comparative Interventions
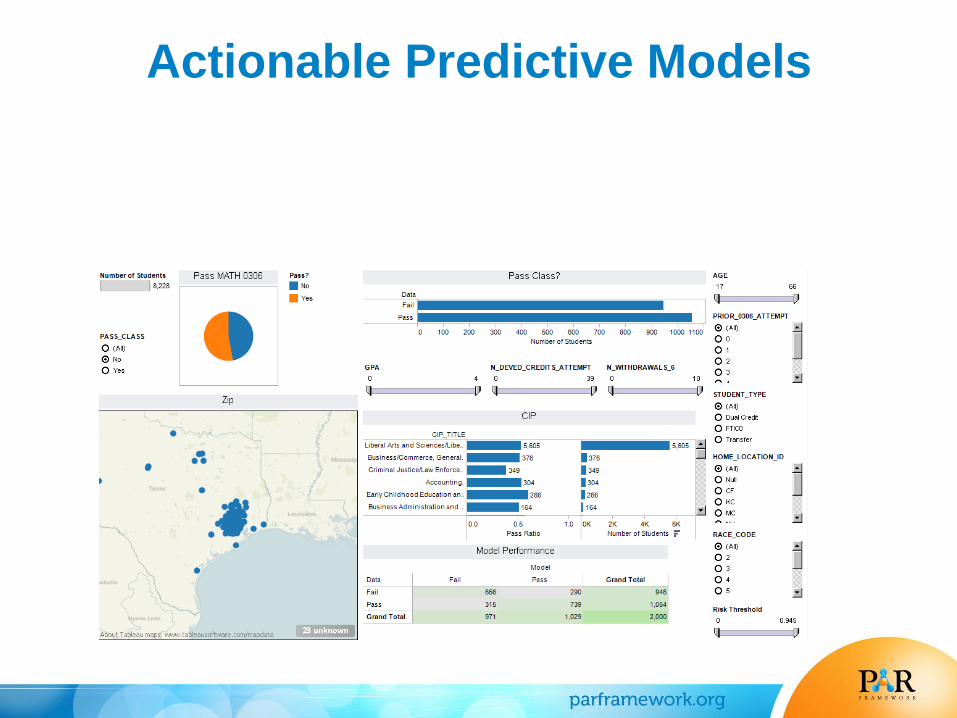
Actionable Predictive Models
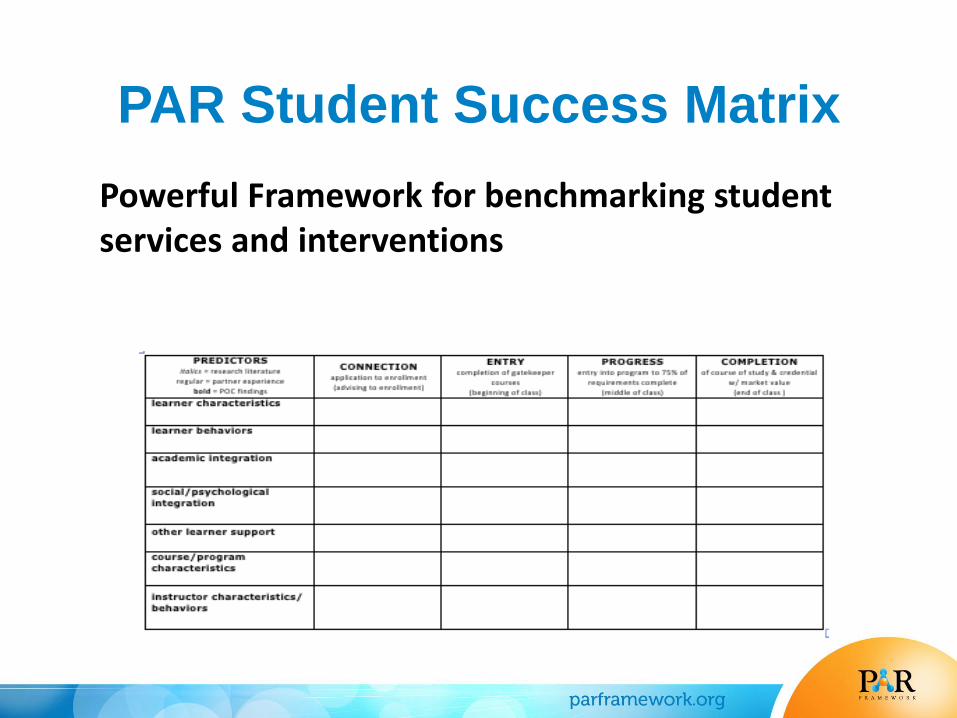
PAR Student Success Matrix
Powerful Framework for benchmarking student services and interventions
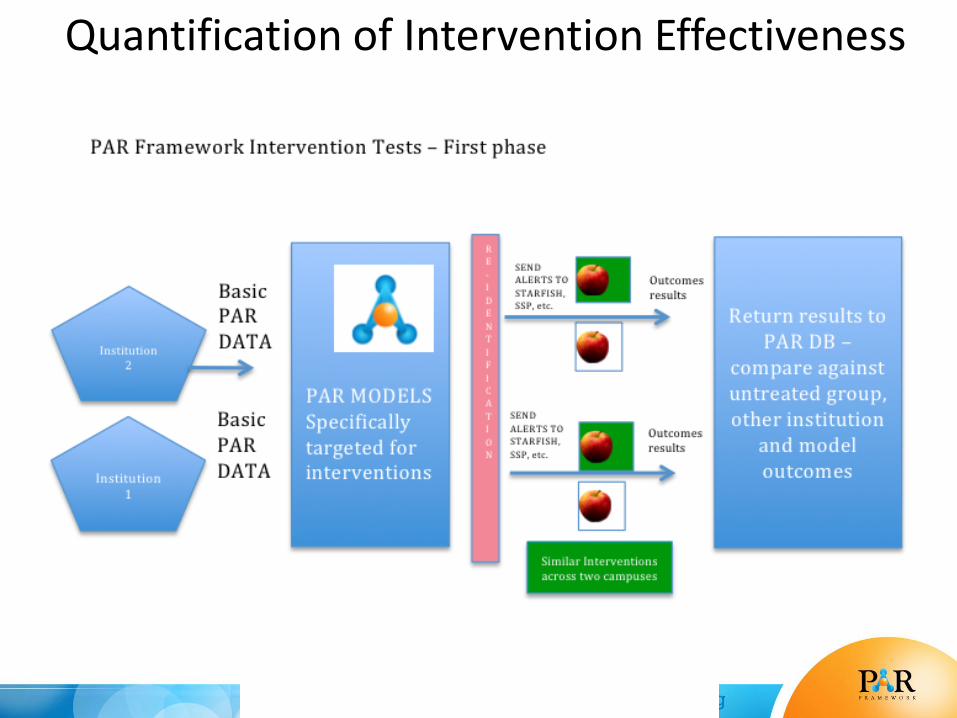
Quantified intervention effectiveness
results
Quantified intervention effectiveness results
Quantification of Intervention Effectiveness
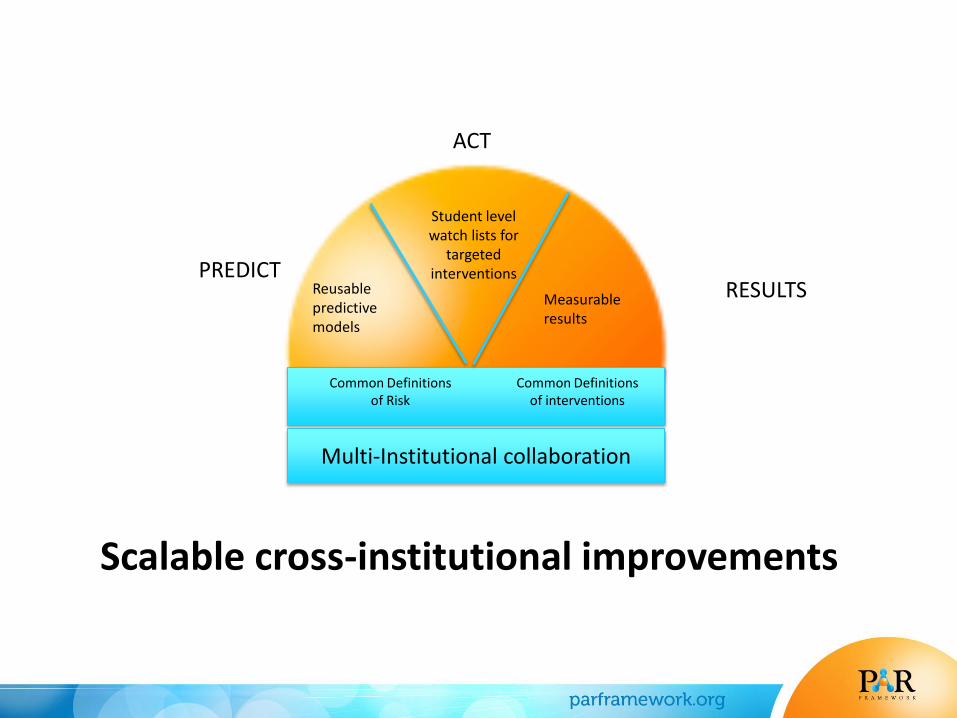
Reusable predictive models
Common Definitions of Risk
Student level watch lists for
targeted interventions
Multi-Institutional collaboration
Measurable results
PREDICT
ACT
RESULTS
Common Definitions of interventions
Scalable cross-institutional improvements
Partner Perspectives:
The University of Central Florida
Dr. Joel Hartman
Vice Provost for Information Technologies and Resources and CIO
THANKS for your interest
http://parframework.org
http://wcet.wiche.edu
Big Data
&
UCF Student
Success
1
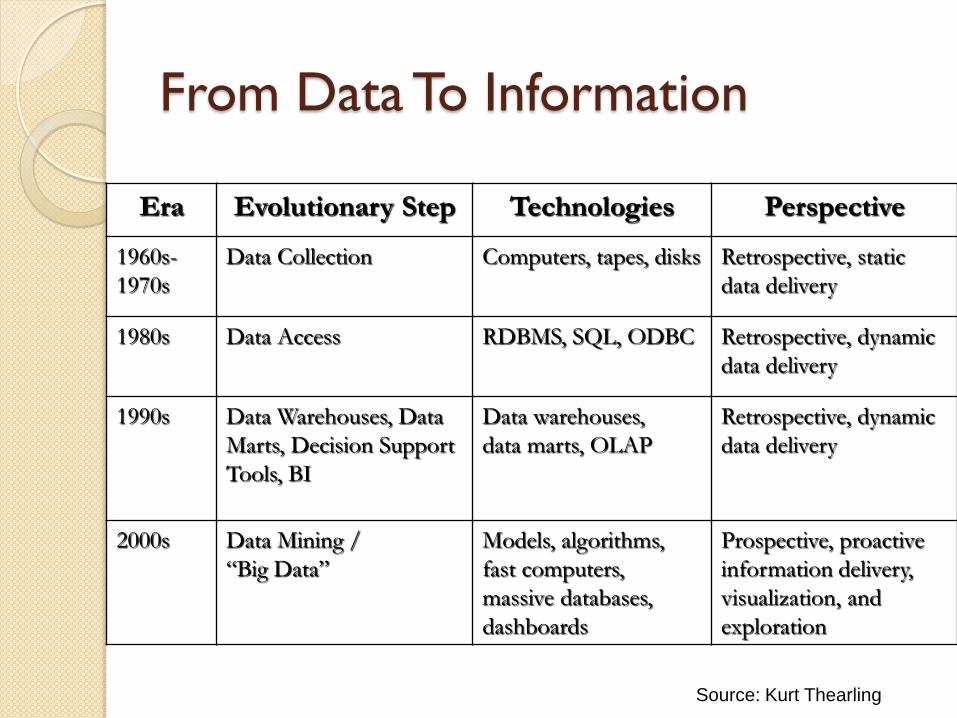
From Data To Information
Era Evolutionary Step Technologies Perspective
1960s-
1970s
Data Collection Computers, tapes, disks Retrospective, static
data delivery
1980s Data Access RDBMS, SQL, ODBC Retrospective, dynamic
data delivery
1990s Data Warehouses, Data
Marts, Decision Support
Tools, BI
Data warehouses,
data marts, OLAP
Retrospective, dynamic
data delivery
2000s Data Mining /
“Big Data”
Models, algorithms,
fast computers,
massive databases,
dashboards
Prospective, proactive
information delivery,
visualization, and
exploration
Source: Kurt Thearling
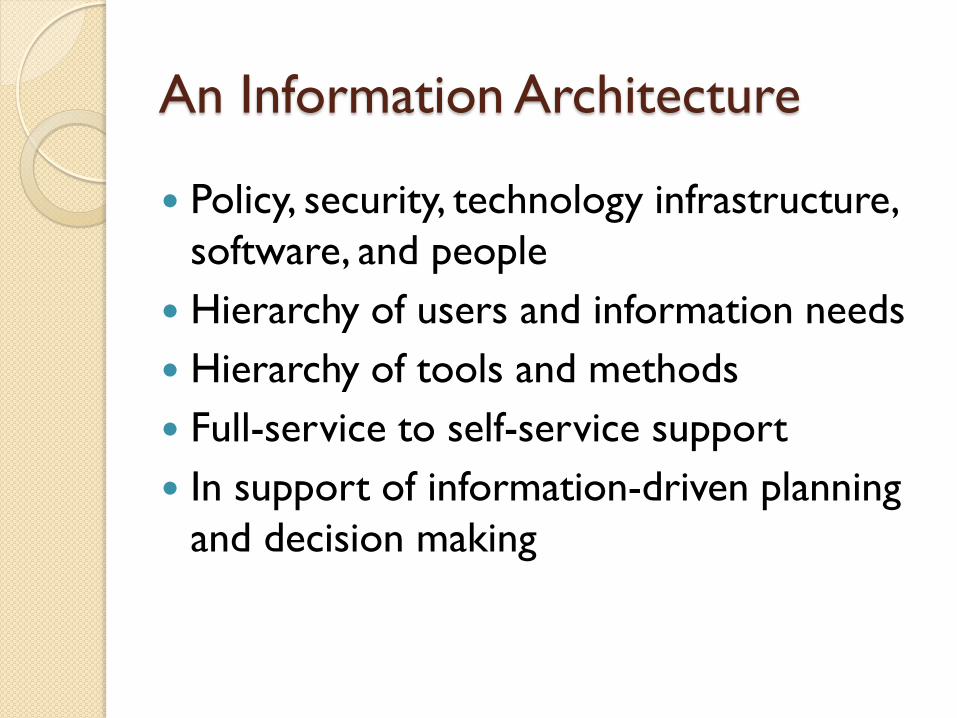
An Information Architecture
Policy, security, technology infrastructure,
software, and people
Hierarchy of users and information needs
Hierarchy of tools and methods
Full-service to self-service support
In support of information-driven planning
and decision making
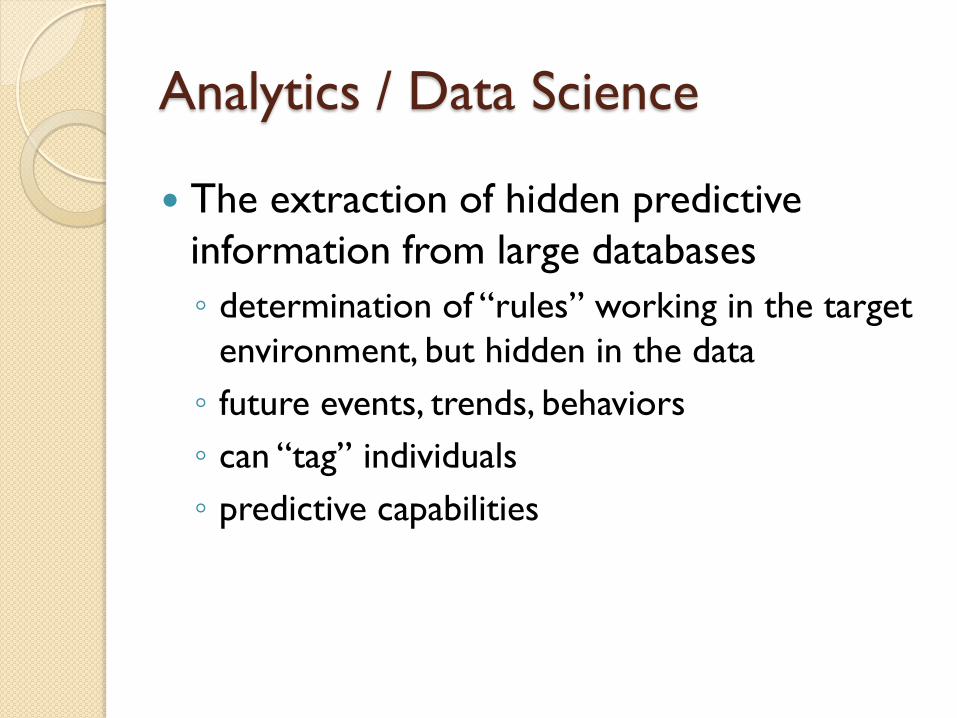
Analytics / Data Science
The extraction of hidden predictive
information from large databases
◦ determination of “rules” working in the target
environment, but hidden in the data
◦ future events, trends, behaviors
◦ can “tag” individuals
◦ predictive capabilities
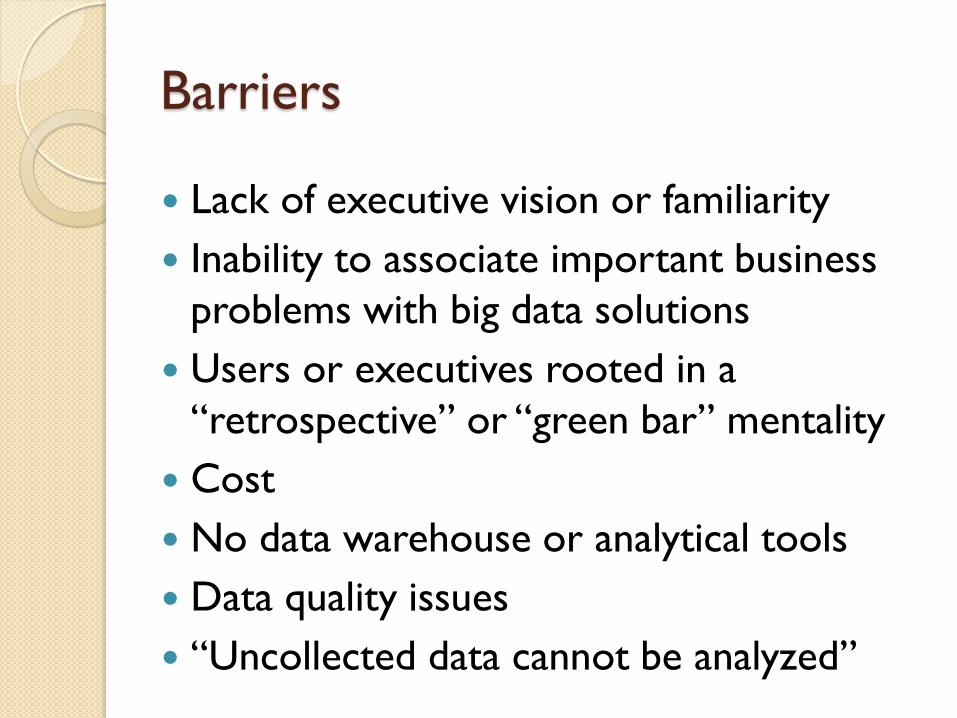
Barriers
Lack of executive vision or familiarity
Inability to associate important business
problems with big data solutions
Users or executives rooted in a
“retrospective” or “green bar” mentality
Cost
No data warehouse or analytical tools
Data quality issues
“Uncollected data cannot be analyzed”
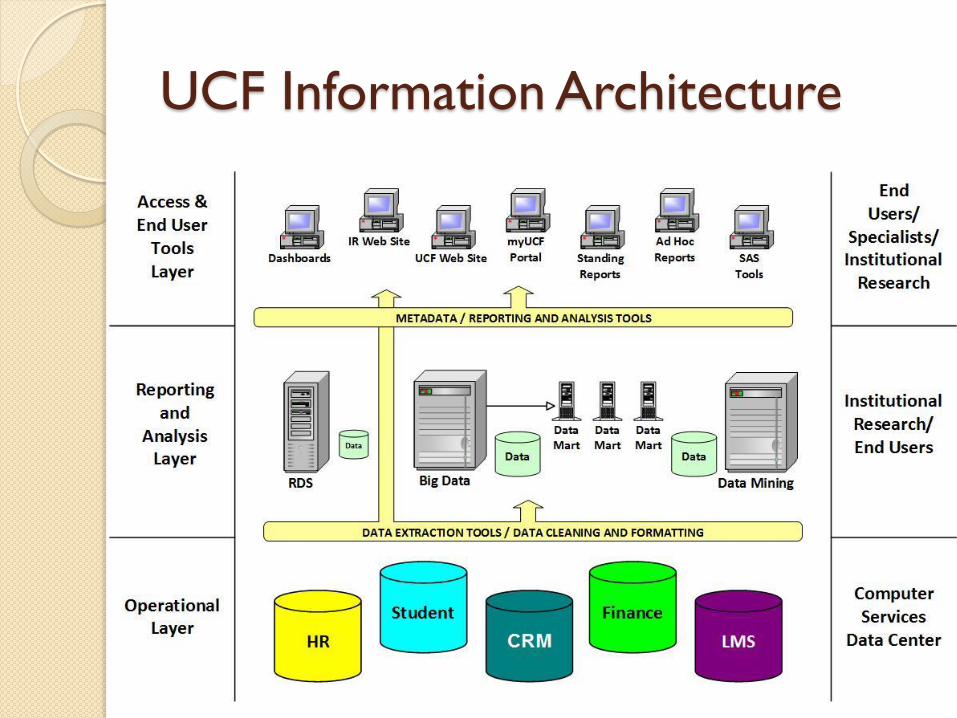
UCF Information Architecture
6
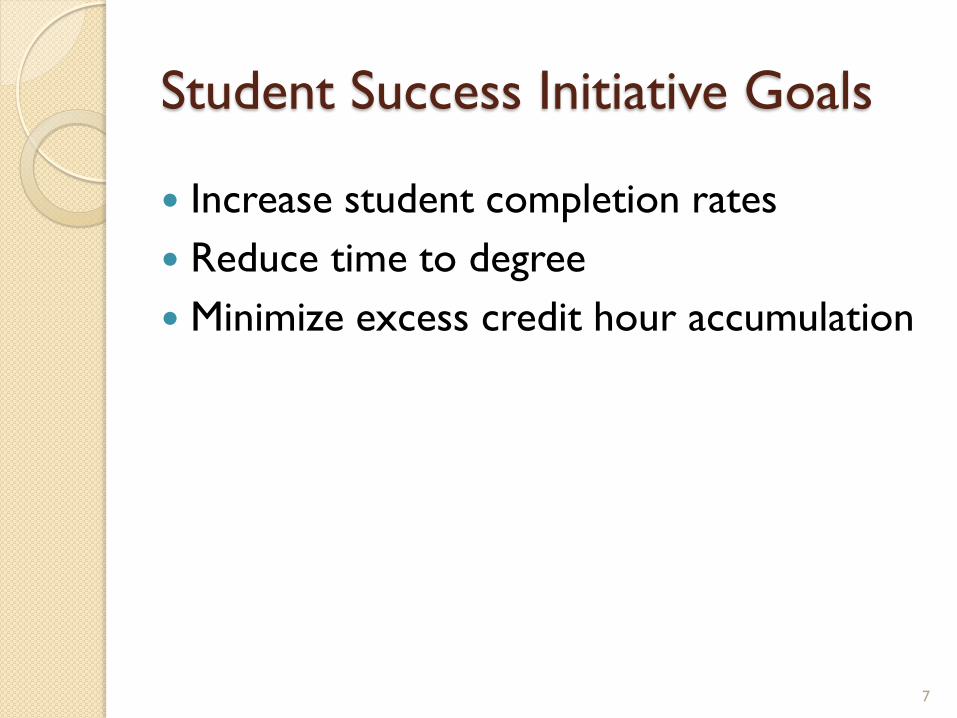
Student Success Initiative Goals
Increase student completion rates
Reduce time to degree
Minimize excess credit hour accumulation
7
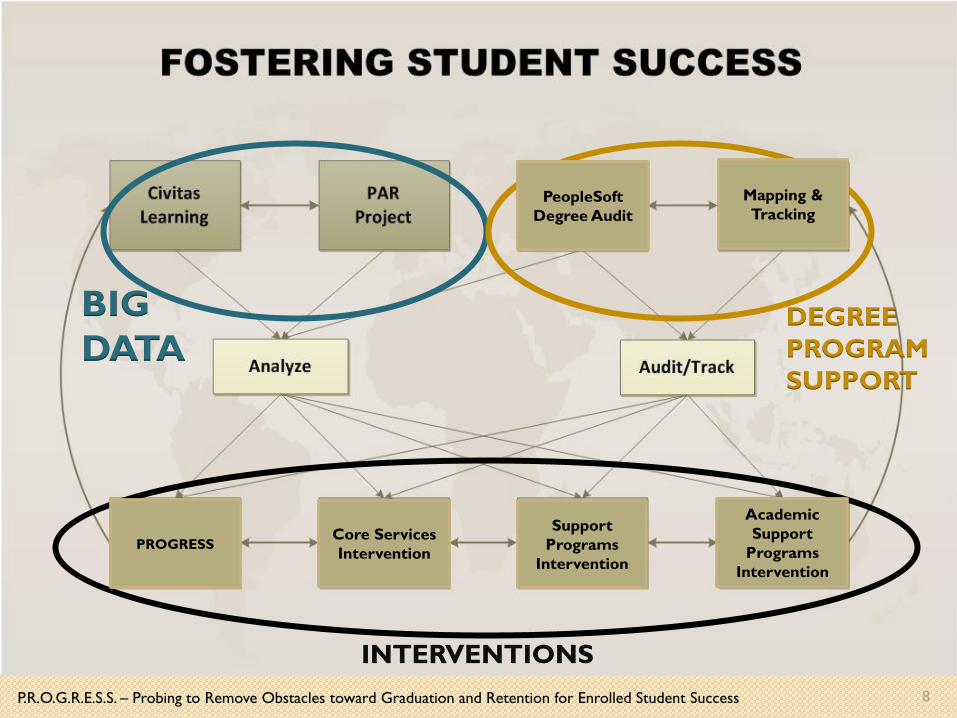
8
BIG
DATA DEGREE
PROGRAM
SUPPORT
INTERVENTIONS
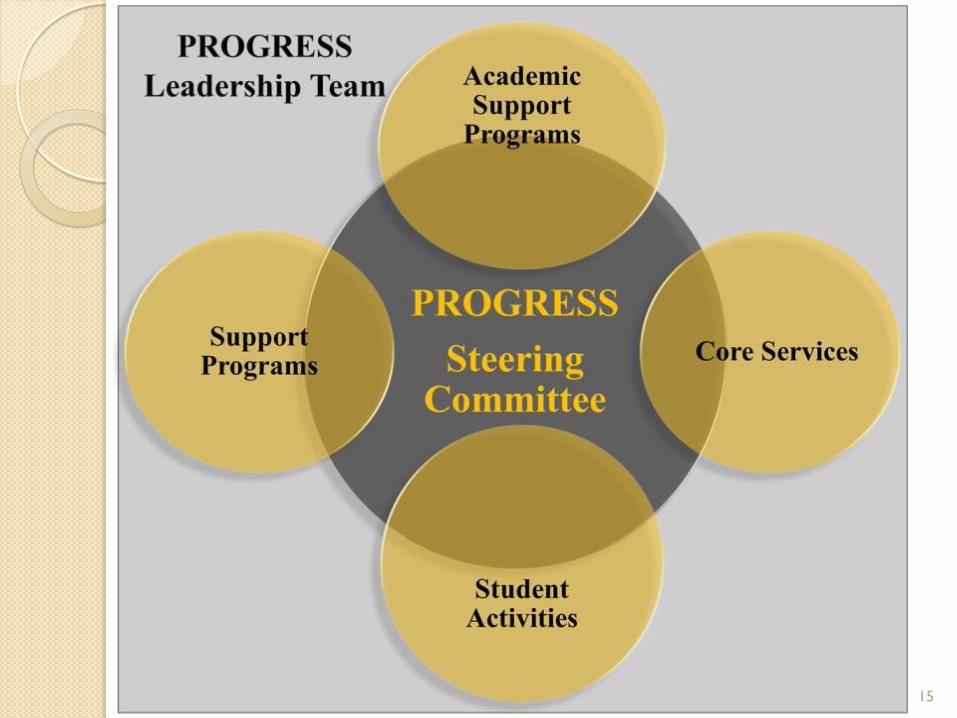
PROGRESS
P.R.O.G.R.E.S.S. – Probing to Remove Obstacles toward Graduation and Retention for Enrolled Student Success
PeopleSoft
Degree Audit
Mapping &
Tracking
Core Services
Intervention
Support
Programs
Intervention
Academic
Support
Programs
Intervention
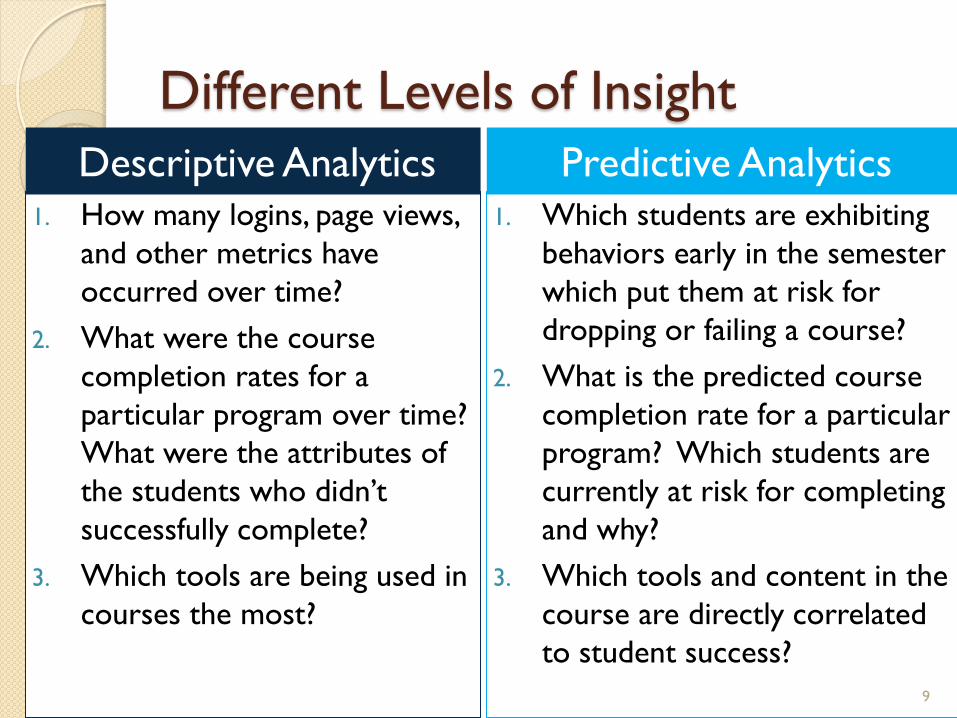
Different Levels of Insight
1. How many logins, page views,
and other metrics have
occurred over time?
2. What were the course
completion rates for a
particular program over time?
What were the attributes of
the students who didn’t
successfully complete?
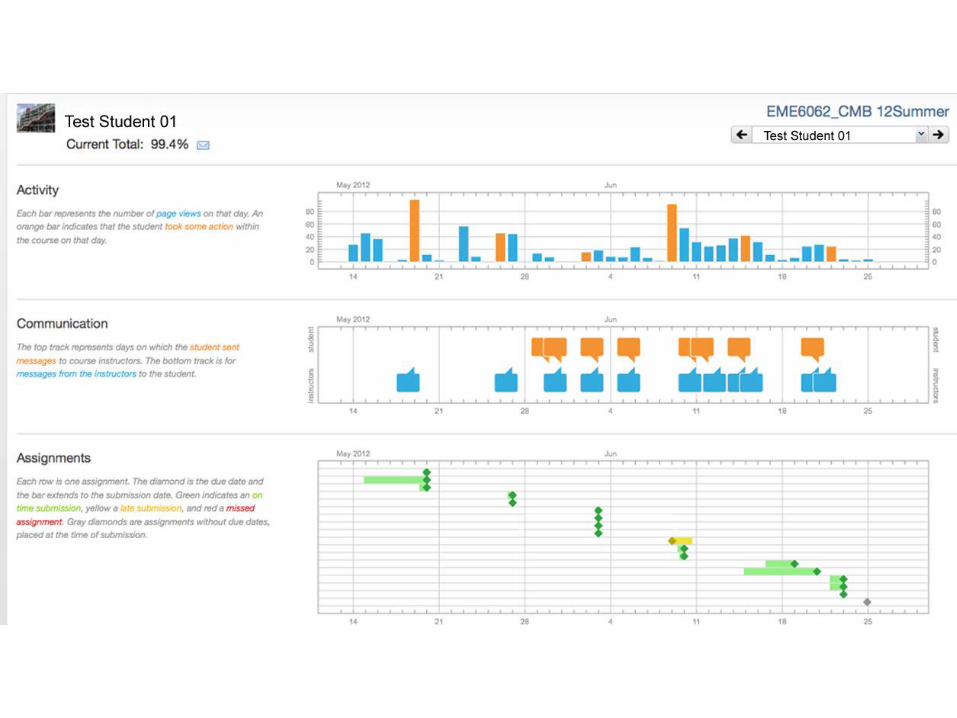
3. Which tools are being used in
courses the most?
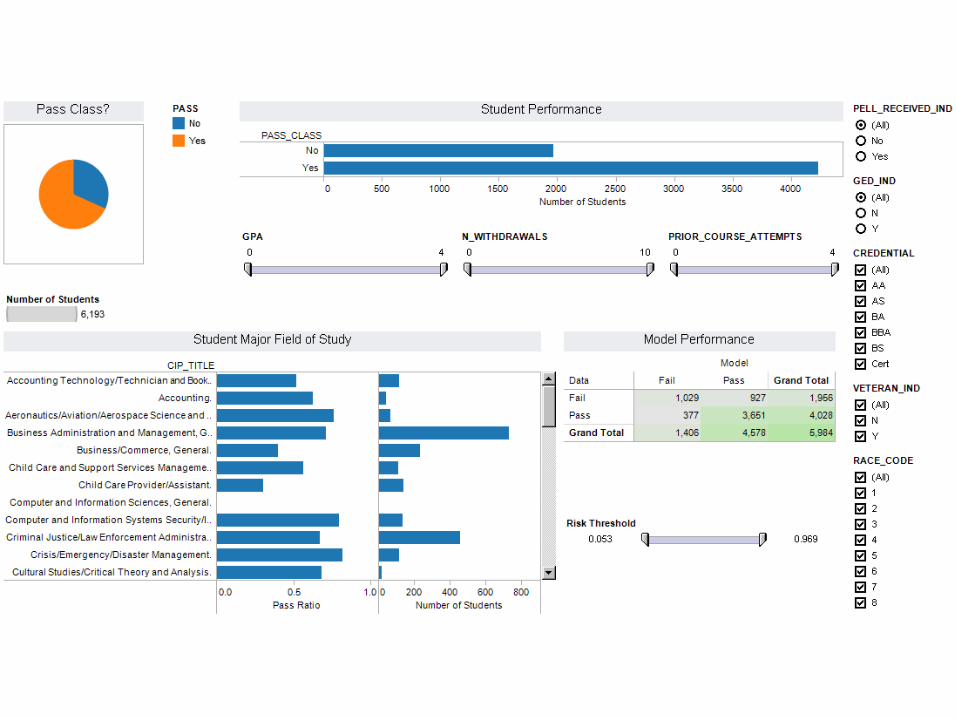
1. Which students are exhibiting
behaviors early in the semester
which put them at risk for
dropping or failing a course?
2. What is the predicted course
completion rate for a particular
program? Which students are
currently at risk for completing
and why?
3. Which tools and content in the
course are directly correlated
to student success?
Descriptive Analytics Predictive Analytics
9
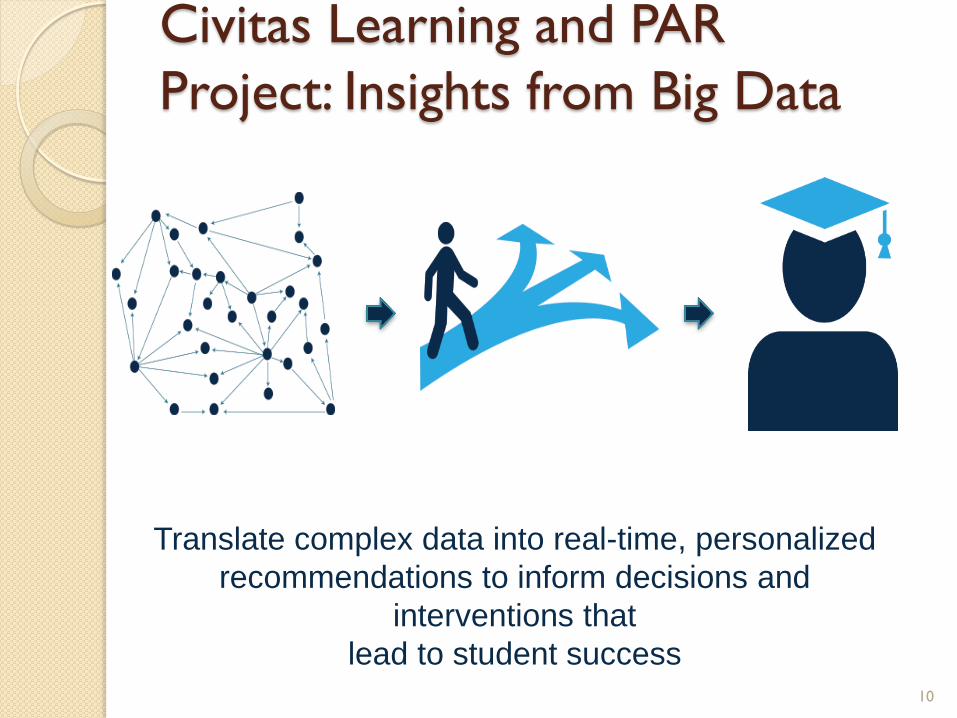
Civitas Learning and PAR
Project: Insights from Big Data
Translate complex data into real-time, personalized
recommendations to inform decisions and
interventions that
lead to student success 10
15

Big Data
&
UCF Student
Success
16