Embed Size (px)
Citation preview
53
In This ChapterThis chapter describes the approaches for selecting products and how to size them for creation and enhancement. The challenge is to select projects well so that the organization realizes the greatest return on investment (ROI) possible and provides high-quality, sus-tainable products. To achieve this, organizations use some form of product-portfolio management. We explore some of that approach's shortcomings (delays, staleness) and offer a better one—one that uses Lean thinking.
TakeawaysKey insights to take away from this chapter include the following.
• The Lean product portfolio should consist of minimum mar-ketable features (MMF) to enable quick delivery of small product enhancements.
• Teams should be organized so that they can work efficiently on these product enhancements.
• Minimizing work-in-process improves efficiency while reducing risk.
• Increasing customer value must encompass all product lines.
Chapter 4
Lean Portfolio Management “There is nothing so useless as doing efficiently that which should not be done at all.” —Peter F. Drucker
54 Chapter4•LeanPortfolioManagement
TheChallengeofSelectingProjects
Improving the product-development process is only half the challenge for software development. The other half, even more fundamental, is select-ing the most important products to create and enhance. This approach is called “portfolio management.”
Portfolio management applies to both product-development organiza-tions and IT organizations. Each type of organization has its particular set of challenges, but the general approach, which we describe here, works for both. You must adapt it to your own situation, of course.
Introducing Terms
At the outset, it always helps to define terms. This section introduces terms we use throughout the rest of the book.
Enterprise
As defined in chapter 1, An Agile Developer’s Guide to Lean Software Develop ment, when we refer to the “enterprise,” we mean all parts of the organization that are involved in the value stream of the product or ser-vice being created, enhanced, or maintained. In an IT organization this includes the business and IT sides. In a product company, it also includes marketing, sales, delivery, support, and development.
ProductOrganizationandCustomerOrganization
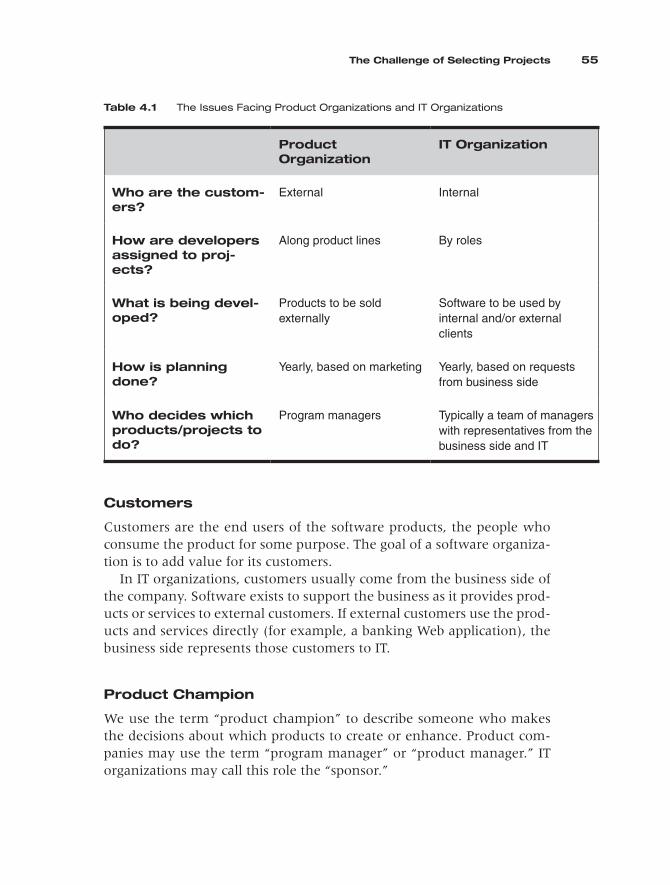
“Product organizations” create software products for companies that derive revenue directly from the software. Customers are primarily external to the organization and developers are managed along product lines. In contrast, “IT organizations” create products for companies whose principal products are not software but that depend on software and applications to deliver or manage their products or services. Examples include financial institutions, healthcare providers, and insurance com-panies. Customers are primarily internal to the organization and devel-opers are managed by roles. Table 4.1 illustrates the differences. Of course, these are just two endpoints on a spectrum; companies might have a mix of both.
TheChallengeofSelectingProjects 55
Table4.1 The Issues Facing Product Organizations and IT Organizations
ProductOrganization
ITOrganization
Whoarethecustom-ers?
External Internal
Howaredevelopersassignedtoproj-ects?
Along product lines By roles
Whatisbeingdevel-oped?
Products to be sold externally
Software to be used by internal and/or external clients
Howisplanningdone?
Yearly, based on marketing Yearly, based on requests from business side
Whodecideswhichproducts/projectstodo?
Program managers Typically a team of managers with representatives from the business side and IT
Customers
Customers are the end users of the software products, the people who consume the product for some purpose. The goal of a software organiza-tion is to add value for its customers.
In IT organizations, customers usually come from the business side of the company. Software exists to support the business as it provides prod-ucts or services to external customers. If external customers use the prod-ucts and services directly (for example, a banking Web application), the business side represents those customers to IT.
ProductChampion
We use the term “product champion” to describe someone who makes the decisions about which products to create or enhance. Product com-panies may use the term “program manager” or “product manager.” IT organizations may call this role the “sponsor.”
56 Chapter4•LeanPortfolioManagement
Project
We use the term “project” to represent a fixed body of work selected to be implemented. It is the work required to create or enhance a product. For “project,” you can substitute the phrase “product creation,” “product enhancement,” or “product fix” if that helps orient you toward product thinking.
Process
“Process” means different things to different people. In software develop-ment, we think of a process as an agreement by a team about how they will work together.
The team is responsible for its process. Teams employ their local knowledge about what is required to do their work, complementing required enterprise standards. The team agrees to use and improve its own processes.
Processes exist to serve the people, to help them get their work done. No process is perfect; when problems arise, the team is responsible to stop, change the process, and start again, all without affixing blame to any one person.
ProjectPortfolios
Virtually all large organizations have a portfolio of projects that they must manage. The mix of these projects is designed to maximize the return on their software-development investment. Ideally, the most important proj-ects would be selected and then given to the development teams; but the larger the portfolio, the harder it is to administer.
Project Portfolios Are Idea Inventories
Administering the project portfolio involves a planning life cycle. The organization uses the life cycle to identify the sources of greatest ROI and then defines a plan to achieve it. It is common to use a yearly project planning cycle. An unintended outcome of the annual cycle is an ever-widening gap between what delivery organizations are working on and what the business needs. The wider the gap, the staler and the less rele-vant the projects become. The annual cycle becomes a sinkhole into which ideas descend.
ProjectPortfolios 57
Think of project ideas as a type of “work-in-process” (WIP). As long as an idea is in process, the business does not realize value from it. The quicker you can turn it into a real product, the sooner it has value.
What causes excess WIP? Planning teams start out with great inten-tions. They develop tight business cases and project visions during the project vision “season.” Program managers lead value-driven discussions about the capabilities and features they need to respond to market oppor-tunities or competitor threats.
Then they enter the technical analysis season. All of that high-band-width communication between business and development degrades while technical organizations take time to analyze the requirements. Work drops into various technical silos (QA, mid-tier, UI, and the like). Technical integration is pushed off farther and farther.1 It becomes a downward spiral—people need to be kept busy while they wait for answers to planning questions; the busier they are, the longer it takes them to answer other questions.
Business is savvy about these delays. If they anticipate long delivery cycles, they may end up piling on poorly prioritized requirements (the kitchen-sink effect) in the hope of getting some work that is useful. The more work they give, the larger the portfolio grows. And the larger the portfolio, the harder it is to administer. And the harder it is to administer, the more delays there are. And so on. It is a vicious cycle.
Should We Avoid Delays by Batching Project Analysis?
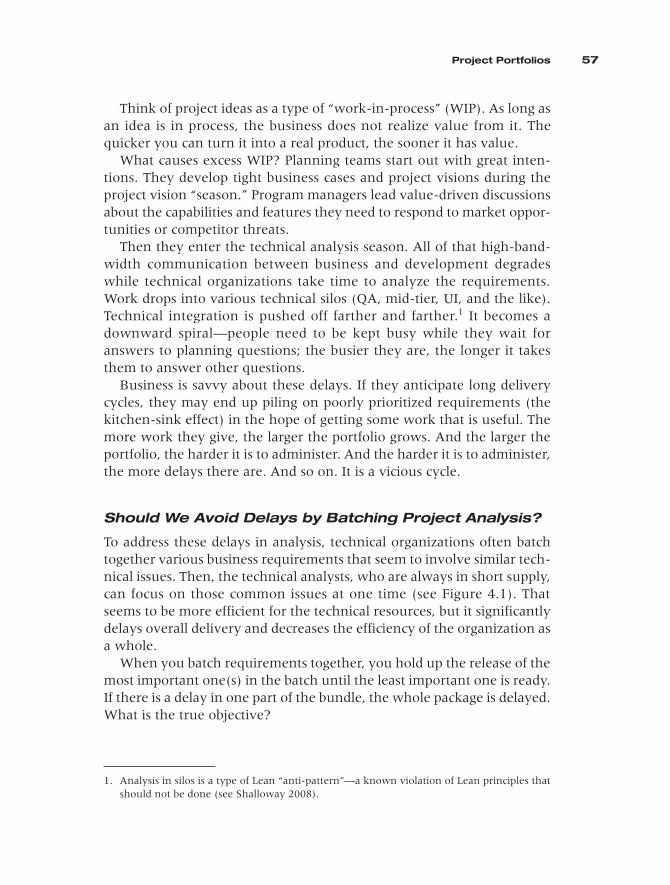
To address these delays in analysis, technical organizations often batch together various business requirements that seem to involve similar tech-nical issues. Then, the technical analysts, who are always in short supply, can focus on those common issues at one time (see Figure 4.1). That seems to be more efficient for the technical resources, but it significantly delays overall delivery and decreases the efficiency of the organization as a whole.
When you batch requirements together, you hold up the release of the most important one(s) in the batch until the least important one is ready. If there is a delay in one part of the bundle, the whole package is delayed. What is the true objective?
1. Analysis in silos is a type of Lean “anti-pattern”—a known violation of Lean principles that should not be done (see Shalloway 2008).
58 Chapter4•LeanPortfolioManagement
The obstacle comes from letting projects drive planning. The focus is on minimizing cost and maximizing resource utilization rather on speed and realizing ROI quickly.
Should We Avoid Delays by Increasing Releases?
One approach to narrowing the gap between idea and delivery—between concept and consumption—is to increase the frequency of a product’s releases. This is good in that it gives the business a predictable schedule of changes. And it gives the appearance of rapid delivery. But if there is still a 12- to 18-month gap between idea and delivery, there is still sig-nificant delay. The ideas are still stale.
LeanPortfolioManagement
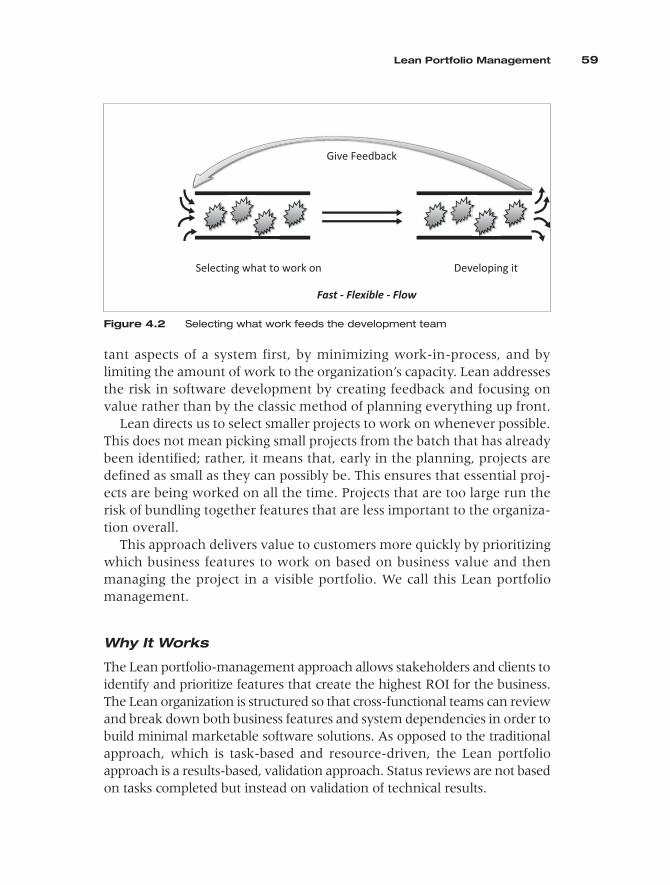
Lean thinking offers a way out of the vicious cycle that can come with managing a large product portfolio. We start by thinking about the rela-tionship between the portfolio’s needs and development team’s needs. As shown in Figure 4.2, there is a pipeline and a feedback mechanism between the two. The goal is to promote a fast-flexible-flow of work while selecting projects that return the greatest value to the organization. Lean thinking says to focus on sustainable speed by delivering the most impor-
Your Bank & Trust
Project Charter: Marconi (Phase 1)Executive Summary
Business Problem
Business Opportunity
Benefits
Project Approach
Stakeholders List
Business CapabilitiesMuch Needed Upgrades
Much Needed Stuff
Capability 1:Capability 2:Capability 3:Capability 4:
Capability 5:Capability 6:Capability 7:
Koffee Hut’s runaway growth has been driven by concentrated efforts on a�rac�ng new customers. To date, this focus has been extremely successful, and has created the opportunity for Koffee Hut to begin development projects geared toward retaining the large number of exis�ng clients. This project is the first of a 3-year program aimed at client retainment.
An engagement is underway with Six Sigma Consultants to measure customer sa�sfac�on through surveys in order to determine root cause of clients lost to compe��on. Preliminary analysis of surveys indicate that as new customers become repeat customers, they place higher value on quicker service as they grow comfortable with Koffee Hut’s selec�ons. Surveys indicate that regular customers, while delighted with Koffee Hut's products, are growing frustrated with the �me it takes to have repeat orders filled.
Post-survey interviews indicate that the high volume, repeat customers visit the same Koffee Hut loca�on at regular repeatable �mes, typically before their commute to or from work. This class of customer represents the most valuable client that, if retained, provide the highest ROI for the retainment program. Post-survey interviews also reveal that a large group customers in this classifica�on responded favorably to the descrip�on of a self-service capability that would allow easy order placement of their usually purchased product. This class of client has been dubbed "The Usual".
PAnalysis of Koffee Hut's Marke�ng Spend and current customer base allows a per-customer calcula�on. Comparing this figure to the es�mated project cost for client retainment reveals that it is 3 �mes cheaper to retain exis�ng clients versus spending to acquire new customers. The Kwikoffee Kiosk also holds promise in making the experience be�er for first-�me customers due to expected decrease in average service �me per customer. Addi�onal revenue is expected from: •Customized marke�ng opportuni�es that the transac�on data will provide •Reward program to encourage Kiosk users to buy targeted products (KoffeeBean Reward Points) •Simple analy�cs of Kiosk users will give insight into new products and services that can be offered •Outside partnerships can be established with other vendors interested in leveraging analy�cs of Koffee Hut transac�ons at the Kiosk
Standard Waterfall approach required to control project and mi�gate risk. Project team will provide detailed resource es�mate and project schedule at end of Analysis phase (project commitment milestone).
IT Systems Manager CMO VP Business Development VP New Product Development
•Order sent straight-through to display system that baristas use to make the coffee drinks
•Customized selec�ons offered--Customer transac�on is saved, so that "the usual" can be established and offered up as a selec�on
•Customer has the capability of selec�ng "something else"
•Account Informa�on Maintenance, Password Maintenance, Credit Card info Maintenance, "Usual" Selec�ons entered & Maintained
•Targeted marke�ng offers (future)
•Customer Kiosk transac�ons are analyzed for customized target promo�ons
•Customer Kiosk transac�ons analyzed for partner promo�ons
ID Task Name Start Finish DurationQ1 09 Q2 09 Q3 09 Q4 09
Jan Feb Mar Apr May Jun Jul Aug Sep Oct Nov Dec
1
2
3
4
5
6
7
8
9
10
Project Initiation
Planning
Requirements
Analysis
Design
Code
Integrate
System Acceptance Testing
Client Acceptance Testing
Deployment
1/1/2009
2/2/2009
2/26/2009
5/1/2009
6/1/2009
7/1/2009
8/3/2009
8/17/2009
8/31/2009
11/16/2009
1/30/2009
2/27/2009
4/29/2009
6/11/2009
8/14/2009
9/15/2009
10/16/2009
10/30/2009
11/13/2009
12/11/2009
22d
20d
45d
30d
55d
55d
55d
55d
55d
20d
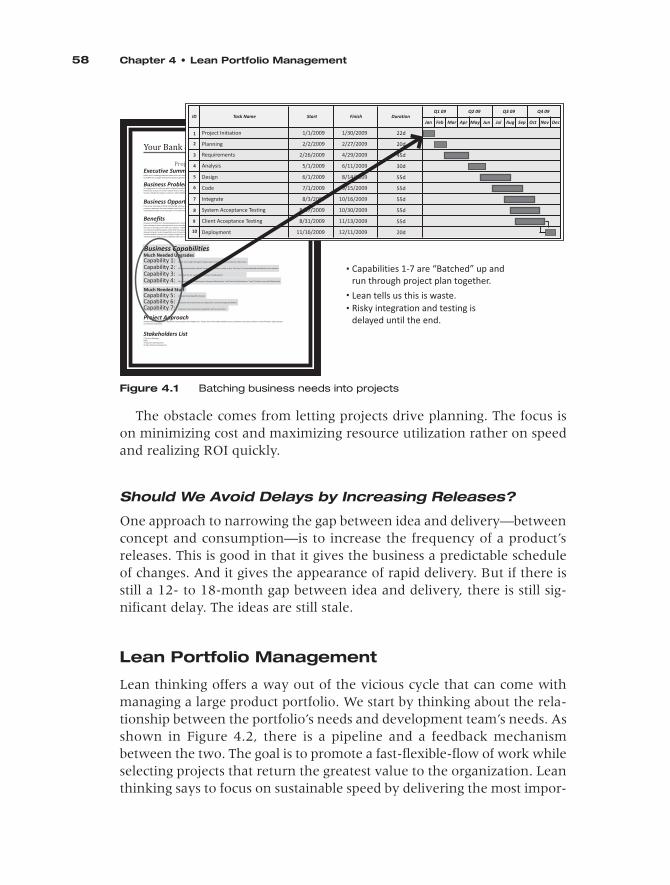
Capabilities 1-7 are “Batched” up and run through project plan together.
Lean tells us this is waste.Risky integration and testing isdelayed until the end.
.
.
.
Figure4.1 Batching business needs into projects
LeanPortfolioManagement 59
tant aspects of a system first, by minimizing work-in-process, and by limiting the amount of work to the organization’s capacity. Lean addresses the risk in software development by creating feedback and focusing on value rather than by the classic method of planning everything up front.
Lean directs us to select smaller projects to work on whenever possible. This does not mean picking small projects from the batch that has already been identified; rather, it means that, early in the planning, projects are defined as small as they can possibly be. This ensures that essential proj-ects are being worked on all the time. Projects that are too large run the risk of bundling together features that are less important to the organiza-tion overall.
This approach delivers value to customers more quickly by prioritizing which business features to work on based on business value and then managing the project in a visible portfolio. We call this Lean portfolio management.
Why It Works
The Lean portfolio-management approach allows stakeholders and clients to identify and prioritize features that create the highest ROI for the business. The Lean organization is structured so that cross-functional teams can review and break down both business features and system dependencies in order to build minimal marketable software solutions. As opposed to the traditional approach, which is task-based and resource-driven, the Lean portfolio approach is a results-based, validation approach. Status reviews are not based on tasks completed but instead on validation of technical results.
Give Feedback
Selecting what to work on Developing it
Fast - Flexible - Flow
Figure4.2 Selecting what work feeds the development team
60 Chapter4•LeanPortfolioManagement
This solves the dilemma that to deliver sooner seems to require more bodies or lowered quality. Lean thinking says that concentrating on deliv-ering the most important features of a product maximizes both team efficiency (by eliminating task switching and waiting times) and team effectiveness (by working on the most important parts of the product). By focusing on small, marketable features, with the goal of getting com-pleted software all the way through the system, an Agile team immedi-ately improves efficiency by avoiding the costs of multi-tasking and its subsequent thrashing. Furthermore, critical projects are not slowed down by working on less important projects in parallel. Additional benefits are achieved because Agile methods quickly expose impediments to rapid delivery that are normally hidden in large Waterfall projects, where pro-cesses to transform handoffs create the illusion of control.
It Is OK to Plan Releases
On the other end of the spectrum, some Scrum practitioners believe teams should stay focused on the current work iteration and never look ahead (or not much). This attitude has led to many failed Agile teams. In fact, Lean thinking agrees with Scrum’s view not to look too far ahead (trying to achieve JIT); but decisions that need to be made early still need to be made early.
The Lean product portfolio enables priorities to be set, and elaboration of details to occur, at the right, responsible moment. Value is realized incrementally. As more is learned about requirements, that knowledge is fed back into the planning for future increments.
Thus, Agile methods allow a learning organization to emerge, which results in predictable estimation of features described at the capability level. These features can be deconstructed in advance of the iteration in which they are actually implemented by establishing Lean flow that is conceptualized as the planned release of features.
With Existing Systems, Plan to Use Incremental Delivery
Building and delivering incrementally works when converting existing systems, too. Customers may say that they “want everything we had in the old system.” But that means they haven’t done an analysis of which features have been valuable. It is extremely unlikely that every feature in the existing system is truly valuable. By building in steps, business value
TheBenefitsofLeanPortfolioManagement 61
drives and it allows the development team to focus only on high-value, required features, and not to waste time converting the system’s unneeded features (or worse, bugs). It also allows the business to embrace market changes and opportunities that arise during the conversion project. 2
TheBenefitsofLeanPortfolioManagement
This section describes four of the benefits that Lean portfolio management provides to a business.
Speed and Quality
A development organization that is truly in synch with its business cus-tomers positions itself to help identify minimal marketable features and is structured to be able to release them quickly. Organizations successfully making the transition to Lean-Agile discover that attempts to deliver quickly expose delays that are impediments to both effective and efficient product development. This enables the organization to adjust and to remove these delays and so deliver value more quickly. When the entire enterprise is focused on speed, market opportunities can be leveraged and threats bypassed; the result is rapid savings and realized profits. In order to accommodate this, the development team must begin to see delivery and quality as sustainable activities that are constantly improved by short-cycle feedback loops. Once time-to-market becomes the focus, actions taken to reduce delays cause quality to go up since these delays are the cause of quality problems. The shorter cycles also reduce the development cost by eliminating wasteful steps.
Another benefit of focusing on speed is that the team’s understanding of what they are building increases and they can therefore avoid building what they don’t need. This creates less complex systems because they are smaller—again, resulting in higher quality. Creating smaller, high-quality modules creates an upward spiral of competitive strength by enabling future changes to be more easily manifested.
2. This does require that the technology organization understand Agile design patterns and Test-Driven Development. These practices allow teams to create change-tolerant architec-tures that give confidence to make aggressive design changes, since the architecture supports them, and suites of automated regression tests allow verification that nothing existing is broken as changes are implemented.
62 Chapter4•LeanPortfolioManagement
Line of Sight to Business Needs
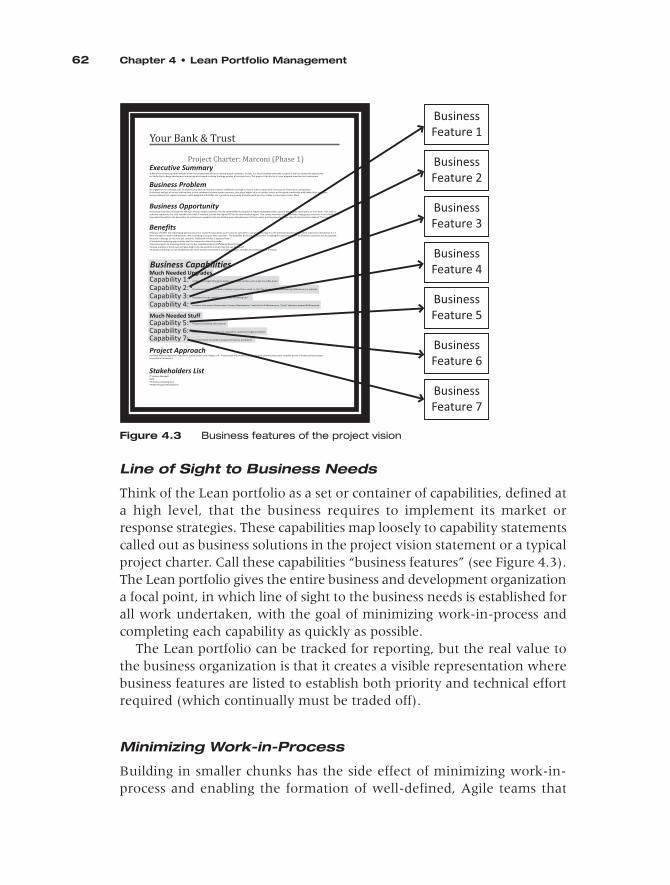
Think of the Lean portfolio as a set or container of capabilities, defined at a high level, that the business requires to implement its market or response strategies. These capabilities map loosely to capability statements called out as business solutions in the project vision statement or a typical project charter. Call these capabilities “business features” (see Figure 4.3). The Lean portfolio gives the entire business and development organization a focal point, in which line of sight to the business needs is established for all work undertaken, with the goal of minimizing work-in-process and completing each capability as quickly as possible.
The Lean portfolio can be tracked for reporting, but the real value to the business organization is that it creates a visible representation where business features are listed to establish both priority and technical effort required (which continually must be traded off).
Minimizing Work-in-Process
Building in smaller chunks has the side effect of minimizing work-in-process and enabling the formation of well-defined, Agile teams that
Figure4.3 Business features of the project vision
Your Bank & Trust
Project Charter: Marconi (Phase 1)Executive Summary
Business Problem
Business Opportunity
Benefits
Project Approach
Stakeholders List
Business CapabilitiesMuch Needed Upgrades
Much Needed Stuff
Capability 1:Capability 2:Capability 3:Capability 4:
Capability 5:Capability 6:Capability 7:
Koffee Hut’s runaway growth has been driven by concentrated efforts on a�rac�ng new customers. To date, this focus has been extremely successful, and has created the opportunity for Koffee Hut to begin development projects geared toward retaining the large number of exis�ng clients. This project is the first of a 3-year program aimed at client retainment.
An engagement is underway with Six Sigma Consultants to measure customer sa�sfac�on through surveys in order to determine root cause of clients lost to compe��on. Preliminary analysis of surveys indicate that as new customers become repeat customers, they place higher value on quicker service as they grow comfortable with Koffee Hut’s selec�ons. Surveys indicate that regular customers, while delighted with Koffee Hut's products, are growing frustrated with the �me it takes to have repeat orders filled.
Post-survey interviews indicate that the high volume, repeat customers visit the same Koffee Hut loca�on at regular repeatable �mes, typically before their commute to or from work. This class of customer represents the most valuable client that, if retained, provide the highest ROI for the retainment program. Post-survey interviews also reveal that a large group customers in this classifica�on responded favorably to the descrip�on of a self-service capability that would allow easy order placement of their usually purchased product. This class of client has been dubbed "The Usual".
PAnalysis of Koffee Hut's Marke�ng Spend and current customer base allows a per-customer calcula�on. Comparing this figure to the es�mated project cost for client retainment reveals that it is 3 �mes cheaper to retain exis�ng clients versus spending to acquire new customers. The Kwikoffee Kiosk also holds promise in making the experience be�er for first-�me customers due to expected decrease in average service �me per customer. Addi�onal revenue is expected from: •Customized marke�ng opportuni�es that the transac�on data will provide •Reward program to encourage Kiosk users to buy targeted products (KoffeeBean Reward Points) •Simple analy�cs of Kiosk users will give insight into new products and services that can be offered •Outside partnerships can be established with other vendors interested in leveraging analy�cs of Koffee Hut transac�ons at the Kiosk
Standard Waterfall approach required to control project and mi�gate risk. Project team will provide detailed resource es�mate and project schedule at end of Analysis phase (project commitment milestone).
IT Systems Manager CMO VP Business Development VP New Product Development
•Order sent straight-through to display system that baristas use to make the coffee drinks
•Customized selec�ons offered--Customer transac�on is saved, so that "the usual" can be established and offered up as a selec�on
•Customer has the capability of selec�ng "something else"
•Account Informa�on Maintenance, Password Maintenance, Credit Card info Maintenance, "Usual" Selec�ons entered & Maintained
•Targeted marke�ng offers (future)
•Customer Kiosk transac�ons are analyzed for customized target promo�ons
•Customer Kiosk transac�ons analyzed for partner promo�ons
BusinessFeature 1
BusinessFeature 2
BusinessFeature 3
BusinessFeature 4
BusinessFeature 5
BusinessFeature 6
BusinessFeature 7
TheApproach 63
work on one feature after another. When they complete one, they pull the next one from the prioritized list of features. This enables teams to work on—and complete—one product or enhancement at a time, which ensures that they are always working on the highest-priority product enhancements.
Smaller chunks make it easier to manage key resources that have to be shared across teams. If the work is smaller, there is less contention for these precious resources, so thrashing is minimized.
Minimizing Interruptions
Interruptions are also more easily handled when working with small chunks. When team members are involved in many projects at once, it is tempting to interrupt the team when a manager has an urgent task come up—just to get the task done—when there is no clear break in work activity or the breaks are too far in the future.
When teams are working on smaller chunks of functionality, it is more likely that the manager’s urgent task can wait until a team is done with its current work. This avoids forcing the team to multi-task, which increases thrashing and lowers efficiency.
TheApproach
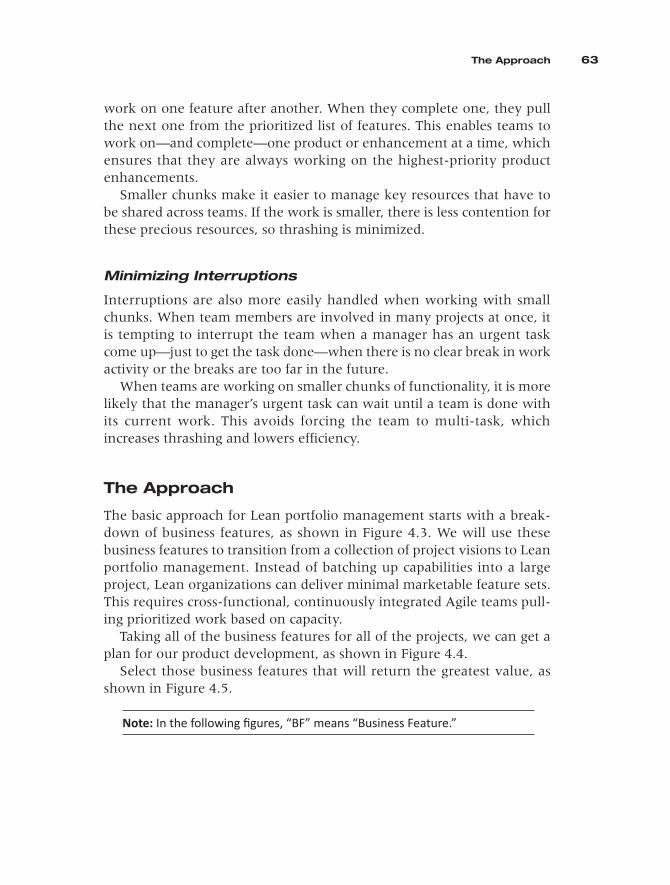
The basic approach for Lean portfolio management starts with a break-down of business features, as shown in Figure 4.3. We will use these business features to transition from a collection of project visions to Lean portfolio management. Instead of batching up capabilities into a large project, Lean organizations can deliver minimal marketable feature sets. This requires cross-functional, continuously integrated Agile teams pull-ing prioritized work based on capacity.
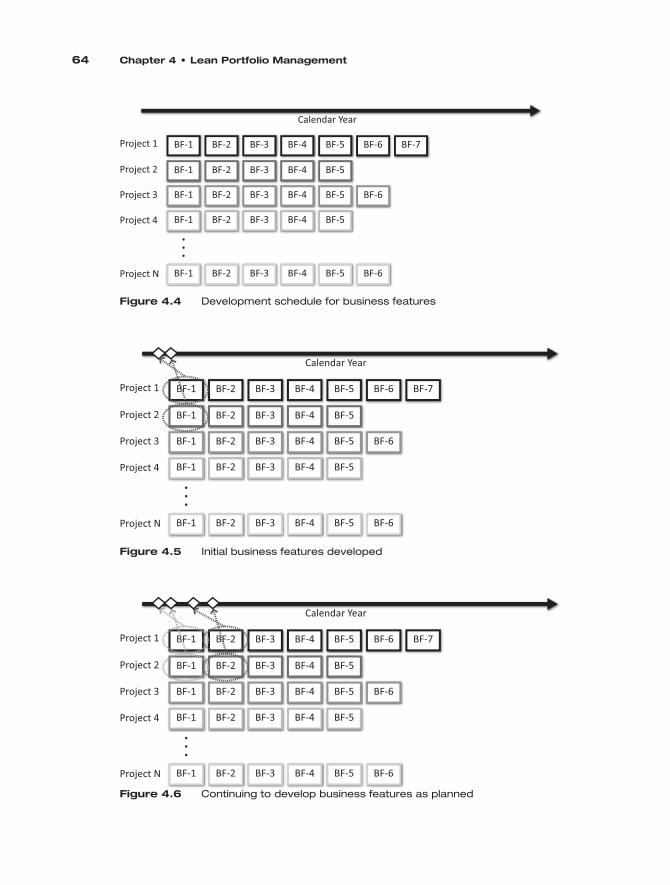
Taking all of the business features for all of the projects, we can get a plan for our product development, as shown in Figure 4.4.
Select those business features that will return the greatest value, as shown in Figure 4.5.
Note: In the following figures, “BF” means “Business Feature.”
64 Chapter4•LeanPortfolioManagement
BF-1
BF-1
BF-1
BF-1
BF-1
BF-2
BF-2
BF-2
BF-2
BF-2
BF-3
BF-3
BF-3
BF-3
BF-3
BF-4
BF-4
BF-4
BF-4
BF-4
BF-5
BF-5
BF-5
BF-5
BF-5
BF-6
BF-6
BF-6
BF-7
Calendar Year
Project 1
Project 2
Project 3
Project 4
Project N
..
.
Figure4.6 Continuing to develop business features as planned
Figure4.4 Development schedule for business features
BF-1
BF-1
BF-1
BF-1
BF-1
BF-2
BF-2
BF-2
BF-2
BF-2
BF-3
BF-3
BF-3
BF-3
BF-3
BF-4
BF-4
BF-4
BF-4
BF-4
BF-5
BF-5
BF-5
BF-5
BF-5
BF-6
BF-6
BF-6
BF-7
Calendar Year
Project 1
Project 2
Project 3
Project 4
Project N
..
.
Figure4.5 Initial business features developed
BF-1
BF-1
BF-1
BF-1
BF-1
BF-2
BF-2
BF-2
BF-2
BF-2
BF-3
BF-3
BF-3
BF-3
BF-3
BF-4
BF-4
BF-4
BF-4
BF-4
BF-5
BF-5
BF-5
BF-5
BF-5
BF-6
BF-6
BF-6
BF-7
Calendar Year
Project 1
Project 2
Project 3
Project 4
Project N
..
.
TheApproach 65
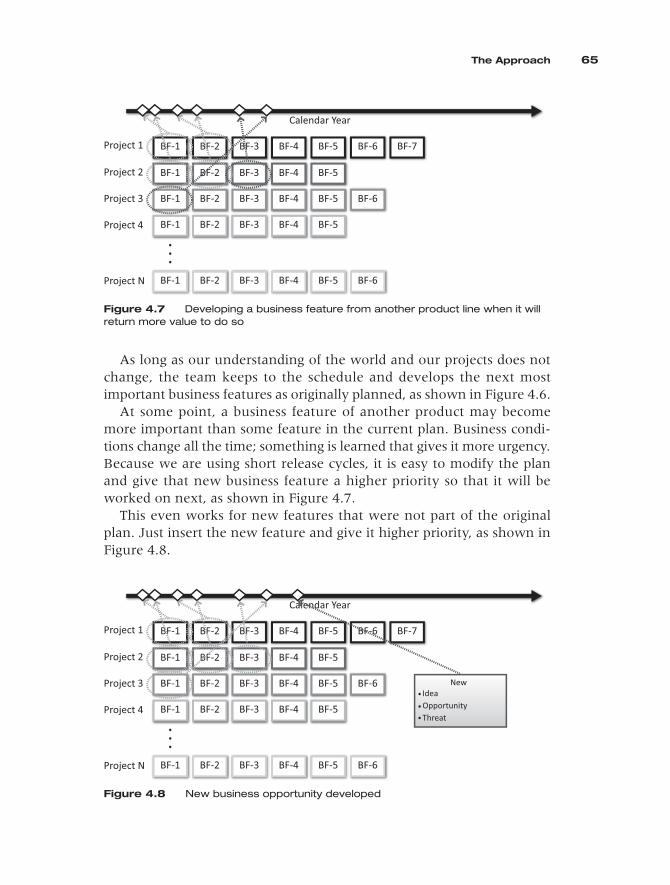
As long as our understanding of the world and our projects does not change, the team keeps to the schedule and develops the next most important business features as originally planned, as shown in Figure 4.6.
At some point, a business feature of another product may become more important than some feature in the current plan. Business condi-tions change all the time; something is learned that gives it more urgency. Because we are using short release cycles, it is easy to modify the plan and give that new business feature a higher priority so that it will be worked on next, as shown in Figure 4.7.
This even works for new features that were not part of the original plan. Just insert the new feature and give it higher priority, as shown in Figure 4.8.
BF-1
BF-1
BF-1
BF-1
BF-1
BF-2
BF-2
BF-2
BF-2
BF-2
BF-3
BF-3
BF-3
BF-3
BF-3
BF-4
BF-4
BF-4
BF-4
BF-4
BF-5
BF-5
BF-5
BF-5
BF-5
BF-6
BF-6
BF-6
BF-7
Calendar Year
Project 1
Project 2
Project 3
Project 4
Project N
..
.
Figure4.7 Developing a business feature from another product line when it will return more value to do so
BF-1
BF-1
BF-1
BF-1
BF-1
BF-2
BF-2
BF-2
BF-2
BF-2
BF-3
BF-3
BF-3
BF-3
BF-3
BF-4
BF-4
BF-4
BF-4
BF-4
BF-5
BF-5
BF-5
BF-5
BF-5
BF-6
BF-6
BF-6
BF-7
Calendar Year
Project 1
Project 2
Project 3
Project 4
Project N
..
.
NewIdeaOpportunityThreat..
.
Figure4.8 New business opportunity developed
66 Chapter4•LeanPortfolioManagement
BF-1
BF-1
BF-1
BF-1
BF-1
BF-2
BF-2
BF-2
BF-2
BF-2
BF-3
BF-3
BF-3
BF-3
BF-3
BF-4
BF-4
BF-4
BF-4
BF-4
BF-5
BF-5
BF-5
BF-5
BF-5
BF-6
BF-6
BF-6
BF-7
Calendar Year
Project 1
Project 2
Project 3
Project 4
Project N
..
.
Fast-Flexible-Flow 7%
BF-1
BF-1
BFBF 1-1
BBF-1
BFBFBF 1-11
BF-2
BF-2
BFBF 2-2
BF-2
BFBF-22
BF-3
BF-3
BFBF-3
BF-3
BFBF-33
BBF-4
BBF-4
BBF-4
BF-4
BF-4
BF-5
BF-5
BF-5
BF-5
BF-5
BF-6
BF-6
BF-6
BF-77
CaCalelendndarar Y YeaearrCaCalelendndarar YYeaearr
oject 1
oject 2
oject 33
ojectt 44
ojectt NN
..
.
Fast-Flexible-Flow 7%
..
.
Don’t buildwhat you
don’t need
IdeaOpportunityThreat
New
45%
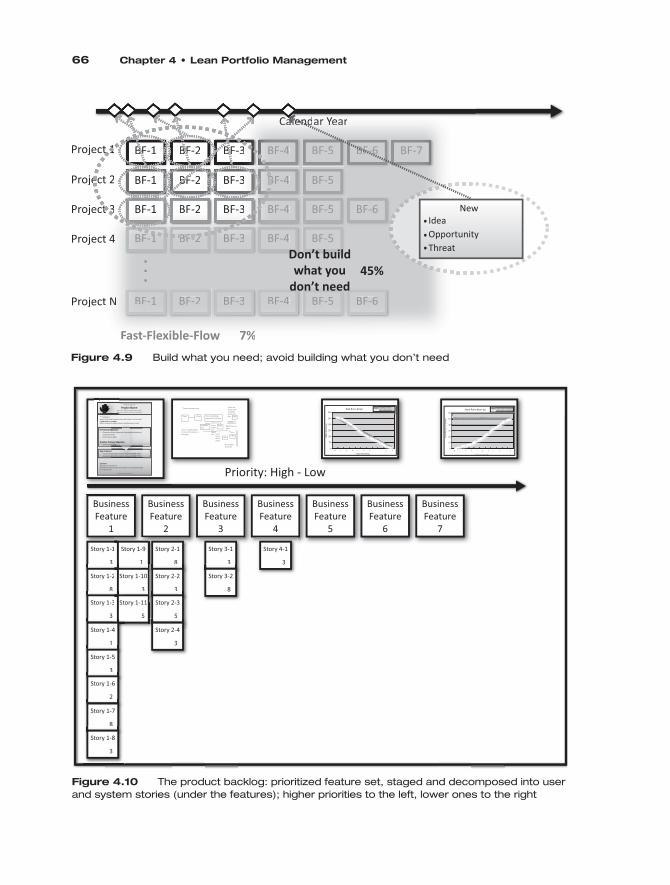
Figure4.9 Build what you need; avoid building what you don’t need
BusinessFeature
1
Priority: High - Low
BusinessFeature
2
BusinessFeature
3
BusinessFeature
4
BusinessFeature
5
BusinessFeature
6
BusinessFeature
7
Story 1-1
3
1 Story 1-9
1
Story 1-2
8
2 Story 1-10
38
Story 1-3
3
3
3 Story 1-11
5
Story 1-4
1
Story 1-5
33
Story 1-6
2
Story 1-7
8
Story 1-8
3
Story 2-1
8
Story 2-2
33
Story 2-3
5
Story 2-4
3
Story 3-1
3
Story 3-2
8
Story 4-1
3
These are some notes
This is an explanation of one of the boxes onthis page
Class This is something important in this box
These are some notes scribbled above this box
What have we here
You need to know this
A ListItem 1Item 2Item3
A Class
Another box
A box under the bigger box
A box
A boxA box
A box
A box
300
250
200
150
100
50
0
Ideal Burn-down
Effo
rt R
emai
ning
Task Burn-down
10 0456789 23 1Days Remaining
Hours Remaining
10 000000000456789 23 11Days Remaining
60
50
40
30
20
10
0
Story Points Committed
Stor
y Po
ints
Com
plet
ed
Story Point Burn-up
10 0456789 23 1Days Remaining
Story Points Completed
101000000 04567899999 23 1D R i i
Project tag line
Project NameDoes this decision support the vision?Will the customer see this as valuable?
MotivationsWhat is driving the business to want this? What is in it for them?Provide a customer quote.What is required to make customers feel like they got value?
A Primary ObjectiveElements of the objectives, described in business /customer termslorem ipsum dolor
lorem ipsum dolorAnother Primary Objective
Key FeaturesA main feature that must be released (MM YYYY)A main feature that must be released (MM YYYY)
What are the risk factors?Remember to focus on value and customers, not (just) technologylorum ipsum dolor
Cautions
Lean-Agile So�ware Development
.
.
.
..
MotivationsWhat is driving the business toProvide a customeer quote
oell
Motivations
DoWi
Figure4.10 The product backlog: prioritized feature set, staged and decomposed into user and system stories (under the features); higher priorities to the left, lower ones to the right
ShorterPlanningCycles 67
The point is to focus on building those functions that are most needed and most important, and to avoid building features that are less useful. The iterative approach of focusing on the most valuable business capa-bilities enables us to take advantage of the Pareto rule: Find the 20 per-cent of the work that provides 80 percent of the value. This is illustrated in Figure 4.9.
With this approach, it is straightforward to create a prioritized product backlog for each team. As shown in Figure 4.10, each team has a product backlog that lists its features across the top and the story breakdown under each feature. The priority of each feature on the team’s backlog must align with the priorities of the overall portfolio. The priorities are shown graphically: Higher-priority features appear on the left and lower-priority features on the right. Figure 4.10 shows an actual team’s product backlog.
ShorterPlanningCycles
Figure 4.10 illustrates the extreme position of planning at the business-feature level based on minimal marketable features. You can still realize significant value without going that far by focusing on the time delays that occur in the regular annual planning cycle.
A typical annual planning cycle runs from July 1 to December 31. This means that we spend the last six months of this year collecting ideas and developing plans for work that begins next year. Then, in January, any new ideas that come along go into the hopper to wait until the next plan-ning cycle, next July 1. If you have worked in IT for any length of time, this is not surprising.
But what is the result? It is that the ideas we are working with are likely stale. To compute the average amount of time it takes from when an idea enters the planning cycle until it is completed, add the following:
• The average time it waits for planning
• The time it takes for planning
• The average time it takes for completion
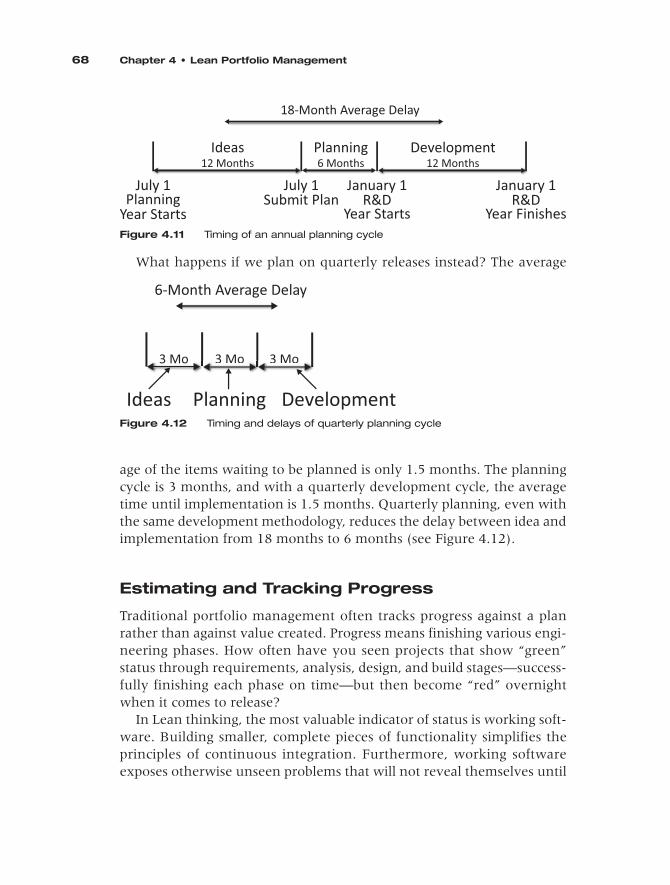
As shown in Figure 4.11, assuming everything gets done in a year, each of these steps takes 6 months, which means that the entire time from idea to delivery averages 18 months.
68 Chapter4•LeanPortfolioManagement
What happens if we plan on quarterly releases instead? The average
age of the items waiting to be planned is only 1.5 months. The planning cycle is 3 months, and with a quarterly development cycle, the average time until implementation is 1.5 months. Quarterly planning, even with the same development methodology, reduces the delay between idea and implementation from 18 months to 6 months (see Figure 4.12).
EstimatingandTrackingProgress
Traditional portfolio management often tracks progress against a plan rather than against value created. Progress means finishing various engi-neering phases. How often have you seen projects that show “green” status through requirements, analysis, design, and build stages—success-fully finishing each phase on time—but then become “red” overnight when it comes to release?
In Lean thinking, the most valuable indicator of status is working soft-ware. Building smaller, complete pieces of functionality simplifies the principles of continuous integration. Furthermore, working software exposes otherwise unseen problems that will not reveal themselves until
18-Month Average Delay
Ideas Planning Development
July 1Planning
Year Starts
July 1Submit Plan
January 1R&D
Year Starts
January 1R&D
Year Finishes
12 Months 6 Months 12 Months
Figure4.11 Timing of an annual planning cycle
6-Month Average Delay
Ideas Planning Development
3 Mo 3 Mo 3 Mo3 Mo 3 Mo
Figure4.12 Timing and delays of quarterly planning cycle
EstimatingandTrackingProgress 69
too late in the development process. Avoiding long integration cycles and hidden snags is a great way to prevent waste.
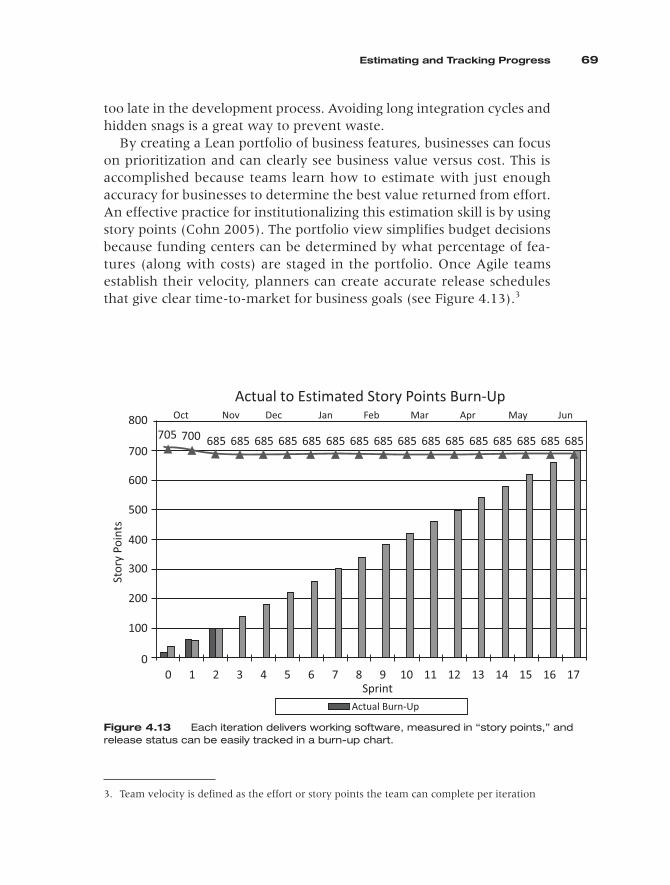
By creating a Lean portfolio of business features, businesses can focus on prioritization and can clearly see business value versus cost. This is accomplished because teams learn how to estimate with just enough accuracy for businesses to determine the best value returned from effort. An effective practice for institutionalizing this estimation skill is by using story points (Cohn 2005). The portfolio view simplifies budget decisions because funding centers can be determined by what percentage of fea-tures (along with costs) are staged in the portfolio. Once Agile teams establish their velocity, planners can create accurate release schedules that give clear time-to-market for business goals (see Figure 4.13).3
3. Team velocity is defined as the effort or story points the team can complete per iteration
Actual to Estimated Story Points Burn-Up800
700
600
500
400
300
200
100
0
705 700 685 685 685 685 685 685 685 685 685 685 685 685 685 685 685 685
0 1 2 3 4 5 6 7 8 9 10 11 12 13 14 15 16 17Sprint
Actual Burn-Up
Oct Nov Dec Jan Feb Mar Apr May Jun
Stor
y Po
ints
Figure4.13 Each iteration delivers working software, measured in “story points,” and release status can be easily tracked in a burn-up chart.
70 Chapter4•LeanPortfolioManagement
Summary
This chapter presents the Lean approach to portfolio management, which has several advantages over other, traditional project-portfolio approaches. A Lean portfolio of features allows the business and technologists to view ROI versus technical risk. Planners can allocate correct proportions of bud-geted work and create right-sized work that can be accurately estimated and pulled into a large Agile organization. The enterprise can issue a predictable release plan that establishes a means to deliver technology solutions guided by business. With focus on correct engineering practices, enterprise Agility will emerge, allowing the organization to be change-enabled, which pro-vides the competitive advantage afforded by quick time-to-market.
The essence of Lean thinking is “fast-flexible-flow.” We can get more value through our development pipeline by selecting minimal marketable features to ensure we are building the smallest sensible features we can. This improves effectiveness. And, by working with smaller pieces that can be completed more quickly, we can minimize work-in-process, limit work to capacity, focus on eliminating delays, and avoid thrashing. This increases our efficiency. Lean enables an upward spiral to the speed of delivering value while increasing quality and decreasing costs.
TryThis
These exercises are best done as a conversation with someone in your organization. After each exercise, ask each other if there are any actions either of you can take to improve your situation.
• Think about the projects you have worked on in the past.
• Was there a subset of these projects that could have been released without all of the features of the project that was released?
• What would have happened had you released the product enhancements in smaller increments?
• Are there reasons other than the product itself (for example, cost of release) that prevent partial releases?
• What should you do about these?
• How many projects at a time does the typical person in your organiz ation work on?
• What does this accomplish and what does it cost?
• Do key people work on even more projects than a typical person?
RecommendedReading 71
RecommendedReading
The following works offer helpful insights into the topics of this chapter.
Aral, Sinan, Erik Brynjolfsson, and Marshall W. Van Alstyne. 2008. What Makes Information Workers Productive. http://sloanreview.mit.edu/smr/issue/2008/winter/12/ (accessed October 2008).
Beaver, Guy. February 11, 2008. Knocking Down Silos: Transitioning the Enterprise to Agile. www.agilejournal.com/content/view/753/76/ (accessed February 09, 2009).
Cohn, Mike. 2005. Agile Estimating and Planning. Upper Saddle River, NJ: Prentice Hall.
Poppendieck, Mary, and Tom Poppendieck. 2003. Lean Software Development: An Agile Toolkit. Boston: Addison-Wesley.
Reinertsen, Donald G. 1997. Managing the Design Factory. New York: Free Press.
Shalloway, Alan. 2008. “Lean Anti-Patterns and What to Do About Them.” Agile Journal. www.agilejournal.com/content/view/553/39/ (accessed February 2009).
Townsend, Patrick L., and Joan E. Gebhardt. 2007. How Organizations Learn: Investigate, Identify, Institutionalize. Milwaukee, WI: ASQ Quality Press.