Embed Size (px)
Citation preview
Overview of Lean Construction
Lean Construction Institute
Stan Chiu - RTKL
Julie Dobyns - DPR Construction
Dennis Sowards - LCI

Workshop ObjectivesAt the end of this session you will be
able to: Explain the background, benefits and
principles of Lean thinking Understand how Lean techniques and
tools work Learn how Lean thinking has been
used in Construction Identify which Lean techniques apply
to your operations
Think Lean!

How do we bid a job today?
Estimate theCosts $$
Profit margin
+ = Bid Price
The Lean way to bid a job:
MarketPrice
- Profit margin
= Cost to dothe Job
Is this Possible?
Why Lean?
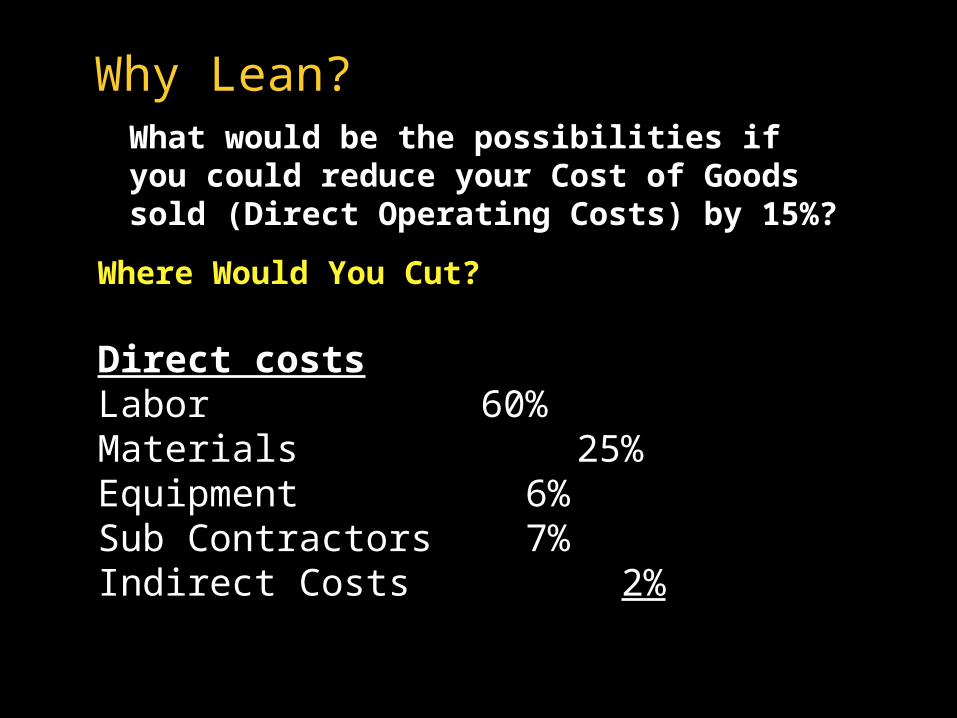
Where Would You Cut?
Direct costs Labor 60%Materials 25%Equipment 6%Sub Contractors 7%Indirect Costs 2%
What would be the possibilities if you could reduce your Cost of Goods sold (Direct Operating Costs) by 15%?
Why Lean?
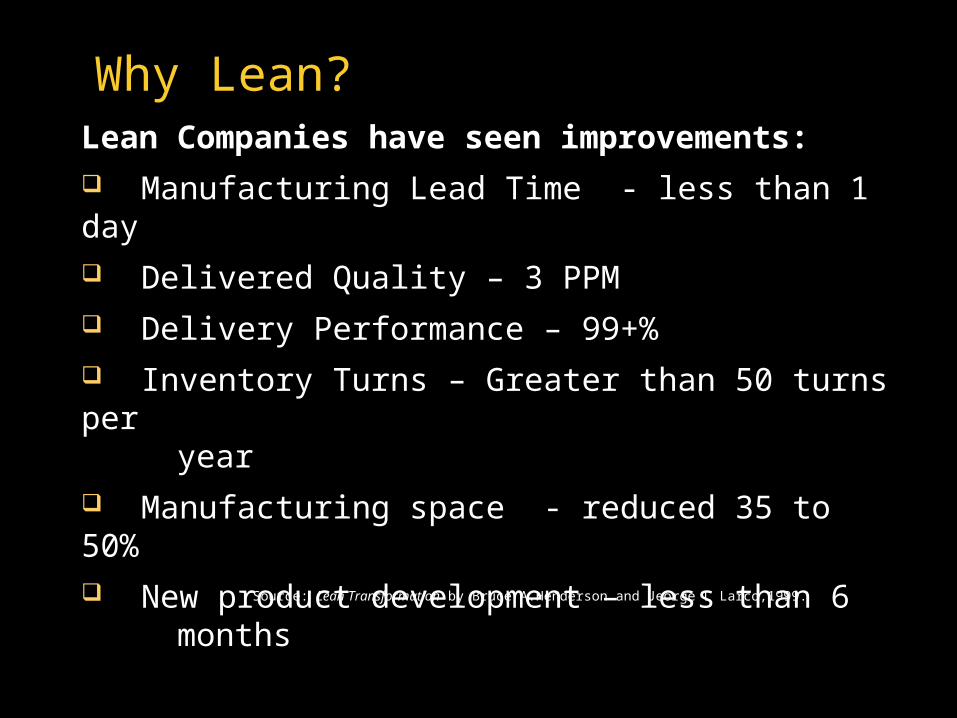
Lean Companies have seen improvements: Manufacturing Lead Time - less than 1 day Delivered Quality – 3 PPM Delivery Performance – 99+% Inventory Turns – Greater than 50 turns per year Manufacturing space - reduced 35 to 50% New product development – less than 6 months
Source: Lean Transformation by Bruce A.Henderson and Jeorge L Larco,1999.
Why Lean?
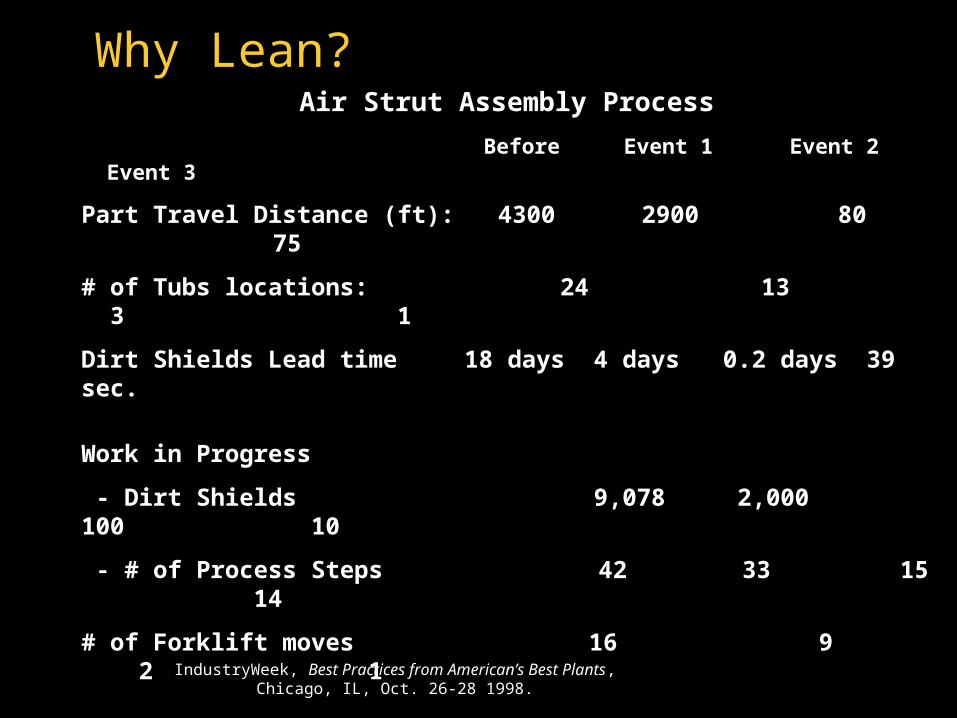
Why Lean?Air Strut Assembly Process
Before Event 1 Event 2 Event 3
Part Travel Distance (ft): 4300 2900 80 75
# of Tubs locations: 24 13 3 1
Dirt Shields Lead time 18 days 4 days 0.2 days 39 sec.
Work in Progress
- Dirt Shields 9,078 2,000 100 10
- # of Process Steps 42 33 15 14
# of Forklift moves 16 9 2 1
Inventory Floor
space (sq.ft.) 288 80 20 0
IndustryWeek, Best Practices from American’s Best Plants, Chicago, IL, Oct. 26-28 1998.
FACT 1: Lean Works
in Manufacturing
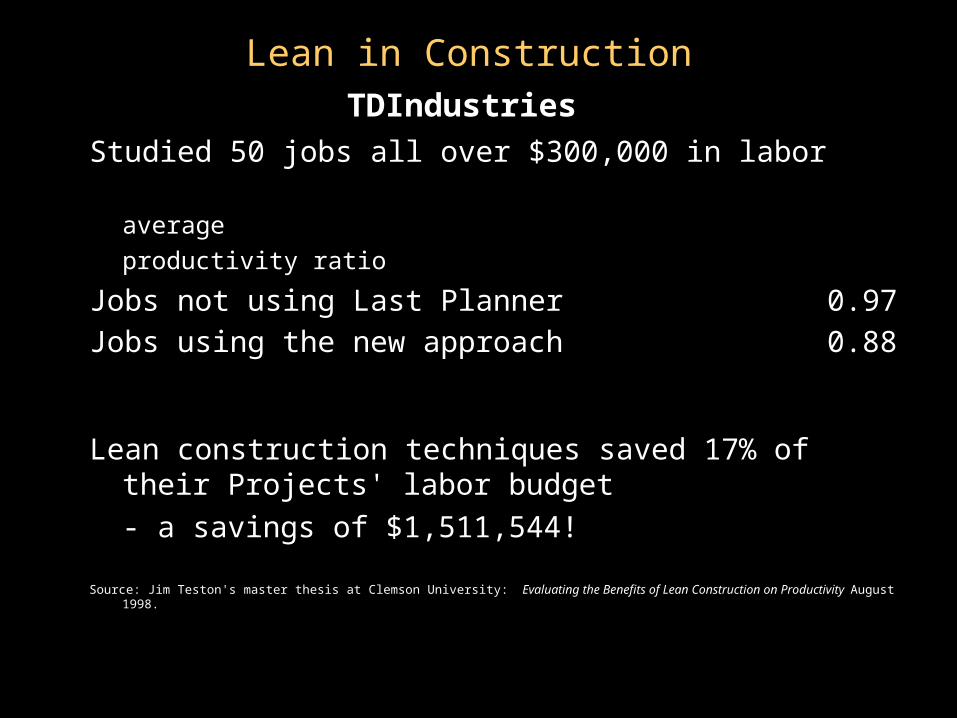
Studied 50 jobs all over $300,000 in labor
average productivity ratio
Jobs not using Last Planner 0.97Jobs using the new approach 0.88
Lean construction techniques saved 17% of their Projects' labor budget - a savings of $1,511,544!
Source: Jim Teston's master thesis at Clemson University: Evaluating the Benefits of Lean Construction on Productivity August 1998.
TDIndustries
Lean in Construction

A customer in the Southwest Region
Pilot Project: Using LPS on Two tools (Nov. 1999 - March 2000)
Results - The customer said:“ Durations have been reduced on major tools by 29%”
Actual Usage: Wet Bench Tool Install – Beat the standard by 300 hours!
Lean in Construction
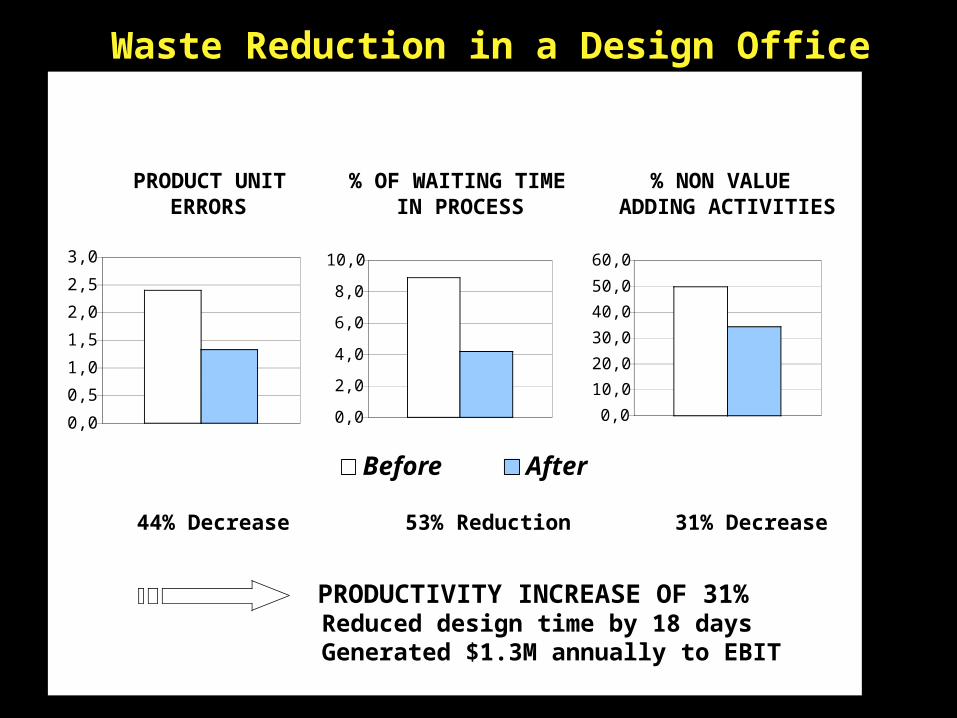
Waste Reduction in a Design Office
0,0
0,5
1,0
1,5
2,0
2,5
3,0
Before After
0,0
2,0
4,0
6,0
8,0
10,0
0,0
10,0
20,0
30,0
40,0
50,0
60,0
PRODUCT UNIT ERRORS
% OF WAITING TIME IN PROCESS
% NON VALUE ADDING ACTIVITIES
44% Decrease 53% Reduction 31% Decrease
PRODUCTIVITY INCREASE OF 31%Reduced design time by 18 daysGenerated $1.3M annually to EBIT

FACT 2:Lean works
in AEC Industry too!
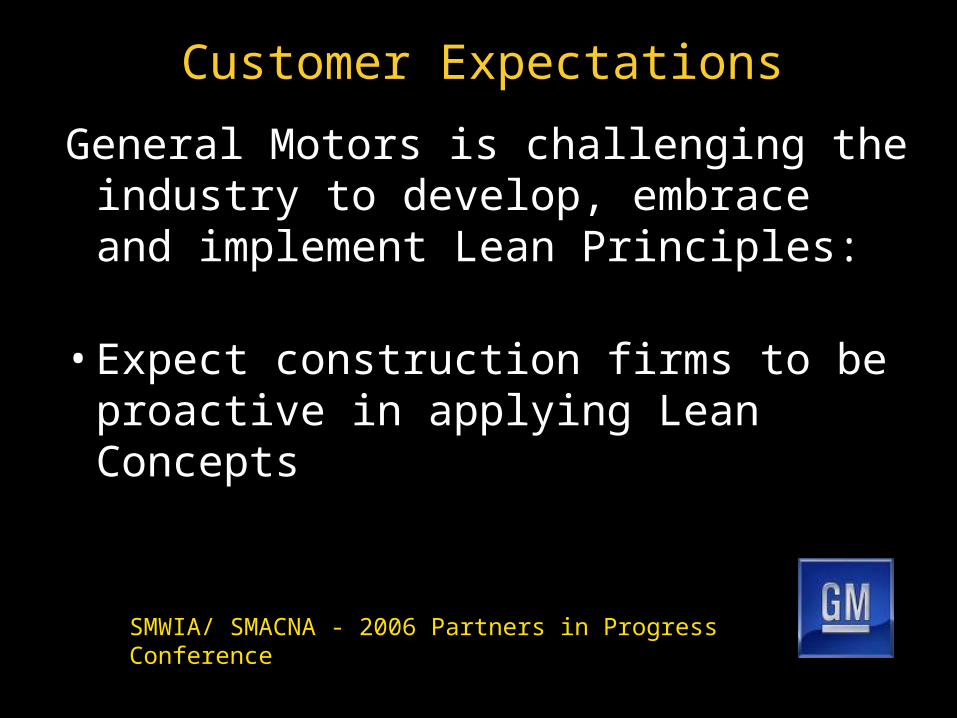
Customer Expectations
General Motors is challenging the industry to develop, embrace and implement Lean Principles:
•Expect construction firms to be proactive in applying Lean Concepts
SMWIA/ SMACNA - 2006 Partners in Progress Conference
Sutter Health Capital Program
The Executive Challenge:
Successfully execute the design and construction of resultant $5.5B program using Lean Project Delivery Methods

Construction Users Roundtable (CURT) says:Education is key;
There needs to be a shift in everyone’s way of thinking;
LEAN targets the best workforce, forms solid relationships and builds trust;
Owner’s must be the agents of change and must demand change; and
LEAN must become the new culture of the industry.
Issued June 2007
FACT 3:Customers are beginning to
see the value of Lean Construction!
Toyota’s goal:
“Give customers what they want, deliver it
instantly, with no waste.”
What is Lean?

Lean History
Henry Ford
Toyota - Taiichi Ohno & Shigeo Shingo
Kaizen - Masaaki Imai
Lean Thinking - James Womack & Daniel Jones
What is Lean?
QuickTime™ and aBMP decompressor
are needed to see this picture.

Lean Thinking is a concept of Continuous Quality Improvement
Lean Thinking is a shift in management's focus to differentiate between Value and WasteAKA: JIT & Toyota Production System (TPS)
Lean Construction applies the principles and techniques of Lean Thinking to develop a better way to deliver the job.AKA: Lean Project Delivery System
What is Lean?
Lean in the Construction Industry: Three Connected Opportunities
1. IMPECCABLE COORDINATIONWORKFLOW BASED OPERATING SYSTEM
2. ORGANIZING PROJECTS AS PRODUCTION SYSTEMS
3. THE PROJECT AS A COLLECTIVE ENTERPRISE.
© Lean Construction Institute, 2009
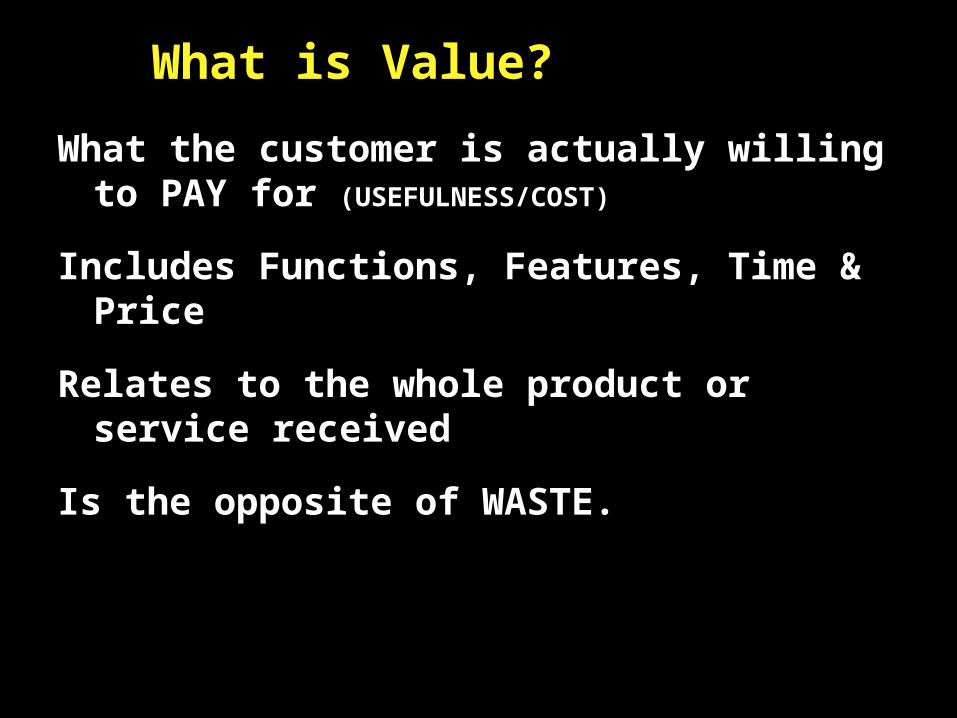
What the customer is actually willing to PAY for (USEFULNESS/COST)
Includes Functions, Features, Time & Price
Relates to the whole product or service received
Is the opposite of WASTE.
What is Value?
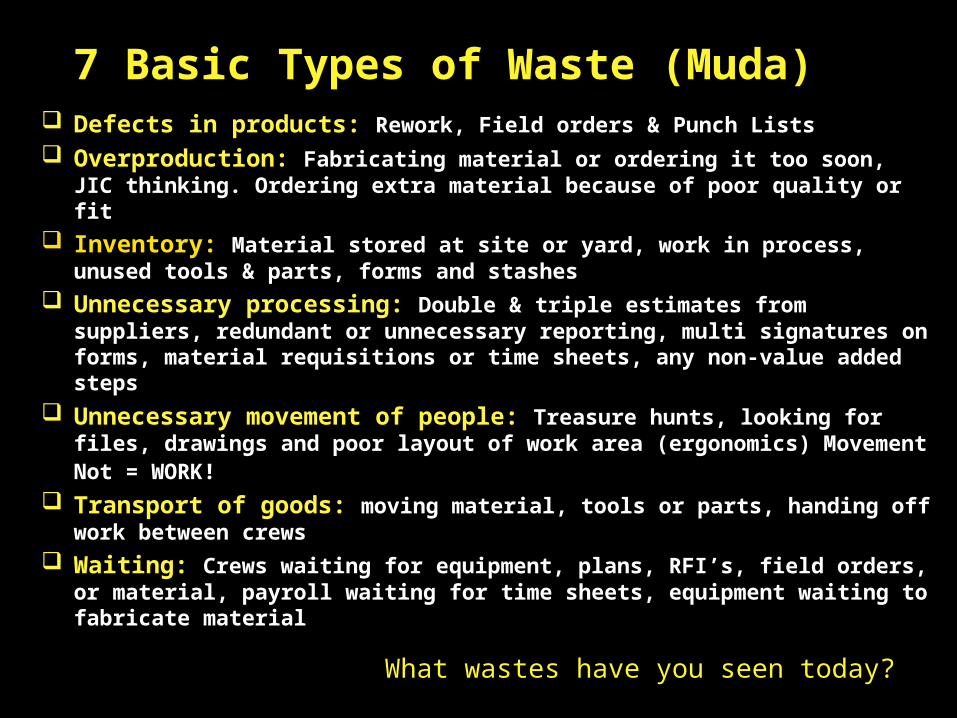
7 Basic Types of Waste (Muda) Defects in products: Rework, Field orders & Punch Lists Overproduction: Fabricating material or ordering it too soon, JIC
thinking. Ordering extra material because of poor quality or fit Inventory: Material stored at site or yard, work in process,
unused tools & parts, forms and stashes Unnecessary processing: Double & triple estimates from
suppliers, redundant or unnecessary reporting, multi signatures on forms, material requisitions or time sheets, any non-value added steps
Unnecessary movement of people: Treasure hunts, looking for files, drawings and poor layout of work area (ergonomics) Movement Not = WORK!
Transport of goods: moving material, tools or parts, handing off work between crews
Waiting: Crews waiting for equipment, plans, RFI’s, field orders, or material, payroll waiting for time sheets, equipment waiting to fabricate material
What wastes have you seen today?
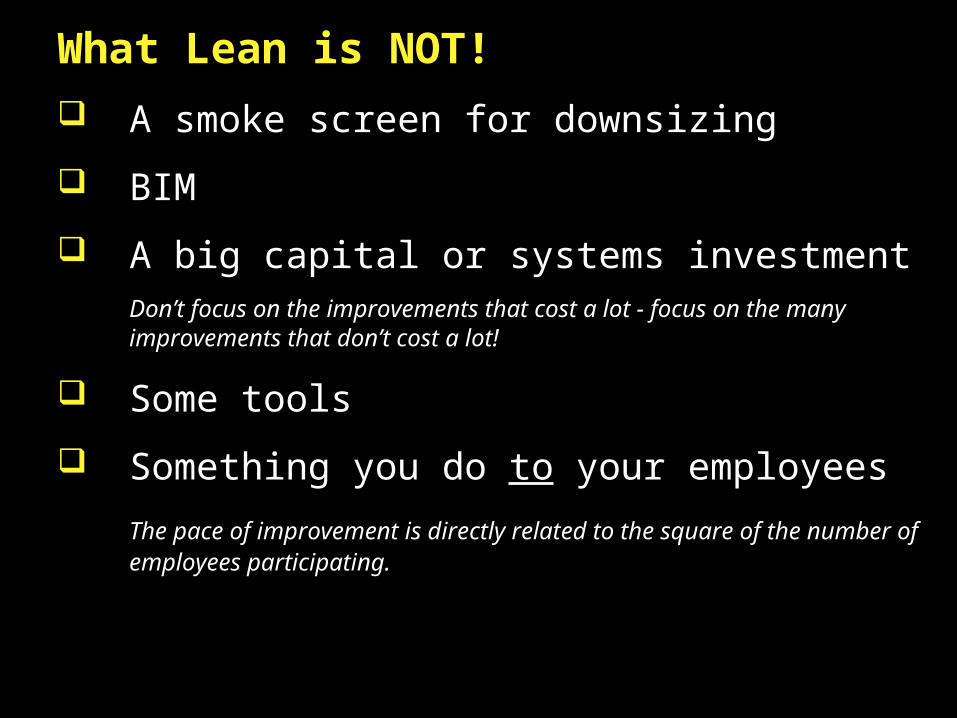
What Lean is NOT!
A smoke screen for downsizing
BIM
A big capital or systems investment Don’t focus on the improvements that cost a lot - focus on the many improvements that don’t cost a lot!
Some tools
Something you do to your employees
The pace of improvement is directly related to the square of the number of employees participating.
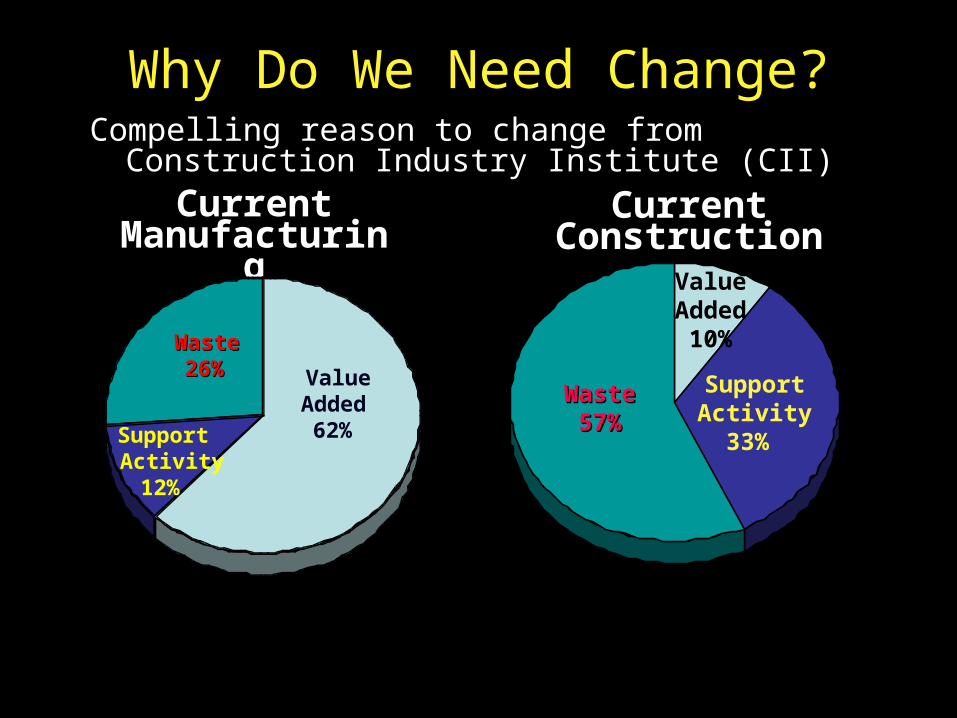
Why Do We Need Change?
Current Manufacturing
Current Construction
Value Added
10%
SupportActivity
33%
WasteWaste57%57%
Compelling reason to change from Construction Industry Institute (CII)
ValueAdded62%Support
Activity 12%
WasteWaste26%26%
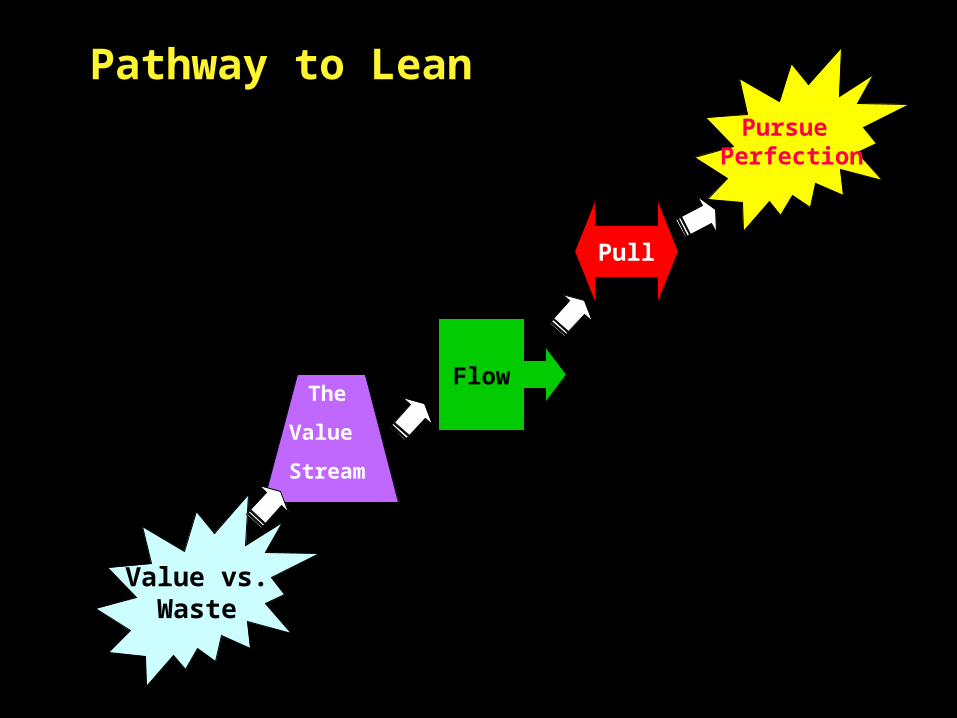
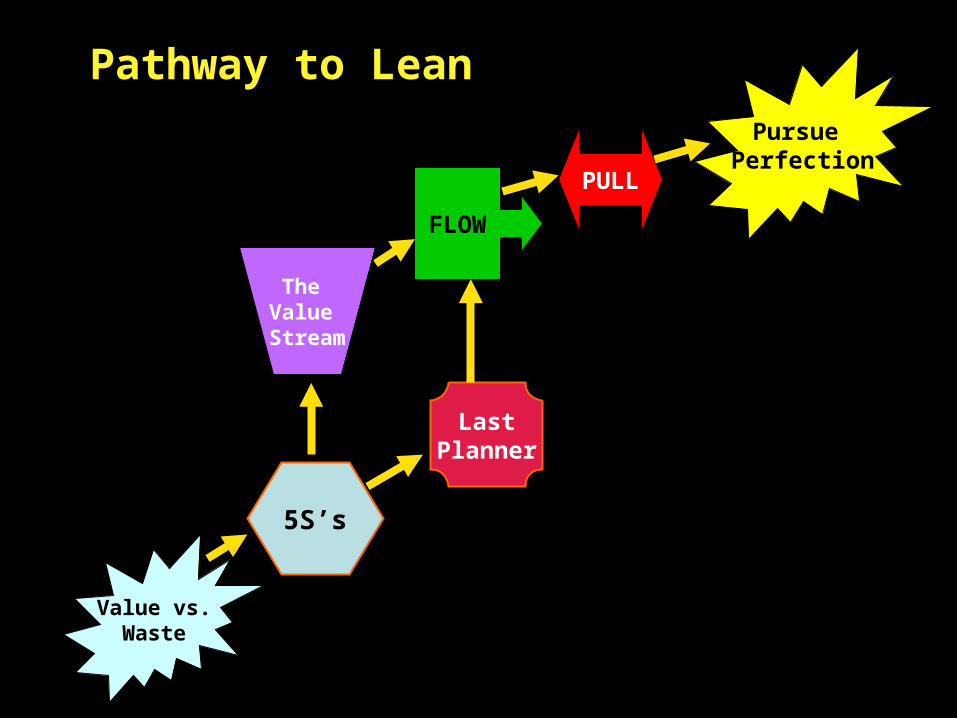
Value vs.Waste
Pursue Perfection
Pathway to Lean
Flow
Pull
The
Value
Stream
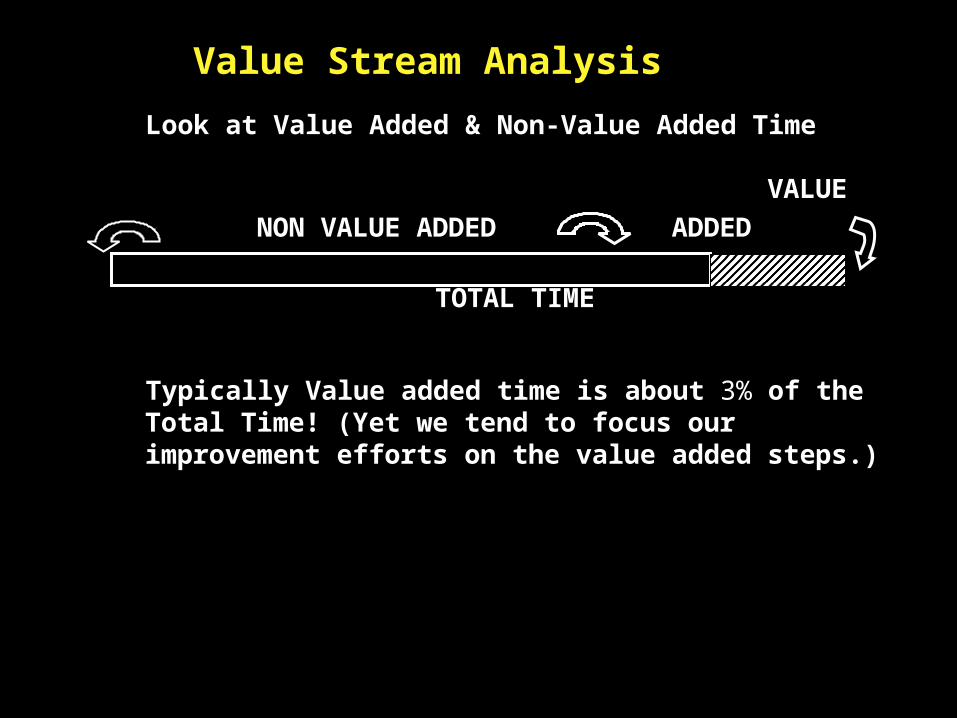
Look at Value Added & Non-Value Added Time
VALUE NON VALUE ADDED ADDED
TOTAL TIME
Typically Value added time is about 3% of the Total Time! (Yet we tend to focus our improvement efforts on the value added steps.)
Value Stream Analysis
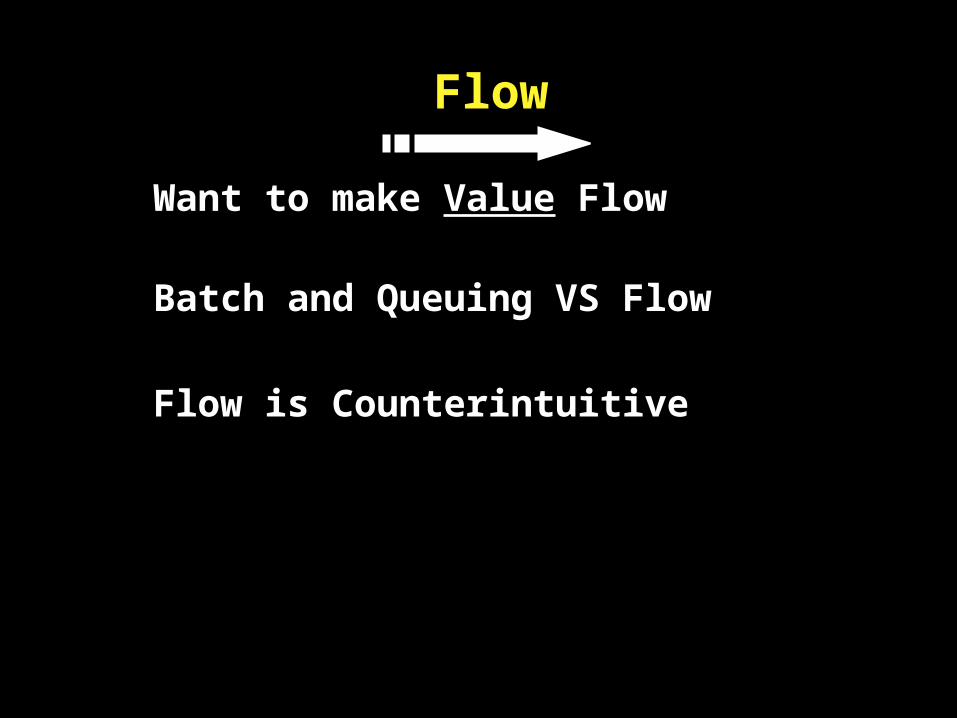
Flow
Want to make Value Flow
Batch and Queuing VS Flow
Flow is Counterintuitive
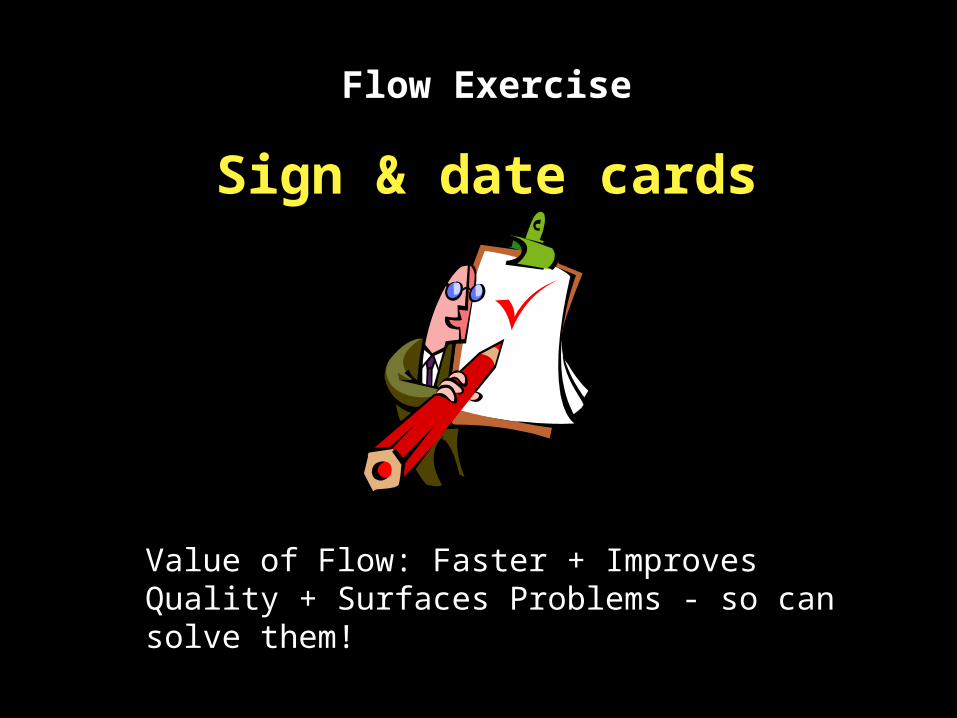
Sign & date cards
Flow Exercise
Value of Flow: Faster + Improves Quality + Surfaces Problems - so can solve them!
Means no one upstream should produce a good or service until the customer downstream asks for it. Products and services are created only on demand.
PULL
Flow where you can - Pull if you must!
Pursue Perfection
What if there were no WASTE at all?
The paradox is that perfection can never be achieved,
but must be pursued.
Continuous Improvement
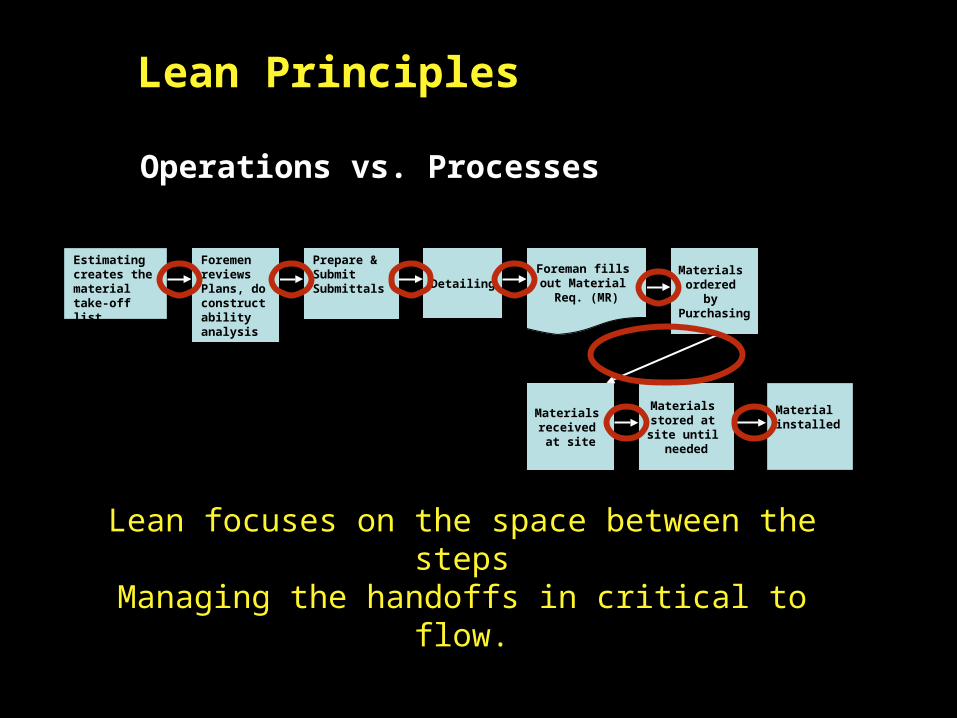
Operations vs. Processes
Lean Principles
Lean focuses on the space between the stepsManaging the handoffs in critical to flow.
Estimating creates the material take-off list
Detailing
Prepare & Submit Submittals
Foremen reviewsPlans, do constructability analysis
Foreman fills out Material
Req. (MR)
Material installed
Materials received
at site
Materials stored at site until needed
Materials ordered
by Purchasing
Lean Principles
Lean focuses on maximizing the whole project NOT on maximizing individual performance.
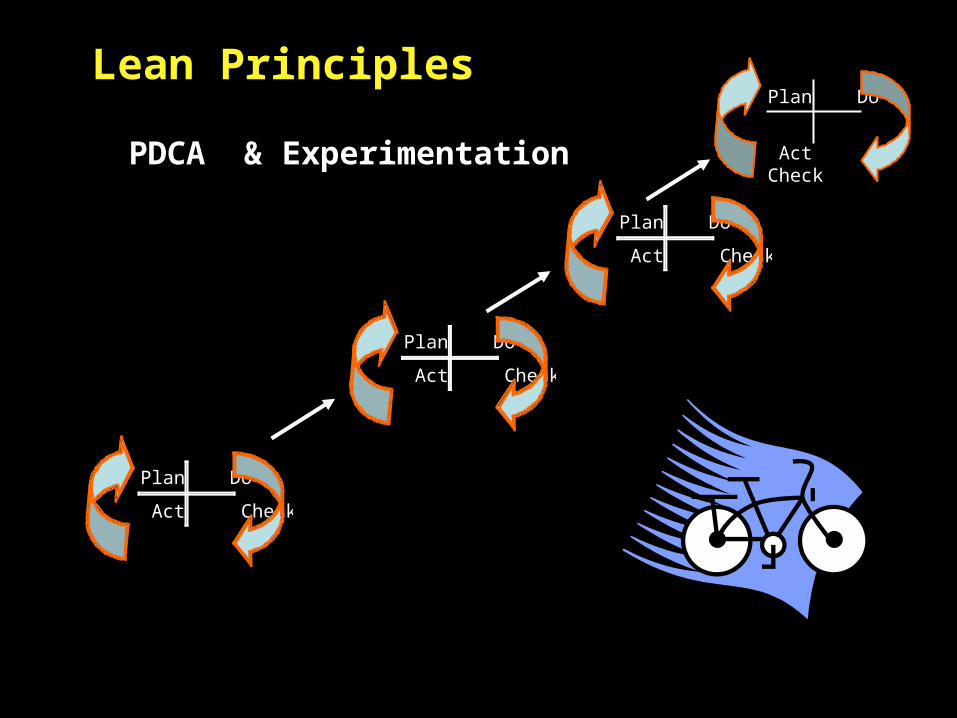
PDCA & Experimentation
Lean PrinciplesPlan Do
Act Check
Plan Do
Act Check
Plan Do
Act Check
Plan Do
Act Check
Basic Lean Tools & Techniques Five S’s Muda Walk - “Chalk Watch” Last Planner System Kaizen Event Kanban Poka-Yoke Process Mapping/Value Analysis Rules of Release Spaghetti Chart Visual Controls A3 Reports

Lean Tools & Techniques
Sorting Simplifying Sweeping Standardizing Self-discipline
The 5 S's
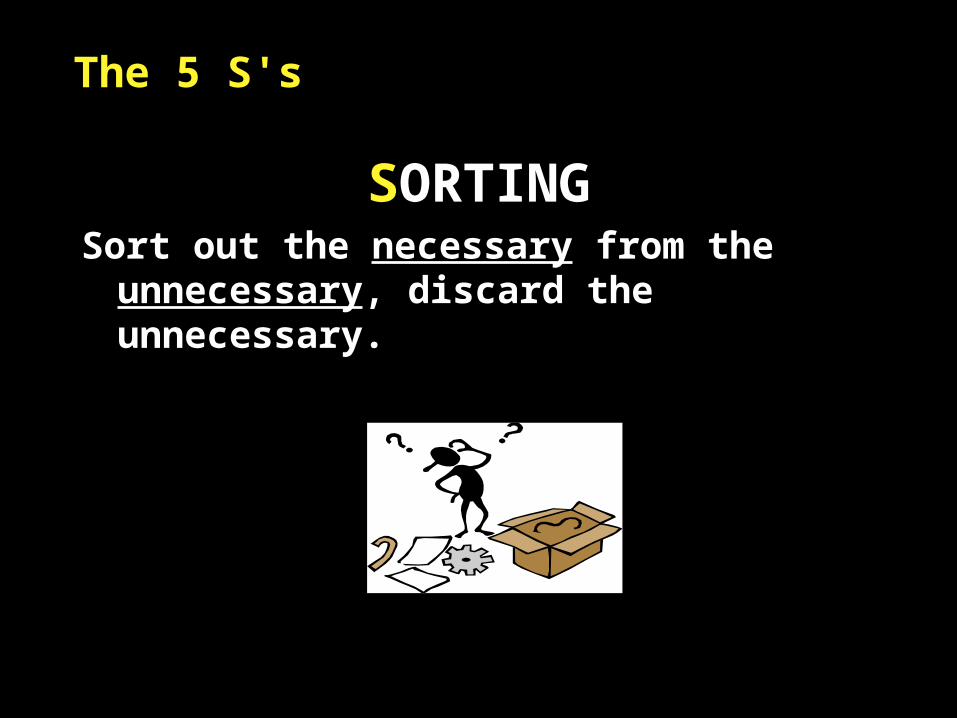
SORTINGSort out the necessary from the
unnecessary, discard the unnecessary.
The 5 S's

How to Sort?
NECESSARY ITEMS USED OR LIKELY TO BE USED
UNNECESSARY ITEMS (NOT USED OR NOT LIKELY TO BE USED)
NO VALUE & EASY TO DISPOSE OF
SOME VALUE
NO VALUE BUT COSTLY TO DISPOSE
DISPOSE OF IMMEDIATELY
LOOK FOR BEST USER TO GIVE OR SELL
FIND LEAST COSTLY WAY TO DISPOSE
RARELY USED (1 - 2 times per year)
FREQUENTLY USED (daily or weekly use)
OCCASIONALLY USED (1 - 2 per month)
REDTAG
USEAUCTION
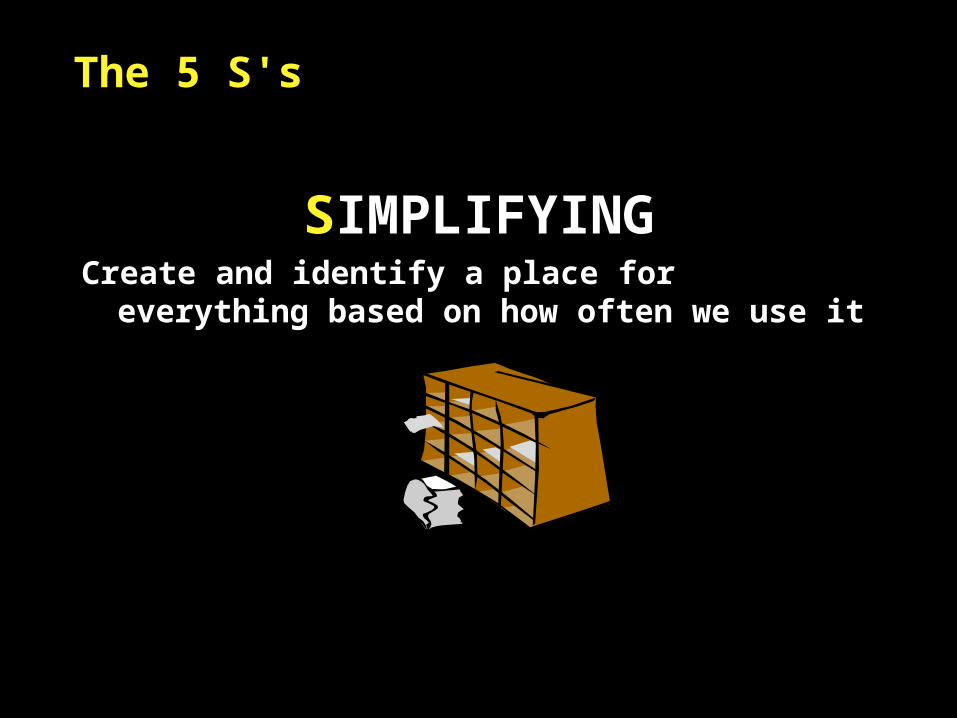
SIMPLIFYINGCreate and identify a place for everything
based on how often we use it
The 5 S's

The 5 S'sSimplifying Steps:1.Review all frequently used items and put those used
most often closest to the work area, those used less often, further away.
2.Develop a way to label or show where everything goes. Consider:
· Shadow board· Marking the item and the location· Color-coding· Labels on drawers with list of contents inside
3. Develop ways to daily replace usable items· Establish lead times for replacement of daily usage supplies· Determine minimum and maximum supply levels and mark them
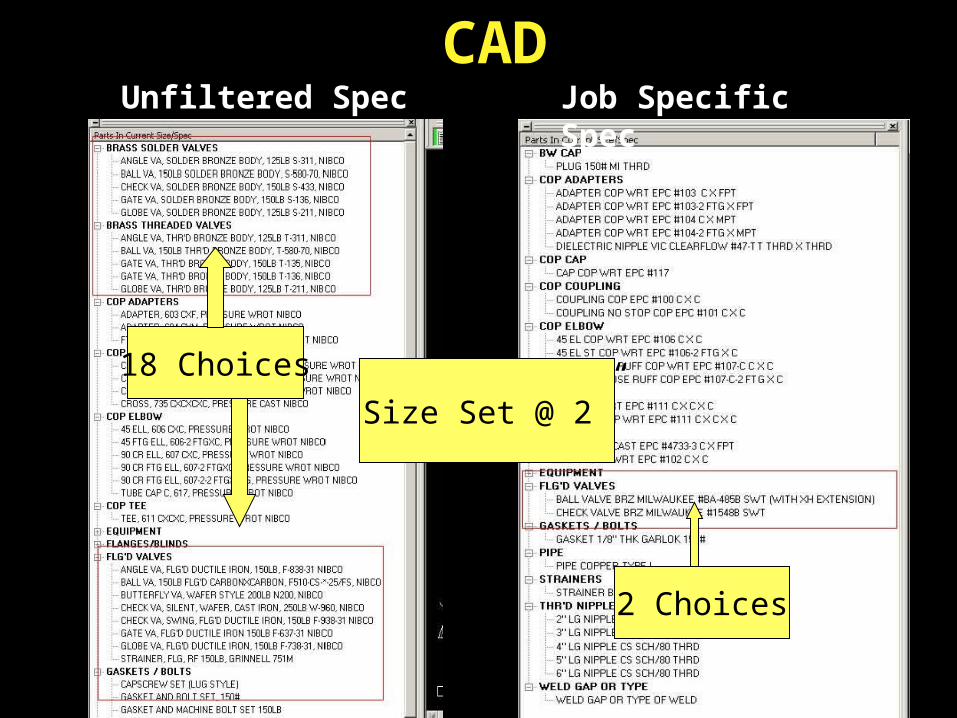
Unfiltered Spec Job Specific Spec
Size Set @ 2”
18 Choices
2 Choices
CAD

The 5 S's
SWEEPINGPhysical and visual control of
the work area

Sweeping ActionsSweeping is done when regular sweeping processes occur and
areas are clean, safe and neat.
Actions:· Determine regular schedule for cleaning the
yard, work & break areas.· Orient everyone including new employees with
daily 5S’s activity responsibilities and expectations.
· Post area cleaning guidelines and schedules.· Perform safety inspections on a regularly
schedule.
The 5 S's
STANDARDIZING
is creating standard ways to keep the work areas organized, clean and orderly and documenting agreements made during the 5S’s.
How to Standardize? Standardize:• Labeling• Tools & equipment• Forms• Gang boxes layout• Yard Layout• Trailers
• Have clear instructions for people who deliver goods or materials to the site. Clearly mark and post where the material, tools & equipment are to be placed.
The 5 S's
SELF-DISCIPLINEFollow through with the 5Ss
agreements
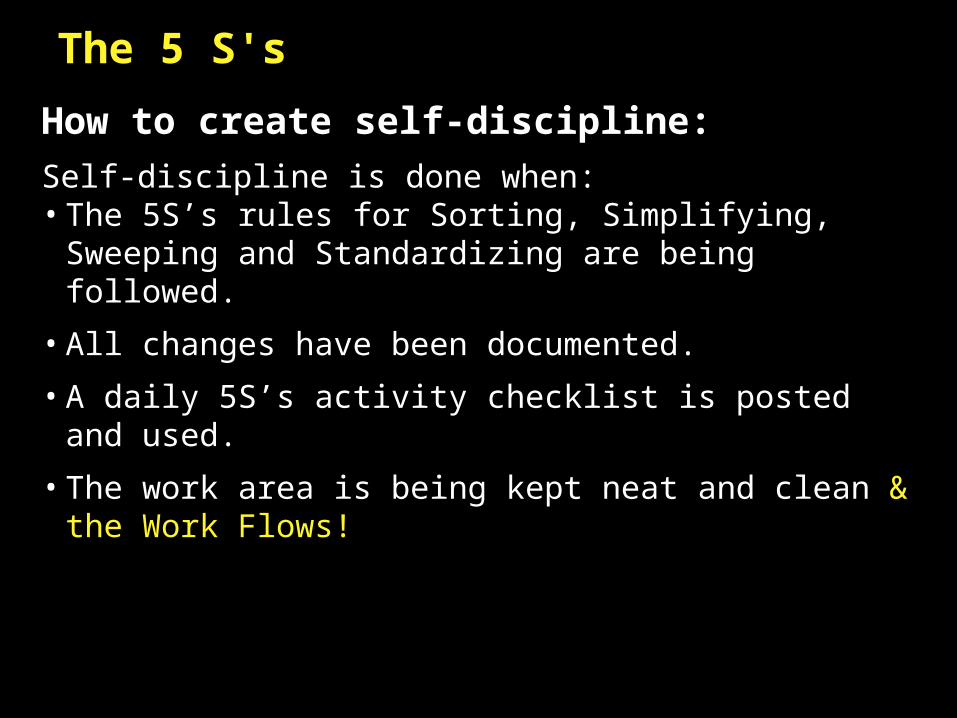
How to create self-discipline:Self-discipline is done when:• The 5S’s rules for Sorting, Simplifying, Sweeping and
Standardizing are being followed.
• All changes have been documented.
• A daily 5S’s activity checklist is posted and used.
• The work area is being kept neat and clean & the Work Flows!
The 5 S's
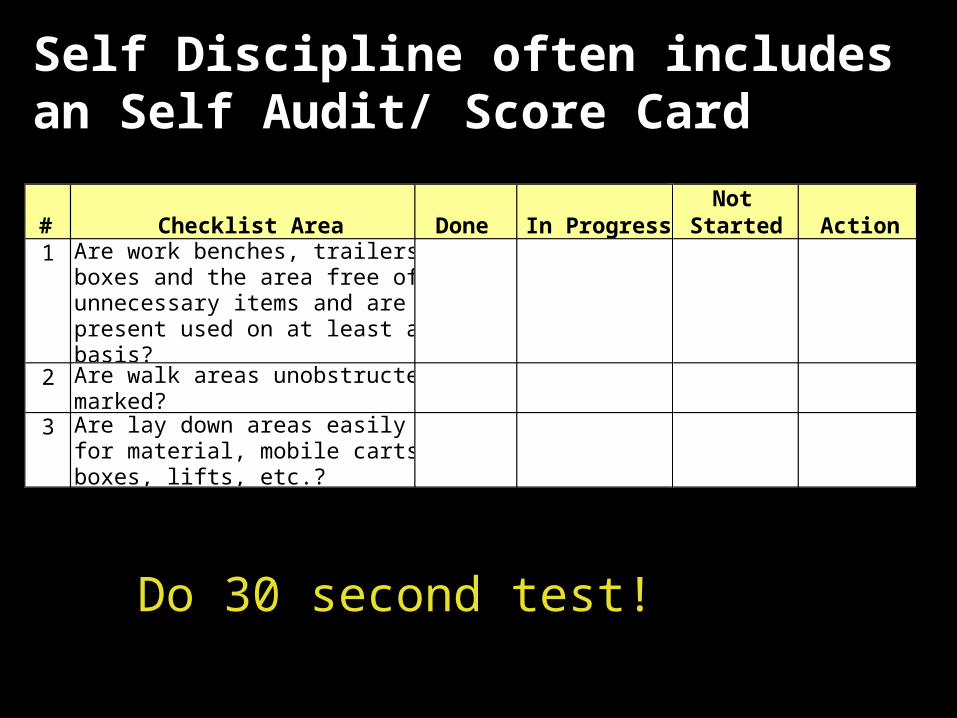
Self Discipline often includes an Self Audit/ Score Card
Not Started Action# Checklist Area Done In Progress
1 Are work benches, trailers, gang boxes and the area free of unnecessary items and are items present used on at least a monthly basis?
2 Are walk areas unobstructed and marked?
3 Are lay down areas easily identified for material, mobile carts, tool boxes, lifts, etc.?
Do 30 second test!
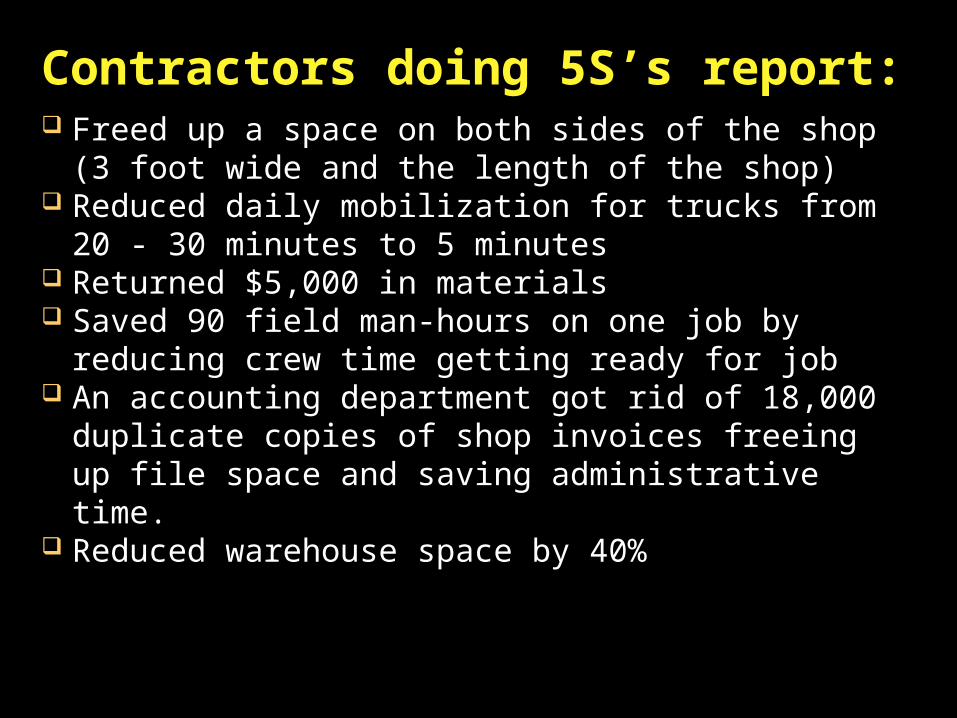
Contractors doing 5S’s report: Freed up a space on both sides of the shop (3 foot
wide and the length of the shop) Reduced daily mobilization for trucks from 20 - 30
minutes to 5 minutes Returned $5,000 in materials Saved 90 field man-hours on one job by reducing
crew time getting ready for job An accounting department got rid of 18,000
duplicate copies of shop invoices freeing up file space and saving administrative time.
Reduced warehouse space by 40%
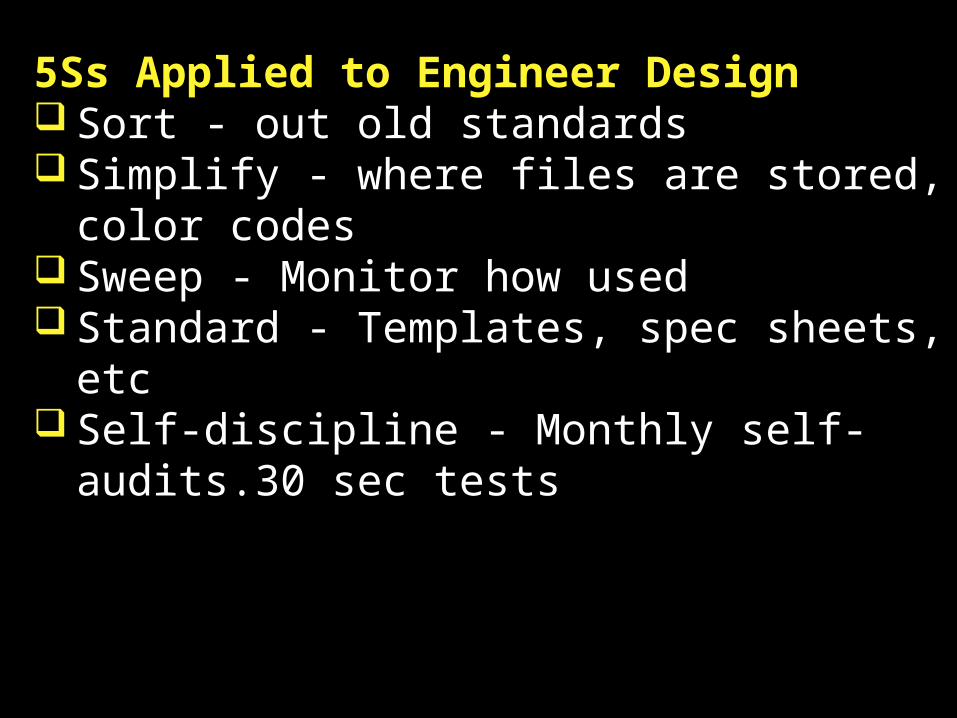
5Ss Applied to Engineer DesignSort - out old standardsSimplify - where files are stored, color
codesSweep - Monitor how usedStandard - Templates, spec sheets, etcSelf-discipline - Monthly self-audits.30
sec tests
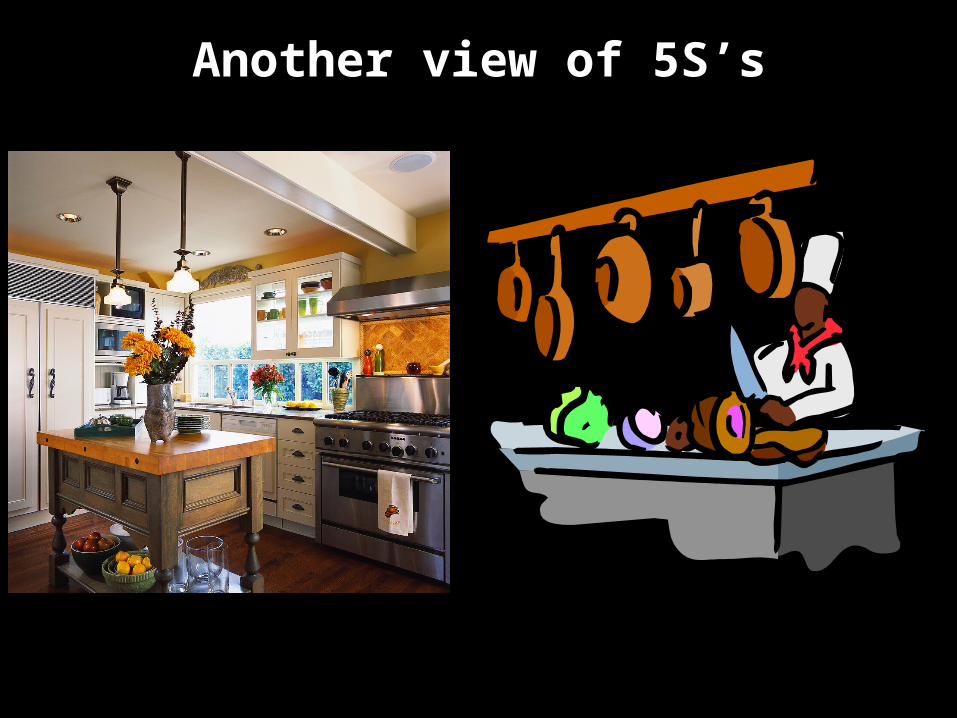
Another view of 5S’s
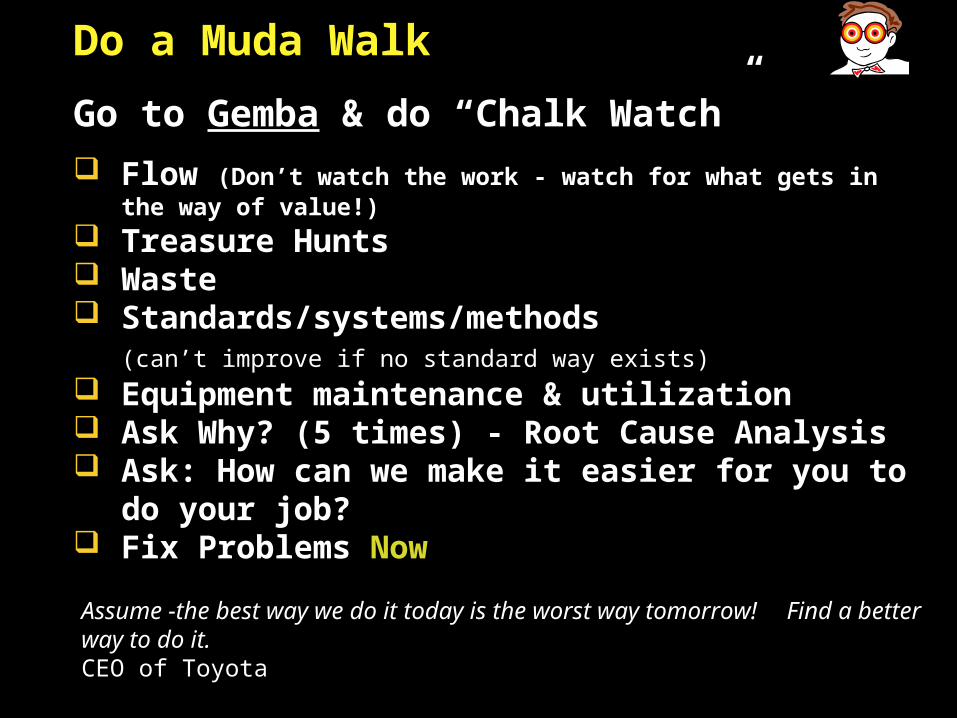
Assume -the best way we do it today is the worst way tomorrow! Find a better way to do it.CEO of Toyota
Do a Muda Walk
Go to Gemba & do “Chalk Watch” Flow (Don’t watch the work - watch for what gets in the
way of value!) Treasure Hunts Waste Standards/systems/methods
(can’t improve if no standard way exists) Equipment maintenance & utilization Ask Why? (5 times) - Root Cause Analysis Ask: How can we make it easier for you to
do your job? Fix Problems Now
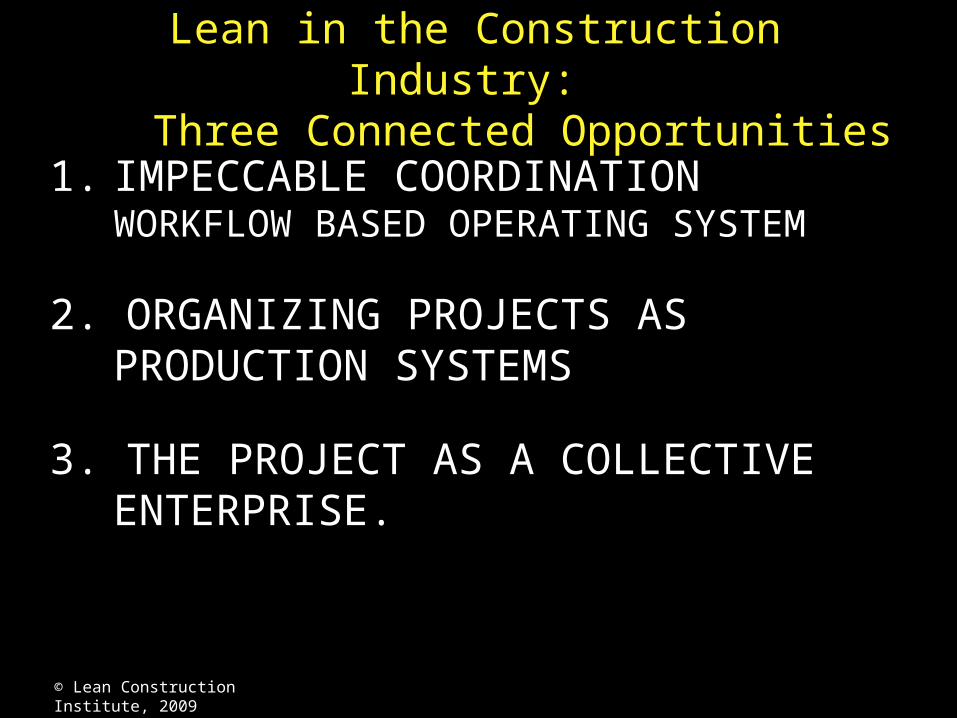
Lean in the Construction Industry: Three Connected Opportunities
1. IMPECCABLE COORDINATIONWORKFLOW BASED OPERATING SYSTEM
2. ORGANIZING PROJECTS AS PRODUCTION SYSTEMS
3. THE PROJECT AS A COLLECTIVE ENTERPRISE.
© Lean Construction Institute, 2009
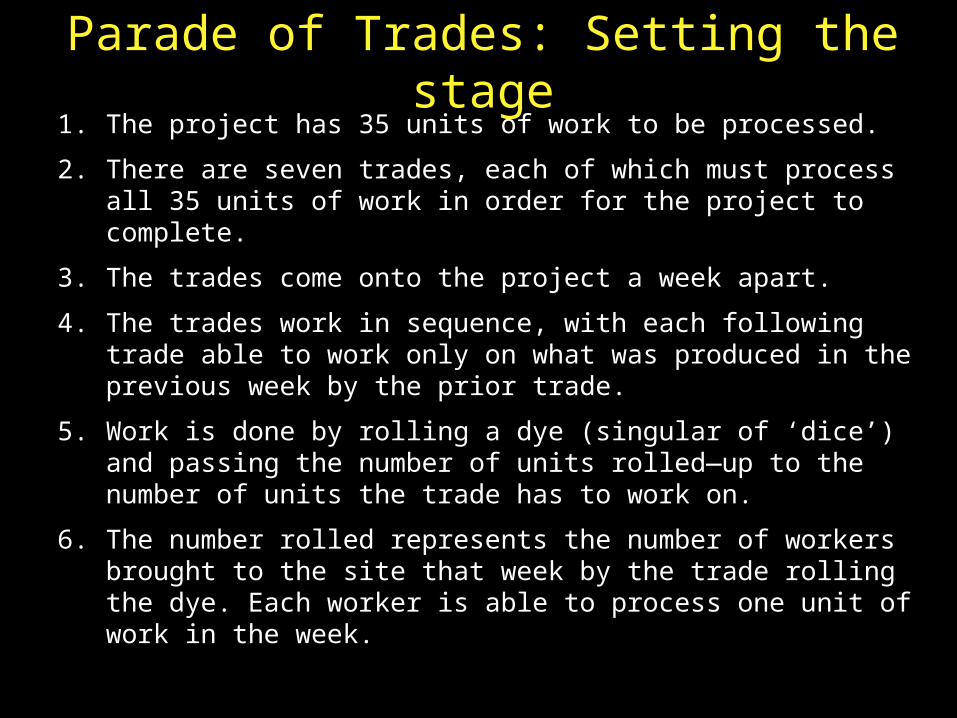
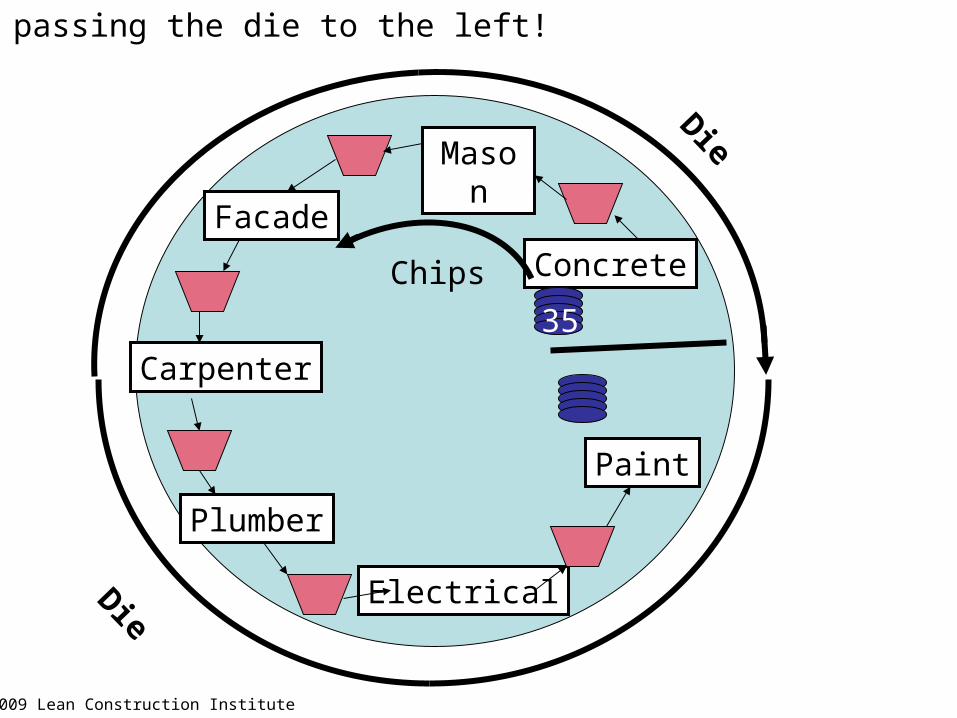
Parade of Trades: Setting the stage1. The project has 35 units of work to be processed.
2. There are seven trades, each of which must process all 35 units of work in order for the project to complete.
3. The trades come onto the project a week apart.
4. The trades work in sequence, with each following trade able to work only on what was produced in the previous week by the prior trade.
5. Work is done by rolling a dye (singular of ‘dice’) and passing the number of units rolled—up to the number of units the trade has to work on.
6. The number rolled represents the number of workers brought to the site that week by the trade rolling the dye. Each worker is able to process one unit of work in the week.
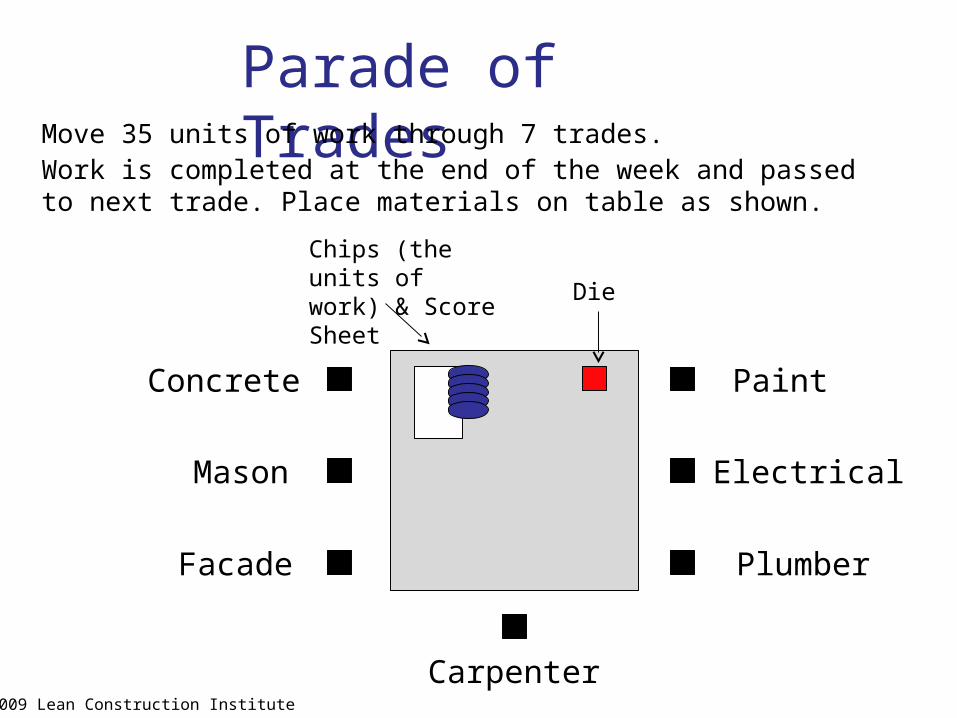
Parade of TradesMove 35 units of work through 7 trades.Work is completed at the end of the week and passed to next trade. Place materials on table as shown.
Chips (the units of work) & Score Sheet
Die
Concrete
Mason
Facade
Paint
Electrical
Plumber
Carpenter© 2009 Lean Construction Institute
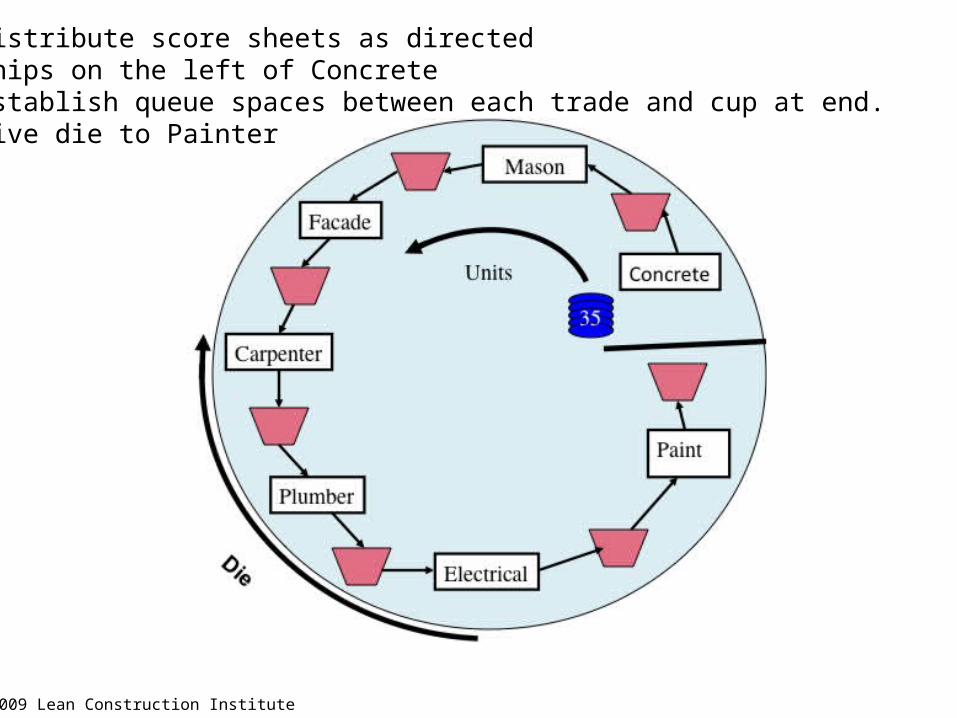
1. Distribute score sheets as directed2. Chips on the left of Concrete3. Establish queue spaces between each trade and cup at end.4. Give die to Painter
© 2009 Lean Construction Institute

End of Week 1
© 2009 Lean Construction Institute
Concrete rolls a 3 and moves 3 chips.
Hands the die to the painter!
Records the result.
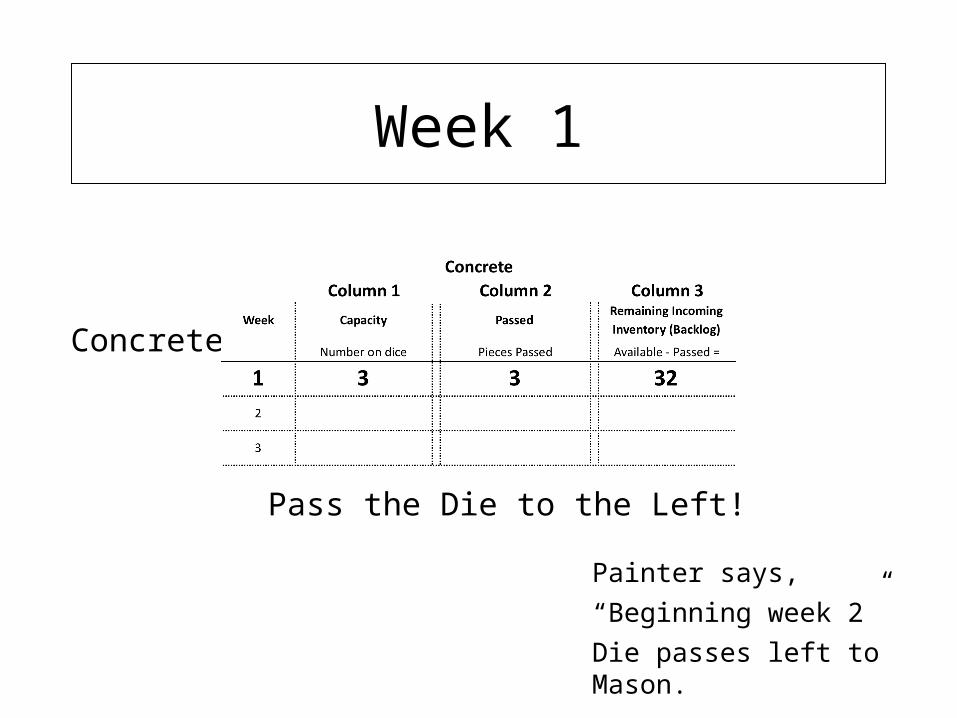
Week 1
Concrete
Pass the Die to the Left!
Painter says,
“Beginning week 2”
Die passes left to Mason.
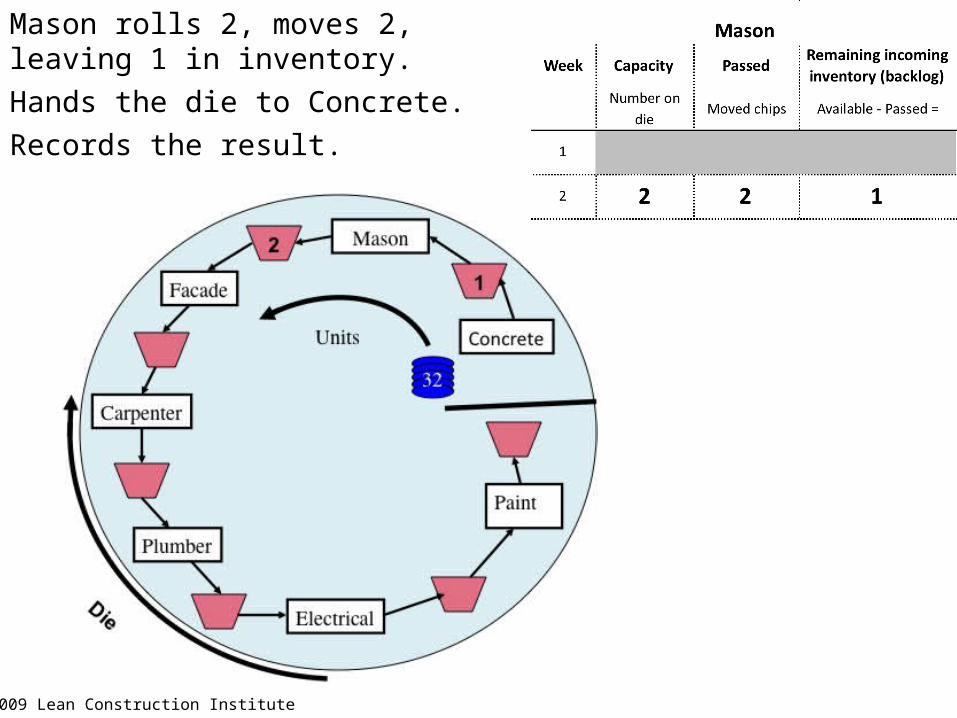
Mason rolls 2, moves 2, leaving 1 in inventory.
Hands the die to Concrete.
Records the result.
© 2009 Lean Construction Institute
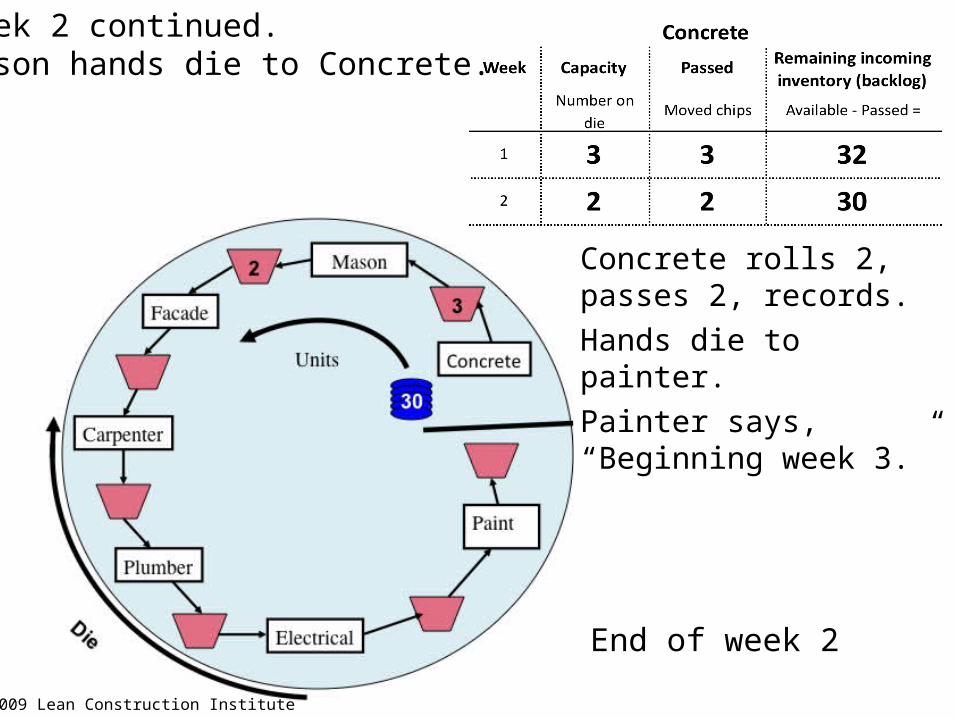
Concrete rolls 2, passes 2, records.
Hands die to painter.
Painter says, “Beginning week 3.”
Week 2 continued.Mason hands die to Concrete.
© 2009 Lean Construction Institute
End of week 2
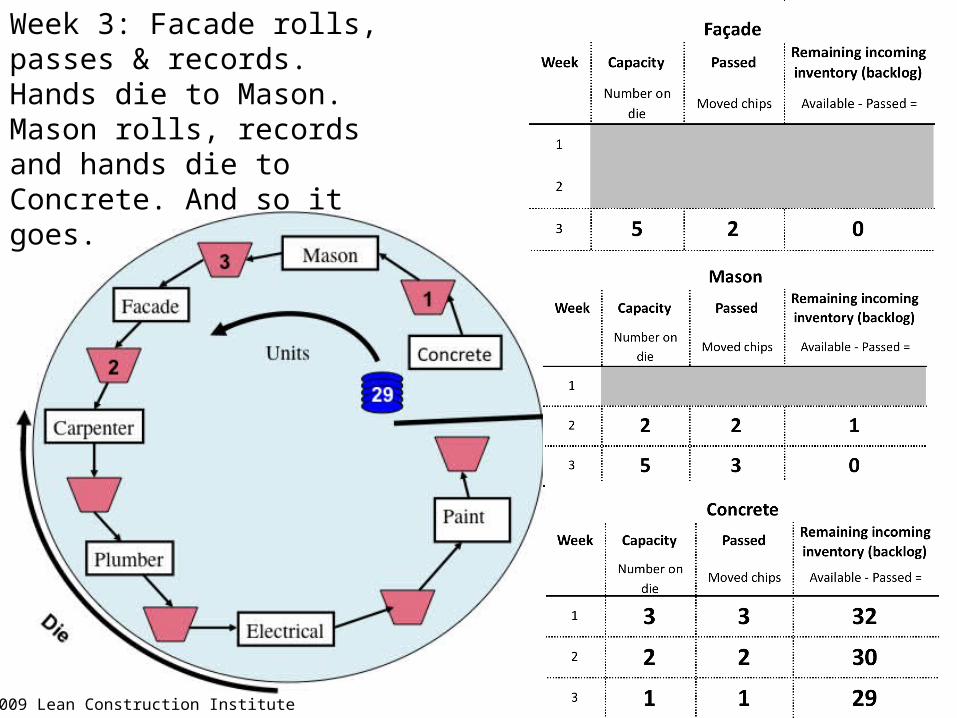
Week 3: Facade rolls, passes & records. Hands die to Mason. Mason rolls, records and hands die to Concrete. And so it goes.
© 2009 Lean Construction Institute
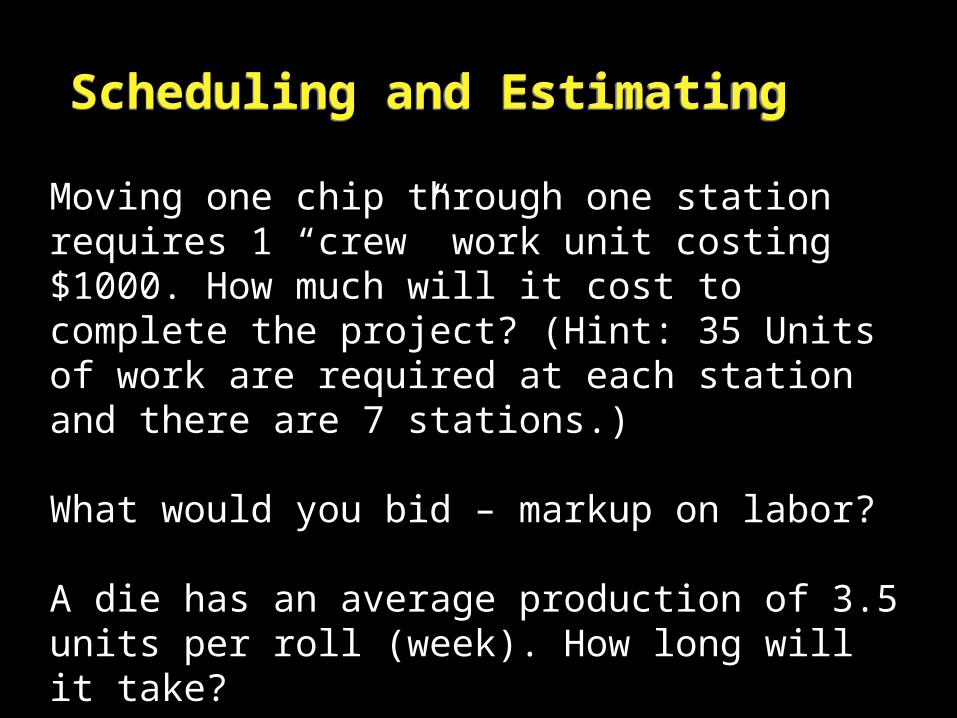
Moving one chip through one station requires 1 “crew” work unit costing $1000. How much will it cost to complete the project? (Hint: 35 Units of work are required at each station and there are 7 stations.)
What would you bid – markup on labor?
A die has an average production of 3.5 units per roll (week). How long will it take?
Scheduling and EstimatingScheduling and Estimating
Concrete
Carpenter
Mason
Facade
Electrical
Paint
35
Die
Plumber
Chips
Keep passing the die to the left!
© 2009 Lean Construction Institute
Die
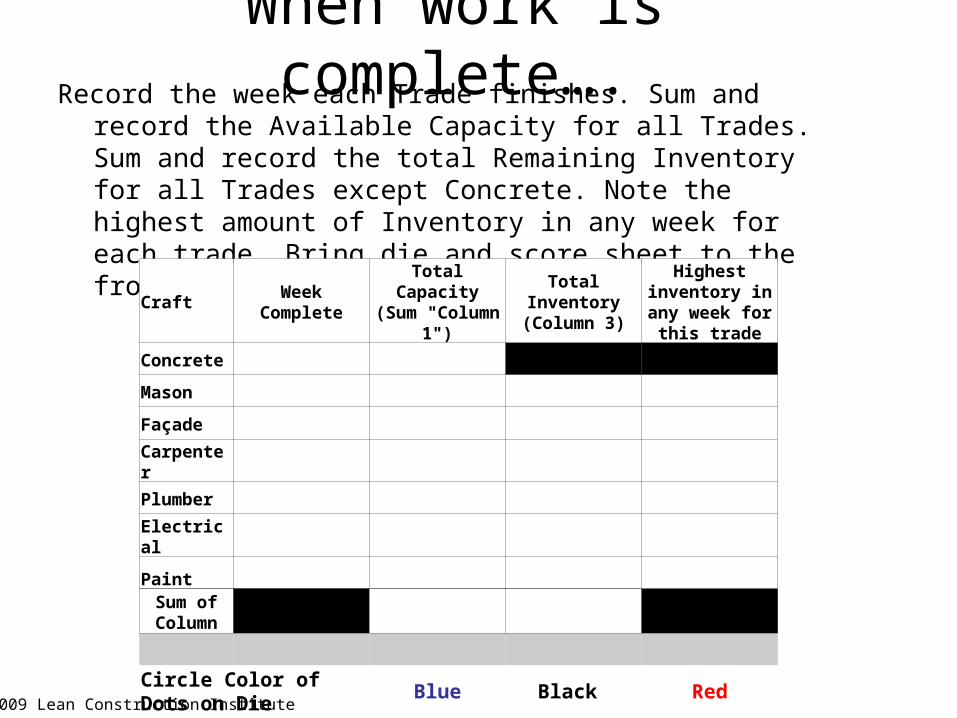
When work is complete….Record the week each Trade finishes. Sum and record the
Available Capacity for all Trades. Sum and record the total Remaining Inventory for all Trades except Concrete. Note the highest amount of Inventory in any week for each trade. Bring die and score sheet to the front.
Craft Week Complete Total Capacity (Sum "Column 1")
Total Inventory (Column 3)
Highest inventory in any week for
this trade
Concrete
Mason
Façade
Carpenter
Plumber
Electrical
Paint
Sum of Column
Circle Color of Dots on Die Blue Black Red
© 2009 Lean Construction Institute
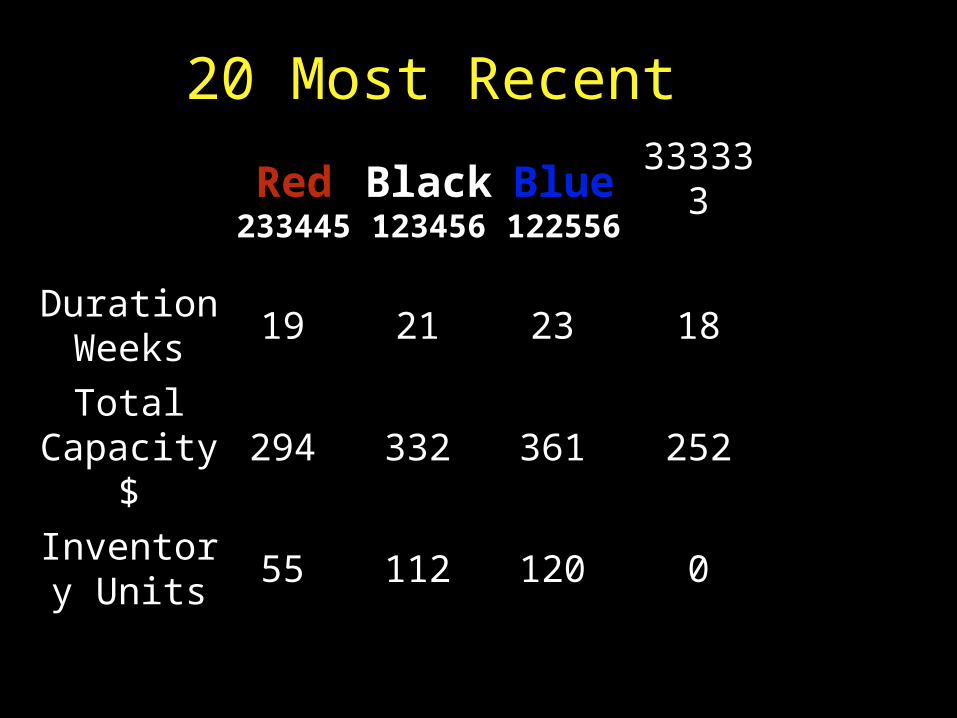
20 Most RecentRed23344
5
Black12345
6
Blue12255
6
333333
Duration Weeks
19 21 23 18
Total Capacity
$294 332 361 252
Inventory Units
55 112 120 0

RESULTS#
Wee
ks t
o C
ompl
ete
1.2.2.5.5.6 1.2.3.4.5.6 2.2.3.4.5.5 2.3.3.4.4.5 3.3.3.4.4.41.1.1.6.6.6
# W
eeks
to
Com
plet
e
Average
Worst
Best
As reduce workflow variability (more reliable)- Outcomes improve & risk goes down!
Question for Discussion
What would be the specific advantages of improved work flow reliability on your projects? For 10 minutes, discuss at table. Select a spokesperson to report.
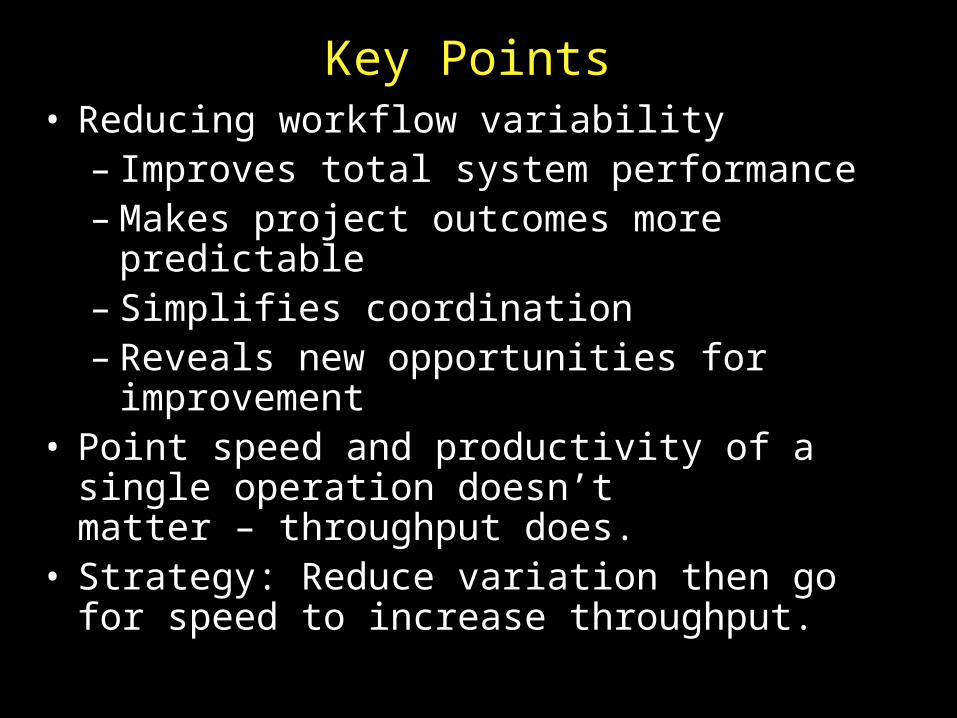
• Reducing workflow variability– Improves total system performance– Makes project outcomes more predictable– Simplifies coordination– Reveals new opportunities for
improvement• Point speed and productivity of a single
operation doesn’t matter – throughput does.• Strategy: Reduce variation then go for
speed to increase throughput.
Key Points
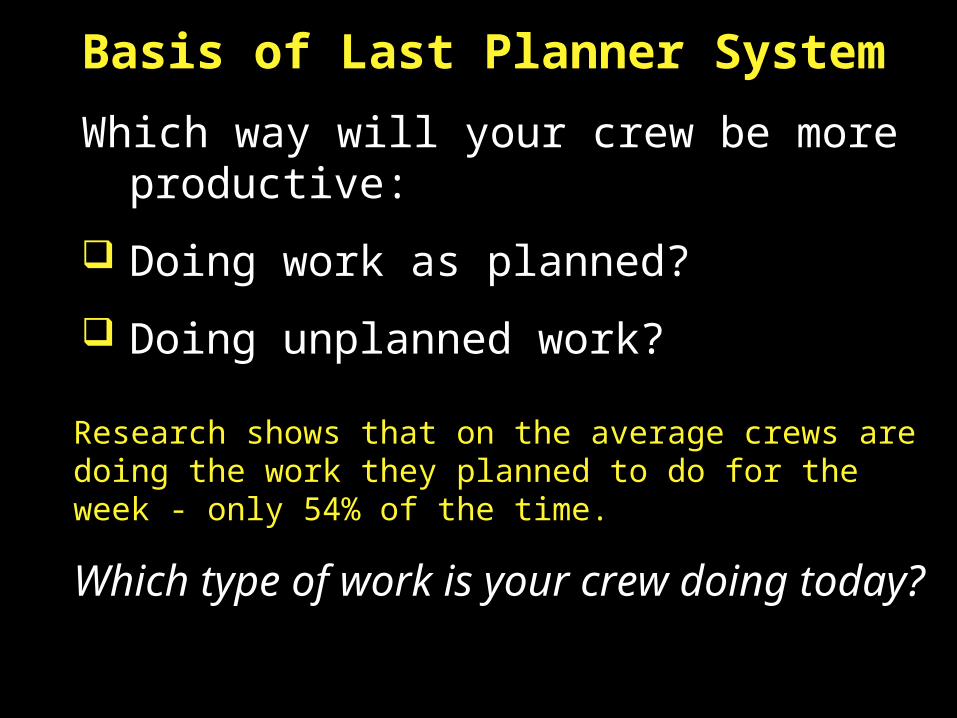
Basis of Last Planner System
Which way will your crew be more productive:
Doing work as planned?
Doing unplanned work?
Research shows that on the average crews are doing the work they planned to do for the week - only 54% of the time.
Which type of work is your crew doing today?
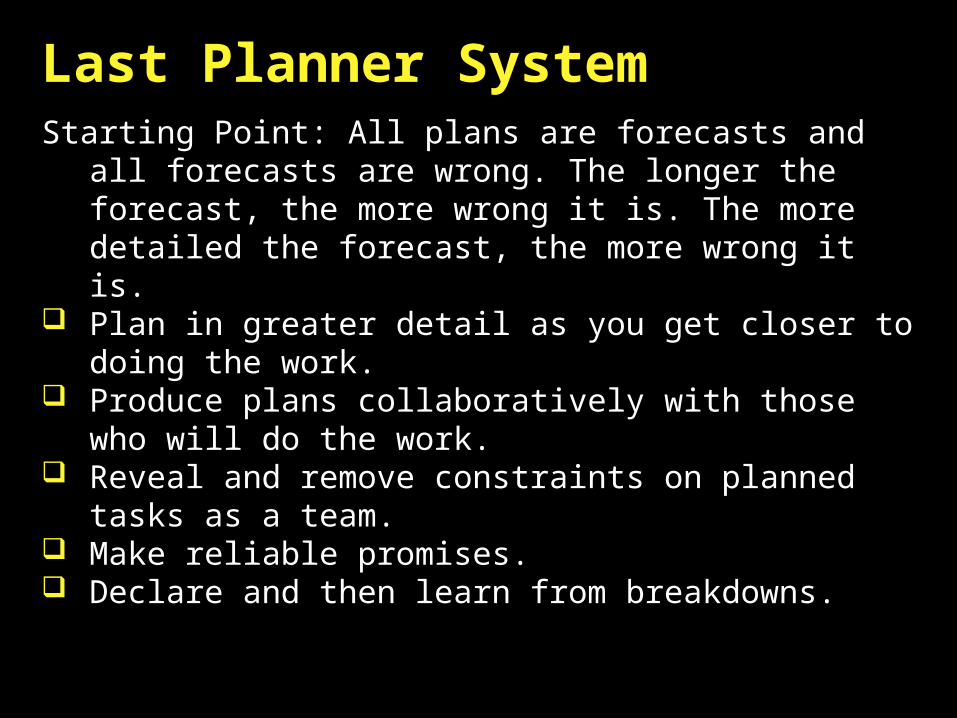
Last Planner SystemStarting Point: All plans are forecasts and all forecasts
are wrong. The longer the forecast, the more wrong it is. The more detailed the forecast, the more wrong it is.
Plan in greater detail as you get closer to doing the work.
Produce plans collaboratively with those who will do the work.
Reveal and remove constraints on planned tasks as a team.
Make reliable promises. Declare and then learn from breakdowns.
* ©Lean Construction Institute, 2009
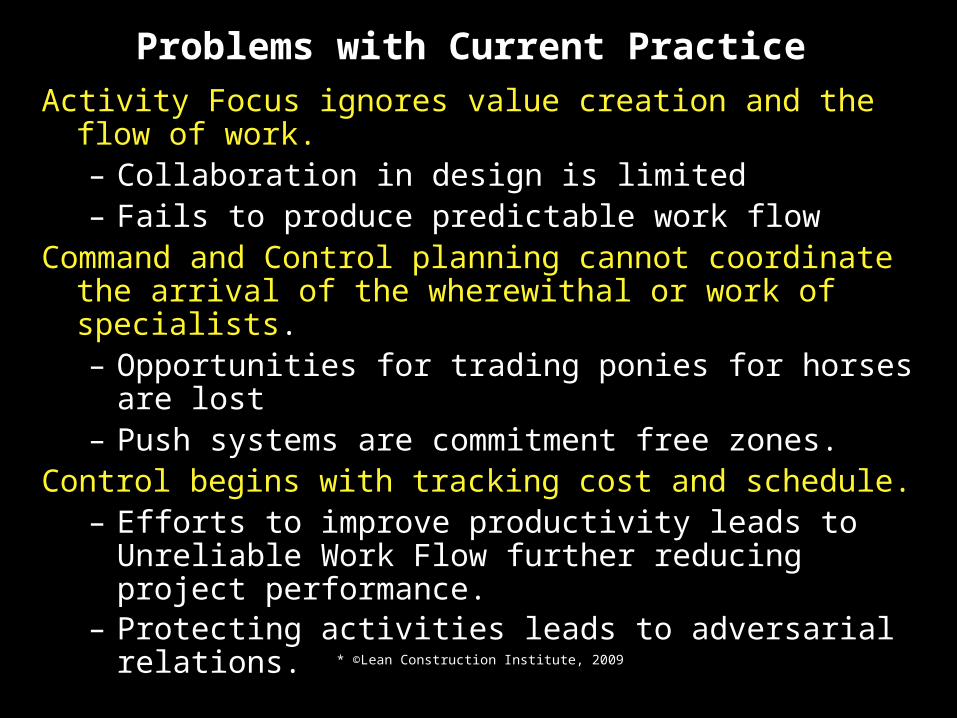
Activity Focus ignores value creation and the flow of work.– Collaboration in design is limited– Fails to produce predictable work flow
Command and Control planning cannot coordinate the arrival of the wherewithal or work of specialists.– Opportunities for trading ponies for horses are
lost– Push systems are commitment free zones.
Control begins with tracking cost and schedule.– Efforts to improve productivity leads to Unreliable
Work Flow further reducing project performance. – Protecting activities leads to adversarial relations.
Problems with Current Practice
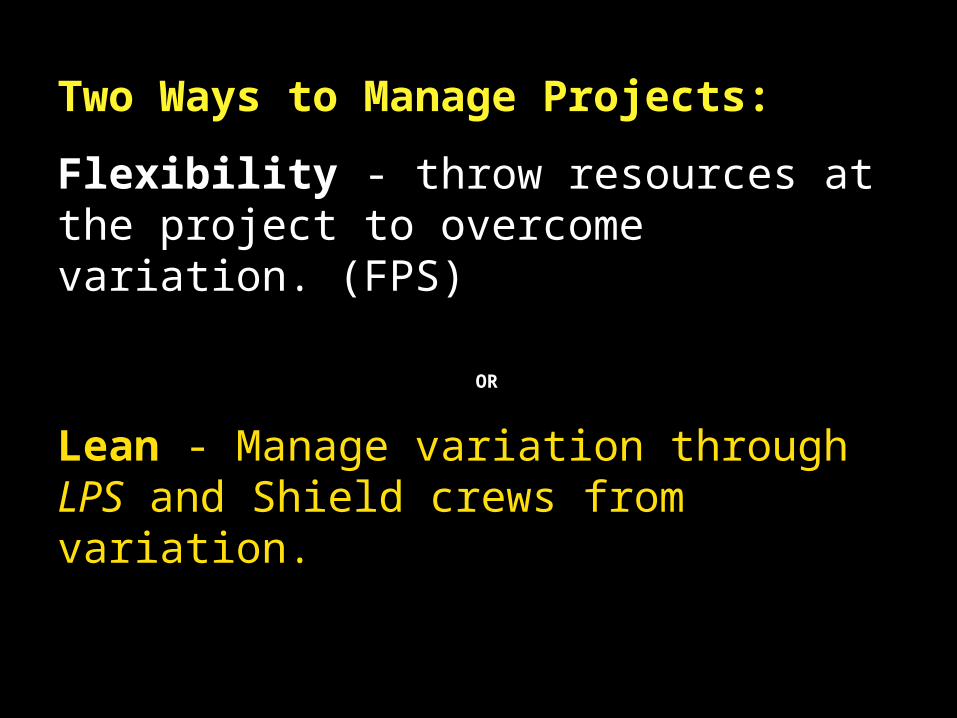
Two Ways to Manage Projects:
Flexibility - throw resources at the project to overcome variation. (FPS)
OR
Lean - Manage variation through LPS and Shield crews from variation.
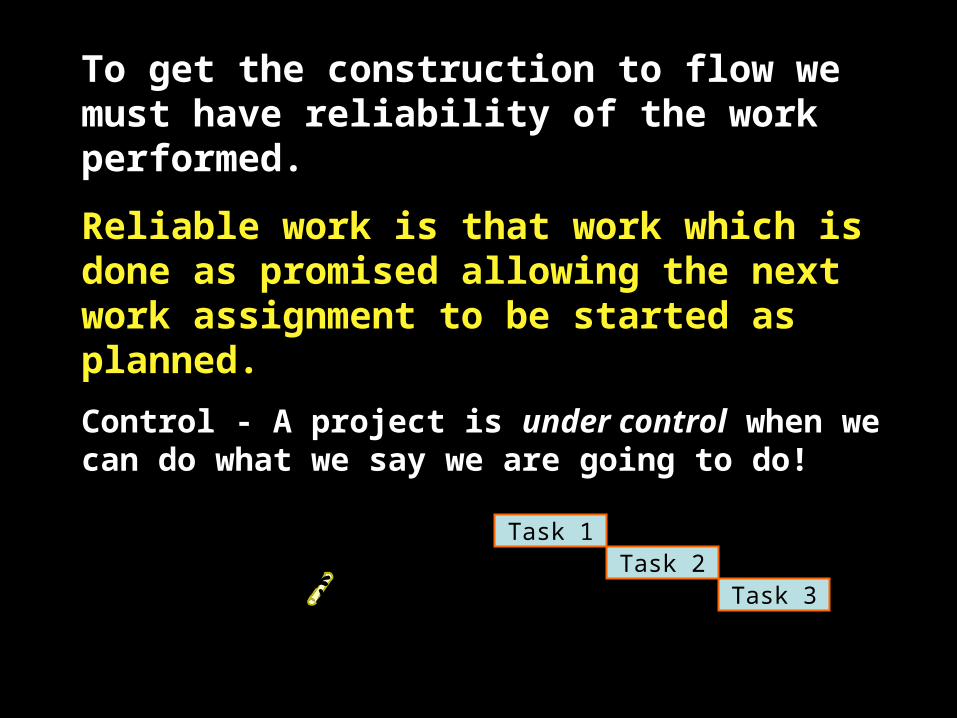
To get the construction to flow we must have reliability of the work performed.
Reliable work is that work which is done as promised allowing the next work assignment to be started as planned.
Control - A project is under control when we can do what we say we are going to do!
Task 1Task 2
Task 3

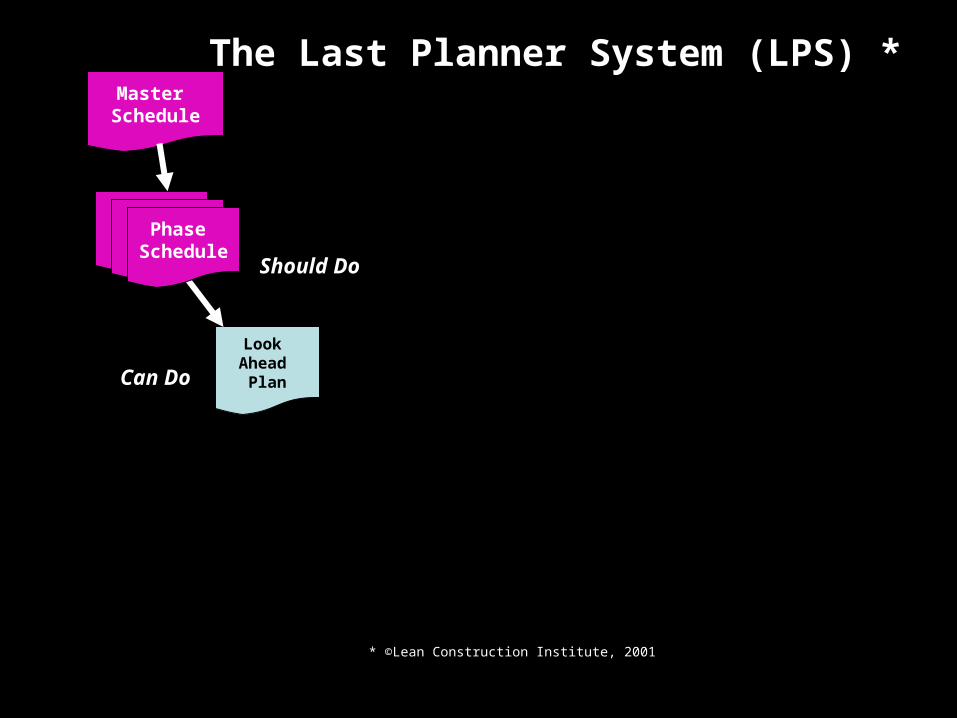
The Last Planner System *
* ©Lean Construction Institute, 2001
Common Practice: Some Assignments Cannot be Completed
CAN
SHOULD
Will
60%
40%
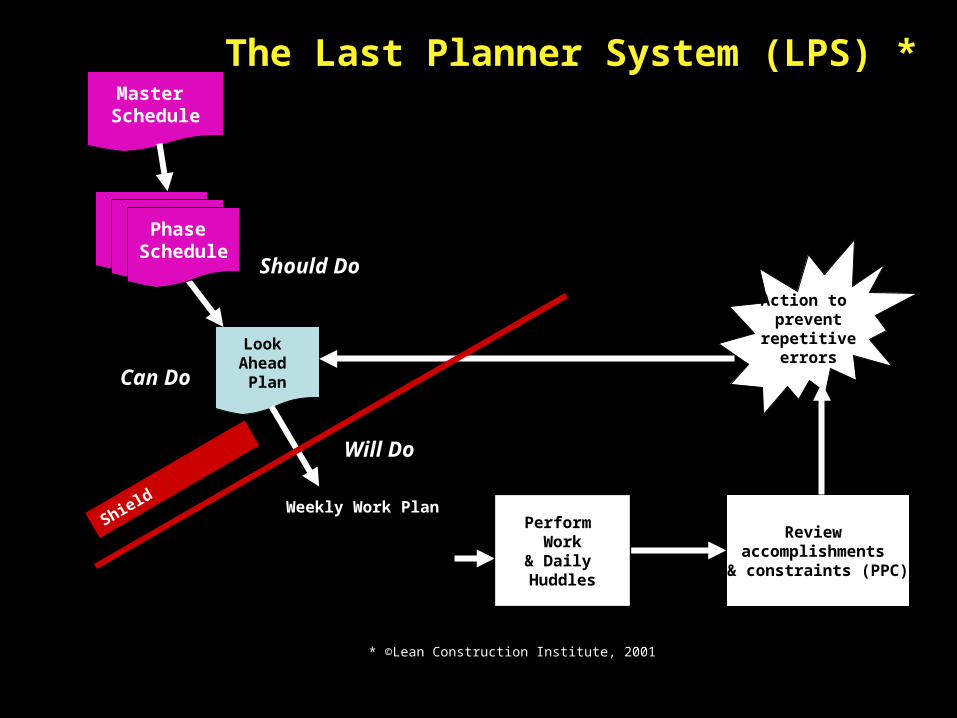
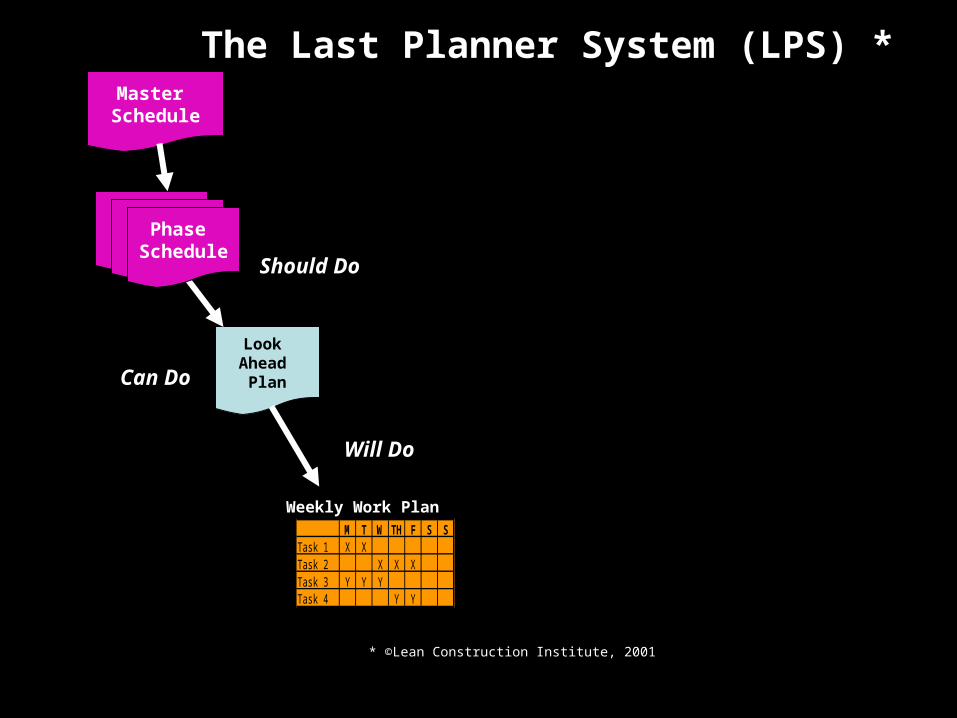
Should Do
Look Ahead
Plan
M T W TH F S STask 1 X XTask 2 X X XTask 3 Y Y YTask 4 Y Y
Weekly Work Plan
Review accomplishments
& constraints (PPC)
Action to prevent
repetitiveerrors
Can Do
Will Do
Shield
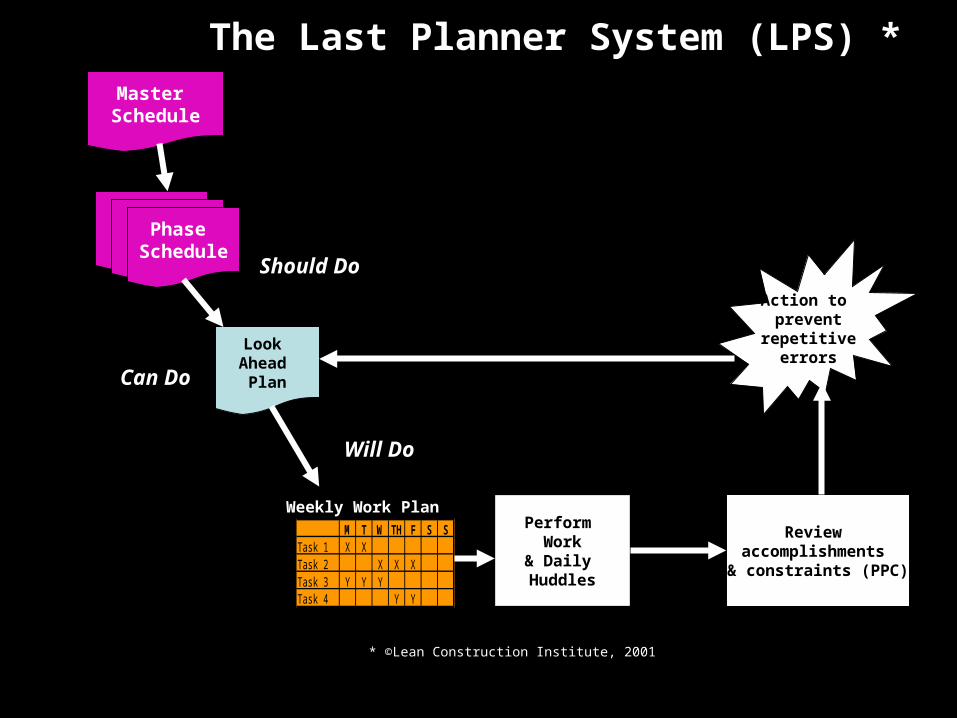
The Last Planner System (LPS) *
* ©Lean Construction Institute, 2001
Master Schedule
Phase PlanPhase Schedule
Perform Work
& Daily Huddles
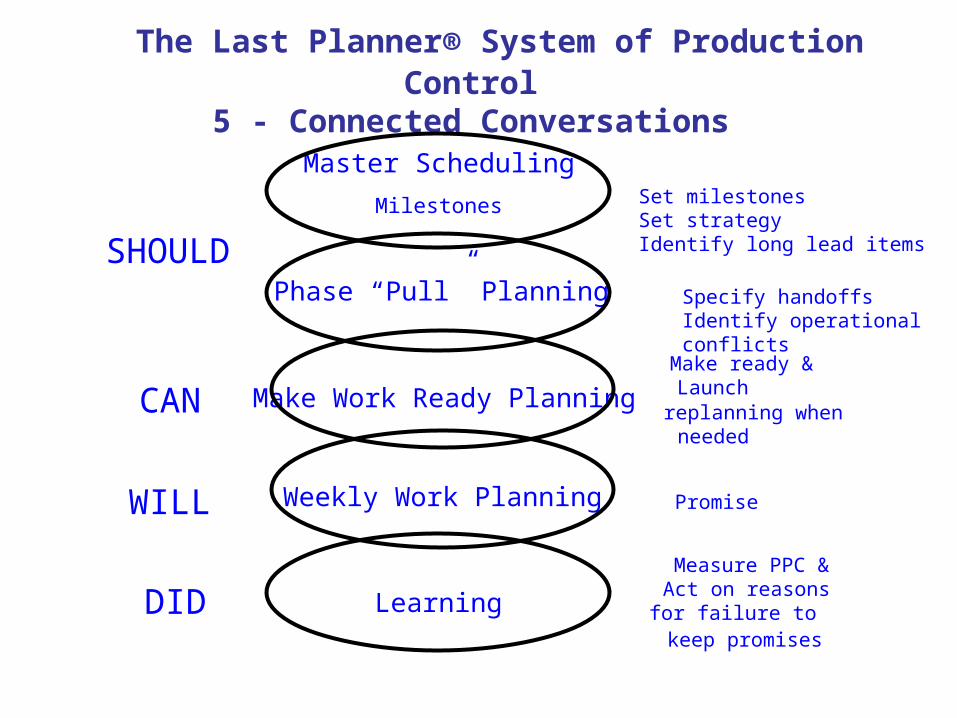
The Last Planner® System of Production Control5 - Connected Conversations
Set milestonesSet strategy Identify long lead items
Specify handoffs Identify operational conflicts
Make ready &Launchreplanning whenneeded
Promise
Measure PPC &Act on reasonsfor failure tokeep promises
SHOULD
CAN
WILL
DID
Weekly Work Planning
Make Work Ready Planning
Learning
Master Scheduling
Milestones
Phase “Pull” Planning

Pull Planning: Designing the Network of Commitments• Produces the best possible plan by involving the
team of people who manage the work in that phase.
• Rehearsing together – Aligns understanding, reveals unexpected
interactions, problems and value adding opportunities: Builds relationship.
– Assures that everyone in a phase understands and supports the plan by the working as a team.
– Assures the selection of value adding tasks that release other work by working backwards from the target completion date to produce a “pull” schedule.
– Establishes the amount of time available for ‘contingency’ and how it should be allocated.
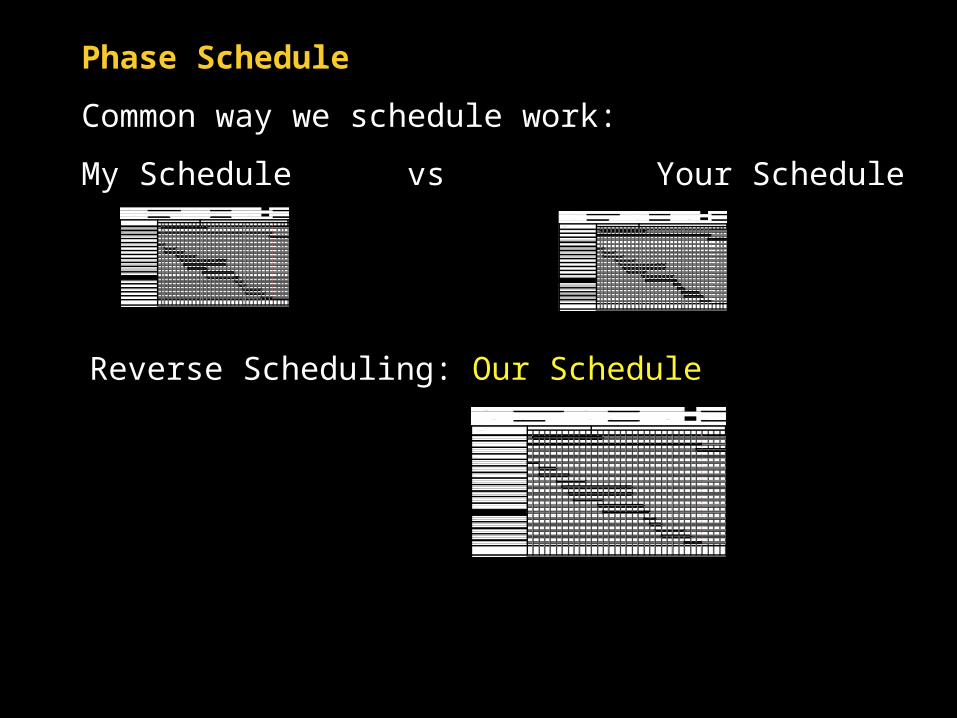
Phase Schedule
Common way we schedule work:
My Schedule vs Your Schedule
Reverse Scheduling: Our Schedule
PRO JECT NAM E: Widget M anuf act ur ing START DATE: LO CATI O N: Wilsonville, O R
DATA DATE: END DATE: CALENDAR PERI O D:
14 17 18 19 20 21 24 25 26 27 28 1 2 3 4 5 8 9 10 11 12 15 16 17 18 19 22 23 24 25 26 29 30 31
Tot als ( on- sit e)
2 2 2
2 2
2 2
4 4 4 33 4 4 4
4 4 4 23 4 4 4
5 4 4
4 4 4 4 4
2 2
4 5 5 5 5 5 5 5
0 0 0 25 4 2 01 6 1 6 8 61 8 1 8 1 9 1 91 5 1 5 1 5 1 50 0 4 80 0 0 0
6 6 4 46 6 6 64 4 6 6
3
3 3
1
2 3 3 3
2 3 3
I nsulat e CHWS/ R Piping
Test CHWS/ R Piping
I nsulat e HWS/ R Piping
CHWS/ R Conn. @ VAV Boxes
Test HWS/ R Piping
HWS/ R Spool Dr awings
I nst all CHWS/ R m ains/ br anches
Fab CHWS/ R piping
Fab HWS/ R piping
I nst all HWS/ R m ains/ br anches
14- Sep- 01
02- Nov- 01
Punch List
CHWS/ R Spool Dr awings
Roof Syst em
M echanical R. I . Sect or " A"
1 1
1 1
Label Pipe Syst em s
06- Aug t o 8- Nov
Sept em ber O ct ober
30- Aug- 01
Set VAV Boxes - Com posit e
ACTI VI TY DESCRI PTI O N
St ar t up & Com m isioning
HWS/ R Conn. @ VAV Boxes
PRO JECT NAM E: Widget M anuf act ur ing START DATE: LO CATI O N: Wilsonville, O R
DATA DATE: END DATE: CALENDAR PERI O D:
14 17 18 19 20 21 24 25 26 27 28 1 2 3 4 5 8 9 10 11 12 15 16 17 18 19 22 23 24 25 26 29 30 31
Tot als ( on- sit e)
2 2 2
2 2
2 2
4 4 4 33 4 4 4
4 4 4 23 4 4 4
5 4 4
4 4 4 4 4
2 2
4 5 5 5 5 5 5 5
0 0 0 25 4 2 016 16 8 618 18 19 1915 15 15 150 0 4 80 0 0 0
6 6 4 46 6 6 64 4 6 6
3
3 3
1
2 3 3 3
2 3 3
I nsulat e CHWS/ R Piping
Test CHWS/ R Piping
I nsulat e HWS/ R Piping
CHWS/ R Conn. @ VAV Boxes
Test HWS/ R Piping
HWS/ R Spool Dr awings
I nst all CHWS/ R m ains/ br anches
Fab CHWS/ R piping
Fab HWS/ R piping
I nst all HWS/ R m ains/ br anches
14- Sep- 01
02- Nov- 01
Punch List
CHWS/ R Spool Dr awings
Roof Syst em
M echanical R. I . Sect or " A"
1 1
1 1
Label Pipe Syst em s
06- Aug t o 8- Nov
Sept em ber O ct ober
30- Aug- 01
Set VAV Boxes - Com posit e
ACTI VI TY DESCRI PTI O N
St ar t up & Com m isioning
HWS/ R Conn. @ VAV Boxes
Look Ahead
PlanCan Do
* ©Lean Construction Institute, 2001
Should Do
The Last Planner System (LPS) *Master
Schedule
Phase PlanPhase Schedule

Project Name: Strawberry Run Date:Prepared
By: Eddie Welsh
Activ ity Planned Start Responsible Contract / Materials Labor Equipment Prereq Weather Other Comments
ID Date Party Change Orders AE Complete Submittals RFI's Work
Order micropiles for NO delay 2-Aug NLB Yes Yes Yes X X X X X X X Approval
Complete lagging and tiebacks 2-Aug M&M X X X X X Yes X X X Yes Money
Place rebar template @ wall #4 2-Aug NLB X X X X X Yes X Yes X X
Complete caissons
Run water and sewer to the top of drive 2-Aug NLB X X X X Yes Yes Yes Yes X X Pothole
Install rebar for footing @ wall #4 2-Aug McGrath X X X X X X X Yes X X
Complete caissons
Pour footing for wall #4 2-Aug NLB X X X X X X X Yes X XComplete caissons
Complete V-Ditch 2-Aug Peak X X X X X X X X X Yes Money
Issue rebar shops for garage footings 6-Aug NLB X X Yes X X X X X X Yes receive 7-30
Get elevator shaft shops approved 6-Aug NLB X X X X X X X X X X Shaft - Sept.15
Complete micropiles on line "L". 9-Aug Drill Tech Yes Yes Yes X Yes X X X X X
Form Wall for wall #4 9-Aug NLB X X X X Yes Yes X Yes X X
Install wall #2 9-Aug NLB X X Yes X Yes Yes X X X X Consultant
Install Miradrain 16-Aug Pacific X X Yes X Yes X X Yes X X
Complete shotcrete testpanel 16-Aug NLB X X X X Yes X X X X X
Survey and layout Bldg. 2 16-Aug NLB X X X X X Yes X Yes X X
Survey and layout Bldg. 1 16-Aug NLB X X X X X Yes X Yes X X
Form wall "23" line 16-Aug NLB X X X X X X X Yes X X
DesignActiv ity Description
Sample Look Ahead Plan
Look Ahead
Plan
M T W TH F S STask 1 X XTask 2 X X XTask 3 Y Y YTask 4 Y Y
Weekly Work Plan
Can Do
Will Do
* ©Lean Construction Institute, 2001
Should Do
The Last Planner System (LPS) *Master
Schedule
Phase PlanPhase Schedule
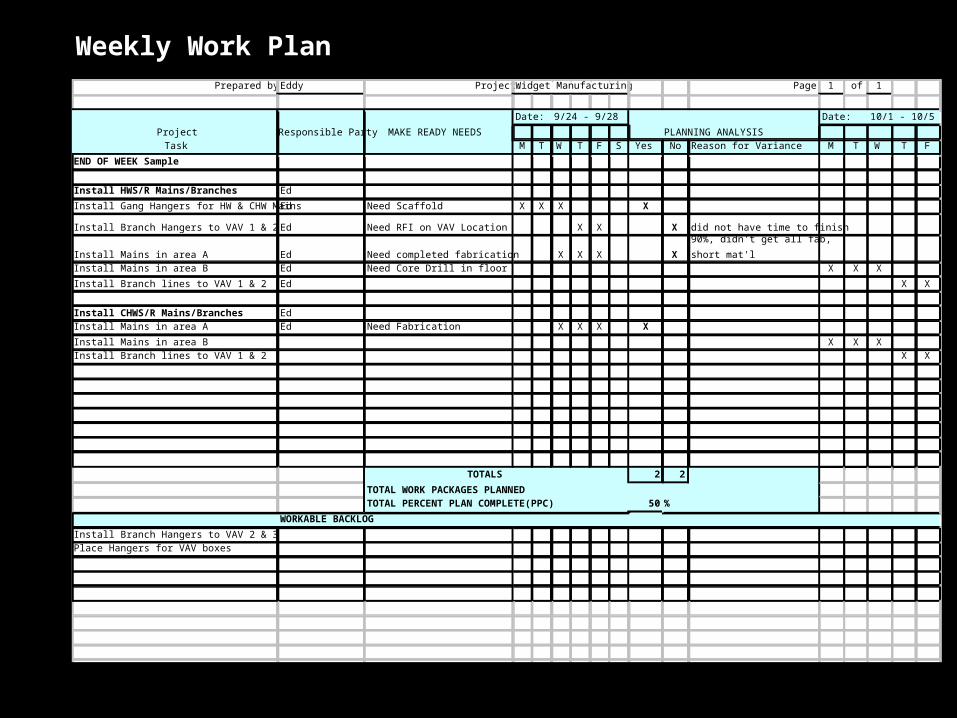
Prepared by: Eddy Project: Widget Manufacturing Page 1 of 1
Date: 9/24 - 9/28 Date: 10/1 - 10/5
Project Responsible Party MAKE READY NEEDS PLANNING ANALYSIS
Task M T W T F S Yes No Reason for Variance M T W T F
END OF WEEK Sample
Install HWS/R Mains/Branches Ed
Install Gang Hangers for HW & CHW Mains Ed Need Scaffold X X X X
Install Branch Hangers to VAV 1 & 2 Ed Need RFI on VAV Location X X X did not have time to finish
Install Mains in area A Ed Need completed fabrication X X X X
90%, didn't get all fab,
short mat'l
Install Mains in area B Ed Need Core Drill in floor X X X
Install Branch lines to VAV 1 & 2 Ed X X
Install CHWS/R Mains/Branches Ed
Install Mains in area A Ed Need Fabrication X X X X
Install Mains in area B X X X
Install Branch lines to VAV 1 & 2 X X
TOTALS 2 2
TOTAL WORK PACKAGES PLANNED
TOTAL PERCENT PLAN COMPLETE(PPC) 50 %
WORKABLE BACKLOG
Install Branch Hangers to VAV 2 & 3
Place Hangers for VAV boxes
Weekly Work Plan
Perform Work
& Daily Huddles
Look Ahead
Plan
M T W TH F S STask 1 X XTask 2 X X XTask 3 Y Y YTask 4 Y Y
Weekly Work Plan
Can Do
Will Do
* ©Lean Construction Institute, 2001
Should Do
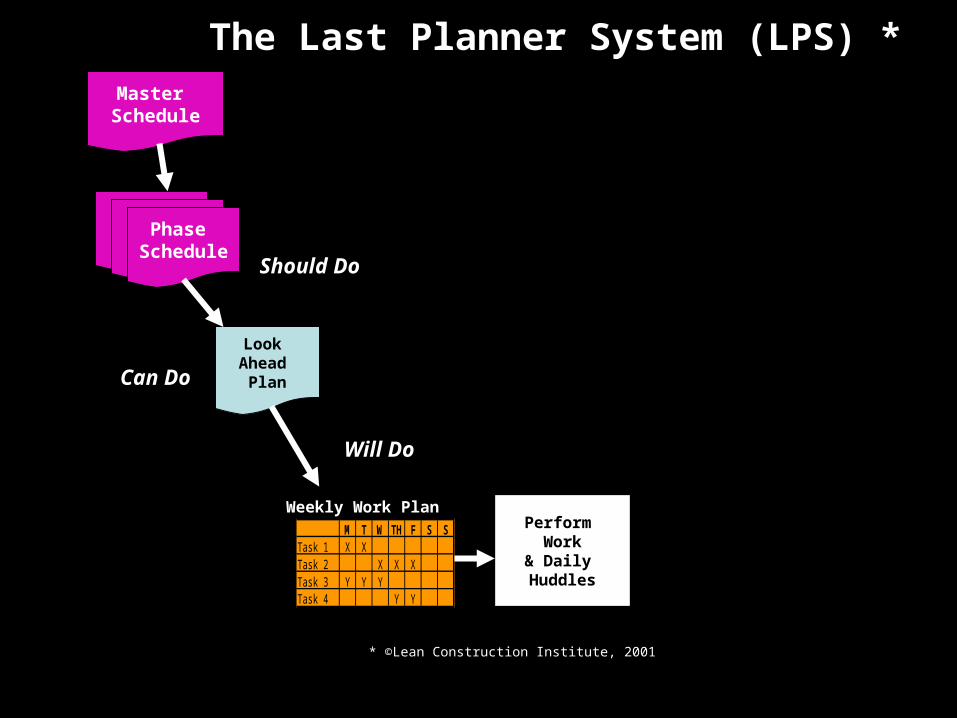
The Last Planner System (LPS) *Master
Schedule
Phase PlanPhase Schedule
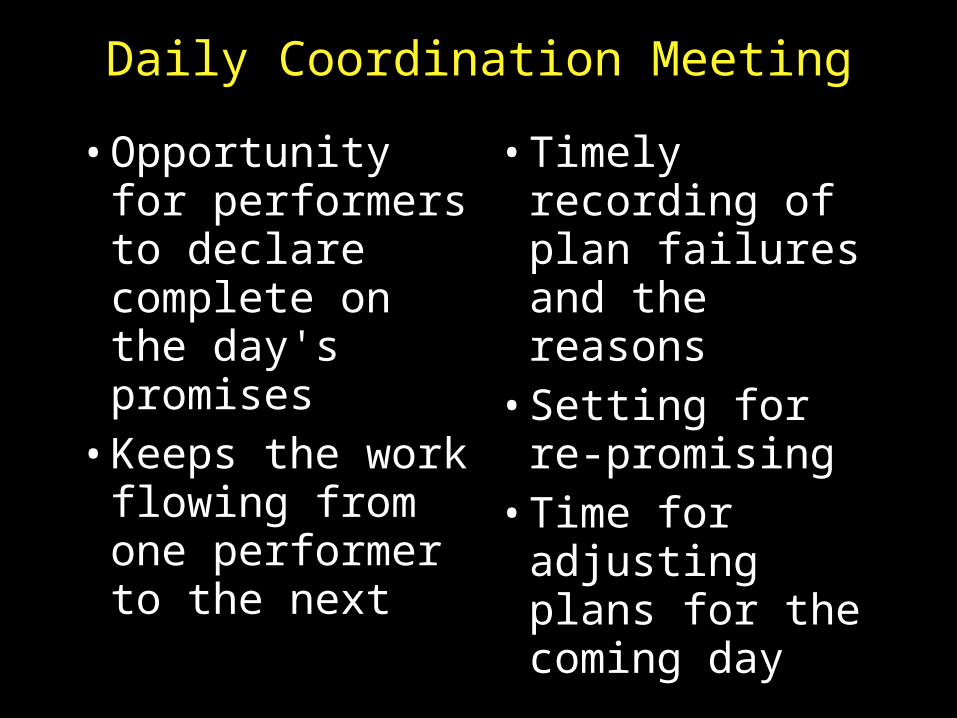
Daily Coordination Meeting
•Opportunity for performers to declare complete on the day's promises
•Keeps the work flowing from one performer to the next
•Timely recording of plan failures and the reasons
•Setting forre-promising
•Time for adjusting plans for the coming day
Perform Work
& Daily Huddles
Look Ahead
Plan
M T W TH F S STask 1 X XTask 2 X X XTask 3 Y Y YTask 4 Y Y
Weekly Work Plan
Review accomplishments
& constraints (PPC)
Action to prevent
repetitiveerrors
Can Do
Will Do
* ©Lean Construction Institute, 2001
Should Do
The Last Planner System (LPS) *Master
Schedule
Phase PlanPhase Schedule
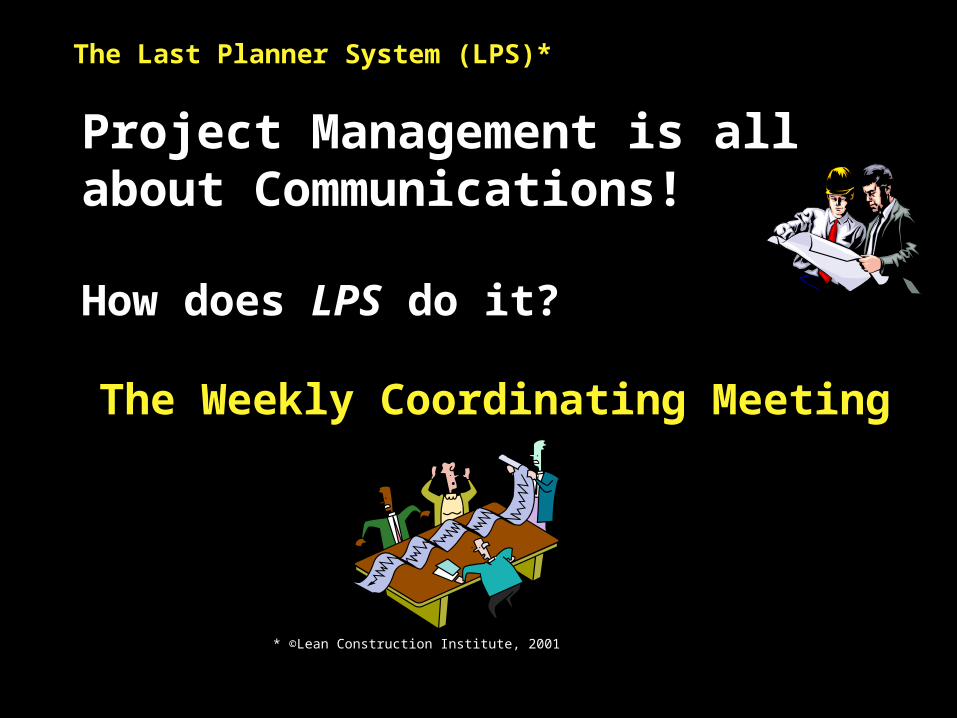
The Last Planner System (LPS)*
* ©Lean Construction Institute, 2001
Project Management is all about Communications!
How does LPS do it?
The Weekly Coordinating Meeting
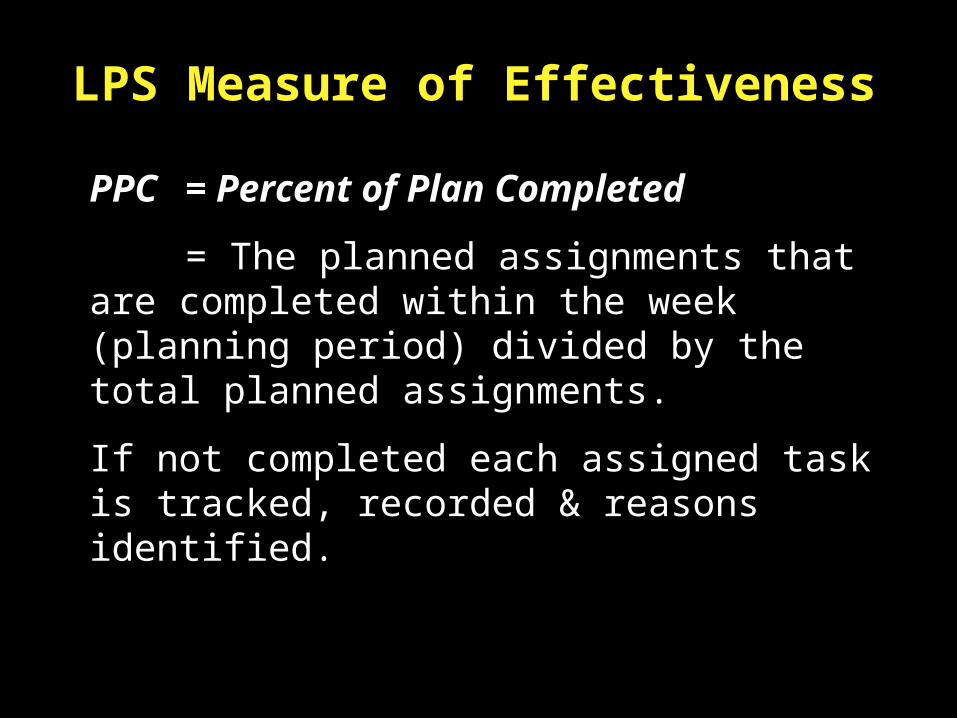
PPC = Percent of Plan Completed
= The planned assignments that are completed within the week (planning period) divided by the total planned assignments.
If not completed each assigned task is tracked, recorded & reasons identified.
LPS Measure of Effectiveness
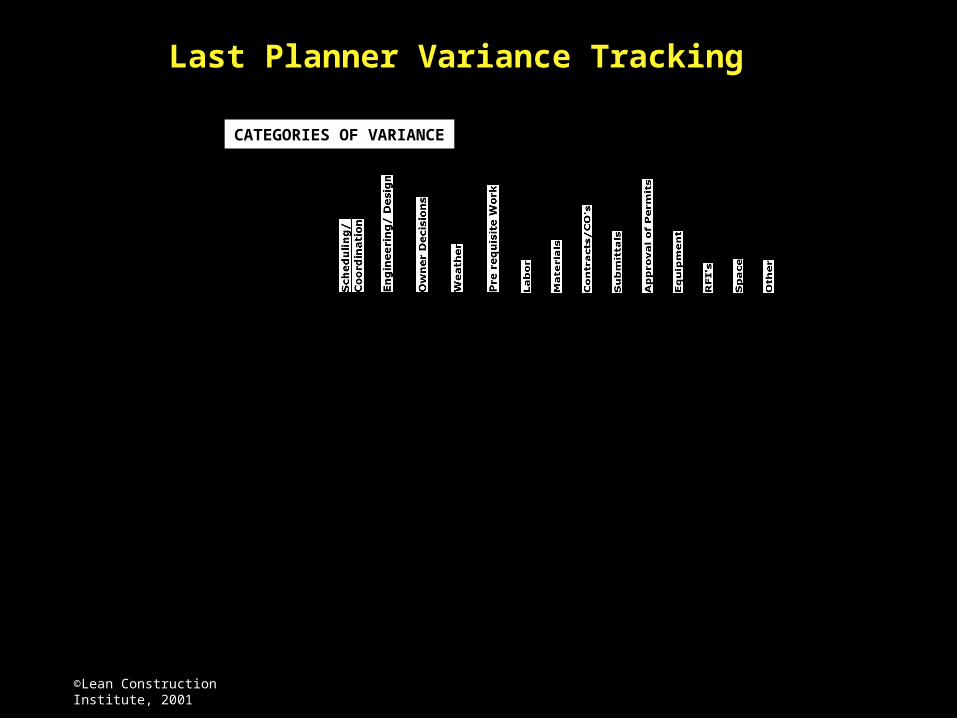
Last Planner Variance Tracking
©Lean Construction Institute, 2001
WEEK PLANNER # YES # NO PPC % Scheduling/ CoordinationEngineering/ DesignOwner DecisionsWeatherPre requisite Work15-Feb Roy 5 4 56% 1
15-Feb Martinez 4 3 57% 2
22-Feb Roy 6 3 67%
22-Feb Martinez 4 6 40% 2 1
1-Mar Roy 2 1 67%
1-Mar Martinez 6 6 50%
8-Mar Roy 6 3 67% 1 1
8-Mar Martinez 5 4 56% 2
15-Mar Roy 7 4 64% 2
15-Mar Martinez 6 3 67%
22-Mar Roy 3 3 50% 1
22-Mar Martinez 5 4 56% 1
29-Mar Roy 6 3 67% 2
29-Mar Martinez 5 3 63%
Totals 70 50 58% 11 1 0 3 1
CATEGORIES OF VARIANCE
Labor MaterialsContracts/CO'sSubmittalsApproval of PermitsEquipmentRFI's SpaceOtherComments on Variation
1 2 Design Change
1 Sub contractor/GC coord.
1 2 Material not ready at shop
1 2 Material not ready at shop
1 RFI # 27 unanswered
4 2 short crew
1 Rain
1 1 Rain
1 1 Waiting on electricians
1 2 Material delivered late
2 material shorts
1 1 1 Inspector was late
1 Shop was down
2 1 Shop down/ Inspector late
10 20 1 0 2 0 1 0 0
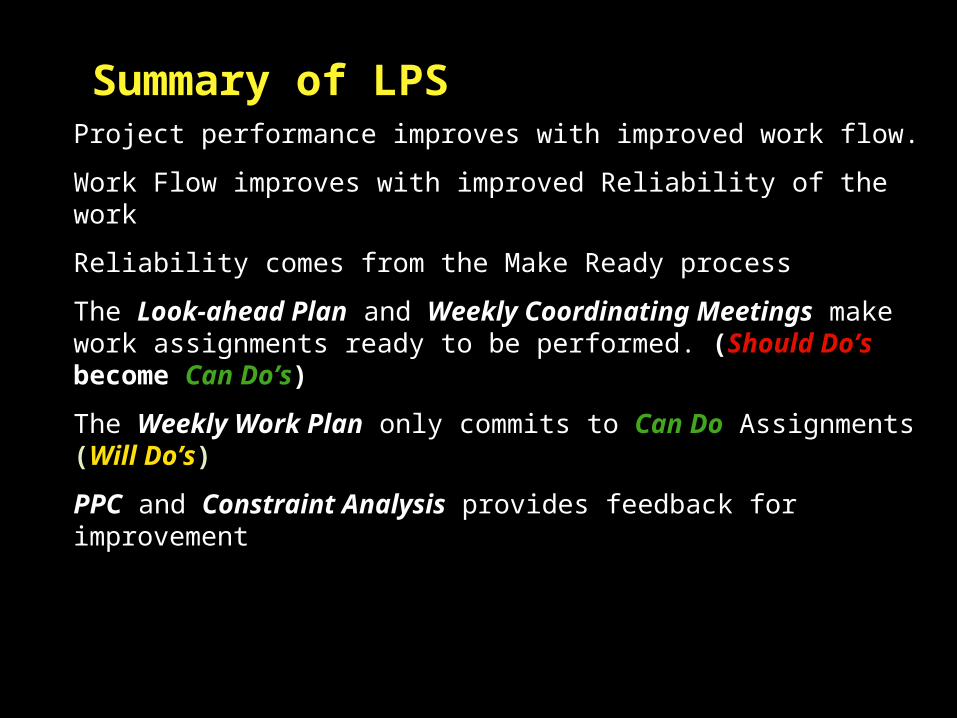
Project performance improves with improved work flow.
Work Flow improves with improved Reliability of the work
Reliability comes from the Make Ready process
The Look-ahead Plan and Weekly Coordinating Meetings make work assignments ready to be performed. (Should Do’s become Can Do’s)
The Weekly Work Plan only commits to Can Do Assignments (Will Do’s)
PPC and Constraint Analysis provides feedback for improvement
Summary of LPS

Why Last Planner®?
• Without Last Planner®:– only half the tasks on weekly work plans
are completed as planned. – so called ‘project control’ is after-the-fact
identification of variances, not proactive steering toward objectives.
– projects are a commitment-free zone; promises are neither requested nor made.
(If you can’t say ‘no’, you can’t make a promise.)
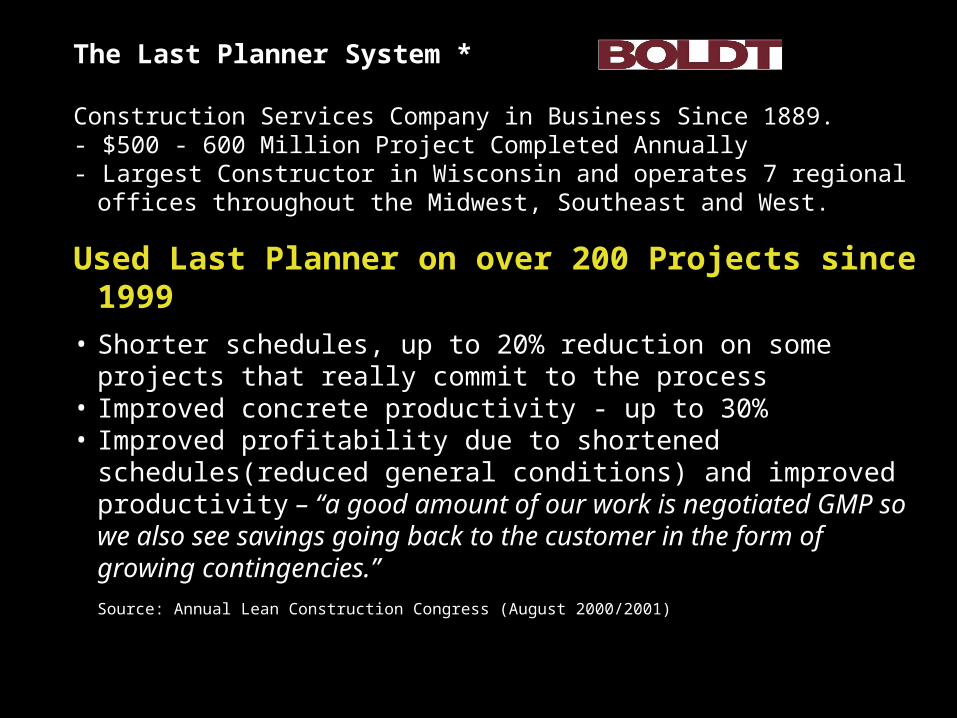
The Last Planner System *
Construction Services Company in Business Since 1889.- $500 - 600 Million Project Completed Annually- Largest Constructor in Wisconsin and operates 7 regional offices
throughout the Midwest, Southeast and West.
Used Last Planner on over 200 Projects since 1999
• Shorter schedules, up to 20% reduction on some projects that really commit to the process
• Improved concrete productivity - up to 30%• Improved profitability due to shortened schedules(reduced
general conditions) and improved productivity – “a good amount of our work is negotiated GMP so we also see savings going back to the customer in the form of growing contingencies.”Source: Annual Lean Construction Congress (August 2000/2001)
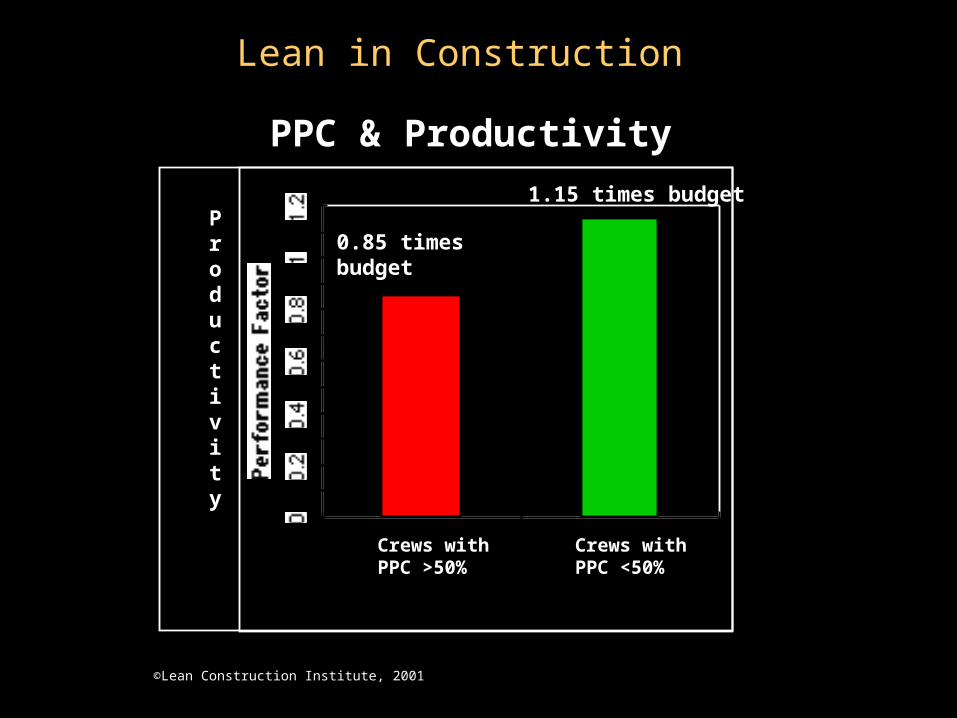
PPC & Productivity
Productivity
Crews withPPC >50%
Crews withPPC <50%
1.15 times budget
0.85 times budget
©Lean Construction Institute, 2001
Lean in Construction
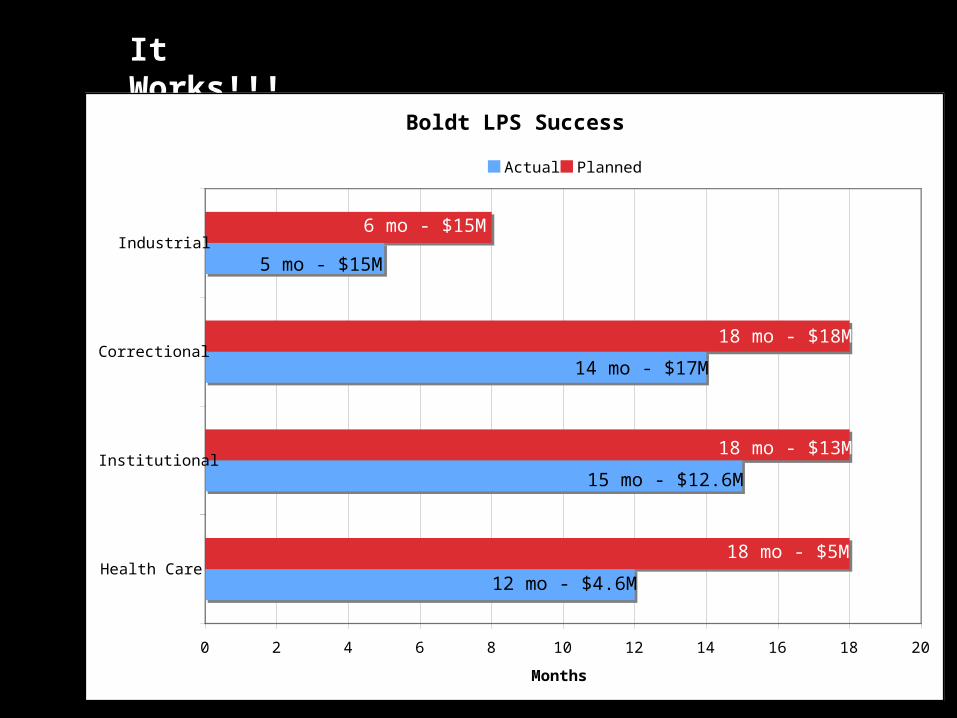
It Works!!!
5 mo - $15M
14 mo - $17M
15 mo - $12.6M
12 mo - $4.6M
Boldt LPS Success
0 2 4 6 8 10 12 14 16 18 20
Health Care
Institutional
Correctional
Industrial
Months
Actual Planned
6 mo - $15M
5 mo - $15M
18 mo - $18M
14 mo - $17M
18 mo - $13M
15 mo - $12.6M
18 mo - $5M
12 mo - $4.6M
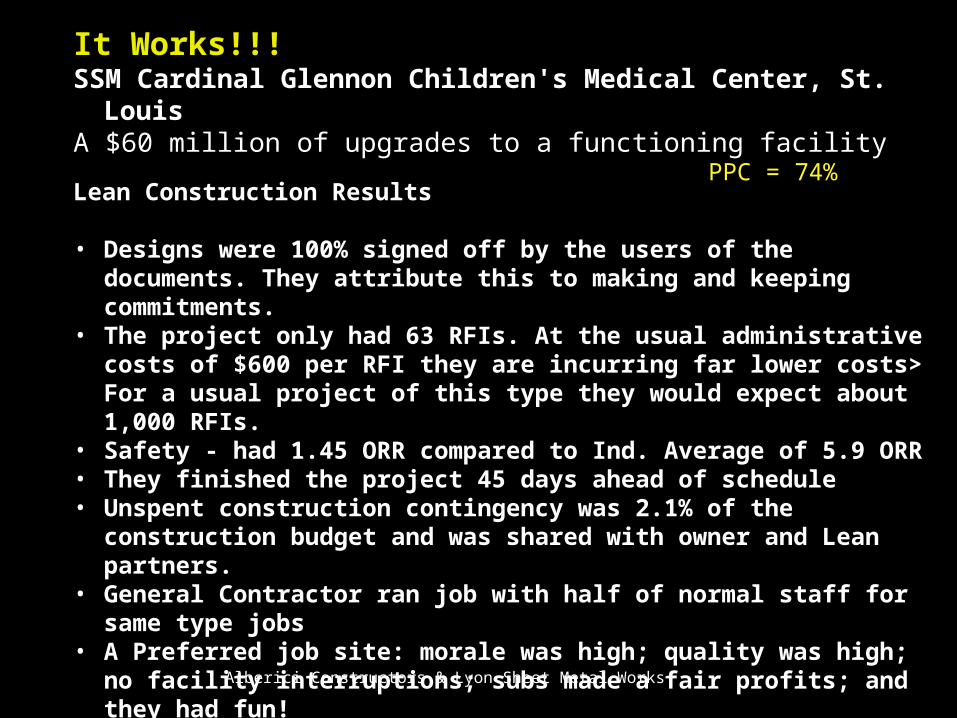
It Works!!!
SSM Cardinal Glennon Children's Medical Center, St. Louis
A $60 million of upgrades to a functioning facility
Lean Construction Results
• Designs were 100% signed off by the users of the documents. They attribute this to making and keeping commitments.
• The project only had 63 RFIs. At the usual administrative costs of $600 per RFI they are incurring far lower costs> For a usual project of this type they would expect about 1,000 RFIs.
• Safety - had 1.45 ORR compared to Ind. Average of 5.9 ORR• They finished the project 45 days ahead of schedule• Unspent construction contingency was 2.1% of the
construction budget and was shared with owner and Lean partners.
• General Contractor ran job with half of normal staff for same type jobs
• A Preferred job site: morale was high; quality was high; no facility interruptions; subs made a fair profits; and they had fun!
PPC = 74%
Alberici Constructors & Lyon Sheet Metal Works
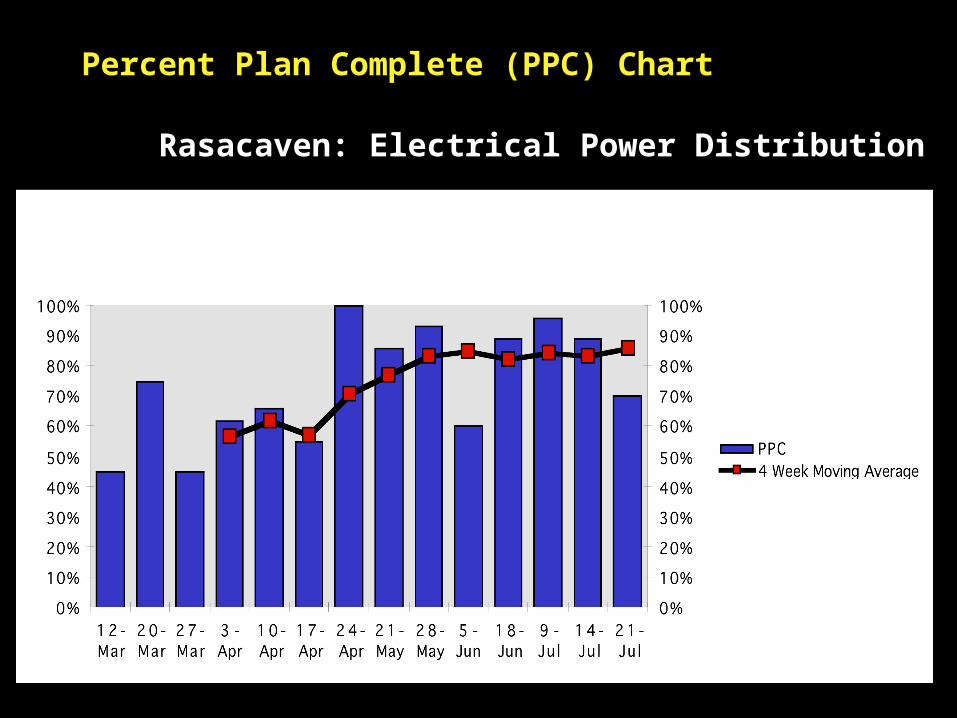
Percent Plan Complete (PPC) Chart
Rasacaven: Electrical Power Distribution

Dave Koester, BMW Senior Project Manager, on using Lean Production Management on the BP
ULSD Project
• “Every large industrial project in Northwest Indiana and the south suburbs of Chicago has been over budget and has missed schedule for the last 20 years. This method broke the cycle.”
• “We have been striving for employee involvement and empowerment; this method gave us a vehicle to achieve it.”
• “We now utilize the entire bodies of our field crews, not just from the neck down.”
• “If we didn’t use the method on this project, I would have been begging for mercy [from the owner] months ago.”
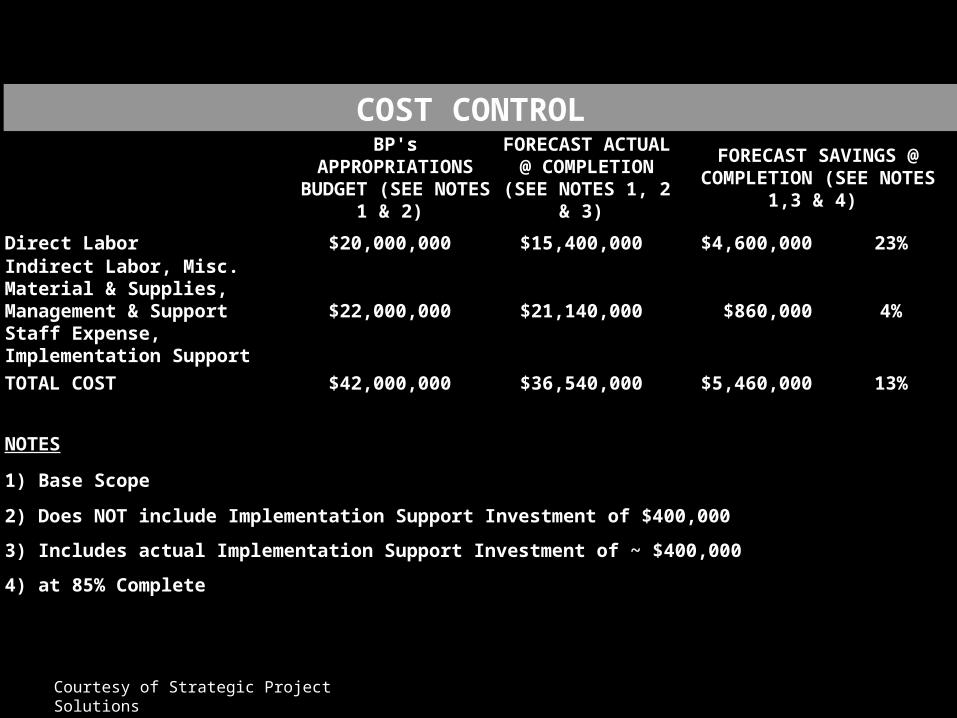
Courtesy of Strategic Project Solutions
COST CONTROL BP's
APPROPRIATIONS BUDGET (SEE NOTES
1 & 2)
FORECAST ACTUAL @
COMPLETION (SEE NOTES 1, 2 & 3)
FORECAST SAVINGS @ COMPLETION (SEE NOTES 1,3
& 4)
Direct Labor $20,000,000 $15,400,000 $4,600,000 23%
Indirect Labor, Misc. Material & Supplies, Management & Support Staff Expense, Implementation Support
$22,000,000 $21,140,000 $860,000 4%
TOTAL COST $42,000,000 $36,540,000 $5,460,000 13%
NOTES
1) Base Scope
2) Does NOT include Implementation Support Investment of $400,000
3) Includes actual Implementation Support Investment of ~ $400,000
4) at 85% Complete
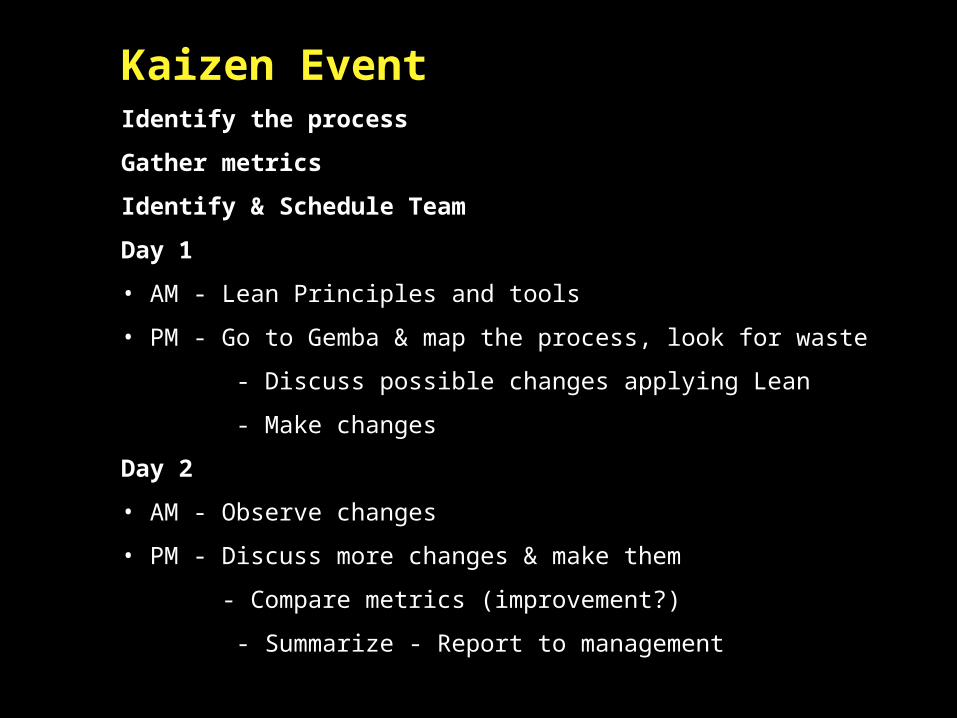
Kaizen EventIdentify the process
Gather metrics
Identify & Schedule Team
Day 1
• AM - Lean Principles and tools
• PM - Go to Gemba & map the process, look for waste
- Discuss possible changes applying Lean
- Make changes
Day 2
• AM - Observe changes
• PM - Discuss more changes & make them
- Compare metrics (improvement?)
- Summarize - Report to management
QuickTime™ and a decompressor
are needed to see this picture.
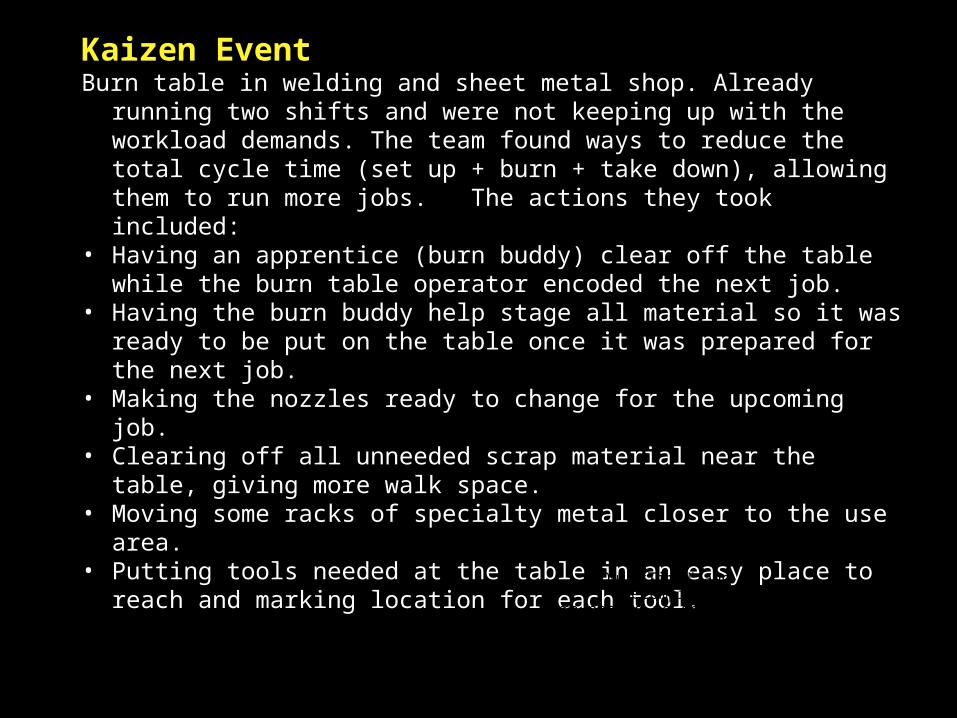
Kaizen Event - Burn table in welding and sheet metal shop. Already running two
shifts and were not keeping up with the workload demands. The team found ways to reduce the total cycle time (set up + burn + take down), allowing them to run more jobs. The actions they took included:
• Having an apprentice (burn buddy) clear off the table while the burn table operator encoded the next job.
• Having the burn buddy help stage all material so it was ready to be put on the table once it was prepared for the next job.
• Making the nozzles ready to change for the upcoming job.• Clearing off all unneeded scrap material near the table, giving
more walk space. • Moving some racks of specialty metal closer to the use area.• Putting tools needed at the table in an easy place to reach and
marking location for each tool.
QuickTime™ and a decompressor
are needed to see this picture.

Kaizen - Quick & EasyEveryone to come up with improvement ideas
that:• Makes the work safer, easier and work more
interesting• Improves skills and capabilities• Improves the work environment• Improves quality, customer services, schedule and
saves money
Employees are to implement the idea, write it down and share it with supervision and fellow employees.
Also, to look at the ideas others have implemented and to copy and use them where possible.

Kaizen - Quick & Easy
One construction company
405 employees
2005 - Zero Ideas
2006 - 11,000 Ideas Challenge >> 2 implemented ideas per
employee per month!
Everybody - Everyday 100 x1% better than 1x100%
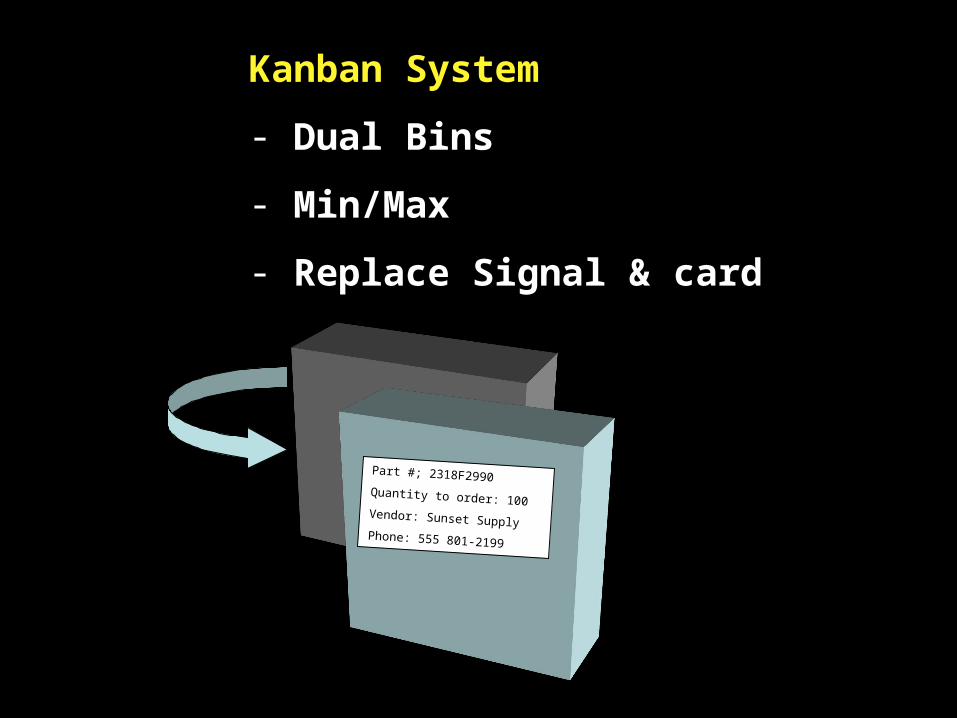
Kanban System
- Dual Bins
- Min/Max
- Replace Signal & card
Part #; 2318F2990Quantity to order: 100Vendor: Sunset SupplyPhone: 555 801-2199

Process Mapping/Analysis
Basic Lean Tools & Techniques
What you think your process looks like:
What the real process looks like:
What your Customer is willing to pay for (Value added)

Process Mapping/Value Analysis
Map the steps for a core process. Include all steps including ‘wait’ times
Do one product line at a time - rectangular straight/fittings
Measure distance traveled & cycle time
Categorize all steps into:
1) Value added
2) Non Value Added But Necessary
3) Non Value added & Not Necessary
Eliminate all #3’s and look for ways to improve #2’s by making the product flow; reduce set-up time & do 5S’s.

QuickTime™ and a decompressor
are needed to see this picture.
New Process - start with only value added steps (9 out of 200) - Only add back real “needed but non value added steps.
They reduced daily mobilization of trucks/vans in yard from 20 - 30 minutes to 5.

Lean in Construction
Contractors doing value stream analysis
Gained 9 hours a week in technician tool repair time
Reduced non-valued added steps in process by 4%
A mechanical contractor save $40,000 in one event.

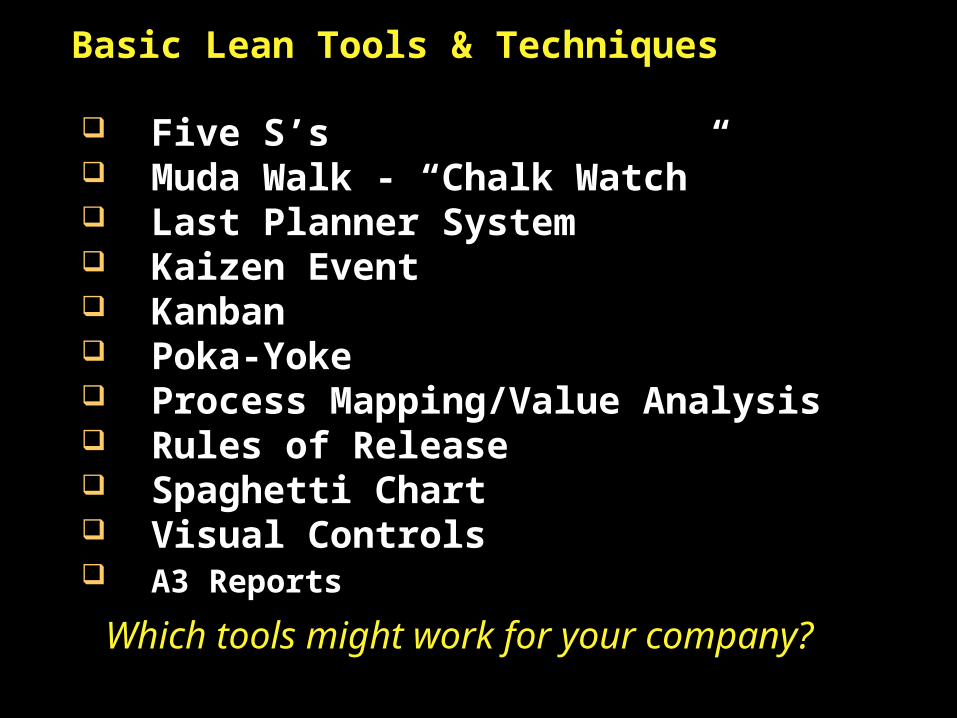
Five S’s Muda Walk - “Chalk Watch” Last Planner System Kaizen Event Kanban Poka-Yoke Process Mapping/Value Analysis Rules of Release Spaghetti Chart Visual Controls A3 Reports
Basic Lean Tools & Techniques

Use Rules of Release
Release Order to Fabricate
Kit/Fabricate/Assemble
Deliver Job To Site
Rules of Release Materials available - not necessarily on-hand but must be confident that will be on-hand when actually needed. Latest spool drawing revisionVerified need date in drawing trackerScheduled - resource loaded/ available. (Shop Supt.)Special equipment needs identified. (Shop Supt.)
Rules of Release Material assembled and packaged completedRelease from site (verified due date)Shop Checklist (Shop Supt.)All shipping information provided (Shop Supt.)Packing Slip completed (driver)
Basic Lean Tools & Techniques
QuickTime™ and a decompressor
are needed to see this picture.
Rules of Release for an Engineering Design Company
Source: Peter Dumont, P. E. Application of lean Principles to Improve Engineering Performance, LCI Congress, Oct. 2008

Observations – look for waste Use a spaghetti chart
Get Roomorder
Getbagel
Cut bagel
Toastbagel
Get butter & Cream Cheese
Get juice cup
Pourjuice
Get knife& napkins
Check order
DeliverTo room

StorageRack
SpiralDuct
machine
Table
Table
StorageRack
PlasmaCutter
StorageRack
Roller
SpotWelder
Swedge
Beader
Sealing &
Painting
Parts, odds & endsRack
Office & Files
Lay
Down
area
Lay
Down
area
Lay
Down
area
Lay
Down
area
Assemble & Spot weld
Lay
Down
area
Finished Duct Lay Down area
Spiral Fittings FlowStraight Spiral Flow
Finished Duct Lay Down area
D
E
L
I
V
E
R
Y
Loading to Trucks

QuickTime™ and a decompressor
are needed to see this picture.
Travel of People & things
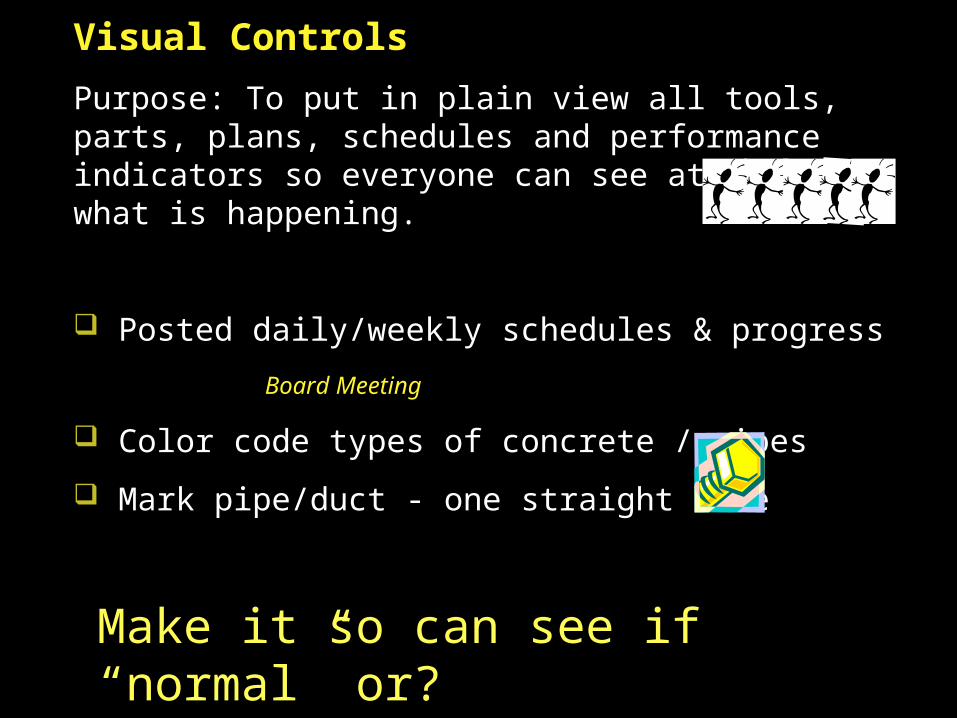
Visual Controls
Purpose: To put in plain view all tools, parts, plans, schedules and performance indicators so everyone can see at a glance what is happening.
Posted daily/weekly schedules & progress
Board Meeting
Color code types of concrete / pipes
Mark pipe/duct - one straight line
Make it so can see if “normal” or?
QuickTime™ and a decompressor
are needed to see this picture.
Job Schedule Board & % OTD Plus Employee Skills Match
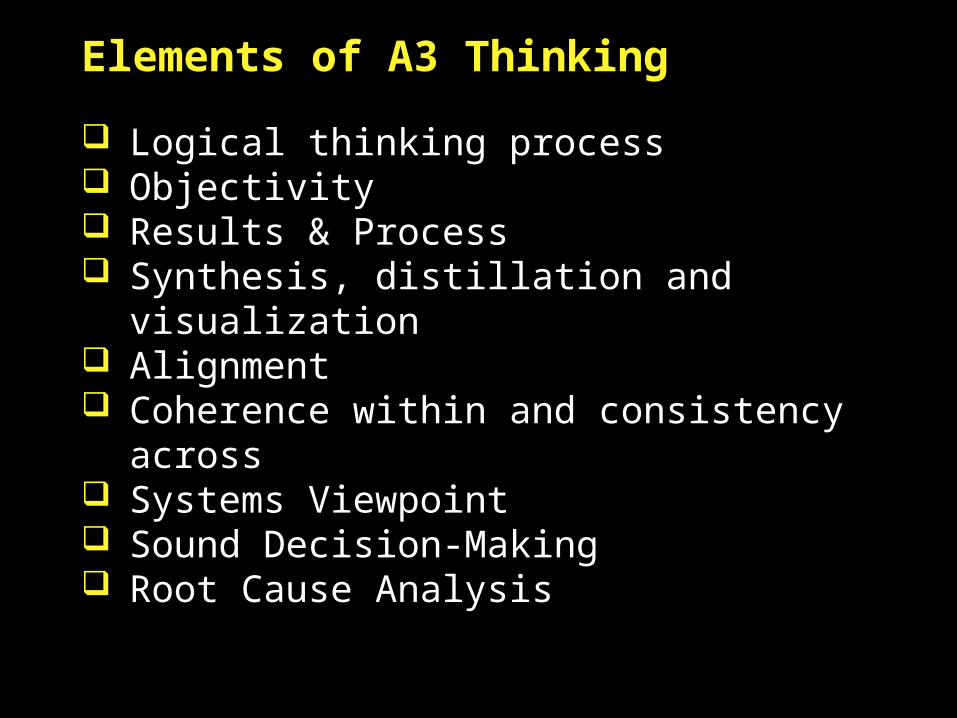
Elements of A3 Thinking
Logical thinking process Objectivity Results & Process Synthesis, distillation and visualization Alignment Coherence within and consistency across Systems Viewpoint Sound Decision-Making Root Cause Analysis

A3 Report Title and Description
Problem Definitionand Description
Problem Analysis
Implementation Plan
Results
Future Steps
Basic A3 Flow on 11 x 17 Paper

A3 Example - Major Decision
Five S’s Muda Walk - “Chalk Watch” Last Planner System Kaizen Event Kanban Poka-Yoke Process Mapping/Value Analysis Rules of Release Spaghetti Chart Visual Controls A3 Reports
Basic Lean Tools & Techniques
Which tools might work for your company?
Value vs.Waste
Pursue Perfection
Pathway to Lean
The Value Stream
FLOW
PULL
5S’s
LastPlanner

Advanced Lean Approaches
Target Value Design
Set based design
Lean & IPD
Lean & BIM

Target Value Design
Design is principally a social activity. -- Gregory Howell
Dick ThompsonStan Chiu
LCI Southern CaliforniaMay 18, 2009
The Big Questions for us
• What is Target Value Design?• How has it been applied?• What is the value to our industry
and our customers?
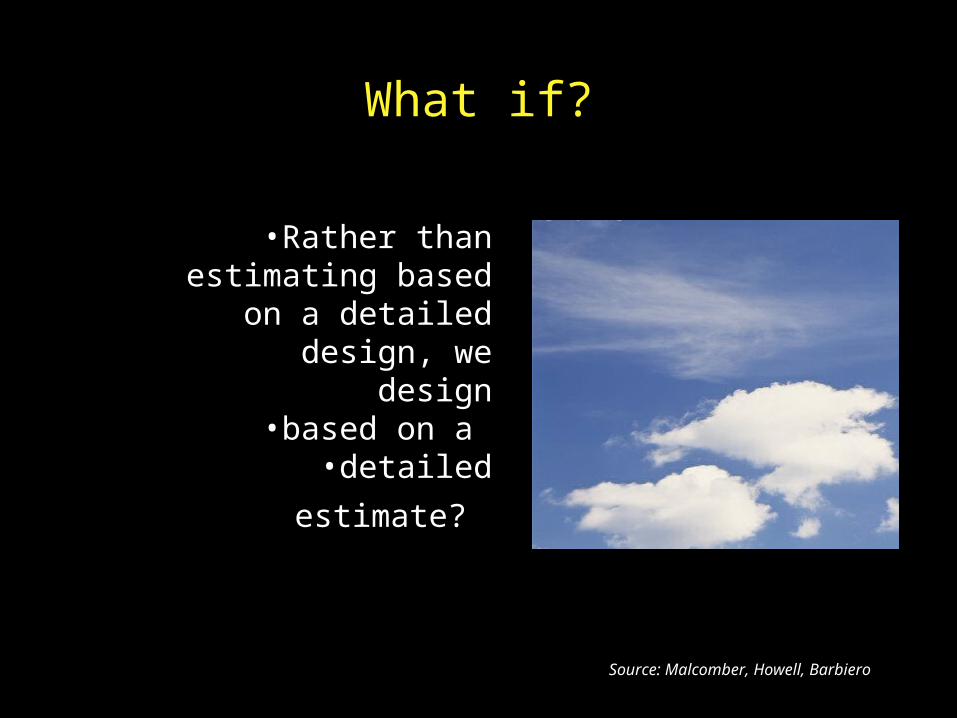
What if?
•Rather than estimating based
on a detailed design, we design
•based on a •detailed estimate?
Source: Malcomber, Howell, Barbiero

• Rather than evaluate the constructability of a design,
we design for what is constructable?
What if?
Source: Malcomber, Howell, Barbiero
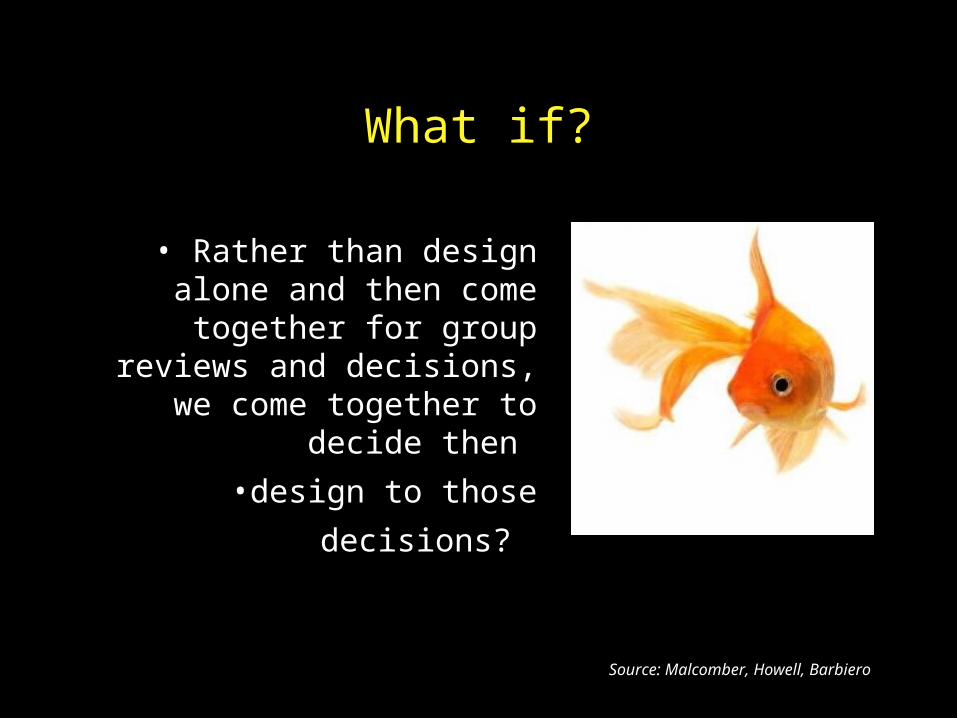
• Rather than design alone and then come together for group
reviews and decisions, we come together to decide then
•design to those decisions?
What if?
Source: Malcomber, Howell, Barbiero

• Rather than narrowing choices to proceed with design,
we carry solution sets far into the design
process?
What if?
Source: Malcomber, Howell, Barbiero

Traditional Project DeliveryLevel of Common Understanding
Comm
onU
nderstanding
CM/GC Hired
Major Trades Hired
Pre-Construction Services
Architect Hired
Engineers Hired
≤100%
SD DD CD
Construction
Source: Will Lichtig
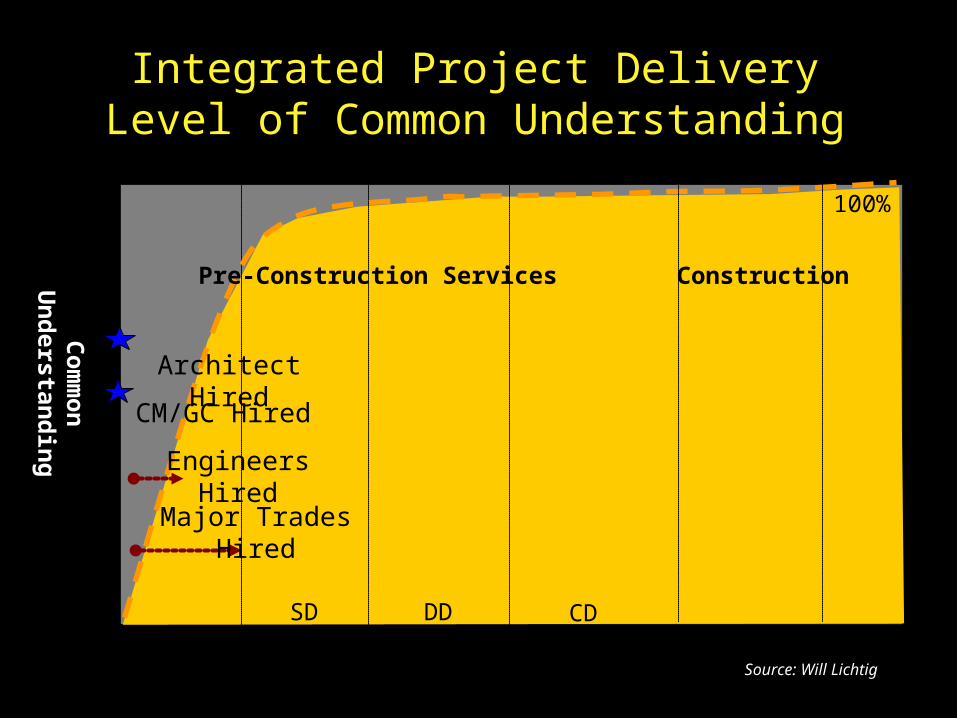
Integrated Project DeliveryLevel of Common Understanding
Time
Comm
onU
nderstanding
CM/GC Hired
SD DD CD
Construction
Architect Hired
Engineers Hired
100%
Major Trades Hired
Pre-Construction Services
Source: Will Lichtig
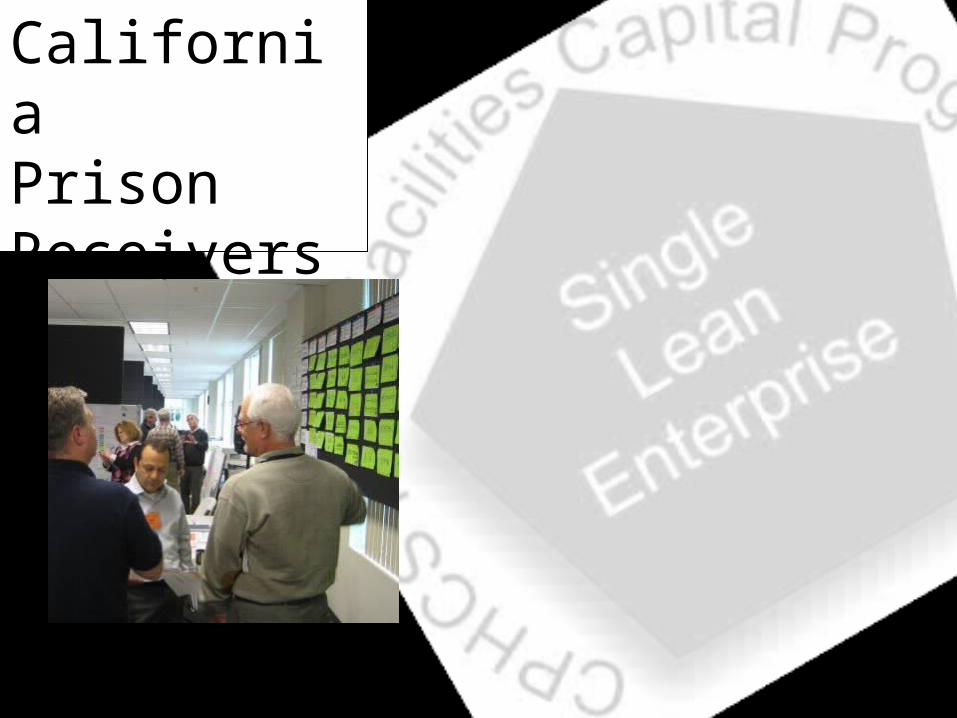
CaliforniaPrison Receivership
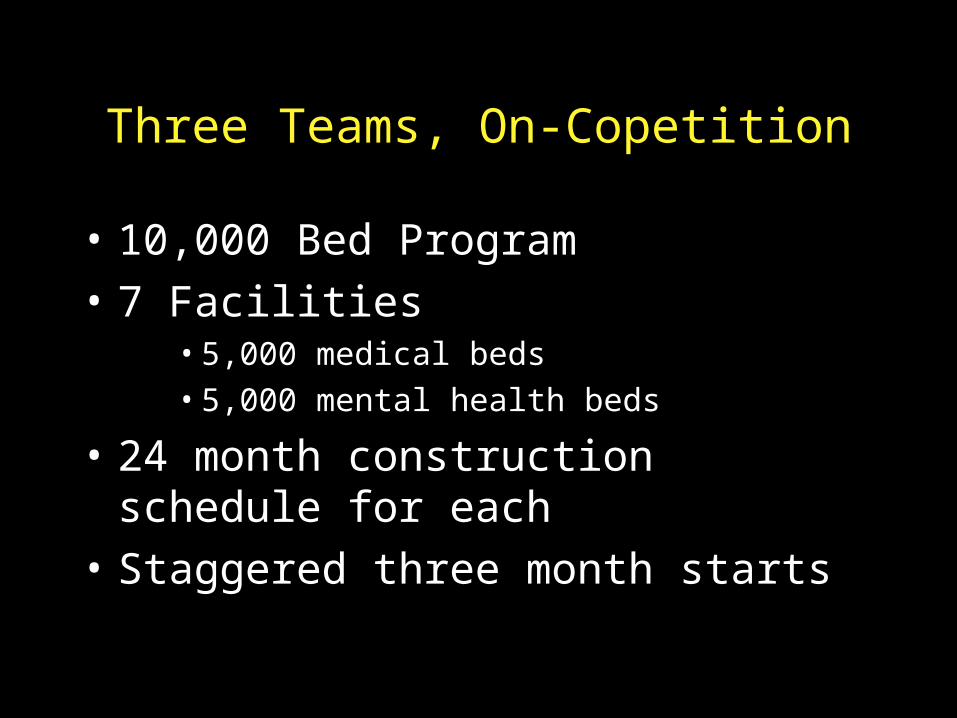
Three Teams, On-Copetition
• 10,000 Bed Program
• 7 Facilities• 5,000 medical beds• 5,000 mental health beds
• 24 month construction schedule for each
• Staggered three month starts
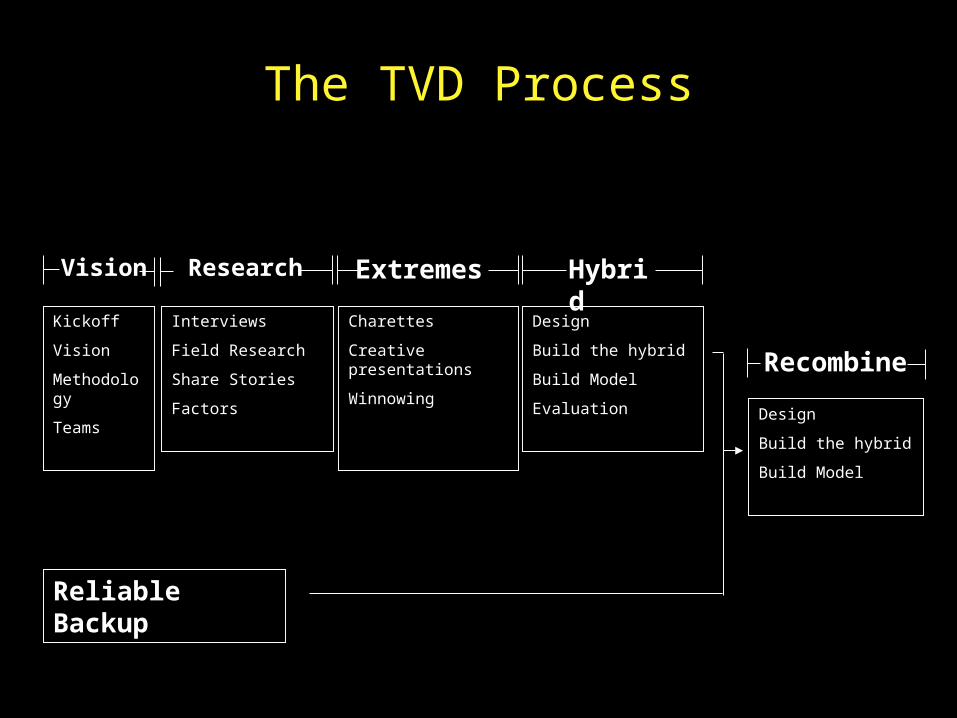
The TVD Process
Kickoff
Vision
Methodology
Teams
Interviews
Field Research
Share Stories
Factors
Charettes
Creative presentations
Winnowing
Design
Build the hybrid
Build Model
Evaluation
Vision Research HybridExtremes
Recombine
Design
Build the hybrid
Build Model
Reliable Backup
What are the Work Products?
Big Ideas Extreme SetsBalanced
Hybrid Selected Design
Kickoff
Vision
Methodology
Teams
Interviews
Field Research
Share Stories
Factors
Charettes
Creative presentations
Winnowing
Design
Build the hybrid
Build Model
Evaluation
Vision Research HybridExtremes
Recombine
Design
Build the hybrid
Build Model
Reliable Backup
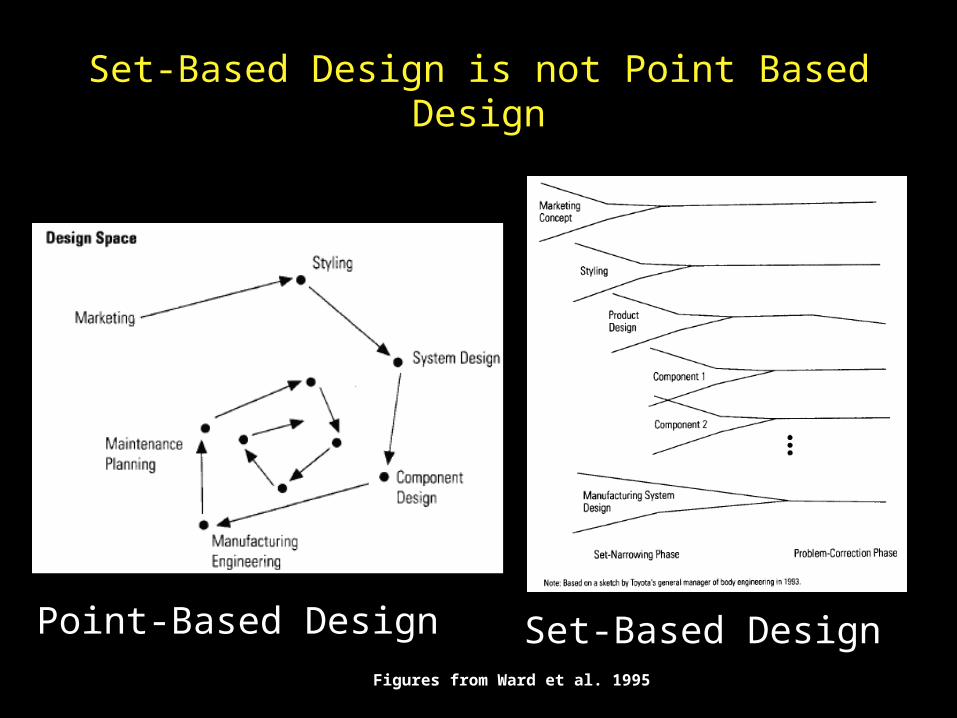
Set-Based Design is not Point Based Design
Point-Based Design Set-Based DesignFigures from Ward et al. 1995
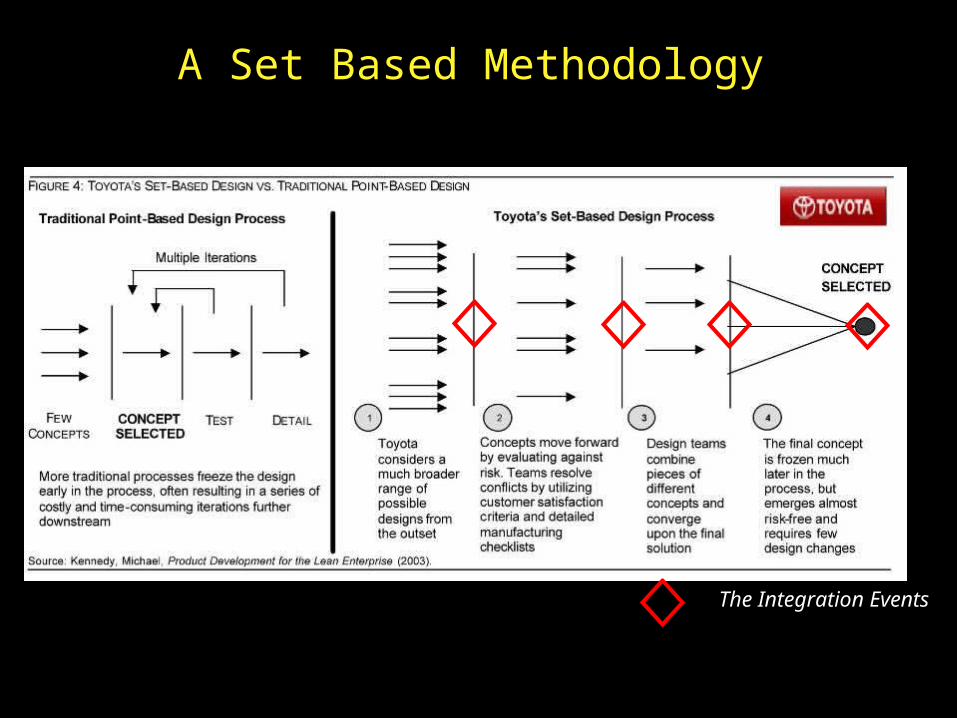
A Set Based Methodology
The Integration Events
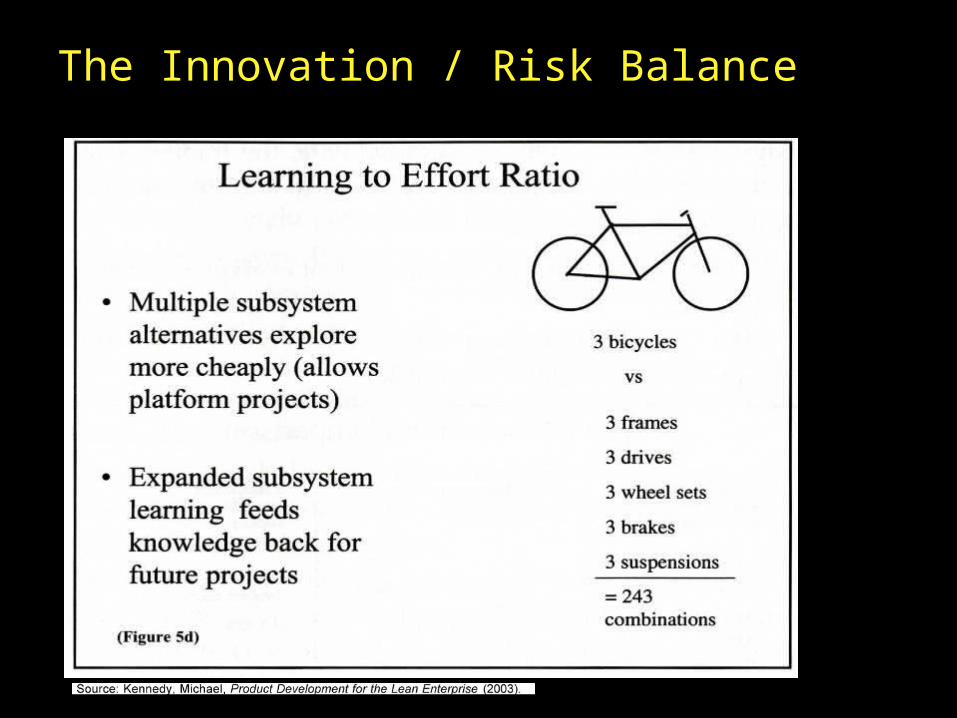
The Innovation / Risk Balance
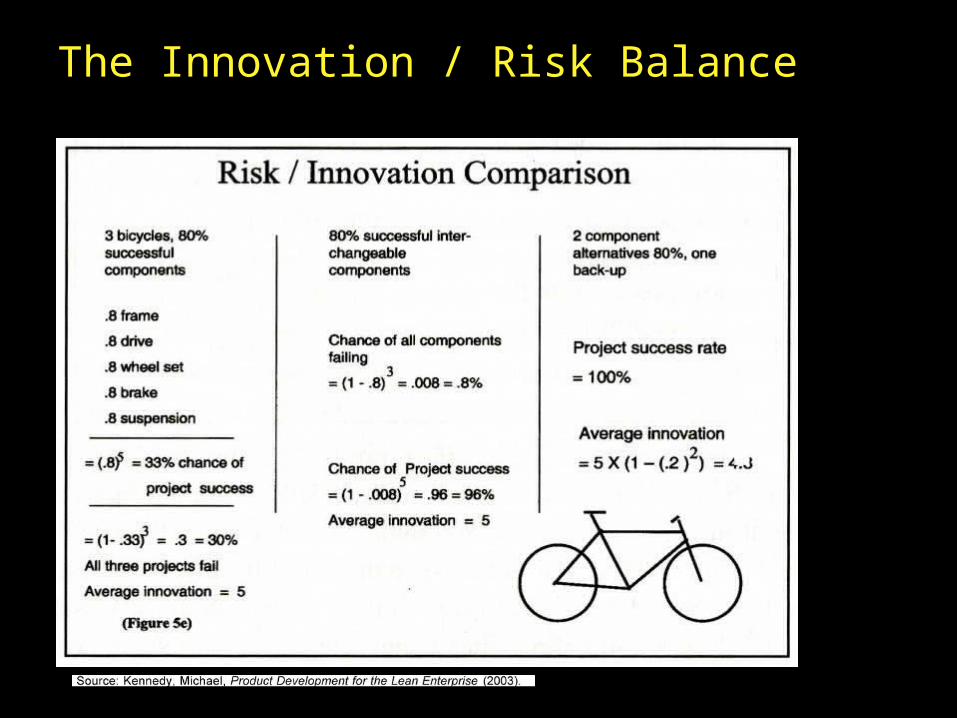
The Innovation / Risk Balance
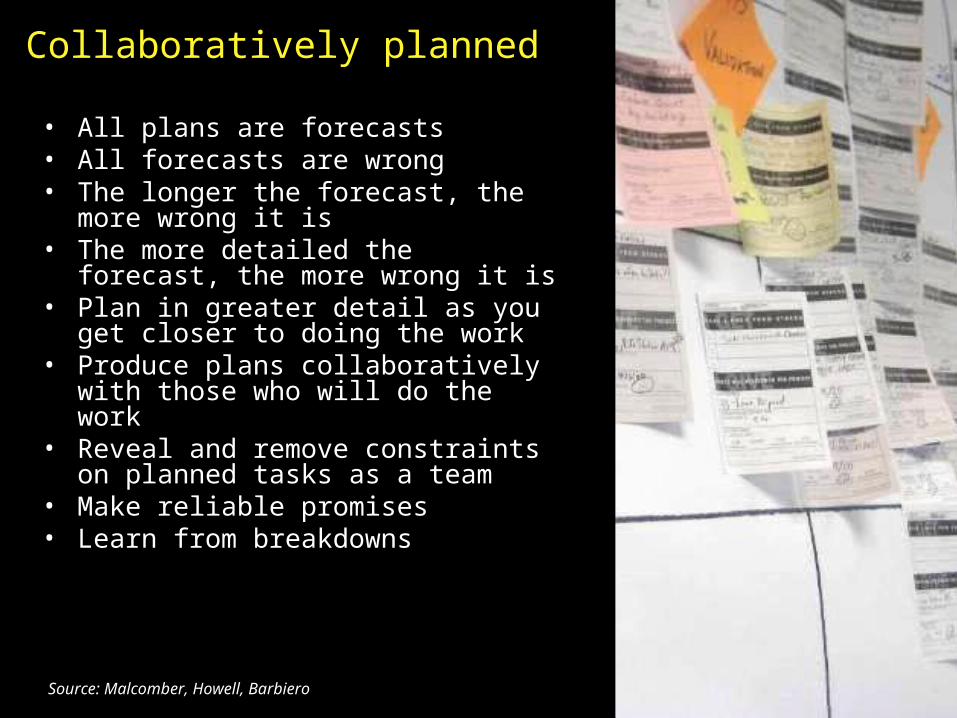
Collaboratively planned
• All plans are forecasts• All forecasts are wrong • The longer the forecast, the more
wrong it is• The more detailed the forecast, the
more wrong it is• Plan in greater detail as you get
closer to doing the work• Produce plans collaboratively with
those who will do the work• Reveal and remove constraints on
planned tasks as a team• Make reliable promises • Learn from breakdowns
Source: Malcomber, Howell, Barbiero
Conditions of Satisfaction
Profoundly Impact “Big 4” factors Through Synergistic
InnovationYet
Balance the FPS Core Values And Operational Principles
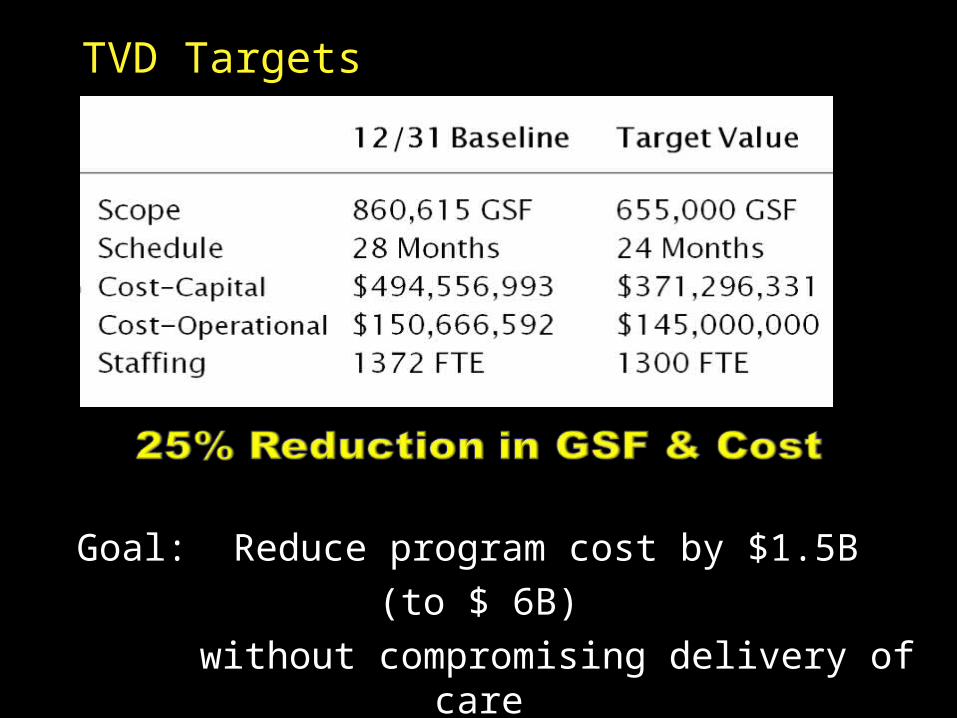
TVD Targets
Goal: Reduce program cost by $1.5B (to $ 6B)
without compromising delivery of care
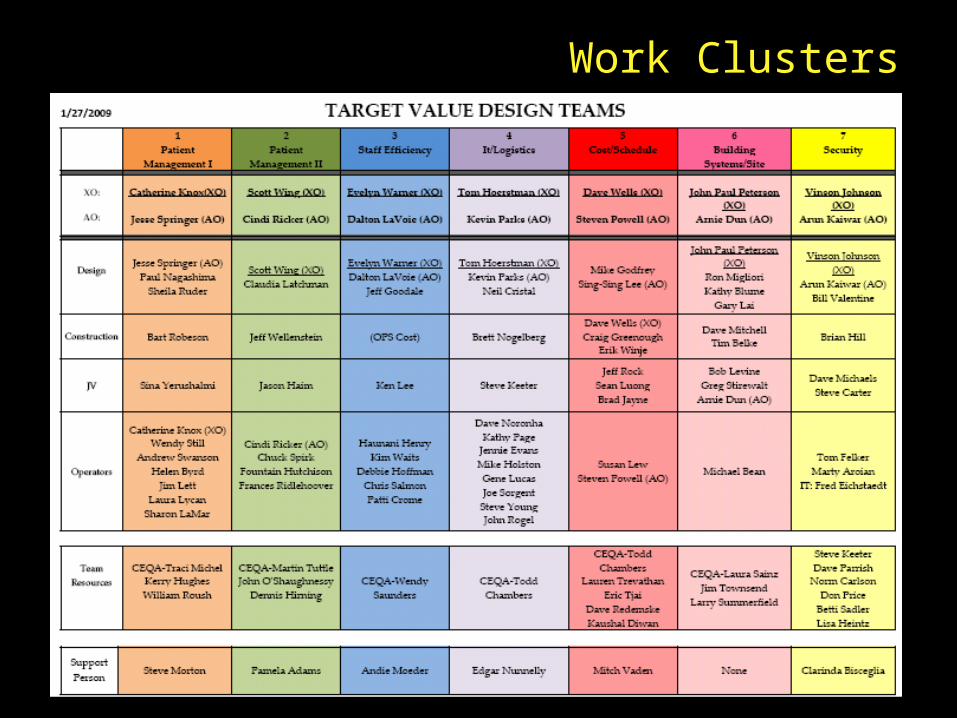
Work Clusters
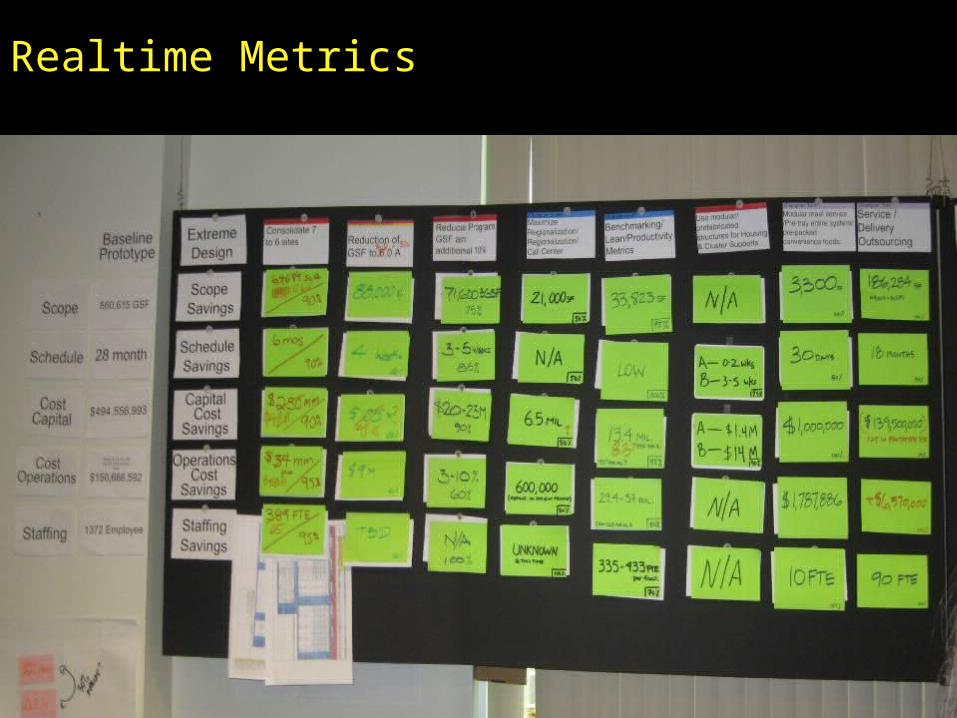
Realtime Metrics
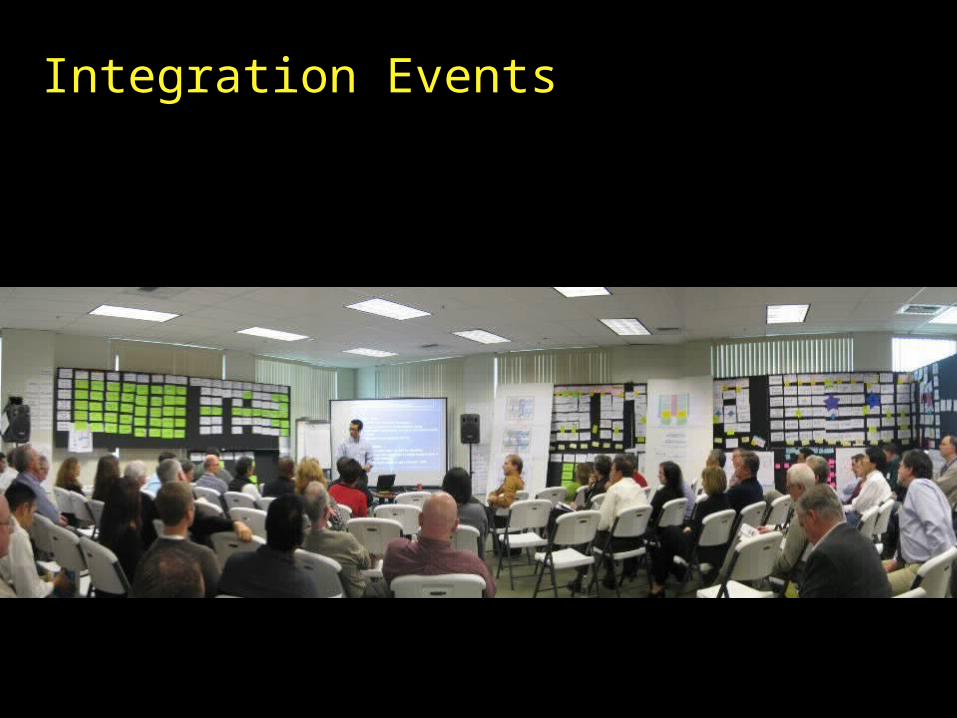
Integration Events
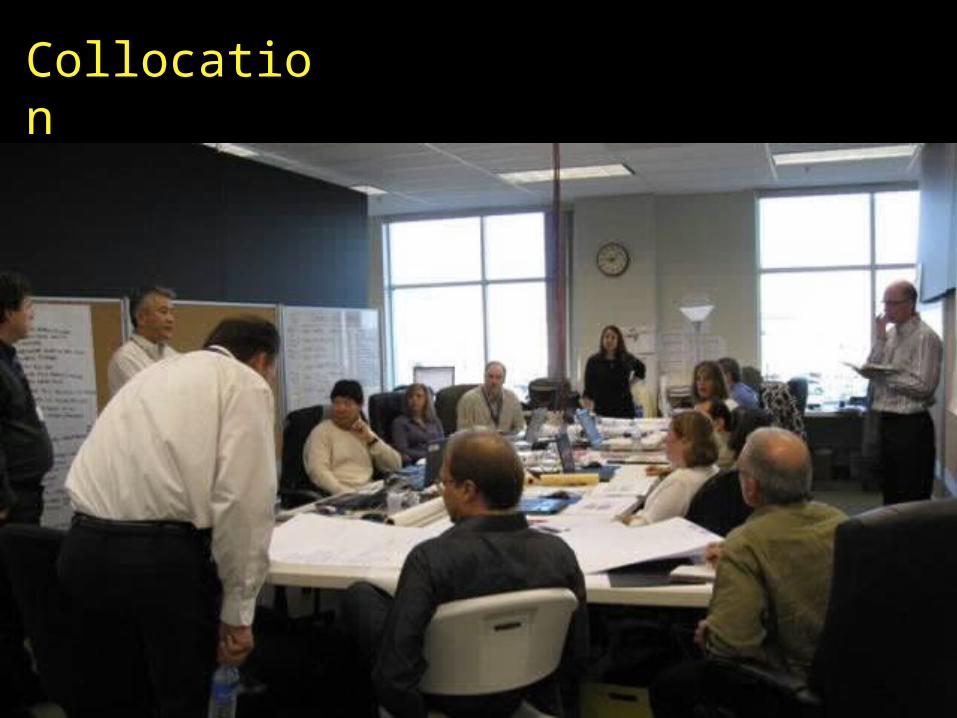
Collocation
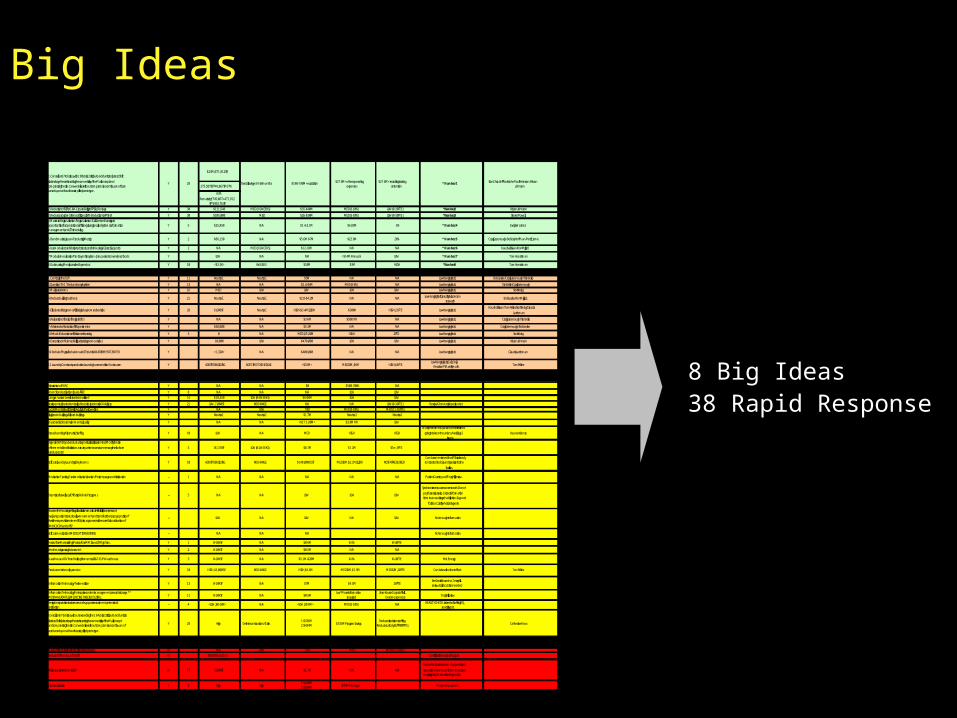
Big Ideas
8 Big Ideas38 Rapid Response
TARGET VALUE DESIGN BIG IDEAS Decision Y/N COUNT SCOPE SCHEDULE COST CAPITAL COST OPERATION STAFFING COMMENTS Assignments
$23M (471,912SF)
275,507SF/749,067SF = 37%
63% Remaining*749,067=471,912
SF*$493.76/SF2. Reduction of GSF to 6.0A - Create Facility to FPS Sq. Footage Y 30 $111,548 MED (3-5 WEEKS) $35-$40M MED (3-10%) LOW (0-10 FTE) * Number 2 Vinson Johnson
3. Reduce program GSF an additional 10%. Reduction to FPS 6.0 Y 30 $105,000 MED $26-$30M MED (3-10%) LOW (0-10 FTE) * Number 3 Steven Powell4. Maximize Regionalization/Regionalization/Call Center: Investigate opportunities for operational efficiency via regionalized systems, information management and JIT scheduling.
Y 5 $25,850 N/A $1.4-2.1M $6.85M 6% * Number 4 Evelyn Warner
5. Benchmarking/Lean/Productivity Metrics Y 2 $86,150 N/A $5.6M-$7M $22.8M 20% * Number 5 Craig Greenough/Debbie Hoffman/Patti Crome
6. Use modular/prefabricated structures for Housing & Cluster Supports Y 2 N/A MED (3-5 WEEKS) $12-18M N/A N/A * Number 6 Kaushal Diwan/Ron Migliori
7. Modular meal service/Pre-tray entire system/pre-packed convenience foods Y LOW N/A N/A <$14M/Annual> LOW * Number 7 Tom Hoerstman
8. Outsourcing: Meals provided by vendor. Y 10 <$3.3K> 6 WEEKS $10M $3M HIGH * Number 8 Tom Hoerstman
Rapid Response (#1 - 11)
1. Centralize the CUP. Y 11 Neutral Neutral $5M N/A N/A Low Hanging Fruit Bob Levine/Craig Greenough/Tim Belke
2. Question "N+1". Redundancy in system Y 13 N/A N/A $2.4-$4M MED (3-4%) N/A Low Hanging Fruit Tim Belke/Craig Greenough3. Multi-use rooms Y 16 MED LOW LOW LOW LOW Low Hanging Fruit Scott Wing
4. Reduce building hardness Y 21 Neutral Neutral $2.8-$4.2M N/A N/A Low Hanging Fruit, Security included on research
Bob Levine/Ron Migliori
5. Eliminate dining rooms/All dining in day rooms or bedside Y 28 6,600SF Neutral HIGH, $3.4 MILLION $300K HIGH, 21 FTE Low Hanging FruitKaushal Diwan/Tom Felker/Scott Wing/Claudia
Latchman
6. Relaxation of Basis of Design (BOD) Y N/A N/A $3-6M $50K/YR N/A Low Hanging Fruit Craig Greenough/Tim Belke
7. Achieve a better ratio of SF to perimeter Y $40,000 N/A $5.3M N/A N/A Low Hanging Fruit Craig Greenough/Bob Levine
8. Rehab: Education self/distance learning Y 3 0 N/A MED, $5-20M HIGH 2 FTE Low Hanging Fruit Scott Wing
9. Executive conference facilities (training room outside) Y 10,000 LOW $470,000 LOW LOW Low Hanging Fruit Vinson Johnson
10. Rehab/Physical Rehab move KIT to Unit - NOURISHMENT CENTER Y <1,320> N/A $400,000 N/A N/A Low Hanging Fruit Claudia Latchman
11. Laundry - Construct production Laundry, base condition" outsource. Y ADD SF TO BUILDING ADD TIME TO SCHEDULE <$16M> MEDIUM, $6M HIGH, 64 FTELow Hanging Fruit (Calc. Only)
Recalc on PIA, verify math. Tom Felker
PENDING RESEARCH AND ANALYSIS
Hybrization of HVAC Y N/A N/A $0 $500-700K N/A
Room Standardization/Space/FF&E Y 8 N/A N/A N/A LOW LOWCan gymnasium be eliminated on all sites? Y 14 $18,450 LOW (0-2 WEEKS) $6-$8M LOW LOW
Service center located centralized to optimize robotic AGV delivery Y 21 LOW, 7,000 SF NO CHANGE N/A N/A LOW (0-10 FTE) Review A3 on outside perimeterLocate Mental Health & High Acuity to their own sites Y N/A LOW TBD MED (3-10%) MED (11-35 FTE)Single room buildings/All dorm buildings Y Neutral Neutral $1.7M Neutral Neutral
Improved indoor environmental quality Y N/A N/A <$17.1-20M> $3.8M/YR LOW
Broadbanding/Alternative Staffing Y 10 LOW N/A MED HIGH HIGHWork performed by unions. Receiver is not
going to take on the unions. Avoid legal issues.
Haunani Henry
Organize D&T into procedure, diagnostic, clinic/clinical centers. Modify the size of the mental health clinic to maximize patient access to necessary levels of care & reduce costs?
Y 5 18,178SF LOW (0-2 WEEKS) $8.7M $1.3M $1m, 9FTE
Self Care laundry - Laundry in Day Rooms Y 10 ADD SF TO BUILDING NO CHANGE $140,000 COST MEDIUM, $2.1 MILLION NO STAFF REQUIREDCambra mentioned that PIA is already
contracted to do laundry service for the facilities.
Medication Tracking: Track medication location/Patient usage and distribution -- 1 N/A N/A N/A N/A N/A Patient Care impact? Terry Hill Review.
Incentives for wellness/Effective Rehab Programs -- 5 N/A N/A LOW LOW LOW
Synchronize resources on research. Do not pay for services twice. Extract information from team working rehabilitation. Support
for idea: Clarify who is doing work.
How can the housing setting allow clinicians maximize flexibility to assess and evaluate patient status to allow movement and transfers that are supportive of their therapeutic treatment? Of primary concern is the careful coordination of DMH/CDCR handoffs?
-- LOW N/A LOW N/A LOW Not enough information
Self Care medications - MEDICATION VENDING -- N/A N/A N/A Not enough informationRFID Asset Tracking/Inventory & equipment locator. Y 1 0-10K SF N/A $0-5M 0-3% 0-10 FTE See David NoronhaPoint of Use Material Mgt/Point of Use MMIS and JIT Mgt. Plan. Y 1 0-10K SF N/A $0-5M 0-3% 0-10 FTE
Benchmark grossing factor vs. net Y 2 0-10K SF N/A $0-5M N/A N/A
Warehouse: AGV "tote" delivery from central D&T/CUP/Warehouse Y 3 0-10K SF N/A $5.1M-$20M 0-3% 0-10 FTE Min. Energy
Produce entrée only by vendor Y 10 HIGH, 43,000 S.F. NO CHANGE HIGH, $4.6M MEDIUM, $1.9M MEDIUM, 20 FTE Combine with other effort. Tom Felker
Information Technology - Telemedicine Y 13 0-10K SF N/A $7M $4.5M 20 FTESee David Noronha, Terry Hill review/collaboration needed
Information Technology/Enterprise content management, records storage. ** MUST HAVE FOR TELEMEDICINE TO BE SUCCESSFUL. Y 11 0-10K SF N/A $0-5M
Low* More information required
Zero - SourceCorp staff will become scanners Terry Hill review
Design best practices to increase and support recruitment, retention & satisfaction.
-- 4 <LOW, $0-10K> N/A <LOW, $0-5M> MED (3-10%) N/A REALITY CHECK: Linked to Staffing IEQ, reactivity cost.
Consolidate 7 to 6 sites, without exceeding the 1:64 ratio. Distribute/add units to clusters. Shift clusters together reiterating the connectivity of the Mall concept and compressing the site. Can we deliver without compromise a continuum of care based upon a focus for a simplified prototype.
Y 28 High Delete construction of 1 site.1: $336M 2: $434M $335M Program Savings
Reduce site driven staffing. Reduce custody staff 400 FTEs. Catherine Knox
BIG IDEAS DROPPED FROM CONSIDERATION
Make a High Acuity site with traditional bed tower N N/A LOW TBD MED MED (11-35 FTE)Reduce EOP bed count by 600 N $90,000/per bed Conflicts with Receiver's Program
Minimize private rooms in SGP. N 17 3,000SF N/A $1.7M N/A N/AReduce % of private rooms. Support direct supervisions. Number of rooms that drop. Analysis get to 25 - what is safety analysis.
Create a twin site Y 3 High High1: $260M 2: $530M $37M Prototype May be resource ted.
$27.8M + other operating expenses
$27.8M + recruiting training retention
Stan Chiu/Jeff Rock/John Paul Peterson/Vinson Johnson
* Number 1$180-190M + escalation
EXTREME VALUE DESIGN (#1 - 8)
1. Consolidate 7 to 6 sites, with 1:80 ratio. Distribute/add units to clusters. Shift clusters together reiterating the connectivity of the Mall concept and compressing the site. Can we deliver without compromise a continuum of care based upon a focus for a simplified prototype.
Y 28 Overall Savings = 24-30 months
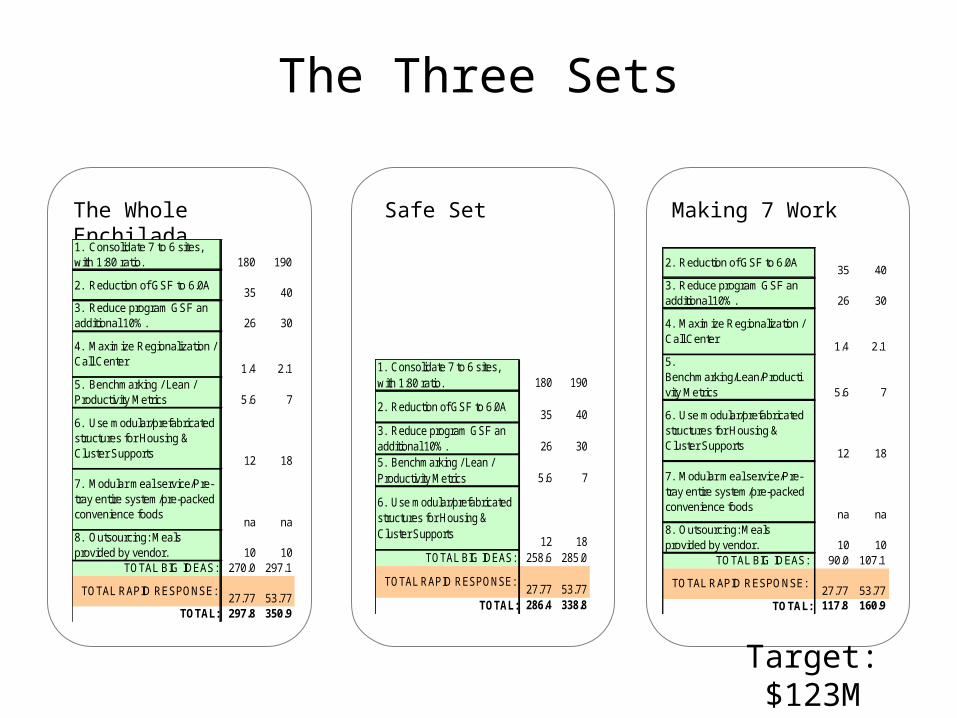
The Three Sets
The Whole Enchilada Safe Set Making 7 Work
1. Consolidate 7 to 6 sites, with 1:80 ratio. 180 190
2. Reduction of GSF to 6.0A35 40
3. Reduce program GSF an additional 10%. 26 30
4. Maximize Regionalization / Call Center
1.4 2.15. Benchmarking / Lean / Productivity Metrics 5.6 7
6. Use modular/prefabricated structures for Housing & Cluster Supports
12 18
7. Modular meal service/Pre-tray entire system/pre-packed convenience foods
na na8. Outsourcing: Meals provided by vendor. 10 10
TOTAL BIG IDEAS: 270.0 297.1
TOTAL RAPID RESPONSE:27.77 53.77
TOTAL: 297.8 350.9
1. Consolidate 7 to 6 sites, with 1:80 ratio. 180 190
2. Reduction of GSF to 6.0A35 40
3. Reduce program GSF an additional 10%. 26 305. Benchmarking / Lean / Productivity Metrics 5.6 7
6. Use modular/prefabricated structures for Housing & Cluster Supports
12 18TOTAL BIG IDEAS: 258.6 285.0
TOTAL RAPID RESPONSE:27.77 53.77
TOTAL: 286.4 338.8
2. Reduction of GSF to 6.0A35 40
3. Reduce program GSF an additional 10%. 26 30
4. Maximize Regionalization / Call Center
1.4 2.15. Benchmarking/Lean/Productivity Metrics 5.6 7
6. Use modular/prefabricated structures for Housing & Cluster Supports
12 18
7. Modular meal service/Pre-tray entire system/pre-packed convenience foods
na na8. Outsourcing: Meals provided by vendor. 10 10
TOTAL BIG IDEAS: 90.0 107.1
TOTAL RAPID RESPONSE:27.77 53.77
TOTAL: 117.8 160.9
Target: $123M
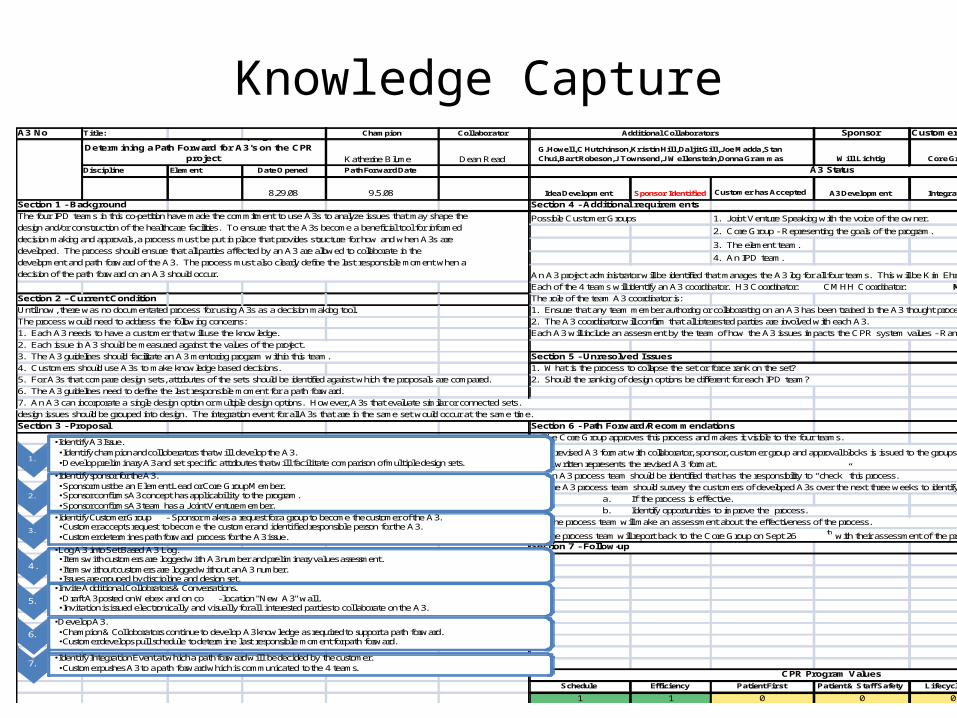
Knowledge CaptureA3 No Title: Champion Collaborator Sponsor Custome r Group
Katherine Blume Dean Read Will Lichtig Core Group
Discipline Element Date Opened Path Forward Date
8.29.08 9.5.08 Idea Development Sponsor Identified Customer has Accepted A3 Development Integration
Se ction 1 - Background Se ction 4 - Additional re quire me nts
Possible Customer Groups 1. Joint Venture Speaking with the voice of the owner.
2. Core Group - Representing the goals of the program.
3. The element team.
4. An IPD team.
An A3 project administrator will be identified that manages the A3 log for all four teams. This will be Kim Ehresman from DPR
Each of the 4 teams will identify an A3 coordinator. H3 Coordinator: CMHH Coordinator: M. Jackson DPR Coordinator: K. Blume
Se ction 2 - Curre nt Condition The role of the team A3 coordinator is:
Until now, there was no documentated process for using A3s as a decision making tool. 1. Ensure that any team member authoring or collaborating on an A3 has been trained in the A3 thought process.
The process would need to address the following concerns: 2. The A3 coordinator will confirm that all interested parties are involved with each A3.
1. Each A3 needs to have a customer that will use the knowledge. Each A3 will include an assesment by the team of how the A3 issues impacts the CPR system values - Ranking will be -1, 0 or +1.
2. Each issue in A3 should be measured against the values of the project.
3. The A3 guidelines should facilitate an A3 mentoring program within this team. Se ction 5 - Unre solve d Issue s
4. Customers should use A3s to make knowledge based decisions. 1. What is the process to collapse the set or force rank on the set?
5. For A3s that compare design sets, attributes of the sets should be identified against which the proposals are compared. 2. Should the ranking of design options be different for each IPD team?
6. The A3 guidelines need to define the last responsible moment for a path forward.
7. An A3 can incorporate a single design option or multiple design options. However, A3s that evaluate similar or connected sets.
design issues should be grouped into design. The integration event for all A3s that are in the same set would occur at the same time.
Se ction 3 - Proposal Se ction 6 - Path Forward/Re comme ndations
1. The Core Group approves this process and makes it visible to the four teams.
3. An A3 process team should be identified that has the responsibility to “check” this process.
4. The A3 process team should survey the customers of developed A3s over the next three weeks to identify:
a. If the process is effective.
b. Identify opportunities to improve the process.
5. The process team will make an assessment about the effectiveness of the process.
6. The process team will report back to the Core Group on Sept 26th
with their assessment of the process. Se ction 7 - Follow-up
Schedule Efficiency Patient Firs t Patient & Staff Safety Lifecycle cost
1 1 0 0 0
Additional Collaborators
G. Howell, C Hutchinson, Kris tin Hill, Daljit Gill, Joe Madda, Stan Chui, Bart Robeson, J Townsend, J Wellenstein, Donna Grammas
CPR Program Value s
Guide to Ge ne rating, De ve loping, and
De te rmining a Path Forward for A3's on the CPR proje ct
The four IPD teams in this co-petition have made the commitment to use A3s to analyze issues that may shape the
design and/or construction of the healthcare facilities. To ensure that the A3s become a beneficial tool for informed
decision making and approvals, a process must be put in place that provides structure for how and when A3s are
developed. The process should ensure that all parties affected by an A3 are allowed to collaborate in the
development and path forward of the A3. The process must also clearly define the last responsible moment when a
decision of the path forward on an A3 should occur.
2. A revised A3 format with collaborator, sponsor, customer group and approval blocks is issued to the groups. The format on which this
A3 is written represents the revised A3 format.
A3 Status
1.
•Identify A 3 Issue.•Identify champion and colloberators that will develop the A 3.•Develop preliminary A 3 and set specific attributes that will facilitate comparison of multiple design sets.
2.
•Identify sponsor for the A 3. •Sponsor must be an Element L ead or Core Group Member.•Sponsor confirms A 3 concept has applicability to the program.•Sponsor confirms A 3 team has a Joint V enture member.
3.
•Identify Customer Group - Sponsor makes a request for a group to become the customer of the A 3.•Customer accepts request to become the customer and identified responsible person for the A 3.•Customer determines path forward process for the A 3 issue.
4.
•L og A 3 into Set Based A 3 L og.•Items with customers are logged with A 3 number and preliminary values assessment.•Items without customers are logged without an A 3 number.•Issues are grouped by discipline and design set.
5.
•Invite A dditional Collobrators & Conversations.•Draft A 3 posted on Webex and on co - location "New A 3" wall.•Invitation is issued electronically and visually for all interested parties to collaborate on the A 3.
6.
•Develop A 3. •Champion & Colloborators continue to develop A 3 knowledge as required to support a path forward.•Customer develops pull schedule to determine last responsible moment for path forward.
7.•Identify Integration Event at which a path forward will be decided by the customer.•Customer pushes A 3 to a path forward which is communicated to the 4 teams.

• Decisions must be made based up on the importance of advantages
• A disadvantage to one alternative is an advantage to alternative option
• For every dollar spent we need to identify that advantages that the money gets the project
CBA: Value based decisions
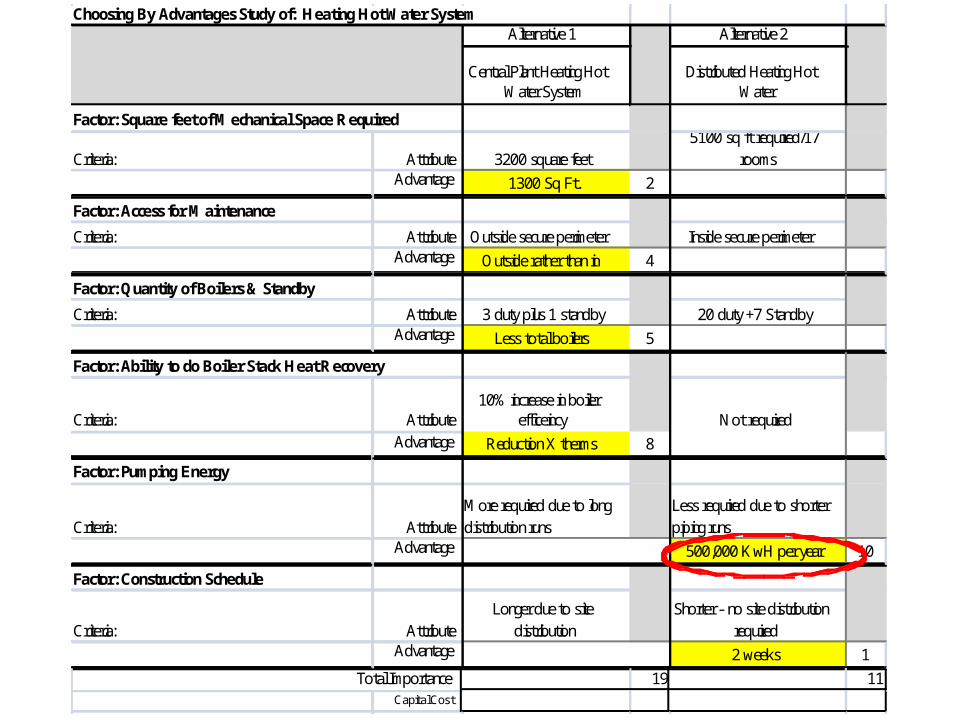
Choosing By Advantages Study of: Heating Hot Water SystemAlternative 1 Alternative 2
Central Plant Heating Hot Water System
Distributed Heating Hot Water
Factor: Square feet of Mechanical Space Required
Criteria: Attribute 3200 square feet5100 sq ft required/17
roomsAdvantage 1300 Sq Ft. 2
Factor: Access for Maintenance
Criteria: Attribute Outside secure perimeter Inside secure perimeterAdvantage Outside rather than in 4
Factor: Quantity of Boilers & Standby
Criteria: Attribute 3 duty plus 1 standby 20 duty +7 StandbyAdvantage Less total boilers 5
Factor: Ability to do Boiler Stack Heat Recovery
Criteria: Attribute10% increase in boiler
efficeincy Not requiredAdvantage Reduction X therms 8
Factor: Pumping Energy
Criteria: AttributeMore required due to long distribution runs
Less required due to shorter piping runs
Advantage 500,000 KwH per year 10
Factor: Construction Schedule
Criteria: AttributeLonger due to site
distributionShorter - no site distribution
requiredAdvantage 2 weeks 1
Total Importance 19 11Capital Cos t
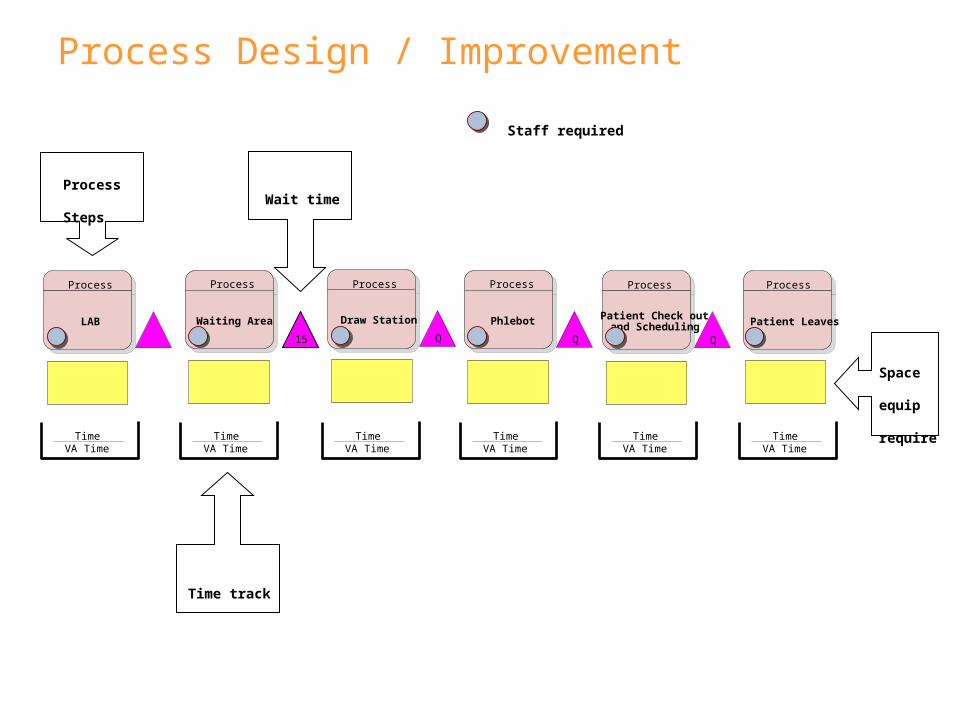
LAB
Process
15
Waiting Area
Process
Q
Patient Check out and Scheduling
Process
Q
Phlebot
Process
Q
Draw Station
Process
Patient Leaves
Process
Process
StepsWait time
TimeVA Time
TimeVA Time
TimeVA Time
TimeVA Time
TimeVA Time
TimeVA Time
Time track
Space
equip
require
Staff required
Process Design / Improvement
Day before patient gets schedule
Process
Patient leaves housing unit
Process
Q
Travel Time
Process
Q
Patient arrives at reception
Process
PMU
Process
Q
See other VSM
Process
Time
VA Time
Time
VA Time
Time
VA Time
Time
VA Time
Time
VA Time
Time
VA Time
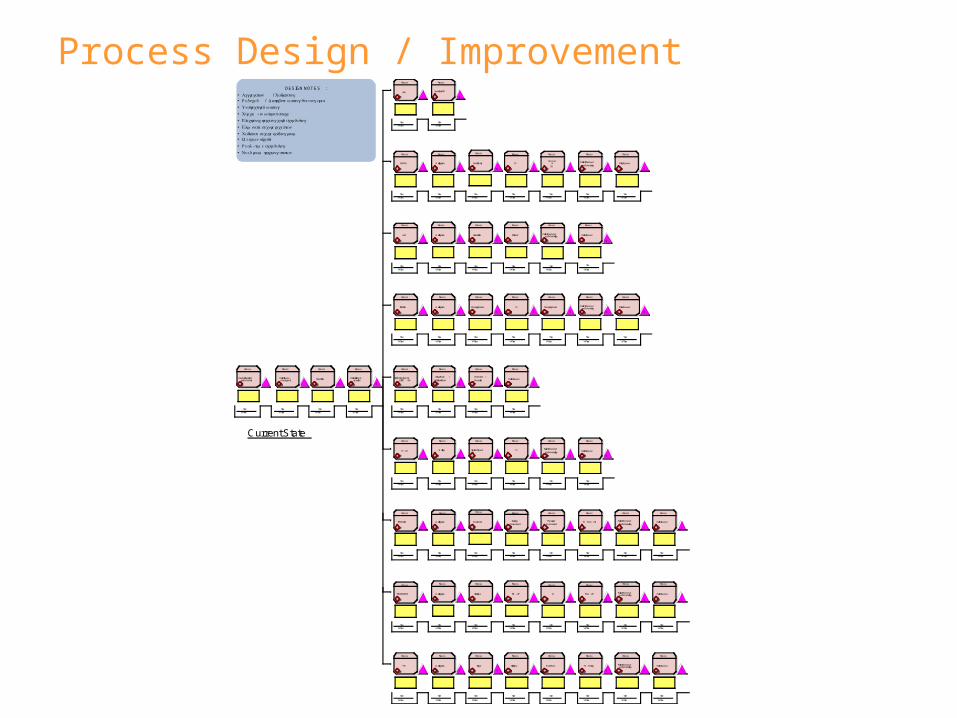
Current State
DENTAL
Process
Q
Waiting Area
Process
Q
Recover &
ED
Process
Q
TX
Process
Q
Dental Chair
Process
Time
VA Time
Time
VA Time
Time
VA Time
Time
VA Time
Time
VA Time
Time
VA Time
LAB
Process
Q
Waiting Area
Process
Q
Patient Check out and Scheduling
Process
Q
Phlebot
Process
Q
Draw Station
Process
Time
VA Time
Time
VA Time
Time
VA Time
Time
VA Time
Time
VA Time
IMAGING
Process
Q
Waiting Area
Process
Q
Changing Rooms
Process
Q
TX
Process
Q
Changing Rooms
Process
Time
VA Time
Time
VA Time
Time
VA Time
Time
VA Time
Time
VA Time
MENTHAL HEALTH CLINIC / SA
Process
Q
Group Room /
Individual Room
Process
Q
Patient Leaves
Process
Q
Check Out /
Reception
Process
Time
VA Time
Time
VA Time
Time
VA Time
Time
VA Time
PT / OT
Process
Q
Waiting
Process
Q
Patient Check out
and Scheduling
Process
Q
TX
Process
Q
Treatment Space
Process
Time
VA Time
Time
VA Time
Time
VA Time
Time
VA Time
Time
VA Time
MED CLINIC
Process
Q
Waiting Area
Process
Q
Physician
Assessment
Process
Q
Nursing
Assessment
Process
Q
Exam Room
Process
Time
VA Time
Time
VA Time
Time
VA Time
Time
VA Time
Time
VA Time
PROCEDURES
Process
Q
Waiting Area
Process
Q
TX
Process
Q
Pre - OP
Process
Q
Vital Signs
Process
Time
VA Time
Time
VA Time
Time
VA Time
Time
VA Time
Time
VA Time
TTC
Process
Q
Waiting Area
Process
Q
Exam Room
Process
Q
Vital Signs
Process
Q
Triage
Process
Time
VA Time
Time
VA Time
Time
VA Time
Time
VA Time
Time
VA Time
Q
Patient Check out
and Scheduling
Process
Q
Patient Check out and Scheduling
Process
Time
VA Time
Q
Patient Leaves
Process
Time
VA Time
Time
VA Time
Q
Patient Leaves
Process
Q
Patient Leaves
Process
Time
VA Time
Q
Patient Leaves
Process
Time
VA Time
Q
TX , Test , Etc
Process
Time
VA Time
Q
Patient Check out
and Scheduling
Process
Time
VA Time
Q
Patient Leaves
Process
Time
VA Time
Q
Post - OP
Process
Time
VA Time
Q
Patient Check out and Scheduling
Process
Time
VA Time
Q
Patient Leaves
Process
Time
VA Time
Q
TX - Testing
Process
Time
VA Time
Q
Patient Check out and Scheduling
Process
Time
VA Time
Q
Patient Leaves
Process
Time
VA Time
DESIGN NOT ES :
• Aggregation / Collapsing• Reduced / Distribute waiting queuing area
• Unstructured waiting
• Check - in without space
• Electronic tracking card scheduling
• Eliminate secure reception
• Collapse secure holding room• Weigh in alcove
• Real - time scheduling
• Need room tracking station
Process Design / Improvement
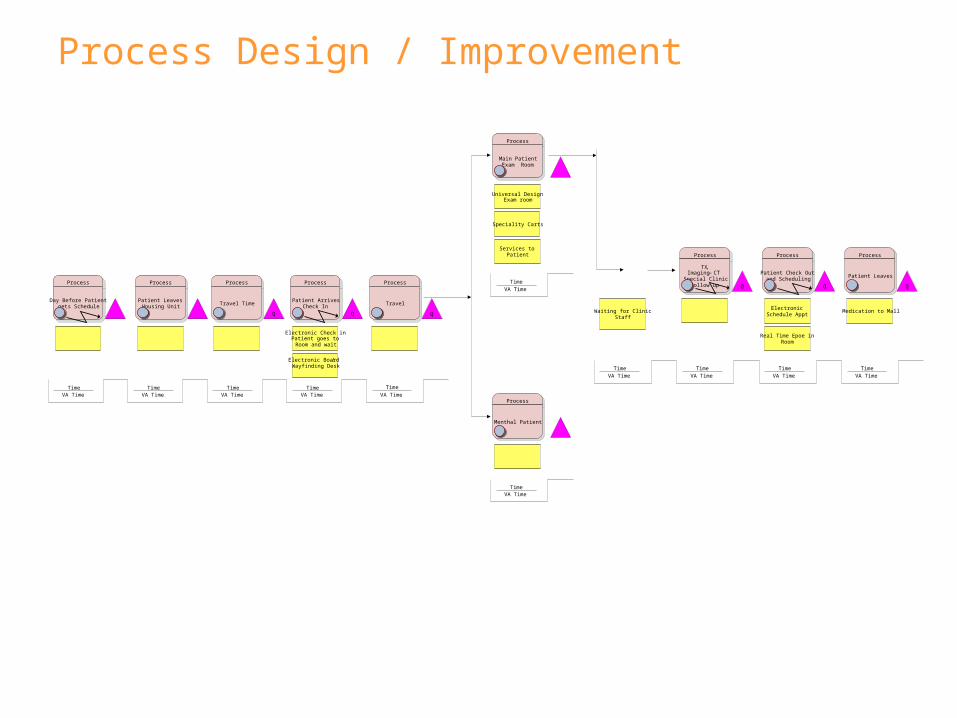
Day Before Patient gets Schedule
Process
Patient Leaves Housing Unit
Process
Q
Travel Time
Process
Q
Patient ArrivesCheck In
Process
Q
Travel
Process
Main PatientExam Room
Process
Electronic Check in Patient goes to Room and wait
Electronic Board / Wayfinding Desk
TimeVA Time
TimeVA Time
TimeVA Time
TimeVA Time
Time
VA Time
Time
VA Time
Services to Patient
Menthal Patient
Process
TimeVA Time
Waiting for Clinic Staff
Time
VA Time
Q
TX, Imaging – CTSpecial Clinic
Follow up
Process
Real Time Epoe in Room
Time
VA Time
Q
Patient Check Out and Scheduling
Process
Electronic Schedule Appt.
Time
VA Time
Q
Patient Leaves
Process
Medication to Mall
Time
VA Time
Universal Design Exam room
Speciality Carts
Process Design / Improvement
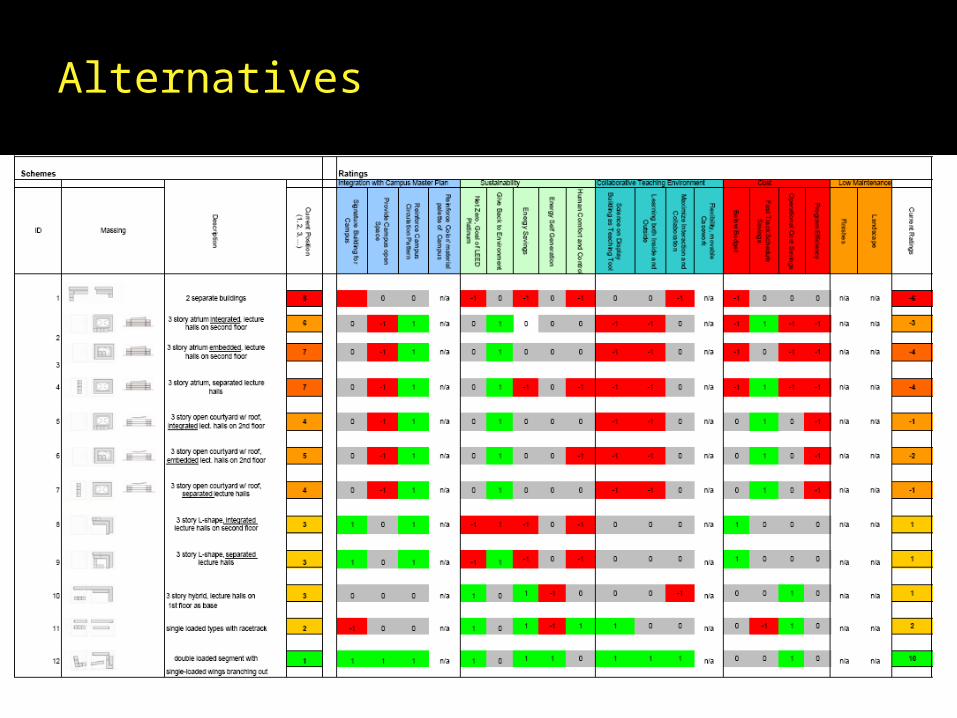
Alternatives

Continuous Improvement
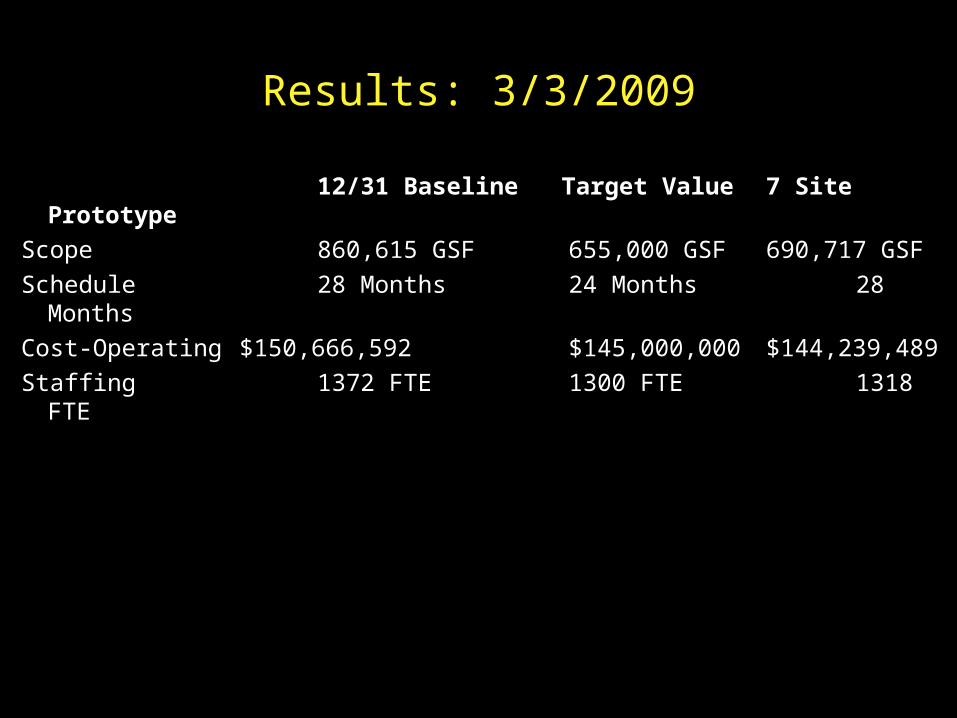
12/31 Baseline Target Value 7 Site Prototype
Scope 860,615 GSF 655,000 GSF 690,717 GSFSchedule 28 Months 24 Months 28 MonthsCost-Operating $150,666,592 $145,000,000 $144,239,489Staffing 1372 FTE 1300 FTE 1318 FTE
Results: 3/3/2009
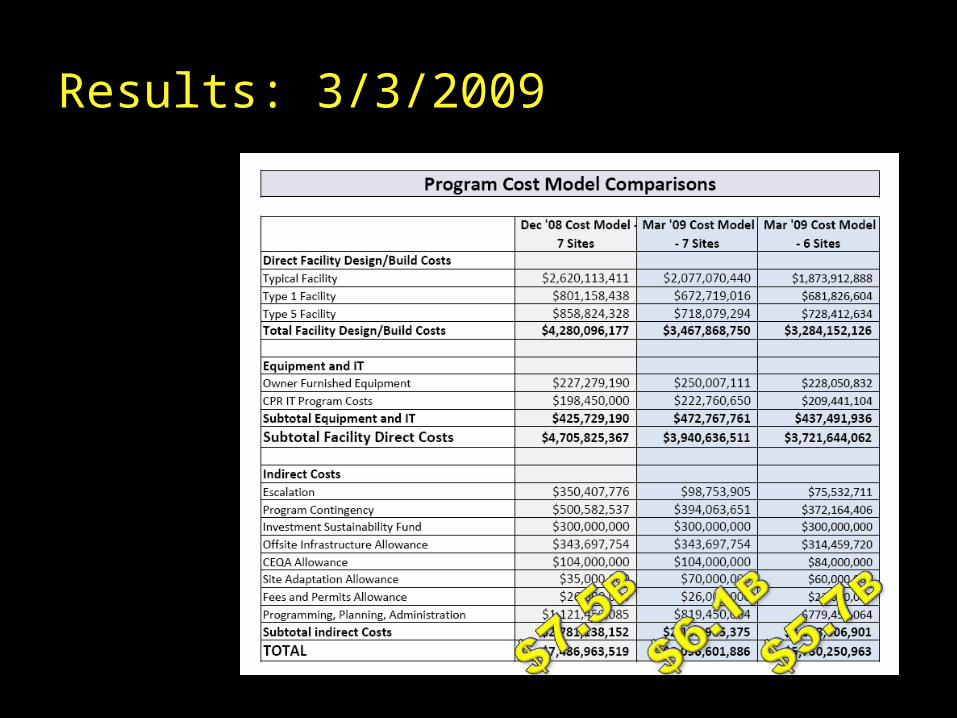
Results: 3/3/2009
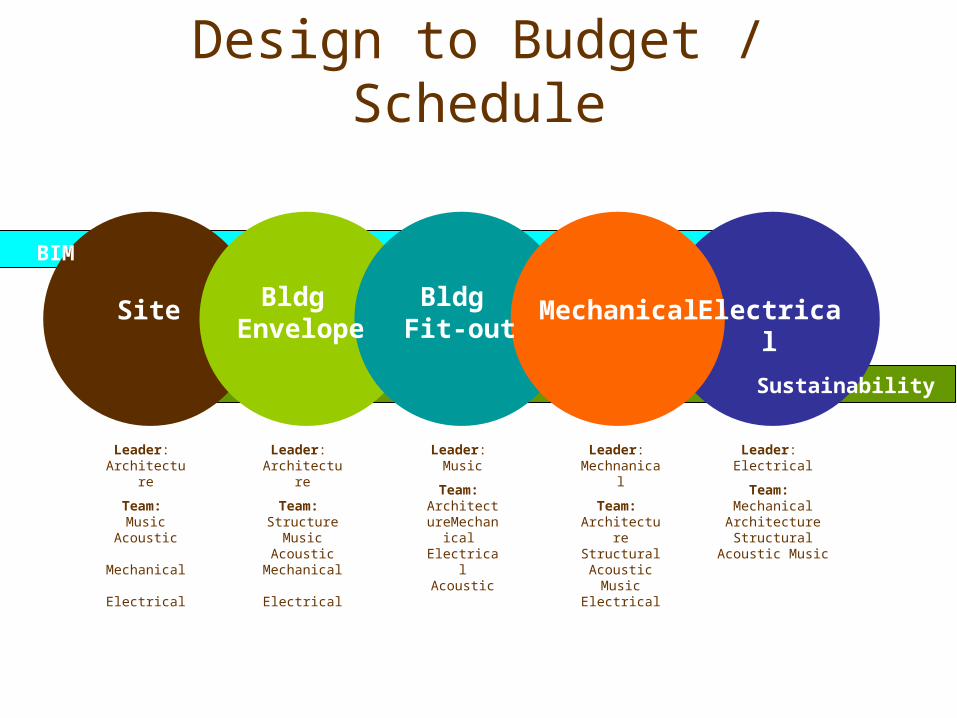
Design to Budget / Schedule
Site Bldg Fit-out
Bldg Envelope
Mechanical Electrical
Sustainability
BIM
Leader: Architecture
Team: Structure
Music Acoustic
Mechanical Electrical
Leader: Architecture
Team: Music
Acoustic Mechanical
Electrical
Leader: Music
Team: ArchitectureMechanical
ElectricalAcoustic
Leader: Mechnanical
Team: Architecture Structural Acoustic
Music Electrical
Leader: Electrical
Team: Mechanical Architecture
Structural Acoustic Music
Source: Boldt Construction
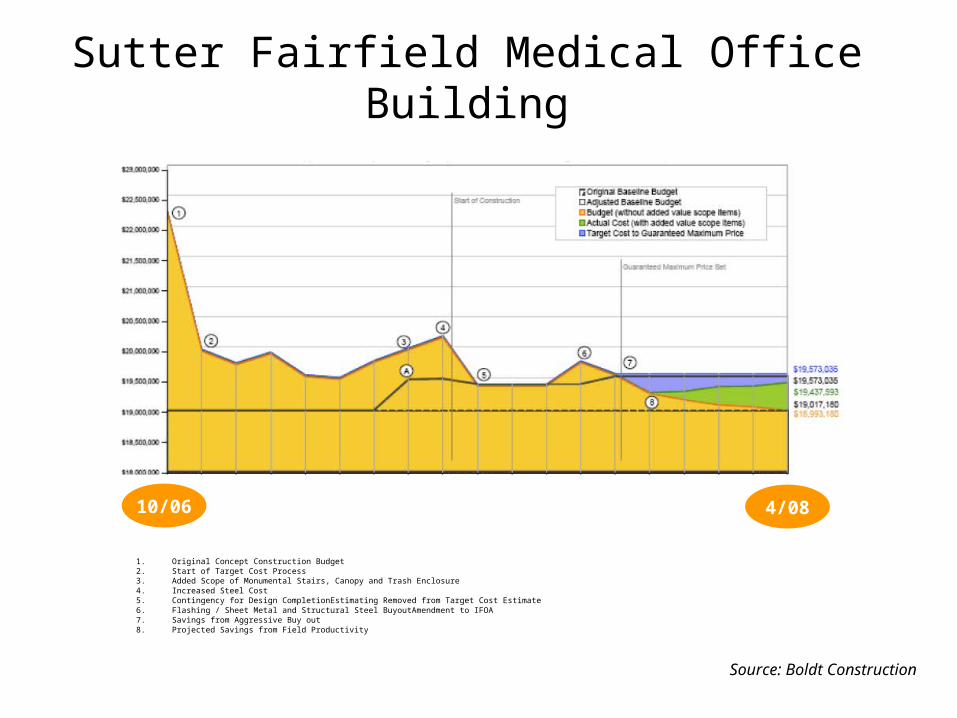
1. Original Concept Construction Budget2. Start of Target Cost Process3. Added Scope of Monumental Stairs, Canopy and Trash Enclosure4. Increased Steel Cost5. Contingency for Design CompletionEstimating Removed from Target Cost Estimate6. Flashing / Sheet Metal and Structural Steel BuyoutAmendment to IFOA7. Savings from Aggressive Buy out8. Projected Savings from Field Productivity
10/06 4/08
Sutter Fairfield Medical Office Building
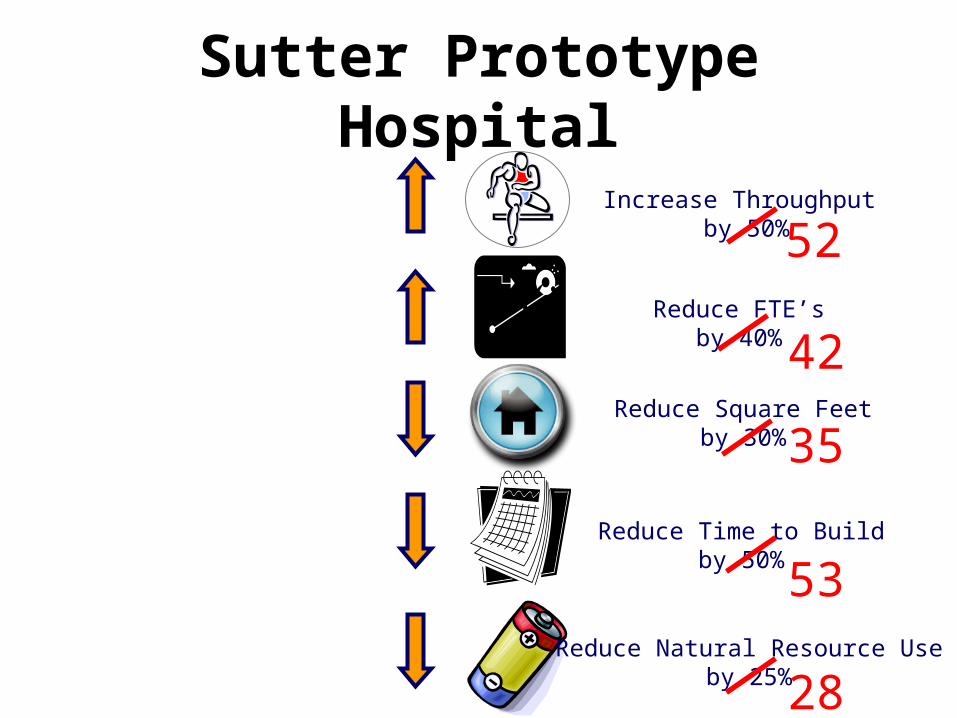
Increase Throughput by 50%
Reduce FTE’sby 40%
Reduce Square Feetby 30%
Reduce Time to Buildby 50%
Reduce Natural Resource Useby 25%
52
42
35
53
28
Sutter Prototype Hospital

takeaways
• Understand players are beyond team that need to be integrated (BOD, Leadership)
• Carrying design through to bid gives false sense of value• Independent cost estimation valued by leadership• BIM as integrating tool• Collaborative personality critical• Contract challenges require committed client• Work at the right level – not design to solve op’s issues• Concurrent Operational, Program, Design, Constructability:
high opportunity but high stress
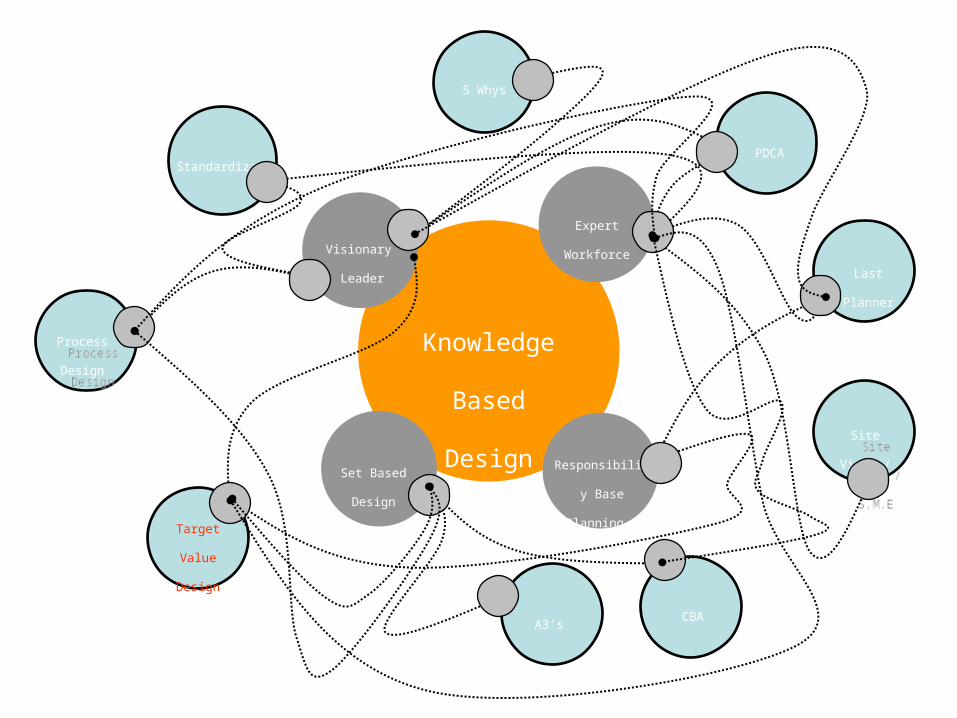
Target
Value
Design
Process
Design
Process
Design
Knowledge
Based
Design
Visionary
Leader
Expert
Workforce
Responsibility
Base Planning
& Control
Standardization
A3’sCBA
Site Visit /
S.M.E
Site Visit /
S.M.E
Last
Planner
PDCA
Set Based
Design
5 Whys
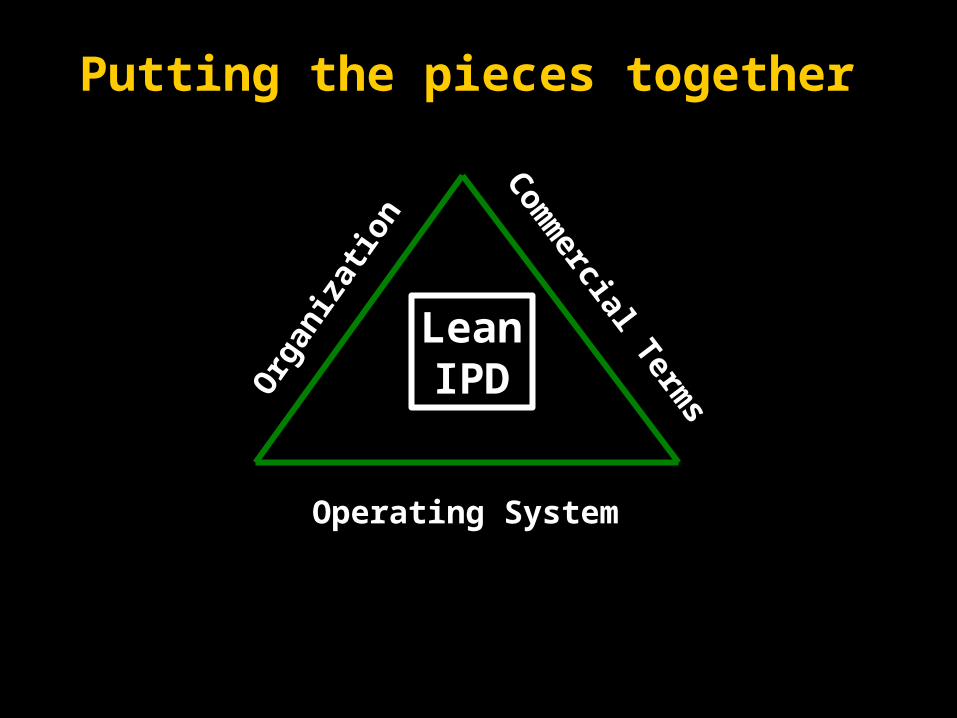
Putting the pieces together
LeanIPDO
rgan
izat
ion
Com
mercial Term
s
Operating System
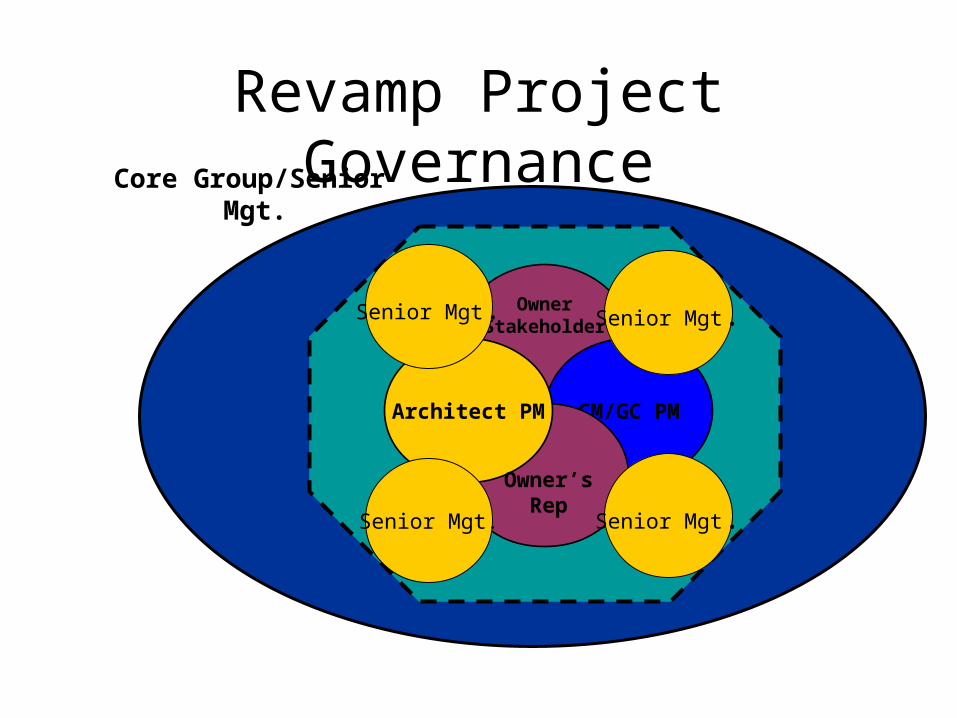
Revamp Project Governance
OwnerStakeholder
CM/GC PMArchitect PM
Owner’sRep
Senior Mgt.
Senior Mgt. Senior Mgt.
Senior Mgt.
Core Group/Senior Mgt.
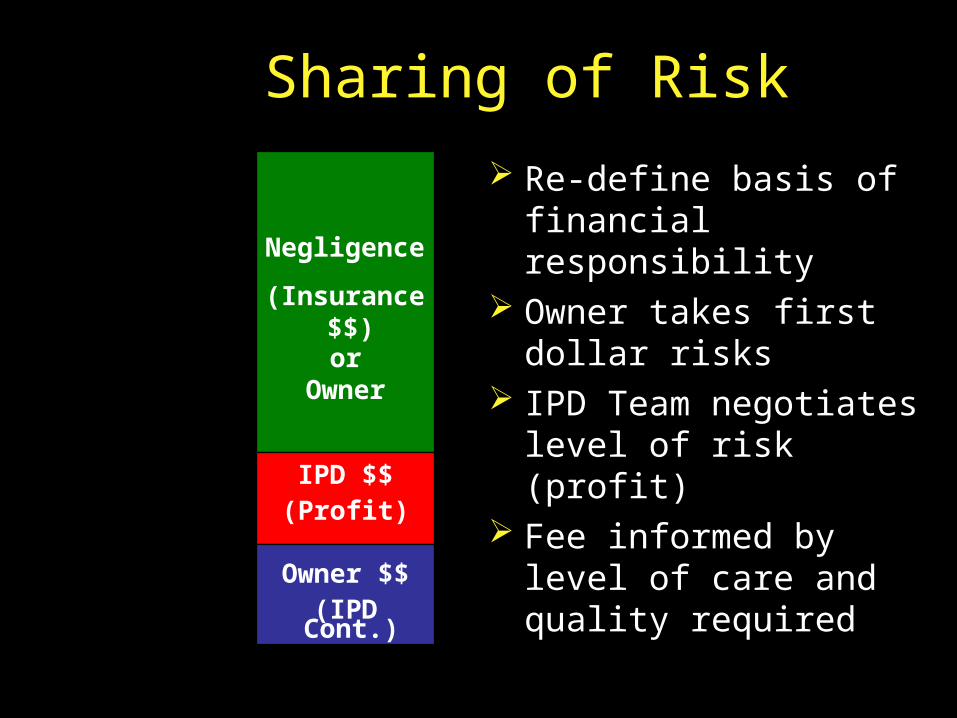
Sharing of Risk
Re-define basis of financial responsibility
Owner takes first dollar risks
IPD Team negotiates level of risk (profit)
Fee informed by level of care and quality required
Owner $$(IPD Cont.)
IPD $$(Profit)
Negligence
(Insurance $$)
orOwner

Sharing Project’s Innovation
Incentive Pool =
Metrics
Owner =
TargetCost
ExpectedCost Savings $$
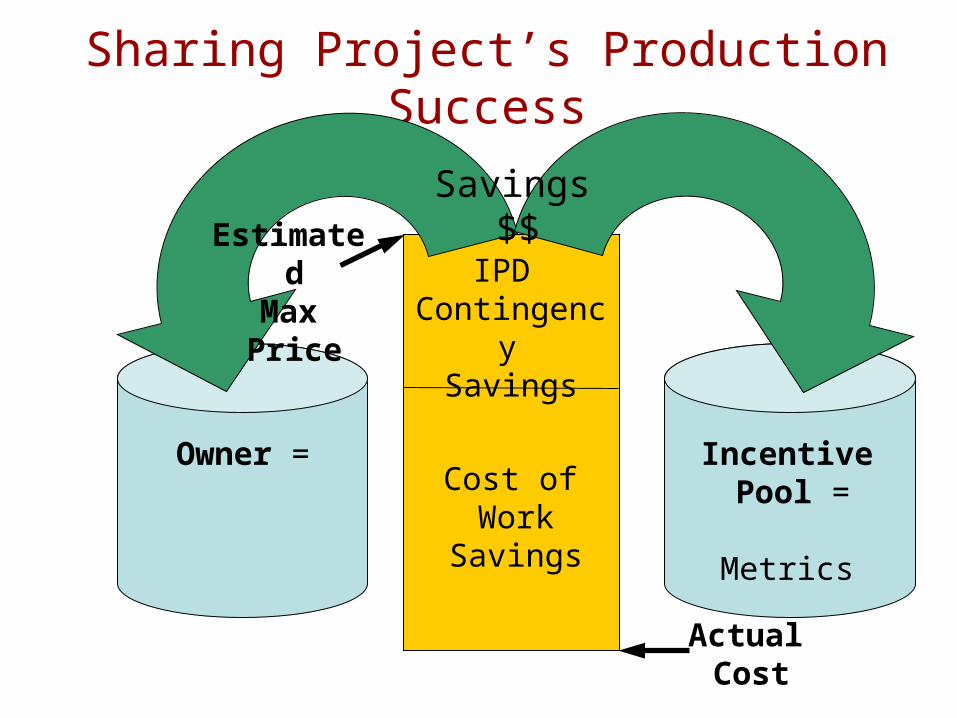
Sharing Project’s Production Success
Incentive Pool =
Metrics
IPD Contingency
Savings
Cost of Work
Savings
Owner =
Savings $$EstimatedMax Price
Actual Cost
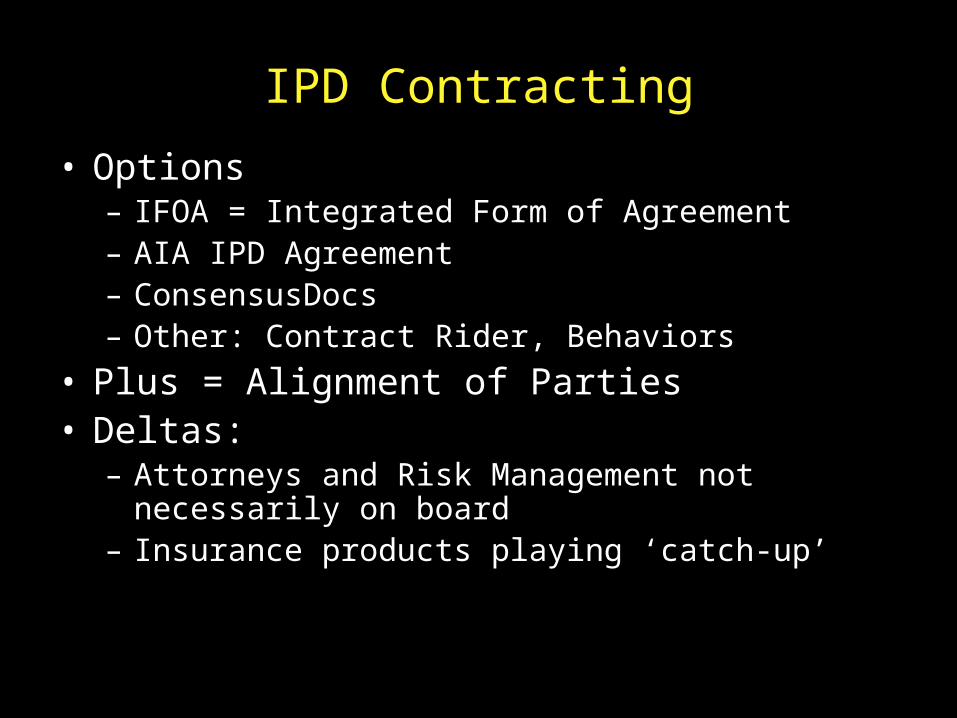
IPD Contracting
• Options– IFOA = Integrated Form of Agreement– AIA IPD Agreement– ConsensusDocs– Other: Contract Rider, Behaviors
• Plus = Alignment of Parties• Deltas:
– Attorneys and Risk Management not necessarily on board
– Insurance products playing ‘catch-up’
Transformation Principles
• Assemble a high-performance cross-functional team as early as possible
• Focus the team on collectively exploring the project’s underlying human concerns and assisting the customer to define “value”
• Have the right person, do the right thing, in the right level of detail, at the right time (last responsible moment)
Transformation Principles
• Create a commercial structure that rewards the team for creating value, eliminating waste, and optimizing the project -- not discrete pieces
• Relentlessly innovate and continuously improve with the goal of increasing value and eliminating waste
Commercial Opportunities
• Pool Contingencies• Trade Contractors’ Compensation• Create Proper Incentives (Rewards)• Create “Enterprise” Risk Sharing• Eliminate trade-level GMPs• Eliminate Project GMP
Relationship between BIM and Lean
BIM facilitates pursuit of the Lean Ideal.Both BIM and Lean work best with
organizational integration and aligned commercial interests.
Lean planning and control helps BIM work better.
BIM is a tool, but a complex tool that impacts the design and execution of socio-technical systems.
Lean and BIM need each other!
SAT’s, Study Action Teams – Use Lean Books and/or Articles for discussion and alignment of team goals and values.
Team-Building – Build camaraderie in collaborative teams – open up dialogue by getting to know team members and have some fun.
Team-Building and SAT’s
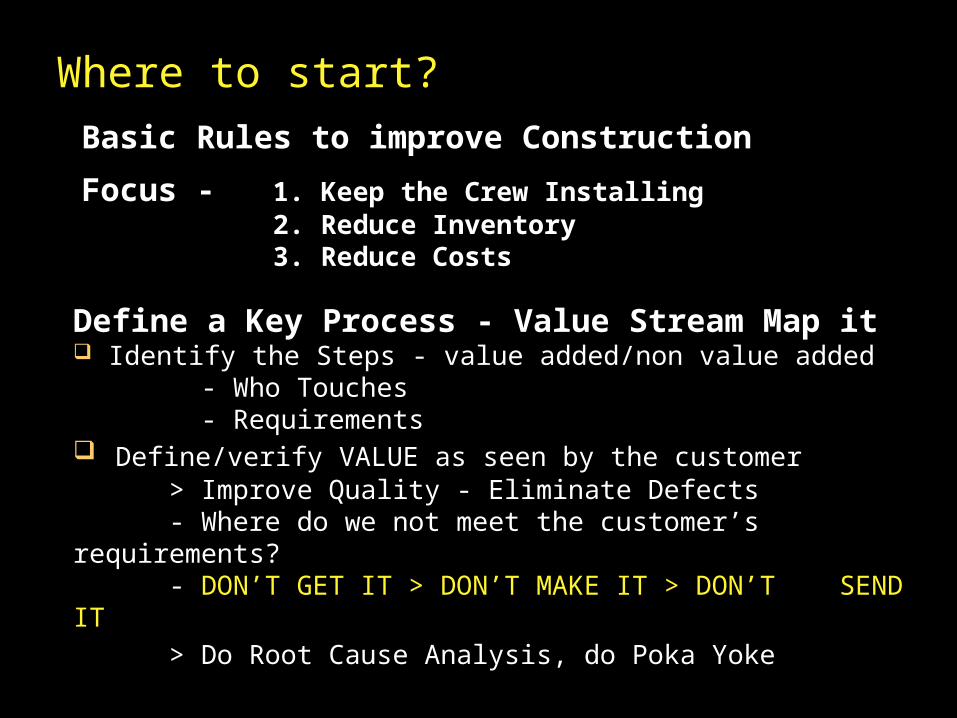
Basic Rules to improve Construction
Focus - 1. Keep the Crew Installing 2. Reduce Inventory 3. Reduce Costs
Where to start?
Define a Key Process - Value Stream Map it Identify the Steps - value added/non value added
- Who Touches - Requirements
Define/verify VALUE as seen by the customer> Improve Quality - Eliminate Defects- Where do we not meet the customer’s requirements?- DON’T GET IT > DON’T MAKE IT > DON’T
SEND IT> Do Root Cause Analysis, do Poka Yoke
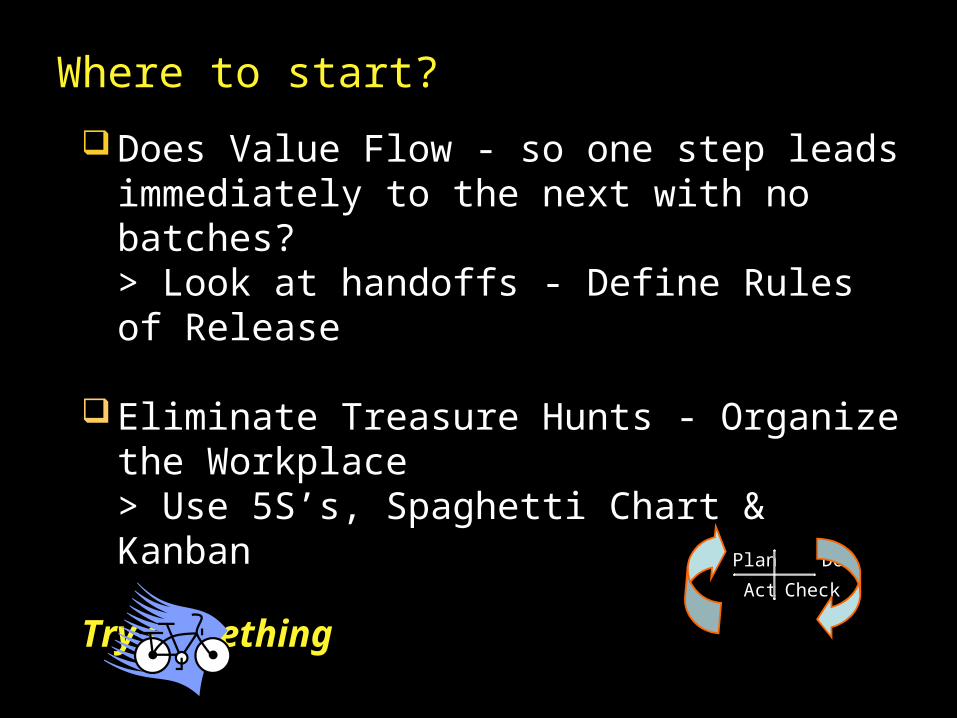
Does Value Flow - so one step leads immediately to the next with no batches?
> Look at handoffs - Define Rules of Release
Eliminate Treasure Hunts - Organize the Workplace > Use 5S’s, Spaghetti Chart & Kanban
Try something
Where to start?
Plan Do
Act Check
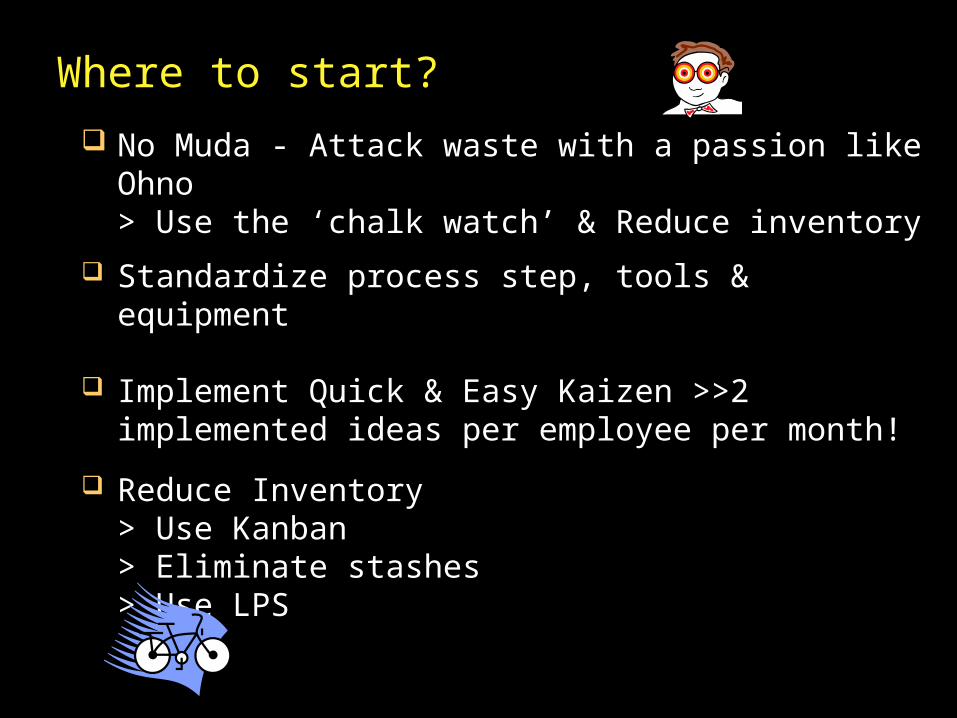
No Muda - Attack waste with a passion like Ohno > Use the ‘chalk watch’ & Reduce inventory
Standardize process step, tools & equipment
Implement Quick & Easy Kaizen >>2 implemented ideas per employee per month!
Reduce Inventory> Use Kanban> Eliminate stashes> Use LPS
Where to start?
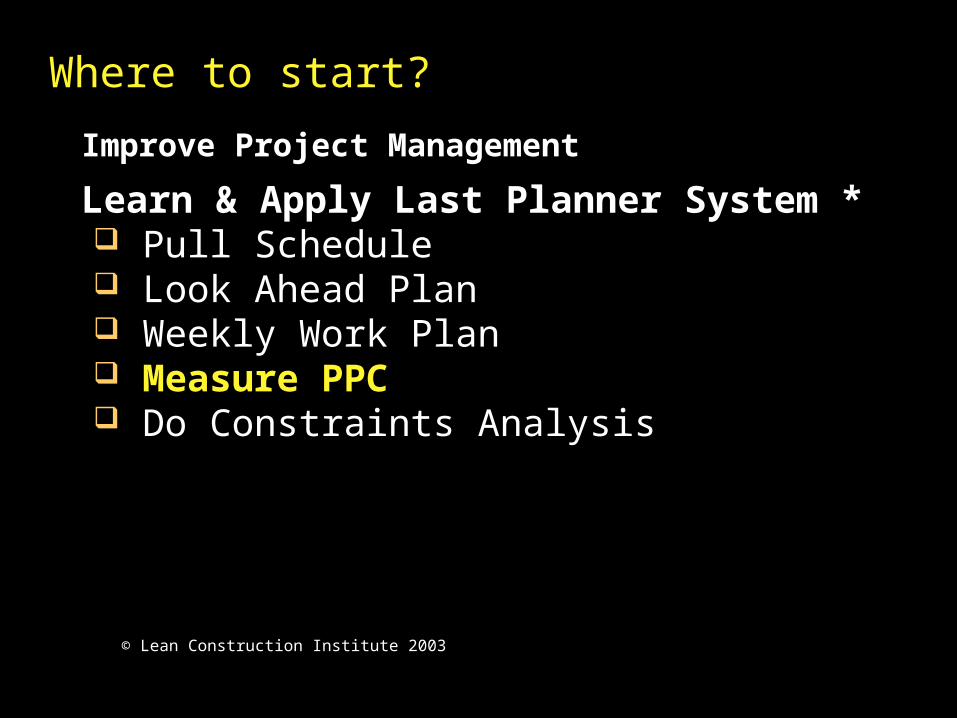
Improve Project Management
Learn & Apply Last Planner System * Pull Schedule Look Ahead Plan Weekly Work Plan Measure PPC Do Constraints Analysis
Where to start?
© Lean Construction Institute 2003
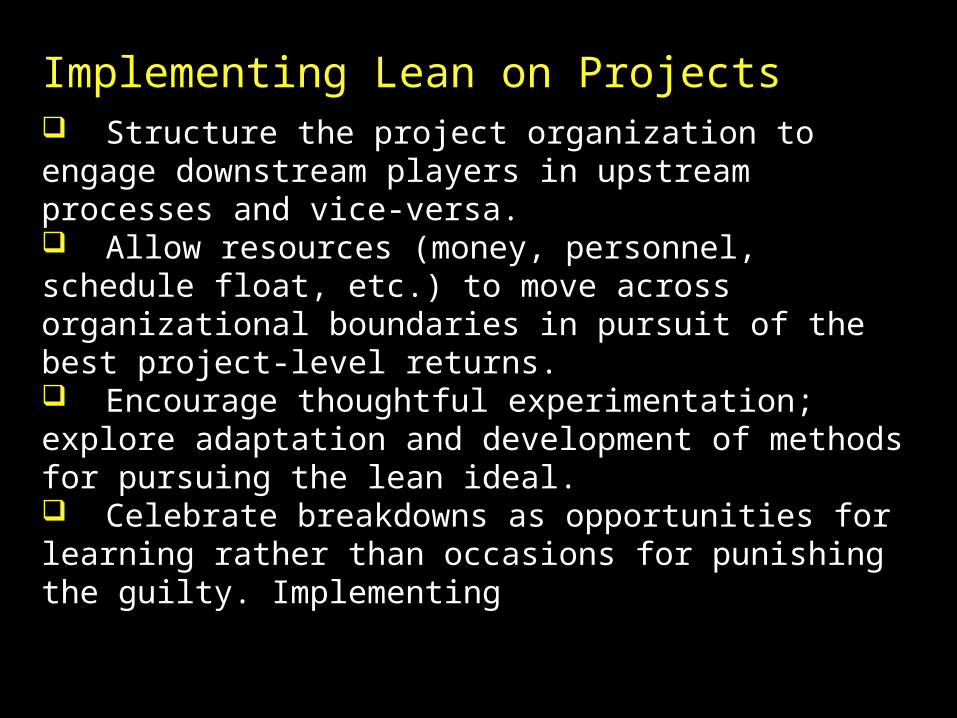
Implementing Lean on Projects Structure the project organization to engage downstream players in upstream processes and vice-versa. Allow resources (money, personnel, schedule float, etc.) to move across organizational boundaries in pursuit of the best project-level returns. Encourage thoughtful experimentation; explore adaptation and development of methods for pursuing the lean ideal. Celebrate breakdowns as opportunities for learning rather than occasions for punishing the guilty. Implementing Lean on Projects

Becoming a Lean Enterprise: Getting Started
Don’t over-theorize. Learn by doing.
Start with your own work where you have the power to make changes.
Stabilize processes by making work flow predictable before attacking waste (muda).
Change the company culture by changing management practice.
Start with demonstration projects to adapt concepts and techniques to your situation, to provide proof of concept, to develop competence and confidence, and to build internal advocates and external partners.
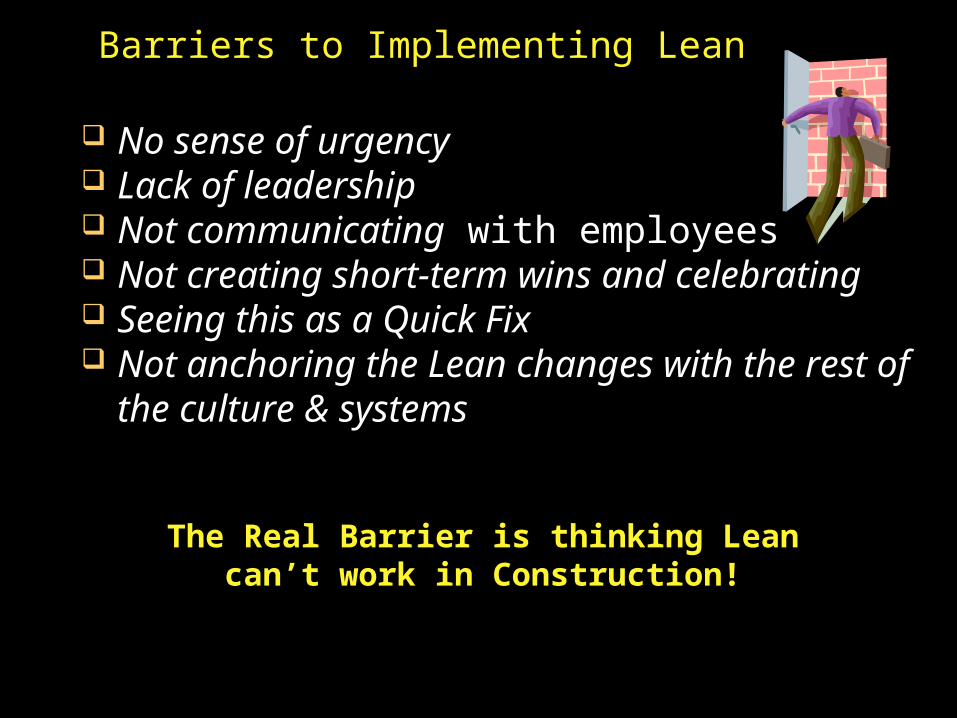
No sense of urgency Lack of leadership Not communicating with employees Not creating short-term wins and
celebrating Seeing this as a Quick Fix Not anchoring the Lean changes with the
rest of the culture & systems
Barriers to Implementing Lean
The Real Barrier is thinking Lean can’t work in Construction!
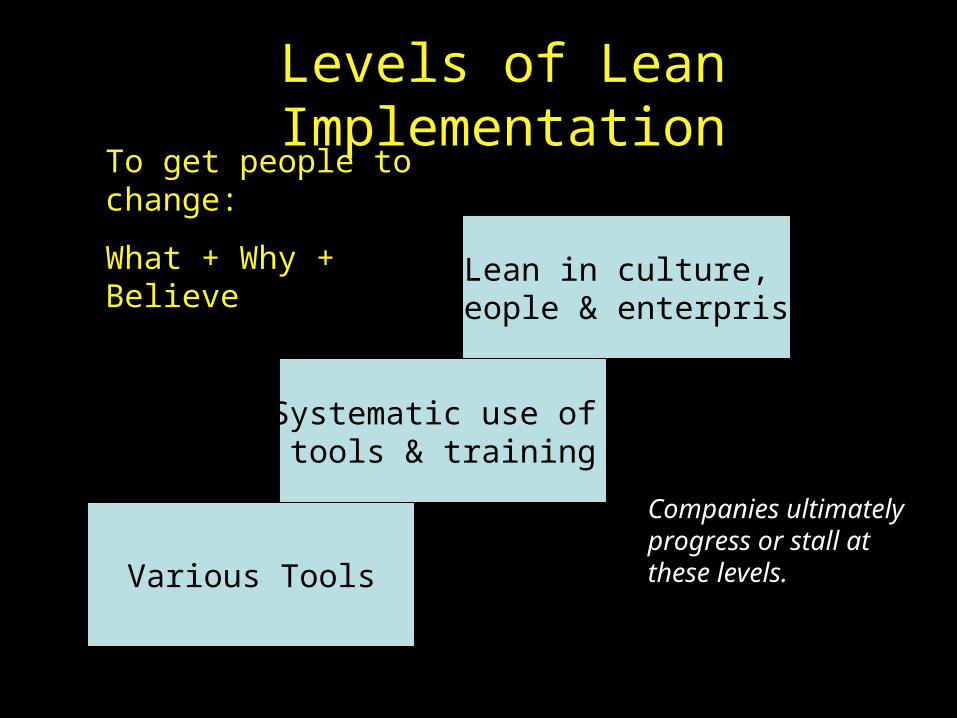
Various Tools
Systematic use of tools & training
Lean in culture, people & enterprise
Levels of Lean Implementation
Companies ultimately progress or stall at these levels.
To get people to change:
What + Why + Believe

Change Management
20 - 60 - 20 Rule
Are you in the boat?
Critical
Against
Virtually
Everything

People Equation
Involvement + Communications=
Engaged Employees

Toyota’s goal:
“Give customers what they want, deliver it
instantly, with no waste.”
What do you want to do?
Every successful Lean transformation began with a passionate leader - Are you that Leader?