Embed Size (px)
Citation preview

Ann. Zool. Fennici 42: 379–395 ISSN 0003-455XHelsinki 29 August 2005 © Finnish Zoological and Botanical Publishing Board 2005
Large-scale dynamics of the Glanville fritillary butterfly: landscape structure, population processes, and weather
Ilkka Hanski* & Evgeniy Meyke
Metapopulation Research Group, Department of Biological and Environmental Sciences, P.O. Box 65, FI-00014 University of Helsinki, Finland (*e-mail: [email protected])
Received 1 Apr. 2005, revised version received 19 Apr. 2005, accepted 20 Apr. 2005
Hanski, I. & Meyke, E. 2005: Large-scale dynamics of the Glanville fritillary butterfly: landscape structure, population processes, and weather. — Ann. Zool. Fennici 42: 379–395.
The Glanville fritillary (Melitaea cinxia) has been studied in Finland within an area of 50 by 70 km since 1993. We analyse 11-yr time series for aggregate populations in 20 squares of 4 by 4 km. Different aggregate populations exhibit dissimilar long-term trends, including significant increasing and decreasing trends as well as stable popula-tion sizes, and their average size is significantly related to the amount of habitat but not of host plants. Precipitation shows spatially correlated variation in the study area, recorded with high-resolution weather radar. Spatial variation in August and June pre-cipitation explains a significant amount of spatial variation in the dynamics of aggre-gate populations. Many processes operating in local populations have strong effects, but these effects are not consistent in time and space and they often counter each other, making it less likely that one would detect a signal of local processes in large-scale data for aggregate populations.
Introduction
Population dynamics of plants and animals are often examined with samples accumulated at multiple locations for some relatively long period of time. Such data are generated by popu-lation monitoring programmes, of which the Rothamsted Insect Survey in the UK is a prime example (Taylor 1986). The Rothamsted Survey has covered the entire UK with around 100 moth traps for 40 years (with some turnover of traps between years). The hope is that analysing time series data from multiple locations will reveal the big picture: type and strength of density dependence in population dynamics (an exam-ple employing the Rothamsted data: Hanski & Woiwod 1991, Woiwod & Hanski 1992, see also
Roland 2005), long-term trends in abundance (Living Planet Report 2004), tendency toward cyclic and other complex dynamics (examples on small mammals: Turchin 2003), and the degree of spatial correlation in the dynamics and how this depends on the spatial scale (Hanski & Woiwod 1993).
Helpful as these analyses are, apart from often being the only ones possible with large-scale monitoring data, one may raise some criti-cal questions. Sampling is often focused on an unknown population or populations within the sampling area, with no knowledge of the spa-tial population structure nor of the structure of the habitat. In monitoring programmes covering hundreds of species, like the Rothamsted Insect Survey, it would be practically impossible to

380 Hanski & Meyke • ANN. ZOOL. FENNICI Vol. 42
map the specific habitat for all the species, many of which have poorly known habitat require-ments to start with. Another problem is that when only time series data on the focal species are available, one will inevitably lack informa-tion about many important population processes, often involving other species with which the focal species interacts.
Our purpose in this paper is to examine spatio-temporal population dynamics in the Glanville fritillary butterfly (Melitaea cinxia) both at the level of time series of aggregated populations at multiple localities and at the level of the actual spatially structured local popula-tions. The second approach is focused more on processes than on patterns, and often on some quite specific questions, and therefore the two approaches are not really alternatives. Taking for granted that the second more detailed approach will yield a more mechanistic understanding of the population processes than the former, we may ask whether any signature of these proc-esses can be detected in the time series data.
The Glanville fritillary has a large metapopu-lation in the Åland Islands in SW Finland, where we have been studying it since 1991 (Hanski 1999, Nieminen et al. 2004). The research has been of the second type as described above, partly for the reason that the actual local popula-tions tend to be so small and ephemeral that time series of continuously existing local populations remain very short (but when a local popula-tion has gone extinct the same meadow may become re-colonized after some time giving rise to another local population; Hanski 1999). One may, however, aggregate local populations into larger entities that are more stable, and examine time series for such aggregate populations. This is done in section Spatial dynamics: time series of aggregated population sizes, by pooling the numbers of individuals counted within 20 square areas of 4 by 4 km in size and located across the study area of 50 by 70 km. These data thus con-sist of 20 time series of 11 years long each. In the subsequent sections we briefly review the results of past research on the detailed spatial struc-ture of the habitat and on a range of population processes that influence the spatial dynamics of the butterfly. In section Weather we present an original analysis of spatio-temporal structure in
precipitation, which is one of the weather factors that can be expected to have a big influence on the dynamics of the Glanville fritillary and other invertebrates. We conclude that no analysis at a single spatial scale is sufficient for all purposes, rather it is helpful to conduct analyses of both patterns and processes at different spatial scales for a comprehensive understanding of popula-tion dynamics.
Material and methods
The long-term study of the Glanville fritillary in the Åland Islands was started in 1991 (Hanski et al. 1994, Hanski 1999). In 1993, we censused the entire Åland Islands for suitable habitat for the butterfly, and all patches of such habitat were surveyed for the presence and the size of local butterfly populations. Suitable habitat consists of dry meadows with one or both of the larval host plants, Plantago lanceolata and Veronica spicata (more on this in section Effect of the spatial structure of habitat on population processes; see also Nieminen et al. 2004). Monitoring of the local populations has been continued ever since 1993.
Female Glanville fritillaries lay their eggs in clutches of 50 to 250 eggs and the larvae remain gregarious until the final larval instar in the fol-lowing spring (Kuussaari et al. 2004). In late summer, the larvae spin a conspicuous ‘winter nest’ inside which they diapause (see the insert in Fig. 1). The winter nests are white and easy to detect in late August to early September. Popula-tion sizes are measured in terms of the number of winter nests. We estimate that roughly 50% of all winter nests are detected during the annual monitoring, hence the true population sizes in terms of the number of larval groups in the autumn are roughly twice the figures reported here (M. Nieminen, J. Pöyry & I. Hanski unpubl. data). Larvae within each nest are typically full sibs (Boggs & Nieminen 2004) but occasionally females mate twice or more often and one larval group may hence include half sibs (Kuussaari et al. 1998 own observations).
The original mapping of suitable habitat conducted in 1993 included ca. 1600 habitat patches. In subsequent years we realized that

ANN. ZOOL. FENNICI Vol. 42 • Large-scale dynamics of the Glanville fritillary butterfly 381
the mapping had remained incomplete. A very thorough re-mapping of the entire Åland was conducted in 1998–1999, yielding the current data base of ca. 4000 habitat patches. Though the number of patches was more than doubled, the original mapping was not quite as bad as these figures might suggest, as the vast majority of the newly-discovered patches are very small and of low quality. In the analyses in section Spatial dynamics: time series of aggregated popula-tion sizes, we used data from the original set of habitat patches only, which have been known since 1993, to make the results comparable for different years.
We selected 20 square areas of 4 by 4 km and located across the range of the Glanville fritil-lary in Åland (Fig. 1). The squares were selected haphazardly among all possible squares, with the aim of covering the entire study area. No squares with shared edges were included, but some squares touching each other in their corners were included. The squares were placed in those regions in Åland with relatively high or high density of habitat patches (also shown in Fig. 1).
The following variables were recorded for each square:
1. The number of larval winter nests recorded in the meadows in each year from 1993 until 2003, denoted by Nagg.
2. The pooled area of meadows.3. The pooled area covered by the two host
plants.
Information about the areas of the habitat patches and the coverage of host plants are included in the database for the Glanville fritil-lary in the Åland Islands that is maintained in the Metapopulation Research Group at the Univer-sity of Helsinki.
Spatial dynamics: time series of aggregated population sizes
The 11-yr time series of aggregated popula-tion sizes (Nagg) in the twenty 16 km2 squares represent a range of long-term patterns (Fig. 2).
Fig. 1. Map of the Åland Islands showing the local populations of the Glan-ville fritillary that existed in 1993 and the 20 squares of 16 km2 in size for which data were aggregated for the time series analysis. Squares with increasing and decreasing popula-tion trend (see Fig. 2) are indicated by red and blue triangles, the size of the triangle being proportional to the regression coeffi-cient indicating the tem-poral trend in population size (note that in the east-ernmost square there was no trend at all). The popu-lation sizes have been measured by the num-bers of ‘winter nests’ in late summer (insert). The larvae diapause inside the winter nest.

382 Hanski & Meyke • ANN. ZOOL. FENNICI Vol. 42
In two squares, the aggregate populations went extinct in 1996 or 1997 and have remained extinct ever since. We characterized the tempo-ral trend in population size by the coefficient of linear regression of log Nagg against time. In most squares (15) the trend has been declining (Fig. 2). The regression coefficient was significantly negative in 6 squares and significantly positive in 3 squares.
Pair-wise correlation between temporal changes in Nagg and the distance between the two aggregate populations was non-significant (t = –1.37, P = 0.18, n = 190). Nonetheless, though there is no overall pattern of more synchronous dynamics in nearby than far-away populations,
there is some order in the data. Most notably, three squares in the west exhibit a clear increas-ing trend, while a series of squares along the NE coast shows a strong declining trend (Fig. 1).
Population regulation, whatever the actual mechanism or mechanisms, tends to keep popu-lation size within positive limits (Sinclair 1989, Hanski 1990, Turchin 1995). Thereby, when the population happens to be large it is likely to decline, and when it happens to be small it tends to increase. A plot of proportional yearly change in population size against population size itself reveals how strong this tendency is. Though such a plot is problematic statistically, as the same variable (current population size)
Year1994 1996 1998 2000 2002 2004
Log
popu
latio
n si
ze
0.0
0.5
1.0
1.5
2.0
2.5
Year1994 1996 1998 2000 2002 2004
0.0
0.5
1.0
1.5
2.0
2.5
Year1994 1996 1998 2000 2002 2004
0.0
0.5
1.0
1.5
2.0
2.5
3.0a b c
Fig. 2. Twenty time series for aggregate populations of the Glanville fritillary, giving the numbers of larval groups counted in the 20 square areas shown in Fig. 1. The populations have been divided into three groups, those show-ing (a) a significant increasing trend, (b) a significant decreasing trend, and (c) no statistically significant trend.
Log population size0.5 1.0 1.5 2.0 2.5 3.0
Log
chan
ge in
pop
ulat
ion
size
–2.0
–1.5
–1.0
–0.5
0.0
0.5
1.0
1.5
Log population size0.5 1.0 1.5 2.0 2.5 3.0
–1.5
–1.0
–0.5
0.0
0.5
1.0
1.5a b
Fig. 3. (a) Plot of the logarithm of proportional change in aggregate population size (log[Nt + 1/Nt ]) against the loga-rithm of current population size (log[Nt + 1]) in the 20 time series shown in Fig. 2. Cases where the current population size was < 5 are omitted. (b) Omitting the aggregate populations (squares) in which there was a statistically signifi-cant increasing or decreasing trend in population size (panels a and b in Fig. 2). For the statistics see Table 1.

ANN. ZOOL. FENNICI Vol. 42 • Large-scale dynamics of the Glanville fritillary butterfly 383
appears in both variables, we used it here as a simple description of the strength of density dependence. While preparing this plot, we omit-ted cases where the current population size was smaller than 5, as measurement error is great in such cases. For the remaining cases, the plot is shown in Fig. 3.
Fitting a linear regression to these data (Fig. 3a) returns a non-significant regression coef-ficient (P = 0.12), in agreement with the visual impression. However, if we include in the model the square (aggregate population) as a categori-cal variable, the result is very different: there are highly significant differences among the popula-tions and now also the negative effect of popula-tion size is highly significant (Table 1).
One could assume that aggregate popula-tions in the 9 squares that exhibited a significant negative or positive trend in population size (Fig. 2) are affected so strongly by some exogenous factors that the influence of population size itself becomes obscured. It is hence not surprising that removing these 9 aggregate populations reveals a negative relationship between the change in population size and population size itself (Fig. 3b, P < 0.001, R2 = 0.13), though there are still highly significant differences among the aggre-gate populations (Table 1).
Another simple analysis of density depend-ence in population dynamics is based on plotting
the logarithm of the variance in population size against the logarithm of the respective mean. If fluctuations in population size are entirely inde-pendent of the mean, the slope of this plot is 2 (Hanski 1982). In the present case (Fig. 4), the slope is significantly smaller than 2, 1.56 (S.E. = 0.14, R2 = 0.86), which implies that those popu-lations with high mean abundance exhibit rela-tively small variance of temporal fluctuations, a signature of density dependence.
Table 1. Analysis of covariance for the change in population size from year t to year t + 1 (log[Nt + 1/Nt ]) explained by the aggregate population (square in Fig. 1) and the logarithm of population size in year t (log[Nt + 1]). Part A includes all 20 aggregate populations (squares), part B only those aggregate populations that exhibited no signifi-cant increasing or decreasing temporal trend (Fig. 2).
A Source DF SS MS F P Population 17 7.03 0.413 2.71 0.0008 Population size 1 3.27 3.272 21.44 < 0.0001 Error 120 18.31 0.152 Total 138
Covariate Coeff. S.E. t P Population size –0.489 0.105 –4.63 < 0.0001
B Source DF SS MS F P Population 9 5.186 0.576 7.30 < 0.0001 Population size 1 5.343 5.343 67.71 < 0.0001 Error 73 5.761 0.078 Total 83
Covariate Coeff. S.E. t P Population size –0.905 0.110 –8.23 < 0.0001
Log mean–0.5 0.0 0.5 1.0 1.5 2.0 2.5
Log
varia
nce
0
1
2
3
4
5
Fig. 4. Plot of the logarithm of variance against the logarithm of mean abundance in the 20 time series in Fig. 2.

384 Hanski & Meyke • ANN. ZOOL. FENNICI Vol. 42
We may ask whether the observed differences in the mean abundances among the 20 aggregate populations can be explained by some features of the environment. The two explanatory variables that first come to mind are the pooled area of the habitat and the pooled coverage of the host plants within habitat (a measure of the quantity of larval resources). The latter measure is not significantly related to the minimum, mean, or maximum pop-ulation size during the 11-yr study period, but the pooled area of habitat explains a significant amount of variance in the mean (R2 = 0.20) and the maximum population sizes (R2 = 0.24; Fig. 5).
Spatial structure of the habitat
The habitat of the Glanville fritillary in Åland is highly fragmented into small and relatively small dry meadows in which the larval host plants are present (Fig. 6). The fraction of land area cov-ered by suitable habitat is only 0.6% (Nieminen et al. 2004). The average patch size is 0.15 ha, and there is a power law relationship between the number of patches N with an area A, such that N ~ A–2 (Vuorinen et al. 2004). The spatial distribution of the patches is aggregated, which is due to the physical structure of the landscape:
the habitat patches typically occur within and around small villages, which have a scattered spatial distribution in the landscape (Fig. 6).
Apart from variation in patch areas and their spatial connectivities to other patches, there is much variation in habitat quality. First, the den-sity of the two larval host plants, Plantago lan-ceolata and Veronica spicata, varies greatly, and so do their relative abundances. Second, some meadows are intrinsically very dry, the host plants growing on rocky outcrops, and such sites are vulnerable to drought. Third, the density of adult nectar plants varies greatly among the meadows. And finally, the type of habitat patch boundary varies from edges with closed forest to edges with various open habitat types (see Fig. 6).
Effect of the spatial structure of habitat on population processes
Past research on the Glanville fritillary has dem-onstrated significant effects of the structure of the habitat on population dynamics. Below, we sum-marize these results briefly. For more detailed analyses and reviews see Hanski (1999), Hanski and Ovaskainen (2000), Nieminen et al. (2004) and Ovaskainen and Hanski (2004).
Log Host area
1.6 2.0 2.4 2.8 3.2 3.6
Log
min
N
0.0
0.4
0.8
1.2
1.6
2.0
Log Host area
1.6 2.0 2.4 2.8 3.2 3.6
Log
mea
n N
–0.5
0.0
0.5
1.0
1.5
2.0
2.5
Log Host area
1.6 2.0 2.4 2.8 3.2 3.6
Log
max
N
0.5
1.0
1.5
2.0
2.5
3.0
Log Area
4.2 4.4 4.6 4.8 5.0 5.2
Log
min
N
0.0
0.4
0.8
1.2
1.6
2.0
Log Area
4.2 4.4 4.6 4.8 5.0 5.2
Log
mea
n N
–0.5
0.0
0.5
1.0
1.5
2.0
2.5
Log Area
4.2 4.4 4.6 4.8 5.0 5.2
Log
max
N
0.5
1.0
1.5
2.0
2.5
3.0
a b c
d e f
Fig. 5. Plots of minimum, mean, and maximum aggregate population sizes in the 20 time series shown in Fig. 2 against the pooled coverage of the two host plants (panels a–c) and the pooled area of suitable habitat (panels d–f).

ANN. ZOOL. FENNICI Vol. 42 • Large-scale dynamics of the Glanville fritillary butterfly 385
Effects of habitat patch area on local population size, extinction risk, and colonization rate
Most local populations of the Glanville fritil-lary in Åland are very small, with an aver-age size of 3.4 larval groups in late summer, roughly corresponding to 10 to 50 adult but-terflies in the following summer (Hanski 1999). The small populations have a very high annual risk of extinction, which is typically around 50% for populations with 1–3 larval groups in the autumn, around 20%–30% for populations with 4–10 larval groups, and < 10% in popula-tions with > 10 larval groups (Hanski 1999). The average population size increases with patch area (Nieminen et al. 2004: fig. 4.15), and hence there is a predictable decline in local extinction risk with increasing patch area (Ovaskainen & Hanski 2004: fig. 4.3). The relationship between patch area and population size indicates that, not surprisingly, the local dynamics involve density dependence (see also Hanski 1999: fig. 11.4),
though the most prominent feature is wild fluc-tuations and generally high risk of extinction.
Local populations occupying large habitat patches tend to have lower extinction risk than populations in small patches because the former tend to be larger, but there are also other rea-sons for populations on larger meadows having smaller extinction risk. First, larger meadows tend to encompass a greater range of environ-mental conditions than small meadows, which to some extent buffers populations against extinc-tion (Hanski et al. 2004: point 2). Second, the rate of emigration increases with decreasing patch area, and the ‘loss rate’ becomes so great in small patches that this will elevate the risk of extinction. The daily probability of emigration from a habitat patch of 1 ha has been estimated to be around 0.1, which is comparable to the daily mortality rate (Hanski et al. 2000; though note that the rate of mortality much depends on the prevailing environmental conditions, e.g. Kuus-saari et al. 1996). Using mark-release-recapture data, we have estimated the scaling of emigra-
Fig. 6. A map of one part of the study area show-ing the distribution of dry meadows suitable for the Glanville fritillary (red). Cultivated fields are shown as yellow and lakes as blue. Note the scale.

386 Hanski & Meyke • ANN. ZOOL. FENNICI Vol. 42
tion and immigration rates by patch area (Hanski et al. 2000; see also Petit et al. 2001, Wahlberg et al. 2002). These results suggest that immigration rate generally increases faster with increasing patch area than emigration rate. Larger habitat patches represent larger ‘targets’ for dispersing individuals than small habitat patches, and this appears to make a big difference to immigration and hence to colonization (Hanski 1999: table 11.1).
Effects of habitat patch connectivity on migration, colonization, and extinction
The spatial locations of habitat patches and local populations have a major effect on migra-tion and colonization, for the obvious reason that the expected numbers of immigrants to a habitat patch or a population increase with the connectivity of that patch or population to the surrounding source populations (Hanski 1999). Extinction rate is reduced by increasing con-nectivity, because immigration tends to increase population sizes especially in the smallest pop-ulations (Hanski 1999: table 8.2). Modelling mark-release-recapture data has yielded quanti-tative estimates of the magnitude of migration among populations and the cost of migration. In typical fragmented landscapes for the Glan-ville fritillary and related butterflies, individuals spend a large fraction of their life-time (often > 50%) in the landscape matrix (Ovaskainen 2004).
Effects of habitat quality on population size, extinction, and colonization
The patch area effects on population size and extinction and colonization rates are so sys-tematic and the reasons for these effects are so clear that they may properly be called first-order effects. But habitat patches also vary in their quality, including the density of larval host plants and adult nectar sources, the degree of within-patch spatial heterogeneity, and the type of surrounding habitats (section Spatial struc-ture of the habitat above). All these factors are known to have an influence on the dynamics
of the Glanville fritillary (Hanski 1999, Hanski et al. 2004, Nieminen et al. 2004). On the other hand, while modelling the dynamics of the Glanville fritillary metapopulations in Åland, Moilanen and Hanski (1998) could not much improve the model fit by modifying patch areas and connectivities by the quality of the patches and the surrounding matrix. One reason prob-ably is that variation in quality is so complex and varies so greatly in time and space that the quality measures that are available in practice are often too crude. The situation is similar with the influence of weather on population dynamics (section Weather).
One of the most interesting and strongest quality effects that we have detected relates to variation in the species composition of the larval host plants among the habitat patches and how this influences the movements of female butter-flies with different genetically-determined host plant preferences. Briefly, it turns out that the match between host plant preference of migrant females and plant species composition in the target patches greatly influences immigration (Kuussaari et al. 2000) and colonization rates (Hanski & Singer 2001), apparently because females that prefer e.g. Veronica spicata do not recognize habitat patches with only Plantago lanceolata as easily as patches with V. spicata. Intriguingly, larvae perform equally well on the two host plants, regardless of the preference of the female (van Nouhuys et al. 2003; for further discussion see Singer & Hanski 2004).
Effect of landscape structure on the size and viability of metapopulations
The large network of ca. 4000 habitat patches in Åland can be divided into well-connected clus-ters of patches that are relatively isolated from the remaining patches (Hanski et al. 1996). Spa-tially realistic metapopulation theory (Hanski 2001, Hanski & Ovaskainen 2003) involves measures that can be used to characterize patch networks and particular patches within networks in terms of their capacity to support viable metapopulations. The most important of these measures is the metapopulation capacity of a fragmented landscape (Hanski & Ovaskainen
ANN. ZOOL. FENNICI Vol. 42 • Large-scale dynamics of the Glanville fritillary butterfly 387
2000, Ovaskainen & Hanski 2001). Metapopu-lation capacity, which is given by the leading eigenvalue of a particular ‘landscape’ matrix, measures the amount of habitat available in the network, but its value is additionally affected by the degree of fragmentation of the total area of habitat and how this will affect local extinctions and colonizations and ultimately the viability of the metapopulation as a whole. Metapopulation capacity is large for networks in which there are many patches and/or the patches tend to be large and/or are well connected. Hanski and Ovaskainen (2000) showed that the metapopula-tion capacity of a network explains the occur-rence of the Glanville fritillary in the network well: networks with metapopulation capacity smaller than a threshold value (the extinction threshold) did not have the butterfly, whereas in networks with metapopulation capacity greater than the threshold a butterfly metapopulation was present and its size increased, as predicted by the theory, with increasing metapopulation capacity.
At the scale of individual habitat patches, patch area and connectivity explain much of the variation in patch occupancy by the butterfly. Similar area and connectivity effects also occur at the network level (Thomas & Hanski 2004: fig. 20.3). In this case we however used the metapopulation capacity of the network rather than its pooled area, because metapopulation capacity also takes the degree of fragmentation of the network into account.
Population processes that influence spatial dynamics and population structure
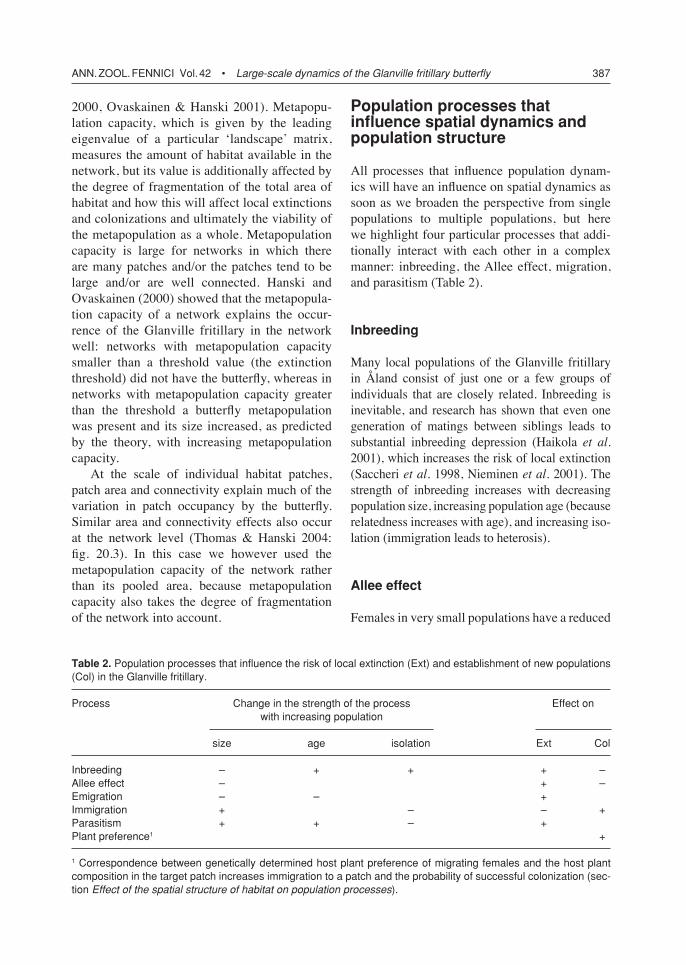
All processes that influence population dynam-ics will have an influence on spatial dynamics as soon as we broaden the perspective from single populations to multiple populations, but here we highlight four particular processes that addi-tionally interact with each other in a complex manner: inbreeding, the Allee effect, migration, and parasitism (Table 2).
Inbreeding
Many local populations of the Glanville fritillary in Åland consist of just one or a few groups of individuals that are closely related. Inbreeding is inevitable, and research has shown that even one generation of matings between siblings leads to substantial inbreeding depression (Haikola et al. 2001), which increases the risk of local extinction (Saccheri et al. 1998, Nieminen et al. 2001). The strength of inbreeding increases with decreasing population size, increasing population age (because relatedness increases with age), and increasing iso-lation (immigration leads to heterosis).
Allee effect
Females in very small populations have a reduced
Table 2. Population processes that influence the risk of local extinction (Ext) and establishment of new populations (Col) in the Glanville fritillary.
Process Change in the strength of the process Effect on with increasing population
size age isolation Ext Col
Inbreeding – + + + –Allee effect – + –Emigration – – +Immigration + – – +Parasitism + + – +Plant preference1 +
1 Correspondence between genetically determined host plant preference of migrating females and the host plant composition in the target patch increases immigration to a patch and the probability of successful colonization (sec-tion Effect of the spatial structure of habitat on population processes).

388 Hanski & Meyke • ANN. ZOOL. FENNICI Vol. 42
probability of mating quickly after eclosion (Kuussaari et al. 1998), which reduces popula-tion growth rate and thereby generates an Allee effect. Here we can detect the first important interaction between different processes: inbreed-ing decreases breeding success, which tends to reduce population size, which leads to the Allee effect. On the other hand, the Allee effect may explain why females do not discriminate against close kin as mates (Haikola et al. 2004); if they were to do so, their chances of mating would be reduced even more, and the genetic benefits of not mating with close kin might not suffice to counter the direct cost of discrimination in terms of reduced probability of mating at all.
Emigration and immigration
Emigration and immigration are key processes in spatial dynamics. The rate of emigration in the Glanville fritillary is inversely density depend-ent (Kuussaari et al. 1996) at densities that have been common in the Åland Islands for the past decade. Thus butterflies prefer not to stay in places where there are few other butterflies (for the mechanisms see Singer & Hanski 2004). Inversely density-dependent emigration reduces
the probability of inbreeding and may help to escape the local Allee effect, though there is no guarantee that migrants will be able to locate another population to reproduce in. The rate of emigration decreases with population age, because in the course of time the most dispersive phenotypes have had time to leave the population and the less dispersive ones tend to accumulate in the older populations (Hanski et al. 2004).
The effect of population density on immigra-tion is similar to that on emigration: other things being equal, dense populations receive more immigrants than sparse populations (Kuussaari et al. 1996). Immigration will reduce extinc-tion risk through the demographic rescue effect (Hanski 1999), but immigration may also lead to a genetic rescue effect, as even a small number of immigrants will reduce the level of inbreed-ing.
Parasitism
Parasitism by the specialist larval parasitoid Cotesia melitaearum (Braconidae) increases with population size and age (more time for the parasitoid to have arrived), and decreases with isolation (the parasitoid has a shorter range of migration than the host, van Nouhuys and Hanski 2002b). When the parasitoid has become well established in a local population, it has such a great impact that the risk of host extinction is increased (Lei & Hanski 1997).
Weather
We have used weather radar data to measure precipitation across the entire Åland Islands at a spatial resolution of 1 km2. The precipitation measurement obtained from an official weather station in Åland was compared with the radar-based measurement for a nearby 1 km2 square (Fig. 7). Each data point gives precipitation during a 12-hr period during June–August in 1998–2000 (most periods had zero precipita-tion). There are a few outliers, but overall the correspondence between the two sets of meas-urements is good, with (log) radar measurement explaining 87% of the variation in (log) weather
Precipitation (mm) at weather station0 1 2 3 4
Pre
cipi
tatio
n (m
m)
as m
easu
red
by r
adar
0
1
2
3
4
Fig. 7. Comparison between 12-hr precipitation values (mm) measured at an official weather station (horizon-tal axis) and with a weather radar in a nearby 1-km2 square.

ANN. ZOOL. FENNICI Vol. 42 • Large-scale dynamics of the Glanville fritillary butterfly 389
station measurement. As an example of spatio-temporal variation in precipitation across the entire Åland Islands, we examined the pooled weekly precipitation values in June to August in 1999 (Fig. 8). There is substantial spatial varia-tion even in the pooled data, and naturally con-siderably more in data for shorter periods of time (Fig. 9), indicating that much of the precipitation originates from spatially delimited showers.
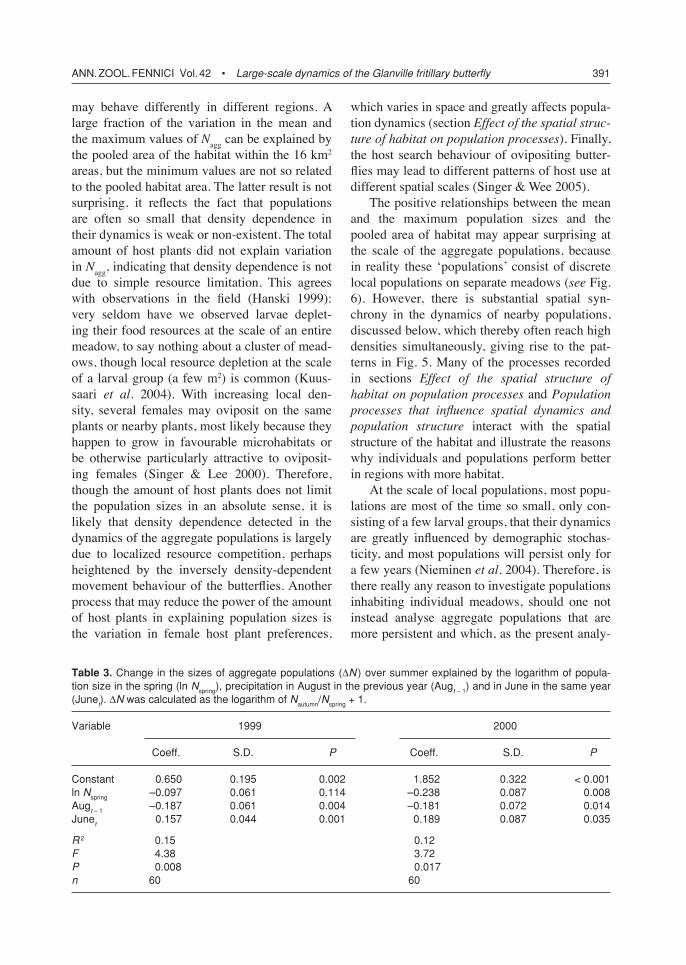
We attempted to explain the change in popu-lation size during the summers of 1999 and 2000 by the monthly precipitation values. The change in population size was measured as the number of larval groups in the population in the autumn divided by the number of larval groups in the spring. For this analysis, the entire study area was divided into 16 km2 squares. Only two monthly precipitation values had significant effects on the change in population size, but
encouragingly these effects were the same in the two years (Table 3). The change in population size during the summer was negatively corre-lated with precipitation in August in the previous year and positively correlated with precipitation in June of the current year. In 2000 the effect of population size was significant, but not in 1999 (Table 3).
Discussion
Our analyses revealed statistically significant and biologically noteworthy patterns in the time series of aggregate population sizes. Previous research has documented many processes that influence the dynamics of spatially delimited local populations. Can the large-scale patterns be explained by the local processes? What might
Fig. 8. Weekly precipitation values (mm) in June–August 1999 based on the weather radar data. Numbers from 1 to 4 refer to the corresponding week in each month.

390 Hanski & Meyke • ANN. ZOOL. FENNICI Vol. 42
be the implications of the large-scale patterns for our understanding of population dynamics? Do we need at all the fine-scale analysis of mostly very small local populations delimited by the actual spatial structure of the habitat?
The analysis of aggregate population counts (Nagg) for the twenty 16 km2 squares distrib-uted across the Åland Islands (Fig. 1) yielded clear evidence of density dependence in tempo-ral dynamics, once we had recognized that Nagg
Fig. 9. Twelve-hour pre-cipitation values (mm) in the second week of August in 1999 (see Fig. 8) based on the weather radar data. Numbers from 4 to 10 refer to the corre-sponding days of August in 1999.
ANN. ZOOL. FENNICI Vol. 42 • Large-scale dynamics of the Glanville fritillary butterfly 391
Table 3. Change in the sizes of aggregate populations (DN ) over summer explained by the logarithm of popula-tion size in the spring (ln Nspring), precipitation in August in the previous year (Augt – 1) and in June in the same year (Junet). DN was calculated as the logarithm of Nautumn/Nspring + 1.
Variable 1999 2000
Coeff. S.D. P Coeff. S.D. P
Constant 0.650 0.195 0.002 1.852 0.322 < 0.001ln Nspring –0.097 0.061 0.114 –0.238 0.087 0.008Augt – 1 –0.187 0.061 0.004 –0.181 0.072 0.014Junet 0.157 0.044 0.001 0.189 0.087 0.035
R 2 0.15 0.12F 4.38 3.72P 0.008 0.017n 60 60
may behave differently in different regions. A large fraction of the variation in the mean and the maximum values of Nagg can be explained by the pooled area of the habitat within the 16 km2 areas, but the minimum values are not so related to the pooled habitat area. The latter result is not surprising, it reflects the fact that populations are often so small that density dependence in their dynamics is weak or non-existent. The total amount of host plants did not explain variation in Nagg, indicating that density dependence is not due to simple resource limitation. This agrees with observations in the field (Hanski 1999): very seldom have we observed larvae deplet-ing their food resources at the scale of an entire meadow, to say nothing about a cluster of mead-ows, though local resource depletion at the scale of a larval group (a few m2) is common (Kuus-saari et al. 2004). With increasing local den-sity, several females may oviposit on the same plants or nearby plants, most likely because they happen to grow in favourable microhabitats or be otherwise particularly attractive to oviposit-ing females (Singer & Lee 2000). Therefore, though the amount of host plants does not limit the population sizes in an absolute sense, it is likely that density dependence detected in the dynamics of the aggregate populations is largely due to localized resource competition, perhaps heightened by the inversely density-dependent movement behaviour of the butterflies. Another process that may reduce the power of the amount of host plants in explaining population sizes is the variation in female host plant preferences,
which varies in space and greatly affects popula-tion dynamics (section Effect of the spatial struc-ture of habitat on population processes). Finally, the host search behaviour of ovipositing butter-flies may lead to different patterns of host use at different spatial scales (Singer & Wee 2005).
The positive relationships between the mean and the maximum population sizes and the pooled area of habitat may appear surprising at the scale of the aggregate populations, because in reality these ‘populations’ consist of discrete local populations on separate meadows (see Fig. 6). However, there is substantial spatial syn-chrony in the dynamics of nearby populations, discussed below, which thereby often reach high densities simultaneously, giving rise to the pat-terns in Fig. 5. Many of the processes recorded in sections Effect of the spatial structure of habitat on population processes and Population processes that influence spatial dynamics and population structure interact with the spatial structure of the habitat and illustrate the reasons why individuals and populations perform better in regions with more habitat.
At the scale of local populations, most popu-lations are most of the time so small, only con-sisting of a few larval groups, that their dynamics are greatly influenced by demographic stochas-ticity, and most populations will persist only for a few years (Nieminen et al. 2004). Therefore, is there really any reason to investigate populations inhabiting individual meadows, should one not instead analyse aggregate populations that are more persistent and which, as the present analy-

392 Hanski & Meyke • ANN. ZOOL. FENNICI Vol. 42
sis shows, exhibit a clear signature of population regulation? The answers to these questions natu-rally depend on the reasons why we are inter-ested in the biology and dynamics of populations in the first place, but we maintain that the study of local populations is very much warranted. Regardless of the highly ephemeral existence of local populations on individual meadows, it is nonetheless essential to study populations at this spatial scale if we want to develop a fundamental understanding of the biological processes that underpin population dynamics. For instance, we know that inbreeding depression significantly reduces the fitness of individuals in the smallest populations and increases their risk of extinction (Saccheri et al. 1998, Nieminen et al. 2001). This process would be entirely missed if we were to focus entirely on the aggregate populations. To take another example, the present results and our previous studies clearly indicate that land-scape structure has a big influence on the size, dynamics, and persistence of metapopulations at the regional scale. Studying the influence of habitat patch areas and connectivities on emi-gration, immigration, and local extinction (sec-tions Effect of the spatial structure of habitat on population processes and Population processes that influence spatial dynamics and population structure) gives us an opportunity to start devel-oping a mechanistic understanding of the roles of the landscape and habitat structure on population dynamics. Spatial variation in landscape struc-ture, succinctly described by the value of the metapopulation capacity, explains a great deal of the occurrence of the butterfly in different parts of the Åland Islands. This result is consistent (though not identical) with the patterns in Fig. 5.
Spatially correlated dynamics
Our previous analyses of changes in local popu-lation sizes and of the rates of local extinction and colonization have revealed a strong statisti-cal influence of the trends in the surrounding populations on what happens locally (Hanski 1999). In other words, population dynamics are strongly spatially correlated. But why?
Dispersal of butterflies must synchronize population dynamics to some extent at the scale
of a few kilometres, and this may help explain the density-dependent changes observed in the aggregate populations in this study. Another potentially synchronizing mechanism is para-sitism by Cotesia melitaearum, which may increase the risk of local host extinction (Lei & Hanski 1997) and might drive spatially cor-related dynamics as predicted by host-parasitoid models (Nicholson & Bailey 1935, Hassell et al. 1991). The ranges of both host and parasitoid migration are short in comparison with the scale of spatially correlated dynamics, but theoretical studies have shown that under certain conditions short-range migration may maintain long-range correlated patterns (Hassell et al. 1991, Turchin et al. 1998).
Though host–parasitoid dynamics is a plau-sible reason for spatially correlated patterns, in the present case parasitism is not an important mechanism explaining density dependence in Nagg and spatially correlated variation in host abundance. First, the parasitoid only occurs in those host butterfly networks in which local host populations are large and occur close to each other (van Nouhuys & Hanski 2002a), while the spatially correlated patterns in host abundance occur everywhere. Second, if short-range migration in the host and the parasitoid maintained spatially correlated variation in their abundances at large spatial scales, we should observe the large-scale spatial patterns to change gradually, with a strong temporal correlation. But in practice, the population sizes at large spa-tial scales change haphazardly from one year to another (see the maps of year-to-year transitions in Nieminen et al. 2004: fig. 4.12). The most likely mechanism for such spatially correlated but temporally uncorrelated abundance changes is spatially correlated weather effects.
Populations of butterflies and other inver-tebrates are typically greatly influenced by the prevailing weather conditions. In the case of the Glanville fritillary, host plants may wither during dry spells in summer and cause widespread larval mortality (Nieminen et al. 2004). On the other hand, adult butterflies can fly in low ambi-ent temperatures only if it is sunny and they can increase their body temperature by basking in the sun. Thus cloudy weather during the adult flight season in June might limit oviposition and hence

ANN. ZOOL. FENNICI Vol. 42 • Large-scale dynamics of the Glanville fritillary butterfly 393
reduce population growth rate. There is marked spatial correlation in precipitation in the Åland Islands (Figs. 8 and 9), and a part of the spatial variation in the annual dynamics of aggregate populations can be explained by spatial variation in precipitation (Table 3). The difficulty here is that it is hard to pinpoint the truly important weather factors, which may be so short-lasting that it is impossible to document them simul-taneously for large areas. For instance, heavy showers in early July may disperse egg clutches and thereby greatly increase mortality of first instar larvae (Nieminen et al. 2004). The meas-ures used in Table 3 are very rough, monthly values of precipitation. It is therefore encourag-ing that the same model explained the change in aggregate population size during the summer in the two years for which we had data. The explan-atory variables were precipitation in August in the previous year and precipitation in June in the current year. The positive effect of precipitation in June is most likely due to improved growth of host plants, which makes it less likely that they will dry out during larval development in late summer (Nieminen et al. 2004). The reason for the negative effect of precipitation in August remains unknown, but it may relate to the physi-ological condition of larvae prior to and during diapause, which in turn would influence their post-diapause development. In any case these results suffice to demonstrate the importance of some precipitation-related processes, and that there is significant spatial variation in these proc-esses within the Åland Islands.
The spatially correlated long-term increas-ing trend in the three aggregate populations in the western Åland Islands over the 11-yr period, and the strong declining trend in several aggregate populations along the north-eastern coastal areas (Fig. 1), remain unexplained. These trends are unlikely to reflect any of the processes discussed in this paper. Potentially, the trends might reflect underlying alternative stable states in metapopulation dynamics, for which there is some evidence (Hanski et al. 1995). An alterna-tive is systematic changes in the structure of the habitats and landscapes, though no changes have taken place that have been noticed by research-ers working in the field during many years. It is worth emphasizing that there is no spatial syn-
chrony in the long-term dynamics of populations across the entire Åland Islands (Fig. 1), which is good news for the long-term persistence of the Glanville fritillary, as spatial asynchrony tends to increase metapopulation persistence (Hanski 1999).
Concluding remarks
The detailed study of local populations of the Glanville fritillary over the past decade has yielded evidence of many processes that have a strong influence on local dynamics, to the extent that many of these processes significantly influence the risk of local extinction and the rate of establishment of new populations (Hanski 1998, Nieminen et al. 2004): demographic sto-chasticity, environmental stochasticity, regional stochasticity, immigration and emigration (lead-ing to Allee effects), host plant preference of migrating females, parasitism, and inbreeding. Most recently, we have documented significant among-population variation in the allele fre-quencies of the glycolytic enzyme phosphoglu-cose isomerase, the variation of which is signifi-cantly related to the dynamics of local popula-tions (I. Hanski unpubl. data). But in spite of many processes having had a strong effect on local dynamics, there are two reasons why we might not expect a strong signal from them in the dynamics of aggregate populations at larger spatial scales. First, particular processes tend to have a strong effect in only some populations in some years, and there are differences among the years in the relative strengths of different proc-esses (Hanski 1999, Nieminen et al. 2004). This applies particularly to environmental stochastic-ity, regional stochasticity, immigration and emi-gration, parasitism, and inbreeding. Second, dif-ferent processes may have counteracting effects. For instance, inbreeding will reduce population sizes due to reduced absolute fitness of indi-viduals (Haikola et al. 2001); reduced population sizes will increase emigration (because emigra-tion is generally inversely density-dependent; Kuussaari et al. 1996); and increased migra-tion among populations will reduce relatedness of individuals in local populations and hence reduce inbreeding.
394 Hanski & Meyke • ANN. ZOOL. FENNICI Vol. 42
To conclude, at present we are not in a posi-tion to explain the large-scale patterns in the population dynamics of the Glanville fritillary documented in Figs. 1–5 with the knowledge of the population processes operating within spatially delimited local populations. One reason is the important role of weather in causing spa-tially correlated unpredictable changes in popu-lation sizes. A more mechanistic understanding of large-scale population dynamics may be pos-sible in the future, but meanwhile it is helpful to conduct analyses of both the patterns and the processes at different spatial scales for a compre-hensive understanding of population dynamics.
References
Boggs, C. & Nieminen, M. 2004: Checkerspot reproductive biology. — In: Ehrlich, P. R. & Hanski, I. (eds.), On the wings of checkerspots: A model system for population biology: 92–112. Oxford University Press, New York.
Haikola, S., Singer, M. C. & Pen, I. 2004: Has inbreeding depression led to avoidance of sib mating in the Glan-ville fritillary butterfly (Melitaea cinxia)? — Evol. Ecol. 18: 113–120.
Haikola, S., Fortelius, W., O’Hara, R. B., Kuussaari, M., Wahlberg, N., Saccheri, I. J., Singer, M. C. & Hanski, I. 2001: Inbreeding depression and the maintenance of genetic load in Melitaea cinxia metapopulations. — Cons. Gen. 2: 325–335.
Hanski, I. 1982: On patterns of temporal and spatial variation in animal populations. — Ann. Zool. Fennici 19: 21–37.
Hanski, I. 1990: Density dependence, regulation and vari-ability in animal populations. — Phil. Trans. R. Soc. Lond. B 330: 141–150.
Hanski, I. 1998: Metapopulation dynamics. — Nature 396: 41–49.
Hanski, I. 1999: Metapopulation ecology. — Oxford Univer-sity Press, New York.
Hanski, I. 2001: Spatially realistic theory of metapopulation ecology. — Naturwissenschaften 88: 372–381.
Hanski, I. & Ovaskainen, O. 2000: The metapopulation capacity of a fragmented landscape. — Nature 404: 755–758.
Hanski, I. & Ovaskainen, O. 2003: Metapopulation theory for fragmented landscapes. — Theor. Pop. Biol. 64: 119–127.
Hanski, I. & Singer, M. 2001: Extinction–colonization dynamics and host-plant choice in butterfly metapopula-tions. — Am. Nat. 158: 341–353.
Hanski, I. & Woiwod, I. P. 1991: Delayed density-depend-ence. — Nature 350: 28.
Hanski, I. & Woiwod, I. P. 1993: Spatial synchrony in the dynamics of moth and aphid populations. — J. Anim. Ecol. 62: 656–668.
Hanski, I., Alho, J. & Moilanen, A. 2000: Estimating the parameters of survival and migration of individuals in metapopulations. — Ecology 81: 239–251.
Hanski, I., Kuussaari, M. & Nieminen, M. 1994: Metapopu-lation structure and migration in the butterfly Melitaea cinxia. — Ecology 75: 747–762.
Hanski, I., Moilanen, A., Pakkala, T. & Kuussaari, M. 1996: The quantitative incidence function model and persist-ence of an endangered butterfly metapopulation. — Cons. Biol. 10: 578–590.
Hanski, I., Pöyry, J., Pakkala, T. & Kuussaari, M. 1995: Mul-tiple equilibria in metapopulation dynamics. — Nature 377: 618–621.
Hanski, I., Erälahti, C., Kankare, M., Ovaskainen, O. & Sirén, H. 2004: Variation in migration rate among indi-viduals maintained by landscape structure. — Ecol. Lett. 7: 958–966.
Hassell, M. P., Comins, H. N. & May, R. M. 1991: Spa-tial structure and chaos in insect population dynamics. — Nature 353: 255–258.
Kuussaari, M., Nieminen, M. & Hanski, I. 1996: An experi-mental study of migration in the Glanville fritillary but-terfly Melitaea cinxia. — J. Anim. Ecol. 65: 791–801.
Kuussaari, M., Singer, M. & Hanski, I. 2000: Local speciali-zation and landscape-level influence on host use in an herbivorous insect. — Ecology 81: 2177–2187.
Kuussaari, M., Saccheri, I., Camara, M. & Hanski, I. 1998: Allee effect and population dynamics in the Glanville fritillary butterfly. — Oikos 82: 384–392.
Kuussaari, M., van Nouhuys, S., Hellmann, J. C. & Singer, M. C. 2004: Larval biology of checkerspots. — In: Ehr-lich, P. R. & Hanski, I. (eds.), On the wings of checkers-pots: A model system for population biology: 138–180. Oxford University Press, New York.
Lei, G. & Hanski, I. 1997: Metapopulation structure of Cotesia melitaearum, a specialist parasitoid of the but-terfly Melitaea cinxia. — Oikos 78: 91–100.
Living Planet Report 2004. WWF, Gland, Switzerland.Moilanen, A. & Hanski, I. 1998: Metapopulation dynam-
ics: effects of habitat quality and landscape structure. — Ecology 79: 2503–2515.
Nicholson, A. J. & Bailey, V. A. 1935: The balance of animal populations. — Proc. Zool. Soc. Lond. 3: 551–598.
Nieminen, M., Siljander, M. & Hanski, I. 2004: Structure and dynamics of Melitaea cinxia metapopulations. — In: Ehrlich, P. R. & Hanski, I. (eds.), On the wings of check-erspots: A model system for population biology: 63–91. Oxford University Press, New York.
Nieminen, M., Singer, M. C., Fortelius, W., Schöps, K. & Hanski, I. 2001: Experimental confirmation that inbreed-ing depression increases extinction risk in butterfly pop-ulations. — Am. Nat. 157: 237–244.
Ovaskainen, O. 2004: Habitat-specific movement parameters estimated using mark-recapture data and a diffusion model. — Ecology 85: 242–257.
Ovaskainen, O. & Hanski, I. 2001: Spatially structured meta-population models: global and local assessment of meta-population capacity. — Theor. Pop. Biol. 60: 281–304.
Ovaskainen, O. & Hanski, I. 2004: Metapopulation dynam-ics in highly fragmented landscapes. — In: Hanski, I. &

ANN. ZOOL. FENNICI Vol. 42 • Large-scale dynamics of the Glanville fritillary butterfly 395
Gaggiotti, O. E. (eds.), Ecology, genetics, and evolution of metapopulations: 73–104. Elsevier Academic Press, Amsterdam.
Petit, S., Moilanen, A., Hanski, I. & Baguette, M. 2001: Metapopulation dynamics of the bog fritillary butter-fly: movements between habitat patches. — Oikos 92: 491–500.
Roland, J. 2005: Are the “seeds” of spatial variation in cyclic dynamics apparent in spatially-replicated short time-series? An example from the forest tent caterpillar. — Ann. Zool. Fennici 42: 397–407.
Saccheri, I. J., Kuussaari, M., Kankare, M., Vikman, P., Fortelius, W. & Hanski, I. 1998: Inbreeding and extinc-tion in a butterfly metapopulation. — Nature 392: 491–494.
Sinclair, A. R. E. 1989: Population regulation in animals. — In: Cherrett, J. M. (ed.), Ecological concepts: 197–242. Blackwell, Oxford.
Singer, M. C. & Hanski, I. 2004: Dispersal behavior and evolutionary metapopulation dynamics. — In: Ehrlich, P. R. & Hanski, I. (eds.), On the wings of checkerspots: A model system for population biology: 181–198. Oxford University Press, New York.
Singer, M. C. & Lee, J. R. 2000: Discrimination within and between host species by a butterfly: Implications for design of preference experiments. — Ecol. Lett. 3: 101–105.
Singer, M. C. & Wee, B. 2005: Spatial pattern in checkerspot butterfly–host plant association at local, metapopulation and regional scales. — Ann. Zool. Fennici 42: 347–361.
Taylor, L. R. 1986: Synoptic dynamics, migration and the Rothamsted insect survey. — J. Anim. Ecol. 55: 1–38.
Thomas, C. D. & Hanski, I. 2004: Metapopulation dynamics in changing environments: butterfly responses to habitat and climate change. — In: Hanski, I. & Gaggiotti, O. E.
(eds.), Ecology, genetics, and evolution of metapopula-tions: 489–514. Elsevier Academic Press, Amsterdam.
Turchin, P. 1995: Population regulation: old arguments and a new synthesis. — In: Cappuccino, N. & Price, P. (eds.), Population dynamics: new approaches and synthesis: 19–40. Academic Press, London.
Turchin, P. 2003: Complex population dynamics: A theoreti-cal/empirical synthesis. — Princeton: Princeton Univer-sity Press.
Turchin, P., Reeve, J. D., Cronin, J. T. & Wilkens, R. T. 1998: Spatial pattern formation in ecological systems: bridging theoretical and empirical approaches. — In: Bascompte, J. & Solé, R. V. (eds.), Modelling spatiotemporal dynam-ics in ecology: 199–213. Springer, Berlin.
van Nouhuys, S. & Hanski, I. 2002a: Multitrophic interac-tions in space: metacommunity dynamics in fragmented landscapes. — In: Tscharntke, T. & Hawkins, B. A. (eds.), Multitrophic level interactions: 124–147. Cam-bridge University Press, Cambridge.
van Nouhuys, S. & Hanski, I. 2002b: Colonization rates and distances of a host butterfly and two specific parasi-toids in a fragmented landscape. — J. Anim. Ecol. 71: 639–650.
van Nouhuys, S., Singer, M. C. & Nieminen, M. 2003: Spa-tial and temporal patterns of caterpillar performance and the suitability of two host plant species. — Ecol. Ent. 28: 193–202.
Vuorinen, V., Peltomäki, M., Rost, M. & Alava, M. J. 2004: Networks in metapopulation dynamics. — European Physical Journal B 38: 261–268.
Wahlberg, N., Klemetti, T., Selonen, V. & Hanski, I. 2002: Metapopulation structure and movements in five species of checkerspot butterflies. — Oecologia 130: 33–43.
Woiwod, I. P. & Hanski, I. 1992: Patterns of density depend-ence in moths and aphids. — J. Anim. Ecol. 61: 619–629.
This article is also available in pdf format at http://www.sekj.org/AnnZool.html

![Regal Fritillary Petition - Wisconsin Public Radio · According to NatureServe (2012 at 14), “no butterfly anywhere in the world resembles this [the regal fritillary].” The species’](https://img.pdfslide.us/doc/110x75/607d062716bcd12054651245/regal-fritillary-petition-wisconsin-public-radio-according-to-natureserve-2012.jpg)