Embed Size (px)
Citation preview

NASA CR-14488810 DE6EMBER 1975
Langley Application ExperimentsData Management System Study
Final Report
Contract NAS1-13657
prepared forNational Aeronautics and Space Administration
Langley Research Center
Hampton, Virginia
AeronutronicAeronutronic Ford Corporation jSpace Information Systems Operation !
1002 Gemini Avenue }Houston, Texas 77058 I
I
https://ntrs.nasa.gov/search.jsp?R=19760006864 2019-08-25T05:01:35+00:00Z

NASA CR-14488810 December 1975
LANGLEY APPLICATIONS EXPERIMENTSDATA MANAGEMENT SYSTEM STUDY
FINAL REPORT
Contract NAS 1-13657
Prepared for
NATIONAL AERONAUTICS AND SPACE ADMINISTRATIONLANGLEY RESEARCH CENTER
HAMPTON, VIRGINIA
Prepared by;
Approved by
C. C. Lanham, Jr.Study Manager
C. H. Denny, ManageiSystems Department
C. \i. Abb it t, ManagerSystem Engineering Activity
AERONUTRONIC FORD CORPORATIONAEROSPACE AND COMMUNICATIONS OPERATIONS
SPACE INFORMATION SYSTEMS OPERATION1002 GEMINI AVENUEHOUSTON, TEXAS

FOREWORD
The Langley Applications Experiments Data Management System Studywas conducted to provide ROM cost estimates of the ground process-ing to support the flights of the Advanced Technology Laboratory(ATL). The Study was conducted by the Space Information SystemsOperation of Aeronutronic-Ford Corporation under Contract NAS 1-13657 for the Langley Research Center. Mr. F. 0. Allamby and Ms.K. D. Brender were the technical study managers for Langley Re-search Center. The Study was conducted during a 12 month periodfrom November 1974 to November 1975.
The final report consists of technical results of the Study on atask by task basis. The results of Task I3 Experiments OperationsAnalysis, is continued in section 4 of the final report. Section5 contains the ground processing requirements for the preprocess-ing of experiment data and a mini operational control center forALT flight support. Section 6 contains the configuration andcosting information. The configuration and costing is based on1975 state-of-the art and 1975 costs. The costing was carriedthrough fringe, burden, and profit.
-11-
TABLE OF CONTENTS
Section
1 INTRODUCTION
1.1 Purpose 1-11.2 Scope 1-1
2 REFERENCES 2-1
3 ACRONYMS AND ABBREVIATIONS 3-1
4 EXPERIMENT OPERATIONS ANALYSIS
4.1 Subtask 1.1, Operations Analysis .... 4-1
,.---''"' 4.1.1 Methodology 4-1
4.1.1.1 Planning Phase 4-14.1.1.2 Integration and Checkout 4-44.1.1.3 Operations Phase 4-64.1.1.4 Postflight Phase 4-8
4.1.2 Areas of Impact 4-10
4.1.2.1 Experiment Integration/Checkout 4-104.1.2.2 ATL/Shuttle Integration/Checkout .... 4-104.1.2.3 Operations Support 4-104.1.2.4 Postflight Data Reformatting 4-12
4.2 Subtask 1.2, LRC Facility Analysis . . . 4-13
4.2.1 Operational Capability 4-134.2.2 Data Throughput 4-154.2.3 System Characteristics 4-15
4.2.3.1 Hardware Characteristics 4-154.2.3.2 Software Characteristics 4-204.2.3.3 Operating Schedule .... 4-224.2.3.4 Equipment for Support of ATL 4-26
-111-
TABLE OF CONTENTS (CONT'D)
Section Page
4.3 Subtask 1.3, Experiments Analysis .... 4-27
4.3.1 Methodology 4-27
4.3.1.1 Format Definitions 4-274.3.1.2 Format Structure 4-294.3.1.3 Timing 4-30
4.3.2 Communications and Navigations 4-31
4.3.2.1 NV-1, Microwave InterferometerNavigation and Tracking Aid '. 4-31
4.3.2.2 NV-2, Autonomous Navigation/Landmark^. " Tracker 4-33
4.3.2.3 NV-3, Multipath Measurements 4-36
4.3.3 Earth Observations 4-40
4.3.3.1 EO-1, Lidar Measurements of CirrusClouds and Lower StratosphericAerosols 4-40
4.3.3.2 EO-2, Tunable Lasers for High-ResolutionStudies of Atmospheric Constituentsand Pollutants 4-42
4.3.3.3 EO-3, Multispectral Scanner . 4-444.3.3.4 EO-4, Microwave Radiometer 4-494.3.3.5 EO-5, Precision Laser Ranging and
Altimetry 4-524.3.3.6 EO-6, Microwave Altimeter 4-564.3.3.7 EO-7, Search and Rescue Aids 4-574.3.3.8 EO-7/8, Imaging Radar 4-574.3.3.9 EO-9, RF Noise 4-634.3.3.10 S190A 4-67
4.3.4 Physics and Chemistry 4-71
4.3.4.1 PH-1, Spacecraft Wake Dynamics 4-714.3.4.2 PH-2, Barium Cloud Release on Sunward
Side of Earth 4-72
-iv-
TABLE OF CONTENTS (CONT'D)
Section Fage
4.3.4.3 PH-3, Optical Properties of Aerosols . . 4-764.3.4.4 PH-6, Ultraviolet Meteor Spectroscopy
From Near-Earth Orbit 4-76
4.3.5 Microbiology 4-80
4.3.5.1 MB-1, Colony Growth in Zero Gravity . . . 4-834.3.5.2 MB-2, Interpersonal Transfer of Micro-
organisms in Zero Gravity 4-844.3.5.3 MB-3, Electrical Field Opacity in
Biological Cells 4-864.3.5.4 MB-4, Electrical Characteristics of
Cells 4-86_^— ' 4.3.5.5 MB-5, Special Properties of Biological
Cells 4-88
4.3.6 Component and System Testing 4-90
4.3.6.1 CS-2, Zero-Gravity Steam Generator ... 4-92
4.3.7 Environmental Effects . 4-93
4.3.7.1 EN-1, Sampling of Airborne Particlesand Micro-Organisms in Space CabinEnvironment 4-93
4.3.7.2 EN-3, Environmental Effects on Non-Metallic Materials . . . » 4-96
4.3.8 Data Recording 4-99
4.3.8.1 Spacelab Recorder « 4-994.3.8.2 Medium Capacity Recorder 4-994.3.8.3 High-Capacity Recorder 4-994.3.8.4 Low Data Rate Experiments 4-994.3.8.5 Data Volume 4-107
-v-
TABLE OF CONTENTS (CONT'D)
Section Page
4.3.9 Major Considerations 4-107
4.3.9.1 Low Data Rate Experiments 4-1074.3.9.2 Medium Data Rate Experiments 4-1074.3.9.3 EO-7/8 4-107
5 GROUND SUPPORT DATA MANAGEMENT SYSTEM REQUIREMENTS
5.1 Subtask 2.1, Functional Requirements . . 5-1
5.1.1 Support Requirements 5-15.1.2 DRS Requirements 5-2
_-—-"' 5.1.2.1 Input Requirements 5-25.1.2.2 Reformatting Requirements 5-35.1.2.3 Data Quality Requirements 5-11
5.1.3 POSC Requirements 5-11
5.1.3.1 Functions 5-155.1.3.2 Data Categories 5-155.1.3.3 Data Link Estimates 5-185.1.3.4 Data Interfaces 5-185.1.3.5 Support Classifications 5-20
5.2 Subtask 2.2, Performance Requirements . . 5-21
5.2.1 DRS Throughput Requirements 5-215.2.2 DRS Computational Requirements 5-275.2.3 DRS Computer Compatible Tapes (CCT) ... 5-305.2.4 POSC Support Requirements 5-30
6 CONFIGURATION CONCEPT DEVELOPMENT
6.1 Subtask 3.1, Configuration Concepts . . . 6-16.2 Subtask 3.2, Trade-Off Analysis 6-5
-vi-
TABLE OF CONTENTS (CONT'D)
Section
6.2.16.2.2
6.3
6.3.16.3.26.3.36.3.4
6.4
SUMMARY
Processing TimesCost Factors
Subtask 3.3, DRS Preferred ConfigurationConcept ,
Instrumentation InterfaceCentral Processor ....Software ConfigurationOperational Support . . .
Payload Operations Support Center Costs
Page
6-56-7
6-9
6-96-96-96-9
6-17
7-1
-vii-
LIST OF FIGURES
Figure^ Page
4.1-1 Integration/Checkout Function Flow 4-5
4.1-2 Data System Functional Flow 4-11
4.2-1 System Control Unit Subsystem 4-14
4.3-1 MTU/Payload Timing Signal Flow Diagram 4-32
5.1-1 Reformatting Process for EO-3 5-5
5.1-2 CCT Scan Line Data Set 5-6
5.1-3 Imaging Radar Data Record 5-8
5.1-4 Descriptor File 5-9
5.1-5 EO-4 PCM Frame on CCT 5-13
-5.1-6 DRS Functional Flow 5-14
5.1-7 Data Interface Overview » . . . 5-19
5.2-1 POSC Support Timeline 5-35
6.1-1 DRS Concept I 6-2
6.1-2 DRS Concept II 6-4
6.2-1 . DRS Floor Plan 6-8
6.4-1 POSC Functional Diagram 6-18
-Vlll-
LIST OF TABLES
Table Page
4.2-1 Instruction Digits 4-19
4.2-2 ID Record Format 4-23
4.2-3 Name Record Format 4-24
4.2-4 Data Record Format 4-25
4.3-1 Study Experiment List 4-28
4.3-2 NV-1, Microwave Interferometer Navigation andTracking Aid 4-34
4.3-3 NV-2, Autonomous Navigation/Landmark Tracker . . . 4-37
4.3-4 NV-3, Multipath Measurements Format 4-41
4--3-5 EO-1, Lidar Measurements Format 4-43
4.3-6 EO-2A, Tunable Laser Heterodyne Radiometer .... 4-45
4.3-7 EO-2B, Tunable Injection Laser Monochromator . . . 4-46
4.3-8 EO-3, Multispectral Scanner Data Frames 4-48
4.3-9 EO-3, Multispectral Scanner Housekeeping Frame . . 4-50
4.3-10 EO-4, Microwave Radiometer Format » 4-51
4.3-11 EO-5, Precision Laser Ranging and AltimetryFormat 4-54
4.3-12 EO-6, Microwave Altimeter Data Frame Format . . . 4-58
4.3-13 EO-6, Microwave Altimeter Housekeeping Measure-ment List 4-59
4.3-14 EO-6, Microwave Altimeter Data Measurement List . 4-60
4.3-15 EO-7/8, Imaging Radar Format 4-64
4.3-16 EO-9, RF Noise Format 4-68
4.3-17 S190A Format 4-69
4.3-18 PH-1, Spacecraft Wake Dynamics 4-73
4.3-19 PH-2, Barium Cloud Release Format 4-77
-ix-

LIST OF TABLES (CONT'D)
Table
4.3-20 PH-3, Optical Properties of Aerosols 4-78
4.3-21 PH-6, UV Meteor Spectrographs CandidateParameters and Format 4-81
4.3-22 MB-1, Colony Growth in Zero Gravity 4-85
4.3-23 MB-3, Electrical Field Opacity in BiologicalCells 4-87"
4.3-24 MB-4, Electrical Characteristics of Cells .... 4-89
4.3-25 MB-5, Special Properties of Biological Cells . . . 4-91
4.3-26 CS-2, Zero-Gravity Steam Generator 4-94
4.3-27 EN-3, Environmental Effects of Nonmetalic--""' Materials 4-98
4.3-28 Spacelab Recorder Characteristics 4-100
4.3-29 Spacelab Recorder Tape Volume 4-101
4.3-30 Medium Capacity Recorder Characteristics 4-102
4.3-31 Medium Capacity Recorder Tape Volume 4-103
4.3-32 High Capacity Recorder Characteristics 4-104
4.3-33 High Capacity Recorder Tape Volume ........ 4-105
4.3-34 Low Data Rate Sensors 4-106
4.3-35 Data Volume by Experiment 4-108
5.1-1 Minimum Input Buffer Requirements 5-4
5.1-2 Record Length by Experiment 5-12
5.2-1 ATL Payload No. 1 5-22
5.2-2 ATL Payload No. 2 5-23
5.2-3 ATL Payload No. 3 ' 5-24
5.2-4 ATL Payload No. 4 5-25
5.2-5 Pallet Only Payload 5-26
-x-

LIST OF TABLES (CONT'D)
Table Page
5.2-6 Experiment Processing Times 5-28
5.2-7 Computations/Second for ATL Experiments 5-29
5.2-8 Computer Compatible Tape Requirements 5-31
5.2-9 Support Characteristics 5-33
6.2-1 Configuration Processing Times 6-6
6.3-1 Total Cost of the DRS 6-10
6.3-2 Instrumentation Interface 6-11
6.3-3 Central Processor 6-12
6.3-4 DRS Operating System Cost 6-13
^6^*3-5 Generalized Checkout/Validation System Cost . . . 6-14
6.3-6 Support Costs 6-16
6.4-1 Hardware Costs 6-20
6.4-2 Software Cost 6-21
6.4-3 POSC System Cost 6-22
-xi-
SECTION 1
INTRODUCTION
1.1 PURPOSE
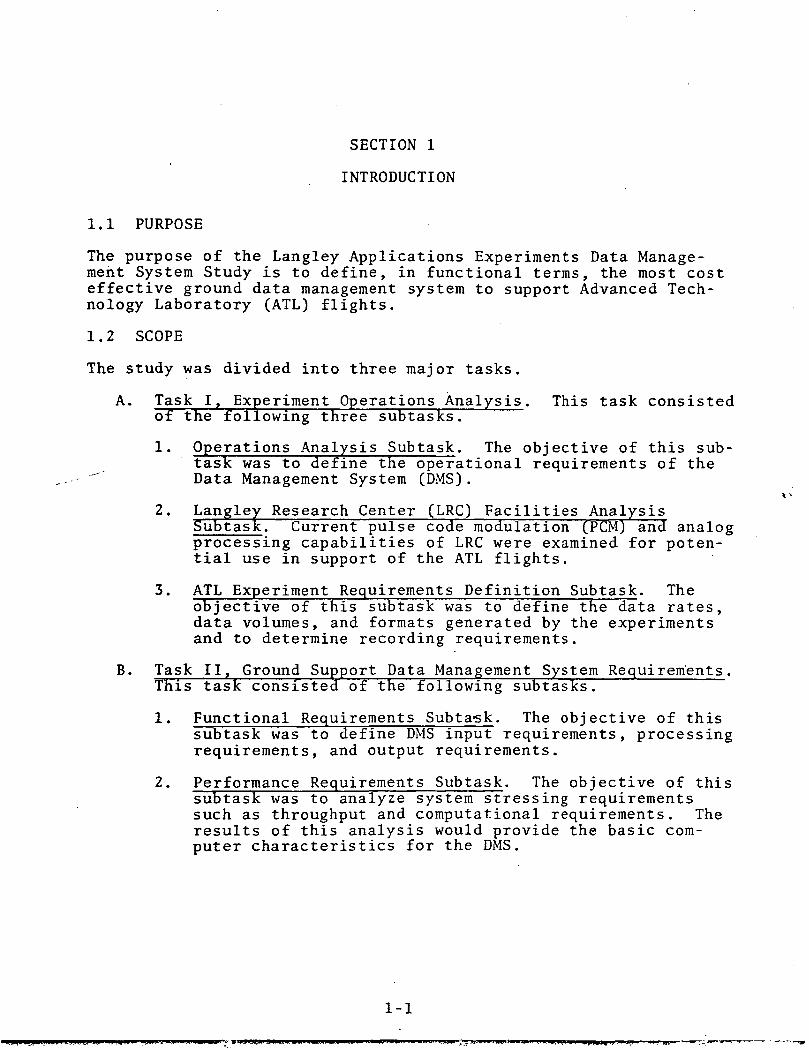
The purpose of the Langley Applications Experiments Data Manage-ment System Study is to define, in functional terms, the most costeffective ground data management system to support Advanced Tech-nology Laboratory (ATL) flights.
1.2 SCOPE
The study was divided into three major tasks.
A. Task I, Experiment Operations Analysis. This task consistedof the following three subtasks.
1. Operations Analysis Subtask. The objective of this sub-task was to define the operational requirements of theData Management System (DMS).
2. Langley Research Center (LRC) Facilities AnalysisSubtask!Current pulse code modulation(PCM) and analogprocessing capabilities of LRC were examined for poten-tial use in support of the ATL flights.
3. ATL Experiment Requirements Definition Subtask. Theobjective of this subtask was to define the data rates,data volumes, and formats generated by the experimentsand to determine recording requirements.
B. Task II, Ground Support Data Management System Requirements.This task consisted of the following subtasks.
1. Functional Requirements Subta-sk. The objective of thissubtask was to define DMS input requirements, processingrequirements, and output requirements.
2. Performance Requirements Subtask. The objective of thissubtask wasto analyze system stressing requirementssuch as throughput and computational requirements. Theresults of this analysis would provide the basic com-puter characteristics for the DMS.
1-1
C. Task III, Preferred Ground Data Management System Config-uration"/This task consisted of the following three sub-t^asks:
1. Configuration Concept Development Subtask. The ob-jective of this subtask was to develop candidate con-figurations which could meet the requirements outlinedin Task II.
2. Trade-off Analysis Subtask. This subtask involved per-forming engineering and cost trade analyses on thecandidate systems to determine the most cost effectiveconcept.
3. Preferred Configuration Subtask. This subtask consistedof providing a ROM cost of the preferred system con-figuration.
This document presents the results from each subtask and therecommended system configuration for reformatting the experimentinstrumentation tapes to computer compatible tape. Included inTask III are cost factors for development of a mini control centerfor LRC for real-time support of the ATL flights.
1-2

SECTION 2
REFERENCES
Resources used to perform experiments analysis are as follows:
• NASA, Study of Shuttle Compatible Advanced TechnologyLaboratory. NASA, September 1973. (TM X-2813).
• NASA/LRC, ATL Experiment Data Sheets, April 1974.
• NASA/ESRO, Spacelab Payload Accommodation Handbook.NASA/ESRO, October 1974. (Preliminary Report, ESTEC Ref.No. SLP/2104).
• JSC, Space Shuttle System Payload Accommodation of Level IIProgram Definition and Requirements. JSC, January 1975.
"". XIV. (JSC-07700).
Contractor reports on individual experiments (where appli-cable these reports are referenced in the documentationfor each experiment)
Similar type experiments which were flown aboard the Skylaband Apollo Missions
Technical journals and reports.
2-1
SECTION 3
ACRONYMS AND ABBREVIATIONS
A/D
A/G
ATL
b/s
CCT
D/A
DMS
DRS
GMT/MET
GSE
GSFC
'ID
IRIG-B
I/S
LRC
LRCDMS
Mb/s
MTU
PAM/PDM
PCC
PCM
PI
P/L
PMT
POC
POSC
analog-to-digital
air/ground
Advanced Technology Laboratory
bits per second
computer compatible tape
digital-to-analog
Data Management System
Data Reformatting System
Greenwich Mean Time/Mission Elapsed Time
ground support equipment
Goddard Space Flight Center
identification
Interrange Instrumentation Group Format B
inches per second
Langley Research Center
Langley Research Center Data Management System
megabits per second
Master Timing Unit
pulse amplitude/duration modulation
Payload Control Center
pulse code modulation
principal investigator
payload
Photo Multiplier Tube
Payload Operations Center
Payload Operations Support Center
3-1

RF radio frequency
RTC real-time command
SCU system control unit
STDN Spacecraft Tracking and Data Network
STS Space Transportation System
TSC time search unit
UV ultraviolet
3-2
SECTION 4
. . EXPERIMENT OPERATIONS ANALYSIS
4.1 SUBTASK 1.1, OPERATIONS ANALYSIS
The purpose of this subtask was to investigate program level opera-tional requirements for the Advanced Technology Laboratory (ATL)in order to determine the areas of impact to the Langley ResearchCenter (LRC) data reformatting system operations.
4.1.1 Methodology. The analysis of the operations was dividedinto the following four main areas of interest:
• Planning Phase
• Integration and Checkout
• Operation Phase
"• Postflight Phase..
The requirements of each phase was then investigated with emphasisplaced on pointing out the areas that would impact operation ofthe data reformatting system.
4.1.1.1 Planning Phase. This phase involves the development ofplans, procedures, activities, and schedules for the ATL mission.It will require coordination, discussion, and document transferbetween LRC and other NASA centers. The major interfaces willinclude:
• MSFC - Spacelab activities
• KSC - Shuttle/ATL integration and checkout activities
• JSC - Mission activities and postflight support
• GSFC - Spacecraft Tracking and Data Network (STDN) activities
• Principal Investigators - Experiment requirements and outputproducts
4-1
It is assumed that experiment integration and checkout will beperformed at LRC.
The major documents to be generated in this phase include:
A. Payload Mission Plan. This plan will be submitted to theNASA Headquarters approving authority. Based on this plan,the approving authority will prepare a mission requirementsdocument. This plan will include:
• Crew requirements
• Orbital parameters
• Communication requirements
• Experiment schedules.
---B~. Mission Requirements Document. This document will bedeveloped by NASA Headquarters with assistance of LRC andother NASA centers. It will be used by JSC, KSC, GSFC,and any other organizations for definition of their flightsupport responsibilities. This document will contain:
• Experiment descriptions
• Flight objectives
• Operations requirements from prelaunch through post-flight data processing
• Detailed requirements for flight scheduling, payloaddestination, data requirements, crew skills, groundfacilities, and vehicle utilization.
C. Payload Crew Flight Plan. The major inputs to this planwill be experiment and principal investigator (PI) require-ments, and the mission requirements document. This planwill include:
• Activities of the payload flight crew
• Activities of the payload ground crew which are relatedto flight crew activities.
4-2

D. Detailed Shuttle Crew Flight Plan. This plan will bedeveloped by JSC and will require LRC support. Duringthis period the payload crew flight plan will be finalizedbased on modifications required or revealed during thedevelopment of the Shuttle crew flight plan.
E. Shuttle/Payload Flight Data File Definition. This willbe a joint effort between LRC and JSC. The document pro-duced in this effort will serve as a JSC/LRC interfaceagreement device for the ATL mission. The definition willestablish the following:
• Standard Shuttle procedures required
• New or unique Shuttle procedures required
• Shuttle/payload interface procedures required
"'• Standard payload procedures required
• New or unique payload procedures required
• Schedule and distribution requirements.
F. Payload Command Plan. This plan will contain the followinginformation:
• Preplanned payload commands that may be initiated fromLRC or JSC
• Critical commands which are those that could possiblyconstitute a hazard to the Orbiter or the ATL.
G. Experiment/ATL Integration and Checkout Plan
H. ATL/Shuttle Integration and Checkout Plan
I. Training Plan. This plan shall contain data for trainingof the commander and pilot and ground support personnelto support an ATL flight.
4-3
4.1.1.2 Integration and Checkout. This phase involves the LRCintegration and checkout of the integrated ATL prior to shipmentto the launch site (reference figure 4.1-1). The final step inthis phase will be the recording of experiment data for pro-cessing by the data reformatting system. The major efforts ofthis phase will include:
A. Development of test procedures for checkout of the ATLsubsystems and experiments
B. Development of calibration and checkout procedures fortelemetry data and health and status signals for recordingof transmission to the ground
C. Procedures for checkout of receiving, validating, andresponding to commands from the ground system
D. Development of procedures for validating the results of,.-""" the processing by the Data Reformatting System (DRS) which
will include the following:
• Number of frames to be recorded by experiment
• Requirements for validation of data values containedon the recording prior to data reformatting
• Number of frames to be processed by the DRS
• Procedures for validating the reformatting processby a comparison of the output data against the recordeddata tape
E. Support of the above procedures during the integration/checkout phase.
F. Complete acceptance testing and ship to launch site 3months prior to launch date.
4-4

< UJOC I-LU if)Q_>O CO
_i o< C£> o.
(SiUJ
Q.LUoroCO
ao
O(U
o•1-1•(->rtinGOa>
«*
<u3
(i,
CVJ
4 - 5

4.1.1.3 Operations Phase. The operations phase includes theintegration/checkout of the ATL/Shuttle at the launch site,integrated simulations for checkout and training purposes, andthe launch, orbital, entry and landing phases of the mission.The major functions to be performed during this phase include:
A. Develop an ATL checkout program or test plan for checkoutof the ATL at KSC during installation and the on-padcheckout. Conduct or assist the launch site in ATLcheckout and calibration. Remotely monitor the checkoutfrom the Payload Control Center (PCC) and control thecheckout sequence from the center as required.
B. Coordinate and control all ATL inflight operations. Theinterface from the PCC to the crew onboard the Shuttlewill be through the payload officer at JSC. Maintain avoice interface with the payload crew during communicationcoverage periods.
C. Generate commands. Commands will be transmitted to JSCfrom the PCC prior to execution. These commands will beformatted to meet the JSC command requirements and willrequire no special handling at JSC other than storageuntil execution time.
D. Coordinate experiment operations with other ground systemsor locations involved.
E. Receive selected experiment data during flights for thepurpose of "quick-look" analysis of the experiment andits results.
F. Conduct real-time planning (replanning) of experimentsas circumstances or contingencies dictate. Coordinatewith the JSC payload officer in developing workaroundprocedures and alternatives to accomplish experiments andmission objectives.
G. Receive real-time or dumped ATL engineering data orexperiment data from the Shuttle through JSC via a tele-communication link. Communication links through JSC arerequired for voice, telemetry, TV, and trajectory.
4-6
Current JSC plans are to support Shuttle payload operations withthe following facilities and capabilities:
• Console and computer terminal facilities for two liaisonrepresentatives from the Payload Operations Center (POC)
• Office space for 6 to 10 POC representatives from about1 month prior to flight
• Decommutation of payload data streams (up to 2 Mb/s)
• Delivery of payload data greater than 2 Mb/s in a raw dataformat
• Engineering unit conversion and display in real time ofless than 2 Mb/s of payload data with hardcopy capability
• Command uplink capability of POC generated real-time commands, —~~ ~' (RTC's) and loads which use the Orbiter command system
• Air-to-ground voice capability for science operations
• Generation of computer-compatible tapes (CCT's) or provideelectronic data transfer for all payload offline or offsitescientific processing
• Integration of payload operator detailed Payload (P/L)Crew Flight Plan with the Space Transportation System (STS)Crew Flight Plan
• Integrated crew and ground team training for integratedoperations.
A standardized set of ground support tools will also be made avail-able to the payload community for their P/L planning. These toolsexist 1) to support Shuttle Operations, 2) are required by severalpayload operators, or 3) can only be uniquely provided. Examplesof this capability include the following:
• Vehicle attitude and orbital element history
• Consumable-use predictions for maneuvers
4-7

• Vehicle lighting predictions
• Target pointing programs for celestial and orbital targets
• Occultation computations for Earth and celestial targetsincluding vehicle occultation as viewed from Orbiter ordifferent payload bay locations
• Orbit prediction and maneuver computations.
4.1.1.4 Postflight Phase. This phase involves the delivery ofthe experiment data tapes to the Data Reformatting Facility, thegeneration of computer compatible tapes and associated tabulations,and the delivery of the reformatted data to the PI.
4.1.1.4.1 Data Tape Routing. The procedures for routing therecorded experiment data to the Reformatting System were devel-oped in the mission planning phase. The Reformatting Systemcould possibly be located at LRC, JSC, or GSFC. For the purposeof this study the assumption is the location will be at LRC.
4.1.1.4.2 Data Processing.
A. Assumptions. The following assumptions have been madefor data processing:
• All experiment data will be recorded. The Data Refor-matting System will be required to reformat the datafrom all experiments defined in this study.
• Ephemeris data will be generated on CCT's at JSC anddelivered in a common format to Pi's.
• The Data Reformatting System will not be concerned withthe ephemeris data as an input, but will be required totime tag the experiment data in a granularity that allowsthe ephemeris data to be merged into the applicationsprocessing.
B. Reformatting. The reformatting requirements will be gener-ated in Task II of the study. In addition to reformatting,
4-8

other functions the system will be required to performinclude:
• Data and system health monitoring
• Sync loss and data quality checks
• Screening capability
• Data annotation.
Output Requirements. The major output will be in the formof computer compatible tape. Tabulations of data qualityand time for each data reformatting process will also berequired. Listed below are five of the high data rateexperiments and the number of CCT's which would be gener-ated based on mission data volume.
Experiment Data Volume (Bits) 1600 CPI CCT's
EO-3 139,175,605,000 425EO-7/8 2,080,685,376,000 6,351NV-1 35,525,952,000 109NV-3 31,850,496,000 98EO-9 2,615,040,000 9
The numbers of CCT's were calculated on the followingassumptions:
• 2400 foot reels of tape
• 3840 characters/record
• 1600 characters/inch
• 0.3 inch interrecord gap.
4-9
4.1.2 Areas of Impact. The following four areas in the ATLIntegration/Operation cycle will require the support of the LRCData System (reference 4.1-2).
• Experiment integration/checkout
• ATL/Shuttle integration/checkout
• Operations support
• Postflight data reformatting.
4.1.2.1 Experiment Integration/Checkout. The interface to theLRC Data System for this phase of operation will be magnetictape. Prior to shipment of the ATL to the launch site, experi-ment data will be recorded on the ATL data recorders and pro-cessed by the Data Reformatting System. This process will accom-plish two major goals:
• Ensure the data acquisition system of the ATL is function-ing properly
t Ensure the hardware/software configuration of the DataReformatting System is functioning properly.
4.1.2.2 ATL/Shuttle Integration/Checkout. The ATL checkout willoccur after shipment of the ATL to the launch site and integrationwith the Shuttle. The process used in the experiment integration/checkout should be repeated to ensure the integrity of the dataacquisition system.
4.1.2.3 Operations Support. During the ATL flight the datasystem will function as a mini payload control center. A datalink with JSC would provide for receipt and evaluation of engi-neering data, experiment data, and advisories. Voice and TVlinks will also be supported.
4-10

rt
•MOC!
OH
6'Q>
CO
rt-prtQ
-3-
0)
3•HPH
CM
4-11
4.1.2.4 Postflight Data Reformatting. This phase representsthe major effort of the LRC Data System. Reformatting the pay-load data will be time critical in getting the data to the PI intime for analysis and correction/modification prior to the nextflight of a particular experiment. All data should be processedfrom one flight before integration and checkout begins for thenext flight.
4-12
4.2 SUBTASK 1.2, LRC FACILITY ANALYSIS
The purpose of this subtask \tfas to document the capabilities of LRCin the area of analog pulse code modulation (PCM) processing. Thisdocumentation became an input to Task III, Preferred Data ManagementSystem Definition.
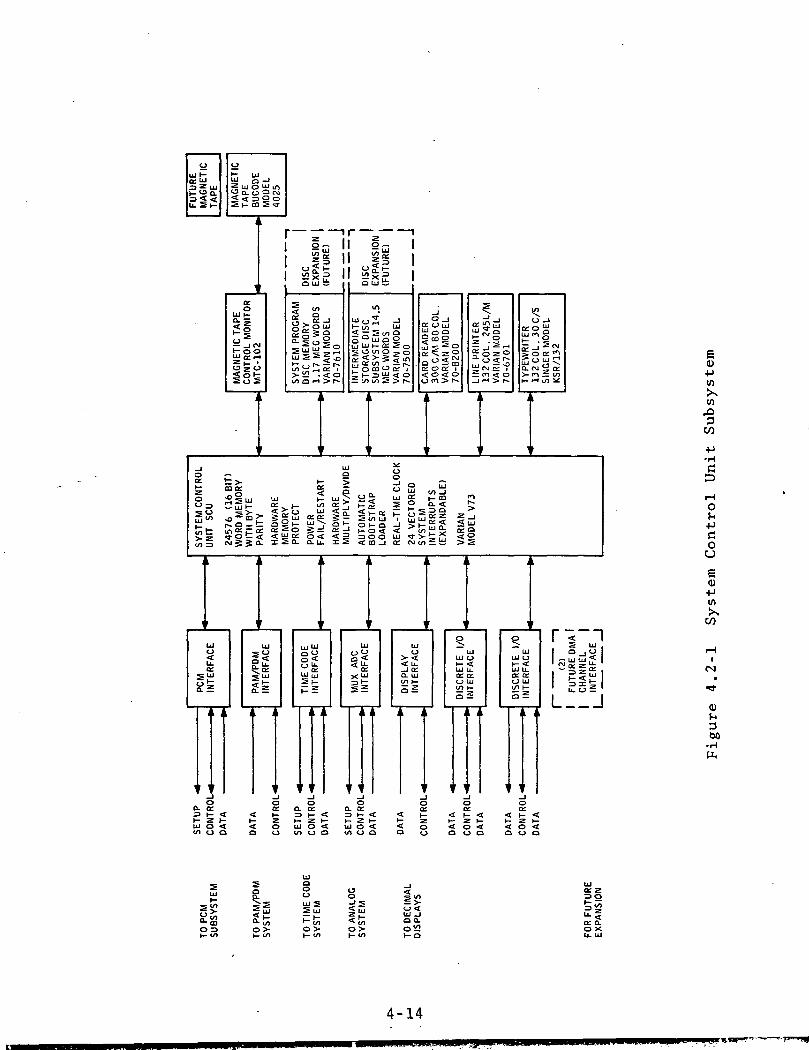
A computer controlled system (reference figure 4.2-1) for process-ing, editing, and digital formatting of the following data typeswas installed at the LRC facility.
• Continuous analog data
• Pulse amplitude duration modulated (PAM/PDM) data
• PCM data
• Time code data.
4.2.1 Operational Capability. The system has the following oper-ational capabilities:
• Processing - 1-32 channels of analog data1 channel of PCM data1 channel of PAM data
Selected data to be formatted and output to digital tape
• "Quick Look" provisions for selected data channels to be out-put to an oscillograph recorder
• Simulate and calibrate capability [using digital-to-analog(D/A) and PCM simulator]
• System diagnostics
• Setup, processing, and editing completely programmable forautomatic control by means of program entry.
• Existence of manual override capabilities so the operatorcan override any programmed function.
4-13
U.5|-
<J Q. O 9< ogSi- CQ 5
12 IIis ii
I £x =
-13 Z O
S°feSoScc oo: i<o<o
ro > r^
<cO J
ScMJltt> rn — c/li— •-«</) 2<:
e,(U
4->tn
Ii.^ i. i
UJ UJ°yo <°£UJ LjJ
0.2UJ o <</) CJ O
<a
oo
o <o o
UJ
>^< u. UJ Oi- <
•H
ou6a>
XCO
§UJ
LU O
UJ U.a tx.o ujtfl i-
, iI I
360
•H
<o o
o
< I- <t~ z t-< o <o o o
oQ£
< I- <
< o <Q O O
ujs0<UJ _la a.
0>I-<rt
ac z= 2
a: a.oxU- UJ
4-14
4.2.2 Data Throughput. There are two modes of operation:
• Normal Mode - 30K words/second without using intermediatestorage
• High-Speed Mode - 120K words/second (accepting data andstoring in intermediate storage)
4.2.3 System Characteristics
4.2.3.1 Hardware Characteristics
A. System Control Unit (SCU). The SCU is a Varian modelV73 with 24,576 16-bit words of central memory. The SCUhas the following features:
1. .66 microsecond maximum cycle time
..---' 2. Memory parity checks
3. Hardware memory protect
4. Power failure and restart
5. Fixed point multiply/divide
6. Multilevel directly vectored interrupt structure
7. Automatic bootstrap loader.
B. Standard Peripherals
1. Typewriter - 132 column, 30 character/second, Singermodel KSR/132
2. Line Printer - 132 column, 245 line/minute, Varianmodel 70-6701
3. System Disk Unit - 1.17 megaword, Varian model 70-7610,92K word/second transfer rate, 60 MS average accesstime
4-15
4. Magnetic Tape Unit - 9-track, 125 IPS, 800 CPI NRZ or• 1600 CPI phase encoded, Bucode model 4025
5. Card Reader - 80 column, 300 card/minute Varian model70-6200
6. Intermediate Storage System - 14.5 megaword, Varianmodel 70-7500, 156K word/second transfer rate, 35 micro-second average access time on track
7. Decimal Readouts - Up to eight selectable analog-to-digital (A/D) channels routed to digital displays fordisplaying present input values, system parameters, ordata channels.
C. Special Interfaces
1. A/D Subsystem
a. 32 parallel input channels
b. Provision for expansion to 64 parallel inputchannels
c. Inputs include
(1) Subcarrier discriminators
(2) Analog tape recorders
(3) Test equipment
d. Data sampling rate includes
(1) Two or more channels at 100,000 samples persecond
(2) One channel at 75,000 samples per second
e. Data word format - 12 bit quantization/sample
4-16
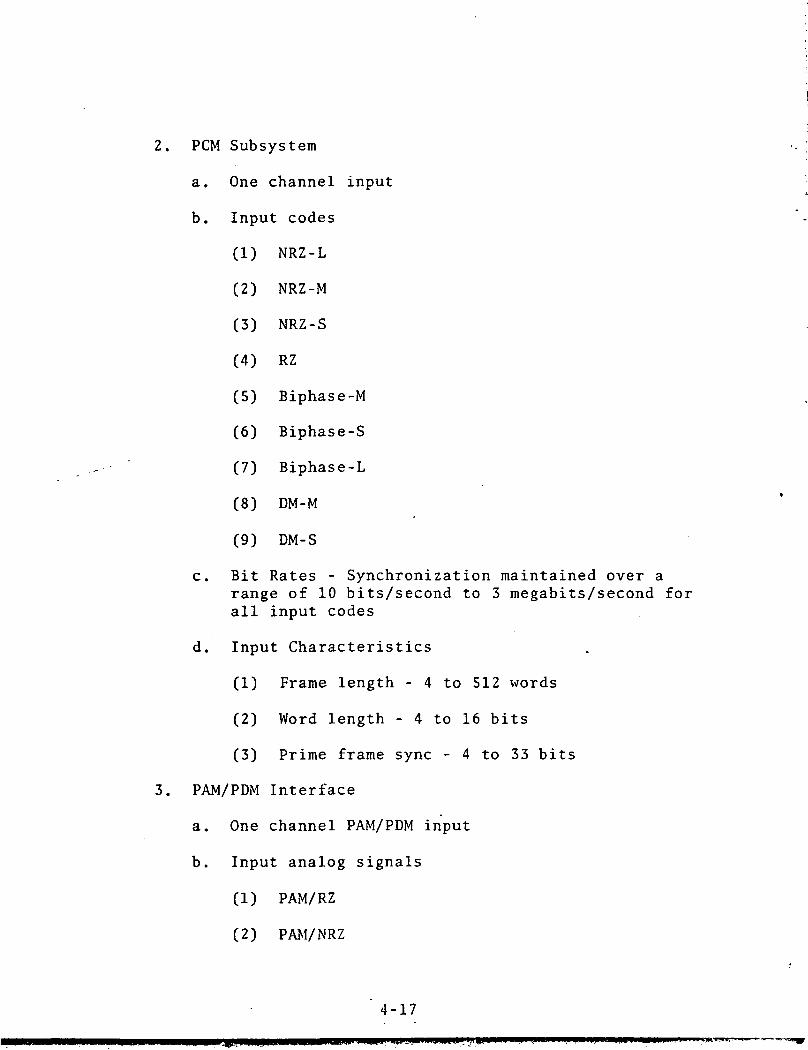
2. PCM Subsystem
a. One channel input
b. Input codes
(1) NRZ-L
(2) NRZ-M
(3) NRZ-S
(4) RZ
(5) Biphase-M
(6) Biphase-S
(7) Biphase-L
(8) DM-M
(9) DM-S
c. Bit Rates - Synchronization maintained over arange of 10 bits/second to 3 megabits/second forall input codes
d. Input Characteristics
(1) Frame length - 4 to 512 words
(2) Word length - 4 to 16 bits
(3) Prime frame sync - 4 to 33 bits
3. PAM/PDM Interface
a. One channel PAM/PDM input
b. Input analog signals
(1) PAM/RZ
(2) PAM/NRZ
4-17

(3) PDM
(4) DPDM
c. Throughput rate - 100,000 conversions/second
4. Time Code Interface
a. Time search unit (TSU)
(1) Maximum data rate - 100,000 GPS
(2) Time and command pulse data
(3) Time format - hours, minutes, seconds, milli-seconds, microseconds
b. Command to the TSU - 10 digits of time plus 1digit instruction code (Table 4.2-1 shows theinstruction digits recognized by the TSU.)
c. Accepts command words from the SCU
5. Digital/Analog Subsystem
a. Provides for the selection of eight analogchannels for "Quick Look" processing
b. Output to the oscillograph recorder
D. Analog Tape Recorders
1. Two Bell § Howell VR3700 - 1" or 1/2" tape
2. One Bell $ Howell R3400 - 1" or 1/2" tape
3. One Ampex FR600 - 1/2" only
4. One Ampex FR1300 - 1/2" only
4-18
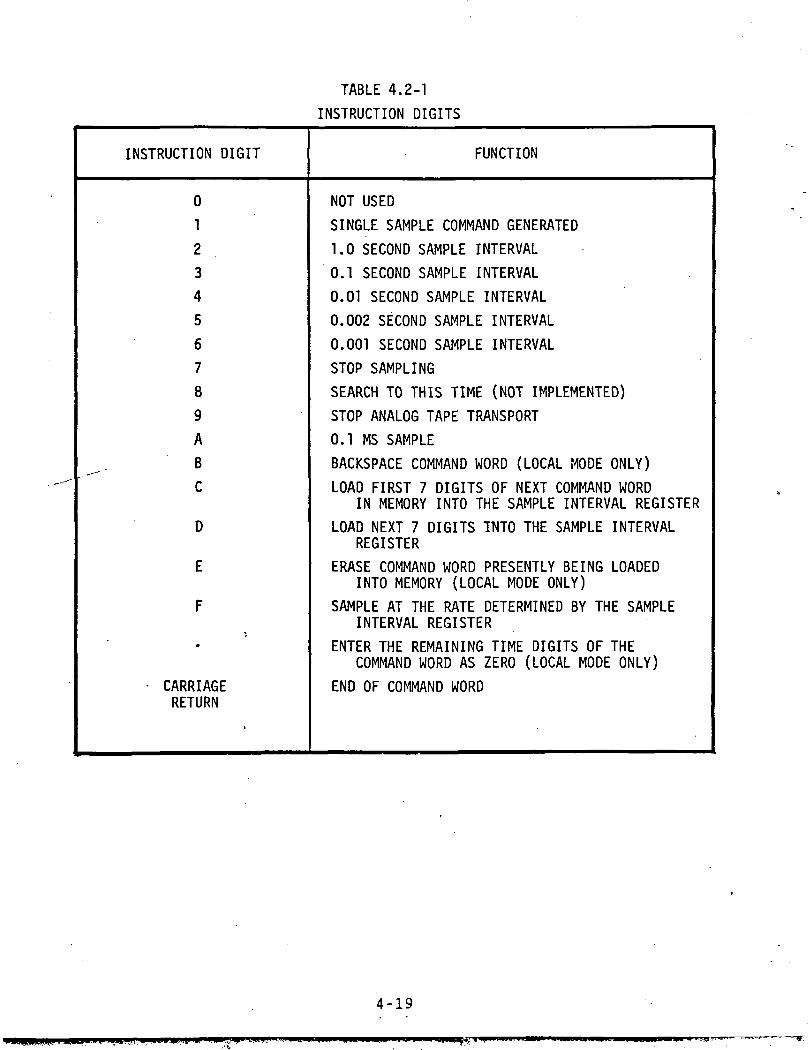
TABLE 4.2-1
INSTRUCTION DIGITS
INSTRUCTION DIGIT FUNCTION
0
1
2
3
4
5
6
7
8
9
A
B
C
D
E
F
CARRIAGERETURN
NOT USED
SINGLE SAMPLE COMMAND GENERATED
1.0 SECOND SAMPLE INTERVAL
0.1 SECOND SAMPLE INTERVAL
0.01 SECOND SAMPLE INTERVAL
0.002 SECOND SAMPLE INTERVAL
0.001 SECOND SAMPLE INTERVAL
STOP SAMPLING
SEARCH TO THIS TIME (NOT IMPLEMENTED)
STOP ANALOG TAPE TRANSPORT
0.1 MS SAMPLE
BACKSPACE COMMAND WORD (LOCAL MODE ONLY)
LOAD FIRST 7 DIGITS OF NEXT COMMAND WORDIN MEMORY INTO THE SAMPLE INTERVAL REGISTER
LOAD NEXT 7 DIGITS INTO THE SAMPLE INTERVALREGISTER
ERASE COMMAND WORD PRESENTLY BEING LOADEDINTO MEMORY (LOCAL MODE ONLY)
SAMPLE AT THE RATE DETERMINED BY THE SAMPLEINTERVAL REGISTER
ENTER THE REMAINING TIME DIGITS OF THECOMMAND WORD AS ZERO (LOCAL MODE ONLY)
END OF COMMAND WORD
4-19
4.2.3.2 .Software Characteristics
A. Operating System
1. The Disk Operating System accepts inputs from type-writer, card reader, and system disk. Inputs arein the form of source programs, object programs, jobcontrol directives, and data.
2. The system structure is modular to allow expansion foradditional processors and I/O drivers.
3. The system operates with a resident monitor for jobcontrol and interrupt answering and uses nonresidentoverlays for compilers, assemblers, support programs,and large application programs
B. Languages
1. FORTRAN IV
2. MACRO Assembly Language
a. Relocatable code and link directives
b. Compatibility with FORTRAN compiler
C. Support Software
1. Program Editor - Used for source program modificationof both FORTRAN and Assembly Language
2. Debug Aids
a. Memory Dump selectable by core location and outputto disk, typewriter, and tape
b. Core location examination and modificationcapability
c. Checkpointing capability for application programswhich allow suspension of execution, examiningintermediate results, and return to execution
4-20
3. Library Editing and Maintenance - Used for modificationof the system software, application routines, and datatables
4. File Management Software - Supports a minimum of 50files on the system disk
D. Telemetry Software
1. Setup Procedures - The setup operation is one of thefollowing three methods.
a. Prepunched cards
b. Interactive from keyboard
c. Input from the system disk
""" The operator is able to specify items which include:
a. PCM channels to be processed
b. Frame length
c. Frame interval
d. Word length
e. Sync pattern
f. Sync length
g. Window
h. Most significant bit (MSB) or least significantbit (LSB) first
i. Zero calibration channel (PAM/PDM)
j. Full scale calibration channel (PAM/PDM)
k. PCM channels to be processed
4-21
2. Processing
a. PAM/PDM Data - Scaled such that any input valuegreater than full scale is flagged by setting theoutput word to +111--1. Any input value less thanzero is flagged as -000 0. Standard deviationis computed on a low priority basis and is deferredif it interferes with system throughput.
b. PCM Data - Not scaled
c. Time Checks - Time is checked for decreases oradvances >1 second. If either occurs an error islisted.
d. Time Tagging - Time is stored for each occurrenceof frame sync.
..,--" ^ 3. Output Tape Formatting - Each data file is made up ofone identification record, one name record, and afile mark.
a. Identification Record - ASCII .format, 82 charactersin length (The format is described in table 4.2-2.)
b. Name Record - ASCII format, length dependent onnumber of data words in the data record (The formatis described in table 4.2-3.)
c. Data Record - Binary format, maximum length of 3840characters, minimum length of 3000 characters (Theformat is described in table 4.2-4.)
4.2.3.3 Operating Schedule. Current and planned operating sched-ule for the LRC facility is two shifts/day, 5 days/week withapproximately three people/shift. Some work is done on weekends,depending on backlog and downtime.
4-22
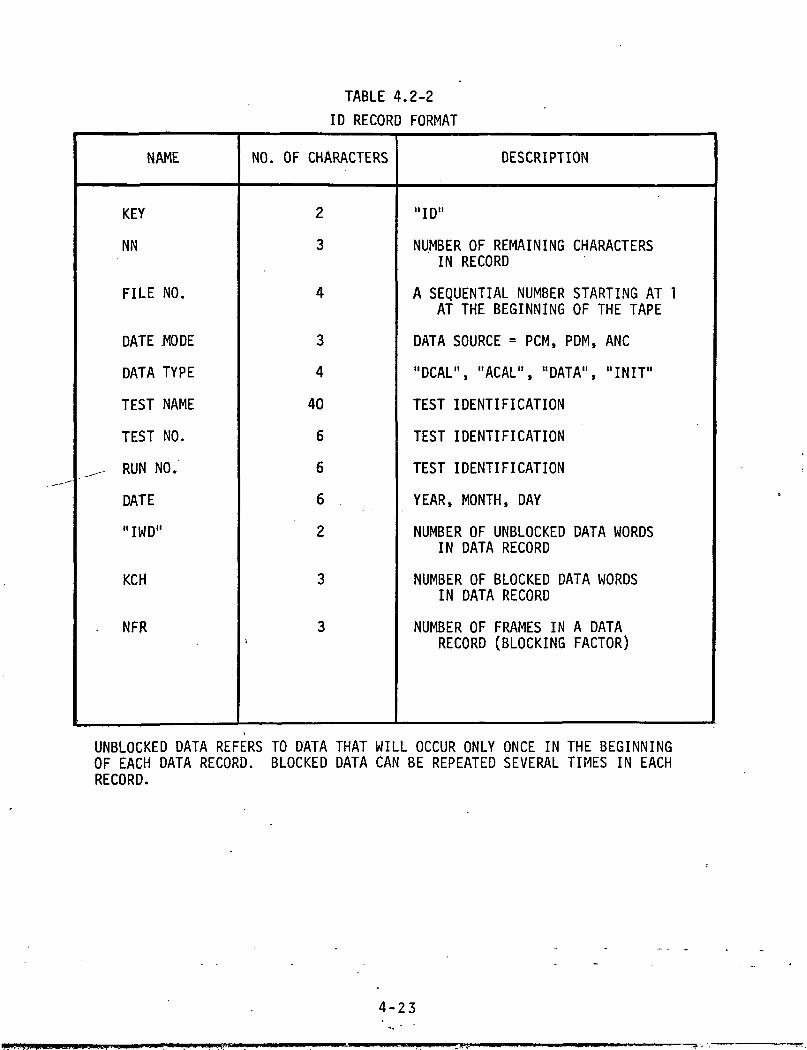
TABLE 4.2-2
ID RECORD FORMAT
NAME
KEY
NN
FILE NO.
DATE MODE
DATA TYPE
TEST NAME
TEST NO.
^ RUN NO.
DATE
"IWD"
KCH
. NFR
NO. OF CHARACTERS
2
3
4
3
4
40
6
6
6
2
3
3i
DESCRIPTION
"ID"
NUMBER OF REMAINING CHARACTERSIN RECORD
A SEQUENTIAL NUMBER STARTING AT 1AT THE BEGINNING OF THE TAPE
DATA SOURCE = PCM, PDM, ANC
"DCAL", "ACAL", "DATA", "INIT"
TEST IDENTIFICATION
TEST IDENTIFICATION
TEST IDENTIFICATION
YEAR, MONTH, DAY
NUMBER OF UNBLOCKED DATA WORDSIN DATA RECORD
NUMBER OF BLOCKED DATA WORDSIN DATA RECORD
NUMBER OF FRAMES IN A DATARECORD (BLOCKING FACTOR)
UNBLOCKED DATA REFERS TO DATA THAT WILL OCCUR ONLY ONCE IN THE BEGINNINGOF EACH DATA RECORD. BLOCKED DATA CAN BE REPEATED SEVERAL TIMES IN EACHRECORD.
4-23

TABLE 4.2-3
NAME RECORD FORMAT
NAME
KEY
NM
NAME (1)
NAME (2)
NAME (3)
NAME (4)
NAME (5)
NAME (6)
NAME (7)••
(IWD+KCH)
NO. OF CHARACTERS
5
5
10
10
10
10
10
10
10•t10
DESCRIPTION
NAME
NUMBER OF REMAINING CHARACTERS INRECORD
"RECORD NO."
"DAYS"
"HRS-MIN"
"SEC"
"MICRO SEC"
"STATUS" USED ONLY FOR RAM, RDM, ANDPCM. THIS WORD SHALL BE DELETEDFOR CONTINUOUS DATA
THE NAMES FOR THE REST OF RECORDWILL BE PROVIDED BY THE OPERATORDURING SETUP TIME
EACH NAME IN THE NAME RECORDS CORRESPONDS TO A DATA WORD IN THE DATA RECORD.
4-24
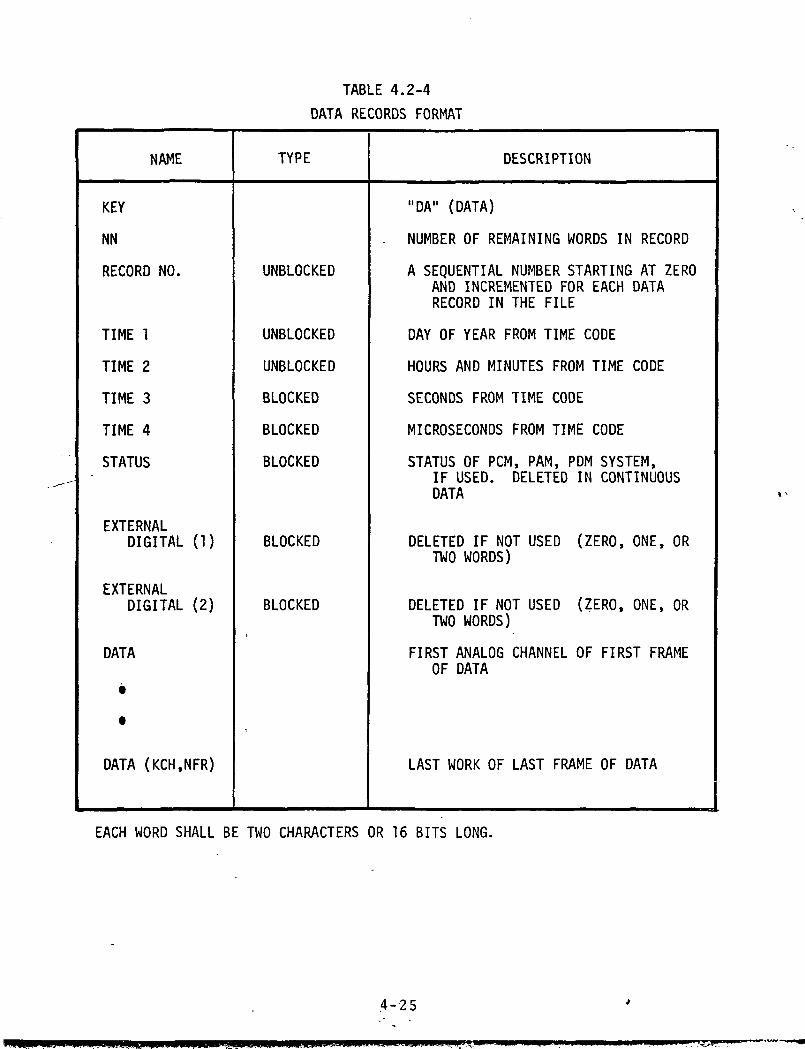
TABLE 4.2-4
DATA RECORDS FORMAT
NAME TYPE DESCRIPTION
KEY
NN
RECORD NO.
TIME 1
TIME 2
TIME 3
TIME 4
STATUS
EXTERNALDIGITAL (1)
EXTERNALDIGITAL (2)
DATA
t
•
DATA (KCH.NFR)
UNBLOCKED
UNBLOCKED
UNBLOCKED
BLOCKED
BLOCKED
BLOCKED
BLOCKED
BLOCKED
"DA" (DATA)
NUMBER OF REMAINING WORDS IN RECORD
A SEQUENTIAL NUMBER STARTING AT ZEROAND INCREMENTED FOR EACH DATARECORD IN THE FILE
DAY OF YEAR FROM TIME CODE
HOURS AND MINUTES FROM TIME CODE
SECONDS FROM TIME CODE
MICROSECONDS FROM TIME CODE
STATUS OF PCM, PAM, PDM SYSTEM,IF USED. DELETED IN CONTINUOUSDATA
DELETED IF NOT USED (ZERO, ONE, ORTWO WORDS)
DELETED IF NOT USED (ZERO, ONE, ORTWO WORDS)
FIRST ANALOG CHANNEL OF FIRST FRAMEOF DATA
LAST WORK OF LAST FRAME OF DATA
EACH WORD SHALL BE TWO CHARACTERS OR 16 BITS LONG.
4-25

4.2.3.4 Equipment for Support of ATL. In conclusion, the follow-ing hardware, if available, could be used to support ground proc-essing of the ATL experiment data.
A. SCU. By expanding the central memory to 64K this systemcould meet the ATL requirements.
B. Staridard Peripherals. The following peripherals could beused to support ATL processing.
1. Typewriter
2. Time printer
3. Card reader
4. Decimal readouts.
The costing information in section 6 lists costs for each individ-ual component of the system including those listed above. Thiswas done to show complete system cost if the current LRC facilitywas being used at a maximum with other LRC projects.
4-26.
4.3 SUBTASK 1.3, EXPERIMENTS ANALYSIS
The purpose of this subtask was to analyze the ATL experiments todetermine the data rate, data volume, and baseline data formatassociated with each experiment. The results of this subtask willbecome a major input to Task II, Ground Support Data ManagementSystem Requirements.•
•4.3.1 Methodology. Each experiment was analyzed individually tocalculate data rates and establish a baseline format. The re-sources used to perform this analysis are listed in section 2.
Data volume for each experiment was calculated by using daily data-take times and number of days of data acquisition based on thefollowing:
• Mission length - 7 days
• ATL experiment data sheets
• Timelines developed by LRC for a 7-day mission.
The experiments which were analyzed are listed in table 4.3-1.
4.3.1.1 Format Definitions. Items considered in the definitionof formats for the ATL experiments were:
A. Spacelab Hardware. Computer and digital interfaces arebyte (8 bits) or multibyte oriented1.
B. Orbiter/Spacelab Interfaces. Interfaces are byte and multi-byte oriented2'3.
C. Orbiter Telemetry Downlink. All formats to be downlinkedfrom the Orbiter will be byte-structured2.
Spacelab Payload Accommodation Handbook (Preliminary), October 1974zTelemetry Standard (Preliminary), January 1975, JSC*Level II Program Definition and Requirements, Vol. XIV, "SpaceShuttle System Payload Accommodations," January 1975, JSC
4-27

TABLE 4.3-1
STUDY EXPERIMENT LIST
SUBJECT '
COMMUNICATIONSAND
NAVIGATION
EARTHOBSERVATIONS
PHYSICS ANDCHEMISTRY
MICROBIOLOGY
COMPONENT ANDSYSTEM TESTING
ENVIRONMENTALEFFECTS
EXPERIMENTNO.
NV-1NV-2NV-3
EO-1EO-2EO-3EO-4EO-5EO-6EO-7EO-8EO-9
PH-1PH-2PH-3PH-6
MB-1MB-2MB-3MB-4MB-5
CS-2
EN-1EN-3
EXPERIMENT TITLE
MICROWAVE INTERFEROMETERAUTONOMOUS NAVIGATION/LANDMARK TRACKERMULTIPATH MEASUREMENTS
LIDAR AEROSOLS AND CLOUD MEASUREMENTSTUNABLE LASERSMULTI SPECTRAL SCANNERMICROWAVE RADIOMETERPRECISION LASER RANGEFINDERMICROWAVE ALTIMETRYSEARCH AND RESCUE AIDSIMAGING RADARRF NOISE
SPACECRAFT WAKE DYNAMICSBARIUM PLASMA CLOUD RELEASEOPTICAL PROPERTIES OF AEROSOLSULTRAVIOLET METEOR SPECTROSCOPY
COLONY GROWTH IN ZERO GRAVITYINTERPERSONAL TRANSFER OF MICRO-ORGANISMS IN ZERO GELECTRICAL FIELD OPACITY IN BIOLOGICAL CELLSELECTRICAL CHARACTERISTICS OF BIOLOGICAL CELLSSPECIAL PROPERTIES OF BIOLOGICAL CELLS
ZERO GRAVITY STEAM GENERATOR
SAMPLING OF AIRBORNE PARTICLESENVIRONMENTAL EFFECTS ON NONMETALLIC MATERIALS
4-28
D. Ground Processing. Most computing facilities use byte-addressable hardware. This is especially true in thereformatting of wideband tapes.
4.3.1.2 Format Structure. Based on the above hardware/interfacecharacteristics, the following assumptions were made in derivinga baseline format structure.
A. The length of each frame will be an integer multiple of16 bits.
B. The maximum frame length will be 8192 bits. This lengthwas selected to maintain compatibility with the currentOrbiter formatting requirements.
C. Word length will be eight bits or an integer multiple ofeight.
,-D. Nonbyte-oriented experiment data will be organized intoblocks; the length of each block will be a multiple ofeight bits.
E. The sequence of data in a frame will be:
• Frame sync: words 1 through 4 of all frames
• Frame counter: word 5 of all frames
• Format ID: word 6 of all frames
• Bit rate ID: word 7 of all frames
• Payload ID: word 8 of all frames
• Time: words 9 through 13
• Data measurements: words 14 through N; N <_ 1024.
Formats for each experiment were designed after analysis to deter-mine parameter types and sample rates required. Data take timeswere supplied by LRC and were used to calculate data volume permission.
4-29
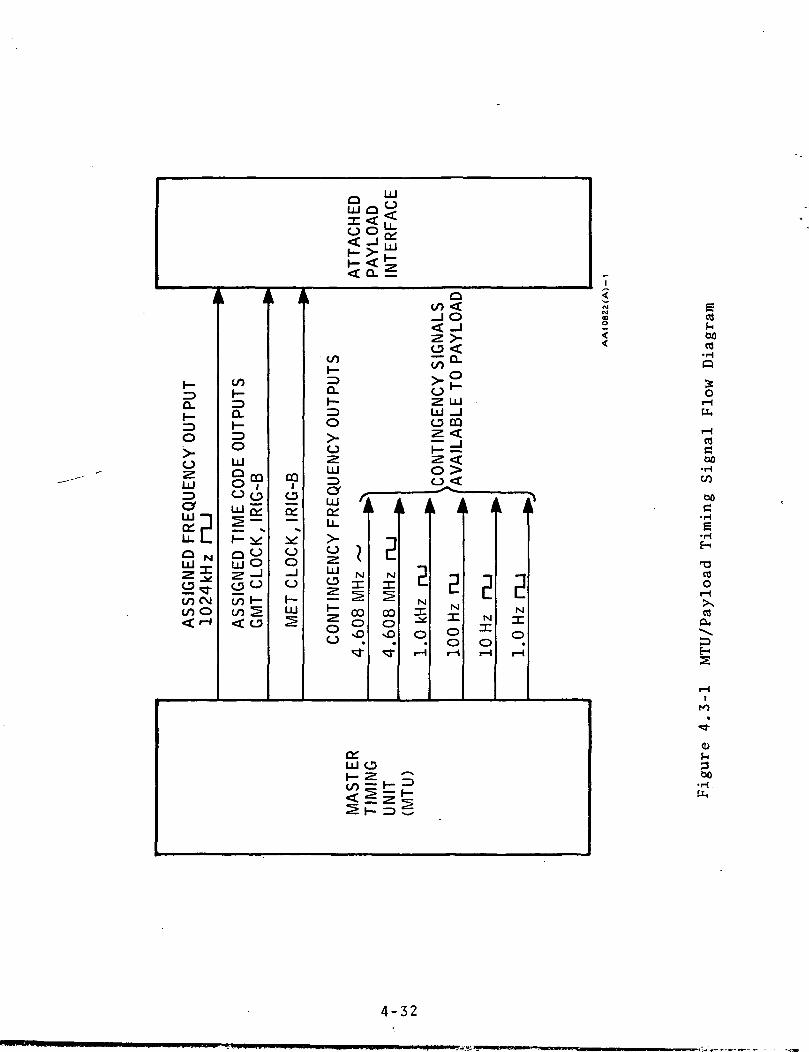
4.3.1.3 Timing. Master timing services in the form of outputdata signals will be provided to attached payloads via hardlinelink from the Orbiter Master Timing Unit (MTU)1. The MTU willprovide accurate frequency and time code outputs through the useof triple redundant crystal oscillators, frequency divider cir-cuits, and Greenwich mean time/mission elapsed time (GMT/MET)accumulators.
An output sync frequency signal of 1024/kHz (square wave) will beassigned to payloads. The following spare contingency frequencieswill also be available to payloads if requirements are defined.
• 4.608 MHz, sine wave
• 4.608 MHz, square wave
• 1.0 kHz, square wave
„--" • 100 Hz, square wave
• 10 Hz, square wave
• 1.0 Hz, square wave.
All basic reference frequency signals will be mutually synchronizedand can be used by the payloads to synthesize other timing frequen-cies if required.
The MTU will maintain separate time accumulators for GMT and METtime clock references. The accumulators are capable of beingreset or updated by ground support equipment (GSE) and Orbitercrew via the keyboard interfaces. Capability will be provided toinitialize or update all GMT, or all MET accumulators simultane-ously. In addition, the MET accumulators will be reset to zeroat liftoff. The GMT and MET clock output time codes to the pay-load will be provided in continuous 100 pulses per second, Inter-range Instrumentation Group B (IRIG-B) format. The serial time codedigit format is coded in milliseconds., seconds, minutes, hours,and days.
In defining the data formats, the assumption was made that the on-board instrumentation unit \vould be able to fetch the IRIG-B time
lLeve1, II Program Definition and Requirements, Vol. XIV, "SpaceShuttle System Payload Accommodations," January 1975, JSC
4-30
from the MET or GMT input source and multiplex the time along withdata in each data frame.
Figure 4.3-1 depicts the timing data flow through the payload hard-line interfaces.
4.3.2 Communications and Navigations. The following paragraphscontain detailed documentation resulting from the communicationsand navigation experiments analysis. Also included are the ref-erences and assumptions used to establish the data rate for eachexperiment and a baseline format description.
4.3.2.1 NV-1, Microwave Interferometer Navigation and TrackingAid. The general concepts and parameter values used for this ex-periment were obtained from the report Development of a MicrowaveInterferometer Position Location, NASA CR-112188, dated August1973. This report was prepared by IBM for LRC under contractNAS 1-10997. Information was also obtained from the LRC experimentdata-sheets and the experiment write-up in LRC ATL report NASATMX-2813.
The following assumptions were made for this experiment:
A. The received signal spectrum will consist of four calibra-tion (Cal) signals (Cals 1 through 4) and two beacon sig-nals (beacons 1 and 2) .
B. There will be seven RF receive channels (each RF channelwill contain the four calibration and two beacon signals).
C. There will be six phase recovery channels (one for eachcalibration and beacon signal; the inputs to each channelwill consist of the seven RF receive channels which havebeen down converted; the seven outputs from each channelwill represent the same signal data that has been extractedfrom each of the seven RF receive channels; six of the out-puts will be provided as inputs to individual phase metersfor phase measurements and the seventh output will be usedas a reference input to the six phase meters for that chan-nel) .
D. There will be 36 digital phase meters (6 for each phaserecovery channel).
E. The output rate of each phase meter will be 2000 samplesper second.
4-31
< 0. •=
oz.LU
OfLU
ZX
g^S2 "stCO CMto o
co
0_
oLU
o ejLU rv
LU OZ -JO O
CO h-
00Io
iniOo_Joh-LU
CO
OzLU
OZ <•
lit CO^ o
oto <_l O< -Jo <
o 2 LULU _JCJJ COZ <
i=d
ISo <
I<
<
i T T t t t tM
O
N4
O
CJ?H
00rt
o
rtC00
•HCO
C!•He•HH
03O
iHXrt
a:LU oto =
i-
(D
300
•H.
4-32

F. The quantization level of experiment data will equal 10 bits.
G. All phase measurements will be performed and recorded dig-itally onboard the ATL.
Since the quantization level provides 10-bit words (one 10-bitword per sample) and the assumed standard format (reference para-graph 4.3.1.2) utilizes 8-bit words, word blocking is required forthe experiment data. The assumed block length is 40 bits (four10-bit words which are equivalent to five 8-bit words). If thedata from each of the 36 output data lines is blocked so that eachblock contains four samples (four 10-bit words), then one completedata pass through all 36 output data lines would yield 144 samples.Five complete data passes through all 36 output data lines wouldyield 720 samples. The sample rate of the experiment data is 72,000samples per second (36 data lines at 2000 samples per second perdata line). Therefore, if five complete data passes of data (720samples) are contained in one frame, then the frame rate would be100 frames per second (72,000 samples per second divided by 720'samples per frame).
Each frame will contain the following number of 8-bit words ofdata: 900 experiment (720 10-bit words), 13 overhead, and 11housekeeping as illustrated in table 4.3-2. By combining theoverhead, experiment, and housekeeping data for 100 frames, thetotal data rate becomes
Overhead data rate = 10,400 b/sExperiment data rate = 720,000 b/sHousekeeping data rate = 8,800 b/s
Total data rate = 739,200 b/s
Types of housekeeping data include instrument calibration, boomtemperature, boom motion, receiver characteristics, equipmentstatus, etc.
4.3.2.2 NV-2v Autonomous Navigation/Landmark Tracker. The basicexperiment, as described in NASA TMX-2813, was intended to investi-gate techniques for correlation tracking of either earth or starfield targets. In order to baseline a data rate and format forthis experiment, the following assumptions were made. Note: Inter-ferometer data will be collected by another experiment and there-fore, will not be included in this analysis.
4-33
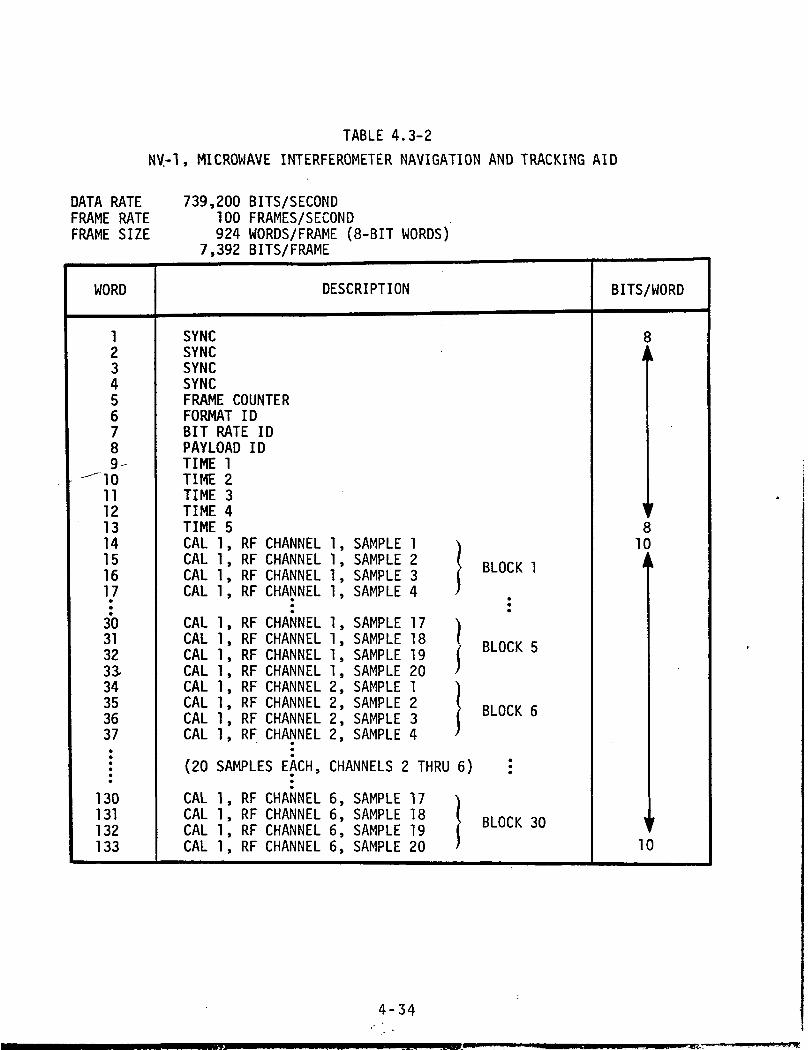
TABLE 4.3-2
NV-1, MICROWAVE INTERFEROMETER NAVIGATION AND TRACKING AID
DATA RATE 739,200 BITS/SECONDFRAME RATE 100 FRAMES/SECONDFRAME SIZE 924 WORDS/FRAME (8-BIT WORDS)
7,392 BITS/FRAME
WORD
123456789
""1011121314151617•
30313233,34353637••••••
130131132133
DESCRIPTION
SYNCSYNCSYNCSYNCFRAME COUNTERFORMAT IDBIT RATE IDPAYLOAD IDTIME 1TIME 2TIME 3TIME 4TIME 5CAL 1 RF CHANNEL 1 , SAMPLE 1 }CAL 1 RF CHANNEL 1 , SAMPLE 2 ( Rl nri, ,CAL 1 RF CHANNEL 1 , SAMPLE 3 ( DLUL* 'CAL 1 RF CHANNEL 1 , SAMPLE 4 )
• •CAL RF CHANNEL 1 , SAMPLE 17)CAL RF CHANNEL 1, SAMPLE 18 ( m nrfc, ,CAL RF CHANNEL 1, SAMPLE 19 ( BLUIA SCAL RF CHANNEL 1 , SAMPLE 20 /CAL RF CHANNEL 2, SAMPLE 1 )CAL 1 RF CHANNEL 2, SAMPLE 2 ( Rl nri, fiCAL 1 RF CHANNEL 2, SAMPLE 3 ( BLUIA °CAL 1 RF CHANNEL 2, SAMPLE 4 >
(20 SAMPLES EACH, CHANNELS 2 THRU 6) •
CAL 1, RF CHANNEL 6, SAMPLE 17 )CAL 1, RF CHANNEL 6, SAMPLE 18 ( Rl nrk, ,nCAL 1, RF CHANNEL 6, SAMPLE 19 ( BLUl^ JU
CAL 1, RF CHANNEL 6, SAMPLE 20 '
BITS/WORD
8i
\
t
r
810
t
i'10
4-34
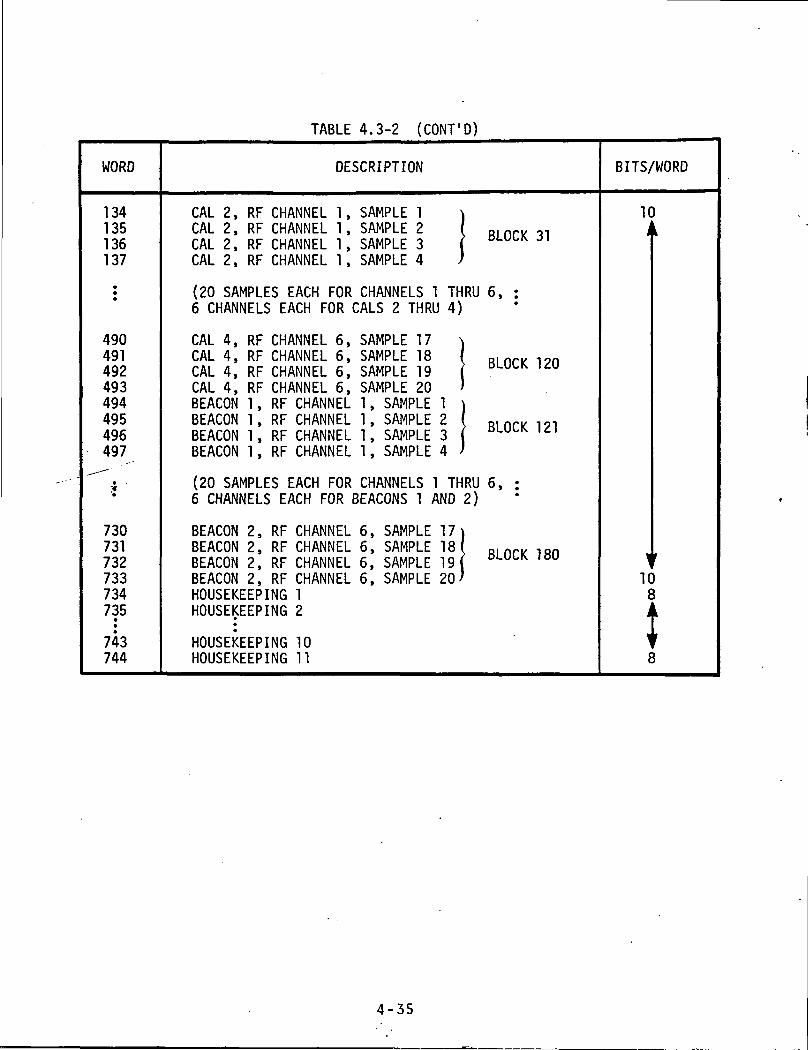
TABLE 4.3-2 (CONT'D)
WORD
134135136137
:
490491492493494495496497
-"".'!
730731732733734735
743744
DESCRIPTION
CAL 2, RF CHANNEL 1, SAMPLE 1 ^CAL 2, RF CHANNEL 1, SAMPLE 2 ( m nn, .,,CAL 2, RF CHANNEL 1, SAMPLE 3 ( DLULN Jl
CAL 2, RF CHANNEL 1, SAMPLE 4 )
(20 SAMPLES EACH FOR CHANNELS 1 THRU 6, :6 CHANNELS EACH FOR CALS 2 THRU 4)
CAL 4, RF CHANNEL 6, SAMPLE 17 \CAL 4, RF CHANNEL 6, SAMPLE 18 ( R| nrk, 19nCAL 4, RF CHANNEL 6, SAMPLE 19 ( DLULN '*uCAL 4, RF CHANNEL 6, SAMPLE 20 )BEACON 1 , RF CHANNEL 1 , SAMPLE 1 )BEACON 1, RF CHANNEL 1, SAMPLE 2 ( R| nrk, 19,BEACON 1, RF CHANNEL 1, SAMPLE 3 ( DLUU^ m
BEACON 1 , RF CHANNEL 1 , SAMPLE 4 I
(20 SAMPLES EACH FOR CHANNELS 1 THRU 6, ;6 CHANNELS EACH FOR BEACONS 1 AND 2)
BEACON 2, RF CHANNEL 6, SAMPLE 17)BEACON 2, RF CHANNEL 6, SAMPLE 181 R| nr|, 1HnBEACON 2, RF CHANNEL 6, SAMPLE 19 ( DLUl^ IOU
BEACON 2, RF CHANNEL 6, SAMPLE 20'HOUSEKEEPING 1HOUSEKEEPING 2
HOUSEKEEPING 10HOUSEKEEPING 11
BITS/WORD
10(
*"
\
108
tT8
4-35
A. The video camera used to monitor the telescope pointing willnot be digitized.
B. Measurements from the onboard inertial system will be madesimultaneously with measurements from the holographic tracker.
C. The electro-optical readout system will consist of am imagedissector placed in the image plane of the correlation sys-tem. The correlation output at the image dissector willconsist of the cross-correlation function of the viewedscene and the target scene.
D. The cross-correlation function will contain a peak whenproperly matched to the viewed scene to allow detection byamplitude comparison on the output sensor.
E. The X-Y location of the correlation peak will be read outat a maximum rate of 200 Hz.
F. The experiment will operate in two modes, search and track.
1. During search mode operation, the following parameters--•"" were assumed:
• Angular position of target filter: quantized to1024 levels
• Position in image dissector: quantized to 1024 x1024 discrete locations
• Amplitude of video signal peak value: quantized to256 levels
• Measurements and calculations: performed 25 timesper second.
2. During track mode operation, the following parameterswere assumed:
• Number of scan cycles: 200
• Estimated position: calculated 200 times per second
• Major grid and location coordinates: digitized foreach scan cycle.
Table 4.3-3 depicts the baseline format.
4.3.2.3 NV-3, Multipath Measurements. The general concepts andparameter values used to represent this experiment were obtainedprimarily from two reports in addition to the LRC experiment datasheets and experiment write-up in the LRC ATL report, NASA TMX-2813.
4-36
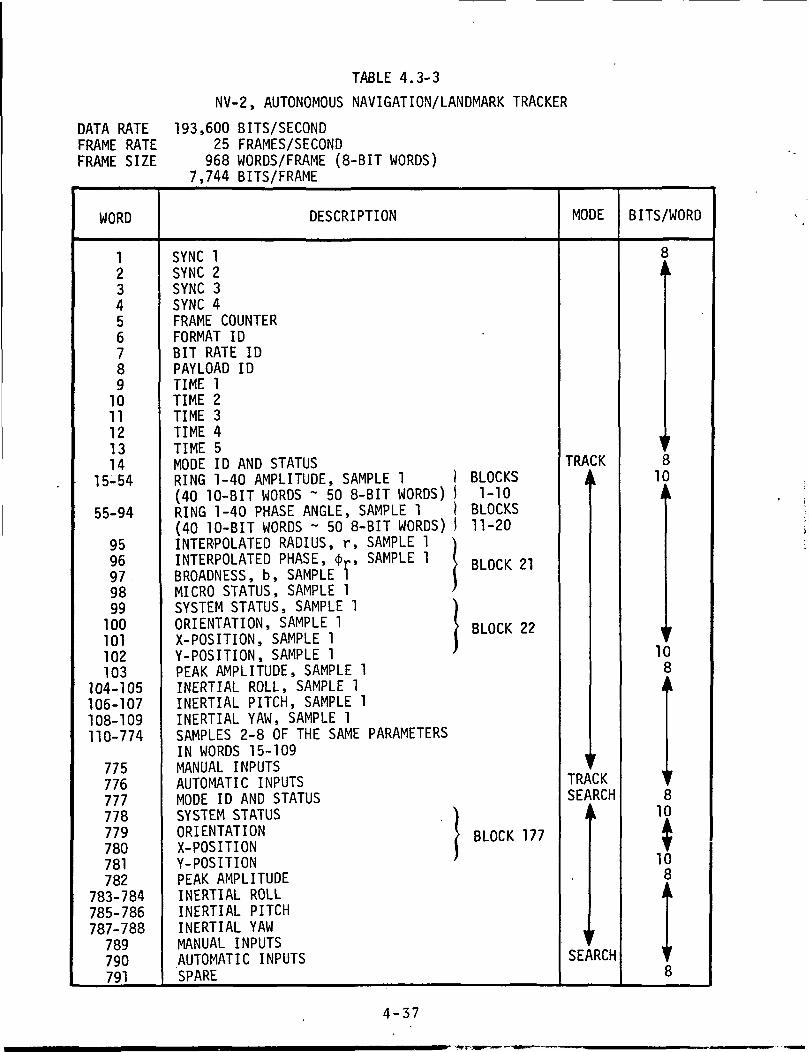
TABLE 4.3-3
NV-2, AUTONOMOUS NAVIGATION/LANDMARK TRACKER
DATA RATE 193,600 BITS/SECONDFRAME RATE 25 FRAMES/SECONDFRAME SIZE 968 WORDS/FRAME (8-BIT WORDS)
7,744 BITS/FRAME
WORD
1234567891011121314
15-54
55-94
9596979899100101102103
104-105106-107108-109110-774
775776777778779780781782
783-784785-786787-788789790791
DESCRIPTION
SYNC 1SYNC 2SYNC 3SYNC 4FRAME COUNTERFORMAT IDBIT RATE IDPAY LOAD IDTIME 1TIME 2TIME 3TIME 4TIME 5MODE ID AND STATUSRING 1-40 AMPLITUDE, SAMPLE 1 ) BLOCKS(40 10-BIT WORDS ~ 50 8-BIT WORDS) 1 1-10RING 1-40 PHASE ANGLE, SAMPLE 1 I BLOCKS(40 10-BIT WORDS ~ 50 8-BIT WORDS) 1 11-20INTERPOLATED RADIUS, r, SAMPLE 1 \INTERPOLATED PHASE, <j>r, SAMPLE 1 ( m nnr 9,BROADNESS, b, SAMPLE 1 ( BLUl^ *'MICRO STATUS, SAMPLE 1 /SYSTEM STATUS, SAMPLE 1 )ORIENTATION, SAMPLE 1 BLQCK nX-POSITION, SAMPLE 1 ( DLUUV "Y-POSITION, SAMPLE 1 'PEAK AMPLITUDE, SAMPLE 1INERTIAL ROLL, SAMPLE 1INERTIAL PITCH, SAMPLE 1INERTIAL YAW, SAMPLE 1SAMPLES 2-8 OF THE SAME PARAMETERSIN WORDS 15-109MANUAL INPUTSAUTOMATIC INPUTSMODE ID AND STATUSSYSTEM STATUS )ORIENTATION ' ( R| nf>K ,„X-POSITION ( BLOCK 177
Y-POSITION ;
PEAK AMPLITUDEINERTIAL ROLLINERTIAL PITCHINERTIAL YAWMANUAL INPUTSAUTOMATIC INPUTSSPARE
MODE
TRACK
^
f
TRACKSEARCH
,"
\
f'SEARCH
BITS/WORD
8
«f810f
.V108t
h1
i
810
A
108 1
8
4-37
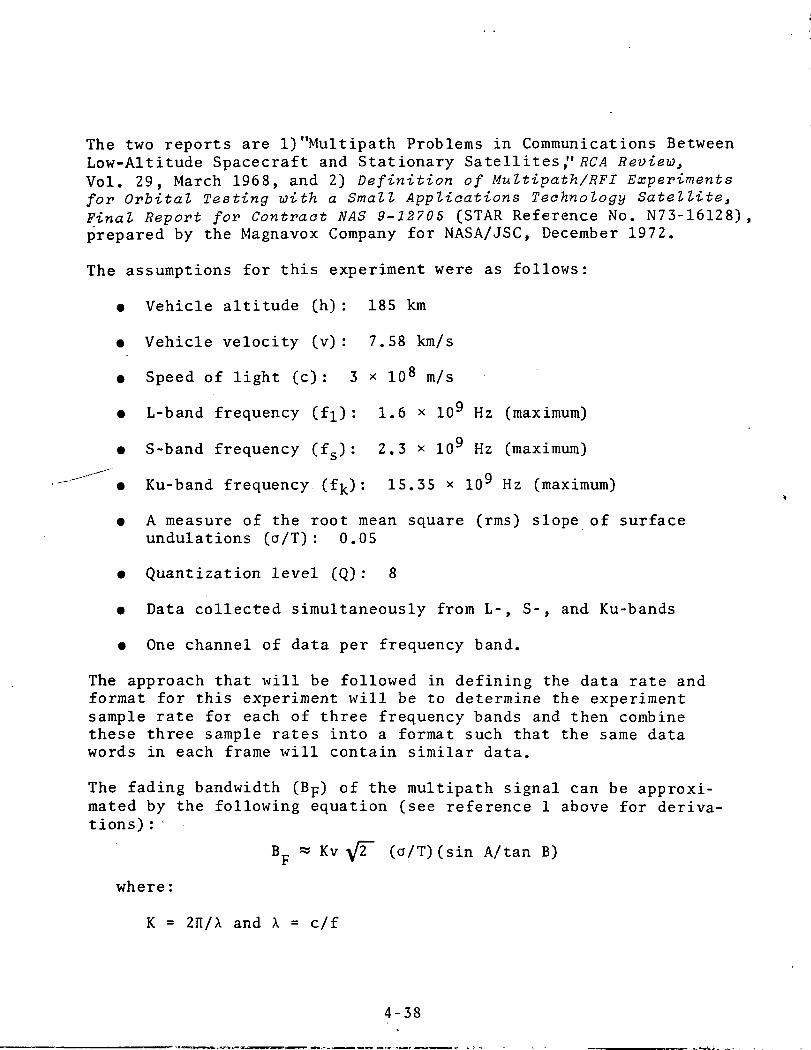
The two reports are l)"Multipath Problems in Communications BetweenLow-Altitude Spacecraft and Stationary Satellites ," RCA Review,Vol. 29, March 1968, and 2) Definition of Multipath/RFI Experimentsfor Orbital Testing with a Small Applications Technology Satellite,Final Report for Contract NAS 9-22705 (STAR Reference No. N73-16128) ,prepared by the Magnavox Company for NASA/JSC, December 1972.
The assumptions for this experiment were as follows:
• Vehicle altitude (h) : 185 km
• Vehicle velocity (v) : 7.58 km/s
• Speed of light (c) : 3 x io8 m/s
• L-band frequency (fi) : 1.6 x IO9 Hz (maximum)
• S-band frequency (fc) : 2.3 x io9 Hz (maximum)
o
• Ku-band frequency (f ) : 15.35 x io9 Hz (maximum)
• A measure of the root mean square (rms) slope of surfaceundulations (a/T) : 0.05
• Quantization level (Q) : 8
• Data collected simultaneously from L-, S-, and Ku-bands
• One channel of data per frequency band.
The approach that will be followed in defining the data rate andformat for this experiment will be to determine the experimentsample rate for each of three frequency bands and then combinethese three sample rates into a format such that the same datawords in each frame will contain similar data.
The fading bandwidth (Bp) of the multipath signal can be approxi-mated by the following equation (see reference 1 above for deriva-tions) :
Bp « Kv \2 (a/T) (sin A/tan B)
where:
K = 2II/A and X = c/f
4-38
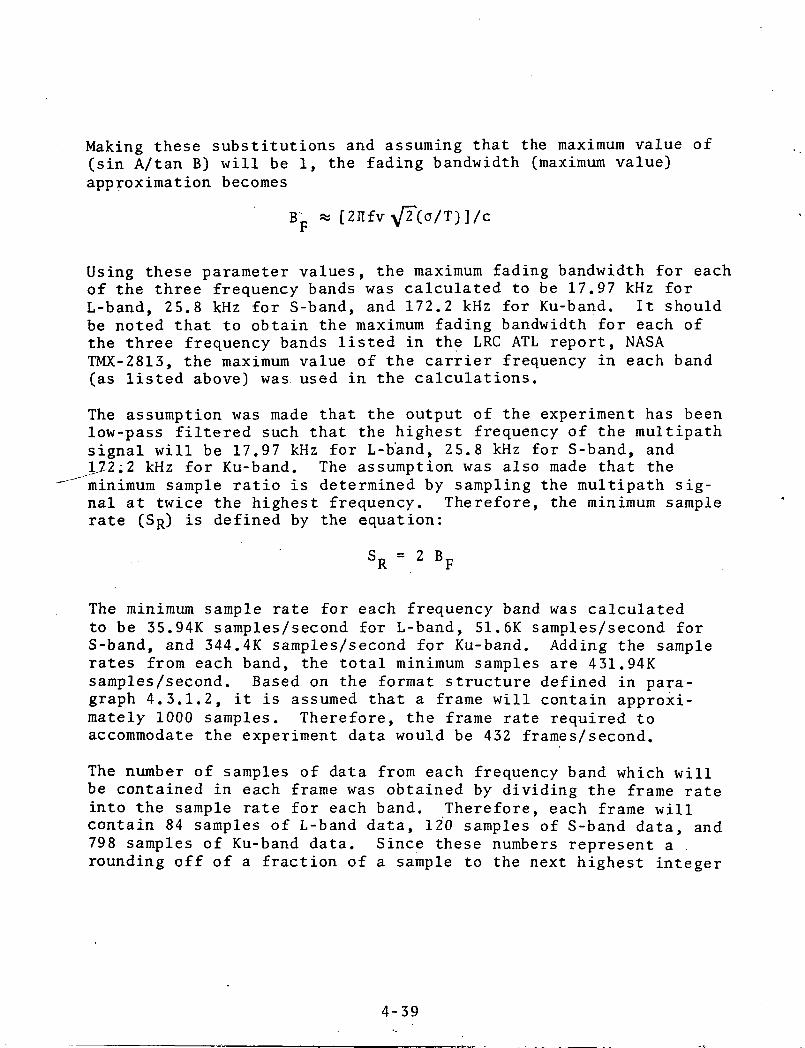
Making these substitutions and assuming that the maximum value of(sin A/tan B) will be 1, the fading bandwidth (maximum value)approximation becomes
Using these parameter values, the maximum fading bandwidth for eachof the three frequency bands was calculated to be 17.97 kHz forL-band, 25.8 kHz for S-band, and 172.2 kHz for Ku-band. It shouldbe noted that to obtain the maximum fading bandwidth for each ofthe three frequency bands listed in the LRC ATL report, NASATMX-2813, the maximum value of the carrier frequency in each band(as listed above) was used in the calculations.
The assumption was made that the output of the experiment has beenlow-pass filtered such that the highest frequency of the multipathsignal will be 17.97 kHz for L-b'and, 25.8 kHz for S-band, and1,72; 2 kHz for Ku-band. The assumption was also made that theminimum sample ratio is determined by sampling the multipath sig-nal at twice the highest frequency. Therefore, the minimum samplerate (SR) is defined by the equation:
SR= 2 BF
The minimum sample rate for each frequency band was calculatedto be 35.94K samples/second for L-band, 51. 6K samples/second forS-band, and 344. 4K samples/second for Ku-band. Adding the samplerates from each band, the total minimum samples are 431. 94Ksamples/second. Based on the format structure defined in para-graph 4.3.1.2, it is assumed that a frame will contain approxi-mately 1000 samples. Therefore, the frame rate required toaccommodate the experiment data would be 432 frames/second.
The number of samples of data from each frequency band which willbe contained in each frame was obtained by dividing the frame rateinto the sample rate for each band. Therefore, each frame willcontain 84 samples of L-band data, 120 samples of S-band data, and798 samples of Ku-band data. Since these numbers represent arounding off of a fraction of a sample to the next highest integer
4-39
sample, the actual sample rate for each frequency band will beslightly higher than previously calculated. The actual samplerate will be 36.288K samples/second for L-band, 51.84K samples/second for S-band, and 344.736K samples/second for Ku-band. Eachsample will be encoded as an 8-bit word.
Each frame will contain the following numbers of 8-bit words ofdata: 13 overhead, 1002 experiment, and 9 housekeeping as illus-trated in table 4.3-4. By combining the overhead, experiment, andhousekeeping data for 432 frames, the total data rate becomes
Overhead data rate = 44,928 b/sExperiment data rate = 3,462,912 b/sHousekeeping data rate = 31,104 b/s
Total data rate = 3,538,944 b/s
Types of housekeeping data include carrier frequencies and posi-tion; altitude, TDRS, calibration, meterological, and receiver'data, etc.
4.3.3 Earth Observations. The following paragraphs contain thedetailed documentation resulting from the analysis of the earthobservations experiments. Included in the documentation are thereferences and assumptions used in establishing the data rate foreach experiment and a baseline format description.
In addition to the nine experiments assigned to this discipline,the S190A camera assembly which flew on the Skylab was analyzed.This same experiment package will fly on an early ATL flight asa forerunner to EO-3, the Multispectral Scanner.
4.3.3.1 EO-1, Lidar Measurements of Cirrus Clouds and LowerStratospheric Aerosols. The general concepts and parameter valuesused to represent this experiment were obtained from LRC experi-ment data sheets, LRC ATL report, NASA TMX-2813, and journalarticles.
The assumptions used for this experiment are as follows:
• Vehicle altitude (h): 185 km
4-40

TABLE 4.3-4
NV-3, MULTIPATH MEASUREMENTS FORMAT
DATA RATE 3,538,944 BITS/SECONDFRAME RATE 432 FRAMES/SECONDFRAME SIZE 1,024 WORDS/FRAME (8-BIT WORDS)
8,192 BITS/FRAME
WORD
123456789
-' 101112131415•
9697
DESCRIPTION
SYNCSYNCSYNCSYNCFRAME COUNTERFORMAT IDBIT RATE IDPAYLOAD IDTIME 1TIME 2TIME 3TIME 4TIME 5L-BAND SAMPLE 1L-BAND SAMPLE 2
•
L-BAND SAMPLE 83L-BAND SAMPLE 84
WORD
9899.•
216217218219.'
1014101510161017:
10231024
DESCRIPTION
S-BAND SAMPLE 1S-BAND SAMPLE 2
.'
S-BAND SAMPLE 119S-BAND SAMPLE 120Ku-BAND SAMPLE 1Ku-BAND SAMPLE 2
.4
Ku-BAND SAMPLE 797Ku-BAND SAMPLE 798HOUSEKEEPING 1HOUSEKEEPING 2|
HOUSEKEEPING 8HOUSEKEEPING 9
4-41

• Vehicle velocity (v): 7.58 km/sec
• Extent of stratosphere: from 11 km to 48 km
• Lower stratospheric layer resolution: 100 meters, 0.66 ysec
• Laser firing per minute: 1
• Frame of data per laser firing: 1
• Each experiment data sample will contain data from each ofthe stratospheric layers (100-meter layer)
• Experiment data rate: 100 samples/minute
• Content of one sample: 8 bits.
Each frame of data will contain the following numbers of 8-bit..words of data: 100 experiment, 13 overhead, and 7 housekeepingas illustrated in table 4.3-5. The total data rate is obtainedfrom the following: 1 frame per minute, 960 bits per frame whichgives a total rate of 16 bits per second.
Types of housekeeping data include pulse number, photomultiplierpower supply voltage, input sensitivity, laser status, calibrationdata, and temperatures.
4.3.3.2 EO-2^Tunable Lasers for High-Resolution Studies of Atmo-spheric Constituents and Pollutants. The tunable lasers experimentpackage will consist of a tunable injection laser monochromatorand a tunable laser heterodyne radiometer for use in measuringatmospheric constituents and pollutants.
The parameters to be measured are:
• Vertical distribution of atmospheric constituents andpollutants which contain absorption bands in the 2 or 3pM region
• Spectroscopic parameters such as line shapes and line posi-tions for use in computer modeling programs of the atmosphere
• Concentration of molecules in the atmosphere interior toand surrounding the Shuttle.
4-42
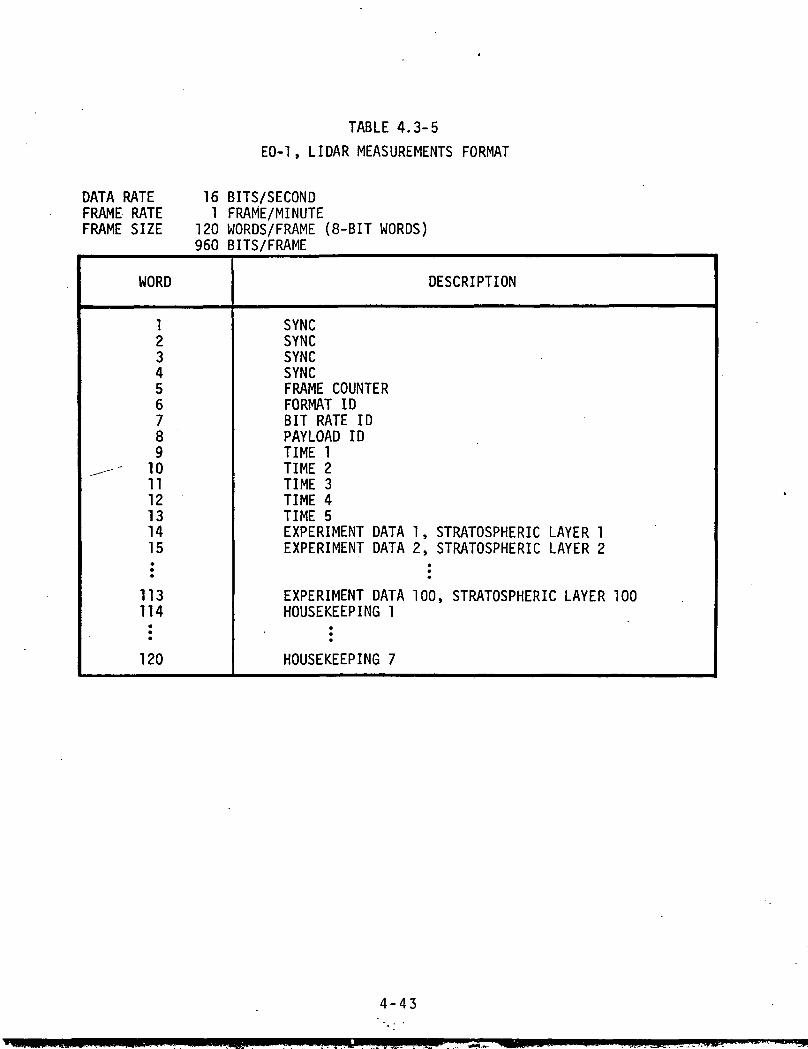
TABLE 4.3-5
EO-1, LIDAR MEASUREMENTS FORMAT
DATA RATE 16 BITS/SECONDFRAME RATE 1 FRAME/MINUTEFRAME SIZE 120 WORDS/FRAME (8-BIT WORDS)
960 BITS/FRAME
WORD
123456789
-" 101112131415
113114
120
DESCRIPTION
SYNCSYNCSYNCSYNCFRAME COUNTERFORMAT IDBIT RATE IDPAYLOAD IDTIME 1TIME 2TIME 3TIME 4TIME 5EXPERIMENT DATA 1 , STRATOSPHERIC LAYER 1EXPERIMENT DATA 2, STRATOSPHERIC LAYER 2
•
EXPERIMENT DATA 100, STRATOSPHERIC LAYER 100HOUSEKEEPING 1
HOUSEKEEPING 7
4-43
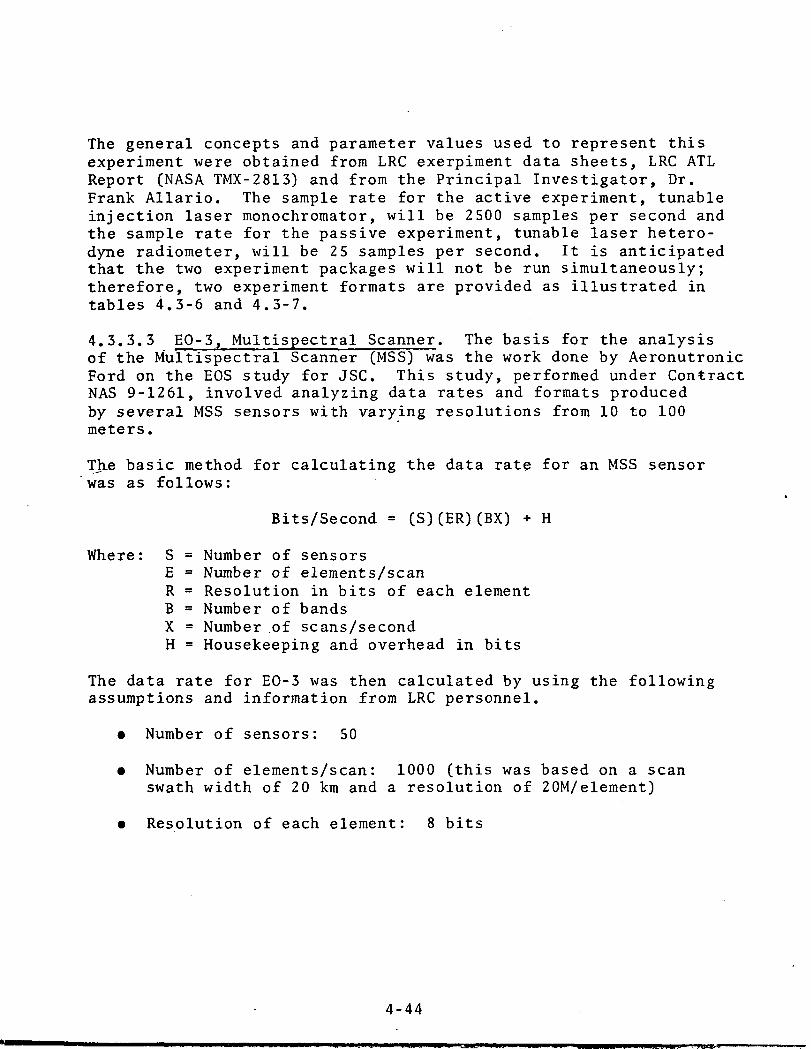
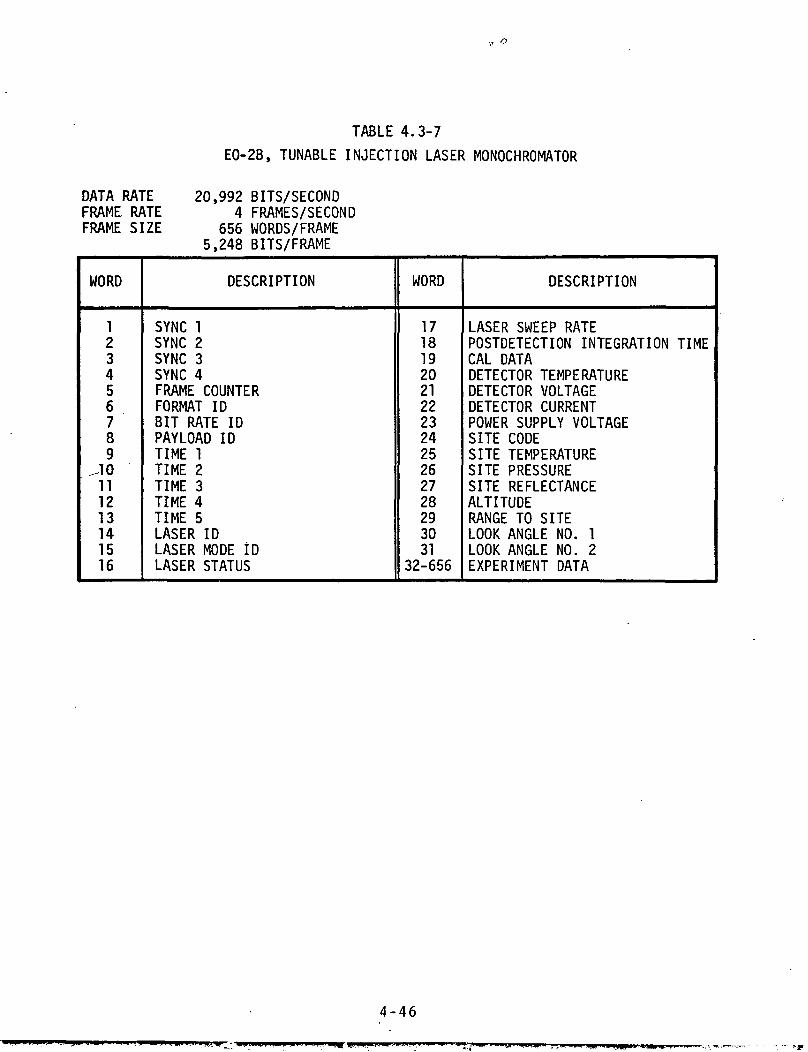
The general concepts and parameter values used to represent thisexperiment were obtained from LRC exerpiment data sheets, LRC ATLReport (NASA TMX-2813) and from the Principal Investigator, Dr.Frank Allario. The sample rate for the active experiment, tunableinjection laser monochromator, will be 2500 samples per second andthe sample rate for the passive experiment, tunable laser hetero-dyne radiometer, will be 25 samples per second. It is anticipatedthat the two experiment packages will not be run simultaneously;therefore, two experiment formats are provided as illustrated intables 4.3-6 and 4.3-7.
4.3.3.3 HO-3, Multispectral Scanner. The basis for the analysisof the Multispectral Scanner (MSS) was the work done by AeronutronicFord on the EOS study for JSC. This study, performed under ContractNAS 9-1261, involved analyzing data rates and formats producedby several MSS sensors with varying resolutions from 10 to 100meters.
The basic method for calculating the data rate for an MSS sensorwas as follows:
Bits/Second = (S)(ER)(BX) + H
Where: S = Number of sensorsE = Number of elements/scanR = Resolution in bits of each elementB = Number of bandsX = Number .of scans/secondH = Housekeeping and overhead in bits
The data rate for EO-3 was then calculated by using the followingassumptions and information from LRC personnel.
• Number of sensors: 50
• Number of elements/scan: 1000 (this was based on a scanswath width of 20 km and a resolution of 20M/element)
• Resolution of each element: 8 bits
4-44
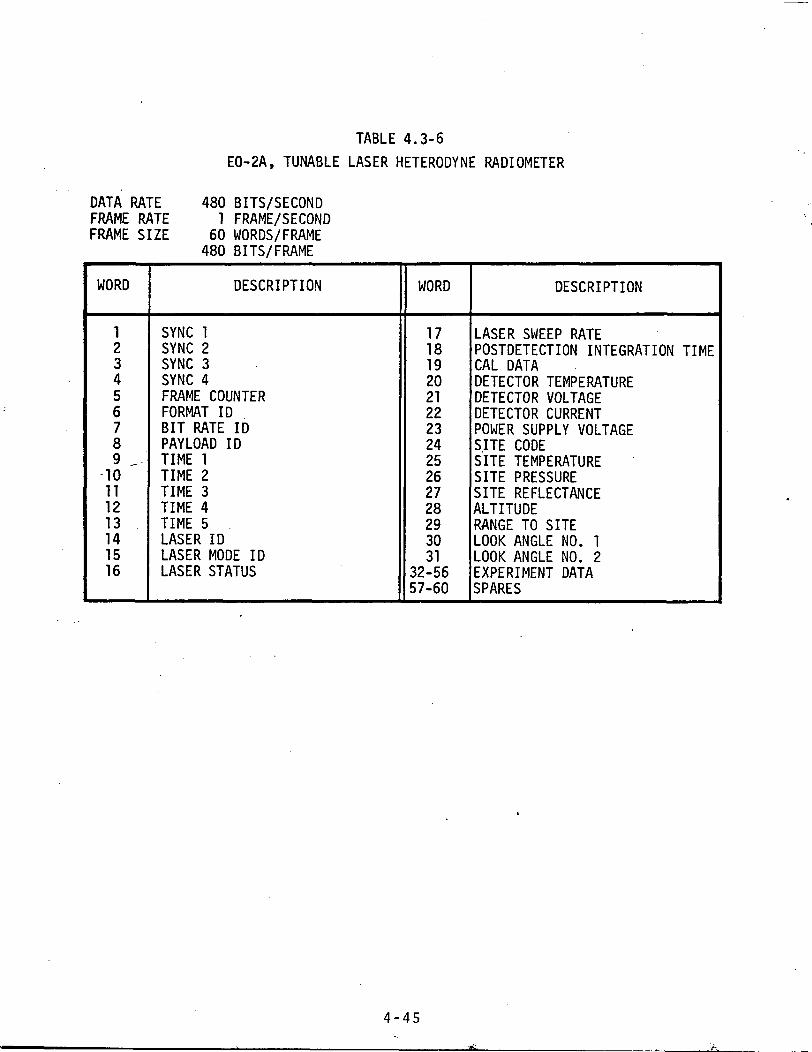
TABLE 4.3-6EO-2A, TUNABLE LASER HETERODYNE RADIOMETER
DATA RATE 480 BITS/SECONDFRAME RATE 1 FRAME/SECONDFRAME SIZE 60 WORDS/FRAME
480 BITS/FRAME
WORD
123456789 10111213141516
DESCRIPTION
SYNC 1SYNC 2SYNC 3SYNC 4FRAME COUNTERFORMAT IDBIT RATE IDPAYLOAD IDTIME 1TIME 2TIME 3TIME 4TIME 5LASER IDLASER MODE IDLASER STATUS
WORD
171819202122232425262728293031
32-5657-60
DESCRIPTION
LASER SWEEP RATEPOSTDETECTION INTEGRATION TIMECAL DATADETECTOR TEMPERATUREDETECTOR VOLTAGEDETECTOR CURRENTPOWER SUPPLY VOLTAGESITE CODESITE TEMPERATURESITE PRESSURESITE REFLECTANCEALTITUDERANGE TO SITELOOK ANGLE NO. 1LOOK ANGLE NO. 2EXPERIMENT DATASPARES
4-45
DATA RATEFRAME RATEFRAME SIZE
TABLE 4.3-7EO-2B, TUNABLE INJECTION LASER MONOCHROMATOR
20,992 BITS/SECOND4 FRAMES/SECOND
656 WORDS/FRAME5,248 BITS/FRAME
WORD
123456789
JO111213141516
DESCRIPTION
SYNC 1SYNC 2SYNC 3SYNC 4FRAME COUNTERFORMAT IDBIT RATE IDPAYLOAD IDTIME 1TIME 2TIME 3TIME 4TIME 5LASER IDLASER MODE IDLASER STATUS
WORD
171819202122232425262728293031
32-656
DESCRIPTION
LASER SWEEP RATEPOSTDETECTION INTEGRATION TIMECAL DATADETECTOR TEMPERATUREDETECTOR VOLTAGEDETECTOR CURRENTPOWER SUPPLY VOLTAGESITE CODESITE TEMPERATURESITE PRESSURESITE REFLECTANCEALTITUDERANGE TO SITELOOK ANGLE NO. 1LOOK ANGLE NO. 2EXPERIMENT DATA
4-46
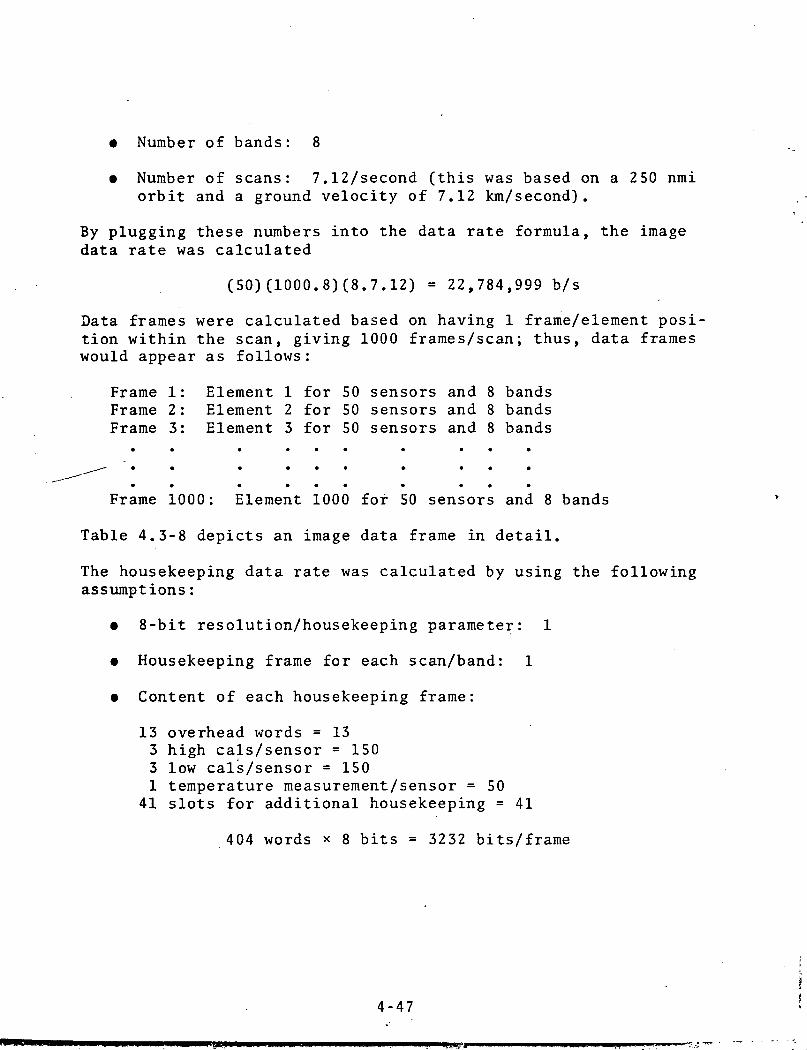
• Number of bands: 8
• Number of scans: 7.12/second (this was based on a 250 nmiorbit and a ground velocity of 7.12 km/second).
By plugging these numbers into the data rate formula, the imagedata rate was calculated
(50)(1000.8)(8.7.12) = 22,784,999 b/s
Data frames were calculated based on having 1 frame/element posi-tion within the scan, giving 1000 frames/scan; thus, data frameswould appear as follows:
Frame 1: Element 1 for 50 sensors and 8 bandsFrame 2: Element 2 for 50 sensors and 8 bandsFrame 3: Element 3 for 50 sensors and 8 bands
Frame 1000: Element 1000 for 50 sensors and 8 bands
Table 4.3-8 depicts an image data frame in detail.
The housekeeping data rate was calculated by using the followingassumptions:
• 8-bit resolution/housekeeping parameter: 1
• Housekeeping frame for each scan/band: 1
• Content of each housekeeping frame:
13 overhead words = 133 high cals/sensor = 1503 low cals/sensor = 1501 temperature measurement/sensor = 50
41 slots for additional housekeeping = 41
404 words x 8 bits = 3232 bits/frame
4-47
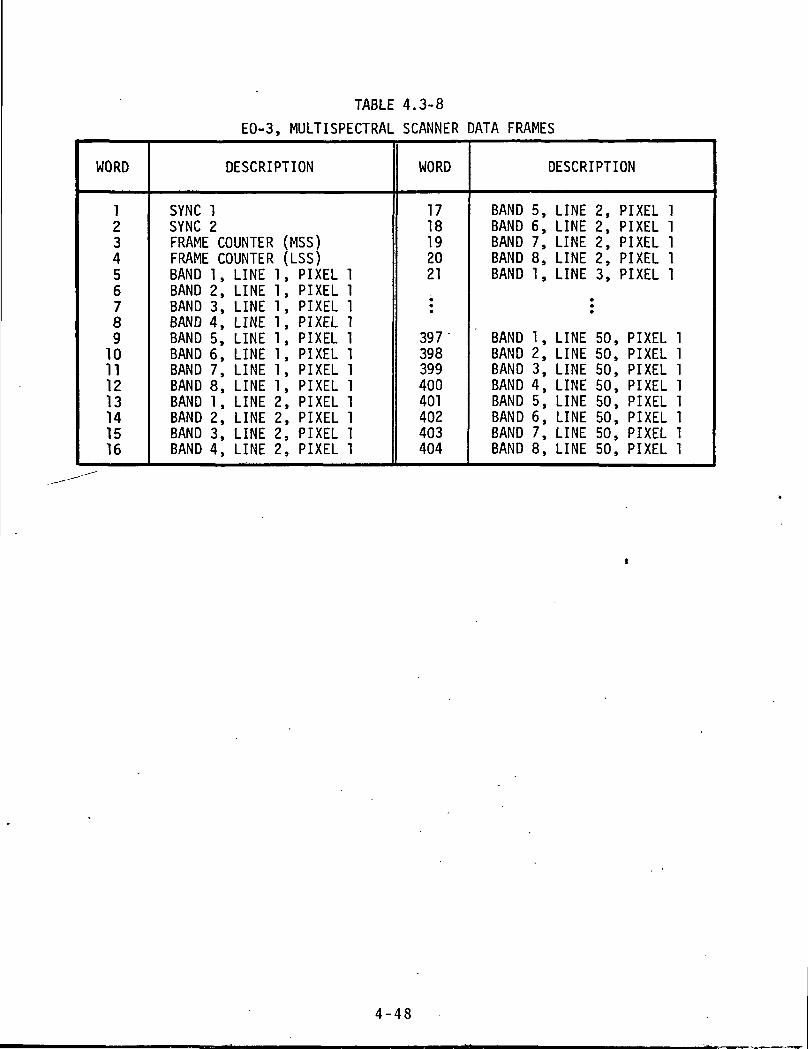
TABLE 4.3-8EO-3, MULTISPECTRAL SCANNER DATA FRAMES
WORD
12345678910111213141516
DESCRIPTION
SYNC 1SYNC 2FRAME COUNTER (MSS)FRAME COUNTER (LSS)BAND 1, LINE 1, PIXEL 1BAND 2, LINE 1, PIXEL 1BAND 3, LINE 1, PIXEL 1BAND 4, LINE 1, PIXEL 1BAND 5, LINE 1, PIXEL 1BAND 6, LINE 1, PIXEL 1BAND 7, LINE 1, PIXEL 1BAND 8, LINE 1, PIXEL 1BAND 1, LINE 2, PIXEL 1BAND 2, LINE 2, PIXEL 1BAND 3, LINE 2, PIXEL 1BAND 4, LINE 2, PIXEL 1
WORD
1718192021
••
397398399400401402403404
DESCRIPTION
BAND 5, LINE 2, PIXEL 1BAND 6, LINE 2, PIXEL 1BAND 7, LINE 2, PIXEL 1BAND 8, LINE 2, PIXEL 1BAND 1, LINE 3, PIXEL 1
••
BAND 1, LINE 50, PIXEL 1BAND 2, LINE 50, PIXEL 1BAND 3, LINE 50, PIXEL 1BAND 4, LINE 50, PIXEL 1BAND 5, LINE 50, PIXEL 1BAND 6, LINE 50, PIXEL 1BAND 7, LINE 50, PIXEL 1BAND 8, LINE 50, PIXEL 1
4-48
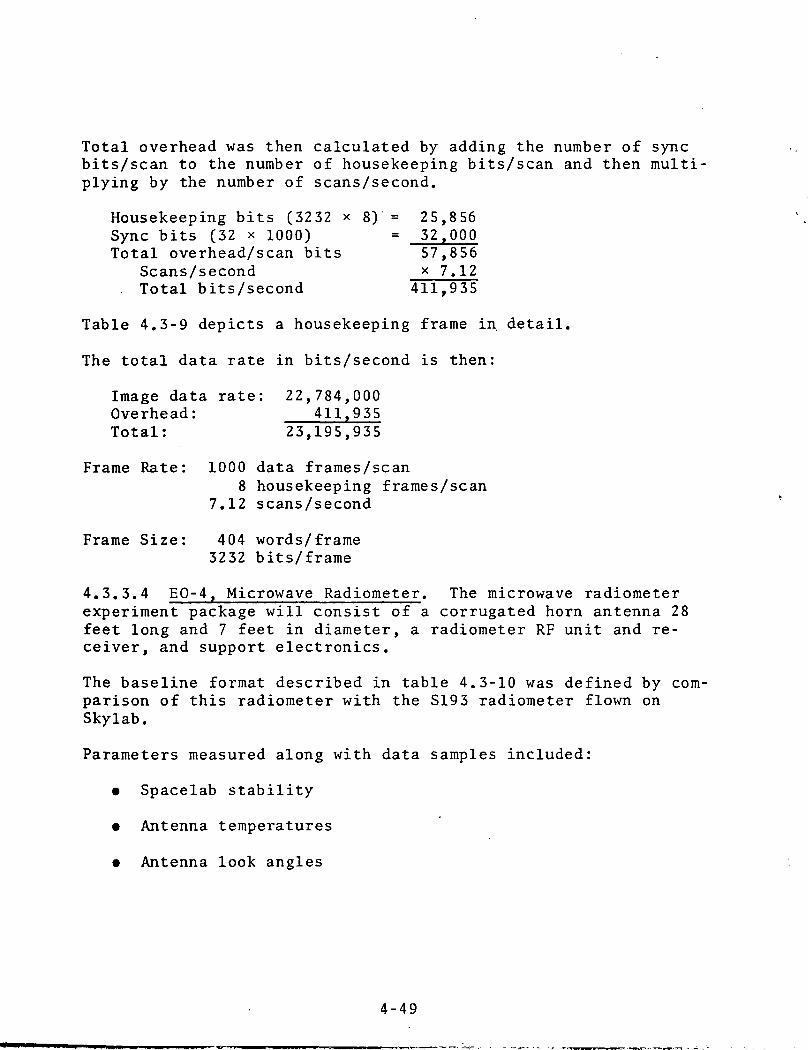
Total overhead was then calculated by adding the number of syncbits/scan to the number of housekeeping bits/scan and then multi-plying by the number of scans/second.
Housekeeping bits (3232 x 8) = 25,856Sync bits (32 x 1000) = 52,000Total overhead/scan bits 57,856
Scans/second x 7.12. Total bits/second 411,935
Table 4.3-9 depicts a housekeeping frame in detail.
The total data rate in bits/second is then:
Image data rate: 22,784,000Overhead: 411.955Total: 23,195,955
Frame Rate: 1000 data frames/scan8 housekeeping frames/scan
7.12 scans/second
Frame Size: 404 words/frame5252 bits/frame
4.3.3.4 EO-4, Microwave Radiometer. The microwave radiometerexperiment package will consist of a corrugated horn antenna 28feet long and 7 feet in diameter, a radiometer RF unit and re-ceiver, and support electronics.
The baseline format described in table 4.3-10 was defined by com-parison of this radiometer with the S195 radiometer flown onSkylab.
Parameters measured along with data samples included:
• Spacelab stability
• Antenna temperatures
• Antenna look angles
4-49
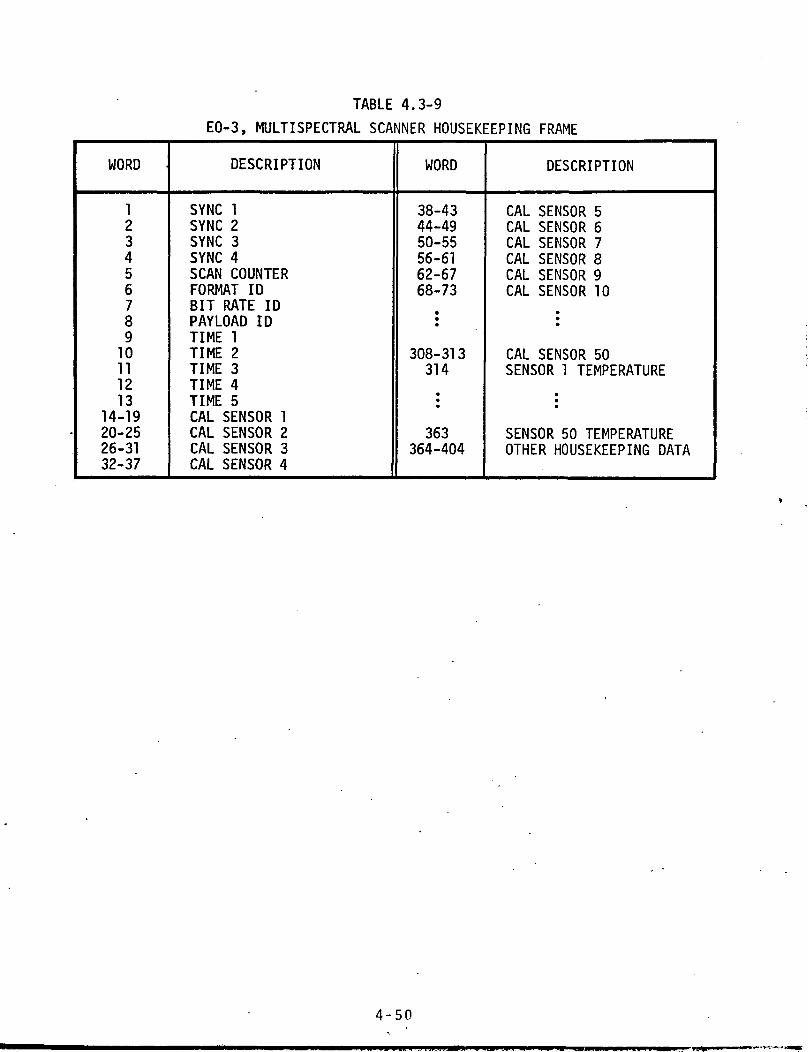
TABLE 4.3-9
EO-3, MULTISPECTRAL SCANNER HOUSEKEEPING FRAME
WORD
12345678910111213
14-1920-2526-3132-37
DESCRIPTION
SYNC 1SYNC 2SYNC 3SYNC 4SCAN COUNTERFORMAT IDBIT RATE IDPAYLOAD IDTIME 1TIME 2TIME 3TIME 4TIME 5CAL SENSOR 1CAL SENSOR 2CAL SENSOR 3CAL SENSOR 4
WORD
38-4344-4950-5556-6162-6768-73
••
308-31 3314•••
363364-404
DESCRIPTION
CAL SENSOR 5CAL SENSOR 6CAL SENSOR 7CAL SENSOR 8CAL SENSOR 9CAL SENSOR 10
••
CAL SENSOR 50SENSOR 1 TEMPERATURE
•••
SENSOR 50 TEMPERATUREOTHER HOUSEKEEPING DATA
4-50
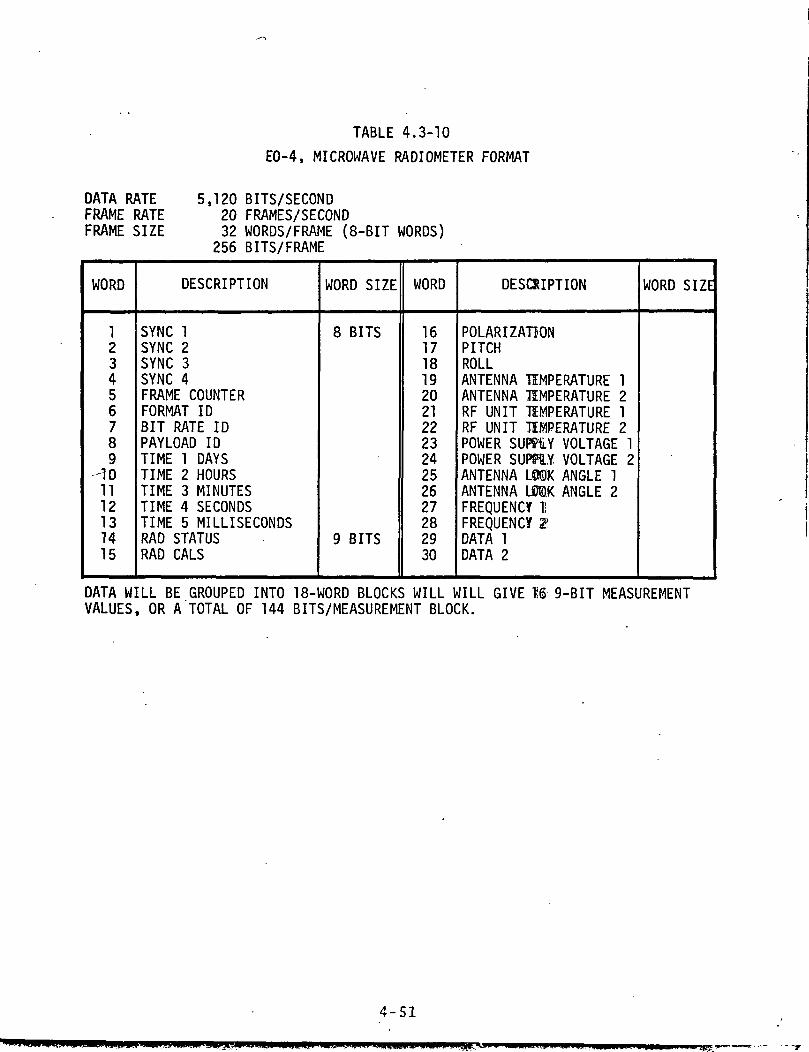
TABLE 4.3-10
EO-4, MICROWAVE RADIOMETER FORMAT
DATA RATE 5,120 BITS/SECONDFRAME RATE 20 FRAMES/SECONDFRAME SIZE 32 WORDS/FRAME (8-BIT WORDS)
256 BITS/FRAME
WORD
123456789
-101112131415
DESCRIPTION
SYNC 1SYNC 2SYNC 3SYNC 4FRAME COUNTERFORMAT IDBIT RATE IDPAY LOAD IDTIME 1 DAYSTIME 2 HOURSTIME 3 MINUTESTIME 4 SECONDSTIME 5 MILLISECONDSRAD STATUSRAD CALS
WORD SIZE
8 BITS
9 BITS
WORD
161718192021222324252627282930
DESCRIPTION
POLARIZATIONPITCHROLLANTENNA TEMPERATURE 1ANTENNA TEMPERATURE 2RF UNIT TEMPERATURE 1RF UNIT TEMPERATURE 2POWER SUPi>1LY VOLTAGE 1POWER SUPPLY VOLTAGE 2ANTENNA LOOK ANGLE 1ANTENNA USK ANGLE 2FREQUENCY 1!FREQUENCY 2>DATA 1DATA 2
WORD SIZE
DATA WILL BE GROUPED INTO 18-WORD BLOCKS WILL WILL GIVE 16 9-BIT MEASUREMENTVALUES, OR A TOTAL OF 144 BITS/MEASUREMENT BLOCK.
4-51

• Polarization
• Frequency
• Calibrations.
The following assumptions were made to establish bit rate and for-mat:
• Housekeeping data to sample: same as the S193 radiometerthat flew on Skylab
• Data sampling: 20 samples/second
• Housekeeping and data values: 9 bits in length
• Overhead values: 8 bits in length
^ • Frame rate: 20 frames/second to allow a sample of eachparameter to appear in every frame.
Using these assumptions as guidelines, the data rate was calculatedas follows:
Overhead/frame: 13 words at 8 bits/word = 104 bitsRadiometer status: 8 bits/frame = 8 bitsHousekeeping: 14 words at 9 bits/word = 126 bitsData words/frame: 2 at 9 bits/word = 18 bits
Total = 256 bits
20 frames/second at 256 bits/frame = 5120 bits/second
4.3.3.5 EO-5, Precision Laser Ranging and Altimetry. To determinethe utility, limitations, and accuracy of this experiment, severalparameters were required to be recorded for use in analysis. Theseparameters included:
• Line-of-sight angle
• Transmit time
4-52
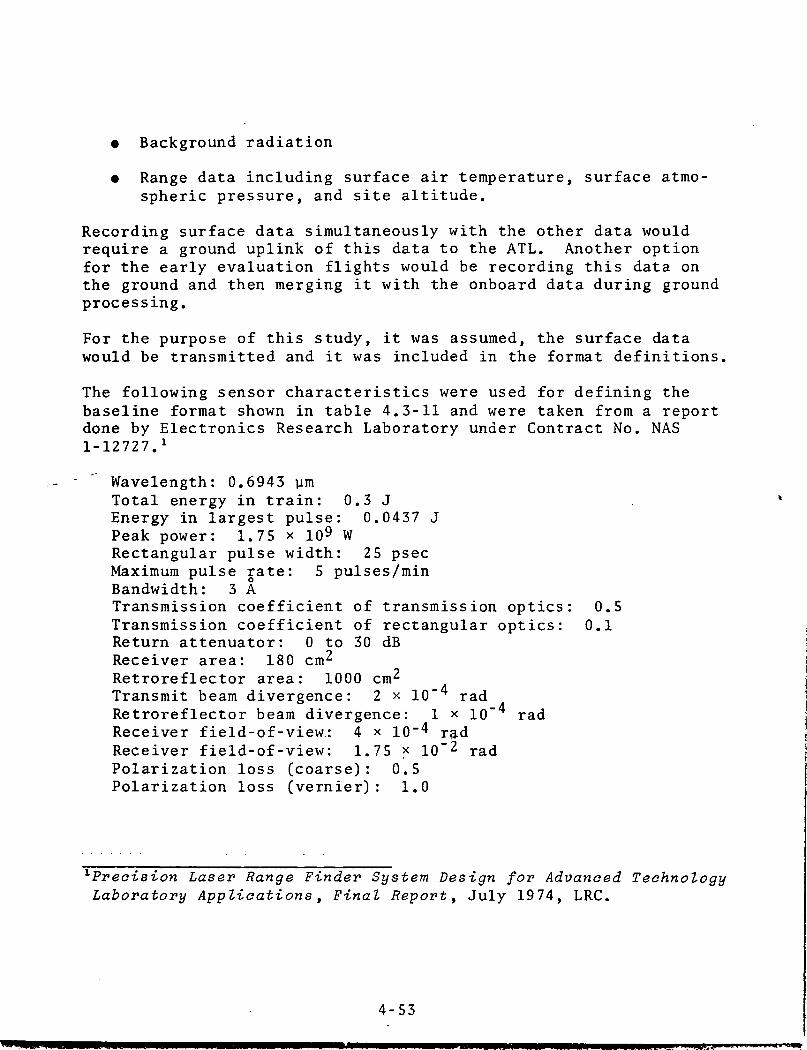
• Background radiation
• Range data including surface air temperature, surface atmo-spheric pressure, and site altitude.
Recording surface data simultaneously with the other data wouldrequire a ground uplink of this data to the ATL. Another optionfor the early evaluation flights would be recording this data onthe ground and then merging it with the onboard data during groundprocessing.
For the purpose of this study, it was assumed, the surface datawould be transmitted and it was included in the format definitions.
The following sensor characteristics were used for defining thebaseline format shown in table 4.3-11 and were taken from a reportdone by Electronics Research Laboratory under Contract No. NAS1-12727.l
Wavelength: 0.6943 ymTotal energy in train: 0.3 JEnergy in largest pulse: 0.0437 JPeak power: 1.75 x i()9 WRectangular pulse width: 25 psecMaximum pulse rate: 5 pulses/minBandwidth: 3 ATransmission coefficient of transmission optics: 0.5Transmission coefficient of rectangular optics: 0.1Return attenuator: 0 to 30 dBReceiver area: 180 cm^Retroreflector area: 1000 cm^Transmit beam divergence: 2 x 10 radRetroreflector beam divergence: 1 x 10 radReceiver field-of-view.: 4 x 10~4 radReceiver field-of-view: 1.75 x 10"2 radPolarization loss (coarse): 0.5Polarization loss (vernier): 1.0
^Precision Laser Range Finder System Design for Advanced TechnologyLaboratory Applications, Final Report, July 1974, LRC.
4-53
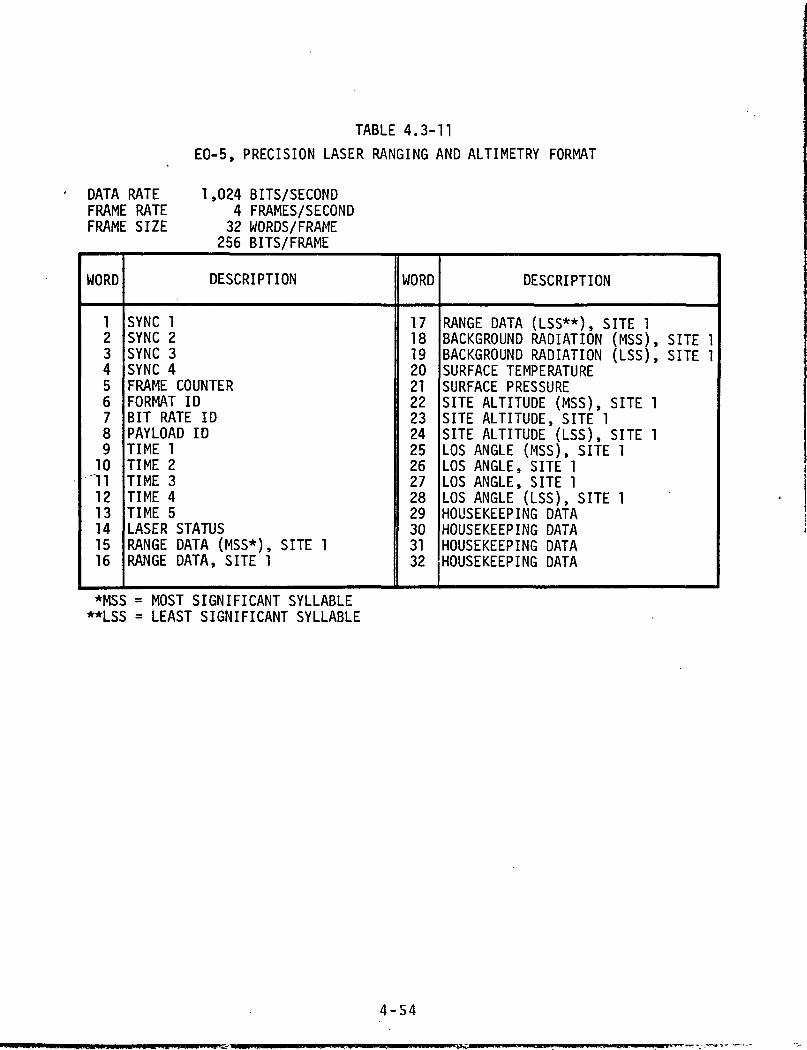
DATA RATEFRAME RATEFRAME SIZE
TABLE 4.3-11
EO-5, PRECISION LASER RANGING AND ALTIMETRY FORMAT
1,024 BITS/SECOND4 FRAMES/SECOND32 WORDS/FRAME
256 BITS/FRAME
WORD
12345678910111213141516
DESCRIPTION
SYNC 1SYNC 2SYNC 3SYNC 4FRAME COUNTERFORMAT IDBIT RATE IDPAYLOAD IDTIME 1TIME 2TIME 3TIME 4TIME 5LASER STATUSRANGE DATA (MSS*), SITE 1RANGE DATA, SITE 1
WORD
17181920212223242526272829303132
DESCRIPTION
RANGE DATA (LSS**), SITE 1BACKGROUND RADIATION (MSS), SITE 1BACKGROUND RADIATION (LSS), SITE 1SURFACE TEMPERATURESURFACE PRESSURESITE ALTITUDE (MSS), SITE 1SITE ALTITUDE, SITE 1SITE ALTITUDE (LSS), SITE 1LOS ANGLE (MSS), SITE 1LOS ANGLE, SITE 1LOS ANGLE, SITE 1LOS ANGLE (LSS), SITE 1HOUSEKEEPING DATAHOUSEKEEPING DATAHOUSEKEEPING DATAHOUSEKEEPING DATA
*MSS = MOST SIGNIFICANT SYLLABLE**LSS = LEAST SIGNIFICANT SYLLABLE
4-54

Solar spectral irradiance: 0.137 x 10"4 W cm"2/ABore sight alignment: ±5 x IQ-5 radOptical beacon tracking accuracy: ±5 x 10"5 radTracking rate: 3 deg/sec
The following assumptions were made to calculate data rate andformat:
• Measurements/data take: 9
• Ranging: four sites simultaneously
• Range data: 24 bits/sample
• Background radiation: 16 bits/sample
• Surface data: 8 bits/sample (except for site altitude whichis 24 bits/sample)
• Line-of-sight angle: 32 bits/sample
• Housekeeping data: 4 8-bit words
• Overhead: 14 8-bit words
• Frames/second: 4 (frames 1 through 4 contain data fromsites 1 through 4, respectively)
• Data acquisition time: 90 seconds
• Measurement: 1 every 10 seconds
• Data stream: continuous during data acquisition with statusand housekeeping words indicating actual data take periods
• Frame size calculation:
14 overhead words = 112 bitsRange data = 24 bitsBackground radiation = 16 bitsSurface data = 40 bitsLOS angle = 32 bitsHousekeeping = 32 bits
Total = 256 bits
4-55
4.3.3.6 EO-6, Microwave Altimeter. The following paragraphs arethe results of a comparative examination of the microwave altim-eter in the Skylab Earth Resources System. They are not meant tooffer firm design parameters; however, they represent typical con-siderations necessary for the design of the ATL microwave altim-eter. Data rates, housekeeping parameters, and data formattingare based on the Skylab instrument.
The ATL microwave altimeter experiment package consists of a trans-mitter, receiver, peripheral electronics, an electronically steeredantenna array, and various support equipment.
The transmitter will operate at a wavelength somewhere between 2centimeters and a few millimeters; optimum wavelength has not beenselected. Power will be on the order of 600 watts. The transmitterwill be pulsed and swept by a linear chirp network.
The transmitter will be used in conjunction with a wide bandwidthreceiver. It is proposed that the receiver and its control elec-tronics be designed to allow usage as a passive radiometer eitherbetween altimeter returns at the same frequency or independentlyat a different frequency.
The antenna will be a center-fed slotted waveguide array with elec-tronic steering. It will use synthetic aperture techniques in thealong-track direction and a real aperture in the cross-trackdirection.
Peripheral electronics will include both automatic and manual con-trols and the capability to select three or four modes of opera-tion. Possible modes include synthetic aperture mode with andwithout electronic steering, and a radiometer mode on an alter-nate frequency and/or between altimeter returns. A signal displayand monitoring system and the capability to record data on mag-netic tape will also be required. No data telemetry will beemployed.
Support equipment will include a photographic camera and a TVcamera and monitor.
4-56
The entire package will be designed with the capability to obtainheight profile data of the geoid to an accuracy of 1 meter andbetter.
The following assumptions were made to establish bit rate andformat.
• Format: patterned after the S193 altimeter which flew onSkylab
• Data and housekeeping values: 10 bits in length
• Overhead values: 8 bits in length
• Subframes per frame of data: 53 (subframe 1 will contain theoverhead data and 17 words of housekeeping data; subframes2-53 will contain 5 words of housekeeping, 20 words ofsample/hold data for wave shape sampling, and 5 words of
,.- •" fill to obtain an integral multiple of 16 bits).
Using these assumptions as guidelines the data rate will be asfollows:
• 30 word/subframe = 240 bits
• 50 subframes/second = 12,000 bits/second.
The detailed format structure is depicted in table 4.3-12; table4.3-13 is the housekeeping measurement list; and table 4.3-14 isthe data measurement list.
4.3.3.7 EO-7, Search and Rescue Aids. This experiment will usethe same antenna and electronic equipment as EO-8. During theATL mission they will operate simultaneously. For bit rate andformat definition, reference paragraph 4.3.3.8, EO-7/8 ImagingRadar.
4.3.3.8 EO-7/8, Imaging Radar. The information presented in thefollowing paragraphs does not represent a point design; however,the system description, parameter values, and format are typical
4-5-7

TABLE 4.3-12 .EO-6, MICROWAVE ALTIMETER DATA FRAME FORMAT
SUBFRAME 1 (8-BIT WORDS)
WORD
123456789101112131415
16-30
CONTENT
FRAME SYNCFRAME SYNCFRAME SYNCFRAME SYNCFRAME COUNTERFORMAT IDBIT RATE IDPAYLOAD IDTIME 1TIME 2TIME 3TIME 4TIME 5FILLFILLFILL OR SPARE DATA ANDHOUSEKEEPING BLOCKS
SUBFRAMES 2 THROUGH 53*WORD
1-4
567891011121314151617181920212223242526-30
CONTENT
HOUSEKEEPING, DATA ANDSTATUS WORDSFRAME COUNTERSAMPLE/HOLD NO. 1SAMPLE/HOLD NO. 2SAMPLE/HOLD NO. 3SAMPLE/HOLD NO. 4
SAMPLE/HOLD NO. 5SAMPLE/HOLD NO. 6SAMPLE/HOLD NO. 7SAMPLE/HOLD NO. 8
SAMPLE/HOLD NO. 1SAMPLE/HOLD NO. 2SAMPLE/HOLD NO. 3SAMPLE/HOLD NO. 4
SAMPLE/HOLD NO. 5SAMPLE/HOLD NO. 6SAMPLE/HOLD NO. 7SAMPLE/HOLD NO. 8
FILL
*SUBFRAMES 2 THROUGH 53 HAVE 10-BIT WORDS BLOCKED TO FIT AN 8-BIT FORMAT.EACH BLOCK CONTAINS FIVE 8-BIT WORDS WHICH IS EQUIVALENT TO FOUR 10-BIT WORDS.
4-58
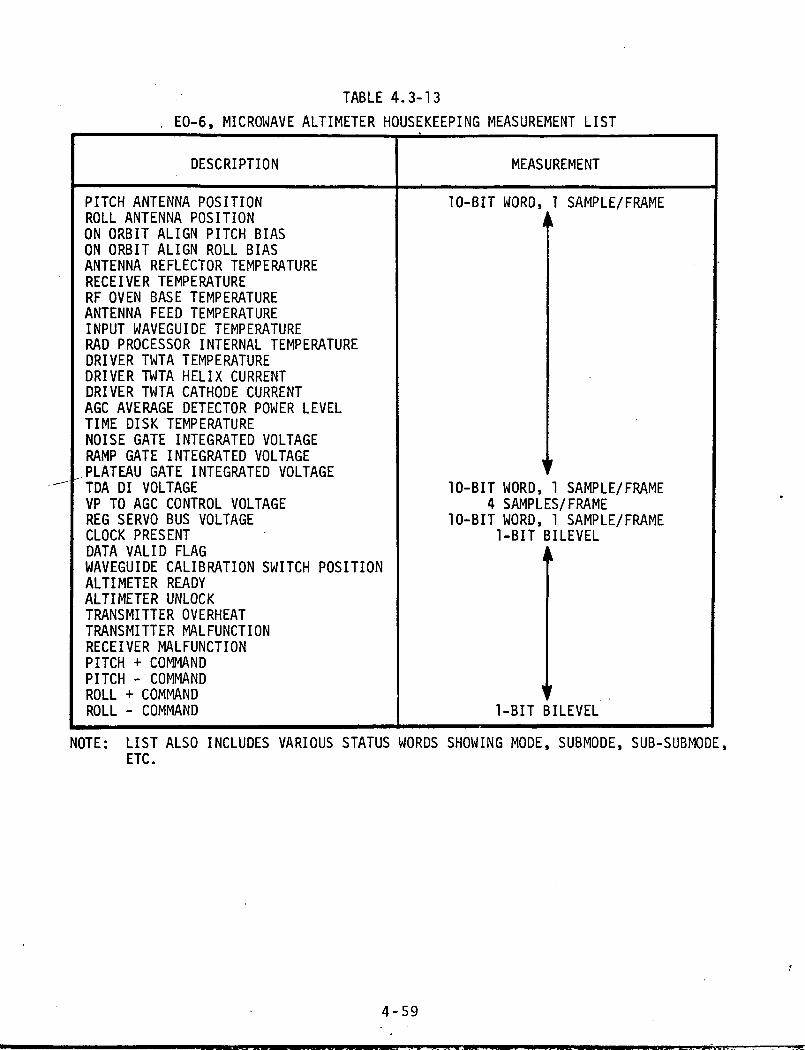
TABLE 4.3-13
EO-6, MICROWAVE ALTIMETER HOUSEKEEPING MEASUREMENT LIST
DESCRIPTION MEASUREMENT
PITCH ANTENNA POSITIONROLL ANTENNA POSITIONON ORBIT ALIGN PITCH BIASON ORBIT ALIGN ROLL BIASANTENNA REFLECTOR TEMPERATURERECEIVER TEMPERATURERF OVEN BASE TEMPERATUREANTENNA FEED TEMPERATUREINPUT WAVEGUIDE TEMPERATURERAD PROCESSOR INTERNAL TEMPERATUREDRIVER TWTA TEMPERATUREDRIVER TWTA HELIX CURRENTDRIVER TWTA CATHODE CURRENTAGC AVERAGE DETECTOR POWER LEVELTIME DISK TEMPERATURENOISE GATE INTEGRATED VOLTAGERAMP GATE INTEGRATED VOLTAGE.PLATEAU GATE INTEGRATED VOLTAGETDA DI VOLTAGEVP TO AGC CONTROL VOLTAGEREG SERVO BUS VOLTAGECLOCK PRESENTDATA VALID FLAGWAVEGUIDE CALIBRATION SWITCH POSITIONALTIMETER READYALTIMETER UNLOCKTRANSMITTER OVERHEATTRANSMITTER MALFUNCTIONRECEIVER MALFUNCTIONPITCH + COMMANDPITCH - COMMANDROLL + COMMANDROLL - COMMAND
10-BIT WORD, 1 SAMPLE/FRAME
10-BIT WORD, 1 SAMPLE/FRAME4 SAMPLES/FRAME
10-BIT WORD, 1 SAMPLE/FRAME1-BIT BILEVEL
1-BIT BILEVEL
NOTE: LIST ALSO INCLUDES VARIOUS STATUS WORDS SHOWING MODE, SUBMODE, SUB-SUBMODE,ETC.
4-59
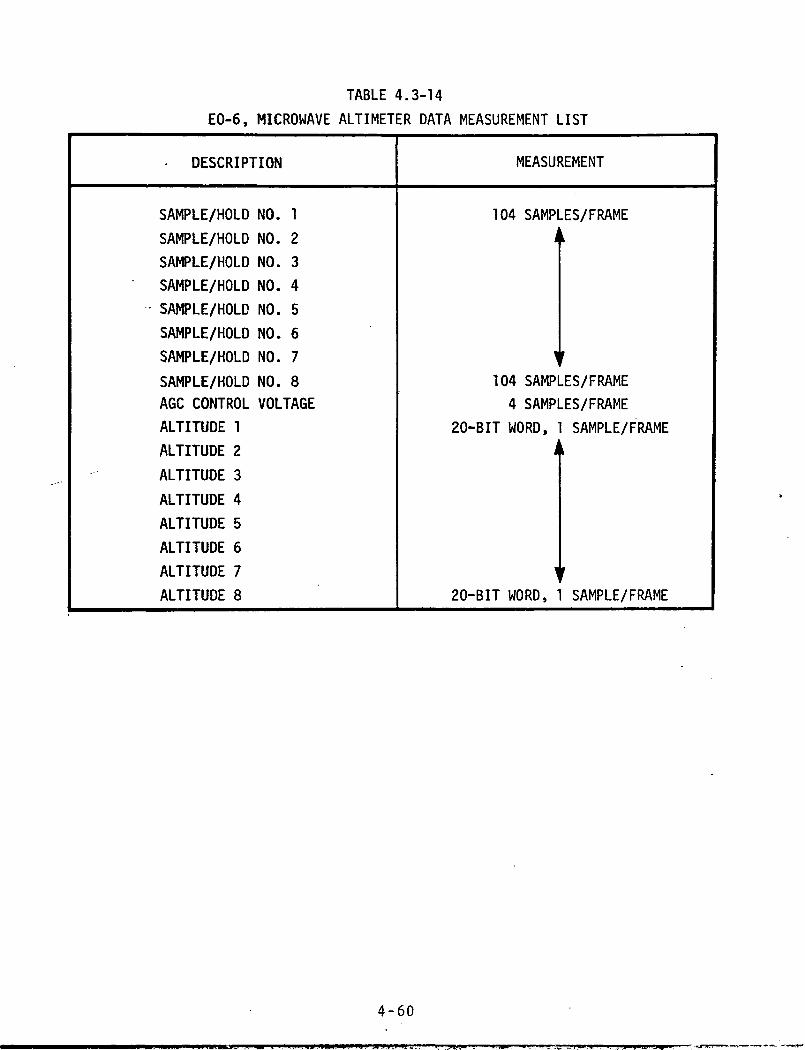
TABLE 4.3-14
EO-6, MICROWAVE ALTIMETER DATA MEASUREMENT LIST
DESCRIPTION MEASUREMENT
SAMPLE/HOLD NO. 1
SAMPLE/HOLD NO. 2
SAMPLE/HOLD NO. 3
SAMPLE/HOLD NO. 4
SAMPLE/HOLD NO. 5
SAMPLE/HOLD NO. 6
SAMPLE/HOLD NO. 7
SAMPLE/HOLD NO. 8AGC CONTROL VOLTAGE
ALTITUDE 1
ALTITUDE 2
ALTITUDE 3
ALTITUDE 4
ALTITUDE 5
ALTITUDE 6
ALTITUDE 7
ALTITUDE 8
104 SAMPLES/FRAME
t
104 SAMPLES/FRAME
4 SAMPLES/FRAME
20-BIT WORD, 1 SAMPLE/FRAME
20-BIT WORD, 1 SAMPLE/FRAME
4-60
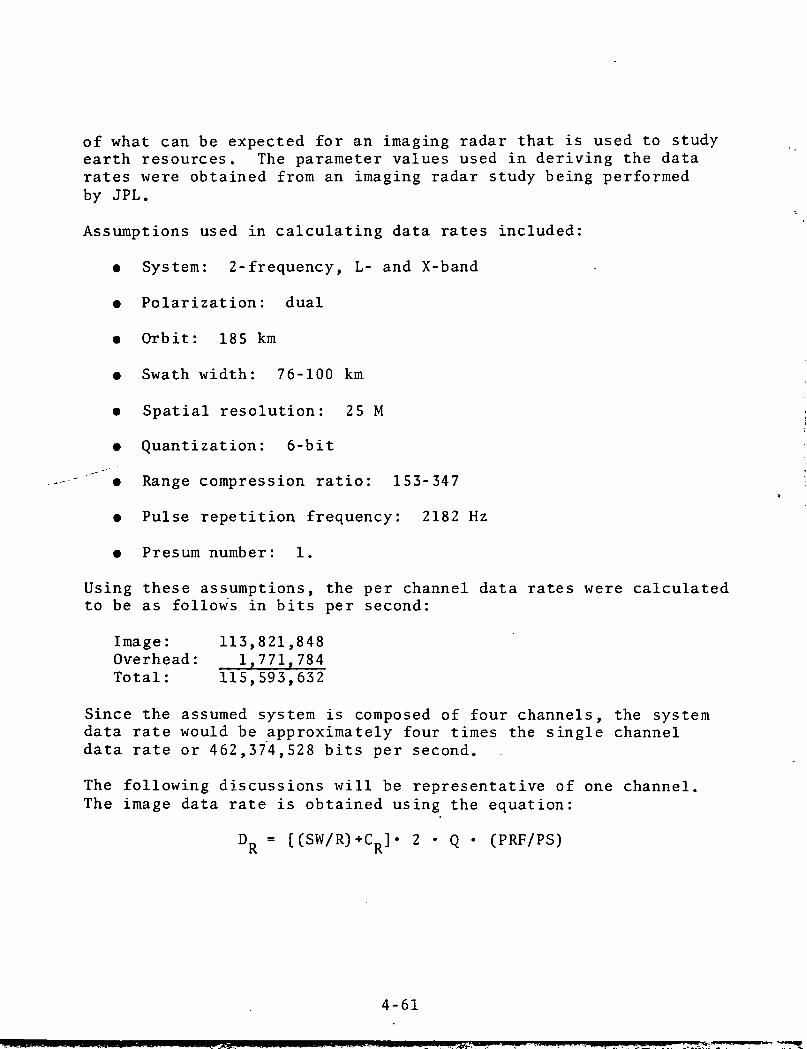
of what can be expected for an imaging radar that is used to studyearth resources. The parameter values used in deriving the datarates were obtained from an imaging radar study being performedby JPL.
Assumptions used in calculating data rates included:
• System: 2-frequency, L- and X-band
• Polarization: dual
• Orbit: 185 km
• Swath width: 76-100 km
• Spatial resolution: 25 M
• Quantization: 6-bit
""" • Range compression ratio: 153-347
• Pulse repetition frequency: 2182 Hz
• Presum number: 1.
Using these assumptions, the per channel data rates were calculatedto be as follows in bits per second:
Image: 113,821,848Overhead: 1,771,784Total: 115,593,632
Since the assumed system is composed of four channels, the systemdata rate would be approximately four times the single channeldata rate or 462,374,528 bits per second.
The following discussions will be representative of one channel.The image data rate is obtained using the equation:
DR = [(SW/R)+CR]« 2 • Q • (PRF/PS)
4-61
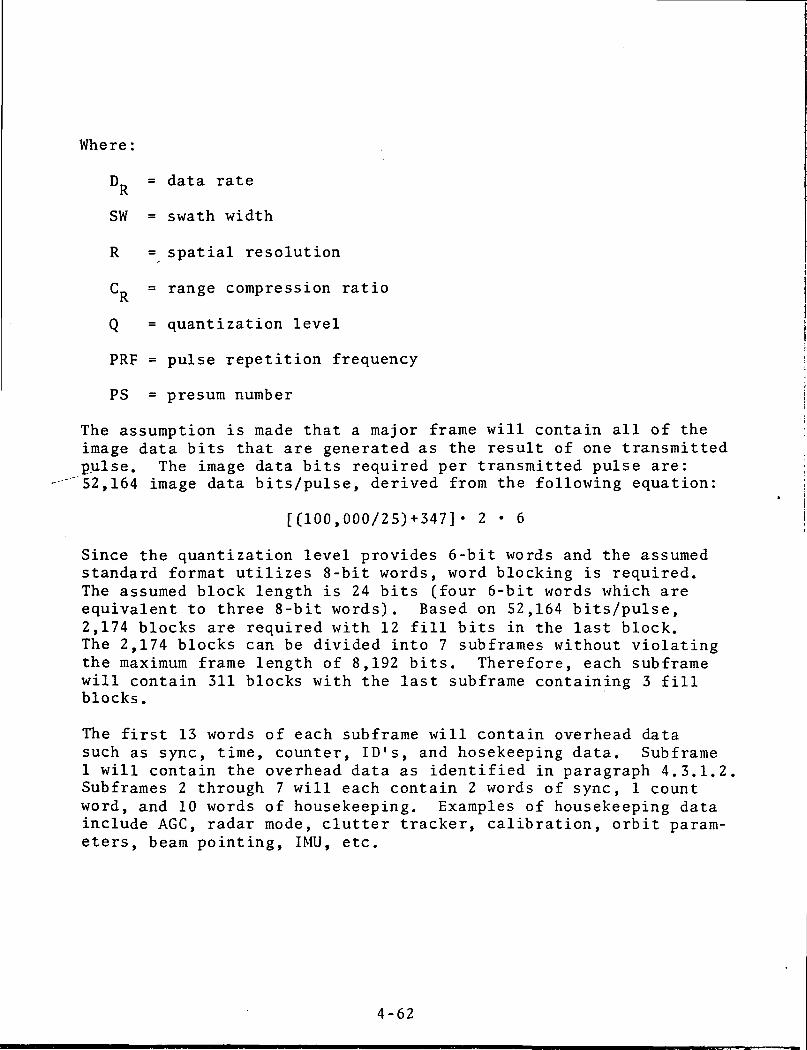
Where:
D = data rateR
SW = swath width
R = spatial resolution
Cn = range compression ratioK
Q = quantization level
PRF = pulse repetition frequency
PS = presum number
The assumption is made that a major frame will contain all of theimage data bits that are generated as the result of one transmittedpulse. The image data bits required per transmitted pulse are:52,164 image data bits/pulse, derived from the following equation:
[(100,000/25)+347]• 2 • 6
Since the quantization level provides 6-bit words and the assumedstandard format utilizes 8-bit words, word blocking is required.The assumed block length is 24 bits (four 6-bit words which areequivalent to three 8-bit words). Based on 52,164 bits/pulse,2,174 blocks are required with 12 fill bits in the last block.The 2,174 blocks can be divided into 7 subframes without violatingthe maximum frame length of 8,192 bits. Therefore, each subframewill contain 311 blocks with the last subframe containing 3 fillblocks.
The first 13 words of each subframe will contain overhead datasuch as sync, time, counter, ID's, and hosekeeping data. Subframe1 will contain the overhead data as identified in paragraph 4.3.1.2.Subframes 2 through 7 will each contain 2 words of sync, 1 countword, and 10 words of housekeeping. Examples of housekeeping datainclude AGC, radar mode, clutter tracker, calibration, orbit param-eters, beam pointing, IMU, etc.
4-62
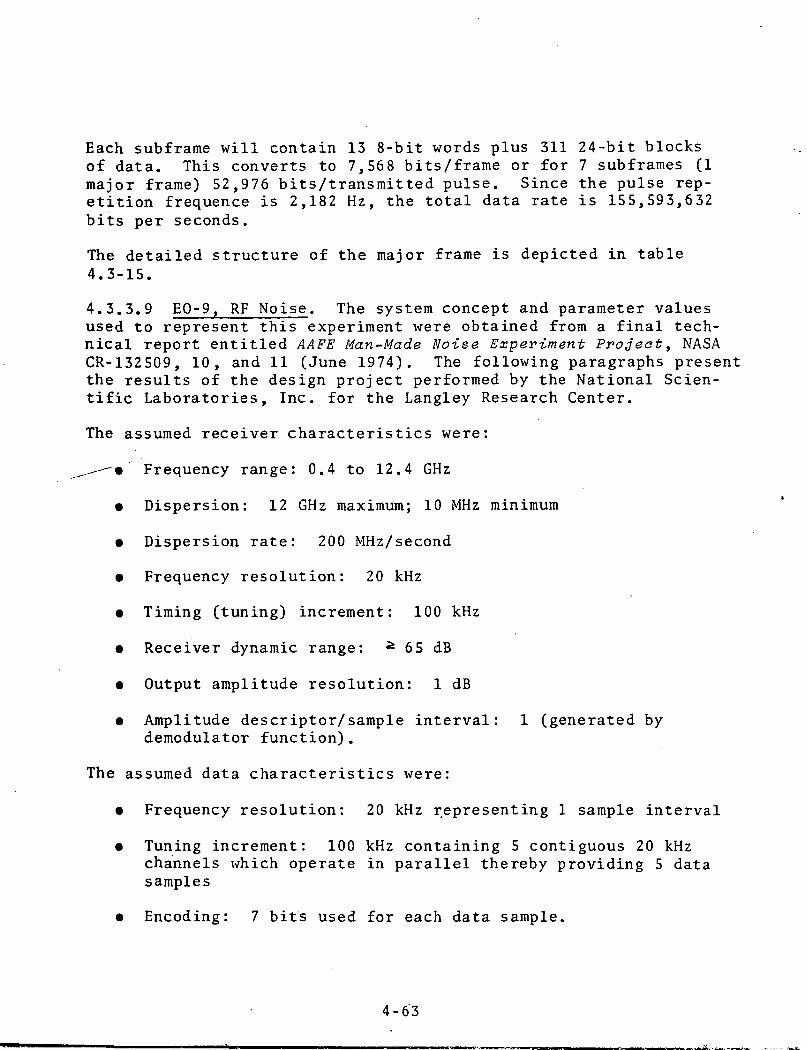
Each subframe will contain 13 8-bit words plus 311 24-bit blocksof data. This converts to 7,568 bits/frame or for 7 subframes (1major frame) 52,976 bits/transmitted pulse. Since the pulse rep-etition frequence is 2,182 Hz, the total data rate is 155,593,632bits per seconds.
The detailed structure of the major frame is depicted in table4.3-15.
4.3.3.9 EO-9, RF Noise. The system concept and parameter valuesused to represent this experiment were obtained from a final tech-nical report entitled AAFE Man-Made No-ise Experiment Project, NASACR-132509, 10, and 11 (June 1974). The following paragraphs presentthe results of the design project performed by the National Scien-tific Laboratories, Inc. for the Langley Research Center.
The assumed receiver characteristics were:
, --» " Frequency range: 0.4 to 12.4 GHz
• Dispersion: 12 GHz maximum; 10 MHz minimum
• Dispersion rate: 200 MHz/second
• Frequency resolution: 20 kHz
• Timing (tuning) increment: 100 kHz
• Receiver dynamic range: ^ 65 dB
• Output amplitude resolution: 1 dB
• Amplitude descriptor/sample interval: 1 (generated bydemodulator function).
The assumed data characteristics were:
• Frequency resolution: 20 kHz representing 1 sample interval
• Tuning increment: 100 kHz containing 5 contiguous 20 kHzchannels which operate in parallel thereby providing 5 datasamples
• Encoding: 7 bits used for each data sample.
4-63
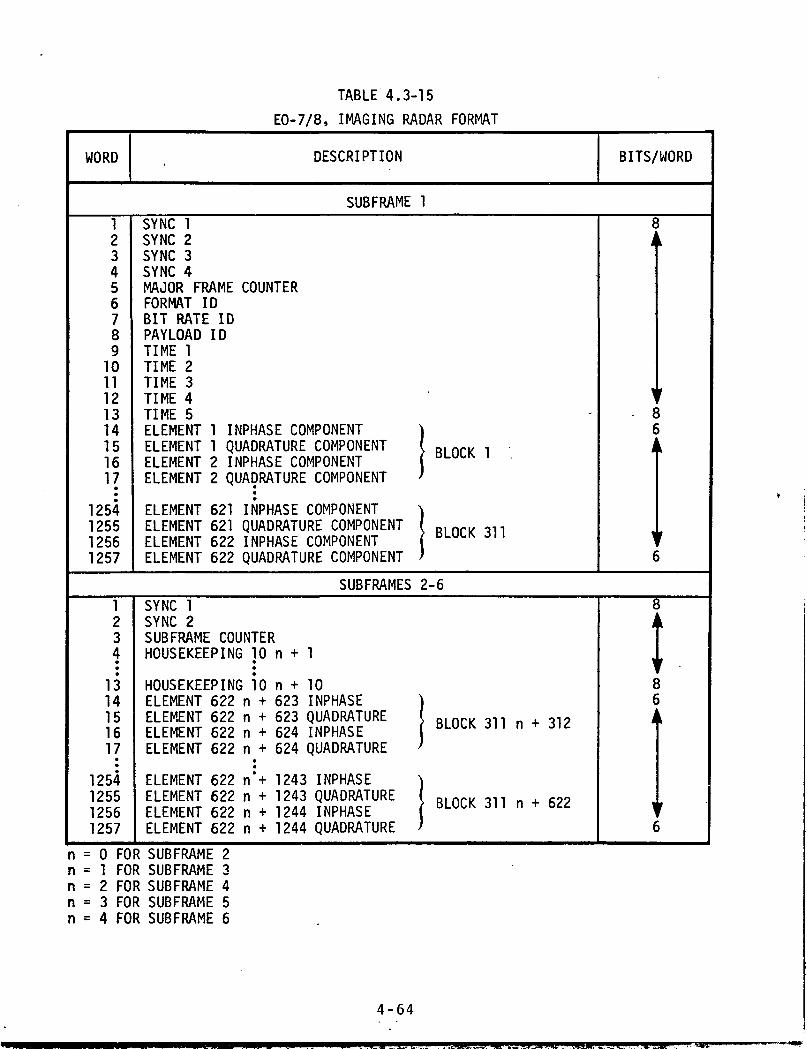
TABLE 4.3-15
EO-7/8, IMAGING RADAR FORMAT
WORD DESCRIPTION BITS/WORD
SUBFRAME 11234567891011121314151617•
1254125512561257
SYNC 1SYNC 2SYNC 3SYNC 4MAJOR FRAME COUNTERFORMAT IDBIT RATE IDPAY LOAD IDTIME 1TIME 2TIME 3TIME 4TIME 5ELEMENT 1 INPHASE COMPONENT )ELEMENT 1 QUADRATURE COMPONENT ( R| nr|, ,ELEMENT 2 INPHASE COMPONENT ( DLUUN 'ELEMENT 2 QUADRATURE COMPONENT >
ELEMENT 621 INPHASE COMPONENT )ELEMENT 621 QUADRATURE COMPONENT ( R| nr|, ?11ELEMENT 622 INPHASE COMPONENT ( DLUUiS °"ELEMENT 622 QUADRATURE COMPONENT )
8j
1
i
F
86i
i 1
6
SUBFRAMES 2-61234•••
1314151617••
1254125512561257
SYNC 1SYNC 2SUBFRAME COUNTERHOUSEKEEPING 10 n + 1
•••
HOUSEKEEPING 10 n + 10ELEMENT 622 n + 623 INPHASE )ELEMENT 622 n + 623 QUADRATURE ( m nn, ,,, n , „-ELEMENT 622 n + 624 INPHASE BLOCK 311 n + 312
ELEMENT 622 n + 624 QUADRATURE '•
ELEMENT 622 n'+ 1243 INPHASE )ELEMENT 622 n + 1243 QUADRATURE ( Rl nry ,„ _ . c<>7ELEMENT 622 n + 1244 INPHASE BLOCK 311 n + 622
ELEMENT 622 n + 1244 QUADRATURE )
8
I86t
i
t
r
6
n = 0 FOR SUBFRAME 2n = 1 FOR SUBFRAME 3n = 2 FOR SUBFRAME 4n = 3 FOR SUBFRAME 5n = 4 FOR SUBFRAME 6
4-64

TABLE 4.3-15 (CONT'D)
WORD DESCRIPTION BITS/WORD
SUBFRAME 71234
1314151617
1242124312441245124612471 t™ /
12481249
1254125512561257
SYNC 1SYNC 2SUBFRAME COUNTERHOUSEKEEPING 51
HOUSEKEEPING 60ELEMENT 3733 INPHASE \ELEMENT 3733 QUADRATURE ( mnri. 1QC7ELEMENT 3734 INPHASE ( BLULK Iab/
ELEMENT. 3734 QUADRATURE )
ELEMENT '4347 INPHASE \ELEMENT 4347 QUADRATURE n. nri, 017.FILL ( BLOCK 2174
FILL )FILL ^PTI 1 IPJLL > BLOCK 2175FILL 1
FILL \
PJLL I BLOCK 2177
FILL *
8
186
|1
T6
4-65
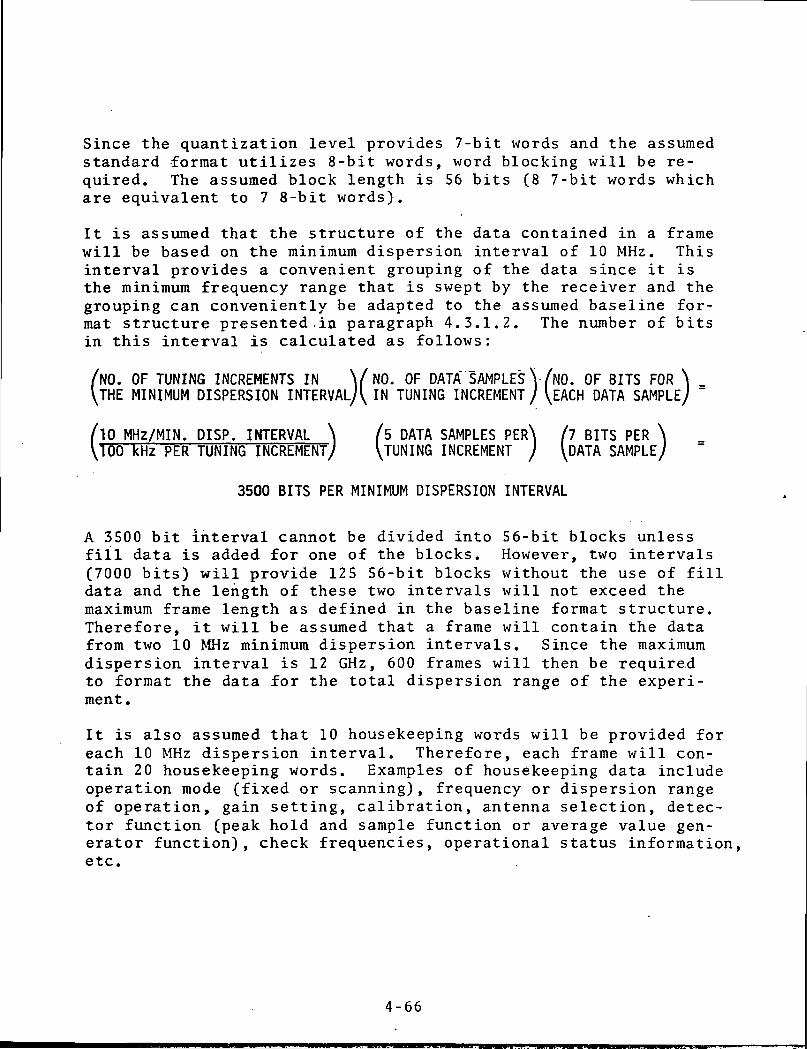
Since the quantization level provides 7-bit words and the assumedstandard format utilizes 8-bit words, word blocking will be re-quired. The assumed block length is 56 bits (8 7-bit words whichare equivalent to 7 8-bit words).
It is assumed that the structure of the data contained in a framewill be based on the minimum dispersion interval of 10 MHz. Thisinterval provides a convenient grouping of the data since it isthe minimum frequency range that is swept by the receiver and thegrouping can conveniently be adapted to the assumed baseline for-mat structure presented.in paragraph 4.3.1.2. The number of bitsin this interval is calculated as follows:
/NO. OF TUNING INCREMENTS IN \f NO. OF DATA SAMPLES V /NO. OF BITS FOR \ _\JHE MINIMUM DISPERSION INTERVAL/^ IN TUNING INCREMENT/ EACH DATA SAMPLE/
/TO MHz/MIN. DISP. INTERVAL \ /5 DATA SAMPLES PER\ /7 BITS PER \\100 kHz PER TUNING INCREMENT^ \TUNING INCREMENT ) \DATA SAMPLE/
3500 BITS PER MINIMUM DISPERSION INTERVAL
A 3500 bit interval cannot be divided into 56-bit blocks unlessfill data is added for one of the blocks. However, two intervals(7000 bits) will provide 125 56-bit blocks without the use of filldata and the length of these two intervals will not exceed themaximum frame length as defined in the baseline format structure.Therefore, it will be assumed that a frame will contain the datafrom two 10 MHz minimum dispersion intervals. Since the maximumdispersion interval is 12 GHz, 600 frames will then be requiredto format the data for the total dispersion range of the experi-ment.
It is also assumed that 10 housekeeping words will be provided foreach 10 MHz dispersion interval. Therefore, each frame will con-tain 20 housekeeping words. Examples of housekeeping data includeoperation mode (fixed or scanning), frequency or dispersion rangeof operation, gain setting, calibration, antenna selection, detec-tor function (peak hold and sample function or average value gen-erator function), check frequencies, operational status information,etc.
4-66
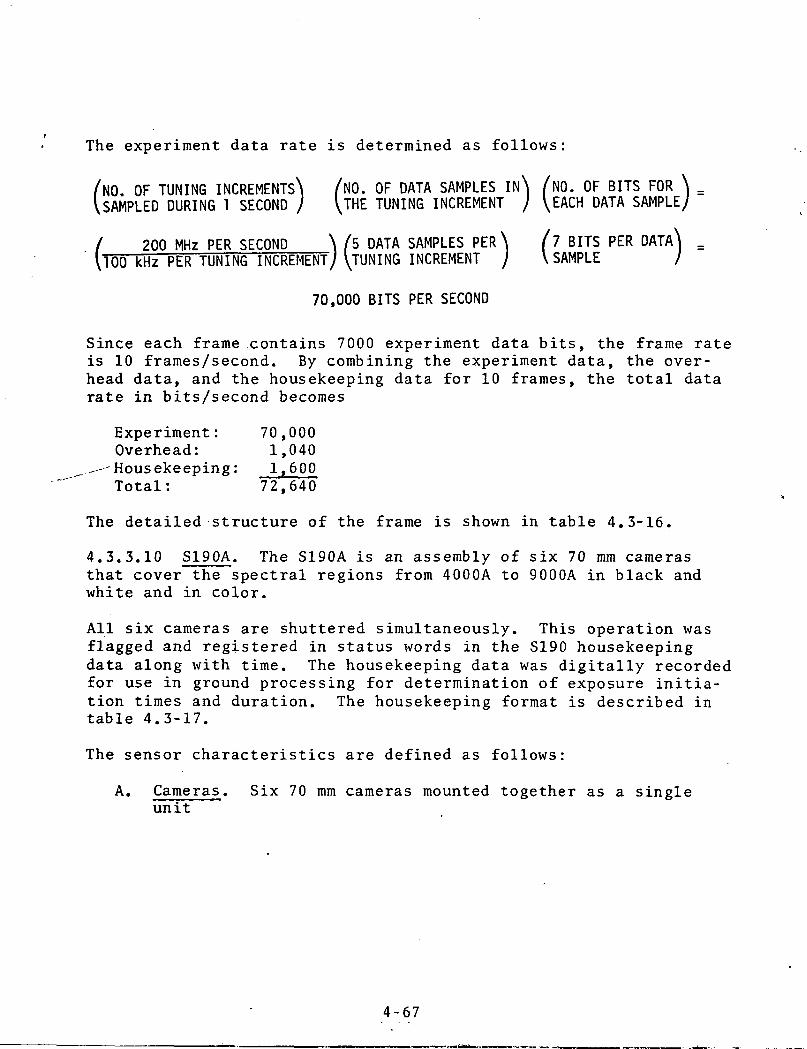
The experiment data rate is determined as follows:
/NO. OF TUNING INCREMENTS^ /NO. OF DATA SAMPLES IN\ /NO. OF BITS FOR \ =VSAMPLED DURING i SECOND / \THE TUNING INCREMENT ) VEACH DATA SAMPLE;
/ 200 MHz PER SECOND \ /5 DATA SAMPLES PER\ /7 BITS PER DATA\ =
\100 kHz PER TUNING INCREMENT/ \JUNING INCREMENT ) \ SAMPLE /
70,000 BITS PER SECOND
Since each frame .contains 7000 experiment data bits, the frame rateis 10 frames/second. By combining the experiment data, the over-head data, and the housekeeping data for 10 frames, the total datarate in bits/second becomes
Experiment: 70,000Overhead: 1,040
^--Housekeeping: 1,600Total: 72,640
The detailed structure of the frame is shown in table 4.3-16.
4.3.3.10 SI9OA. The S190A is an assembly of six 70 mm camerasthat cover the spectral regions from 4000A to 9000A in black andwhite and in color.
All six cameras are shuttered simultaneously. This operation wasflagged and registered in status words in the S190 housekeepingdata along with time. The housekeeping data was digitally recordedfor use in ground processing for determination of exposure initia-tion times and duration. The housekeeping format is described intable 4.3-17.
The sensor characteristics are defined as follows:
A. Cameras. Six 70 mm cameras mounted together as a singleunit
4-67

TABLE 4.3-16EO-9, RF NOISE FORMAT
DATA RATE 72,640 BITS/SECONDFRAME RATE 10 FRAMES/SECONDFRAME SIZE 908 WORDS/FRAME (8-BIT WORDS)
7,264 BITS/FRAME
WORD
1234567891011121314
.
21
1006
•
10131014
•
1033
DESCRIPTION
SYNC 1SYNC 2SYNC 3SYNC 4FRAME COUNTERFORMAT IDBIT RATE IDPAYLOAD IDTIME 1TIME 2TIME 3TIME 4TIME 5FREQUENCY RESOLUTION ELEMENT 1
.
FREQUENCY RESOLUTION ELEMENT 8
FREQUENCY RESOLUTION ELEMENT 993 ^
•
FREQUENCY RESOLUTION ELEMENT 1000 ,HOUSEKEEPING 1
*
HOUSEKEEPING 20
BLOCK 1
•
BLOCK 125
BITS/WORD
8t
}
i
(
87i
\
i
i
78
t8
4-68
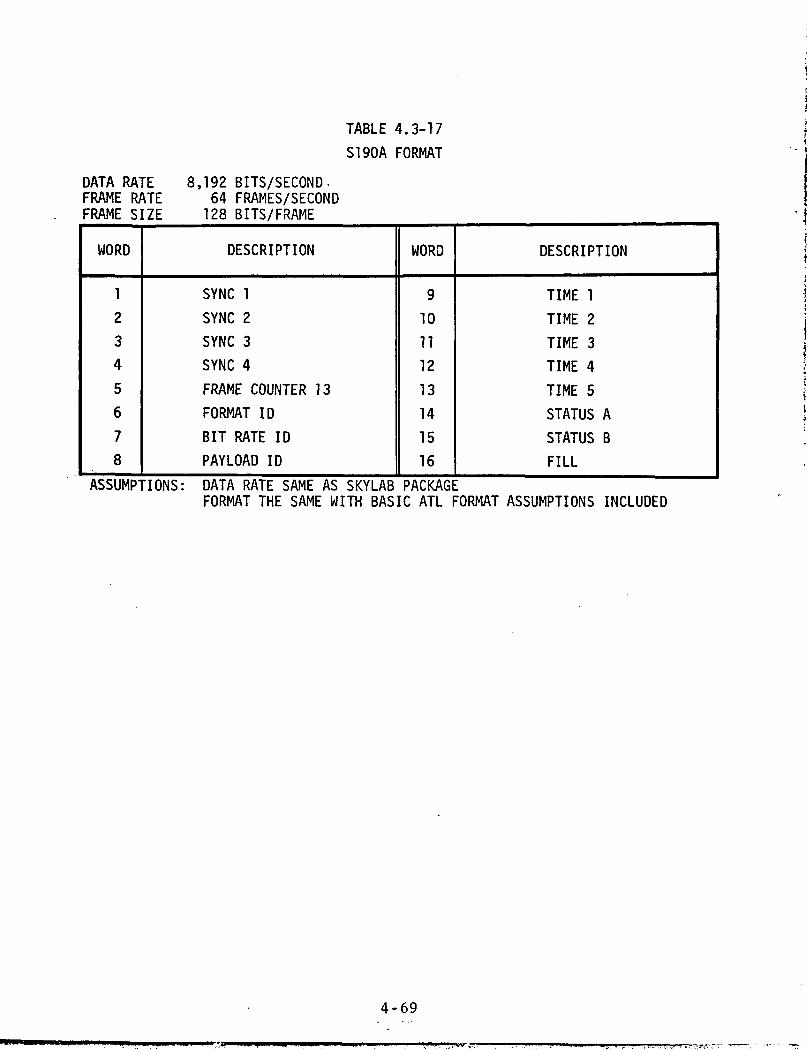
DATA RATEFRAME RATEFRAME SIZE
TABLE 4.3-17
S190A FORMAT
8,192 BITS/SECOND-64 FRAMES/SECOND128 BITS/FRAME
ASSUMPTIONS: DATA RATE SAME AS SKYLAB PACKAGEFORMAT THE SAME WITH BASIC ATL FORMAT ASSUMPTIONS INCLUDED
WORD
1
234
5
6
78
DESCRIPTION
SYNC 1
SYNC 2SYNC 3
SYNC 4
FRAME COUNTER 13FORMAT ID
BIT RATE IDPAYLOAD ID
WORD
9
101112
13141516
DESCRIPTION
TIME 1
TIME 2
TIME 3TIME 4
TIME 5
STATUS ASTATUS BFILL
4-69
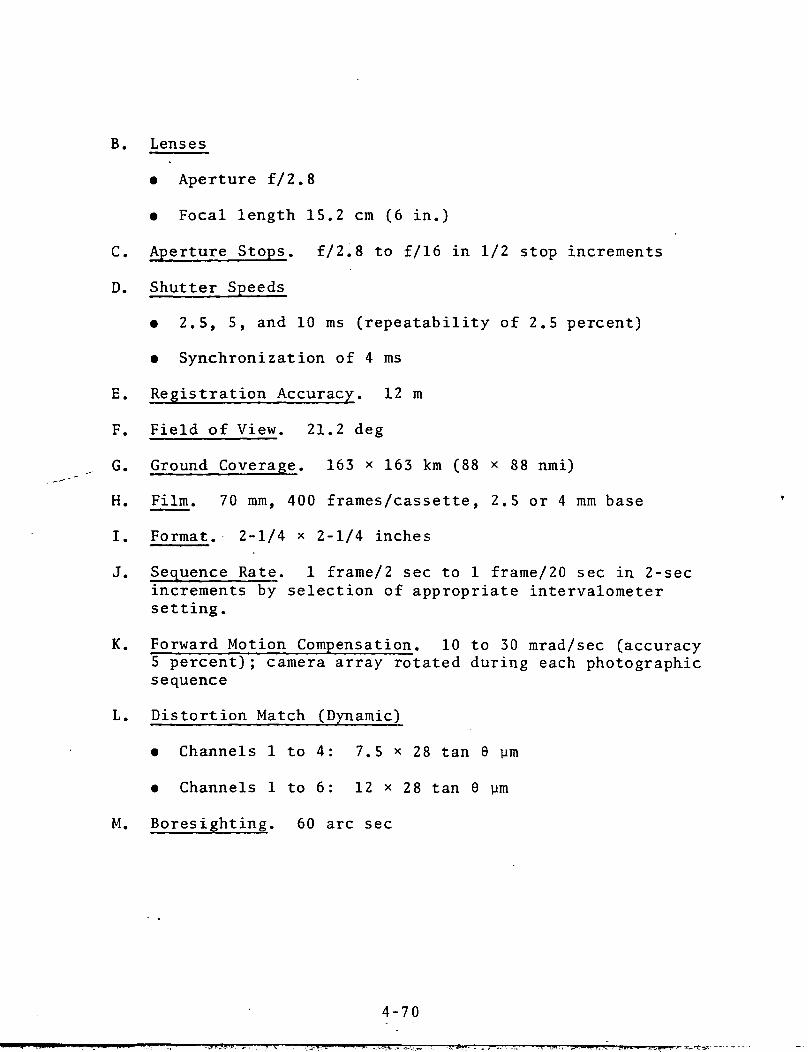
B. Lenses
• Aperture f/2.8
• Focal length 15.2 cm (6 in.)
C. Aperture Stops. f/2.8 to f/16 in 1/2 stop increments
D. Shutter Speeds
• 2.5, 5, and 10 ms (repeatability of 2.5 percent)
• Synchronization of 4 ms
E. Registration Accuracy. 12 m
F. Field of View. 21.2 deg
G. Ground Coverage. 163 x 163 km (88 x 88 nmi)
H. Film. 70 mm, 400 frames/cassette, 2.5 or 4 mm base
I. Format. 2-1/4 x 2-1/4 inches
J. Sequence Rate. 1 frame/2 sec to 1 frame/20 sec in 2-secincrements by selection of appropriate intervalometersetting.
K. Forward Motion Compensation. 10 to 30 mrad/sec (accuracy5 percent); camera array rotated during each photographicsequence
L. Distortion Match (Dynamic)
• Channels 1 to 4: 7.5 x 28 tan 8 ym
• Channels 1 to 6: 12 x 28 tan 9 ym
M. Boresighting. 60 arc sec
4-70
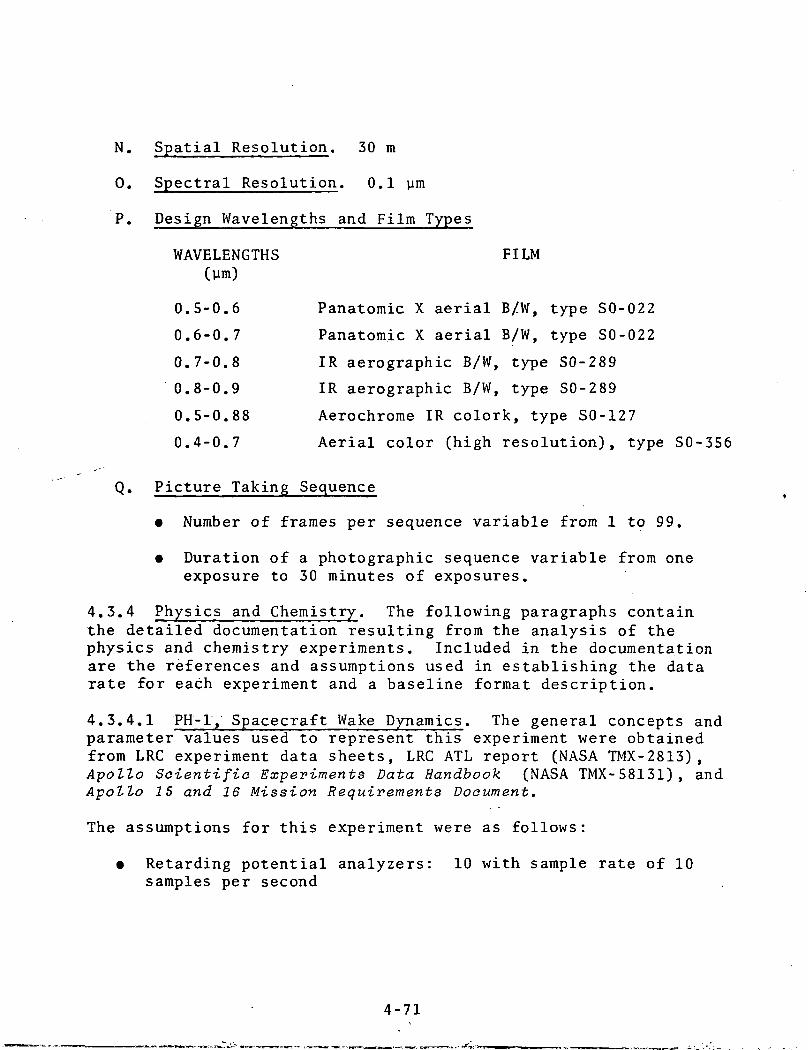
N. Spatial Resolution. 30 m
0. Spectral Resolution. 0.1 ym
P. Design Wavelengths and Film Types
WAVELENGTHS FILM
0.5-0.6 Panatomic X aerial B/W, type SO-022
0.6-0.7 Panatomic X aerial B/W, type SO-022
0.7-0.8 IR aerographic B/W, type SO-289
0.8-0.9 IR aerographic B/W, type SO-289
0.5-0.88 Aerochrome IR colork, type SO-127
0.4-0.7 Aerial color (high resolution), type SO-356
Q. Picture Taking Sequence
• Number of frames per sequence variable from 1 to 99.
• Duration of a photographic sequence variable from oneexposure to 30 minutes of exposures.
4.3.4 Physics and Chemistry. The following paragraphs containthe detailed documentation resulting from the analysis of thephysics and chemistry experiments. Included in the documentationare the references and assumptions used in establishing the datarate for each experiment and a baseline format description.
4.3.4.1 PH-1, Spacecraft Wake Dynamics. The general concepts andparameter values used to represent this experiment were obtainedfrom LRC experiment data sheets, LRC ATL report (NASA TMX-2813),Apollo Scientific Experiments Data Handbook (NASA TMX-58131), andApollo 15 and 16 Mission Requirements Document.
The assumptions for this experiment were as follows :
• Retarding potential analyzers: 10 with sample rate of 10samples per second
4-71
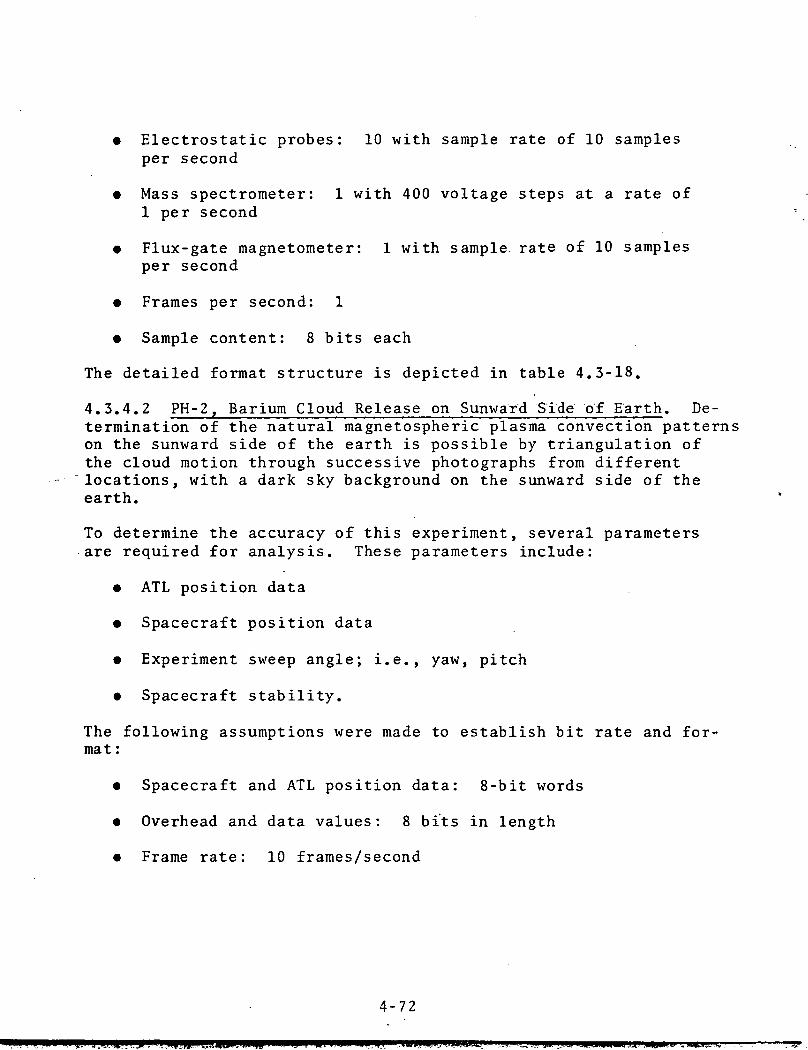
• Electrostatic probes: 10 with sample rate of 10 samplesper second
• Mass spectrometer: 1 with 400 voltage steps at a rate of1 per second
• Flux-gate magnetometer: 1 with sample, rate of 10 samplesper second
• Frames per second: 1
• Sample content: 8 bits each
The detailed format structure is depicted in table 4.3-18.
4.3.4.2 PH-2, Barium Cloud Release on Sunward Side of Earth. De-termination of the natural magnetospheric plasma convection patternson the sunward side of the earth is possible by triangulation ofthe cloud motion through successive photographs from differentlocations, with a dark sky background on the sunward side of theearth.
To determine the accuracy of this experiment, several parametersare required for analysis. These parameters include:
• ATL position data
• Spacecraft position data
• Experiment sweep angle; i.e., yaw, pitch
• Spacecraft stability.
The following assumptions were made to establish bit rate and for-mat:
• Spacecraft and ATL position data: 8-bit words
• Overhead and data values: 8 bits in length
• Frame rate: 10 frames/second
4-72
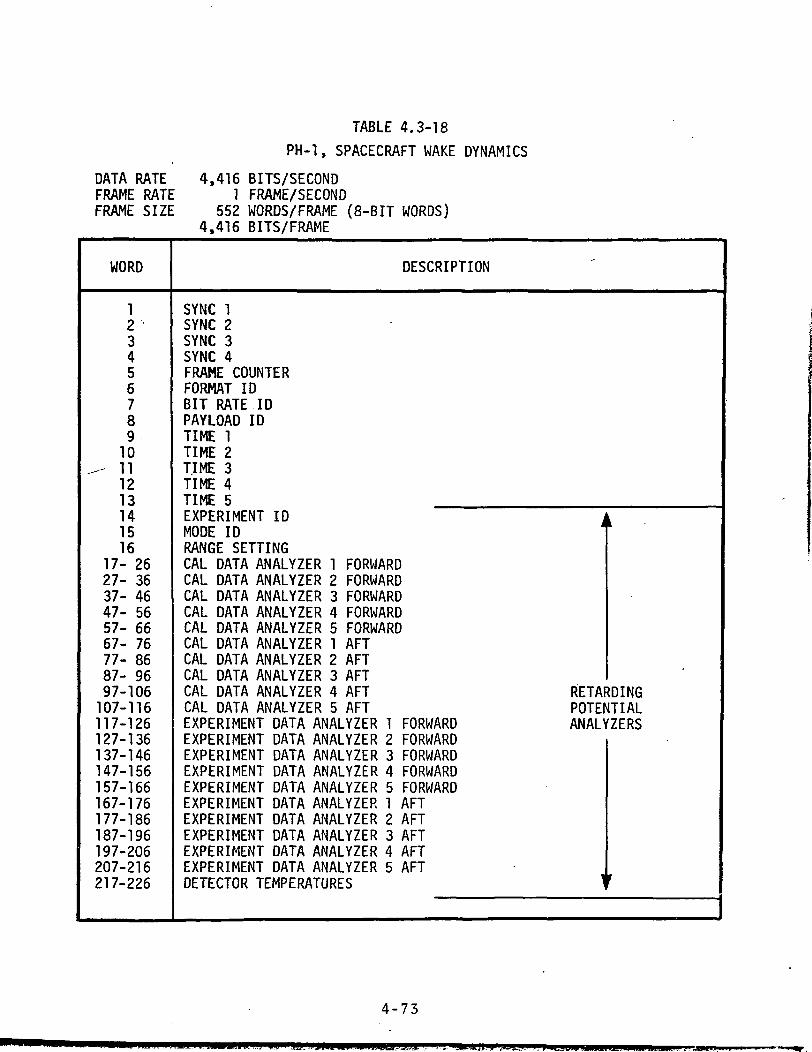
TABLE 4.3-18PH-1, SPACECRAFT WAKE DYNAMICS
DATA RATE 4,416 BITS/SECONDFRAME RATE 1 FRAME/SECONDFRAME SIZE 552 WORDS/FRAME (8-BIT WORDS)
4,416 BITS/FRAME
WORD
12345678910
^ 111213141516
17- 2627- 3637- 4647- 5657- 6667- 7677- 8687- 9697-106107-116117-126127-136137-146147-156157-166167-176177-186187-196197-206207-216217-226
DESCRIPTION
SYNC 1SYNC 2SYNC 3SYNC 4FRAME COUNTERFORMAT IDBIT RATE IDPAYLOAD IDTIME 1TIME 2TIME 3TIME 4TIME 5EXPERIMENT ID AMODE ID TRANGE SETTINGCAL DATA ANALYZER 1 FORWARDCAL DATA ANALYZER 2 FORWARDCAL DATA ANALYZER 3 FORWARDCAL DATA ANALYZER 4 FORWARDCAL DATA ANALYZER 5 FORWARDCAL DATA ANALYZER 1 AFTCAL DATA ANALYZER 2 AFTCAL DATA ANALYZER 3 AFTCAL DATA ANALYZER 4 AFT RETARDINGCAL DATA ANALYZER 5 AFT POTENTIALEXPERIMENT DATA ANALYZER 1 FORWARD ANALYZERSEXPERIMENT DATA ANALYZER 2 FORWARDEXPERIMENT DATA ANALYZER 3 FORWARDEXPERIMENT DATA ANALYZER 4 FORWARDEXPERIMENT DATA ANALYZER 5 FORWARDEXPERIMENT DATA ANALYZER 1 AFTEXPERIMENT DATA ANALYZER 2 AFTEXPERIMENT DATA ANALYZER 3 AFTEXPERIMENT DATA ANALYZER 4 AFTEXPERIMENT DATA ANALYZER 5 AFT 1DETECTOR TEMPERATURES T
4-73
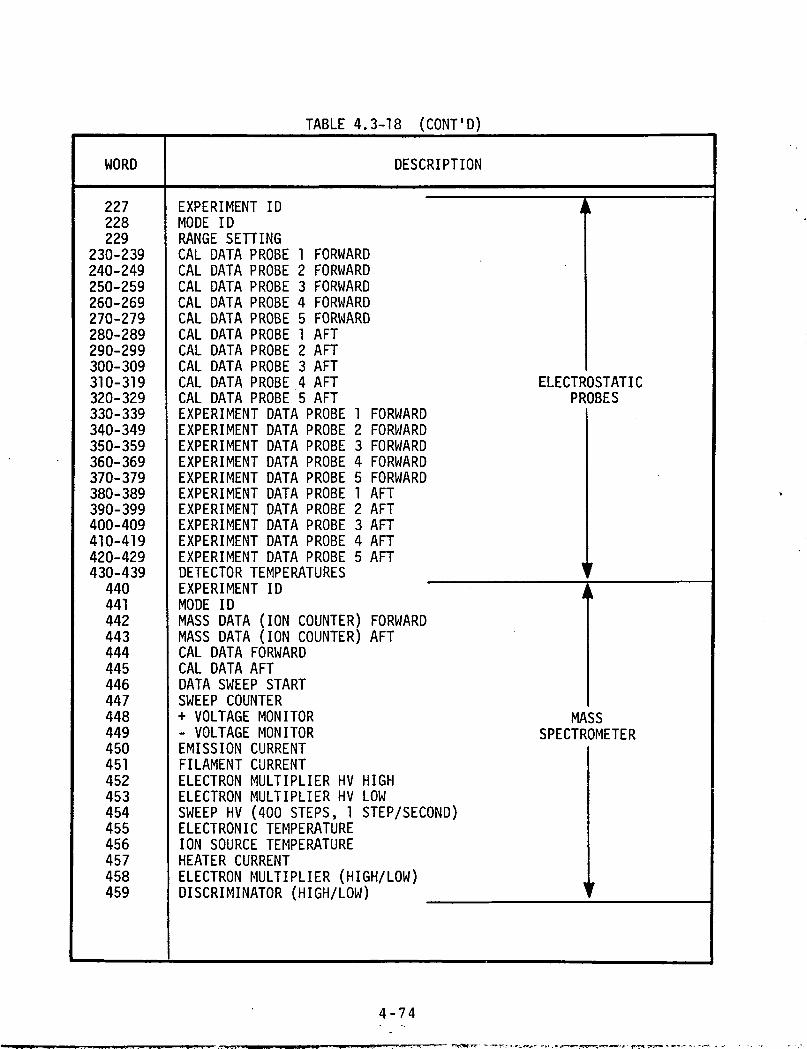
TABLE 4.3-18 (CONT'D)
WORD
227228229
230-239240-249250-259260-269270-279280-289290-299300-309310-319320-329330-339340-349350-359360-369370-379380-389390-399400-409410-419420-429430-439440441442443444445446447448449450451452453454455456457458459
DESCRIPTION
EXPERIMENT ID AMODE ID TRANGE SETTINGCAL DATA PROBE 1 FORWARDCAL DATA PROBE 2 FORWARDCAL DATA PROBE 3 FORWARDCAL DATA PROBE 4 FORWARDCAL DATA PROBE 5 FORWARDCAL DATA PROBE 1 AFTCAL DATA PROBE 2 AFTCAL DATA PROBE 3 AFT 1CAL DATA PROBE 4 AFT ELECTROSTATICCAL DATA PROBE 5 AFT PROBESEXPERIMENT DATA PROBE 1 FORWARDEXPERIMENT DATA PROBE 2 FORWARDEXPERIMENT DATA PROBE 3 FORWARDEXPERIMENT DATA PROBE 4 FORWARDEXPERIMENT DATA PROBE 5 FORWARDEXPERIMENT DATA PROBE 1 AFTEXPERIMENT DATA PROBE 2 AFTEXPERIMENT DATA PROBE 3 AFTEXPERIMENT DATA PROBE 4 AFTEXPERIMENT DATA PROBE 5 AFTDETECTOR TEMPERATURES 'EXPERIMENT IDMODE IDMASS DATA (ION COUNTER) FORWARDMASS DATA (ION COUNTER) AFTCAL DATA FORWARDCAL DATA AFTDATA SWEEP STARTSWEEP COUNTER
F
ii
+ VOLTAGE MONITOR MASS- VOLTAGE MONITOR SPECTROMETEREMISSION CURRENTFILAMENT CURRENTELECTRON MULTIPLIER HV HIGHELECTRON MULTIPLIER HV LOWSWEEP HV (400 STEPS, 1 STEP/SECOND)ELECTRONIC TEMPERATUREION SOURCE TEMPERATUREHEATER CURRENTELECTRON MULTIPLIER (HIGH/LOW)DISCRIMINATOR (HIGH/LOW) "
'
4-74
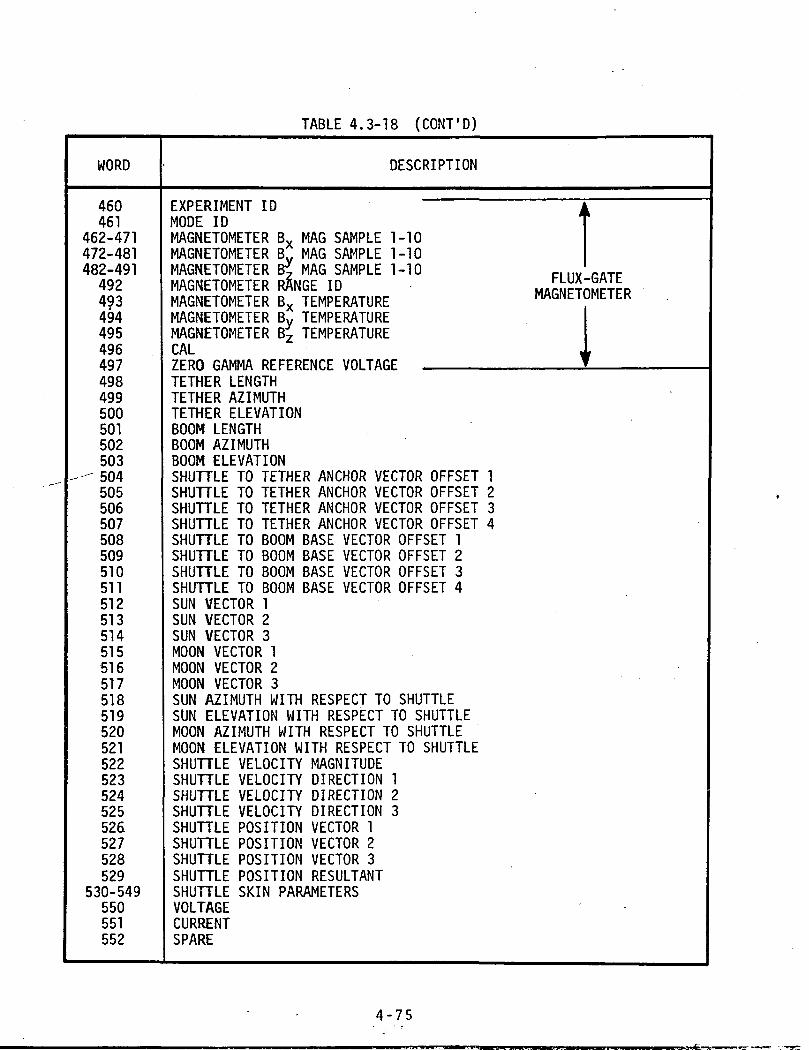
TABLE 4.3-18 (CONT'D)
WORD
460461
462-471472-481482-491492493494495496497498499500501502503
-- 504505506507508509510511512513514515516517518519520521522523524525526527528529
530-549550551552
DESCRIPTION
EXPERIMENT ID ,MODE IDMAGNETOMETER Bx MAG SAMPLE 1-10MAGNETOMETER B* MAG SAMPLE 1-10
L1
MAGNETOMETER K MAG SAMPLE 1-10 C| |IY r.TCMAGNETOMETER RANGE ID MartcTpSr-irnMAGNETOMETER Bx TEMPERATURE
mblNtl
MAGNETOMETER Bv TEMPERATUREMAGNETOMETER B^ TEMPERATURECAL -7FDO CflMMfl DFFFDFMPF UOI TAEF 1
TETHER LENGTHTETHER AZIMUTHTETHER ELEVATIONBOOM LENGTHBOOM AZIMUTHBOOM ELEVATIONSHUTTLE TO TETHER ANCHOR VECTOR OFFSET 1SHUTTLE TO TETHER ANCHOR VECTOR OFFSET 2SHUTTLE TO TETHER ANCHOR VECTOR OFFSET 3SHUTTLE TO TETHER ANCHOR VECTOR OFFSET 4SHUTTLE TO BOOM BASE VECTOR OFFSET 1SHUTTLE TO BOOM BASE VECTOR OFFSET 2SHUTTLE TO BOOM BASE VECTOR OFFSET 3SHUTTLE TO BOOM BASE VECTOR OFFSET 4SUN VECTOR 1SUN VECTOR 2SUN VECTOR 3MOON VECTOR 1MOON VECTOR 2MOON VECTOR 3SUN AZIMUTH WITH RESPECT TO SHUTTLESUN ELEVATION WITH RESPECT TO SHUTTLEMOON AZIMUTH WITH RESPECT TO SHUTTLEMOON ELEVATION WITH RESPECT TO SHUTTLESHUTTLE VELOCITY MAGNITUDESHUTTLE VELOCITY DIRECTION 1SHUTTLE VELOCITY DIRECTION 2SHUTTLE VELOCITY DIRECTION 3SHUTTLE POSITION VECTOR 1SHUTTLE POSITION VECTOR 2SHUTTLE POSITION VECTOR 3SHUTTLE POSITION RESULTANTSHUTTLE SKIN PARAMETERSVOLTAGECURRENTSPARE
\r
4 - 7 5
• Camera gimbles: instrumented to provide pitch, yaw angles
• Slots/frame: provided for housekeeping information such asshutter speed, sequence rate, and temperature measurements.
Table 4,3-19 describes the data frame construction.
4.3.4.3 PH-3, Optical Properties of Aerosols. The followingassumptions were used to derive data rate and format for PH-3.
A. The camera will operate at a maximum of 24 frames persecond.
B. There will be four 20-minute intervals per day for dataacquisition.
C. The following data will be recorded 24 times per secondcorresponding to the camera frame rate:
• Temperature
• lonization
• Pressure
• Electric fields
• Dewpoint
• Composition
• Camera frame number.
The format structure is depicted in table 4.3-20.
4.3.4.4 PH-6, Ultraviolet Meteor Spectroscopy From Near-EarthOrbit. This experiment is an assembly of three ultraviolet (UV)spectrographs with associated film recorders, a photo multipliertube (PMT) detector, control unit, onboard data recorder, andassociated power supplies.
4-76
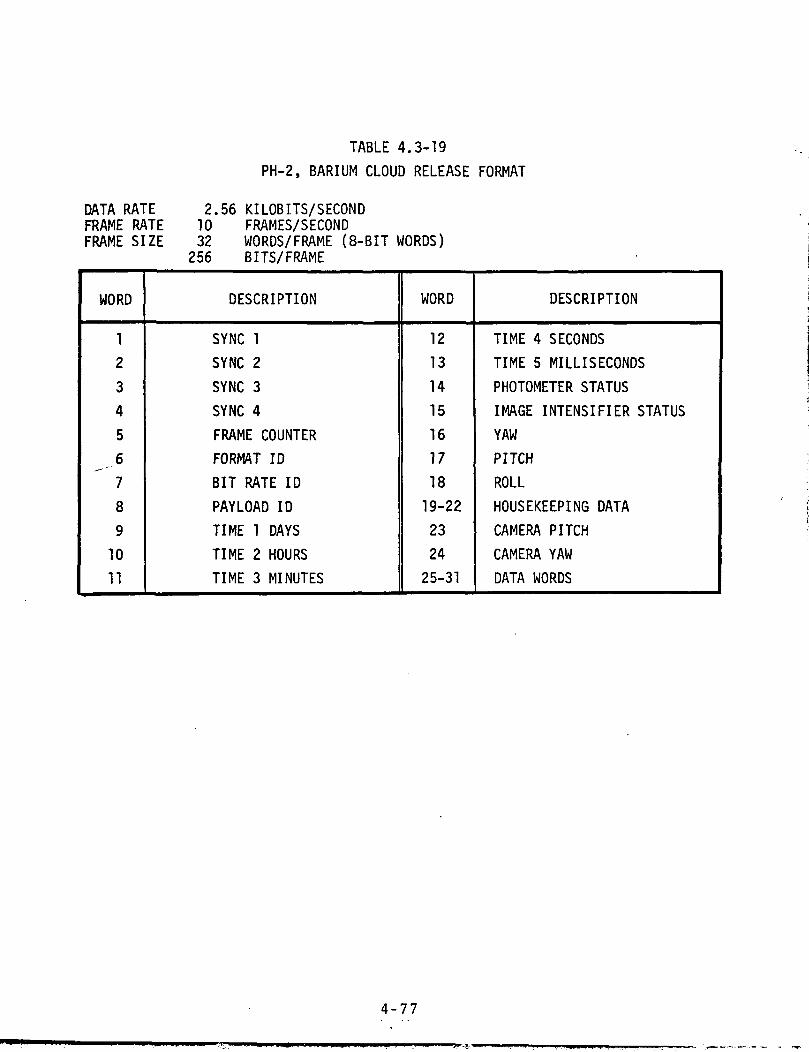
TABLE 4.3-19
PH-2, BARIUM CLOUD RELEASE FORMAT
DATA RATE 2.56 KILOBITS/SECONDFRAME RATE 10 FRAMES/SECONDFRAME SIZE 32 WORDS/FRAME (8-BIT WORDS)
256 BITS/FRAME
WORD
12
3
4
5
.67
8
9
1011
DESCRIPTION
SYNC 1
SYNC 2
SYNC 3
SYNC 4
FRAME COUNTERFORMAT ID
BIT RATE ID
PAYLOAD IDTIME 1 DAYS
TIME 2 HOURS
TIME 3 MINUTES
WORD
12
13
14
15
1617
18
19-22
23
2425-31
DESCRIPTION
TIME 4 SECONDS
TIME 5 MILLISECONDS
PHOTOMETER STATUS
IMAGE INTENSIFIER STATUSYAWPITCH
ROLL
HOUSEKEEPING DATA
CAMERA PITCH
CAMERA YAWDATA WORDS
4-77

TABLE 4.3-20PH-3, OPTICAL PROPERTIES OF AEROSOLS
DATA RATE 6,912 BITS/SECONDFRAME RATE 24 FRAMES/SECONDFRAME SIZE 36 WORDS/FRAME (8-BIT WORDS)
288 BITS/ FRAME
WORD
12345678910
-— 11121314-1617-2627282930313233
DESCRIPTION
SYNC 1SYNC 2SYNC 3SYNC 4FRAME COUNTERFORMAT IDBIT RATE IDPAYLOAD IDTIMETIMETIMETIMETIMEPHOTO FRAME COUNTERGAS COMPOSITIONS 1-10SPARETEMPERATURE \ _ R1 nrk, ,IONIZATION f BLOCK 'PRESSURE \ R,nrK 9ELECTRIC FIELD f bLULKw i
DEWPOINT \ RLOCK -SPARE / BLOCK 3
BITS/WORD
8
t
1812
• JT12
4-78
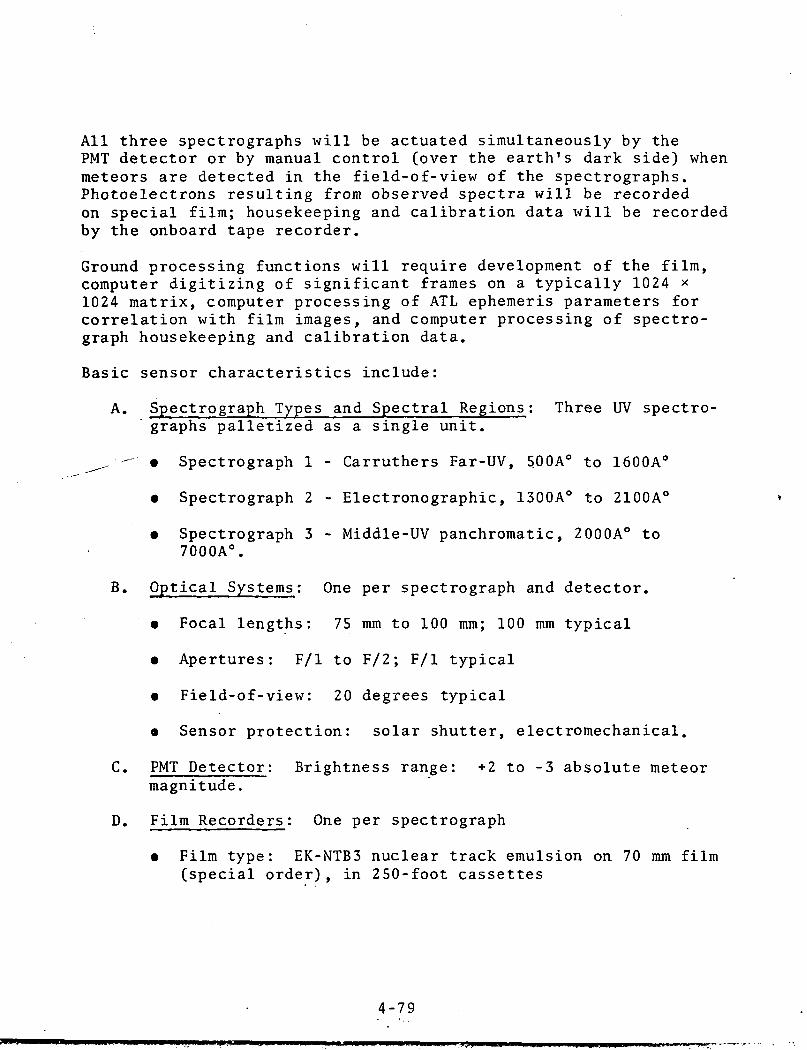
All three spectrographs will be actuated simultaneously by thePMT detector or by manual control (over the earth's dark side) whenmeteors are detected in the field-of-view of the spectrographs.Photoelectrons resulting from observed spectra will be recordedon special film; housekeeping and calibration data will be recordedby the onboard tape recorder.
Ground processing functions will require development of the film,computer digitizing of significant frames on a typically 1024 *1024 matrix, computer processing of ATL ephemeris parameters forcorrelation with film images, and computer processing of spectro-graph housekeeping and calibration data.
Basic sensor characteristics include:
A. Spectrograph Types and Spectral Regions; Three UV spectro-graphs palletized as a single unit.
^. —~ • Spectrograph 1 - Carruthers Far-UV, 500A" to 1600A0
• Spectrograph 2 - Electronographic, 1300A0 to 2100A0
• Spectrograph 3 - Middle-UV panchromatic, 2000A0 to7000A0.
B. Optical Systems; One per Spectrograph and detector.
• Focal lengths: 75 mm to 100 mm; 100 mm typical
• Apertures: F/l to F/2; F/l typical
• Field-of-view: 20 degrees typical
• Sensor protection: solar shutter, electromechanical.
C. PMT Detector: Brightness range: +2 to -3 absolute meteormagnitude.
D. Film Recorders: One per Spectrograph
• Film type: EK-NTB3 nuclear track emulsion on 70 mm film(special order), in 250-foot cassettes
4-79
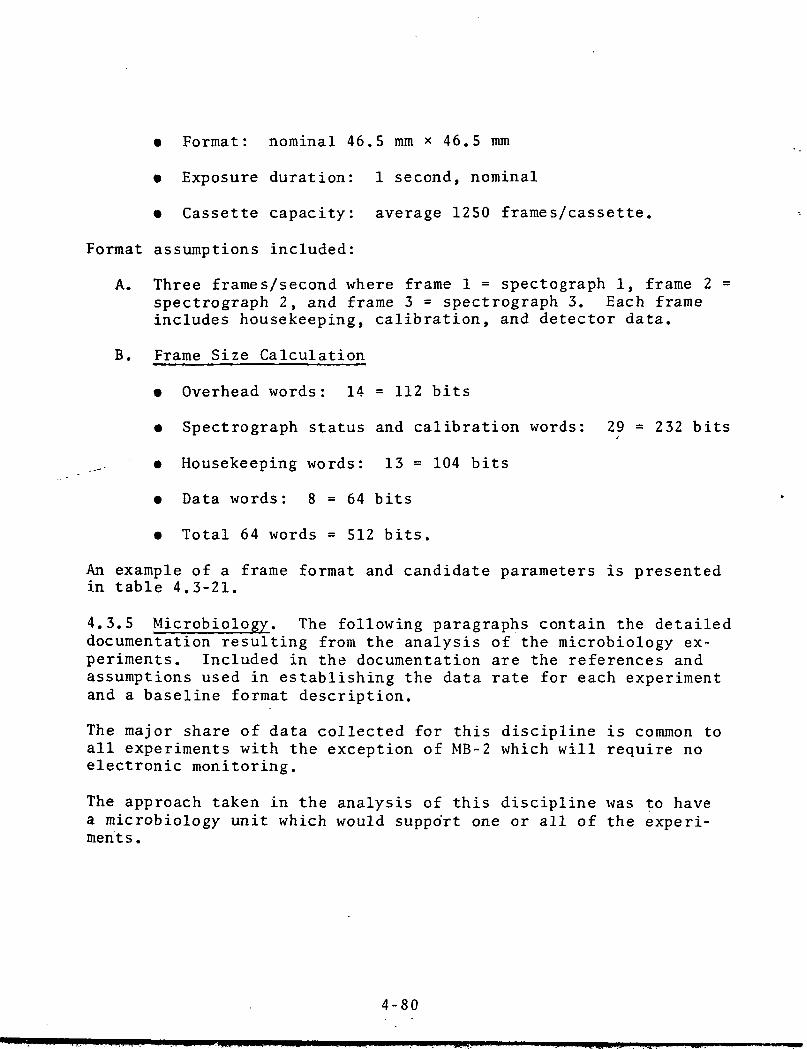
• Format: nominal 46.5 mm * 46.5 mm
• Exposure duration: 1 second, nominal
• Cassette capacity: average 1250 frames/cassette.
Format assumptions included:
A. Three frames/second where frame 1 = spectograph 1, frame 2 =spectrograph 2, and frame 3 = spectrograph 3. Each frameincludes housekeeping, calibration, and detector data.
B. Frame Size Calculation
• Overhead words: 14 = 112 bits
• Spectrograph status and calibration words: 29 = 232 bits
• Housekeeping words: 13 = 104 bits
• Data words: 8 = 64 bits
• Total 64 words = 512 bits.
An example of a frame format and candidate parameters is presentedin table 4.3-21.
4.3.5 Microbiology. The following paragraphs contain the detaileddocumentation resulting from the analysis of the microbiology ex-periments. Included in the documentation are the references andassumptions used in establishing the data rate for each experimentand a baseline format description.
The major share of data collected for this discipline is common toall experiments with the exception of MB-2 which will require noelectronic monitoring.
The approach taken in the analysis of this discipline was to havea microbiology unit which would support one or all of the experi-ment s.
4-80
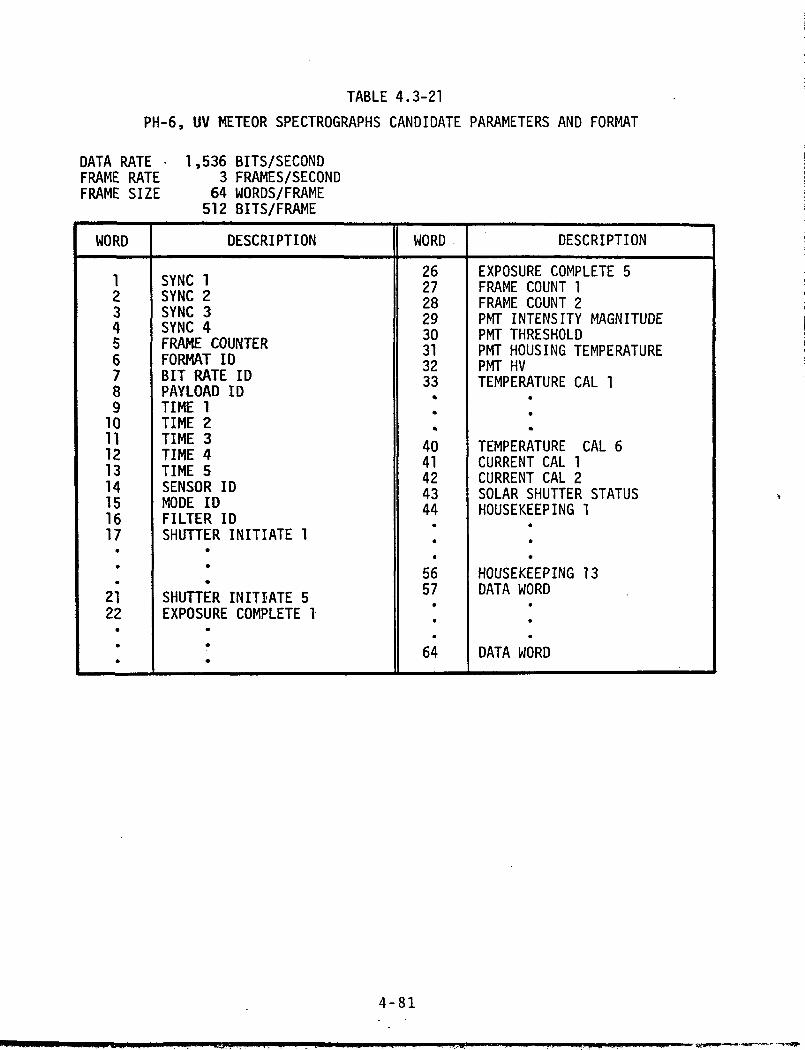
TABLE 4.3-21
PH-6, UV METEOR SPECTROGRAPHS CANDIDATE PARAMETERS AND FORMAT
DATA RATEFRAME RATEFRAME SIZE
1,536 BITS/SECOND3 FRAMES/SECOND64 WORDS/FRAME512 BITS/FRAME
WORD
1234567891011121314151617•
•
21*22•
•
•
DESCRIPTION
SYNC 1SYNC 2SYNC 3SYNC 4FRAME COUNTERFORMAT IDBIT RATE IDPAYLOAD IDTIME 1TIME 2TIME 3TIME 4TIME 5SENSOR IDMODE IDFILTER IDSHUTTER INITIATE 1
•
•
•
SHUTTER INITIATE 5EXPOSURE COMPLETE 1
•
•
•
WORD .
2627282930313233*
•
*
4041424344*
•
•
5657
•
•
64
DESCRIPTION
EXPOSURE COMPLETE 5FRAME COUNT 1FRAME COUNT 2PMT INTENSITY MAGNITUDEPMT THRESHOLDPMT HOUSING TEMPERATUREPMT HVTEMPERATURE CAL 1
•
•
TEMPERATURE CAL 6CURRENT CAL 1CURRENT CAL 2SOLAR SHUTTER STATUSHOUSEKEEPING 1
•
•
•
HOUSEKEEPING 13DATA WORD
•
•
DATA WORD
4-81
Basic assumptions for this unit included the following:
A. All parameters except photo time will be expressed in 8-bitwords; time will be represented in 16 bits.
B. A complement of common equipment will include four incuba-tors, one cold storage area, and a work area. Commonsensors present will be six thermometers, six pressure sen-sors, and six humidity monitors (one for each incubator,one for cold storage, and one for ambient readings in thework area) . Also included among the common equipment sen-sors will be five accelerometers (one for each incubatorplus one used as a vibration monitor) and one radiationalarm.
C. Atmospheric constituents monitored will be p02, pC02,and
The ON/OFF condition of five thermostatic thermocouples (onefor each incubator heater and one for cooler) will be com-bined into one 8-bit status word.
E. Alarms and status will be "latchedj" i.e., if a change inmonitored condition occurs, the sensor will continue toshow the change until it is sampled even if the conditionreturns to its original status in the interim.
F. Mission duration will be 7 days. Each featured experimentwill be performed three times: once at the beginning, oncein the middle, and once towards the end of the mission.
G. For' MB-4, the plotting of cell positions will occur at 30-second intervals in a semi-automatic mode.
H. Micro-photos could be recorded on 16 mm film although theyare tabulated separately.
Common measurements to be taken will include:
• Temperature: 3 samples/hour
• Thermostatic status: 60 samples/hour
4-82
SISO-TR622
• Accelerometer: 3 samples/hour
• Pressure: 3 samples/hour
• Relative humidity: 3 samples/hour
• Atmospheric constituents: 1 sample/hour
• Radiation: 60 samples/hour
• Event verification/ID1s: 1 sample/hour.
Other experiment support such as voice, film, and TV will include:
VOICE/DAY 16 mm FILM/ TV/DAY MICRO NO.EXPERIMENT '(MIN) DAY (MIN) (MIN) PHOTOS/DAY DAYS
MB-1 10 36 - - 3
--""MB-2 15 15 - 7
MB-3 - - - 240 3
MB-4 - 3
MB-5 10 - 960*-1-* (-2') 5
(1) Time-lapse, one photo every 15 seconds(2) Two 2-hour sessions per day
4.3.5.1 MB-1, Colony Growth in Zero Gravity. The purpose of thisexperiment is to validate bacterial colony growth patterns previ-ously observed in cultures grown on a clinostat, a device designedto neutralize the effect of gravity in a terrestrial laboratory.
The culture tubes will be transported in cold storage (278° K) andwill be placed in an incubator (310° K ±1° K) for a 24-hour growth-observational period. During the growth period the back-lightedculture tubes will be cine-photographed for 3-minute runs every 2hours. The culture tube racks will be mounted in a manner thatwill avoid accelerations above some designated level (e.g., 10~3 g)
4-83

during the incubation period. After the completion of the 24-hourobservational period, the culture tubes will once again be refrig-erated for return to earth. The film and recorded annotationparameters will be analyzed after the mission.
In addition to the common parameters previously mentioned, cameramode and photo time will be monitored. A detailed format structureis depicted in table 4.3-22.
4.3.5.2 MB-2, Interpersonal Transfer of Micro-Organisms in ZeroGravity. The purpose of this experiment is to explore the effectof zero gravity interpersonal transfer patterns for micro-organisms.
An important factor in the design of environmental control andlife support systems is a knowledge of the manner in which micro-organisms are transferred between crewmen in a closed environment.Much experimental, ground-based work has been conducted and isplanned in this area. Although the absence of gravity is expectedto affect the transfer pattern, this is difficult to simulate onthe ground or assess analytically.
The experiment will rely upon postflight analysis of microbialsamples collected by the crewmen during the mission. Prior toflight, a known trace organism and a crewman carrier will beidentified. During the mission (at intervals of at least onceevery 24 hours) crewmen will collect microbial samples from theirnose, throat, and skin, label them, and place them in an incubatorto be grown for a suitable length of time (24 to 48 hours). Thistask will require about 15 minutes for each collection period.There will be no onboard data processing requirements.
During the mission and after suitable incubation at 310° K, thesamples will be transferred to a 278° K refrigerator for preserva-tion. Postflight analysis will determine the transfer history ofthe trace organism. This experiment is closely related to theSampling of Airborne Particles and Micro-Organisms Experiment, andthe postflight data analysis will include the air-sampler datafrom that experiment. This investigation is an extension of cur-rent ground-based experimentation at LRC.
4-84

TABLE 4.3-22MB-1, COLONY GROWTH IN ZERO GRAVITY
DATA RATE 1,392 BITS/HOUR ( 0.38666 BITS/SECOND)FRAME RATE 1 FRAME/HOURFRAME SIZE 174 WORDS/FRAME (8-BIT WORDS)
1,392 BITS/FRAME
WORD
12345678910
"• 111213
14-1617-1920-2223-2526-2829-3132-3435-3738-4041-4344-4647-5051-110111-170
171172
173-174
DESCRIPTION
SYNC 1SYNC 2SYNC 3SYNC 4FRAME COUNTERFORMAT IDBIT RATE IDPAYLOAD IDTIME 1TIME 2TIME 3TIME 4TIME 5INCUBATOR TEMPERATURE SAMPLESINCUBATOR PRESSURE SAMPLES 1-3
1-3
INCUBATOR RELATIVE HUMIDITY SAMPLES 1-3COLD STORAGE TEMPERATURE SAMPLES 1-3COLD STORAGE PRESSURE SAMPLESCOLD STORAGE RELATIVE HUMIDITYWORD AREA TEMPERATURE SAMPLESWORD AREA PRESSURE SAMPLES 1-3
1-3SAMPLES 1-31-3
WORK AREA RELATIVE HUMIDITY SAMPLES 1-3INCUBATOR ACCELEROMETER SAMPLES 1-3VIBRATION MONITOR ACCELEROMETER SAMPLES 1-3ATMOSPHERIC CONSTITUENTS pO?, pCOo, pNHo, pH20THERMOSTATIC STATUS SAMPLES 1-60RADIATION SAMPLES 1-60EVENT VERIFICATION ID'SCAMERA MODEPHOTO TIME
4-85

4.3.5.3 MB-5, Electrical Field Opacity in Biological Cells. Thepurpose of this experiment is to correlate independent cell volumemeasurements with Coulter counter readings. The Coulter counter(Coulter Electronics Inc., Florida) is an electronic device thatmeasures the dielectric properties of a sample and outputs a cellvolume count. Electronic measurements of this sort yield veryquick readings; however, electric properties of cells may inducesignificant measurement error. Independent cell volume measure-ments (difficult in a one-g environment due to sedimentation,attachment and cell shape changes) can be carried out for compari-son with electronic volume counts by photographing in zero-g cellsamples which have also been measured on the Coulter counter.
Samples for this experiment will be transported in cold storage(278° K) and tested at incubator temperatures of 310° K ±1° K. Aculture pH between 7.0 and 7.3 must be maintained until completionof tests. Acceleration levels should not exceed 10"3 during incu-bation and testing.
Th addition to the common parameters previously mentioned, thefollowing data must also be monitored.
• Cell counts: 240 samples/hour
• pH level: 60 samples/hour
• Photo times: 240 samples/hour.
A detailed format structure is depicted in table 4.3-23.
4.3.5.4 MB-4, Electrical Characteristics of Cells. The purposeof this experiment is to exploit the zero-g environment to in-crease the sensitivity of cell electrophoretic mobility measure-ments. On earth these measurements are adversely affected byconvection currents and the sedimentation of the cells undergravitational forces.
The cell cultures will be transported in cold storage (278° K).For performing the experiment the cells will be incubated at310° K with 7.0 £ pH £ 7.3. The cultures will be chemically syn-chronized; i.e., all cells in a culture will be induced to divide
4-86
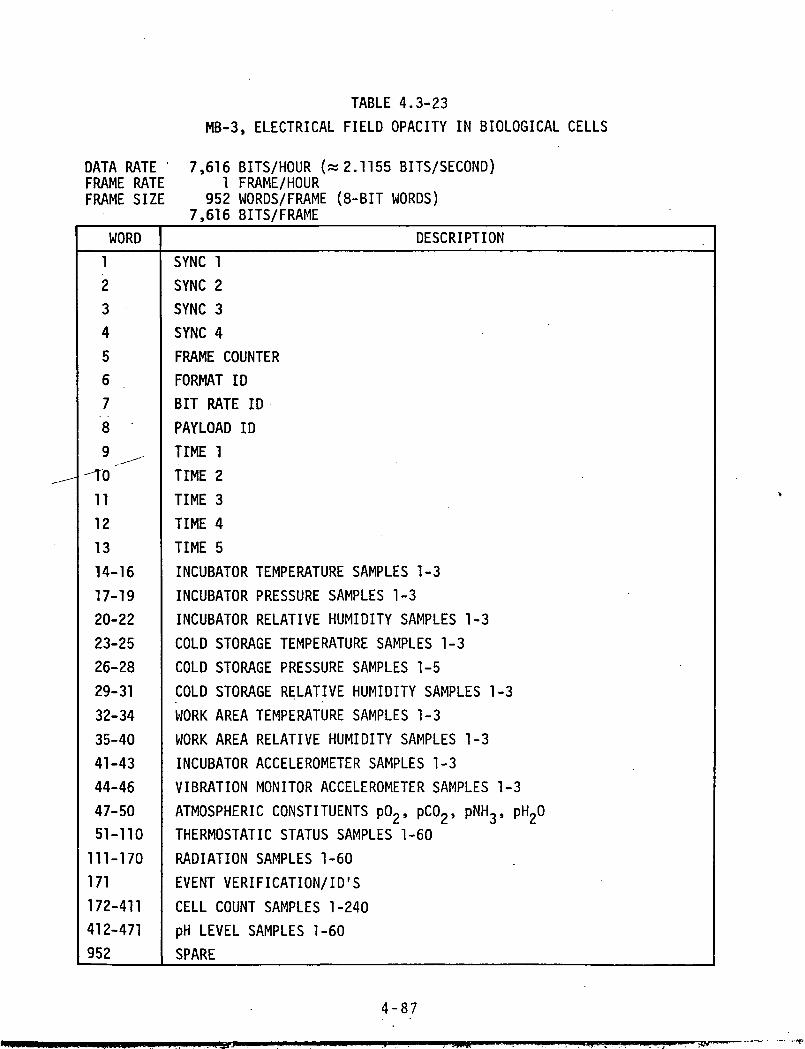
TABLE 4.3-23MB-3, ELECTRICAL FIELD OPACITY IN BIOLOGICAL CELLS
DATA RATE ' 7,616 BITS/HOUR («2.1155 BITS/SECOND)FRAME RATE 1 FRAME/HOURFRAME SIZE 952 WORDS/FRAME (8-BIT WORDS)
7,616 BITS/FRAMEWORD
1
23
456
78
9 .
"TO
11
12
13
14-1617-1920-22
23-25
26-28
29-31
32-34
35-4041-43
44-4647-5051-110
111-170
171
172-411412-471952
DESCRIPTION
SYNC 1SYNC 2SYNC 3SYNC 4
FRAME COUNTERFORMAT ID
BIT RATE IDPAYLOAD ID
TIME 1TIME 2
TIME 3
TIME 4
TIME 5
INCUBATOR TEMPERATURE SAMPLES 1-3
INCUBATOR PRESSURE SAMPLES 1-3
INCUBATOR RELATIVE HUMIDITY SAMPLES 1-3
COLD STORAGE TEMPERATURE SAMPLES 1-3
COLD STORAGE PRESSURE SAMPLES 1-5
COLD STORAGE RELATIVE HUMIDITY SAMPLES 1-3
WORK AREA TEMPERATURE SAMPLES 1-3
WORK AREA RELATIVE HUMIDITY SAMPLES 1-3
INCUBATOR ACCELEROMETER SAMPLES 1-3VIBRATION MONITOR ACCELEROMETER SAMPLES 1-3
ATMOSPHERIC CONSTITUENTS p02, pC02> pNHj, pH20THERMOSTATIC STATUS SAMPLES 1-60
RADIATION SAMPLES 1-60
EVENT VERIFICATION/ID'S
CELL COUNT SAMPLES 1-240pH LEVEL SAMPLES 1-60SPARE
4-87
at the same time. This will permit cell mobility and cell sizemeasurements (15-minute observation periods every 2 hours) tocharacterize different points in the cell life cycles. Accelera-tion levels in excess of 10"3 g must be avoided. Electrostaticprobes and magnetometers will be used to detect strong fields whichmay adversely affect the experiment. Data will be recorded forpostflight analysis of cell surface potential and charge as afunction of time in the cell life cycle. Cell cultures will bedisposed of after completion of the experiment.
In addition to the common data previously mentioned, the followingdata must also be monitored.
• pH level: 60 samples/hour
• Cell position: 120 samples/hour
• Position time tag: 120 samples/hour
• Magnetic field: 120 samples/hour
• Electrical field: 120 samples/hour.
A detailed format structure is depicted in table 4.3-24.
4.3.5.5 MB-5, Special Properties of Biological Cells. The objectof this experiment is to conduct advanced studies of mammaliancells in a zero-g environment.
A number of important characteristics and activities of human andmammalian cells cannot be accurately or mammalian cells cannot beaccurately or meaningfully studies on earth because of the signifi-cant interference of gravity or gravity-related effects, such assedimentation and convectivity. Study of such activities underconditions of weightlessness will potentially provide a greatlyincreased accuracy of measurement, as well as elucidation ofspecific phenomena not otherwise observable.
Several very important biological phenomena, particularly thoseinvolved in the fundamental processes of morphogenesis, involvegeotropism. Study of such processes under weightlessness can
4-88
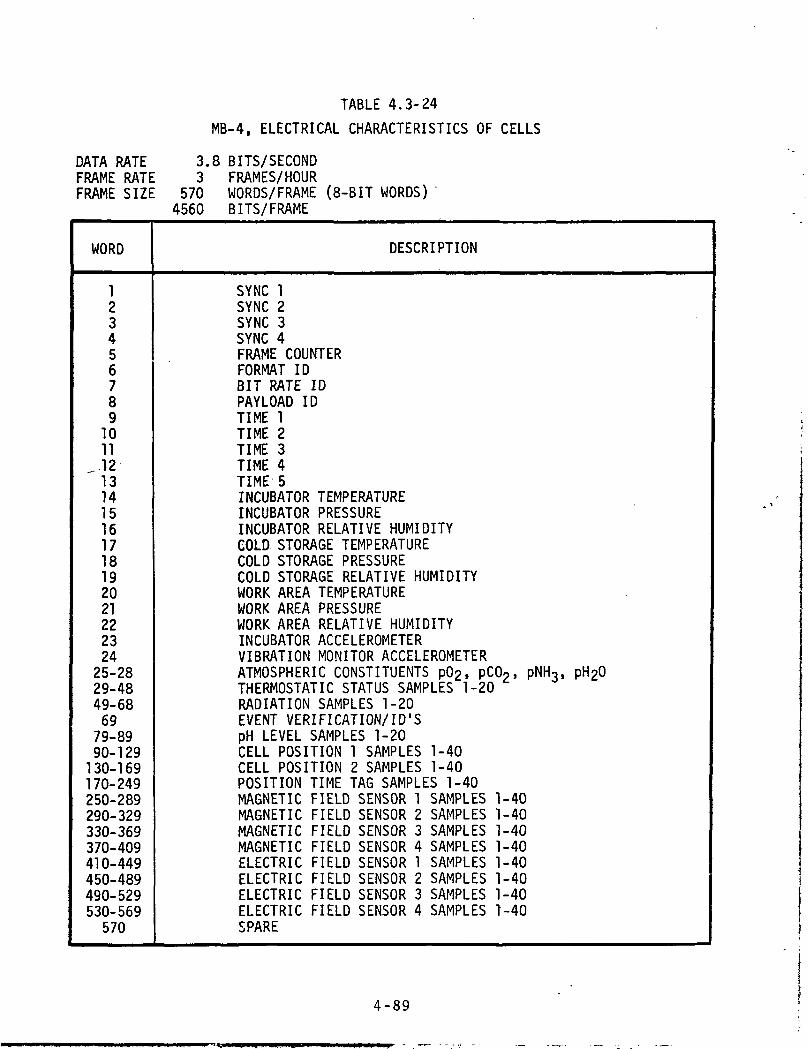
DATA RATEFRAME RATEFRAME SIZE
TABLE 4.3-24
MB-4. ELECTRICAL CHARACTERISTICS OF CELLS
3.8 BITS/SECOND3 FRAMES/HOUR
570 WORDS/FRAME (8-BIT WORDS)4560 BITS/FRAME
WORD
1234567891011-1213141516171819202122232425-2829-4849-686979-8990-129130-169170-249250-289290-329330-369370-409410-449450-489490-529530-569570
DESCRIPTION
SYNC 1SYNC 2SYNC 3SYNC 4FRAME COUNTERFORMAT IDBIT RATE IDPAYLOAD IDTIME 1TIME 2TIME 3TIME 4TIME 5INCUBATOR TEMPERATUREINCUBATOR PRESSUREINCUBATOR RELATIVE HUMIDITYCOLD STORAGE TEMPERATURECOLD STORAGE PRESSURECOLD STORAGE RELATIVE HUMIDITYWORK AREA TEMPERATUREWORK AREA PRESSUREWORK AREA RELATIVE HUMIDITYINCUBATOR ACCELEROMETERVIBRATION MONITOR ACCELEROMETERATMOSPHERIC CONSTITUENTS p02, pCOo, pNH3, pH20THERMOSTATIC STATUS SAMPLES 1-20RADIATION SAMPLES 1-20EVENT VERIFICATION/ ID'SpH LEVEL SAMPLES 1-20CELL POSITION 1 SAMPLES 1-40CELL POSITION 2 SAMPLES 1-40POSITION TIME TAG SAMPLES 1-40MAGNETIC FIELD SENSOR 1 SAMPLES 1-40MAGNETIC FIELD SENSOR 2 SAMPLES 1-40MAGNETIC FIELD SENSOR 3 SAMPLES 1-40MAGNETIC FIELD SENSOR 4 SAMPLES 1-40ELECTRIC FIELD SENSOR 1 SAMPLES 1-40ELECTRIC FIELD SENSOR 2 SAMPLES 1-40ELECTRIC FIELD SENSOR 3 SAMPLES 1-40ELECTRIC FIELD SENSOR 4 SAMPLES 1-40SPARE
4-89
yield crucial and otherwise unattainable information as to thebasic mechanisms of their functional and morphological involve-ments in response to gravity.
Ten special properties of cells will be studied in this total ex-perimental effort. These special properties are as follows:
• Cellular shape variation
• Cellular volume changes
• Cellular spreading and attachment
• Cell locomotion
• Cell-to-cell adhesion
• ,Cell surface molecular properties
• Serum sedimentation
• All clones and clonal growth
• Slime-mold morphogensis
• Molecular basis of geotropism.
All studies must be performed with the cells at 310° K and at pHbetween 7.0 and 7.3. At the completion of the experiment, thecells will be disposed of. All of the studies will use time-lapsemicrography to observe and record the cells under study. Exten-sive postflight analysis of the film will be required.
In addition to the common parameters previously mentioned, pHlevel and photo-time will be monitored. A detailed format struc-ture is depicted in table 4.3-25.
4.3.6 Component and System Testing. CS-2, Zero Gravity Steam Gen-erator, is the only experiment in this discipline which was analyzed.The remaining experiments in this discipline were removed from thestudy requirements by direction of LRC.
4-90

TABLE 4.3-25
MB-5, SPECIAL PROPERTIES OF BIOLOGICAL CELLS
DATA RATE 5,696 BITS/HOUR («1.5822 BITS/SECOND)FRAME RATE . 1 FRAME/HOURFRAME SIZE 712 WORDS/FRAME (8-BIT WORDS)
5,696 BITS/FRAME
WORD
123
456
78
9
-113 "11
12
1314-1617-1920-22
23-25
26-28
29-3132-34
35-3738-4041-43
44-4647-5051-110
111-170
171172-231
232-711712
DESCRIPTION
SYNC 1
SYNC 2SYNC 3SYNC 4FRAME COUNTERFORMAT IDBIT RATE ID
PAYLOAD ID
TIME 1
TIME 2
TIME 3TIME 4
TIME 5INCUBATOR TEMPERATURE SAMPLES 1-3INCUBATOR PRESSURE SAMPLES 1-3
INCUBATOR RELATIVE HUMIDITY SAMPLES 1-3
COLD STORAGE TEMPERATURE SAMPLES 1-3
COLD STORAGE PRESSURE SAMPLES 1-3
COLD STORAGE RELATIVE HUMIDITY SAMPLES 1-3WORK AREA TEMPERATURE SAMPLES 1-3WORK AREA PRESSURE SAMPLES 1-3
WORK AREA RELATIVE HUMIDITY SAMPLES 1-3
INCUBATOR ACCELEROMETER SAMPLES 1-3
VIBRATION MONITOR ACCELEROMETER SAMPLES 1-3ATMOSPHERIC CONSTITUENTS p02» pCO , pNH3> pH20THERMOSTATIC STATUS SAMPLES 1-60
RADIATION SAMPLES 1-60
EVENT VERIFICATION/ID'SpH LEVEL SAMPLES 1-60
PHOTO TIME SAMPLES 1-240SPARE
4-91
4.3.6.1 CS-2, Zero-Gravity Steam Generator. The general conceptfor this experiment was obtained from the LRC ATL report, NASATMX-2813. Additional sensors were added to the experiment forthe purpose of providing a better data base from which to analyzethe experiment results.
The assumptions for this experiment were that the following sensorsare necessary:
• High pressure water tank sensors: one temperature and onepressure for each of four tanks
• Water reservoir pressure sensor: one
• Generator inlet water sensors: one water flow, one tempera-ture, and one pressure
• Generator outlet steam sensors: one flow meter, one temper-^, ature, one pressure, and one flow control valve
• Steam condenser sensors: one temperature, one pressure, oneagitator current, and one agitator voltage
• Low pressure condensate collection tank sensors: one tem-perature and one pressure for each of two tanks
• Condensate collection tank sensor: one 3-position sensorfor the 3-way valve at the input to the two tanks
• Heater fluid reservoir sensors: one pressure and six tem-perature
• Fluid reservoir resistance heater sensors: one heater cur-rent and one heater voltage
• Heating fluid circuit sensors: one flow meter, one pumpAP, one pump current, one pump voltage, and one pump switchposition.
4-92

The following assumptions were also made:
• Sensor output sample rate: 10 samples per second
• Encoding: 8 bits for each analog data sample.
The measurement list will consist of 36 analog signals which areconverted to digital data and five event indicators. It will beassumed that a frame will contain one data sample from each sensor.Since the sample rate is 10 samples per second, the frame rate willbe 10 frames per second which will provide for a timing sample at0.1 second intervals.
Each frame will contain 37 8-bit words of experiment data and 138-bit words of overhead data as illustrated in table 4.3-26. Bycombining the overhead data and the experiment data for 10 frames,the total data rate will become:
Overhead: 1,040 bits per secondExperiment: 2,960 bits per secondTotal: 4,000 bits per second
4.3.7 Environmental Effects. The following paragraphs containthe detailed documentation resulting from the analysis of theenvironmental effects experiments. Included in the documentationare the references and assumptions used to establish the data ratefor each experiment and a baseline format description.
4.3.7.1 EN-1, Sampling of Airborne Particles and Micro-Organismsin Space Cabin Environment. The cabin air sampling experimentpackage will consist of two sampling units; each unit will havethree manifolded 6-stage sieve-type samplers. Cabin air will bedrawn into the units by pumps, and microflora and particulatematter will be collected on surfaces in the units for postflightanalysis.
The parameters to be measured will include:
• Types of micro-organisms present in the cabin air environ-ment
4-93

TABLE 4.3-26
CS-2, ZERO-GRAVITY STEAM GENERATOR
DATA RATE 4,000 BITS/SECONDFRAME RATE • 10 FRAMES/SECONDFRAME SIZE 50 WORDS/FRAME (8-BIT WORDS)
400 BITS/FRAME
WORD
12345678910111213,14
' 151617181920212223242526272829303132333435363738394041
DESCRIPTION
SYNC 1SYNC 2SYNC 3SYNC 4FRAME COUNTERFORMAT IDBIT RATE IDPAYLOAD IDTIME 1TIME 2TIME 3TIME 4TIME 5HIGH PRESSURE WATER TANK 1 TEMPERATUREHIGH PRESSURE WATER TANK 2 TEMPERATUREHIGH PRESSURE WATER TANK 3 TEMPERATUREHIGH PRESSURE WATER TANK 4 TEMPERATUREHIGH PRESSURE WATER TANK 1 PRESSUREHIGH PRESSURE WATER TANK 2 PRESSUREHIGH PRESSURE WATER TANK 3 PRESSUREHIGH PRESSURE WATER TANK 4 PRESSUREWATER RESERVOIR PRESSUREGENERATOR INLET WATER FLOW METERGENERATOR INLET WATER TEMPERATUREGENERATOR INLET WATER PRESSUREGENERATOR OUTLET STEAM FLOW METERGENERATOR OUTLET STEAM TEMPERATUREGENERATOR OUTLET STEAM PRESSURESTEAM CONDENSER TEMPERATURESTEAM CONDENSER PRESSURESTEAM CONDENSER AGITATOR CURRENTSTEAM CONDENSER AGITATOR VOLTAGELOW PRESSURE CONDENSATE COLLECTION TANKLOW PRESSURE CONDENSATE COLLECTION TANKLOW PRESSURE CONDENSATE COLLECTION TANKLOW PRESSURE CONDENSATE COLLECTION TANKHEATING FLUID RESERVOIR PRESSUREHEATING FLUID RESERVOIR TEMPERATURE 1HEATING FLUID RESERVOIR TEMPERATURE 2HEATING FLUID RESERVOIR TEMPERATURE 3HEATING FLUID RESERVOIR TEMPERATURE 4
1 TEMPERATURE2 TEMPERATURE1 PRESSURE2 PRESSURE
4-94

TABLE 4.3-26 (CONT'D)
WORD
424344454647484950
-
DESCRIPTION
HEATING FLUID RESERVOIR TEMPERATURE 5HEATING FLUID RESERVOIR TEMPERATURE 6HEATING FLUID RESERVOIR HEATER CURRENTHEATING FLUID RESERVOIR HEATER VOLTAGEHEATING FLUID FLOW METERHEATING FLUID PUMP APHEATING FLUID PUMP CURRENTHEATING FLUID PUMP VOLTAGEEVENT INDICATORSBIT 1 STEAM FLOW CONTROL VALVEBIT 2 CONDENSATE COLLECTION TANK INLET VALVEBIT 3 CONDENSATE COLLECTION TANK INLET VALVEBIT 4 CONDENSATE COLLECTION TANK INLET VALVEBIT 5 HEATING FLUID PUMP SWITCHBIT 6-8 SPARES
POSITION 1POSITION 2POSITION 3
4-95
• Quantification of micro-organism types
• Rate of change of micro-organism types with respect tooperations of, and in, the spacecraft
• The type, quantity, and rates of change of nonviableparticles
• Origin of nonviable particles by size
• Size classification of both viable and nonviable particles.
Based on requirements for this type experiment, which is similarto the T003 and the Atmospheric Volatile Concentrator experimentsperformed on Skylab 3 and 4, no telemetry or electronic recordingwill be required. Crew comments on properly labeled canisterswill be required, such as:
^_-« Time measurement start/end
• Temperature at experiment location
• Humidity of environment
• Description of any event (scheduled or unscheduled) whichcoincides with sampler operation and has the potential forproducing particles.
4.3.7.2 EN-3, Environmental Effects on Non-Metallic Materials.The environmental effects on non-metallic materials experimentwill utilize one array of test material which will be deployedduring the mission, exposed to solar radiation for the maximumtime possible, retrieved after a minimum of 5 days exposure, andreturned at mission end to the ground laboratory for analysis.
No data from the material samples will be required since groundanalysis will yield the required data. However, the temperatureof the array will be required to be recorded for factoring intothe analysis results.
4-96
The sampling frequency must be high enough to assure that tempera-ture changes occasioned by temporary shadowing, as from a rollingOrbiter, will be detected. For this reason, a sampling rate ofonce per 100 seconds was chosen. Even if the roll rate exceededthis figure, a mass-averaged temperature reading would still beavailable.
Based on the sampling consideration stated, a format was establishedas shown in table 4.3-27, consisting of 13 header words and 1 tem-perature reading.
4-97
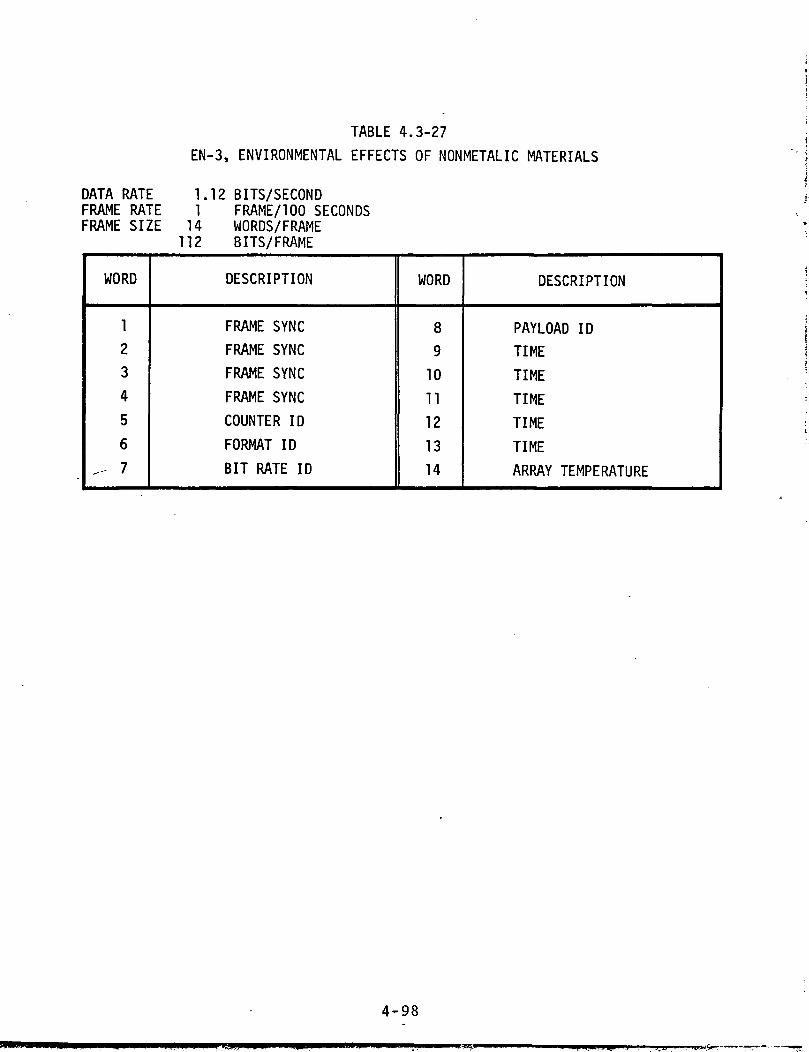
DATA RATEFRAME RATEFRAME SIZE
TABLE 4.3-27EN-3, ENVIRONMENTAL EFFECTS OF NONMETALIC MATERIALS
1.12 BITS/SECOND1 FRAME/100 SECONDS
14 WORDS/FRAME112 BITS/FRAME
WORD
123
4
5
6„- 7
DESCRIPTION
FRAME SYNCFRAME SYNC
FRAME SYNC
FRAME SYNCCOUNTER ID
FORMAT IDBIT RATE ID
WORD
891011
12
13
14
DESCRIPTION
PAYLOAD IDTIME
TIME
TIMETIMETIME
ARRAY TEMPERATURE
4-98
4.3.8 Data Recording. During the data recording analysis, threeinstrumentation recorders were used to calculate tape volume.These were the high data rate recorder as listed in the SpacelabPayload Accommodation Handbook, a medium capacity 14-track recorder,and a high-capacity 32-track recorder.
4.3.8.1 Spacelab Recorder. The characteristics of this recorderare listed in table 4.3-28. Some of the disadvantages are singlerecord/reproduce speed and the inability to handle more than 30megabits of data. Table 4.3-29 depicts the number of tapes re-quired to record the experiment data on the spacelab recorder. Animportant factor to the mission planning phase of the ATL is thateach instrumentation tape weighs approximately 14 pounds.
4.3.8.2 Medium Capacity Recorder. Table 4.3-30 depicts the char-acteristics of the medium capacity recorder. Table 4.3-31 depictsthe number of tapes required using a recorder of this type. Asshown in table 4.3-31, EO-2A, EO-2B, and EO-4 require a signif-icant number of tapes; this is primarily due to the long data'acquisition cycles. Where possible single track recording wasassumed.
4.3.8.3 High-Capacity Recorder. Table 4.3-32 depicts the char-acteristics of the high-capacity recorder and table 4.3-33 showsthe number of tapes required to record EO-3 and EO-7/8 using arecorder of this type.
4.3.8.4 Low Data Rate Experiments. Experiment analysis pointsout six experiments which should not have their output recordedon the spacelab recorders. There are two main reasons for this:
• The data rates of these experiments are too low to recordwith an instrumentation recorder.
• The data take time for MB-1 and EN-3 would tie up a re-corder for the entire mission.
In order to record the data from these experiments, the datarates would have to be increased significantly. Table 4.3-34shows the experiments and their bit volumes/mission recorded andnonrecorded.
4-99
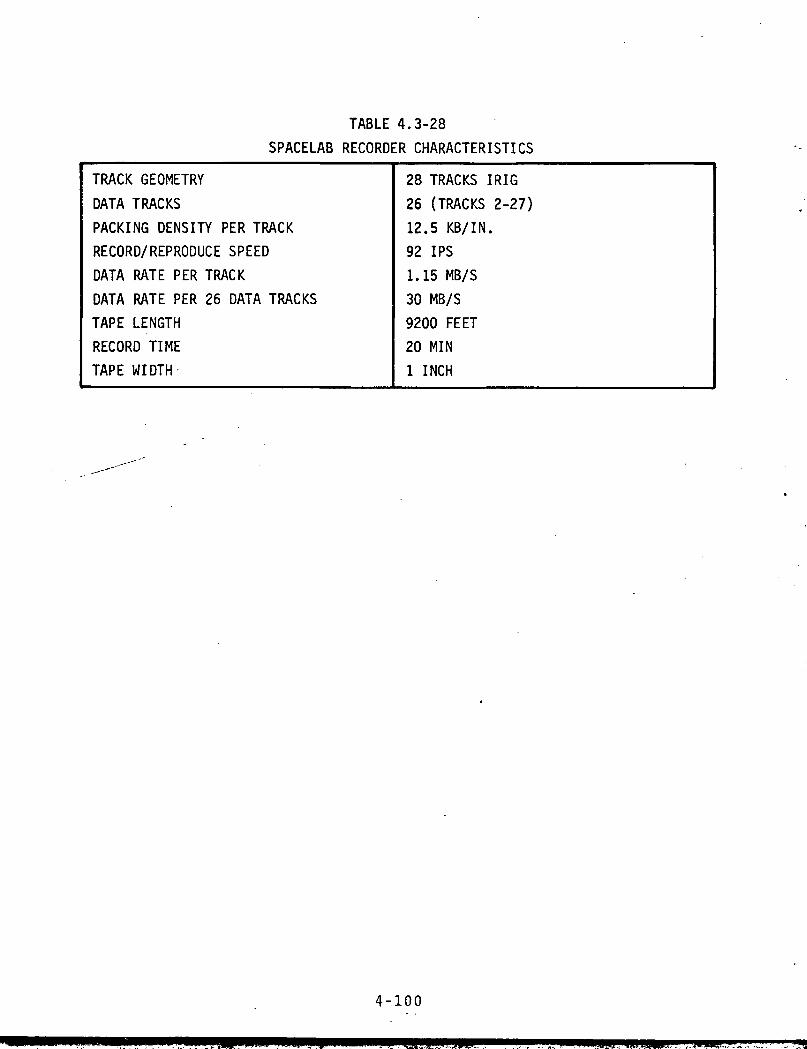
TABLE 4.3-28
SPACELAB RECORDER CHARACTERISTICS
TRACK GEOMETRY
DATA TRACKS
PACKING DENSITY PER TRACK
RECORD/REPRODUCE SPEED
DATA RATE PER TRACK
DATA RATE PER 26 DATA TRACKS
TAPE LENGTH
RECORD TIME
TAPE WIDTH
28 TRACKS IRIG
26 (TRACKS 2-27)
12.5 KB/IN.
92 IPS
1.15 MB/S
30 MB/S
9200 FEET
20 MIN
1 INCH
4-100
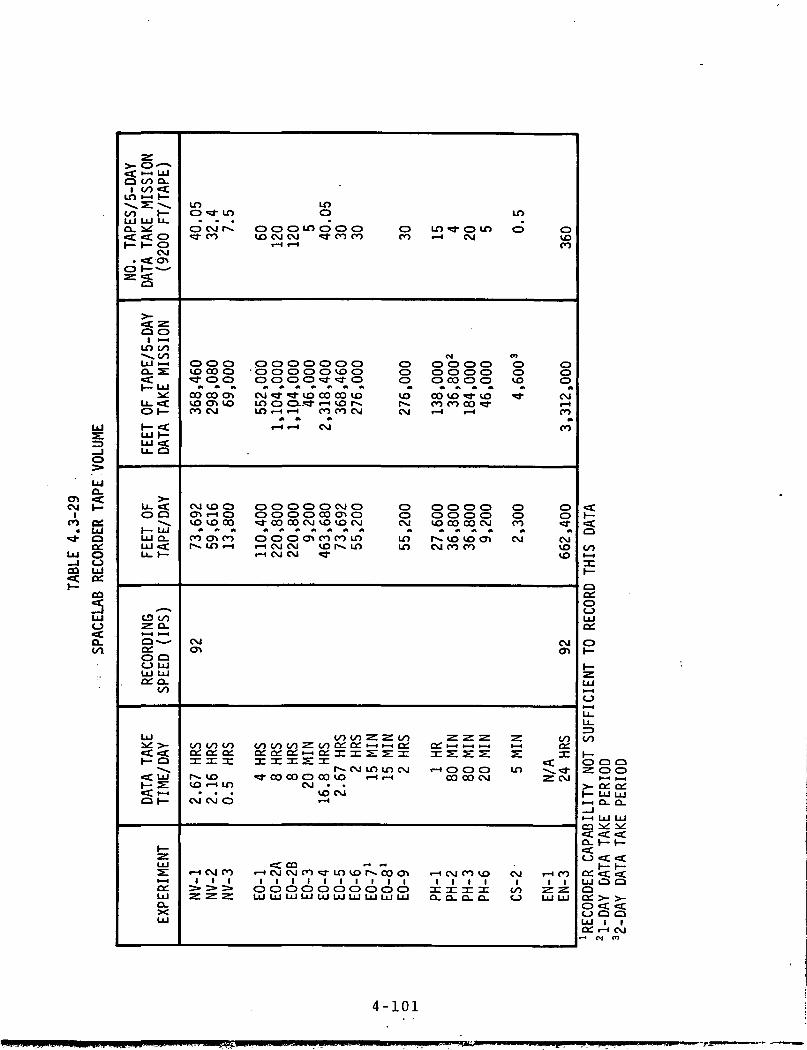
LU
CM h-
co ee.• LU
•* QQL
LU O—I OOQ LU
CO
a.oo,
z>- O'— »«t i— i LUo oo ex
1 00 <f.in i— 1 1—oo" H^LU LU Lua. <c <c or— I— O
CM
CD 1
«£ Z0 0
in ooLU •— iQ- 2:
Z£LU ""f01—
t£LU e£Lu O
U. <C00
LU O.LU «=CLU I—
O COZ 0-
o -*O 0<_> LULU LUa: a.
oo
LU:*: >-i— §••eC LUi— s:0 h-
i_LUs:i— i<*v*LUO.XLU
LOCD •* LO
* • *
O CM f^.«a- co
o o o10 CO O«* o oOO CO O"vLO C7^ LOCO CM
CM VO OCT> r-l OVO VO 00
CO CT^ COr-. in i-i
CM
oo oo ooCC.OC GC.3: x: 3:r-. voVO i-« LO
• • •CM CM O
t-H CM CO1 1 1
^* ^> >Z Z Z
in0
o o o in o o o oIO CM CM "5f CO CO CO
r- 1 i— 1
O O O O O O O CD•ooooovoo oOOOO-sl-'vt-O O
CM^-^VOCOCOVO VOin o CD.-"* t— i vo r~. r>»in «-< t-l CO CO CM CM
T-H i-H CM
OOOOOCMO Ooooococno o^ •COCOCMVOVOCM CM
ooocncocom inT-I CM CM vo r-» in int-l CM CM ^~
co oo z z oo000000^000:0:1— 11— 10;3: 3; 3; 5 3: "n ^ ^
r*. CM in in CM^^ CO CO CD OO VO *— ' r—4
CM • •VO CMr-H
< 03 - -
1 1 1 1 1 1 1 1 1 1oooooooooo1 1 i 1 1 i LU LU LU LU LU LU LU LU
in «j- CD int-H CM
O O O CDCD O CD OO CO O O
CO VO " VOCO CO CO "t-H t-H
o o o oo o o oVO CO 00 CM
f 1,0 O O^CM OO CO
Q** *- -t t—i t—43: s: s s:t-l O CD O
CO CO CM
t— 1 CM CO VO1 1 1 1
3: 3: 3: 3;a. a. a. a.
LO
O OVOCO
o oo ovo o- CM
I— troCO
o oo oCO «J-
CM CM
vo
CMCT»
z ooi— i a:s 3:in ^_«j-
Z CM
CM t-H CO1 1 1
00 Z Z(_> LU LU
fitQ
oo3:
CDa:oLUo:0K~
t—
LUi— i
LULU
ooI—CD 0 OZ CD O
t—t i—i>- GC. G£.\ — LU LUi— i o_ a.
1
i— i LU LU
<<eC0- t— I—
CJ <t <f
OC eC rLU O OOo: >- >-o <: «=c<_> O CDLU 1 1O: r-l CM
<-4 CJ <n
4-101
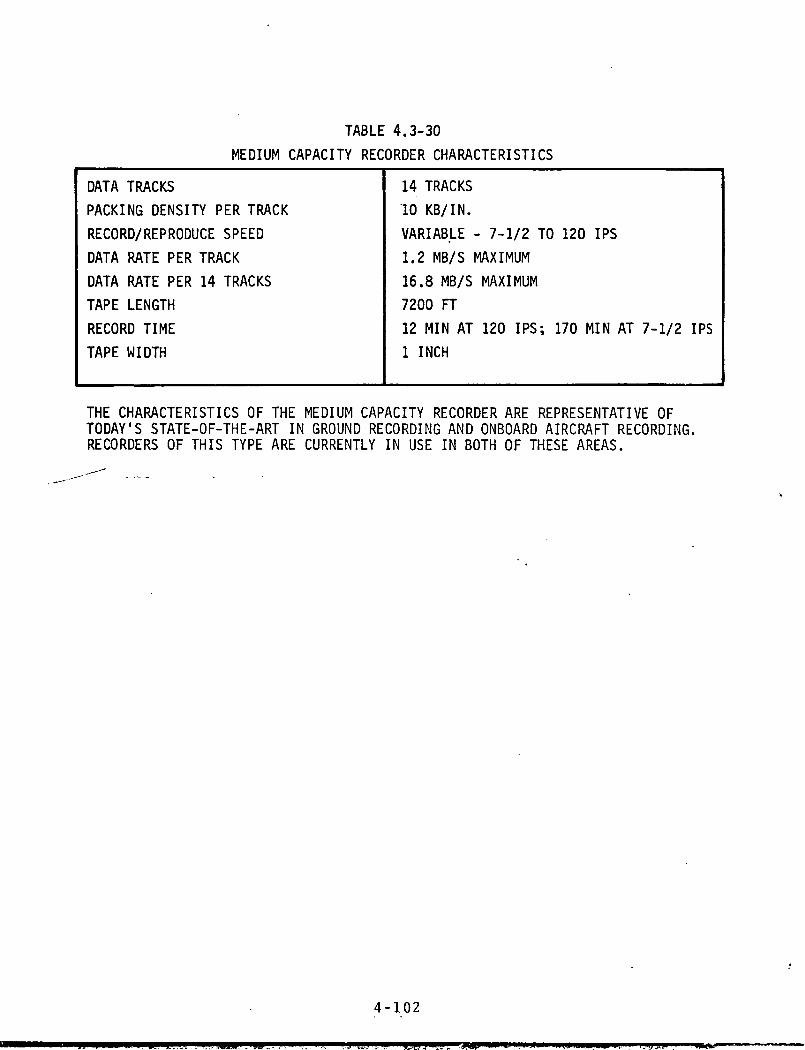
TABLE 4.3-30
MEDIUM CAPACITY RECORDER CHARACTERISTICS
DATA TRACKS
PACKING DENSITY PER TRACK
RECORD/REPRODUCE SPEED
DATA RATE PER TRACK
DATA RATE PER 14 TRACKS
TAPE LENGTH
RECORD TIME
TAPE WIDTH
14 TRACKS
10 KB/IN.
VARIABLE - 7-1/2 TO 120 IPS
1.2 MB/S MAXIMUM
16.8 MB/S MAXIMUM
7200 FT
12 MIN AT 120 IPS; 170 MIN AT 7-1/2 IPS
1 INCH
THE CHARACTERISTICS OF THE MEDIUM CAPACITY RECORDER ARE REPRESENTATIVE OFTODAY'S STATE-OF-THE-ART IN GROUND RECORDING AND ONBOARD AIRCRAFT RECORDING.RECORDERS OF THIS TYPE ARE CURRENTLY IN USE IN BOTH OF THESE AREAS.
4-102
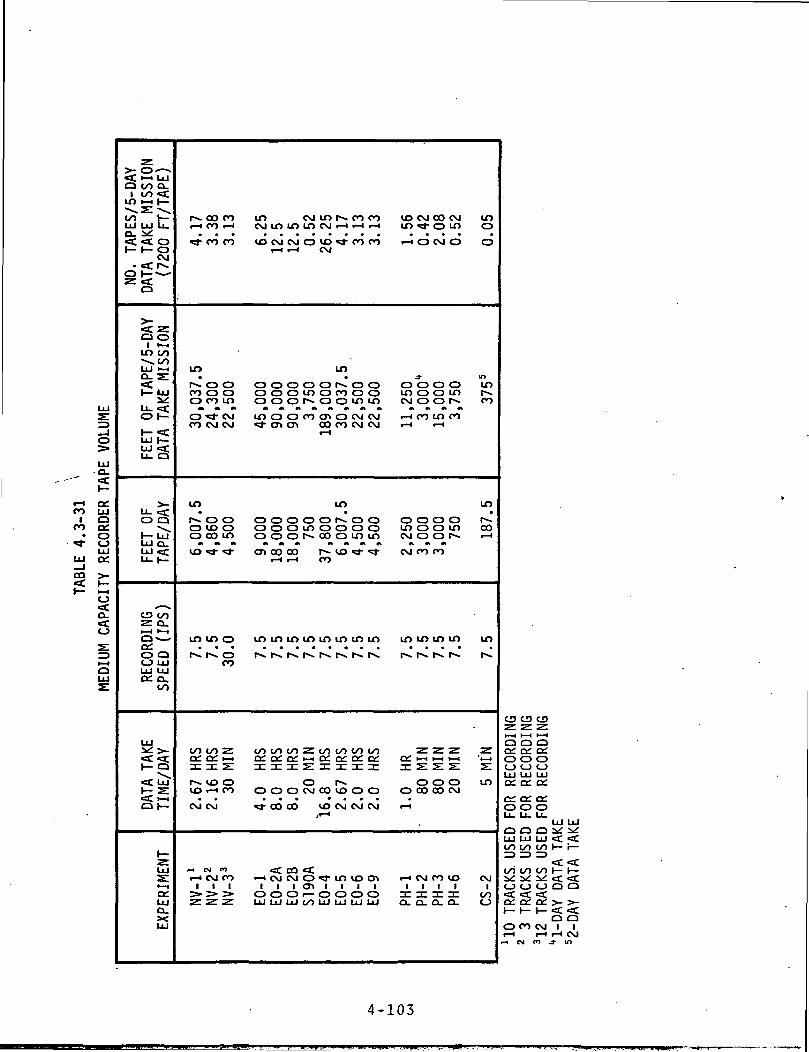
coico•
UJ1•J
CO
1—
2:_,..-!o>
UJQ.
CSLLUOoioLUG£
>-
I-H0
0.£o
:z>1— 1oLU2:
>- o ~*Q CO Q-1 CO <C
LO t— i I —
CO f—LU LU U.rt XXf. «C Ot— H- 0
CM
0 1
Q
Q O1 •— iLO CO
LU >—"Q- s:»- UJ1 1 _^fU_ 10 »—
1— «=CLU I—UJ <u_ f*
1 1 <fO Q
I— uTLi J f*\LJ.J LTLU <=C
U- 1 —
to coZ 0.
0- -o:0 QO UJLU LUOH Q,
CO
LU
<c 1— Q<C UJ
Q P
,_
ZUJ31— 1a:UJa.LU
r .t— i,3.
LO•
|*coooco
LO•r-oovo
LO
^
COCsL3:f>VO
CM
^t— 11
»^
CO COCO i-H
co co
o Oo oCO LO
• J-CMCM CM
O O\Q OCO LO
«4- <*
LO O
r^» oCO
co z:o: i-.1C 21
VO O»-H CO
e\j
tM mCM CO1 1
> >^ ^
IDCM LO
VD CMt— 1
0 0O Oo oLO O«* 0*
o o0 0
a» oot— i
LO LO
CO CO
n: in
o o*J- CO
<c1 10 0LU LU
CM LOLO LO CM
CM O IOt-l CM
O O OO LO Oo r»» oo co cr»a* oot— i
o o oO LO OO !">• OO
oo rt-H CO
LO LO LO
co z coDC 21 3Z
oO CM OO
CO VO.J--/ "•
CO ef.CSJ CD ^1 O*v 1O i— OLU OO LU
r- cot— 1 1— i«d- co
LO•
^^ oco oO LO
CD CMCO CM
LO
1^ 0o oO LO
vo <d-
LO LO
CO CO
3: x:r-»vo oCM CM
LO lf~*i iO OLU LU
cor-4
CO
0OLO
CMCM
OO
,3-
LO
CO
3:
oCM
CT1OLU
VO CM OO CM LOLO «^- O LO O
«-H O CM O O
J- 10O O O O LOLO O O LO t —CM o o r-. cof-l OO LO CO«— i t— i
LO•
o o o o r«-LO CD O LO COCM o o r«» i— iCM CO CO
LO LO LO LO LO
Q£ l-H 1—4 *— t *1— (
n: 2:2: 2: 2:O O O LO
O CO CO CM
f— 1
t— 1 CM CO iO CM1 1 1 1 1a: a: z a: coa. a. a. a. <_>
tD O CDz z zt— 1 1— 1 t— 1a o o0:0:0:o o o
a: a: o:AX f*s rvU. tJt. UZ-
o o o1 1 If 1 1LiU U_ LJ^
O O LU LU LUCO CO CO
CO CO CO
o o cj< ^ «*>* /v'H*" H~ H~
O CO CMi— I i— Ift c>4 en
UJ LUx/
1— r—
t— 1—
Q Q
. C C0 O1 1
i-H CM
4-103
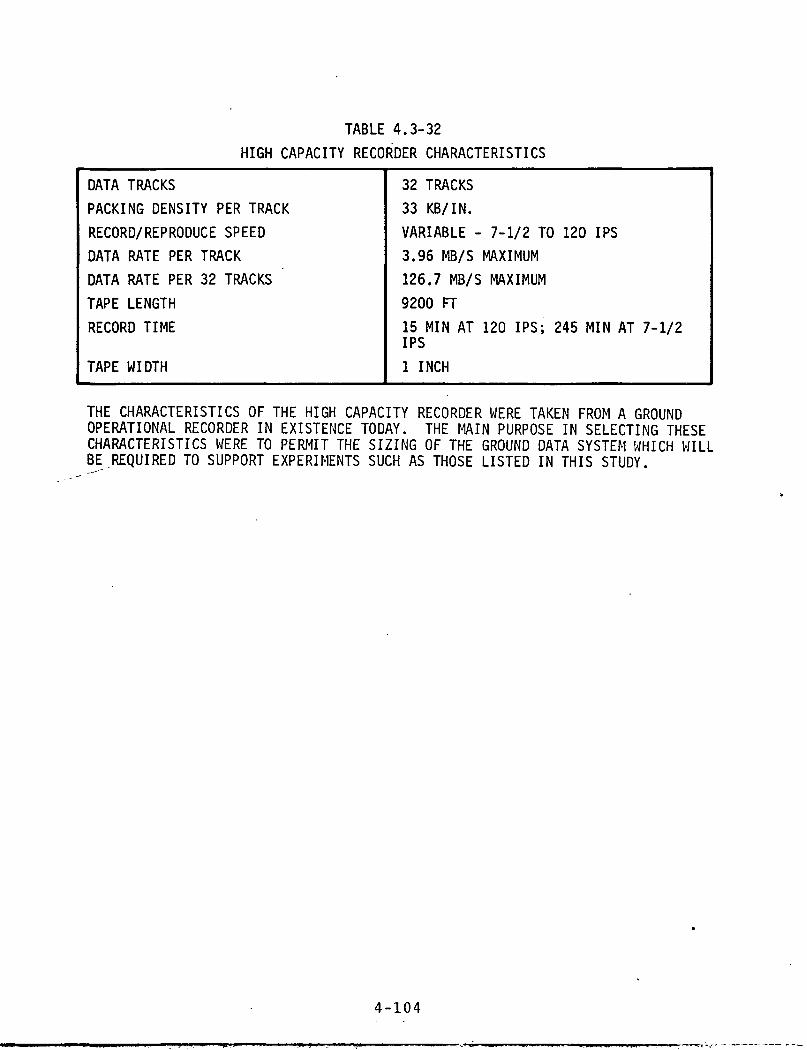
TABLE 4.3-32
HIGH CAPACITY RECORDER CHARACTERISTICS
DATA TRACKS
PACKING DENSITY PER TRACK
RECORD/REPRODUCE SPEED
DATA RATE PER TRACK
DATA RATE PER 32 TRACKS
TAPE LENGTH
RECORD TIME
TAPE WIDTH
32 TRACKS
33 KB/IN.
VARIABLE - 7-1/2 TO 120 IPS
3.96 MB/S MAXIMUM
126.7 MB/S MAXIMUM
9200 FT
15 MIN AT 120 IPS; 245 MIN AT 7-1/2IPS
1 INCH
THE CHARACTERISTICS OF THE HIGH CAPACITY RECORDER WERE TAKEN FROM A GROUNDOPERATIONAL RECORDER IN EXISTENCE TODAY. THE MAIN PURPOSE IN SELECTING THESECHARACTERISTICS WERE TO PERMIT THE SIZING OF THE GROUND DATA SYSTEM WHICH WILLBE REQUIRED TO SUPPORT EXPERIMENTS SUCH AS THOSE LISTED IN THIS STUDY.
4-104
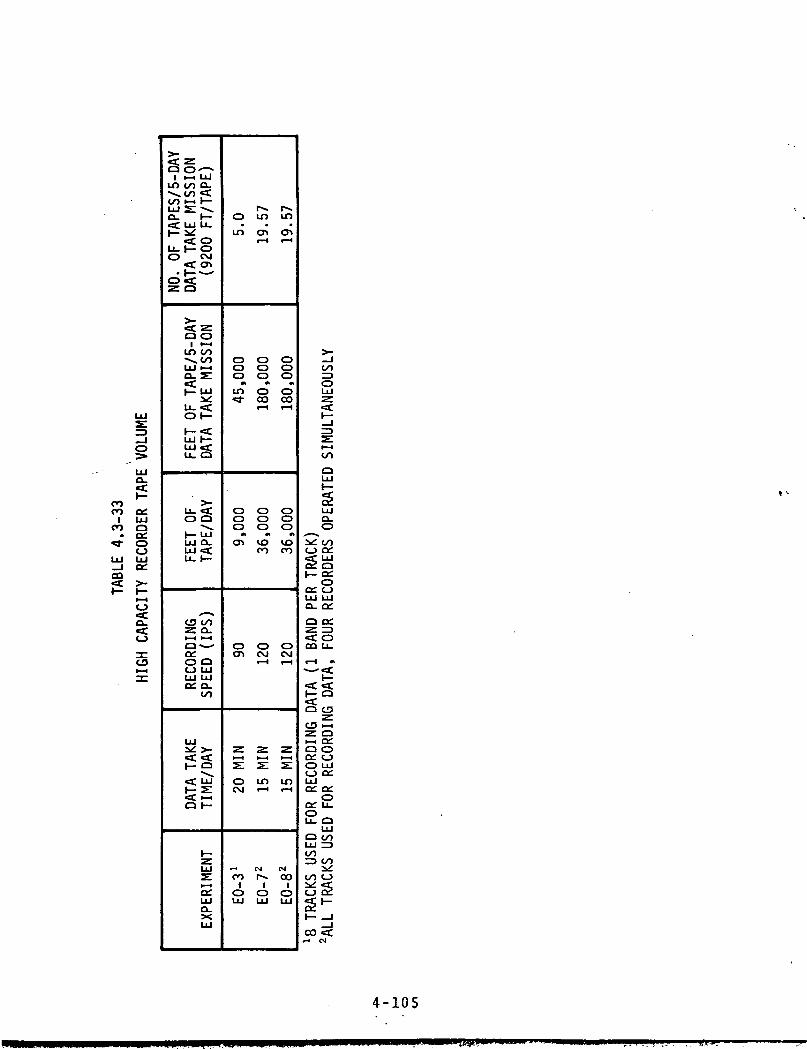
cococo
CO
Q.•a:
LUoex:oCJLUOL
Q O^~I I—I LUin co a.
^>»co ftco •-> i—
•a: oLu I— Oo cvj
o «cz o
Q Oin co
OH-
LU •
O Q
h- LULU Q-LU <CLu I—
C3 COz. a.
O QCJ LULU LU££ 0-
CO
LU
I— Q
<C LU
^C *-HQ t—
o:LUa.xLU
o in in0%
o o oo o oo o oin o o«3- CO 03
o o o0 0 0o o ocr> UD 10
CO CO
o o o<T» evj cvj
oCVJ
in in
-I CJ 01
co r>» coi i i
O O OLU LU LU
CO
OLU
co
LU
LUa.o
:*: coCJ CHef LUc2 oi— a:oCsL CJLU LUa. oio o:•a: oCO LU
£§2o
•z.O 1-1z oi—i ££O Orv e •*O LUo o:LUo: o:
oQ; LU£o
LUC3 COLU ^COr> coCO CJ
cj 2
c»
4-105
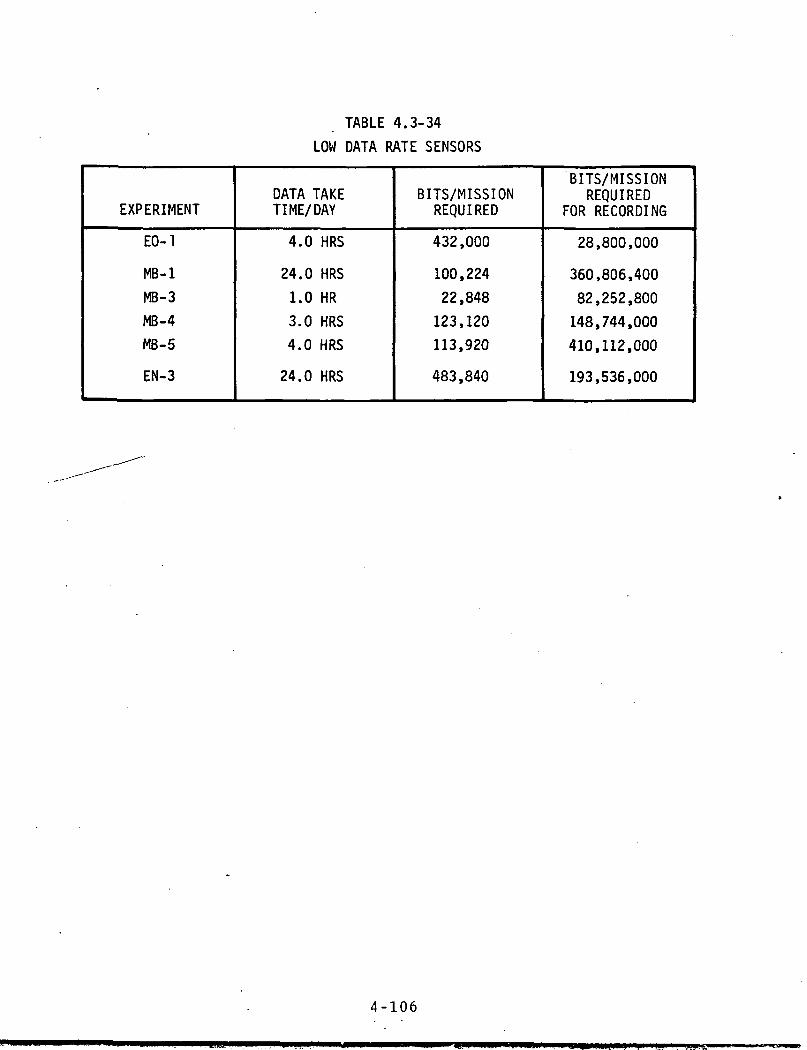
TABLE 4.3-34
LOW DATA RATE SENSORS
EXPERIMENT
EO-1
MB-1
MB-3
MB-4
MB- 5
EN-3
DATA TAKETIME/ DAY
4.0 HRS
24.0 HRS
1.0 HR
3.0 HRS
4.0 HRS
24.0 HRS
BITS/MISSIONREQUIRED
432,000
100,224
22,848
123,120
113,920
483,840
BITS/MISSIONREQUIRED
FOR RECORDING
28,800,000
360,806,400
82,252,800
148,744,000
410,112,000
193,536,000
4-106
4.3.8.5 Data Volume. Table 4.3-35 shows the data volume in bitsper day and mission for each experiment. All mission volumesassume 5-day data take except where otherwise indicated.
4.3.9 Major Considerations. The major consideration resultingfrom this analysis is data acquisition. As shown in paragraph4.3.8, there are three areas which will require further studyand development. These are 1) low data rate experiments, 2)medium data rate and high data take time experiments, and 3)EO-7/8.
4.3.9.1 Low Data Rate Experiments. An alternate method of dataacquisition needs to be considered for these experiments otherthan using a spacelab recorder. Possible alternatives include:
• Self-contained data acquisition within the experiment
• Onboard processing of the data as it is collected
e Insertion of the data into the Orbiter downlink.
4.3.9.2 Medium Data Rate Experiments. The two experiments ofconcern in this area are EO-2 and EO-4. The data rate of theseexperiments is readily manageable but the long periods of datatake will require many instrumentation tapes per ATL mission.Some possible alternatives for these experiments include;
• Insertion of the data streams into the Orbiter downlink
• Reduction of the data acquisition time where possible
• Self-contained data acquisition equipment within theexperiment.
4.3.9.3 EO-7/8. The major consideration is the high data rate.Data rates of this magnitude are going to require multiple re-corders which would mean this experiment, as defined in thisstudy, would require its own recording system.
4-107
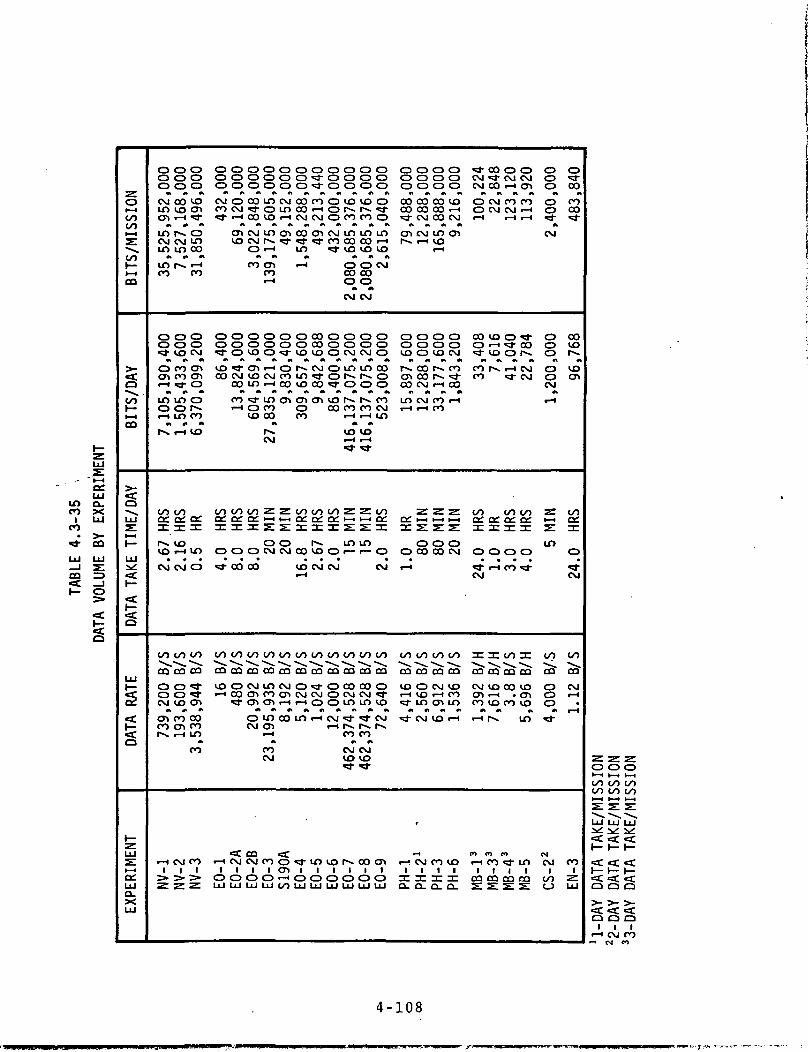
-
incoi
co
srIIIUJ
OQ
1—
1—
LU
" i— i
LUIX•x.LU
03
111UJ
=>0
<c1—a
ocoooI-Hy•
OO1—I-H
m
>_•Q
OOH-i— iOQ
<a"N
LU.
P
^ir^
ta
MlUJh-
2
^J__
<C.O
LUs:I-Hex.LUQ.XUJ
O O CDO CD OO O 0
CM 00 VOin vo cncn 1-1 srin r-. oCM CM min in co
«» •» *in r-. 1-1co co
O CD OO CD Osr vo CMO CO Cncn co cnr-l ^T O
in in oo o r^r-l in CO
•* •» *r--. .-H vo
oo ooce o: cn.Z 1C DC
1 — VOvo i— i mCM CM O
OO 00 00
m co cao o sro o srCM vo cncn co coco cn cor-» i-i in
A
CO
•—I CM CO1 1 1
"y "^ ^*
ooooooooooooooooosrooooC D C D O O O O s T O O O O
cMocoincMcocoovovooco CM sr CD in co rH CD r r srsT"— i cOVOi— I C M C M O C O C O O
cncMincncocncMinininvo CM r * sr sr sr co co oo I-H
o i— i in sr vo vo vo•» « «l * « •»
CO Cn rH O O CMCO CO COI-H O O
CM CM
oooooocoooooO C D O O O O C O O C D O Os T O V O O s r v O V O O C M C M O
vosrcnrHor^cMOinincoco CM vo CM co m sr CD ^^ ^^ CD
comi— loovocosrooocosrincncncnvoi^r^cor-iOCO O OOCOCOCM
vo oo co I-H i— i inM « «k
i-^ vo voCM i-H i-H
O O O O O O Z Z O O O O O O Z Z O Of f Ff I-H I-H <*V rv* t^r* 1— H I-H f S
^^0:2:2:3:3:^2:2:3:
o o r>» in inO O O C M C M C O V O O i — i— O
sT 00 OO VO CM CM CMi-H
oooooooooooooooooooooo
^^cooam^^^^^^VOOCMinCMOsTCDOOOOO
""sralcnSlr^ooininvoomcoinrHCMsrsrcMCM cy> i— i r~- r>» ^>.
r-l CO CO9* * A
CO CM CMCM VO VOsr sr
<C CQ «fr-icMCMcoosrinvor«>.cocni i i i cn i i i i i i
OOOOr-HOOOOOOLU LU LU LU OO LU LU LU LU UJ LU
o oO 0o o00 0000 COsr CM
cn CMr>- 1— i
CD CDo oVO O
r^- cocn COCO CM
in CMi— 1 i-H
•zcn i-.31 S.
oO CO
1— 1
oo oo
CO CQ
VO Oi— 1 VOsr msr CM
,
t-tr->. CM
1 11C DCa. o.
o oCD CDo oCO VOCO rHCO CM
in cnvorH
O Oo oVO CM
r*«» cor^ vjrH OO
CO rHCO
^^ ^^HH 1 — 1
. sco oCO CM
OO OO
CQ CQ
CM VOrH COcr> inVO rH
CO VO| |
T- T-
Q_ Q_
sr co oCM ST CMCM CO rH
O CM COO CM CMrH rH
CO VO OO rH «3-
sr vo oCO !•>«. rHco sr
oo oocn a: cn
o o oST rH COCM
3C DC OO
CQ CQ CO*
CM VO COCn rH .CO VO CO
rH ^N,
m cn mrH CO ST
1 1 1CQ CQ CQy ^" ^>~
OCMcnCOl-HrH
STCO
CMCM
ooDC
O
^
-j-
CQ"vocnvo
A
in
ini
OQ
OOooosrCM
0OO
OoCM
rH
;gHH
Si
m
00
OQ"ooo1-
CM
CM1
OOo
osrCO
coCOsr
COVO
vo
OOcnDC
O
CM
00
CQ"CMI-H
i-H
CO1
LU
-z.-z.-z.CD O O
oo oo oooo oo oo1— 1 I-H I-H
LU LU LU
?^^=£ <t <C1 — 1 — 1 —
0 O Q
^^ . ^^ef.ff.ef.O O 0
rH CM CO<-t CM m
4-108
SECTION 5
GROUND SUPPORT DATA MANAGEMENT SYSTEM REQUIREMENTS
5.1 SUBTASK 2.1, FUNCTIONAL REQUIREMENTS
The purpose of this subtask was to define the functional require-ments of the Langley Research Center Data Management System(LRCDMS). The primary inputs were the results of the experimentanalysis and the operations analysis performed in Task I of thestudy.
5.1.1 Support Requirements. The LRCDMS will be required tosupport the following four major areas of each Advanced TechnologyLaboratory (ATL) mission.
• Experiment integration/checkout
~" • ATL/Orbiter integration/checkout
• Mission operations
• Postflight processing
All of the above areas except mission operations will require thesame system configuration in the support function. This configu-ration, referred to in this document as the Data ReformattingSystem (DRS), will be required to perform the following functions:
• Instrumentation tape input
• Reformatting of experiment data
• Generation of computer-compatible tapes ICCT's) and associ-ated tabulations.
The configuration for support of the mission operations will bereferred to as the Payload Operations' Support Center (POSC).
5-1
5.1.2 DRS Requirements. The DRS will be required to accept andreformat the recorded data from each of the experiments analyzedin Task I.
5.1.2.1 Input Requirements. The DRS will have the capability ofaccepting data that has been recorded on 14- or 32-track instru-mentation tape. These recorded tapes will have various formatsand track configurations, dependent on the particular experiment.
5.1.2.1.1 Instrumentation Interface. The instrumentation tapeinterface will be required to provide independent logic for eachtrack for detection of frame sync codes, accumulation of serialdata into computer words and control of data transfer to computermemory. Each track will have the capability to transfer dataasynchronously with respect to the other tracks. The interfacetracks will be input and output patchable to accommodate all pos-sible tape configurations and will have the following programmablecapabilities:
-"""• Accept pulse code modulation (PCM) or analog input
• Input storage buffers for address and word count, framelength, and frame buffer
• Pack 8-bit data bytes into one memory word to allow 2 bytes/16-bit word, 4 bytes/32-bit word, etc., to optimize memoryrequirements
• Synchronization code with maximum 32 bits and sync windowwidth
• Tape speed with variable 1-7/8 IPS to 120 IPS
• Analog sample rate and resolution
• Time search in forward or reverse direction.
Each track interface will be required to automatically perform thefollowing functions:
• Buffer switching
• Sync verification
5-2
• Reset and search when loss of sync occurs
• Initiate interrupts to the processor on buffer full anderror conditions
• Right justify data words prior to transfer to the computer.
5.1.2.1.2 Buffering Requirements. The DRS will be required todouble buffer all input data. Buffer sizes will vary by experi-ment, time tagging requirements, and processing time. Minimuminput buffer requirements are shown in table 5.1-1. As can beseen by the number of bytes required for buffering, the imagingsensors (EO-3 and EO-7/8) are the main drivers.
5.1.2.2 Reformatting Requirements. The reformatting require-ments are divided into either imagery or nonimagery.
5.1.2.2.1 Imagery Reformatting. The two experiments in thiscategory are EO-3 and EO-7/8.
A. EO-5, Multispectral Scanner. The serial input bit streammust be reformatted into a scan line by sensor format. Asis shown in figure 5.1-1, the data is recorded by sensorand band. A complete scan line cannot be retrieved untilthe last element is in the buffer.
The CCT output will consist of a 17 record data set foreach scan line and each band (reference figure 5.1-2).Each record is 3006 bytes in length. The first recordwill contain 1002 bytes of ancillary information whichwill contain the housekeeping data frame, annotation infor-mation, and data quality. The next 1002 bytes will be thescan line from sensor 1. The last 1002 bytes will be thescan line from sensor 2. The remaining 16 records of thedata set will also be 3006 bytes in length with eachrecord containing scan line data from three sensors.
B. EO-7/8, Imaging Radar. The 6-bit elements of the imagingradar data must be reformatted into 8-bit bytes with thesix data bits right-justified. The seven subframes of
5-3
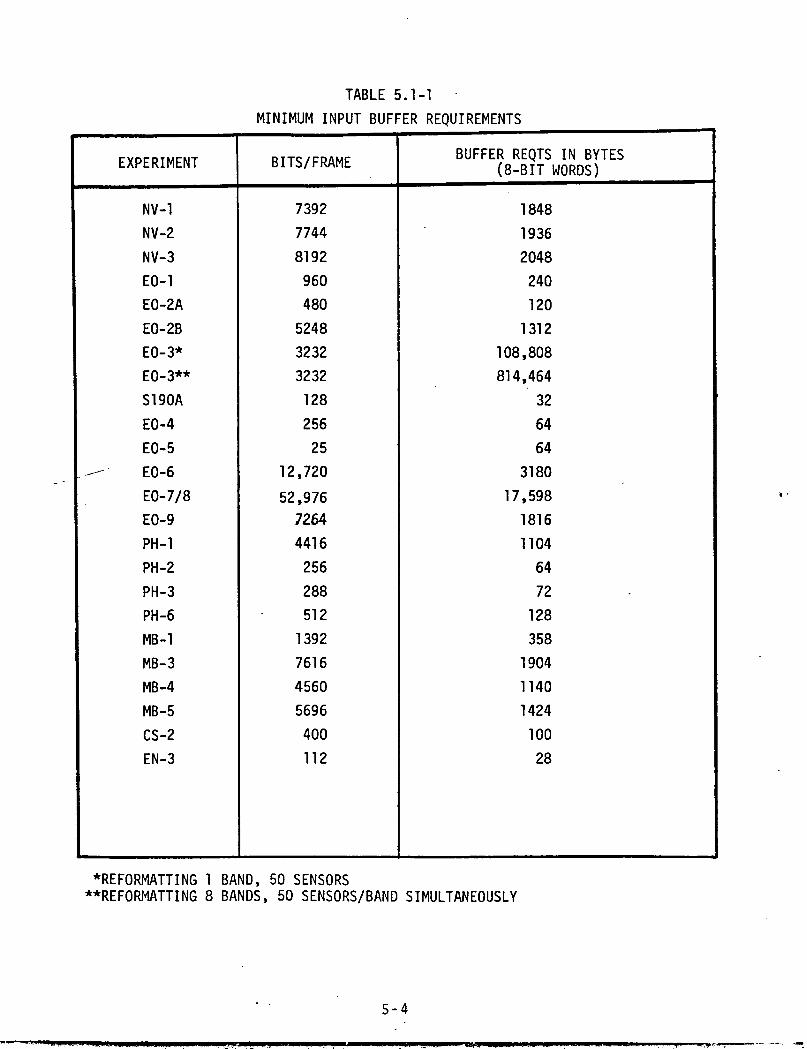
TABLE 5.1-1
MINIMUM INPUT BUFFER REQUIREMENTS
EXPERIMENT
NV-1
NV-2
NV-3
EO-1
EO-2A
EO-2B
EO-3*
EO-3**
S190A
EO-4
EO-5
_^-' EO-6
EO-7/8
EO-9
PH-1
PH-2
PH-3
PH-6
MB-1
MB- 3
MB-4
MB-5
CS-2
EN-3
BITS/FRAME
7392
7744
8192
960
480
5248
3232
3232
128
256
25
12,720
52,976
7264
4416
256
288
512
1392
7616
4560
5696
400
112
BUFFER REQTS IN BYTES(8-BIT WORDS)
1848
1936
2048
240
120
1312
108,808
814,464
32
64
64
3180
17,598
1816
1104
64
72
128
358
1904
1140
1424
100
28
*REFORMATTIN6 1 BAND, 50 SENSORS**REFORMATTING 8 BANDS, 50 SENSORS/BAND SIMULTANEOUSLY
5-4

8 BANDS
DATA OUTPUT BY SCAN LINEAND BY BAND
I ,
DATA RECORDEDBY SENSOR ANDBY BAND
Figure 5.1-1 Reformatting Process for EO-3
5-5
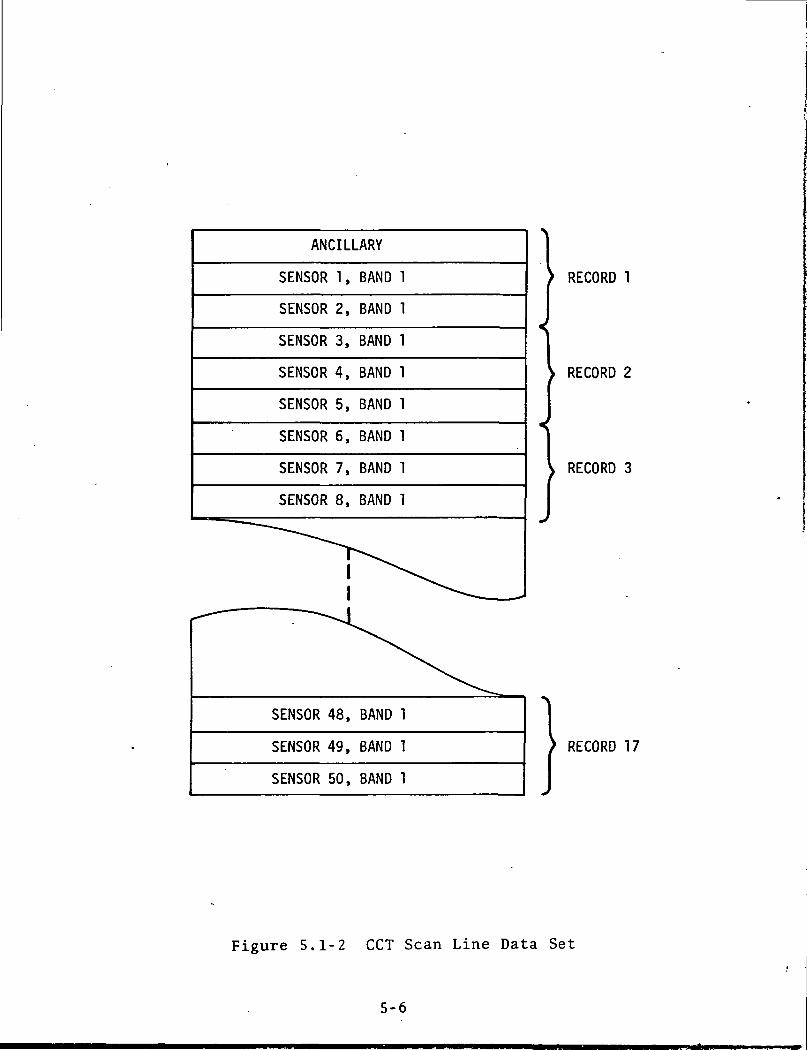
ANCILLARY
SENSOR 1, BAND 1
SENSOR 2, BAND 1
SENSOR 3, BAND 1
SENSOR 4, BAND 1
SENSOR 5, BAND 1
SENSOR 6, BAND 1
SENSOR 7, BAND 1
SENSOR 8, BAND 1
SENSOR 48, BAND 1
SENSOR 49, BAND 1
SENSOR 50, BAND 1
1 RECORD 1
RECORD 2
RECORD 3
RECORD 17
Figure 5.1-2 CCT Scan Line Data Set
5-6
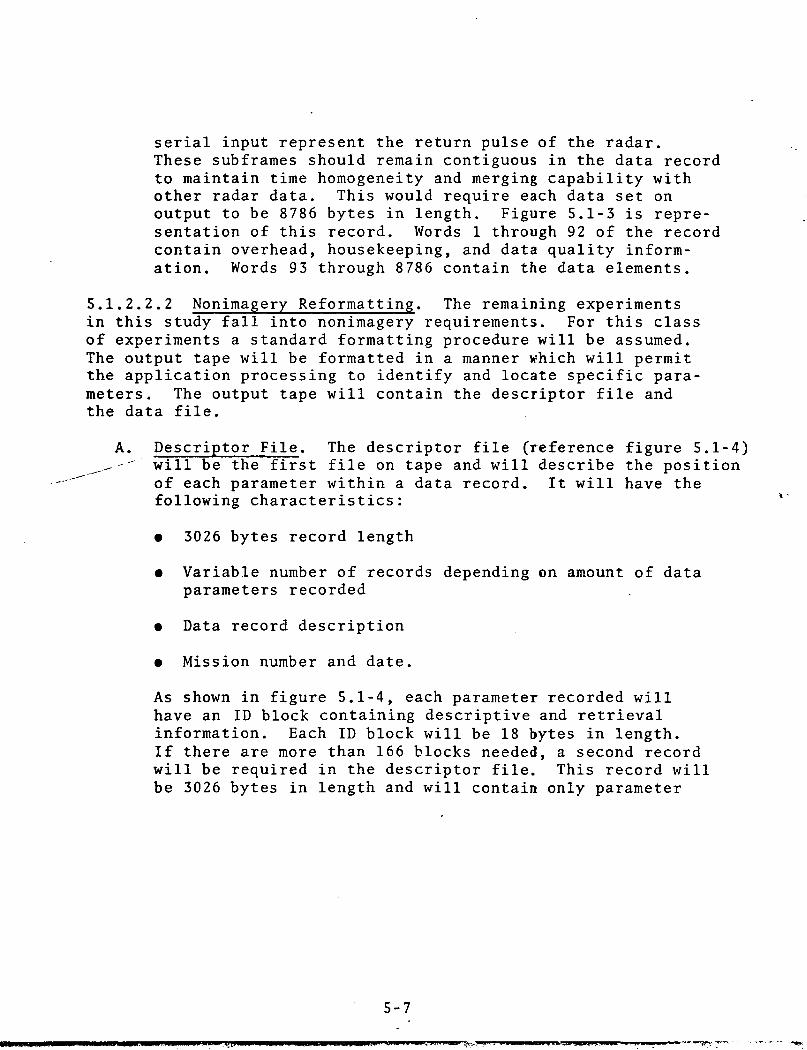
serial input represent the return pulse of the radar.These subframes should remain contiguous in the data recordto maintain time homogeneity and merging capability withother radar data. This would require each data set onoutput to be 8786 bytes in length. Figure 5.1-3 is repre-sentation of this record. Words 1 through 92 of the recordcontain overhead, housekeeping, and data quality inform-ation. Words 93 through 8786 contain the data elements.
5.1.2.2.2 Nonimagery Reformatting. The remaining experimentsin this study fall into nonimagery requirements. For this classof experiments a standard formatting procedure will be assumed.The output tape will be formatted in a manner which will permitthe application processing to identify and locate specific para-meters. The output tape will contain the descriptor file andthe data file.
A. Descriptor File. The descriptor file (reference figure 5.1-4)_^,_^-"' will be the first file on tape and will describe the position
of each parameter within a data record. It will have thefollowing characteristics:
• 3026 bytes record length
• Variable number of records depending on amount of dataparameters recorded
• Data record description
• Mission number and date.
As shown in figure 5.1-4, each parameter recorded willhave an ID block containing descriptive and retrievalinformation. Each ID block will be 18 bytes in length.If there are more than 166 blocks needed, a second recordwill be required in the descriptor file. This record willbe 3026 bytes in length and will contain only parameter
5-7
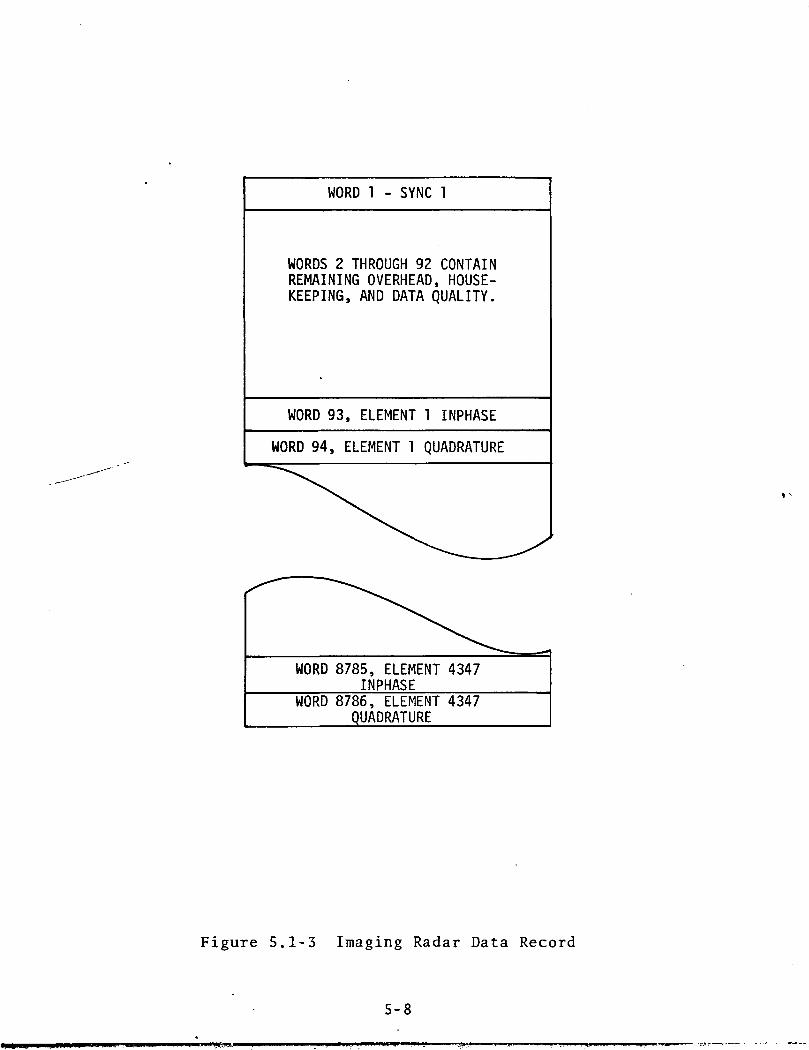
WORD 1 - SYNC 1
WORDS 2 THROUGH 92 CONTAINREMAINING OVERHEAD, HOUSE-KEEPING, AND DATA QUALITY.
WORD 93, ELEMENT 1 INPHASE
WORD 94, ELEMENT 1 QUADRATURE
WORD 8785, ELEMENT 4347INPHASE
WORD 8786, ELEMENT 4347QUADRATURE
Figure 5.1-3 Imaging Radar Data Record
5-8

BYTE NO.
1-89-14
15-1617-1819-2021-2223-2425-2627-2829-3637-3839-4041-4243444546
FILE IDMISSION DATEMISSION NUMBERFORMAT NUMBERFRAMES/RECORDFRAME LENGTHRECORD LENGTH IN BYTESRECORD SPEEDBITS/SECONDPARAMETER IDPARAMETER POSITIONFIRST FRAME ADDRESSPARAMETER INCREMENTNUMBER OF BITSLSBFIELD LENGTHSAMPLES/RECORD
> ID BLOCK NO. 1
2999-30063007-30083009-30103011-30123013301430153016
3017-3026
PARAMETER IDPARAMETER POSITIONFIRST FRAME ADDRESSPARAMETER INCREMENTNUMBER OF BITSLSBFIELD LENGTHSAMPLES/RECORDFILL ZEROIRG OR EOF
> ID BLOCK NO. 166
Figure 5.1-4 Descriptor File
5-9

ID blocks. The descriptor file will consist of the follow-ing:
• File ID - Eight character identification
• Mission Date - Launch date (month, day, year)
• Mission Number - ATL mission number
• Format Number - Format identification (experiment unique)
• Frames/Record - Number of data frames in data record
• Frame Length - Data frame length in bytes
• Record Length - Data record length in bytes
• Record Speed - Tape speed which data was recorded
• Bits/Second - Data rate in bits/second
• Parameter ID - Eight character identification
• Parameter Position - Byte position of the data field
• First Frame Address - Frame number in which this para-meter first appears
• Parameter Increment - Byte count or frame count betweensamples
• Number of Bit^s - Bit length of sample
• LSB - Least significant bit within data field
• Field Length - 8, 16, 24, 32, etc. bits
• Samples/Record - Number of samples of this parameterwithin a data record.
5-10
B. Data File. The data file will be made up of binaryrecords of parameter values. The minimum record lengthwill be 3000 bytes and the maximum 3872 bytes. Table5.1-2 depicts record lengths and number of frames perrecord for each experiment. For the purpose of thisreport, it was assumed that all data on the instrumen-tation tape would be converted to CCT.
Figure 5.1-5 represents an EO-4 pulse code modulation(PCM) frame on CCT. The data words are 9 bits in lengthwhile the overhead words are 8 bits in length.
5.1.2.3 Data Quality Requirements. The DRS will be required tomonitor data lock on all tracks of the instrumentation input tapeand report to the operator in real time when a sync loss occurs.It will provide the capability for output to oscillograph recordersfor additional data quality checks and quick-look processing. Fig-ure 5.1-6 depicts a functional diagram of the DRS.
The CCT output will be monitored for error conditions. Any errorwhich might prohibit further processing will be reported in realtime to the operator.
On completion of each reformatting process, a data quality reportwill be generated. This report will contain the following inform-ation:
• All operator commands
• Instrumentation tape status consisting of loss of lock andtape time by track, number of data frames processed, andnumber of data frames lost
• CCT status with parity errors by reel
• All system messages generated during processing.
5.1.3 POSC Requirements. The purpose of the LRC POSC is toprovide a focal point or central facility through which LRC ATLpayload operations support is conducted. It is assumed that the
5-11
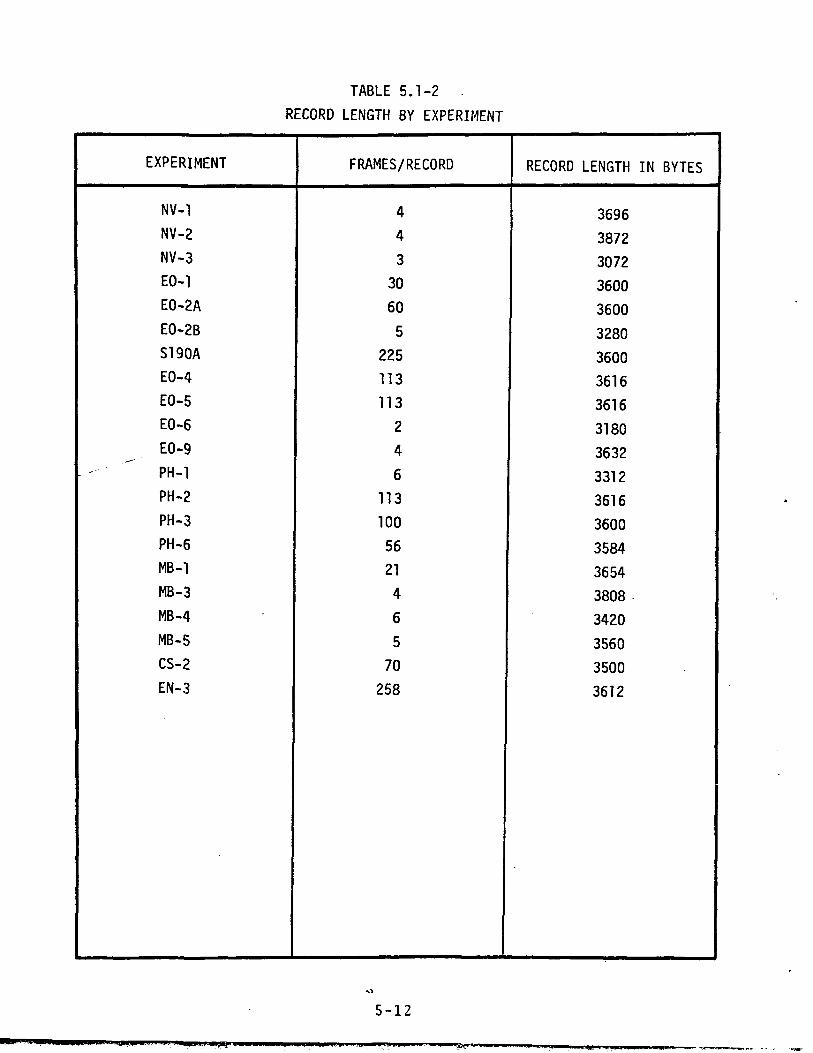
TABLE 5.1-2 .
RECORD LENGTH BY EXPERIMENT
EXPERIMENT
NV-1
NV-2
NV-3EO-1
EO-2A
EO-2B
S190AEO-4
EO-5EO-6
EO-9- ^ PH-1
PH-2
PH-3PH-6MB-1
MB-3
MB-4
MB-5CS-2
EN-3
FRAMES/ RE CORD
44
330
60
5
225113113
2
4
6
113
1005621
4
6
5
70
258
RECORD LENGTH IN BYTES
369638723072
3600
3600
3280
36003616
3616
31803632
3312
3616
36003584
36543808
3420
35603500
3612
5-12
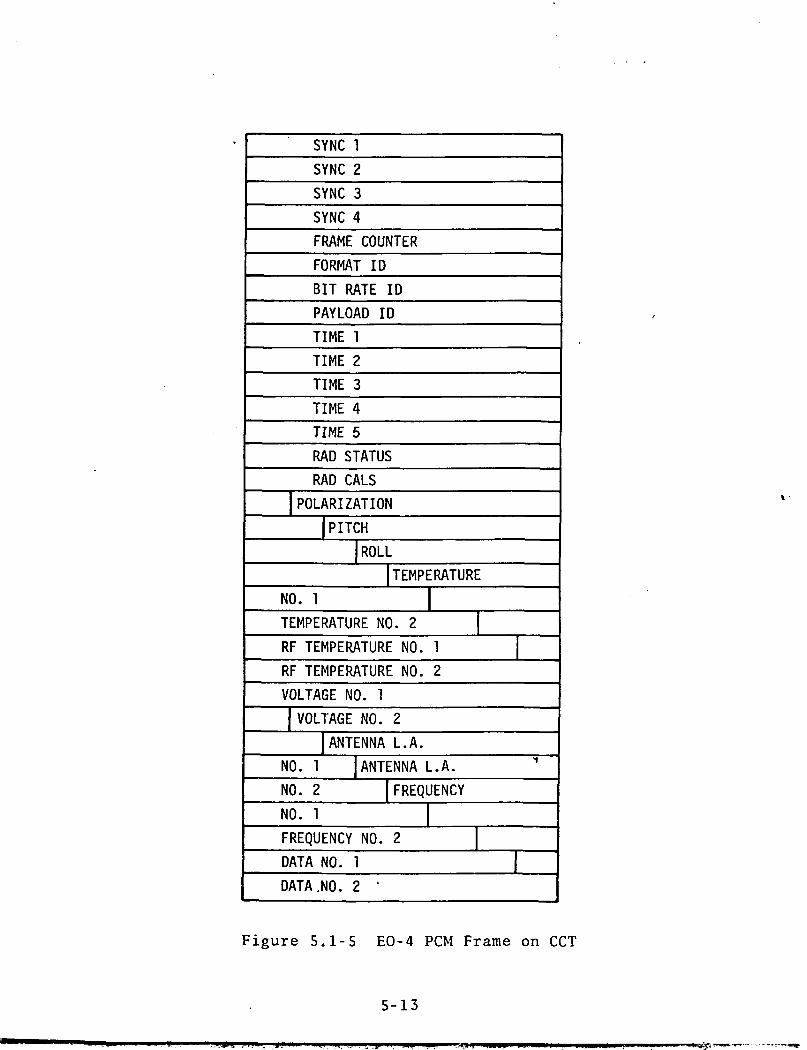
SYNC 1
SYNC 2
SYNC 3
SYNC 4
FRAME COUNTER
FORMAT ID
BIT RATE ID
PAYLOAD ID
TIME 1
TIME 2
TIME 3
TIME 4
TIME 5
RAD STATUS
RAD CALS
POLARIZATION
PITCH
ROLL
TEMPERATURE
NO. 1
TEMPERATURE NO. 2
RF TEMPERATURE NO. 1
RF TEMPERATURE NO. 2
VOLTAGE NO. 1
VOLTAGE NO. 2
ANTENNA L.A.
NO. 1 ANTENNA L.A.
NO. 2 FREQUENCY
NO. 1
FREQUENCY NO. 2
DATA NO. 1
DATA .NO. 2
Figure 5.1-5 EO-4 PCM Frame on CCT
5-13

o: oo z
o oCO LUo o:
ia:o
_l CO< coa: LUi- oz oLU a:o a.
oa:
oo
OO
s£0?Q
oct:
oo
rtCO
•H-PO
cnpe!Q
inLU U_ < O
I Od00•H
oa:
oo
<I—<
oa:
oo
<Q
5-14
ATL mission will be controlled from the MCC-H by LRC flightcontrollers and that the POSC will function in support of theATL mission through interfaces with JSC. In this capacity, themajor functions of the POSC are payloads management and contingencyanalysis.
LRC personnel could perform all necessary flight operations supportat JSC but the POSC will provide support to the principal investi-gators and operations personnel. Experiment and mission perform-ance can be monitored through the POSC.
5.1.3.1 Functions. The POSC will provide for real-time supportduring ATL missions. In addition, limited support will be requiredto retrieve postflight data, to participate in crew and missionsimulations, and to participate in active vehicle ground tests.The POSC will function primarily in a support role and will providethe following services:
• Permit ground-based user personnel to interface with onboard••""" experiment operators and to interact with their experiments
• Provide ground-based personnel with mission data for evalu-ation and mission input
• Manage onboard payload functions and operations
• Perform contingency analysis/
^9 Perform payload activities rescheduling.
5.1.3.2 Data Categories. To perform the POSC functions listedin paragraph 5.1.3.1, several categories of data will be required.Six categories of data that have been identified are voice, telem-etry, trajectory, command, video, and a category containing miscel-laneous data.
A- Voice. Voice communications will be required with the on-board experiment operators and with the mission operations
5-15
personnel at MCC-H. The following types of voice channelsmust interface with the POSC:
• Air/ground (A/G) channel with onboard experiment opera-tors*
• Channel with the payload officer in the Flight ControlRoom at JSC*'
• Channel with the multipurpose support rooms at JSC*
• Channel with the Master Operations Planning Room at JSC*
• Channel with the Flight Director at JSC**
• Operations status channel**
• Network channel.*
B. Telemetry. Telemetry data will be required at the POSC sothe ground personnel will have mission data for evaluationand mission input. The telemetry data will include space-lab systems data, experiment equipment data, and Shuttlesystems data.
C. Trajectory. Trajectory data will be required for .deter-mining the position and attitude of the space vehicle. Thisdata will consist of tracking data and guidance/navigationdata. The trajectory data will provide a basis for generat-ing orbit ephemeris, maneuver profiles, and experiment/crewtimelines. In addition, site coverage times, sunrise/sunsettimes, and communication coverage times will be obtainedfrom this data.
D. Command. The MCC-H will have command responsibility forall Orbiter and payload commands. It is intended for LRCpersonnel at JSC to do ATL command; however, limited com-mand capability should exist at the POSC for cases ofspecialized experiment management and contingency situa-tions. In any event, all commands will be routed via JSC.
*Dual voice channel (task and monitor)**0ne-way voice channel (monitor only)
5-16
ATL commands are required for experiment equipment and datatake operations. Typical functions to be performed by com-mands include on/off experiment control, pointing control,data acquisition control, and operating mode selection.Commands to perform these functions may be single commandsor multicommands (command loads).
E. Video. Video data will provide a visual record of bothexperiment equipment operations and of scientific data.This data will allow the ground-based personnel to betterevaluate the experiment functions being performed by thecrew and will allow for more timely mission inputs. Visualscientific data will provide a quick-look capability wherebythe quality and sufficiency of experiment output data canbe determined. Video data will aid in performing real-timepayload activities rescheduling.
F. Miscellaneous. This category will contain data which does- not specifically fall in any of the previous categories
and which could better be handled in a general category.The majority of this data will be supportive type datawhich has been generated from other data sources. It willbe used for mission operations, ground-control system opera-tions, contingency analysis, activities planning, etc.Types of data to be included in this category are as fol-lows :
• Command histories
• Data logs
• Status/verification messages
• Environmental data consisting of meterological and spaceenvironment
• Simulation/training data
• Consumable usage.
5-17
5.1.3.3 Data Link Estimates. An estimates of the data link capa-bilities that will be required to support the data categories des-cribed in paragraph 5.1.3.2 is as follows.
A. Voice. It is estimated that one full duplex voice channelwill be required for air/ground science communications.This channel may be either digital or analog. If the voicechannel is kept in the original uplink/downlink form, itwill be 32 kb/s digital.
Four full duplex voice channels will be required for POSC/JSC mission operations and coordination functions. Inaddition, two monitor channels will be required. Thesechannels may be either analog or digital.
B. Telemetry. An estimate of the required telemetry data islisted as follows:
.-—•"'• Spacelab systems data up to 5 kb/s
• Experiment equipment data up to 20 kb/s
• Shuttle system data up to 5 kb/s.
C. Trajectory. The trajectory data loading is estimated tobe up to 5 kb/s. This will include ground station generatedtracking data and JSC generated data.
D. Command. Uplink command capability of up to 8 kb/s is esti-mated for payload commands.
E. Video. One 4 MHz bandwidth analog channel is required forvideo data.
F. Miscellaneous. It is estimated that a 5 kb/s rate will besufficient to handle the miscellaneous data as outlined inparagraph 5.1.3.2,F.
5.1.3.4 Data Interfaces. An overview of the typical data inter-faces for the NASA Space Transportation System flights is illus-trated in figure 5.1-7. The POSC could have data links with the
5-18

0•H
0
o0)Ort
0•P
•PcdQ
LO
5-19

Goddard Space Flight Center (GSFC), the Tracking Data Relay Satel-lite System (TDRSS) receiving station, the launch facility, andthe landing facility. The requirements for each link will dependon the POSC operations philosophy as defined by LRC.
5.1.3.5 Support Classifications. The degree of support providedby the POSC can vary from voice only support to a complete sup-port capability required for the coordination and control of allpayload operations. This degree of support will affect both thecomplexity and cost of the POSC. To provide a basis for identify-ing support capabilities, the following support classifications(utilizing the previously discussed data categories) have beendefined:
• Class I - Voice
• Class II - Voice and video
^,. • Class III - Voice, telemetry, and miscellaneous
• Class IV - Voice, video, telemetry, and miscellaneous
• Class V - Voice, telemetry, trajectory, command, video, andmiscellaneous.
5-20

5.2 SUBTASK 2.2, PERFORMANCE REQUIREMENTS
The purpose of this subtask was to establish the performance re-quirements of the Langley Research Center Data Management System(LRCDMS). Determination of these requirements consisted ofanalysis of data volumes and processing cycles.
The performance requirements are based, by direction of LRC,on one ATL flight per year. The experiment groupings for fiveATL payloads were provided by LRC. These groupings, along withdata volumes, are shown in tables 5.2-1 thru 5.2-5.
The major areas of support for the LRCDMS are integration andcheckout, mission operations, and postflight processing. As shownin the functional requirements document, there are the followingtwo main system configurations:
• .Data Reformatting System (DRS) consisting of 1) integration„-—- and checkout and 2) postflight processing
• Payload Operations Support Center (POSC) consisting ofmission operations.
5.2.1 DRS Throughput Requirements. The driving requirement forthroughput of the DRS is EO-7/8. Playback of the instrumentationrecording at minimum speed produces a throughput rate of-nearly2 megabits per second (Mb/s). EO-7/8 is recorded using fourrecorders simultaneously. Each recorder is handling 115,593,632bits per second (b/s) at a speed of 120 inches per second (I/S).The minimum playback speed of the recorder is 1-7/8 I/S. Thisplayback rate produces a throughput rate of 1,806,150 b/s. Thisis equivalent to a reduction of 64:1 in playback versus recordingspeed. This means that for every one second of data acquisition,64 seconds will be required to reformat the data. Using thesefigures total processing time can be calculated as shown below.
Mission acquisition time for EO-7/8 = 1.25 hoursOne recorder reduced 64:1 = 64 x 1.25 = 80 hoursFour recorders = 4 x 80 hours = 320 hours
5-21
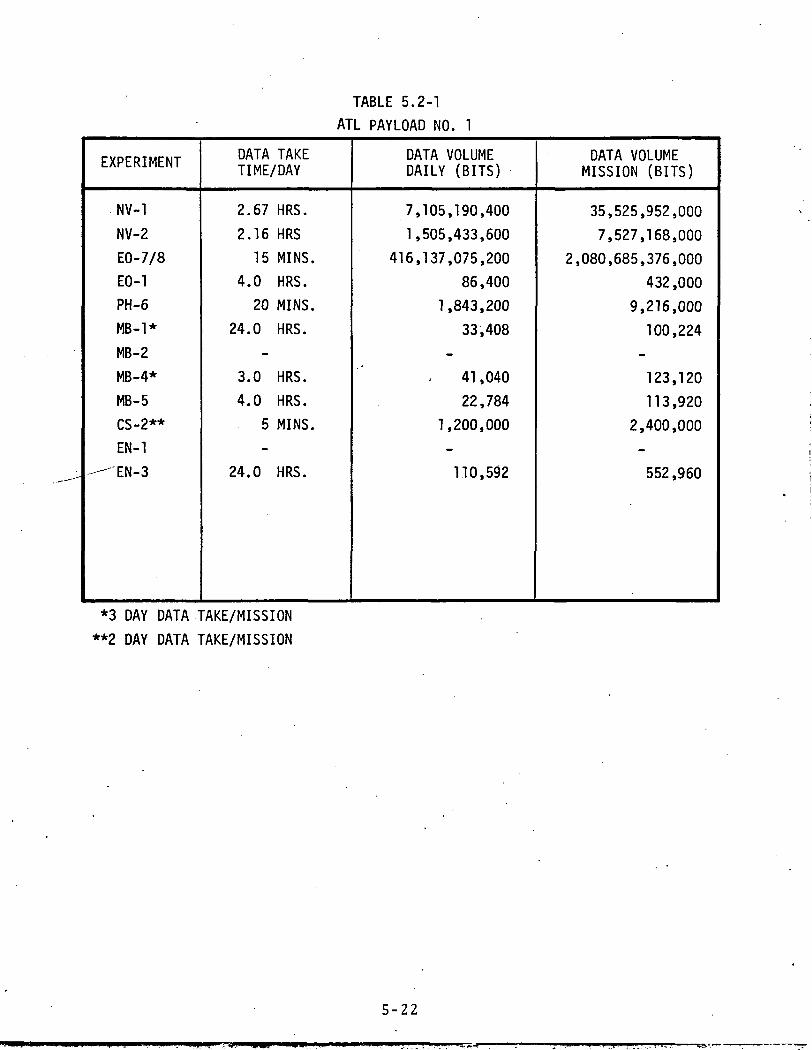
TABLE 5.2-1ATL PAYLOAD NO. 1
EXPERIMENT
NV-1
NV-2EO-7/8
EO-1PH-6MB-1*
MB-2
MB-4*
MB-5
CS-2**EN-1
-^EN-3
DATA TAKETIME/DAY
2.67 MRS.
2.16 MRS
15 MINS.4.0 HRS.
20 MINS.24.0 HRS.
-
3.0 HRS.
4.0 HRS.5 MINS.-
24.0 HRS.
DATA VOLUMEDAILY (BITS)
7,105,190,400
1,505,433,600
416,137,075,20086,400
1,843,200
33,408-
41,040
22,7841,200,000-
110,592
DATA VOLUMEMISSION (BITS)
35,525,952,000
7,527,168,0002,080,685,376,000
432,000
9,216,000
100,224-
123,120113,920
2,400,000-
552,960
*3 DAY DATA TAKE/MISSION
**2 DAY DATA TAKE/MISSION
5-22

TABLE 5.2-2ATL PAYLOAD NO. 2
EXPERIMENT
EO-5
NV-3
EO-9
EO-2
PH-2*
PH-3
MB-1**
MB-3**
EN-1
DATA TAKETIME/DAY
2.67 HRS.
.5 HRS.
2.0 HRS.
16.0 HRS.
80 MINS.
30 MINS.
24.0 HRS.
1.0 HR.
DATA VOLUMEDAILY (BITS)
368,640
6,370,099,200
523,008,000
618,393,600
12,288,000
33,177,600
33,408
7,616
DATA VOLUMEMISSION (BITS)
1,843,200
31,850,496,000
2,615,040,000
3,091,968,000
12,288,000
165,888,000
100,224
22,848
*1 DAY DATA TAKE/MISSION**3 DAY DATA TAKE/MISSION
5-23
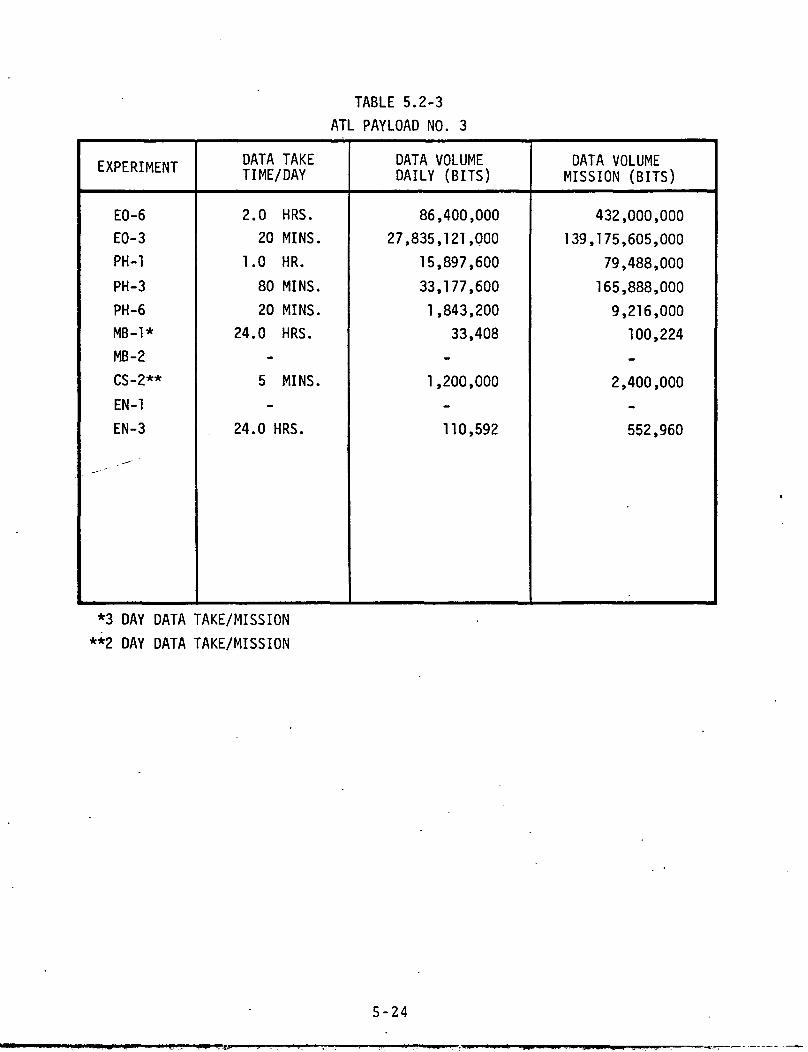
TABLE 5.2-3ATL PAYLOAD NO. 3
EXPERIMENT
EO-6EO-3PH-1
PH-3PH-6MB-1*MB -2CS-2**
EN-1EN-3
DATA TAKETIME/ DAY
2.0 MRS.20 MINS.
1.0 HR.
80 MINS.
20 MINS.24.0 MRS.
-
5 MINS.-
24.0 HRS.
DATA VOLUMEDAILY (BITS)
86,400,00027,835,121,000
15,897,600
33,177,600
1,843,20033,408-
1,200,000-
110,592
DATA VOLUMEMISSION (BITS)
432,000,000139,175,605,000
79,488,000
165,888,0009,216,000100,224-
2,400,000-
552,960
*3 DAY DATA TAKE/MISSION
**2 DAY DATA TAKE/MISSION
5-24
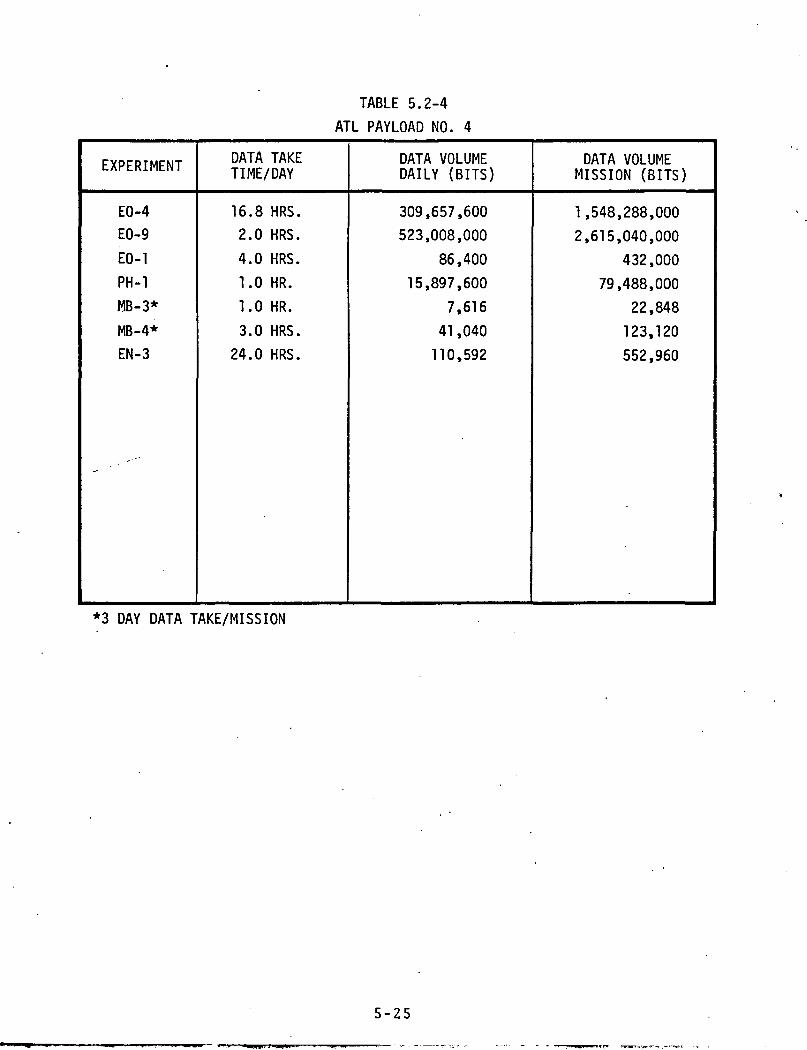
TABLE 5.2-4
ATL PAYLOAD NO. 4
EXPERIMENT
EO-4
EO-9
EO-1
PH-1
MB-3*
MB-4*
EN-3
DATA TAKETIME/DAY
16.8 HRS.
2.0 HRS.
4.0 HRS.
1.0 HR.
1.0 HR.
3.0 HRS.
24.0 HRS.
DATA VOLUMEDAILY (BITS)
309,657,600
523,008,000
86,400
15,897,600
7,616
41 ,040
110,592
DATA VOLUMEMISSION (BITS)
1,548,288,000
2,615,040,000
432,000
79,488,000
22,848
123,120
552,960
*3 DAY DATA TAKE/MISSION
5-25

TABLE 5.2-5
PALLET ONLY PAYLOAD
EXPERIMENT
NV-1NV-2
EO-7/8
EO-1
PH-6
EN-1EN-3
EO-4
PH-2*
DATA TAKETIME/DAY
2.67 MRS.2.16 MRS.
15 MINS.4.0 HRS.
20 MINS.-
24.0 HRS.
16.8 HRS.
80 MINS.
DATA VOLUMEDAILY (BITS)
7,105,190,4001,505,433,600
416,137,075,200
84,400
1,843,200-
110,592
309,657,600
12,288,000
DATA VOLUMEMISSION (BITS)
35,525,952,0007,527,168,000
2,080,685,376,000
432,000
9,216,000-
552,960
1 ,548,288,00012,288,000
*1 DAY DATA TAKE/MISSION
5-26

This calculation shows 320 hours of processing time will berequired to reformat the data from one ATL mission for EO-7/8.Achieving a 2 megabit throughput rate will allow most experi-ments to be processed at a minimum ratio of 1:1. Several willbe capable of being processed at a higher playback rate than theywere recorded.
Table 5.2-6 depicts the processing time for each experiment basedon data acquisition time and playback reduction. Any experimentwhich did not require a reduction in playback speed was assumedto be processed at a 1:1 ratio. Using the processing times shownin this table, the total processing time for reformatting eachpayload grouping can be calculated. The hours shown below arefor actual processing of one pass only. They do not include anyset up or rerun time.
ATL No. 1 587 HoursATL No. 2 197 Hours
^-^ ATL No. 3 242 HoursATL No. 4 251 HoursPallet only 571 Hours
5.2.2 DRS Computational Requirements. The DRS computationalrequirements involve decommutation, verification, and recordingof the experiment data. These items must be performed in areal-time mode since the instrumentation tapes cannot be stoppedand restarted in a fashion similar to digital tapes. For calcu-lating the computational requirements the following numbers ofinstructions/byte were used.
Decommutation and Verification - 25Recording - 3
TOTAL 28
Table 5.2-7 shows the number of computations required per secondby experiment based on the playback rates defined in table 5.2-6.
5-27
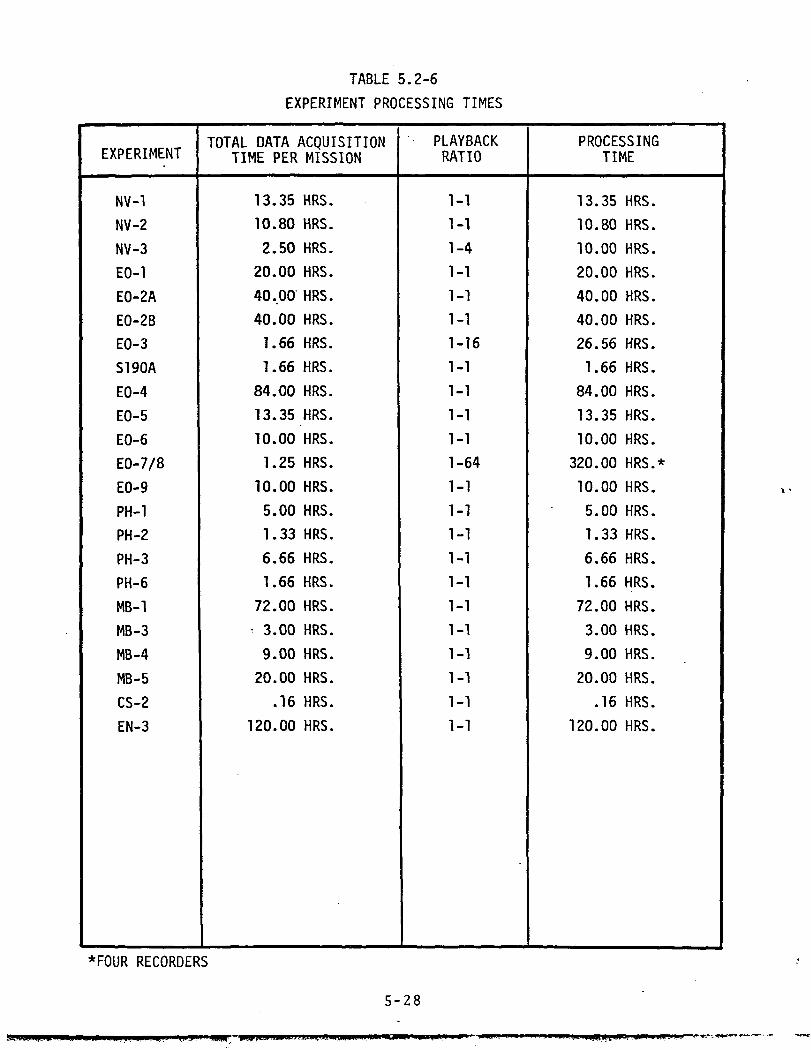
TABLE 5.2-6
EXPERIMENT PROCESSING TIMES
EXPERIMENT
NV-1
NV-2
NV-3
EO-1
EO-2A
EO-2B
EO-3
S190A
EO-4
EO-5
EO-6
EO-7/8
EO-9
PH-1
PH-2
PH-3
PH-6
MB-1
MB-3
MB-4
MB-5
CS-2
EN-3
TOTAL DATA ACQUISITIONTIME PER MISSION
13.35 HRS.
10.80 HRS.
2.50 HRS.
20.00 HRS.
40.00 HRS.
40.00 HRS.
1.66 HRS.
1.66 HRS.
84.00 HRS.
13.35 HRS.
10.00 HRS.
1.25 HRS.
10.00 HRS.
5.00 HRS.
1.33 HRS.
6.66 HRS.
1.66 HRS.
72.00 HRS.
- 3.00 HRS.
9.00 HRS.
20.00 HRS.
.16 HRS.
120.00 HRS.
PLAYBACKRATIO
1-1
1-1
1-4
1-1
1-1
1-1
1-16
1-1
1-1
1-1
1-1
1-64
1-1
1-1
1-1
1-1
1-1
1-1
1-1
1-1
1-1
1-1
1-1
PROCESSINGTIME
13.35 HRS.
10.80 HRS.
10.00 HRS.
20.00 HRS.
40.00 HRS.
40.00 HRS.
26.56 HRS.
1.66 HRS.
84.00 HRS.
13.35 HRS.
10.00 HRS.
320.00 HRS.*
10.00 HRS.
5.00 HRS.
1.33 HRS.
6.66 HRS.
1.66 HRS.
72.00 HRS.
3.00 HRS.
9.00 HRS.
20.00 HRS.
.16 HRS.
120.00 HRS.
*FOUR RECORDERS
5-28
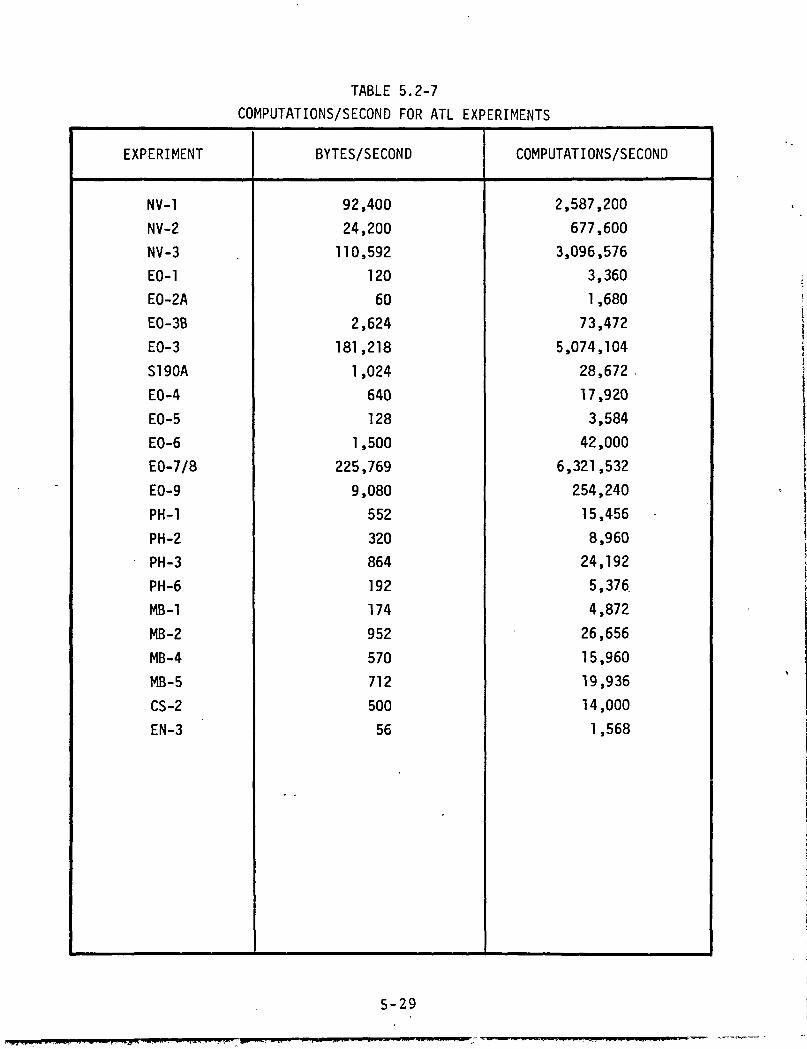
TABLE 5.2-7COMPUTATIONS/SECOND FOR ATL EXPERIMENTS
EXPERIMENT
NV-1NV-2
NV-3
EO-1EO-2AEO-3B
EO-3
S190A
EO-4
EO-5
EO-6EO-7/8
EO-9PH-1
PH-2
PH-3
PH-6MB-1
MB-2MB-4
MB-5
CS-2
EN-3
BYTES/SECOND
92,40024,200110,592
120
602,624
181,218
1,024
640128
1,500
225,769
9,080552
320864
192
174
952
570
712
500
56
COMPUTATIONS/SECOND
2,587,200
677,6003,096,576
3,360
1,68073,472
5,074,104
28,672
17,9203,584
42,0006,321,532
254,24015,456
8,96024,192
5,376.
4,872
26,656
15,960
19,936
14,0001,568
5-29

5.2.3 DRS Computer Compatible Tapes (CCT)• Based on generatingCCT's at 1600 characters per inch, table 5.2-8 depicts the numberof CCT's required per experiment.
5.2.4 POSC Support Requirements. The support provided by thePOSC can be divided into the following phases:
• Launch site tests
• Crew and mission simulations
• Premission operations
• Mission operations
• Postmission operations.
A summary of the support duration and the data categories required^during each of these support phases is presented in table 5.2-9.
During the 7-day mission operations phase, it is anticipated thatthe POSC will provide real-time support, 24 hours per day. Alldata categories will be required during this time. In addition,2 days of premission support and 2 days of postmission supportare also anticipated. However, this support will be limited inthat all categories of data will not be required. The voice,telemetry, command, and miscellaneous data categories will berequired for the premission operations period; whereas, voice,telemetry, and the miscellaneous data will be required for thepostmission operations period. These data categories will berequired on a 24 hour per day basis. This type of supportschedule will ensure that all premission activities are accom-plished, the experiment data collection is successfully completed,and all ATL related data is returned and stored at LRC.
In addition to the mission related operation activities, certaintests and simulations must-be supported by the POSC. It isestimated that the POSC will have to support four tests and
5-30
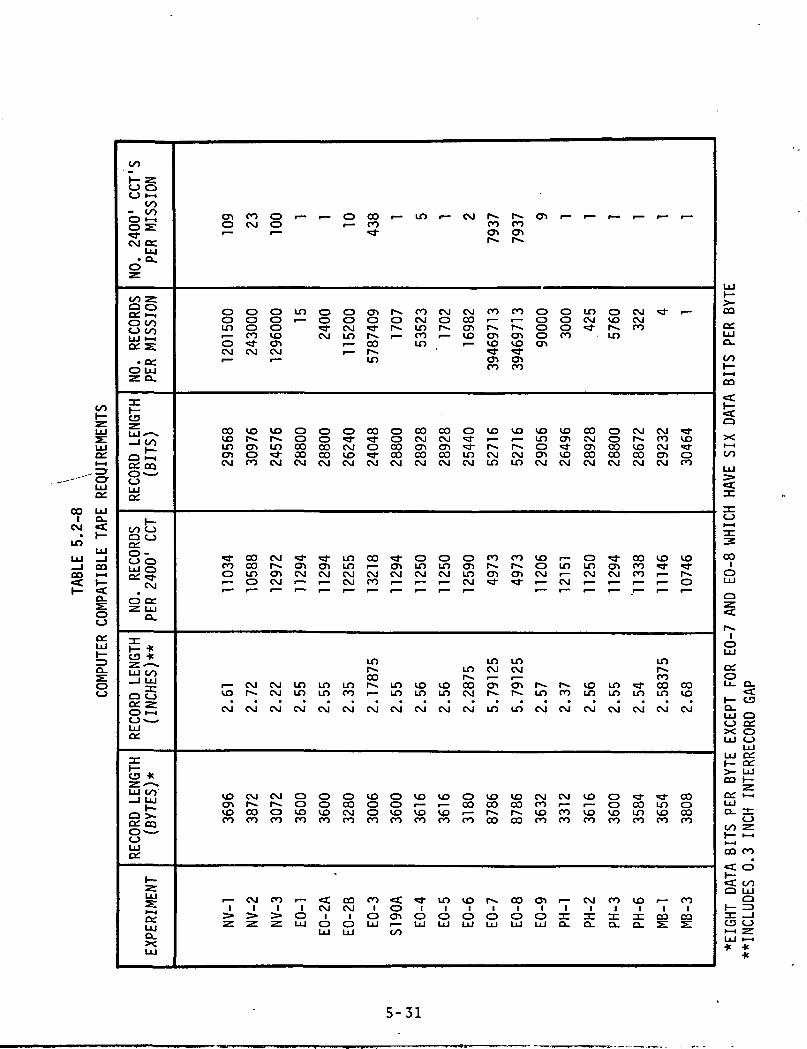
001—
LU
UJce:
--"" OrHi
ce:
GO ' * *1 Q.
CM «t• !•"•
LOLU
LU —1— 1 COCO t— «
o.0OJ
ce:LUi—f\
O
OO
i— z0 O<_> i— i
00- o oo •-«5CM CC
o
00 ZQ O
O OOO OOi 1 1 h~JUJ ^™*rv 3£
itV
O UJ2: ex
:rG3
UJ «*""«*
^^ 11
^•^ ' ~
ce: CQO^— '0LU
OO C_>Q 0ce:O-<_> 0LU Oce: ^~
CMo ceZ. LLJ
Q.
L_ .£O 4cZ *•"*•III/ s\UJ d J
— 1 LU
Q 5
f I—H
O»— *LUQ£
OC
0 *LU OO
1 III— J 1 1 J
_. r^
ce: CQ
LU
,_Z£UJ
^-5LU0_XLLJ
ro i—O CM Oi— i—
O O OO O OLO O Oi— CO VOo >a- enCM CM CM
CO VO VO<o r-» Is*LO en LOen CD ^~CM CO CM
^J- OO CMco oo r»-o LO eni— CD CM
r— CM CMvo r>~ CM
CM CM CM
VO CM CMcn r**« r**UD CO Oco co co
i— CM CO1 1 1
•z. z. z.
'
in^~
ooCOCOCM
CM
LOinCM
ooUDco
r—1oLU
*~ .
CD O0 0
r_
^^
0 0
00 CSJoo voCM CM
CM CMi— CM
LO LOLO CO
CM CM
O OO CO
CO CO
-
^C COCM CM
1 10 0LU LU
mCO^~
cn r-»o o
00 "~r*.LO
00 Ovj1 f™ ^^ CO*d- ooCM CM
CM CMCO i—
LOr-«.CO
r— LO
CM CM
VO O0 O
CO CO
co ^1 0
o cnLU i—
oo
*~ COcn"^
CO CM CM COCM O CO i—
LO i— <O^enco
CO OO O VOCM CM f ^—
cn cn ^^ r^^CO OO LO CMCM CM CM LO
CM CM LO cni— i— CM «*
LOLO CMr-. i —
LO LO CM r-»CM CM CM in
<o vo o vor- i— CO OO
CO CO CO CO
^- LO vo r**i i i i
O O O OLU LU LU LU
^^^cocn^
co
0?VO
^^cnco
VOr—f*s.
CMLO
cn«3-
LOCM
I*~
LO
VOOO
00
oo1oLU
fTl
O O0 OC^ ^^f^ COen
VO VOin cnCD ^^cn voCM CM
CM i—i— CM
r- r>»LO CO
CM CM
CM CMCO r—vo coco co
cn ^~i i
o :cLU Q.
LOCM
00CMcnCOCM
oLOCM•—
VOin
CM
VO
voCO
CM1
Q.
O CM *± i—VO CMr**. coLO
O CM CM •*O r^ co voCO VO CM ^~co co cn oCM CM CM CO
<* OO VO VOcn co ^~ ^CM CO r— fi— r— •— 0
LOp*
coLO "3- 00 OOLO LO LO VO
CM CM CM CM
O «d- -d- ooO CO LO OVO LO VO COco co co co
co vo ^~ cot i l lI 3C CQ CQ0 . 0 . ^ ^
1 1 1I—
co
LUo_00I—CO
Q
XI-H
oo1 1 1>
1
1— 1
CO1oLU
§1«£f»^
1oUJ
o£oLL. 0.
h~ CDO-1 1 1 /"^
cj ce:X OLU C_>
LULU ce:t- ce:>- LUCO t—
ce: t-iLU0- .
CJoo z
co co^C CD
<=C OOO LU
Q1— IDor —iC3 CJ•— i Z1,1 ^_^
* *-K
5-31
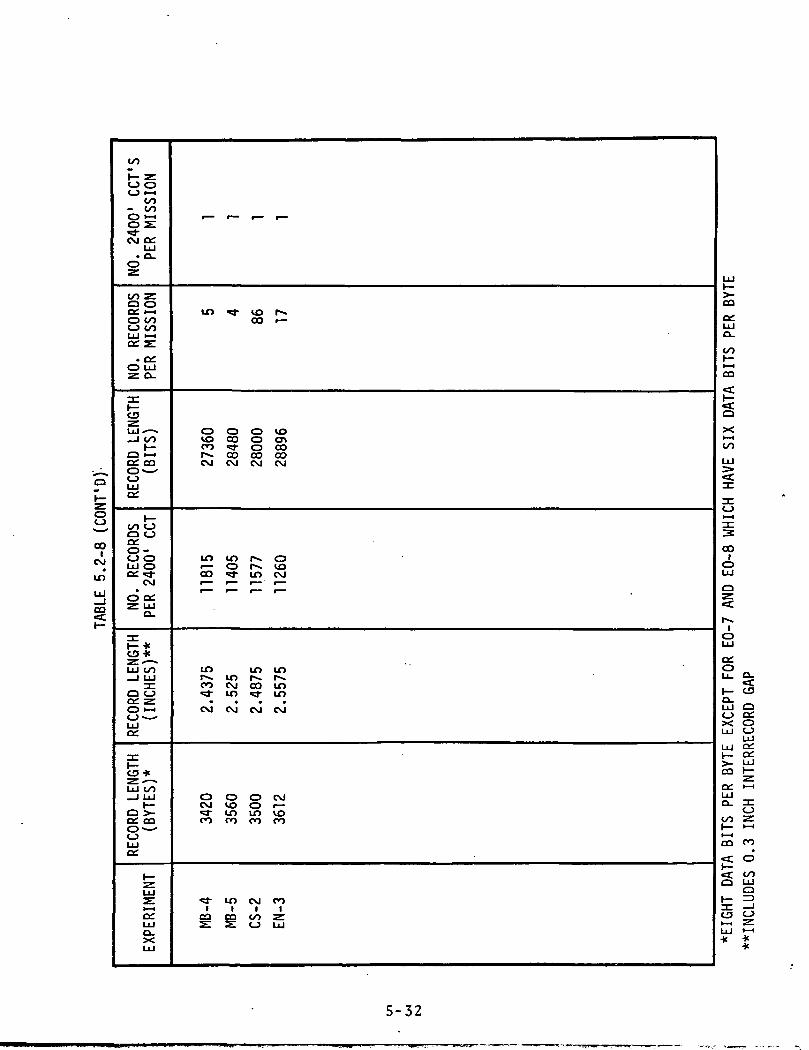
o"K-
O0^"' *00
CM•
LO
LO
CO
^
CO
h- Z<-> 0O 1-1
o *-•o 2:CM 0£.
IllU-l
• Q.oz
CO 2=0 0OH >-iO COO COLU I— ior s:
• o:O LUZ O-
3C
LU— »_l CO1—^3 •— '
1 1 1a:
i—CO <_Jo c_>
o-o o£3
CM
COQiZ LU
Q_
-,-
h-*
LU co_l LU
O C_Jrv ^yO •-<
LU
T*)__
LU CO_J LU
/™^ ^^a: cao —LUC£.
^UJ2:1— 1c:LUa.XLU
t— r— . .
LO sf vo r^00 •—
CD O CD VOva co o cnCO -53- O 00f**+ CO CO COCM CM CM CM
l£> lf> f*. Oi— o r~- voCO <5T LO CM
LO LO LOr**» LO ^* r*^CO CM OO LO*&• in *f if)CM CM CM CM
O O CD CMCM VO CD f—- LO LO VO
CO CO CO CO
*- LO CM CO1 1 1 1
CQ CQ CO Zs: s: o LU
LU
>ICQ
LUO.
CO1—i— iCQ
1—
0
X1— 4
CO
LU3>
^31
3
CO
CDLU
O
«*
r~.
oLU
§0.
H- CDCL.LU Oc_> oc.X 0LU O
LU1 i 1 Q£
I— o:>- LUCQ 1—
ct: >-"UJQ- 3=
V-Jco z1 — "— iCO CO
<c CD"<c coQ UJ
Q
t^ 3CD Oi— * ^-LU •— I
* *
5-32
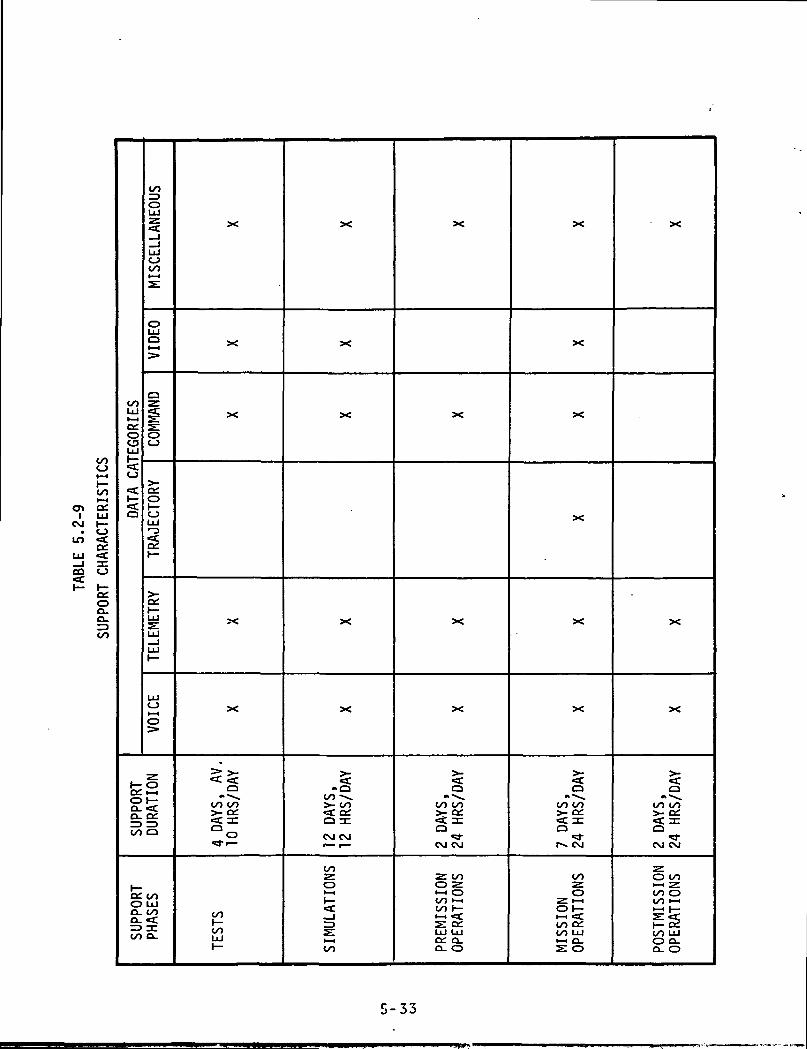
ooO
00
I UJCM t—. oin «e
CO O
oa.o.
00UI
ooUI
CJ
C£
1—a
CO_^
oll 1
1_JUIooot— •2:
0UIQ1— 1
oz2:0
o;sUI•-3
£UI2:UI_lUI>-
UloH-f
o
SUPP
ORT
DU
RAT
ION
L_
a: ooo uiQ. 00Q- «=C~™ ^— ' _1_CO CX.
X
X
X
X
X
•
i *rfo
oo oogs•=3-1—
001—ooUI1 —
X
X
X
X
X
.1OO -v»>- oo«« a:aa:CM CM
OO
Oi— i
•=£
2:1— COO
X
X
X
X
>-o
oo oo
CM CM
Z OO0 Z1-1 OOO >-ioo 1—2; BZUI UIo: a.Q- 0
X
X
X
X
X
X
ooo oo>- 01
~r» CM
ooz0
HH Coo a:oo uii— i D-2: o
X
X
X
>-o
oo oo>- a:oCM CM
zO 00I— i Z00 Ooo i— i•-! 1—
oo uiO 0.a- 0
5-33

12 simulations. The data categories required for this supportare voice, video, telemetry, command, and the miscellaneous data.An average of 10 hours of support is required for each pad testand each simulation will require approximately 12 hours of support,
A timeline illustrating the active support periods of the POSCis shown in figure 5.2-1. Although the ATL missions are base-lined as 7-day missions, POSC support will be required over a2 month period. Time that is not utilized for simulations willbe utilized to complete mission related hardware, and softwareconfiguration changes as required prior to the start of the pre-mission operations phase. These types of changes are missionpeculiar changes and are handled on a mission-to-mission basis.It should also be noted that two of the launch site tests occurduring the premission operations phase. During this time period,both phases must be supported simultaneously.
5-34
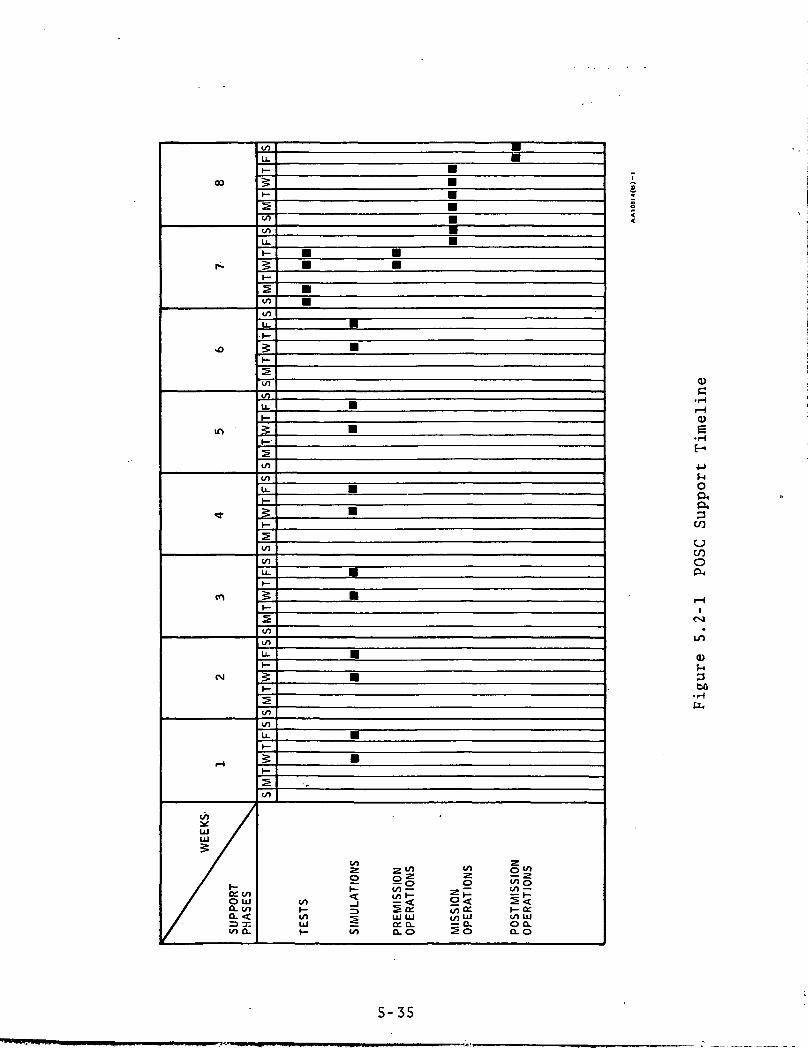
CO
CM
<U6•H
OP,P.3
C/D
C/DO
<S1•
tn
<u
3bO
•Htu
(/>zo
UJ UJa o.0.0
10 o
I- ceco ujo aa. o
5-35
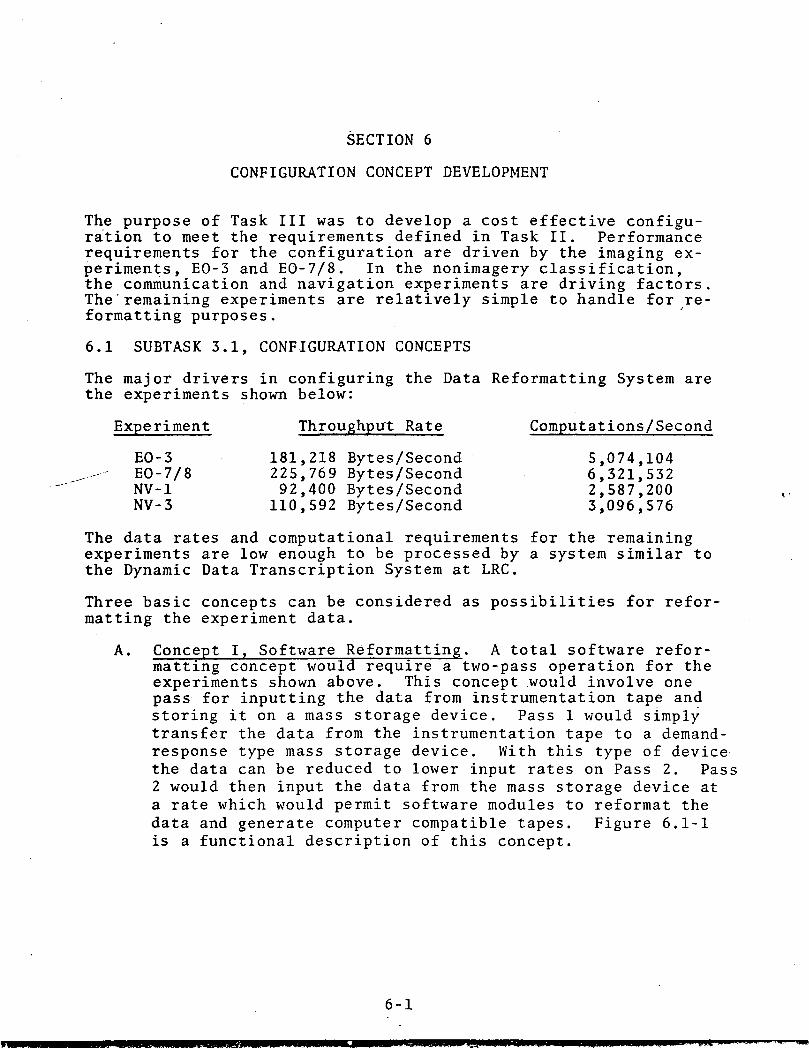
SECTION 6
CONFIGURATION CONCEPT DEVELOPMENT
The purpose of Task III was to develop a cost effective configu-ration to meet the requirements defined in Task II. Performancerequirements for the configuration are driven by the imaging ex-periments, EO-3 and EO-7/8. In the nonimagery classification,the communication and navigation experiments are driving factors.The"remaining experiments are relatively simple to handle for re-formatting purposes.
6.1 SUBTASK 3.1, CONFIGURATION CONCEPTS
The major drivers in configuring the Data Reformatting System arethe experiments shown below:
Experiment Throughput: Rate Computations/Second
EO-3 181,218 Bytes/Second 5,074,104--•- EO-7/8 225,769 Bytes/Second 6,321,532
NV-1 92,400 Bytes/Second 2,587,200NV-3 110,592 Bytes/Second 3,096,576
The data rates and computational requirements for the remainingexperiments are low enough to be processed by a system similar tothe Dynamic Data Transcription System at LRC.
Three basic concepts can be considered as possibilities for refor-matting the experiment data.
A. Concept I, Software Reformatting. A total software refor-matting concept would require a two-pass operation for theexperiments shown above. This concept .would involve onepass for inputting the data from instrumentation tape andstoring it on a mass storage device. Pass 1 would simplytransfer the data from the instrumentation tape to a demand-response type mass storage device. With this type of devicethe data can be reduced to lower input rates on Pass 2. Pass2 would then input the data from the mass storage device ata rate which would permit software modules to reformat thedata and generate computer compatible tapes. Figure 6.1-1is a functional description of this concept.
6-1

o:o
_i co< coo; uih- oz oLU o;O D-
oD.
OO
oa:
oo
oI-coCOCO
a.<
— zcoi—
oa:
oo
<I—<
oa:
oo
f<I-<
UIsa:h-co
COCO
£
o_ico< COo: LUi- ozoUJ 0£.00-
oooI-UJ
a:oi—CO
COCO
CsJ
COCO
ft0)otio
CJ
COa!Q
0)!H3bO
•Htu
6-2
B. Concept II, Hardware Reformatting. This concept would per-mit all experiments to be reformatted in a one-pass opera-tion. It would require a sophisticated instrumentationtape interface which could decommutate and reformat thedata from the experiments shown above. The hardware inter-face would contain 800K bytes of memory for reformattingEO-3. In addition, the interface would contain the for-matting logic required to assemble the serial input in thedesired output format to permit the data to be writtendirectly to CCT from the input buffers. This would reducethe time required by software reformatting. Figure 6.1-2is a functional description of this concept.
C. Concept III, Combined Concepts. This concept would provideone-pass processing for all experiments except EO-3. EO-3would be a two-pass operation due to the large amount ofbuffering which would be required for completing the re-formatting in one pass (814,464 bytes).
6-3
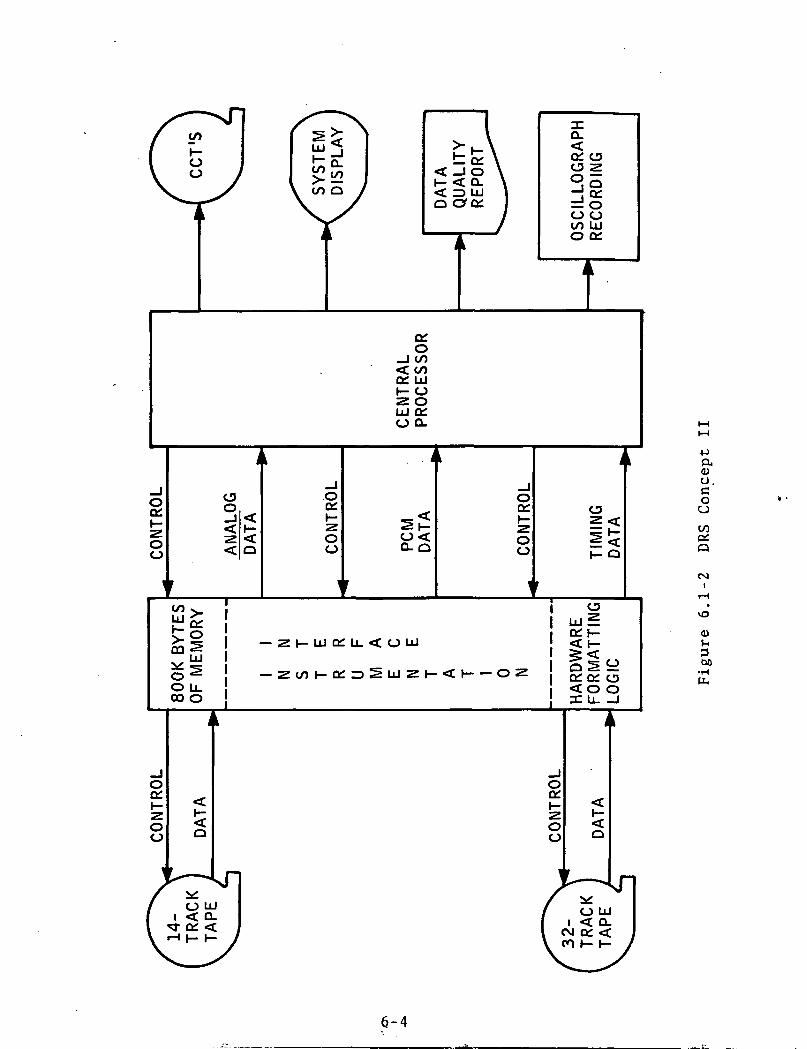
o:o
o oCO LUo or
1O
_J CO< COQ£ LUh- OZ OLU or00-
OO
"O U_00 O
Oa:
oo
OO
0<Q-Q
Ooc
oo
I —I
—
U. < O
to i- o; h- < I O
<h-<
0o.
I LdS
o; o: o<o o
\£>
<UJH360
•HPH
Oa
<o
6-4

6.2 SUBTASK 3.2, TRADE-OFF ANALYSIS
This subtask consists of the analysis performed on the three candi-date configurations to select the optimum system.
6.2.1 Processing Times. Processing times were calculated foreach experiment in each configuration. These figures are shoivnin table 6.2-1. For the majority of experiments there are nodifferences in processing times for the three configurations. Thegreatest difference occurs with the system drivers. All timesgiven in table 6.2-1 are actual equipment times and do not includesetup or rerun times
The following shows how processing times were calculated for eachof the basic concepts to be considered for reformatting the ex-periment data.
A. Concept I, Software Reformatting. This concept as des-cribed in paragraph 6.1,involves a two-pass operation.The first"pass would be at tape speed and would requirethe same time as shown under configuration 2 in table 6.2-1.
--"' The second pass would be the reformatting and CCT gener-ation pass. To perform this operation as a software func-tion requires a computation rate of approximately 500,000-600,000 computations/second. Using the computational re-quirements from Task II, the rate at which the data canbe played back on the second pass can be calculated.Total processing time is then equal to the combined timesof pass 1 and pass 2. Shown below is a sample calculationfor EO-3.
Pass 1 - 1.66 hours of data recorded @ 120 inches/second(IPS) and played into the system @ 7-1/2 IPS =26.56 hours
Pass 2 - Computations/second @ 7-1/2 IPS = 5.074,104.To complete pass 2, reduce rate by a factorof 9 to achieve the 500,000-600,000 computations/second
26.56 x 9 = 239.04 hours
Total processing time for Pass 1 + Pass 2 = 265.60 hours.
6-5
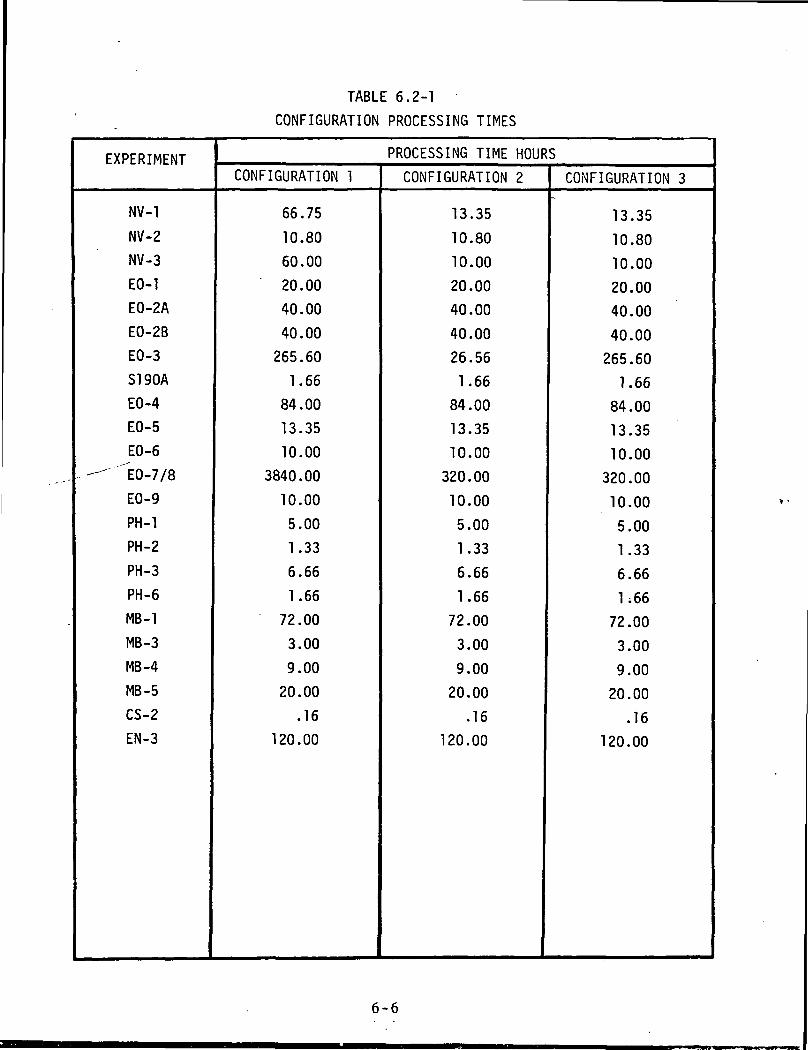
TABLE 6.2-1
CONFIGURATION PROCESSING TIMES
EXPERIMENT
NV-1
NV-2
NV-3
EO-1
EO-2A
EO-2B
EO-3
S190A
EO-4
EO-5
EO-6
~ -"""EO-7/8
EO-9
PH-1
PH-2
PH-3
PH-6
MB-1
MB -3
MB -4
MB -5
CS-2
EN-3
PROCESSING TIME HOURS
CONFIGURATION 1
66.75
10.80
60.00
20.00
40.00
40.00
265.60
1.66
84.00
13.35
10.00
3840.00
10.00
5.00
1.33
6.66
1.66
72.00
3.00
9.00
20.00
.16
120.00
CONFIGURATION 2
13.35
10.80
10.00
20.00
40.00
40.00
26.56
1.66
84.00
13.35
10.00
320.00
10.00
5.00
1.33
6.66
1.66
72.00
3.00
9.00
20.00
.16
120.00
CONFIGURATION 3
13.35
10.80
10.00
20.00
40.00
40.00
265.60
1.66
84.00
13.35
10.00
320.00
10.00
5.00
1.33
6.66
1,66
72.00
3.00
9.00
20.00
.16
120.00
6-6
B. Concept II, Hardware Reformatting. As can be seen in table6.2-1, this concept significantly reduces the processingtimes for the system drivers. The processing time is equalto the data acquisition time multiplied by the playbackreduction factor. For the majority of the experiments theprocessing time is equal to the data acquisition time.
C. Concept III, Combined Concepts. This concept is identicalto ConceptII with the exception of EO-3 which uses thetwo-pass operation.
EO-7/8 must be reformatted in a one-pass operation. If oneassumes a system operation of 16 hours a day, 5 days a week,the total processing time available/year is 4160 hours. Toprocess EO-7/8 for one mission under a two-pass configu-ration would require almost 1 year at 16 hours/day, 5 days/week.
6.2.2 Cost Factors. Considering different cost factors of thethree candidate systems, the only differences between the systemsa,re mass storage costs versus interface costs. Analysis of thesecosts show the full interface capability of configuration 2 ismore cost effective as well as more timely. The additional coreand engineering needed to provide the capability given in configu-ration 2 amounts to approximately $50,000. A mass storage deviceto replace this function would require a minimum of $200,000.Based on the analysis of processing times and cost factors, therecommendation of this study is configuration 2.
Reference figure 6.2-1 for the DRS floor layout.
6-7
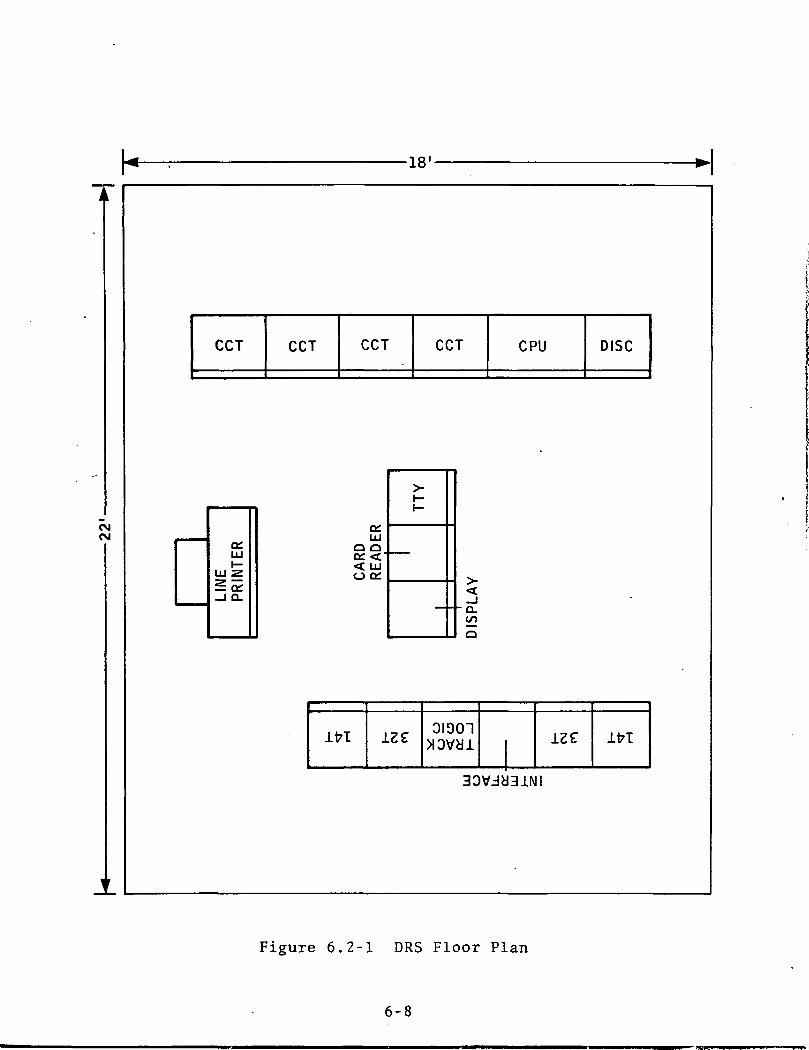
-18'
CM<VJ
CCT CCT CCT CCT CPU DISC
a:LU
Ul
LUO Oa: << LJO Oi
CLto
IfrT 12 e OIDOT»ovyi ize IfrT
Figure 6.2-1 DRS Floor Plan
6-8

6.3 SUBTASK 3.3, DRS PREFERRED CONFIGURATION CONCEPT
Based on processing and cost analyses, the recommended configu-ration for the DRS is configuration 2 as shown in figure 6.1-2.The two main subsystems of this configuration are 1) the instru-mentation interface and 2) the CPU and associated peripherals.
The costing of the DRS configuration consists' of hardware, engi-neering, and documentation. The costs will not include any in-flation or tax factors. The total cost of system implementationis shown in table 6.3-1.
6.3.1 Instrumentation Interface. Table 6.3-2 shows the majoritems and cost of the instrumentation interface. The interfacecontains the track logic as defined in the functional requirementsand the buffering for reformatting EO-3. Two recorders of eachtype were costed to provide copying capability for the instru-mentation tape.
6.3.2 Central Processor. Table 6.3-3 shows the.major items andcojst of^the CPU and peripherals.
6.3.3 Software Configuration. The two main software projects areas follows.
A. DJRS Operating System. It is made up of four main components,These are system software, image processing software, non-image processing software, and data quality software. Thecost of this software is shown in table 6.3-4.
B. Checkout Validation System. This system will assist withthe integration and checkout of ATL experiments and generateand validate test data for system checkout. The cost ofthis software is shown in table 6.3-5.
6.3.4 Operational Support. Three areas of support will be re-quired for the DRS and POSC operation. These areas are:
A. Operations. Two shifts of operations and maintenancesupport for the operational system would be required foreach shift. Personnel would include the following:
• Operations Supervisor - Responsible for the operationalarea; coordinates all operational activities and inter-faces with the production and software groups
• Operator/Technician - Responsible for operation, set-up and maintenance of the instrumentation tape interfaceand assists with computer operation
6-9
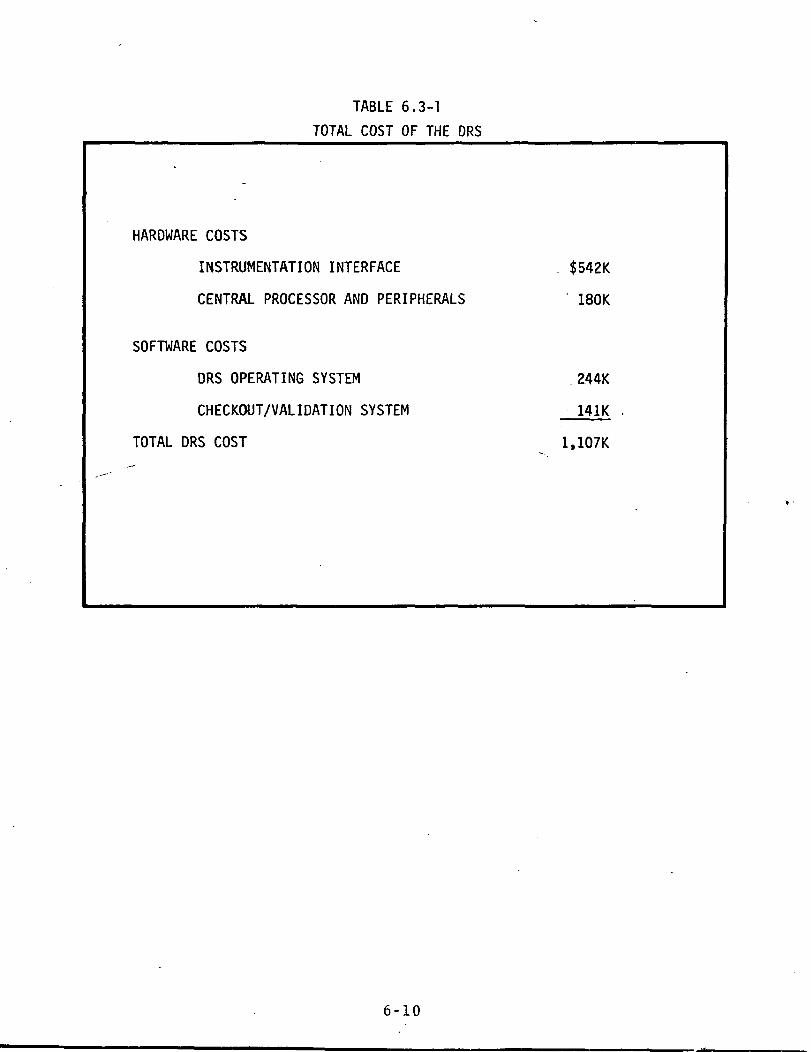
TABLE 6.3-1
TOTAL COST OF THE DRS
HARDWARE COSTS
INSTRUMENTATION INTERFACE
CENTRAL PROCESSOR AND PERIPHERALS
SOFTWARE COSTS
DRS OPERATING SYSTEM
CHECKOUT/VALIDATION SYSTEM
TOTAL DRS COST
$542K
180K
244K
141K
1.107K
6-10
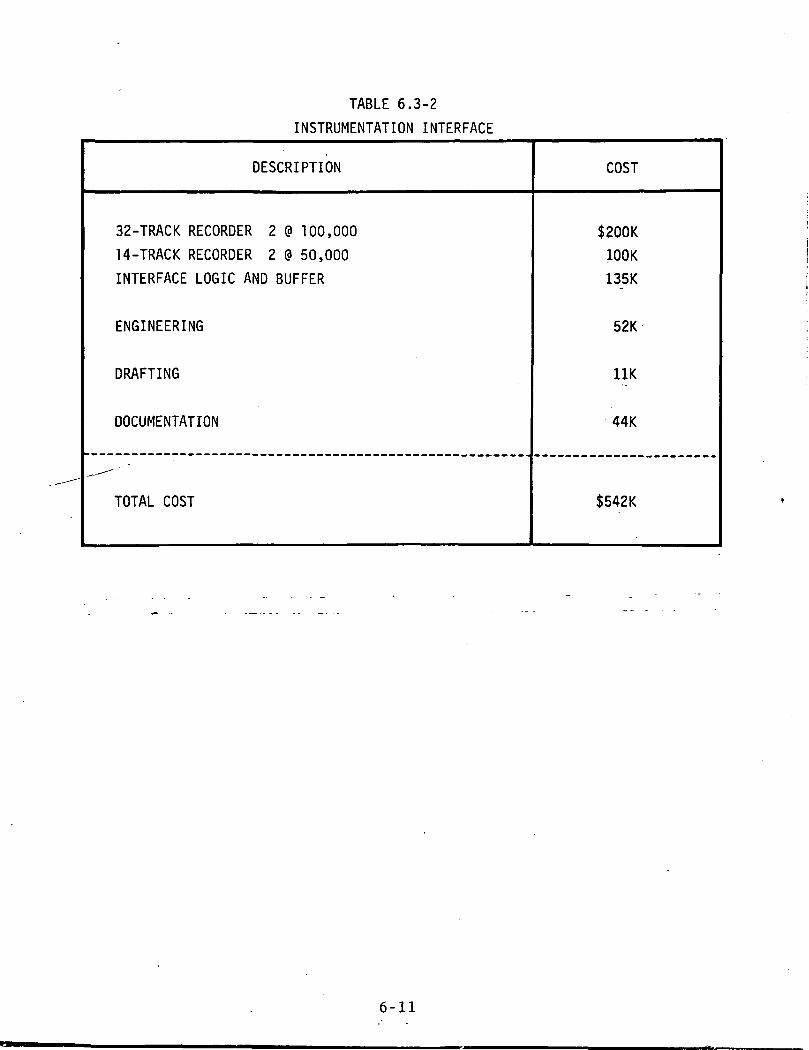
TABLE 6.3-2
INSTRUMENTATION INTERFACE
DESCRIPTION COST
32-TRACK RECORDER 2 @ 100,000
14-TRACK RECORDER 2 @ 50,000
INTERFACE LOGIC AND BUFFER
ENGINEERING
DRAFTING
DOCUMENTATION
$200K
100K
135K
52K
11K
44K
TOTAL COST $542K
6-11
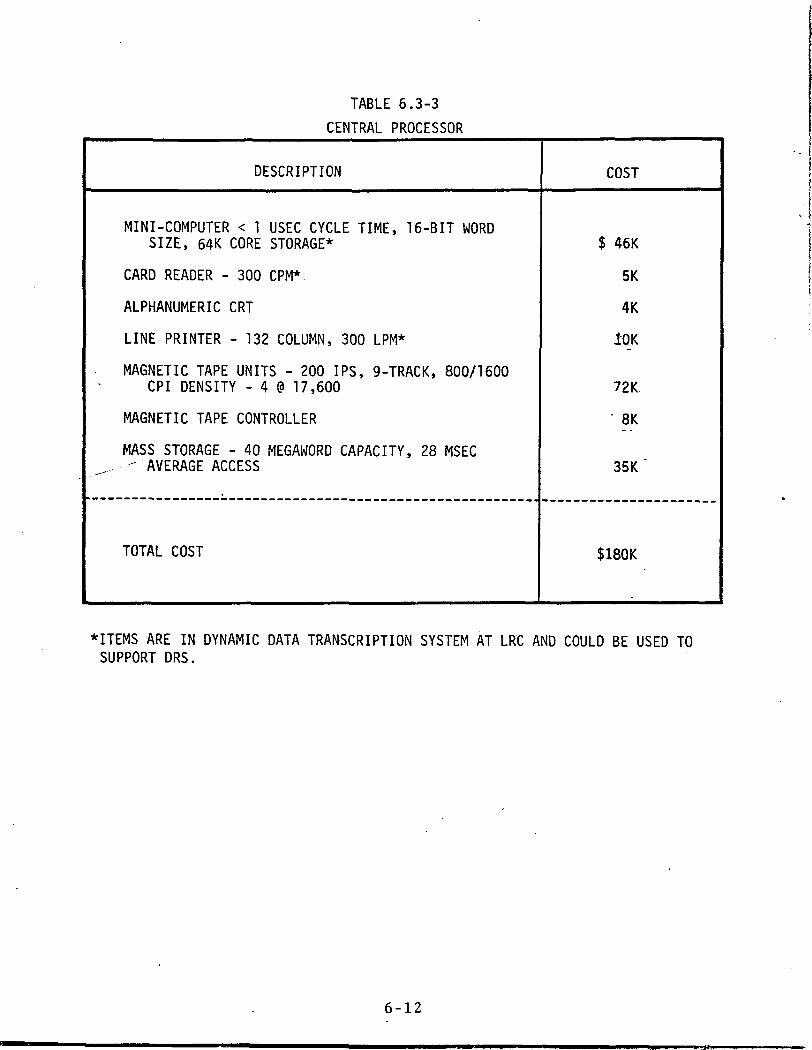
TABLE 6.3-3
CENTRAL PROCESSOR
DESCRIPTION
MINI-COMPUTER < 1 USEC CYCLE TIME, 16-BIT WORDSIZE, 64K CORE STORAGE*
CARD READER - 300 CPM*
ALPHANUMERIC CRT
LINE PRINTER - 132 COLUMN, 300 LPM*
MAGNETIC TAPE UNITS - 200 IPS, 9-TRACK, 800/1600CPI DENSITY -40 17,600
MAGNETIC TAPE CONTROLLER
MASS STORAGE - 40 MEGAWORD CAPACITY, 28 MSEC- AVERAGE ACCESS
TOTAL COST
COST
$ 46K
5K
4K
10K
72K
• 8K
35K
$180K
I
*ITEMS ARE IN DYNAMIC DATA TRANSCRIPTION SYSTEM AT LRC AND COULD BE USED TOSUPPORT DRS.
6-12
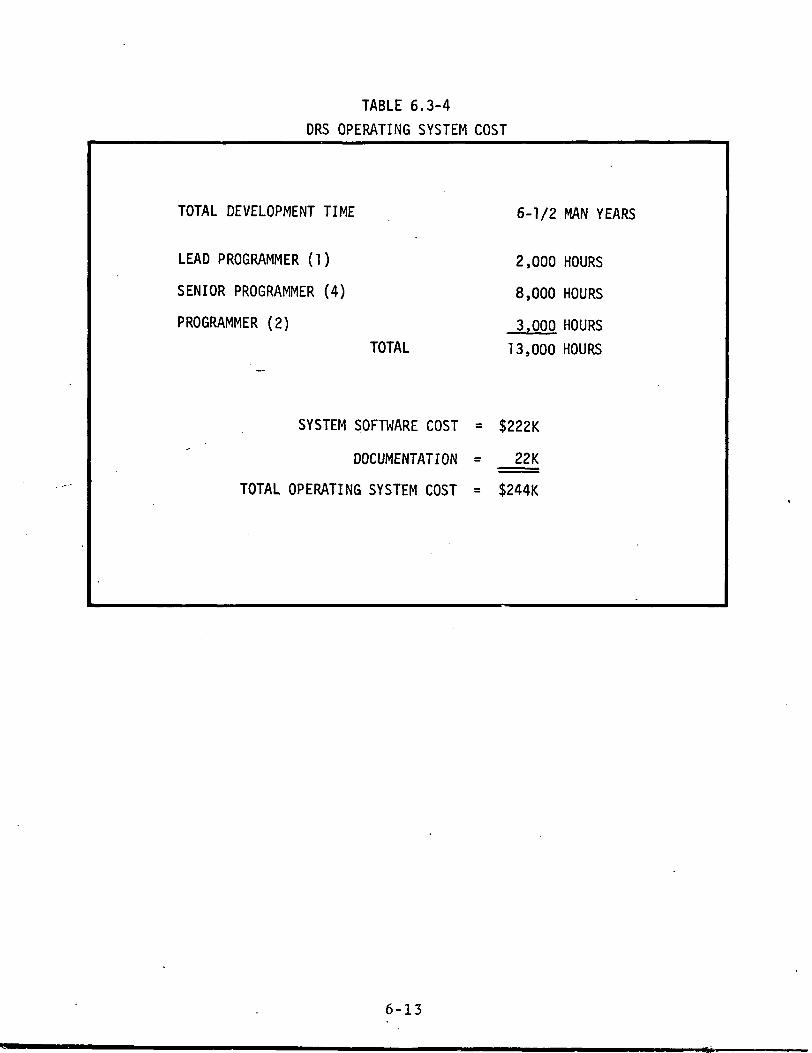
TABLE 6.3-4
DRS OPERATING SYSTEM COST
TOTAL DEVELOPMENT TIME 6-1/2 MAN YEARS
LEAD PROGRAMMER (1) 2,000 HOURS
SENIOR PROGRAMMER (4) 8,000 HOURS
PROGRAMMER (2) 3.000 HOURS
TOTAL 13,000 HOURS
SYSTEM SOFTWARE COST = $222K
DOCUMENTATION = 22K
TOTAL OPERATING SYSTEM COST = $244K
6-13

TABLE 6.3-5
GENERALIZED CHECKOUT/VALIDATION SYSTEM COST
TOTAL DEVELOPMENT TIME 4 MAN YEARS
LEAD PROGRAMMER (1) 1,500 HOURS
SENIOR PROGRAMMERS (2) 3,000 HOURS
PROGRAMMERS (2) 3,000 HOURS
TOTAL 7,500 HOURS
CHECKOUT/VALIDATION COST = $128K
DOCUMENTATION = 13K
TOTAL SYSTEM COST = $141K
6-14
• Computer Operator - Responsible for CPU and peripheraloperation, tape labeling, and coordination of tapes withthe tape librarian
• Tape Librarian - Maintains tape library; responsiblefor logging tapes in and out of the system.
B. Production Control. Two people per shift for two shiftsper day would be required. Personnel would include thefollowing for each shift:
• Data Coordinator - Sets up all production runs for thesystem and coordinates receipt and delivery of all data
• Production Analyst - Responsible for data quality;analyzes results of each run; and assists in trouble-shooting data problems.
C. System Software. A team of three programmers for systemmaintenance and modification would be required to assistProduction and Operations in problem solving.
The cost of the support effort is illustrated in table 6.3-6.These costs are broken out as annual costs using 1896 hoursavailable per year.
6-15
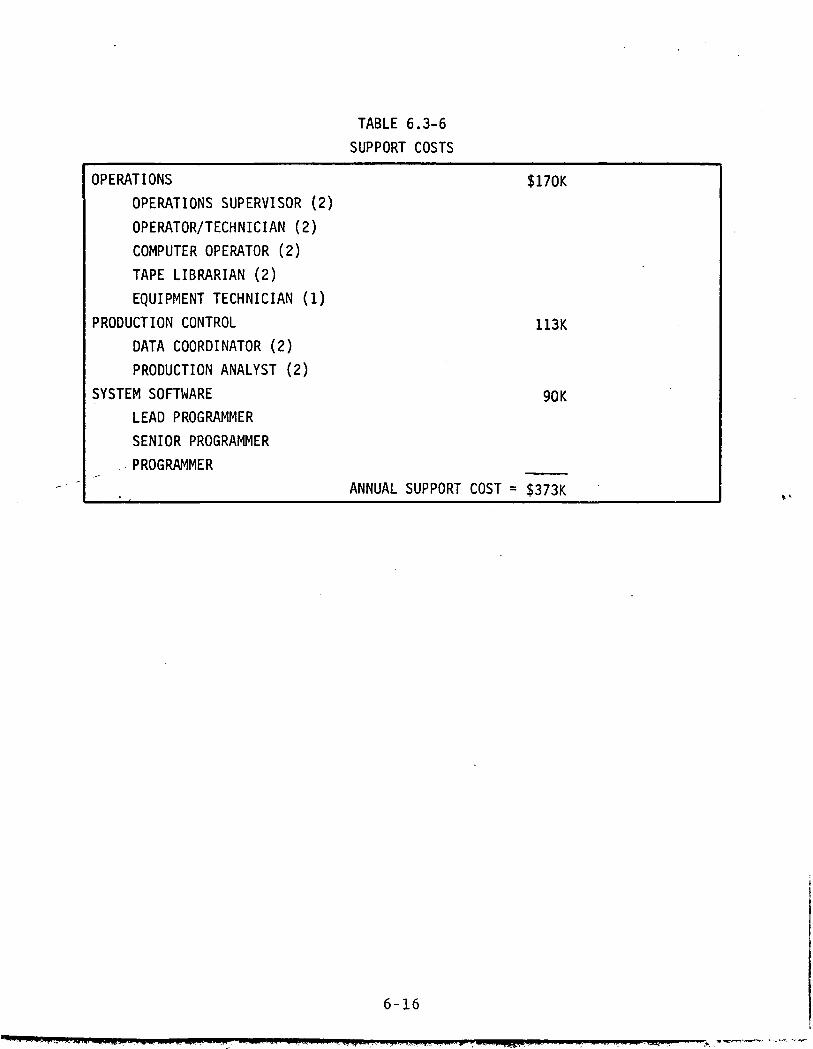
TABLE 6.3-6
SUPPORT COSTS
OPERATIONS
OPERATIONS SUPERVISOR (2)
OPERATOR/TECHNICIAN (2)
COMPUTER OPERATOR (2)
TAPE LIBRARIAN (2)
EQUIPMENT TECHNICIAN (1)
PRODUCTION CONTROL
DATA COORDINATOR (2)
PRODUCTION ANALYST (2)
SYSTEM SOFTWARE
LEAD PROGRAMMER
SENIOR PROGRAMMER
PROGRAMMER
$170K
113K
90K
ANNUAL SUPPORT COST = $373K
6-16

6.4 POSC COSTS
Each data category outlined in the requirements for the POSC wasanalyzed to derive the minimal configuration for meeting therequirement. The hardware configuration components are as follows:
A. Voice. One 10 FBI TLM remote keyset would meet the spec-ified requirements.
B. Telemetry, Trajectory, and Command. This data could behandled by one 56 kb/s line from JSC to LRC. Minimaltype hardware necessary to support these functions includethe following:
• 56 kb/s CPU Interface. This interface would acceptdata from the 56 kb/s data line and perform frame syncand poly checking. After the verification of eachmessage, the message would be routed to the central
_ --" processor.
• Central Processor. This processor would be the sameone used by the DRS.
• Displays. Displays consist of two table top type alpha-numeric displays for the purpose of displaying telemetryand trajectory data.
• Video. There will be only one video receiver. Theassumption is the video data will be processed at JSCand then transmitted to LRC.
Reference figure 6.4-1 for a functional diagram of POSC.
The software costs were generated based on the following assumptions.
• The major effort will be formatting data for and driving the. displays.
• The data received from the 56 kb/s interface will requirelittle or no processing.
• The operating system will be vendor supplied.
• The basic modules required will be for telemetry, trajectory,command and display.
6-17
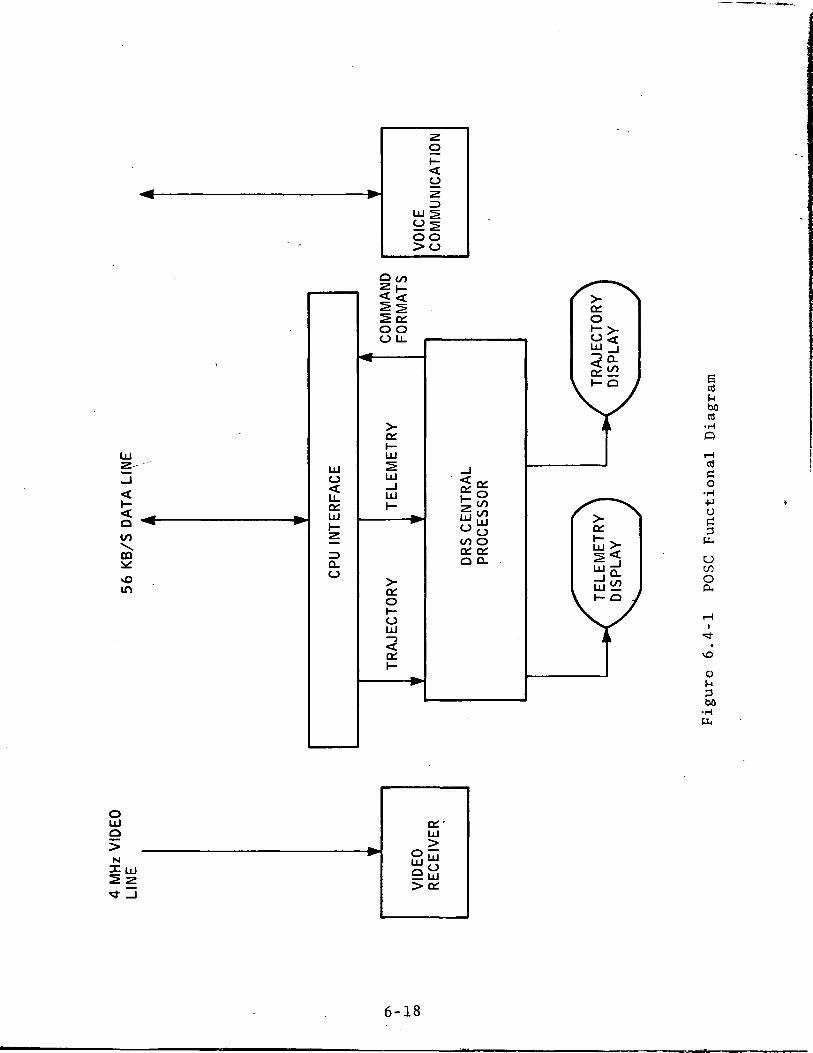
UJ-^
I]<1—^ ^- »^o ^ ^•s^
CD
NO
in
LUO
u.OHUJ1—_
Q-O
^<^C£O O
i B
Q£
UJ
UJ—IUJh-
o:0
oUJ
3o:i-
'MiiCO Oo: o:Q 0.
r >oh—
UJ
3o:
1^^0^
QLH-
U_jUJ
V ^~V1
Ert
bort
•HQ
CO
• H•PU
CJCOo
\o0)M3bO
•HUH
OUJo UJ
6-18
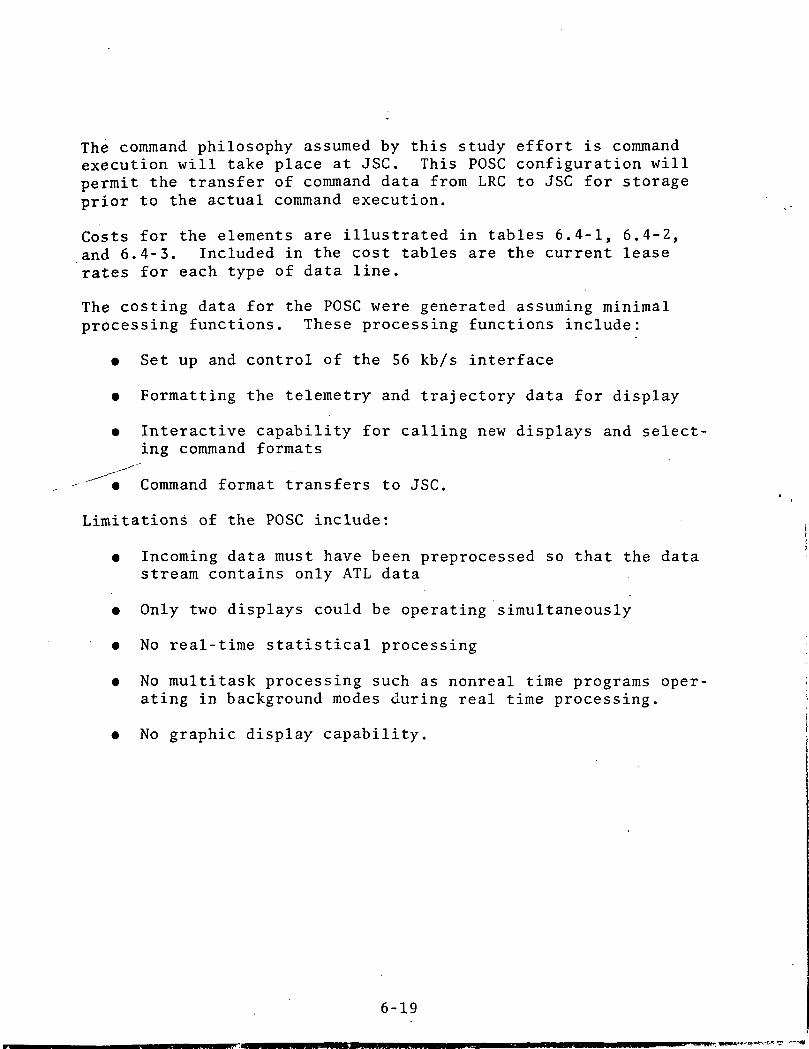
The command philosophy assumed by this study effort is commandexecution will take place at JSC. This POSC configuration willpermit the transfer of command data from LRC to JSC for storageprior to the actual command execution.
Costs for the elements are illustrated in tables 6.4-1, 6.4-2,and 6.4-3. Included in the cost tables are the current leaserates for each type of data line.
The costing data for the POSC were generated assuming minimalprocessing functions. These processing functions include:
• Set up and control of the 56 kb/s interface
• Formatting the telemetry and trajectory data for display
• Interactive capability for calling new displays and select-ing command formats
• Command format transfers to JSC.
Limitations of the POSC include:
• Incoming data must have been preprocessed so that the datastream contains only ATL data
• Only two displays could be operating simultaneously
• No real-time statistical processing
• No multitask processing such as nonreal time programs oper-ating in background modes during real time processing.
• No graphic display capability.
6-19
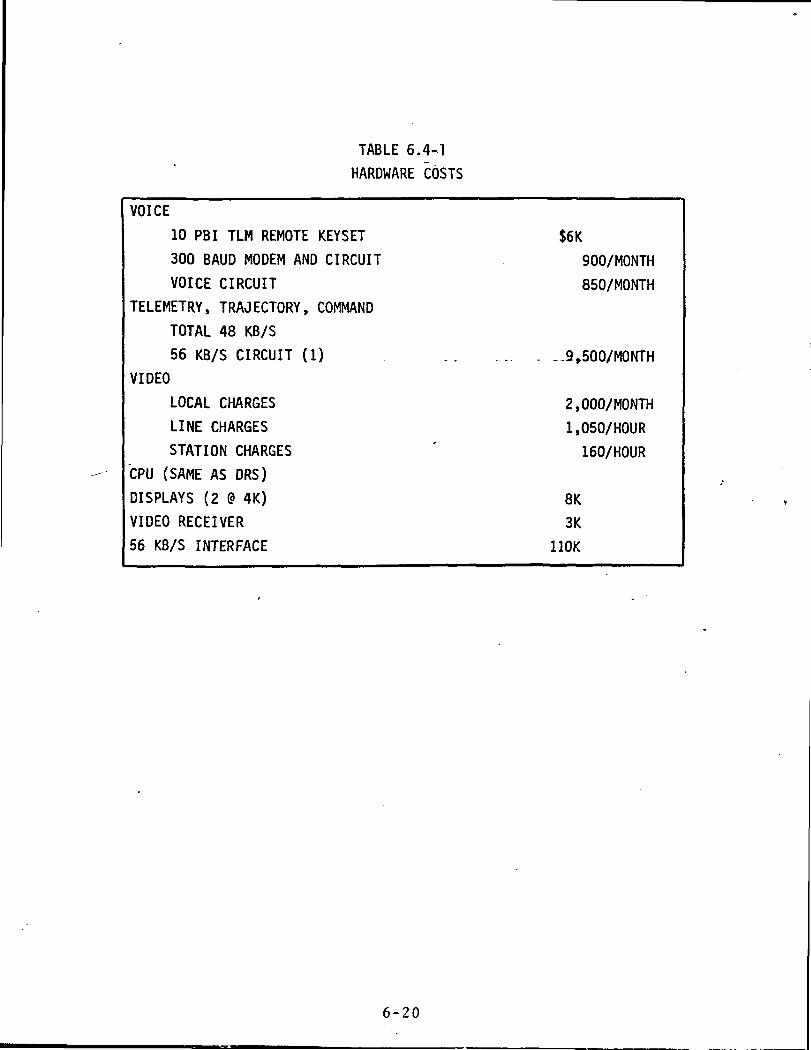
TABLE 6.4-1
HARDWARE COSTS
VOICE
10 PBI TLM REMOTE KEYSET
300 BAUD MODEM AND CIRCUIT
VOICE CIRCUIT
TELEMETRY, TRAJECTORY, COMMAND
TOTAL 48 KB/S
56 KB/S CIRCUIT (1)
VIDEO
LOCAL CHARGES
LINE CHARGES
STATION CHARGES
CPU (SAME AS DRS)
DISPLAYS (2 9 4K)
VIDEO RECEIVER
56 KB/S INTERFACE
$6K
900/MONTH
850/MONTH
-9,500/MONTH
2,000/MONTH
1,050/HOUR
160/HOUR
8K
3K
110K
6-20
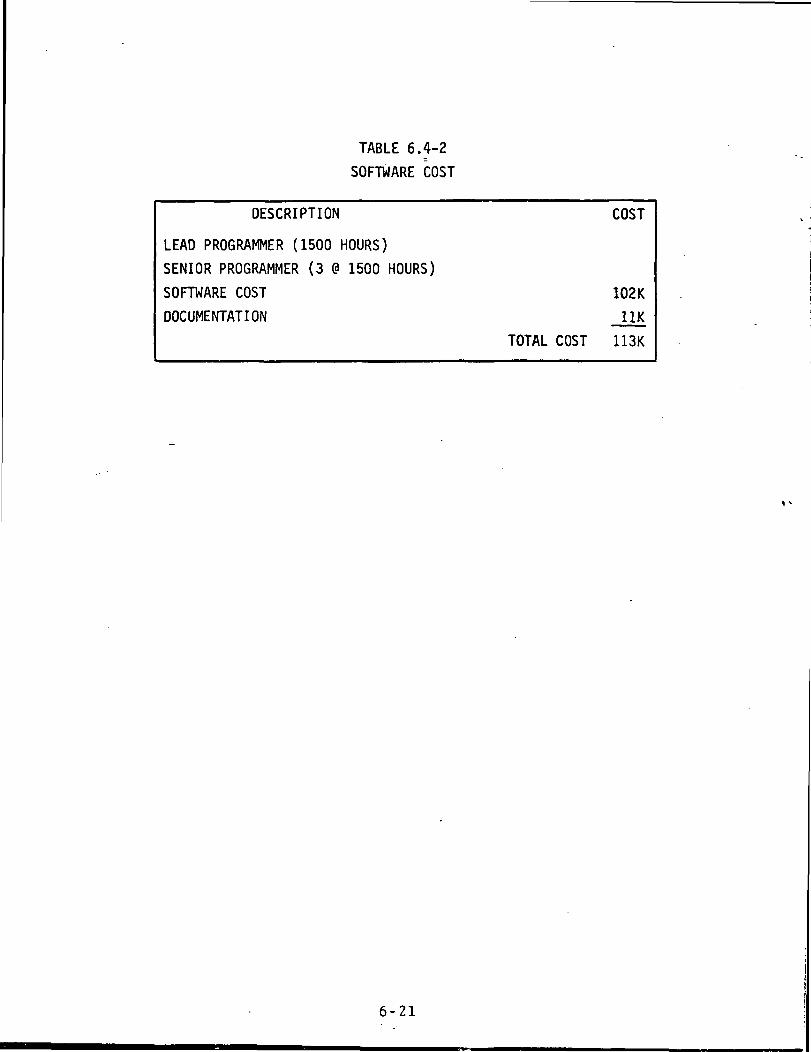
TABLE 6.4-2
SOFTWARE COST
DESCRIPTION
LEAD PROGRAMMER (1500 HOURS)
SENIOR PROGRAMMER (3 @ 1500 HOURS)
SORWARE COST
DOCUMENTATION
COST
102K
11K
TOTAL COST 113K
6-21

TABLE 6.4-3
POSC SYSTEM COST
HARDWARE COST
VOICE
TELEMETRY, TRAJECTORY, COMMAND
VIDEO
SOFTWARE COST
TOTAL IMPLEMENTATION COST
LINE CHARGES
VOICE
56 KB/S CIRCUIT
VIDEO
6K
118K
3K
113K
240K
1,750/MONTH
9,500/MONTH
2,000/MONTH
1,210/HOUR
6-22
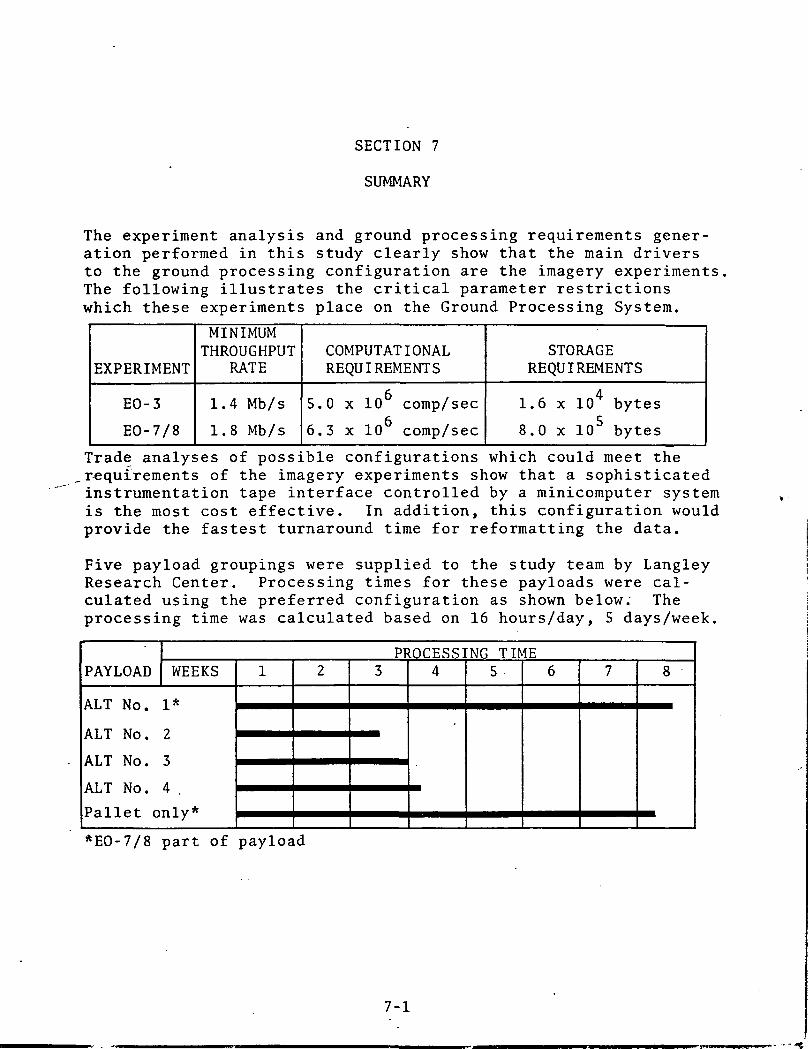
SECTION 7
SUMMARY
The experiment analysis and ground processing requirements gener-ation performed in this study clearly show that the main driversto the ground processing configuration are the imagery experimentsThe following illustrates the critical parameter restrictionswhich these experiments place on the Ground Processing System.
EXPERIMENT
EO-3
EO-7/8
MINIMUMTHROUGHPUT
RATE
1.4 Mb/s
1.8 Mb/s
COMPUTATIONALREQUIREMENTS
5.0 x 10 comp/sec
6.3 x 10 comp/sec
STORAGEREQUIREMENTS
1.6 x 104 bytes
8.0 x 10 bytes
Trade analyses of possible configurations which could meet therequirements of the imagery experiments show that a sophisticatedinstrumentation tape interface controlled by a minicomputer systemis the most cost effective. In addition, this configuration wouldprovide the fastest turnaround time for reformatting the data.
Five payload groupings were supplied to the study team by LangleyResearch Center. Processing times for these payloads were cal-culated using the preferred configuration as shown below. Theprocessing time was calculated based on 16 hours/day, 5 days/week.
PROCESSING TIMEPAYLOAD WEEKS
ALT No. 1*
ALT No. 2
ALT No. 3
ALT No. 4 .
Pallet only*
1 2 3 4 5 - 6 7 8
*EO-7/8 part of payload
7-1
The processing times reflect actual CPU and interface time anddo not include any set-up or rerun time. These times clearlyreflect the impact of EO-7/8 to the Ground Processing System.The cost of the system is given in section 6 of this document.
In addition to examining the data processing costs for the post-flight processing, costs are provided for various elements of aPayload Operations Support Center (POSC). These costs (containedin section 6 of this document) are broken out into three mainareas: 1) voice; 2) telemetry, command and trajectory; and 3)video.
The POSC was assumed to be a monitoring type center with theactual command and control of the mission being done by LRCpersonnel located at JSC.
Areas of future study which have been identified by this analysisinclude:
A. Data Analysis System Study. Ground processing analysisshould be continued. This would give the requirementsand configuration needed to complete the ground process-ing of the ATL experiment data. Before total groundprocessing costs can be evaluated, the analysis proc-essing must be examined.
B. Imaging Radar Processing Study. A detailed processingstudy is necessary to determine processing techniques andcapabilities to optimize the processing of the Image Radar
* Data. These techniques and capabilities will enhance thecost-effective development of the LRC Data ManagementSystem.
C. ATL Command and Control Study. A study should be to madeto develop a detailed requirements document for ATL com-mand processing including interagency responsibilities,command types, and formats.
7-2