Embed Size (px)
Citation preview
Land Values:
Preparing for What’s Next
DTN Ag Summit
F. Howard Halderman AFM
Halderman Farm Management Service/
Halderman Real Estate Services
Who is Halderman?
December 2012 DTN Ag Summit

December 2012 DTN Ag Summit
Halderman Can Help!
Since 1930, people have been turning to Halderman Farm Management Service, Inc. and Halderman Real Estate Services, Inc. for their farm management and farm real estate needs. All kinds of people – farm owners, investors, tenants, bankers, lenders, trust officers, wealth advisors, attorneys, accountants…in fact, anyone involved with a farm in any way. We’ve provided services, from an occasional consultation to complete farm management and real estate brokerage, to thousands of clients throughout the U.S.
If you have a farm-related problem or want to explore the investment opportunities in farmland, Halderman Can Help!
We’ve been doing it for three generations.
December 2012 DTN Ag Summit
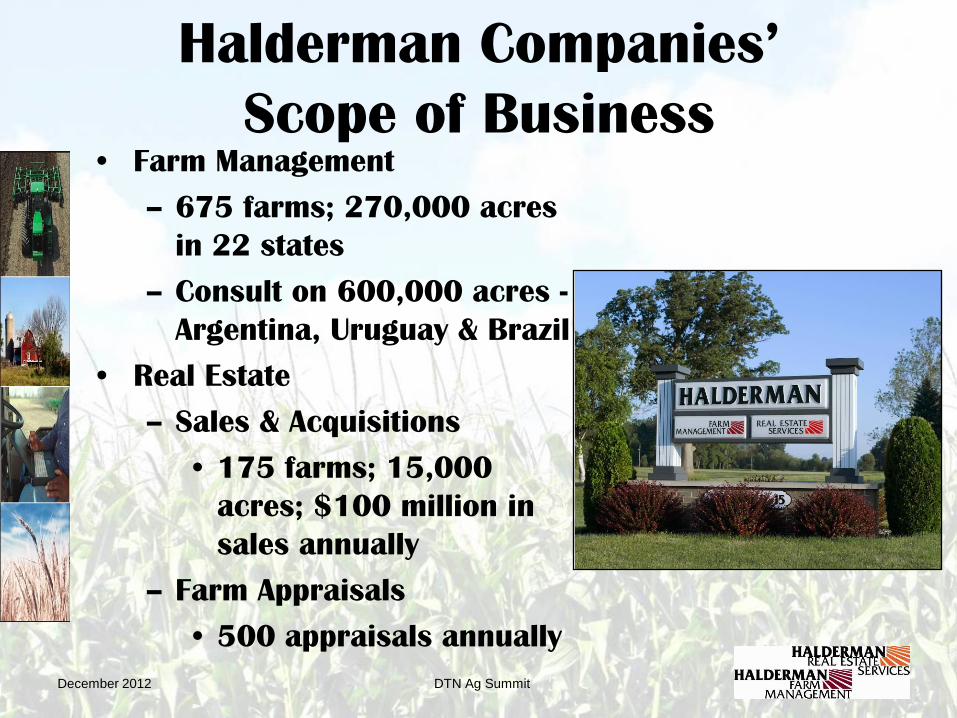
Halderman Companies’
Scope of Business • Farm Management
– 675 farms; 270,000 acres
in 22 states
– Consult on 600,000 acres -
Argentina, Uruguay & Brazil
• Real Estate
– Sales & Acquisitions
• 175 farms; 15,000
acres; $100 million in
sales annually
– Farm Appraisals
• 500 appraisals annually
December 2012 DTN Ag Summit
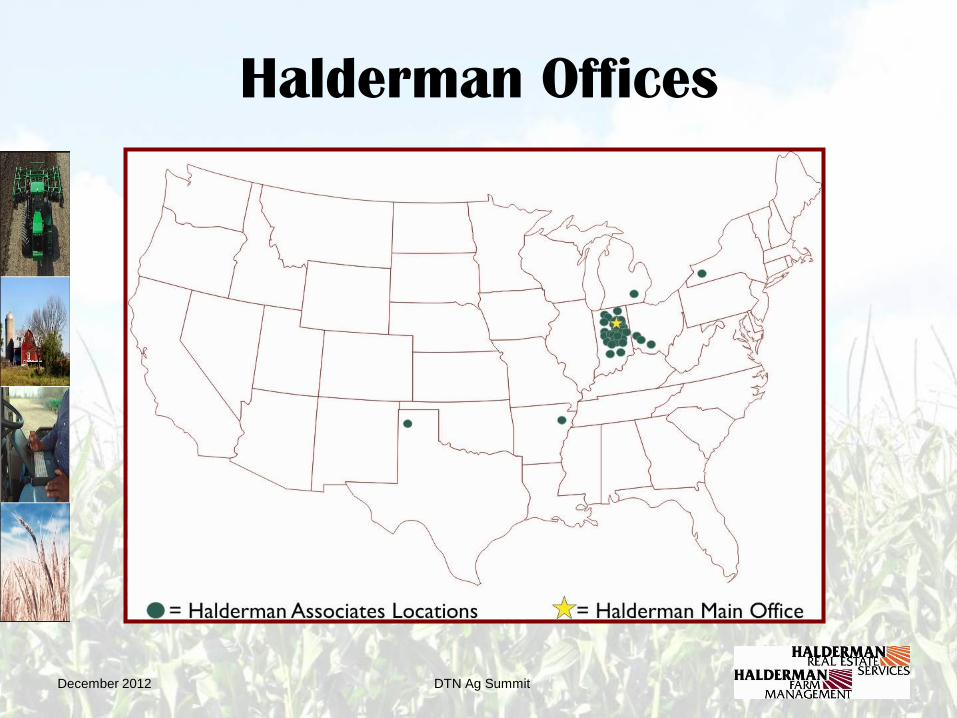
Halderman Offices
December 2012 DTN Ag Summit
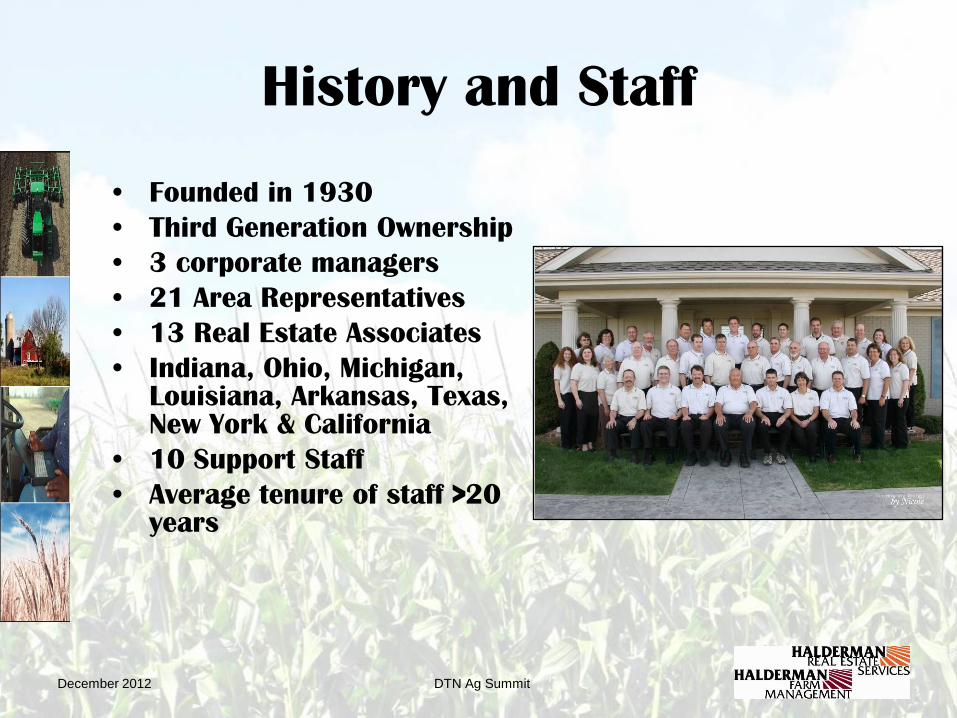
History and Staff
• Founded in 1930
• Third Generation Ownership
• 3 corporate managers
• 21 Area Representatives
• 13 Real Estate Associates
• Indiana, Ohio, Michigan, Louisiana, Arkansas, Texas, New York & California
• 10 Support Staff
• Average tenure of staff >20 years
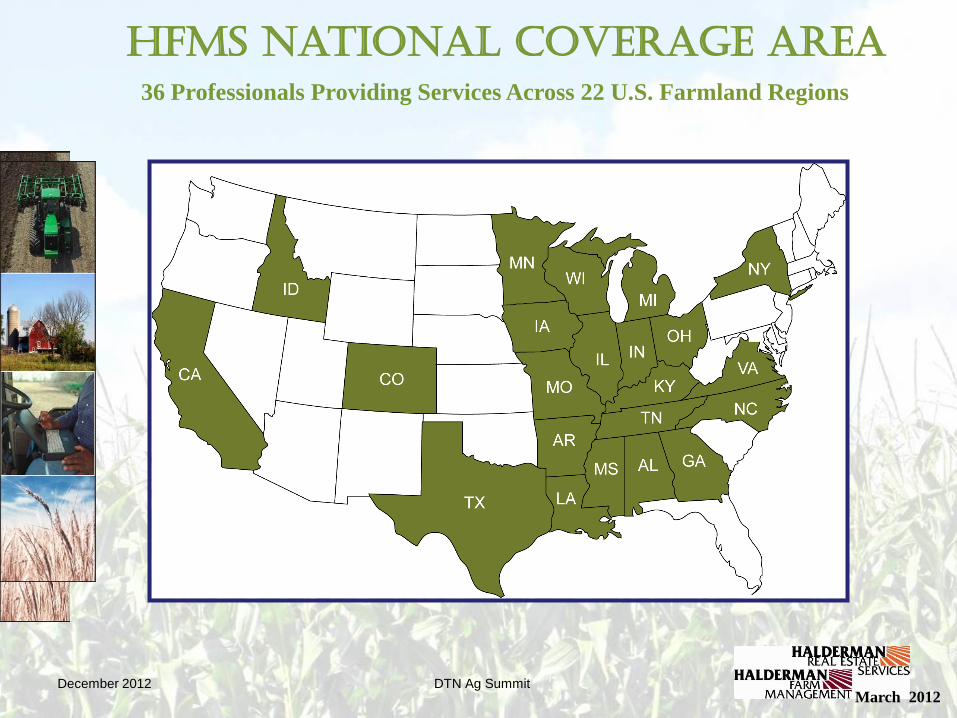
HFMS National Coverage Area
36 Professionals Providing Services Across 22 U.S. Farmland Regions
March 2012 December 2012 DTN Ag Summit

December 2012 DTN Ag Summit
Farm Land Why it might be the best investment in
your portfolio!
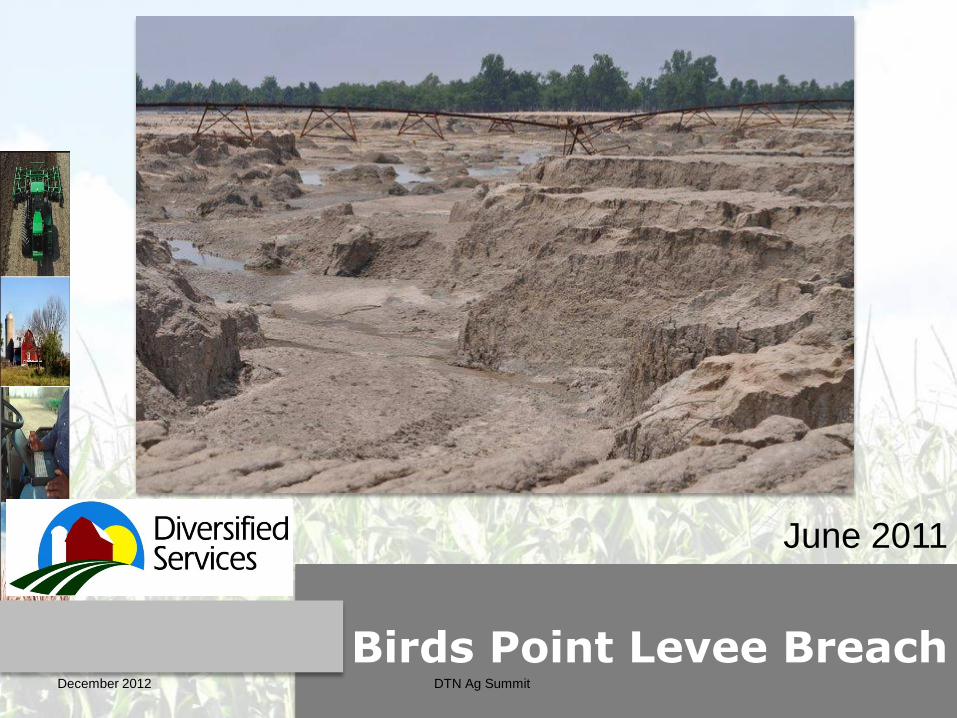
Birds Point Levee Breach
June 2011
December 2012 DTN Ag Summit
December 2012 DTN Ag Summit
Farmland Real Estate Market
• Cropland values increase substantially!
• During Fall 2008, 2010, 2011 and
2012 capital gains tax increase fears
once again drive some sales!
• Decline in recreational, timber, and
residential values since “2008 financial
crisis” continues.
DTN Ag Summit
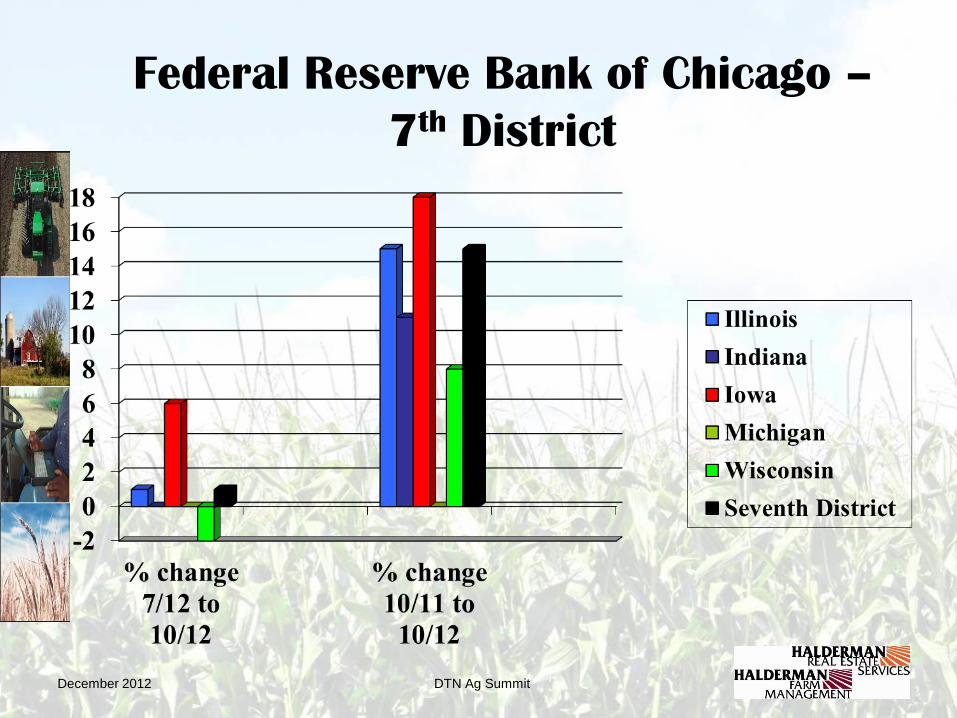
Federal Reserve Bank of Chicago –
7th District
December 2012
DTN Ag Summit
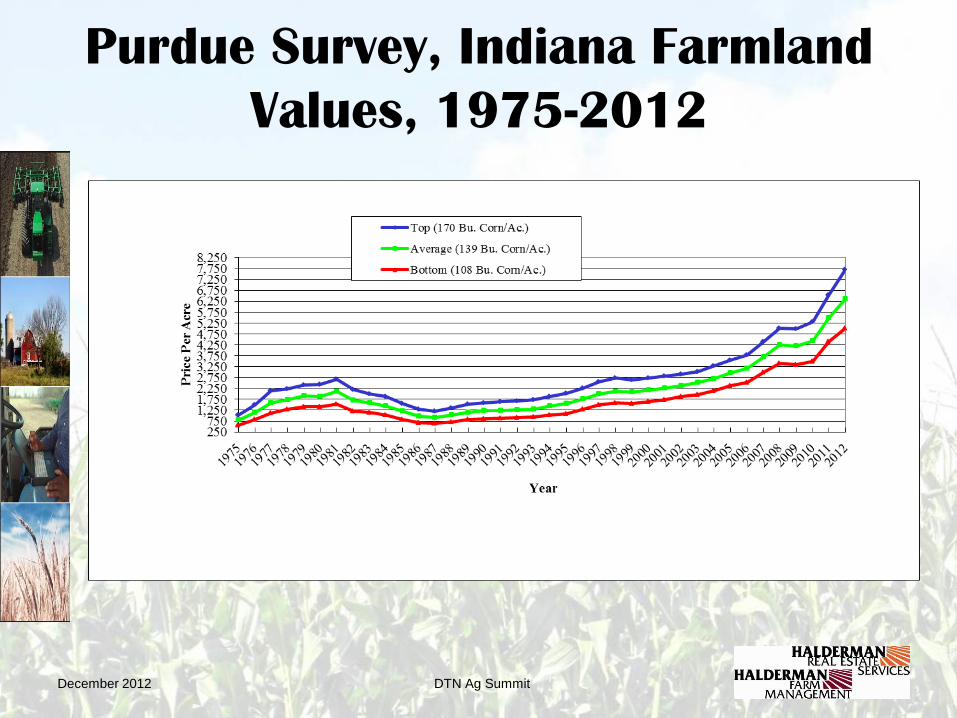
Purdue Survey, Indiana Farmland
Values, 1975-2012
December 2012
December 2012 DTN Ag Summit
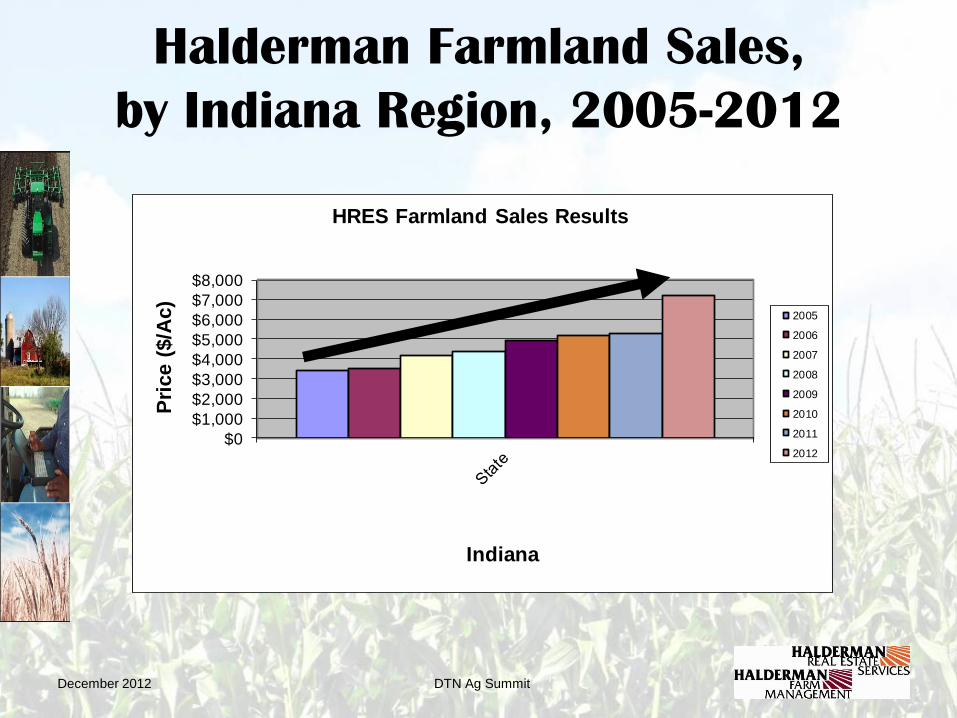
Halderman Farmland Sales,
by Indiana Region, 2005-2012
$0
$1,000
$2,000
$3,000
$4,000
$5,000
$6,000
$7,000
$8,000
Pri
ce (
$/A
c)
Indiana
HRES Farmland Sales Results
2005
2006
2007
2008
2009
2010
2011
2012
DTN Ag Summit
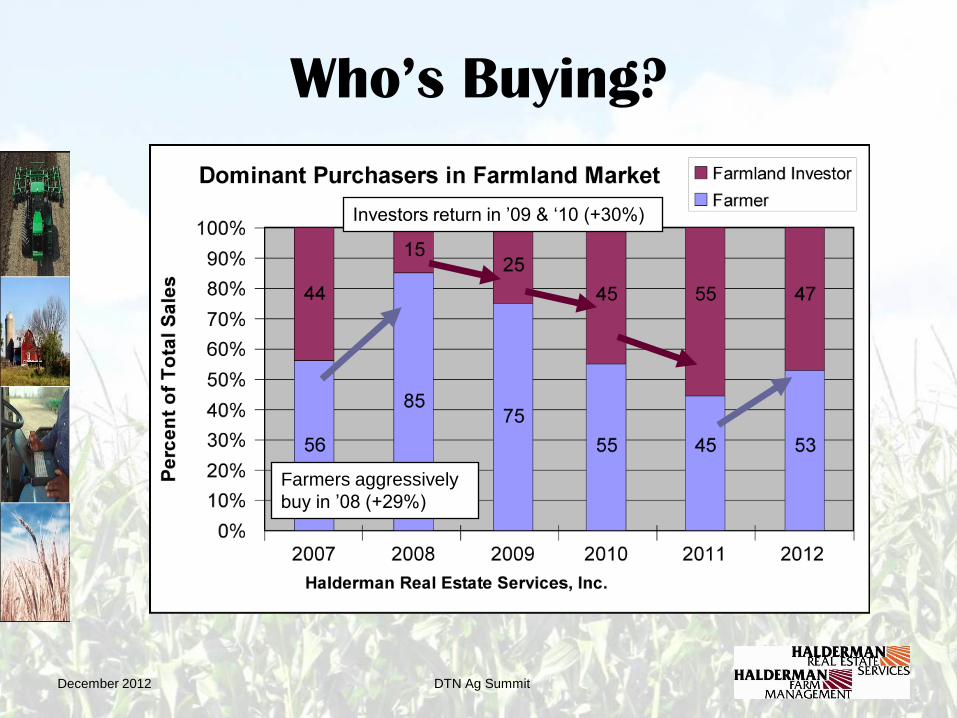
Who’s Buying?
December 2012
Farmers aggressively
buy in ’08 (+29%)
Investors return in ’09 & ‘10 (+30%)

DTN Ag Summit
Farmland Real Estate Sales
Oct. – Putnam Co, OH – 169 ac. sold for $1.132 M
$6,700/acre
Oct.– Huntington Co – 77 ac. sold for $530,000
$6,883/acre
Oct. – Kosciusko Co. – 220 ac. sold for $805,000
$3,659/acre
Nov. – Carroll Co. – 77 ac. sold for $960,000
$12,357/acre
Nov. – Piatt Co., IL – 160 ac. sold for $1.43 M
$8,936/acre
December 2012
DTN Ag Summit
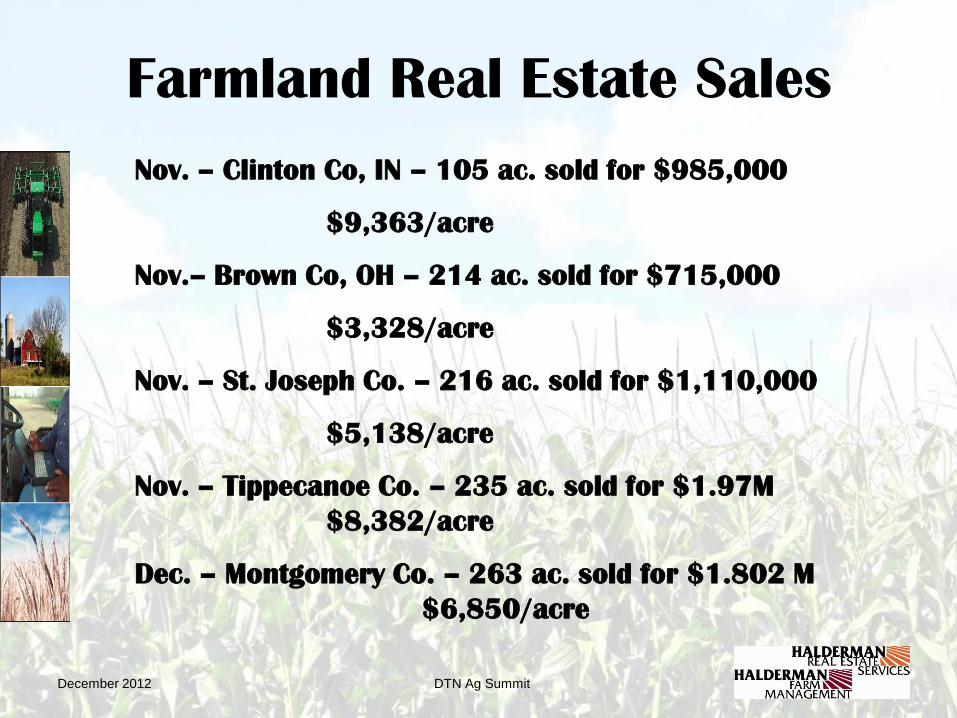
Farmland Real Estate Sales
Nov. – Clinton Co, IN – 105 ac. sold for $985,000
$9,363/acre
Nov.– Brown Co, OH – 214 ac. sold for $715,000
$3,328/acre
Nov. – St. Joseph Co. – 216 ac. sold for $1,110,000
$5,138/acre
Nov. – Tippecanoe Co. – 235 ac. sold for $1.97M
$8,382/acre
Dec. – Montgomery Co. – 263 ac. sold for $1.802 M
$6,850/acre
December 2012
DTN Ag Summit
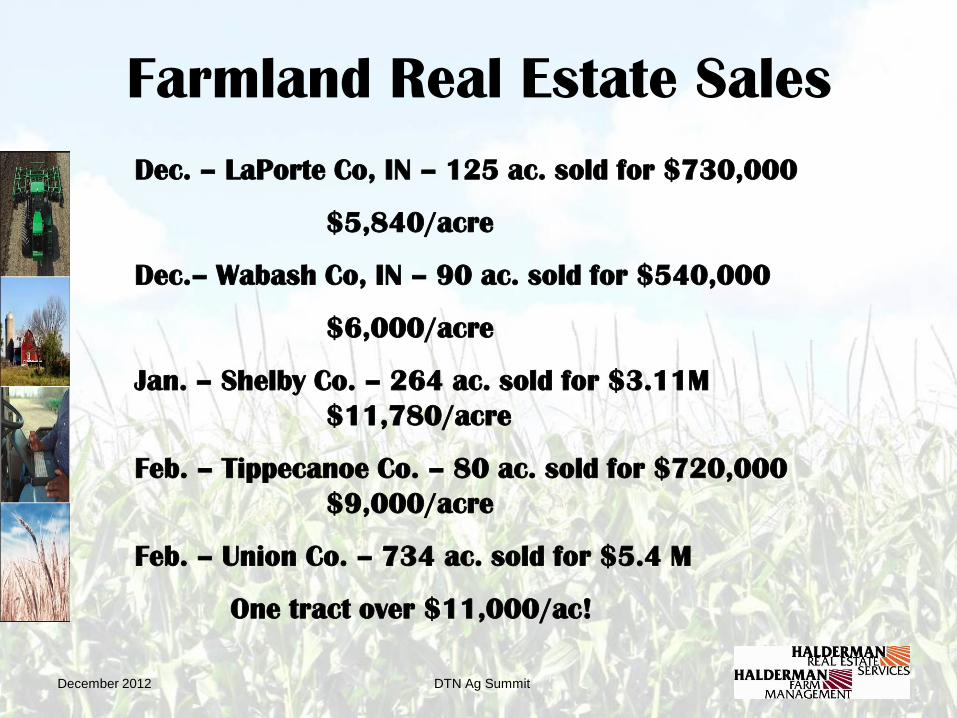
Farmland Real Estate Sales
Dec. – LaPorte Co, IN – 125 ac. sold for $730,000
$5,840/acre
Dec.– Wabash Co, IN – 90 ac. sold for $540,000
$6,000/acre
Jan. – Shelby Co. – 264 ac. sold for $3.11M
$11,780/acre
Feb. – Tippecanoe Co. – 80 ac. sold for $720,000
$9,000/acre
Feb. – Union Co. – 734 ac. sold for $5.4 M
One tract over $11,000/ac!
December 2012
DTN Ag Summit
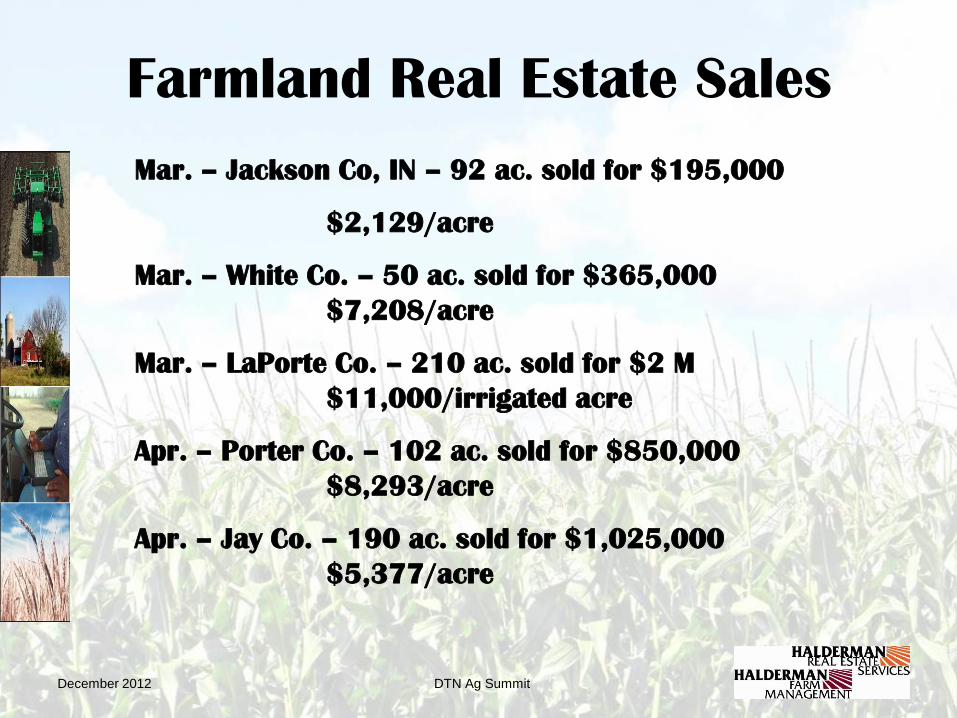
Farmland Real Estate Sales
Mar. – Jackson Co, IN – 92 ac. sold for $195,000
$2,129/acre
Mar. – White Co. – 50 ac. sold for $365,000
$7,208/acre
Mar. – LaPorte Co. – 210 ac. sold for $2 M
$11,000/irrigated acre
Apr. – Porter Co. – 102 ac. sold for $850,000
$8,293/acre
Apr. – Jay Co. – 190 ac. sold for $1,025,000
$5,377/acre
December 2012

DTN Ag Summit
Farmland Real Estate Sales
Apr. – Clay Co, IN – 93.5 ac. sold for $920,000
$9,840/acre
Apr. – Fulton Co. – 205 ac. sold for $605,000
$2,950/acre (1/2 cropland)
Apr. – Howard Co. – 67 ac. sold for $570,000
$8,500/acre
May – Wabash Co. – 58 ac. sold for $410,000
$7,069/acre
May – Wabash Co. – 75 ac. sold for $450,000
$6,000/acre
June – Kosciusko Co. – 50 ac. for $150,000
$3,000/acre
December 2012
DTN Ag Summit
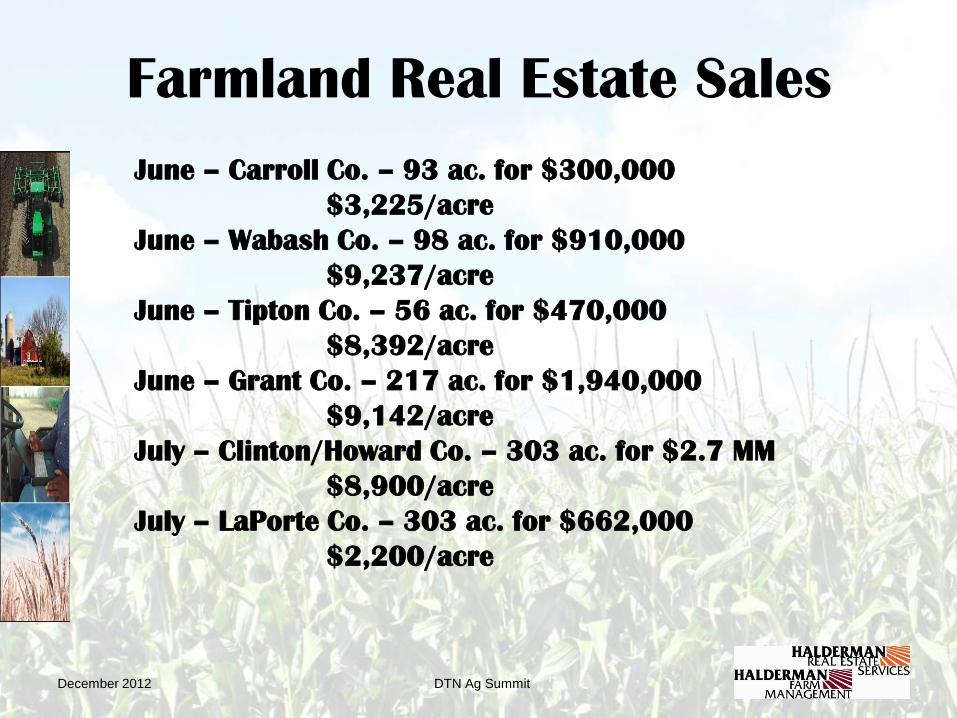
Farmland Real Estate Sales
June – Carroll Co. – 93 ac. for $300,000
$3,225/acre
June – Wabash Co. – 98 ac. for $910,000
$9,237/acre
June – Tipton Co. – 56 ac. for $470,000
$8,392/acre
June – Grant Co. – 217 ac. for $1,940,000
$9,142/acre
July – Clinton/Howard Co. – 303 ac. for $2.7 MM
$8,900/acre
July – LaPorte Co. – 303 ac. for $662,000
$2,200/acre
December 2012
DTN Ag Summit
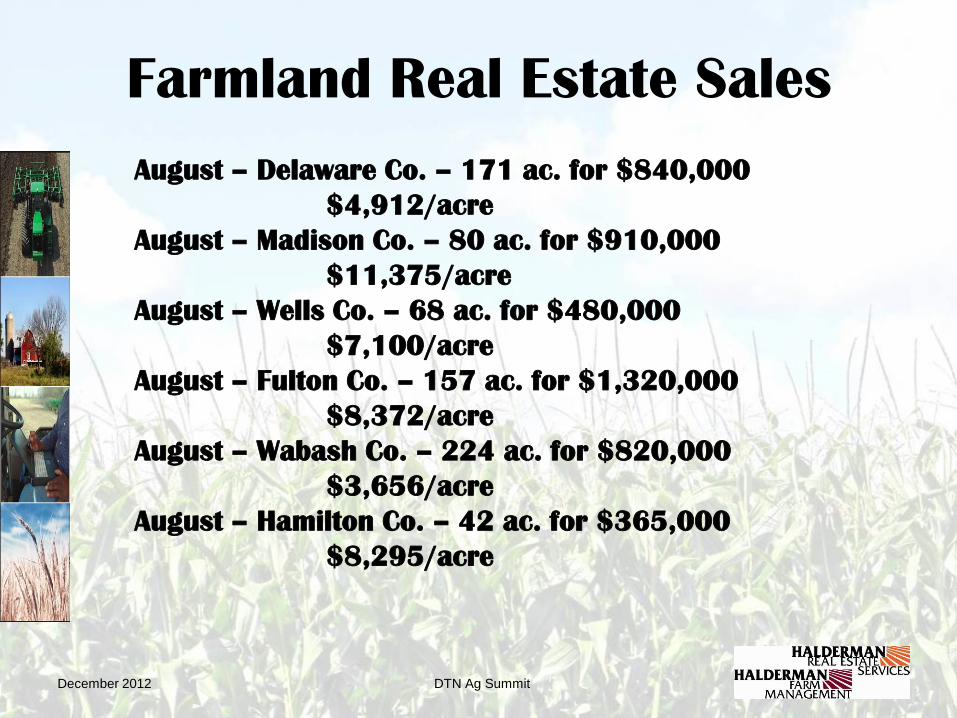
Farmland Real Estate Sales
August – Delaware Co. – 171 ac. for $840,000
$4,912/acre
August – Madison Co. – 80 ac. for $910,000
$11,375/acre
August – Wells Co. – 68 ac. for $480,000
$7,100/acre
August – Fulton Co. – 157 ac. for $1,320,000
$8,372/acre
August – Wabash Co. – 224 ac. for $820,000
$3,656/acre
August – Hamilton Co. – 42 ac. for $365,000
$8,295/acre
December 2012
DTN Ag Summit
Farmland Real Estate Sales
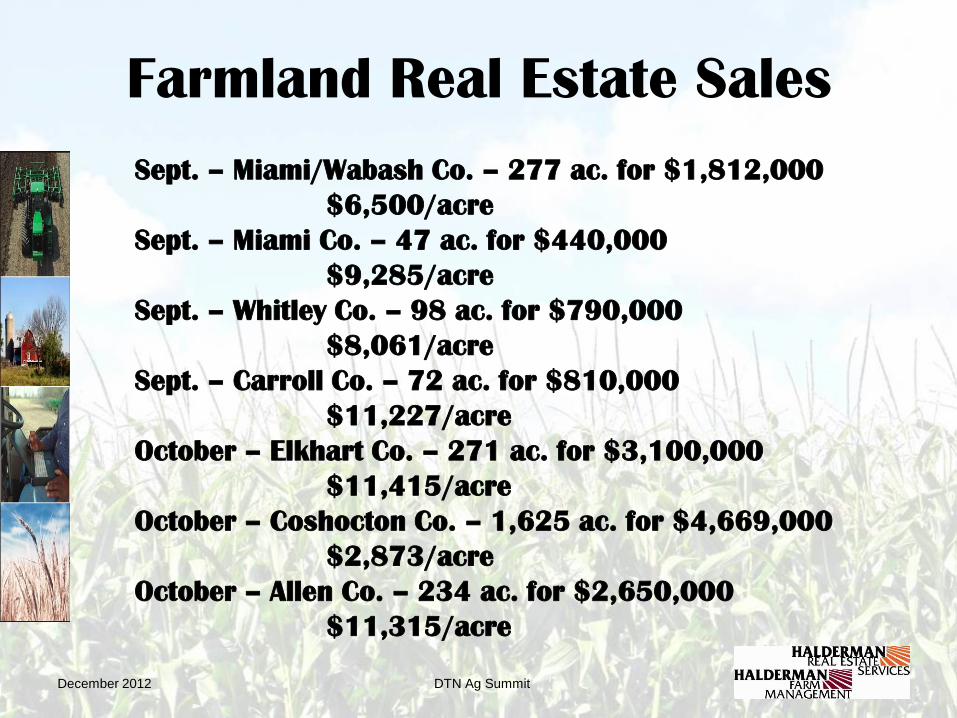
Sept. – Miami/Wabash Co. – 277 ac. for $1,812,000
$6,500/acre
Sept. – Miami Co. – 47 ac. for $440,000
$9,285/acre
Sept. – Whitley Co. – 98 ac. for $790,000
$8,061/acre
Sept. – Carroll Co. – 72 ac. for $810,000
$11,227/acre
October – Elkhart Co. – 271 ac. for $3,100,000
$11,415/acre
October – Coshocton Co. – 1,625 ac. for $4,669,000
$2,873/acre
October – Allen Co. – 234 ac. for $2,650,000
$11,315/acre
December 2012
DTN Ag Summit
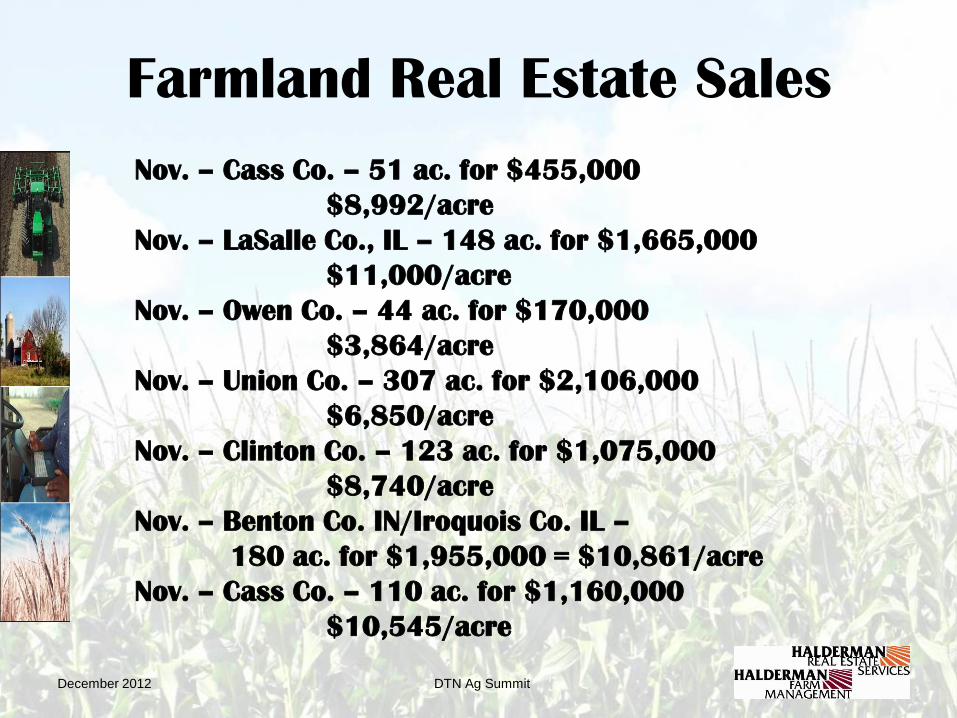
Farmland Real Estate Sales
Nov. – Cass Co. – 51 ac. for $455,000
$8,992/acre
Nov. – LaSalle Co., IL – 148 ac. for $1,665,000
$11,000/acre
Nov. – Owen Co. – 44 ac. for $170,000
$3,864/acre
Nov. – Union Co. – 307 ac. for $2,106,000
$6,850/acre
Nov. – Clinton Co. – 123 ac. for $1,075,000
$8,740/acre
Nov. – Benton Co. IN/Iroquois Co. IL –
180 ac. for $1,955,000 = $10,861/acre
Nov. – Cass Co. – 110 ac. for $1,160,000
$10,545/acre
December 2012
Farmland Investment
Characteristics -
Remain the same!
WHY FARMLAND?

December 2012 DTN Ag Summit
Farmers buy because…
• Control of acres & “chance of a
lifetime”
• Available cash from ’06 -‘12 operations
• Low interest rates – still, but for how
long??
• What better alternatives?
– Invest in what you know…and control
• Retain the returns to land otherwise
paid as rents.
December 2012 DTN Ag Summit
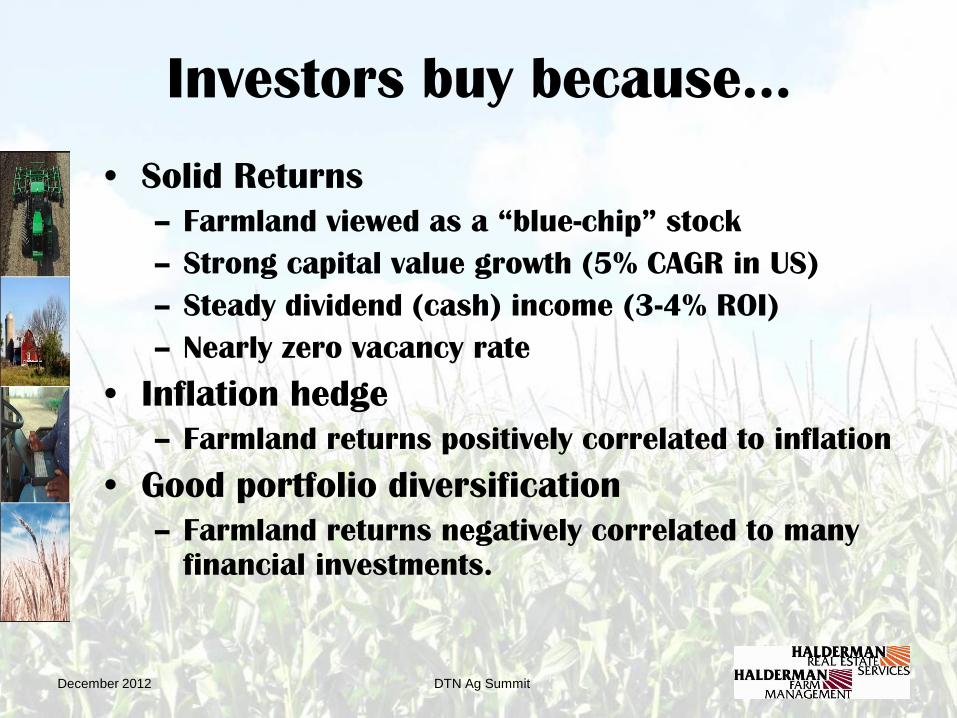
Investors buy because…
• Solid Returns
– Farmland viewed as a “blue-chip” stock
– Strong capital value growth (5% CAGR in US)
– Steady dividend (cash) income (3-4% ROI)
– Nearly zero vacancy rate
• Inflation hedge
– Farmland returns positively correlated to inflation
• Good portfolio diversification
– Farmland returns negatively correlated to many
financial investments.
December 2012 DTN Ag Summit
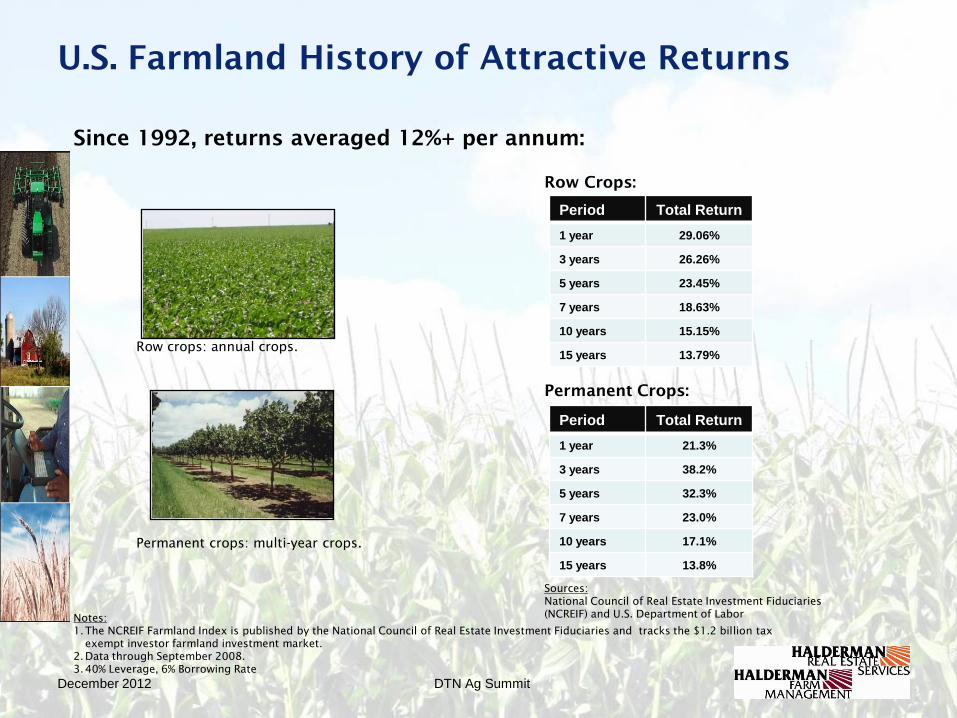
Since 1992, returns averaged 12%+ per annum:
U.S. Farmland History of Attractive Returns
Notes:
1.The NCREIF Farmland Index is published by the National Council of Real Estate Investment Fiduciaries and tracks the $1.2 billion tax
exempt investor farmland investment market.
2.Data through September 2008.
3.40% Leverage, 6% Borrowing Rate
Permanent Crops:
Row Crops:
Row crops: annual crops.
Permanent crops: multi-year crops.
Sources:
National Council of Real Estate Investment Fiduciaries
(NCREIF) and U.S. Department of Labor
Period Total Return
1 year 29.06%
3 years 26.26%
5 years 23.45%
7 years 18.63%
10 years 15.15%
15 years 13.79%
Period Total Return
1 year 21.3%
3 years 38.2%
5 years 32.3%
7 years 23.0%
10 years 17.1%
15 years 13.8%
December 2012 DTN Ag Summit
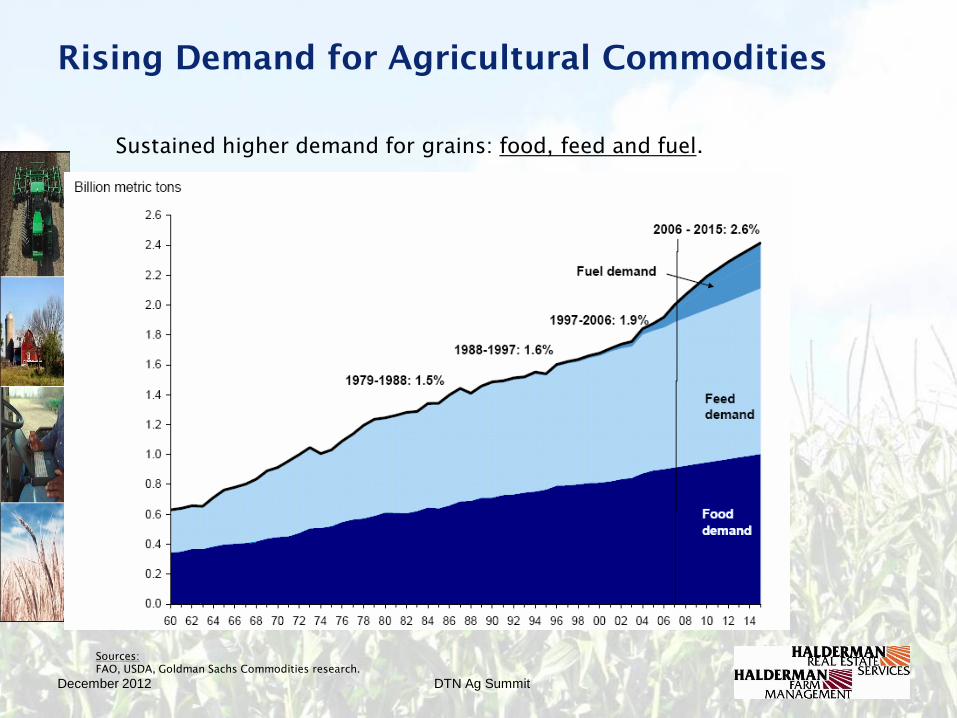
Sustained higher demand for grains: food, feed and fuel.
Rising Demand for Agricultural Commodities
Sources:
FAO, USDA, Goldman Sachs Commodities research.
December 2012 DTN Ag Summit
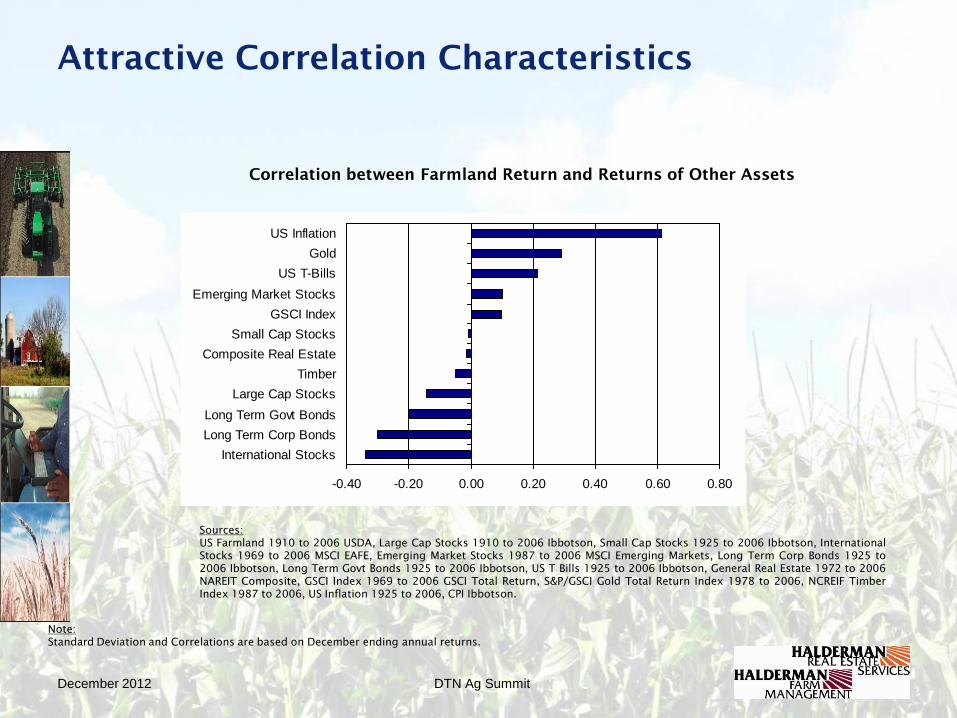
Sources:
US Farmland 1910 to 2006 USDA, Large Cap Stocks 1910 to 2006 Ibbotson, Small Cap Stocks 1925 to 2006 Ibbotson, International
Stocks 1969 to 2006 MSCI EAFE, Emerging Market Stocks 1987 to 2006 MSCI Emerging Markets, Long Term Corp Bonds 1925 to
2006 Ibbotson, Long Term Govt Bonds 1925 to 2006 Ibbotson, US T Bills 1925 to 2006 Ibbotson, General Real Estate 1972 to 2006
NAREIT Composite, GSCI Index 1969 to 2006 GSCI Total Return, S&P/GSCI Gold Total Return Index 1978 to 2006, NCREIF Timber
Index 1987 to 2006, US Inflation 1925 to 2006, CPI Ibbotson.
Attractive Correlation Characteristics
Correlation between Farmland Return and Returns of Other Assets
Note:
Standard Deviation and Correlations are based on December ending annual returns.
-0.40 -0.20 0.00 0.20 0.40 0.60 0.80
International Stocks
Long Term Corp Bonds
Long Term Govt Bonds
Large Cap Stocks
Timber
Composite Real Estate
Small Cap Stocks
GSCI Index
Emerging Market Stocks
US T-Bills
Gold
US Inflation
December 2012 DTN Ag Summit
Farm Land Where do values go from here?
December 2012 DTN Ag Summit
Where are land prices going?
• Depends on
»Farm Income
»Interest Rates
»Supply • Farm Income records ‘07-’11
– (2012 slightly lower)
• Interest Rates historically low
• Farms for sale ½ of typical 3%
December 2012 DTN Ag Summit
Farm Land Leases Farmland is worth what it earns!
December 2012 FCS Marion
Farm Leases
• Competition for leasing land remains high!
• Input costs increased in ’07, ‘08, ’09, ’11
and in ‘12.
• Output Opportunities are many!
– Bio Fuels/Ethanol/Bio Diesel, Feed, Specialty
Crops
• Cash Rents in 2012 - Central IL over
$300/acre – average rent. 2013 even
higher?
• Drought Impacts???
December 2012 DTN Ag Summit
Drought 2012
• Yields are a disaster in many areas
– Genetics provide more protection than ever
• Commodity prices move to all time highs
• Prices for 2013 grain at profitable levels
• 74% of IN row crop farmers buy insurance
• Long term demand destruction a concern
DTN Ag Summit
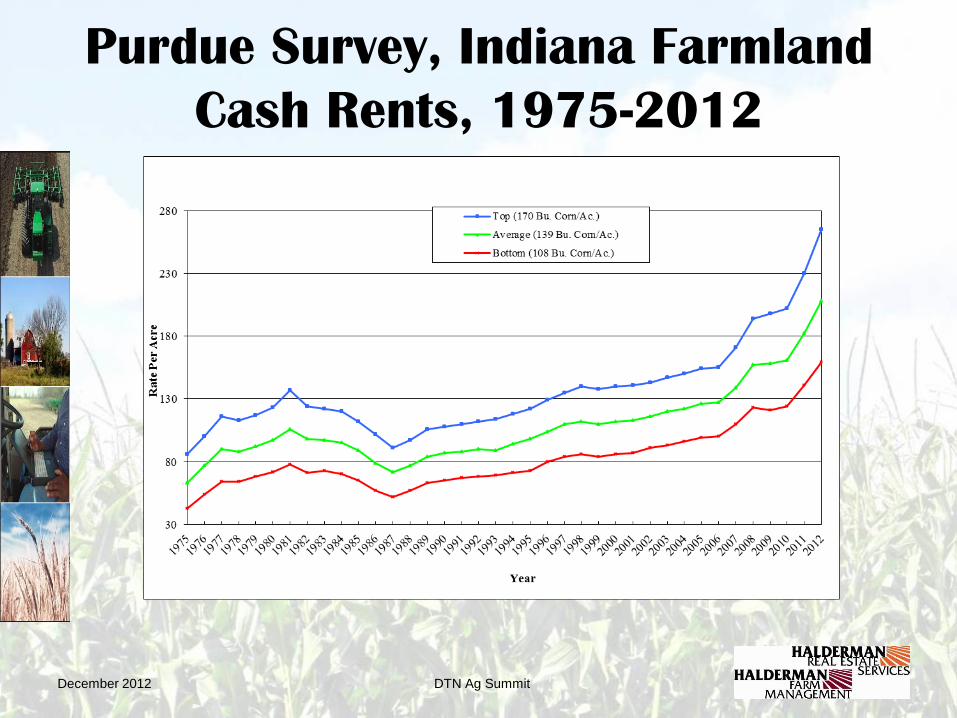
Purdue Survey, Indiana Farmland
Cash Rents, 1975-2012
December 2012
December 2012 DTN Ag Summit
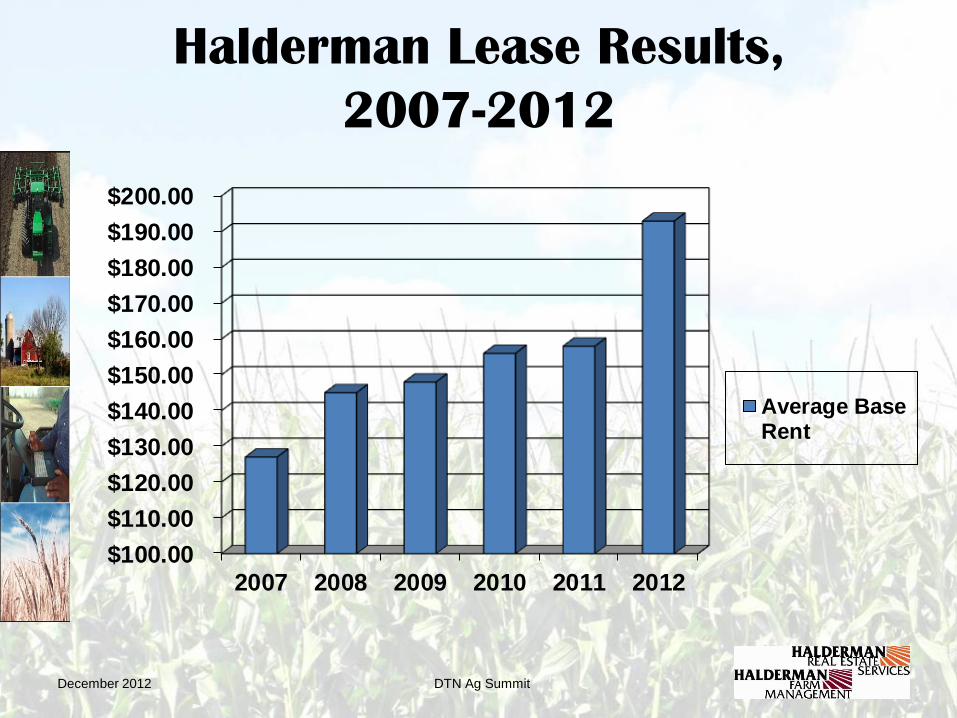
Halderman Lease Results,
2007-2012
$100.00
$110.00
$120.00
$130.00
$140.00
$150.00
$160.00
$170.00
$180.00
$190.00
$200.00
2007 2008 2009 2010 2011 2012
Average BaseRent
December 2012 DTN Ag Summit
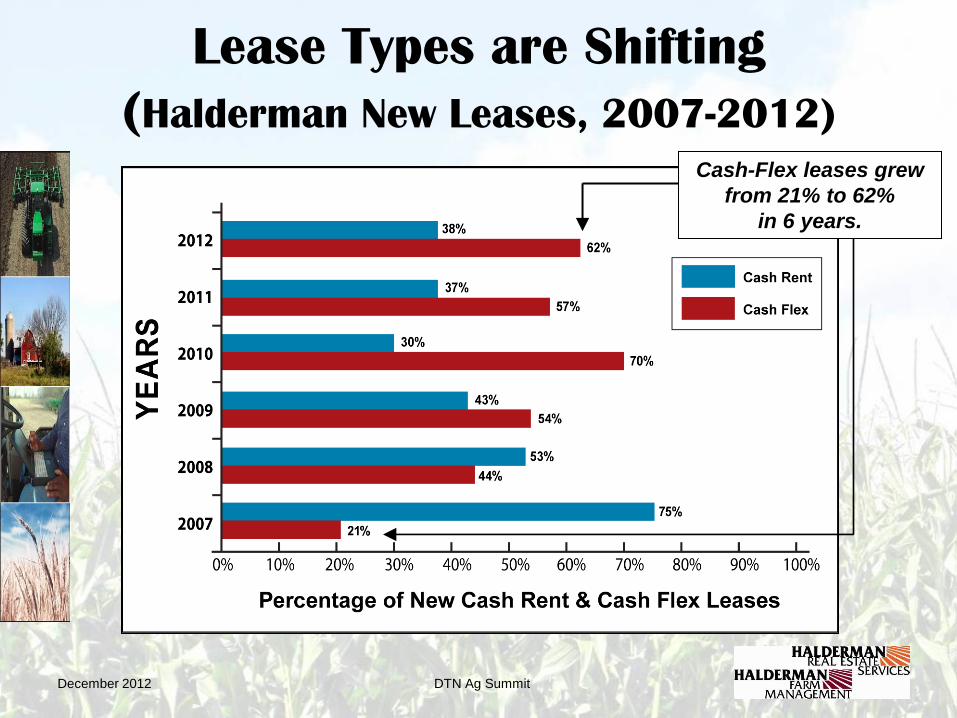
Lease Types are Shifting
(Halderman New Leases, 2007-2012)
Cash-Flex leases grew
from 21% to 62%
in 6 years.
December 2012 DTN Ag Summit
Cash Flex Leases
• Many different flex arrangements
• Base cash rent with the “potential” for
a bonus.
• Most triggered off gross revenue (some
yield based)
• Averaged $180-$320/ac. in Wabash
County in 2007 - 2012.
• Can add $50-$100/acre in bonus.
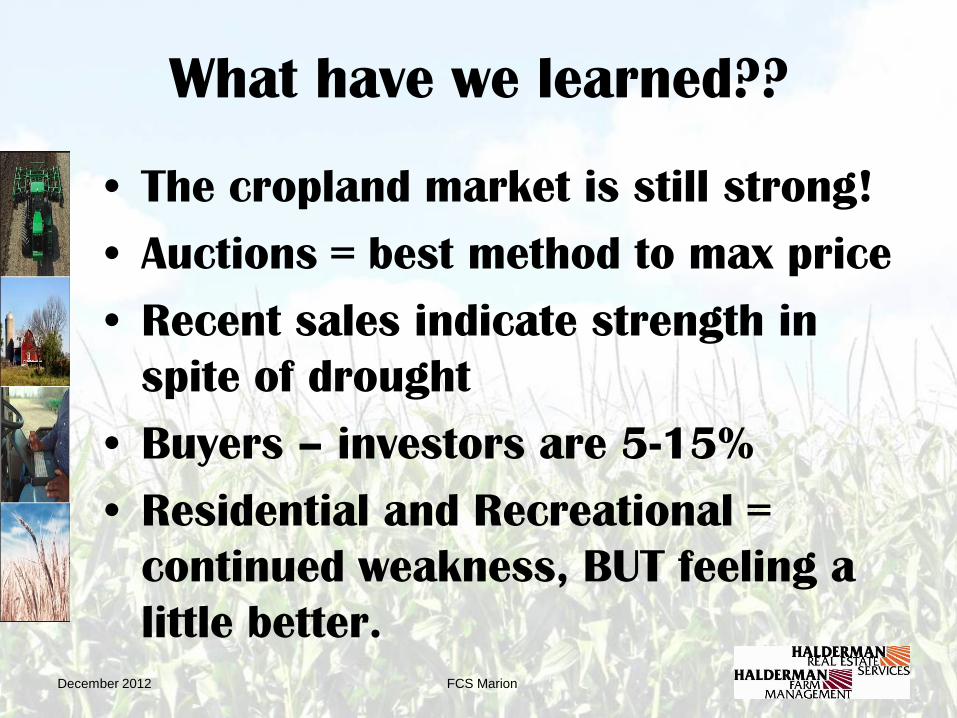
What have we learned??
• The cropland market is still strong!
• Auctions = best method to max price
• Recent sales indicate strength in
spite of drought
• Buyers – investors are 5-15%
• Residential and Recreational =
continued weakness, BUT feeling a
little better.
December 2012 FCS Marion
FCS Marion
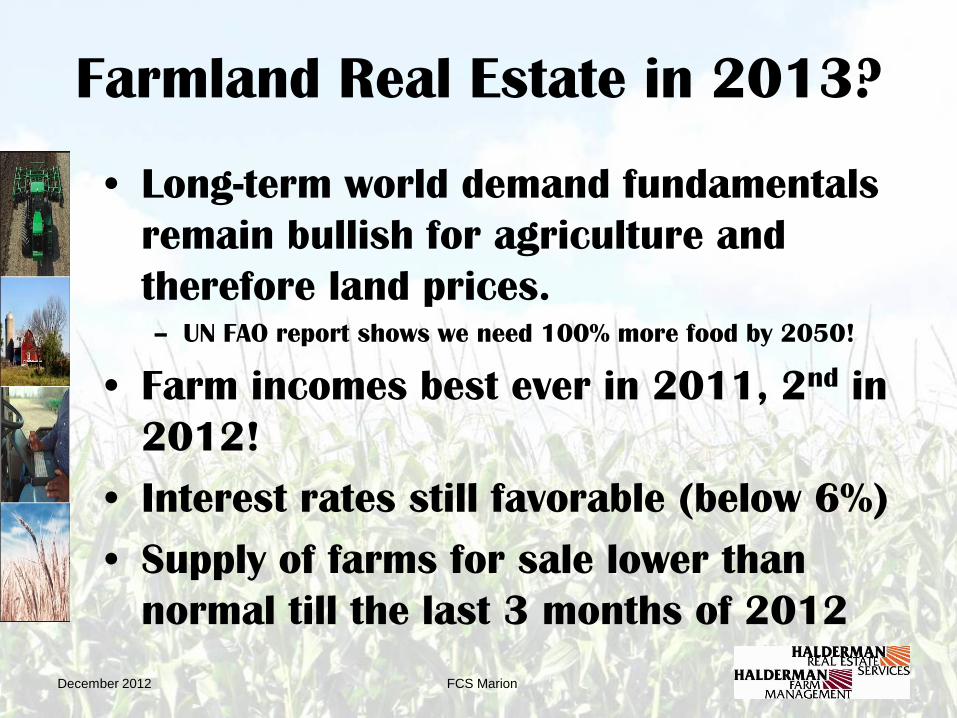
Farmland Real Estate in 2013?
• Long-term world demand fundamentals
remain bullish for agriculture and
therefore land prices. – UN FAO report shows we need 100% more food by 2050!
• Farm incomes best ever in 2011, 2nd in
2012!
• Interest rates still favorable (below 6%)
• Supply of farms for sale lower than
normal till the last 3 months of 2012
December 2012
DTN Ag Summit
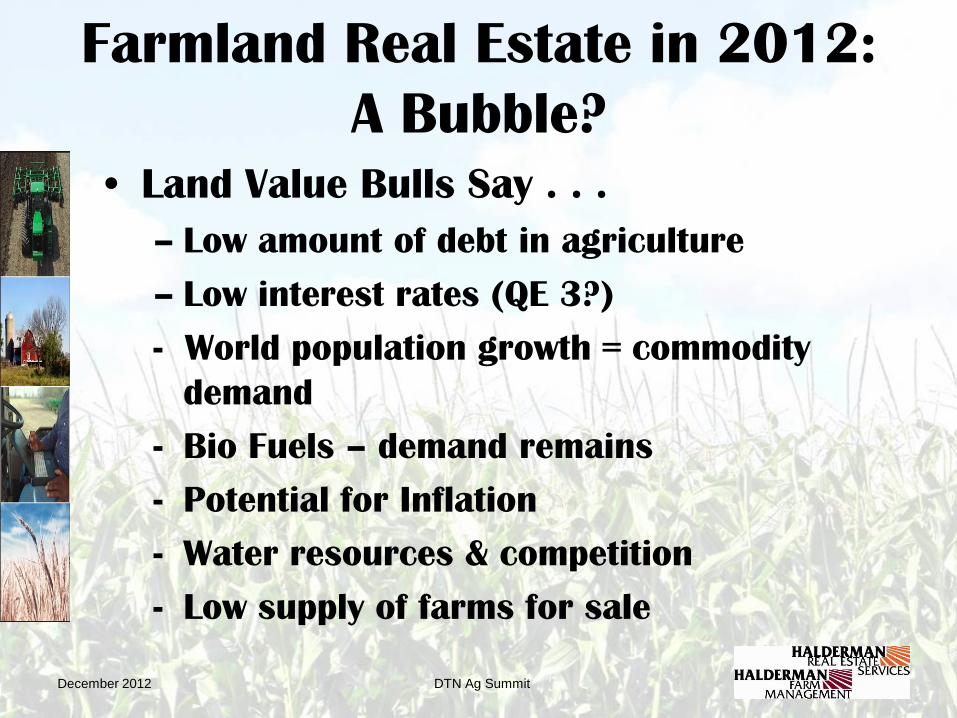
Farmland Real Estate in 2012:
A Bubble?
• Land Value Bulls Say . . .
– Low amount of debt in agriculture
– Low interest rates (QE 3?)
- World population growth = commodity
demand
- Bio Fuels – demand remains
- Potential for Inflation
- Water resources & competition
- Low supply of farms for sale
December 2012
DTN Ag Summit
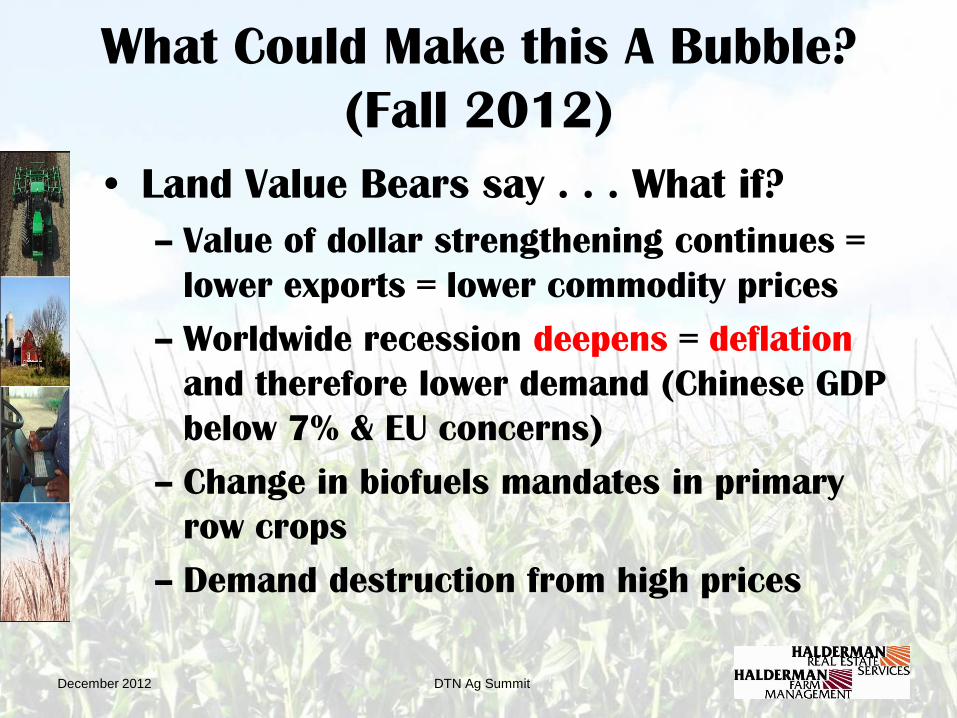
What Could Make this A Bubble?
(Fall 2012)
• Land Value Bears say . . . What if?
– Value of dollar strengthening continues =
lower exports = lower commodity prices
– Worldwide recession deepens = deflation
and therefore lower demand (Chinese GDP
below 7% & EU concerns)
– Change in biofuels mandates in primary
row crops
– Demand destruction from high prices
December 2012
DTN Ag Summit
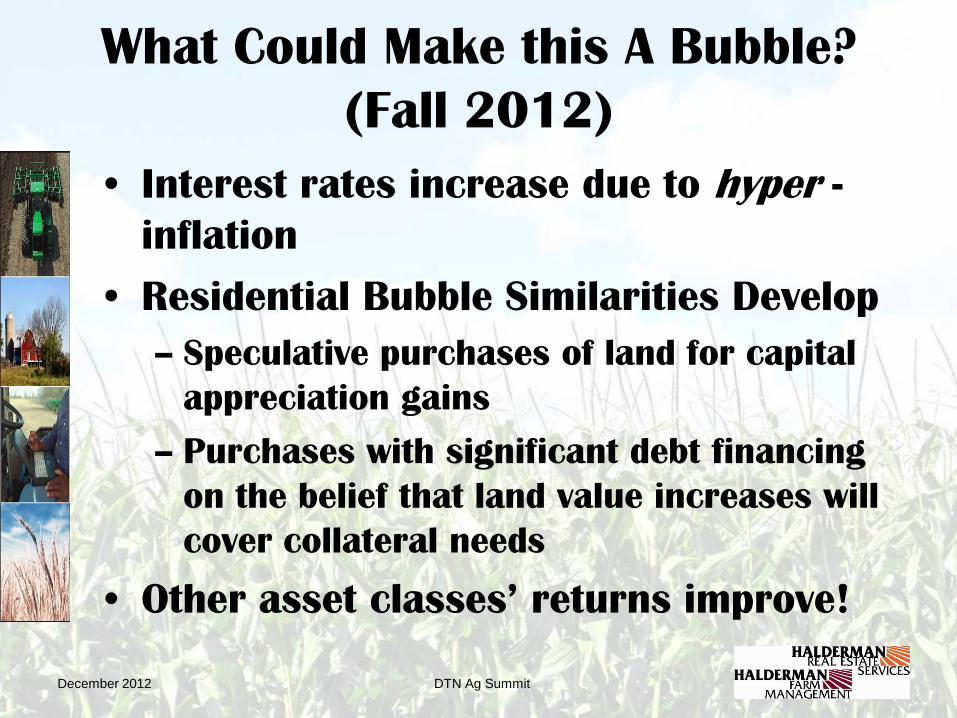
What Could Make this A Bubble?
(Fall 2012)
• Interest rates increase due to hyper -
inflation
• Residential Bubble Similarities Develop
– Speculative purchases of land for capital
appreciation gains
– Purchases with significant debt financing
on the belief that land value increases will
cover collateral needs
• Other asset classes’ returns improve!
December 2012
DTN Ag Summit
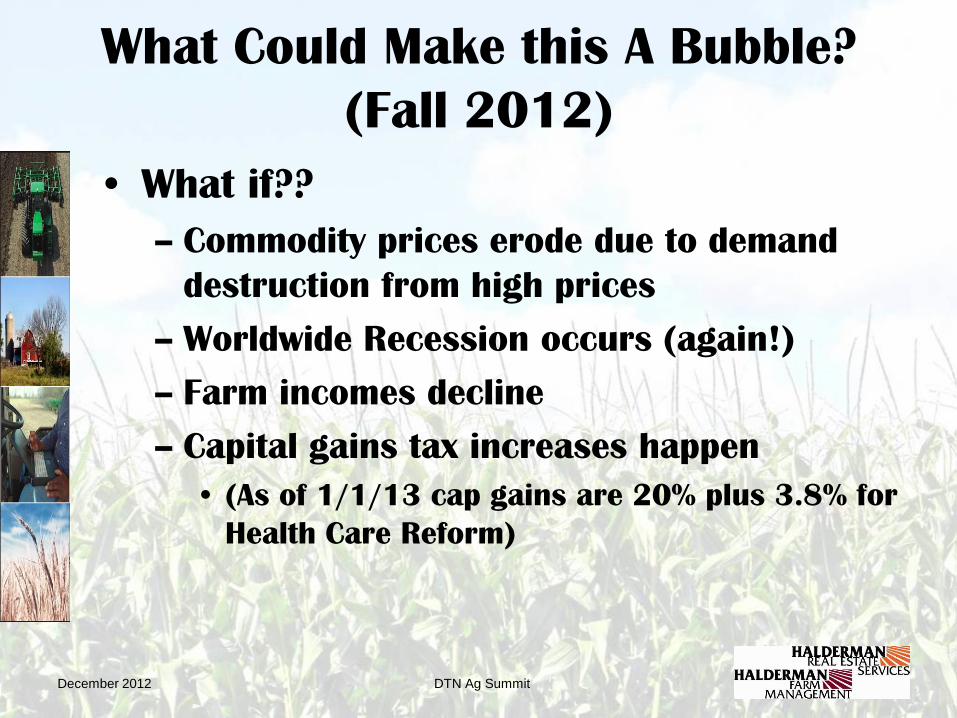
What Could Make this A Bubble?
(Fall 2012)
• What if??
– Commodity prices erode due to demand
destruction from high prices
– Worldwide Recession occurs (again!)
– Farm incomes decline
– Capital gains tax increases happen
• (As of 1/1/13 cap gains are 20% plus 3.8% for
Health Care Reform)
December 2012
DTN Ag Summit
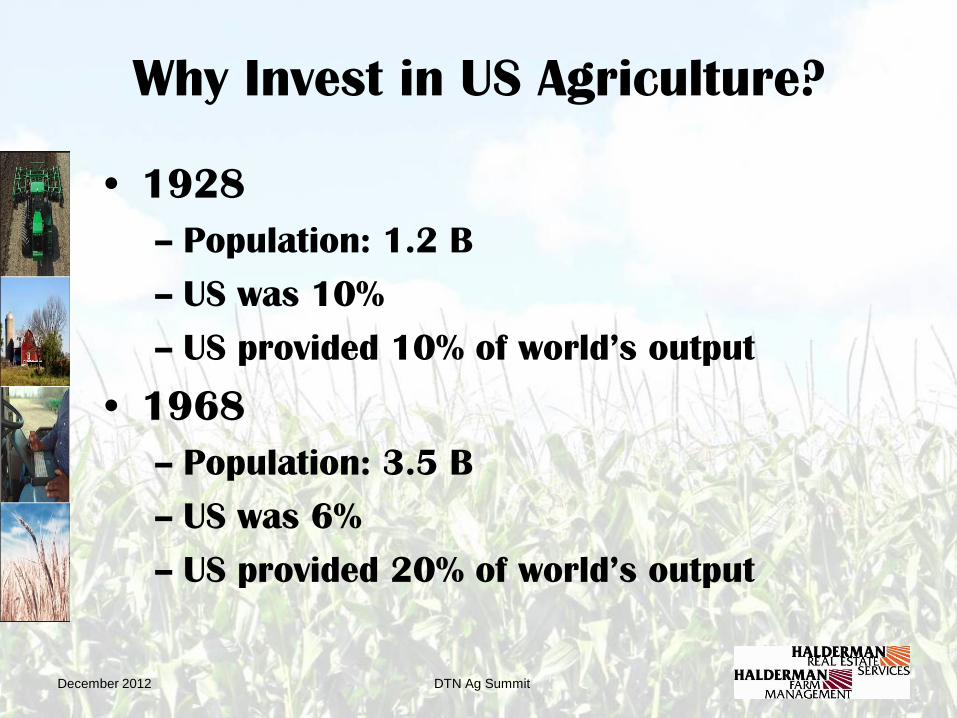
Why Invest in US Agriculture?
• 1928
– Population: 1.2 B
– US was 10%
– US provided 10% of world’s output
• 1968
– Population: 3.5 B
– US was 6%
– US provided 20% of world’s output
December 2012
DTN Ag Summit
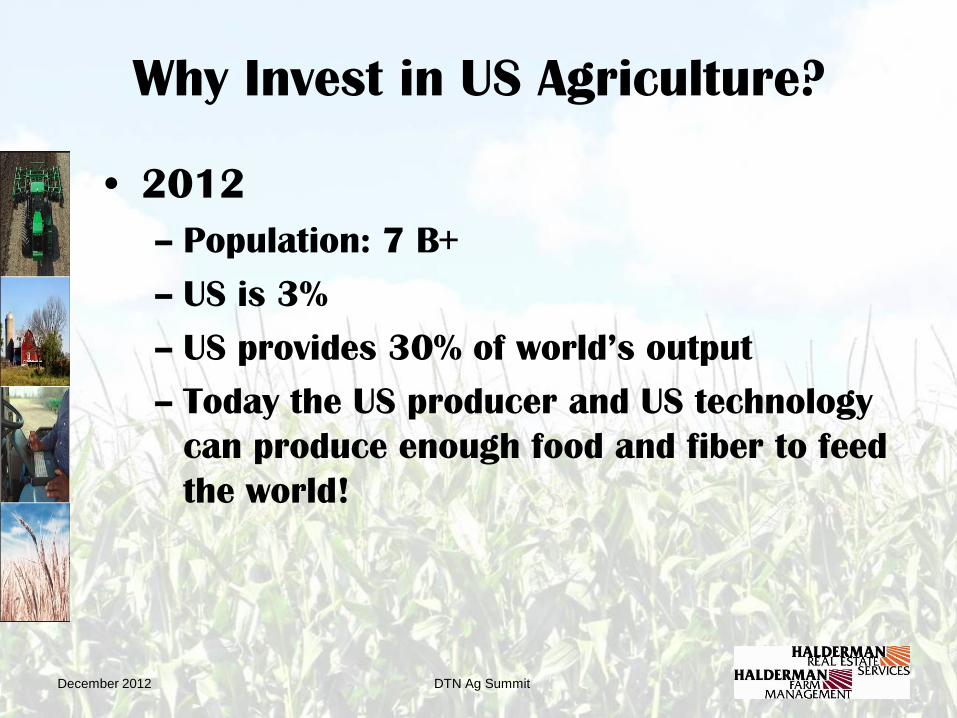
Why Invest in US Agriculture?
• 2012
– Population: 7 B+
– US is 3%
– US provides 30% of world’s output
– Today the US producer and US technology
can produce enough food and fiber to feed
the world!
December 2012
Halderman Companies Information
F. Howard Halderman, AFM President
Halderman Farm Management Service, Inc.
Halderman Real Estate Services, Inc. P. O. Box 297
Wabash, IN 46992-0297
800-424-2324 260-563-8889 – fax
www.halderman.com
December 2012 DTN Ag Summit