Embed Size (px)
Citation preview
1Land and Natural Resources
The analytical capabilities of GIS have a profound effect on critical decisions regarding the earth’s resources. More than ever before, we must manage, preserve, and restore natural resources by gaining a deeper under-standing of environmental problems and bringing more accurate information to the table. There is no simple solution to our environmental and natural resource con-cerns, but whether restoring habitats, planting crops, drilling for oil, or monitoring endangered species, there is increasing optimism that the application of GIS tools will help us become a more sustainable planet.
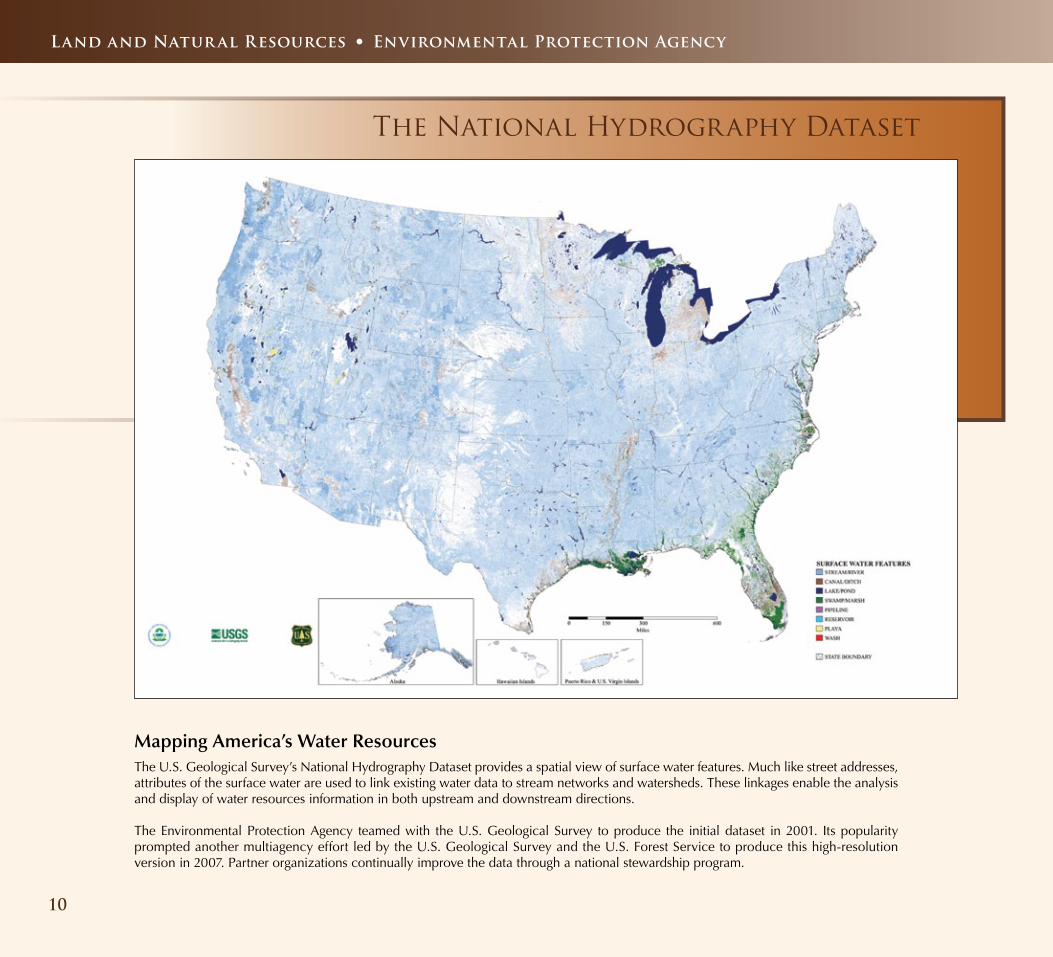
The National Hydrography Dataset
Mapping America’s Water Resources The U.S. Geological Survey’s National Hydrography Dataset provides a spatial view of surface water features. Much like street addresses, attributes of the surface water are used to link existing water data to stream networks and watersheds. These linkages enable the analysis and display of water resources information in both upstream and downstream directions.
The Environmental Protection Agency teamed with the U.S. Geological Survey to produce the initial dataset in 2001. Its popularity prompted another multiagency effort led by the U.S. Geological Survey and the U.S. Forest Service to produce this high-resolution version in 2007. Partner organizations continually improve the data through a national stewardship program.
Land and Natur al Resources • Environmental Protection Agency
10
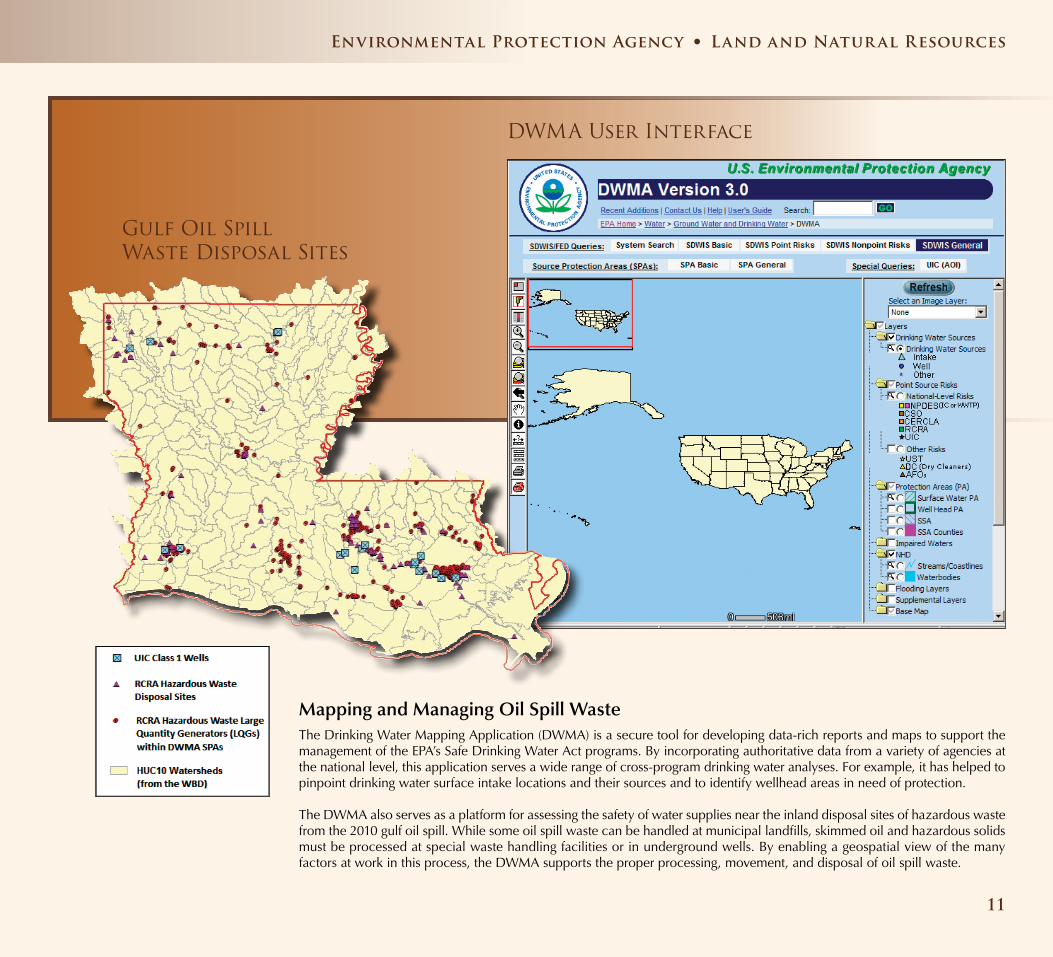
Mapping and Managing Oil Spill WasteThe Drinking Water Mapping Application (DWMA) is a secure tool for developing data-rich reports and maps to support the management of the EPA’s Safe Drinking Water Act programs. By incorporating authoritative data from a variety of agencies at the national level, this application serves a wide range of cross-program drinking water analyses. For example, it has helped to pinpoint drinking water surface intake locations and their sources and to identify wellhead areas in need of protection.
The DWMA also serves as a platform for assessing the safety of water supplies near the inland disposal sites of hazardous waste from the 2010 gulf oil spill. While some oil spill waste can be handled at municipal landfills, skimmed oil and hazardous solids must be processed at special waste handling facilities or in underground wells. By enabling a geospatial view of the many factors at work in this process, the DWMA supports the proper processing, movement, and disposal of oil spill waste.
Gulf Oil Spill Waste Disposal Sites
DWMA User Interface
Environmental Protection Agency • Land and Natur al Resources
11
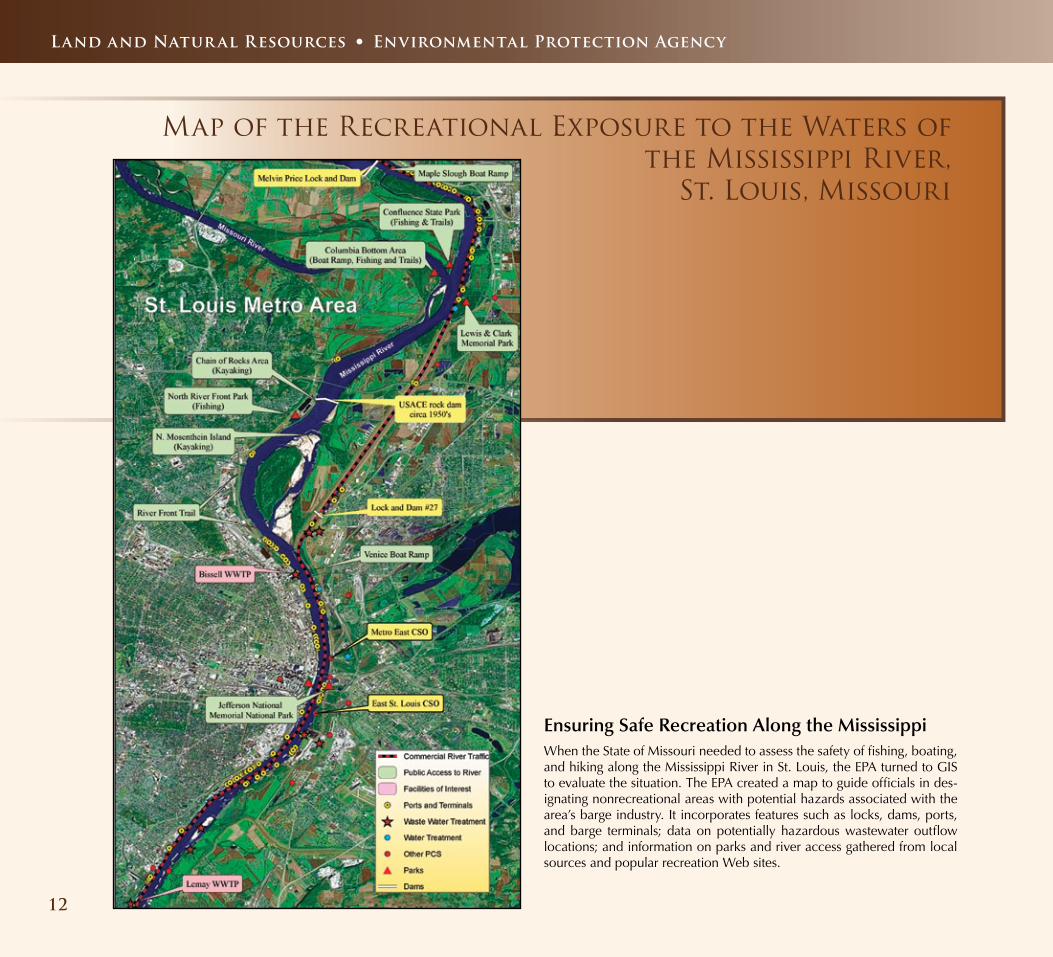
Map of the Recreational Exposure to the Waters of the Mississippi River,
St. Louis, Missouri
Ensuring Safe Recreation Along the MississippiWhen the State of Missouri needed to assess the safety of fishing, boating, and hiking along the Mississippi River in St. Louis, the EPA turned to GIS to evaluate the situation. The EPA created a map to guide officials in des-ignating nonrecreational areas with potential hazards associated with the area’s barge industry. It incorporates features such as locks, dams, ports, and barge terminals; data on potentially hazardous wastewater outflow locations; and information on parks and river access gathered from local sources and popular recreation Web sites.
Land and Natur al Resources • Environmental Protection Agency
12
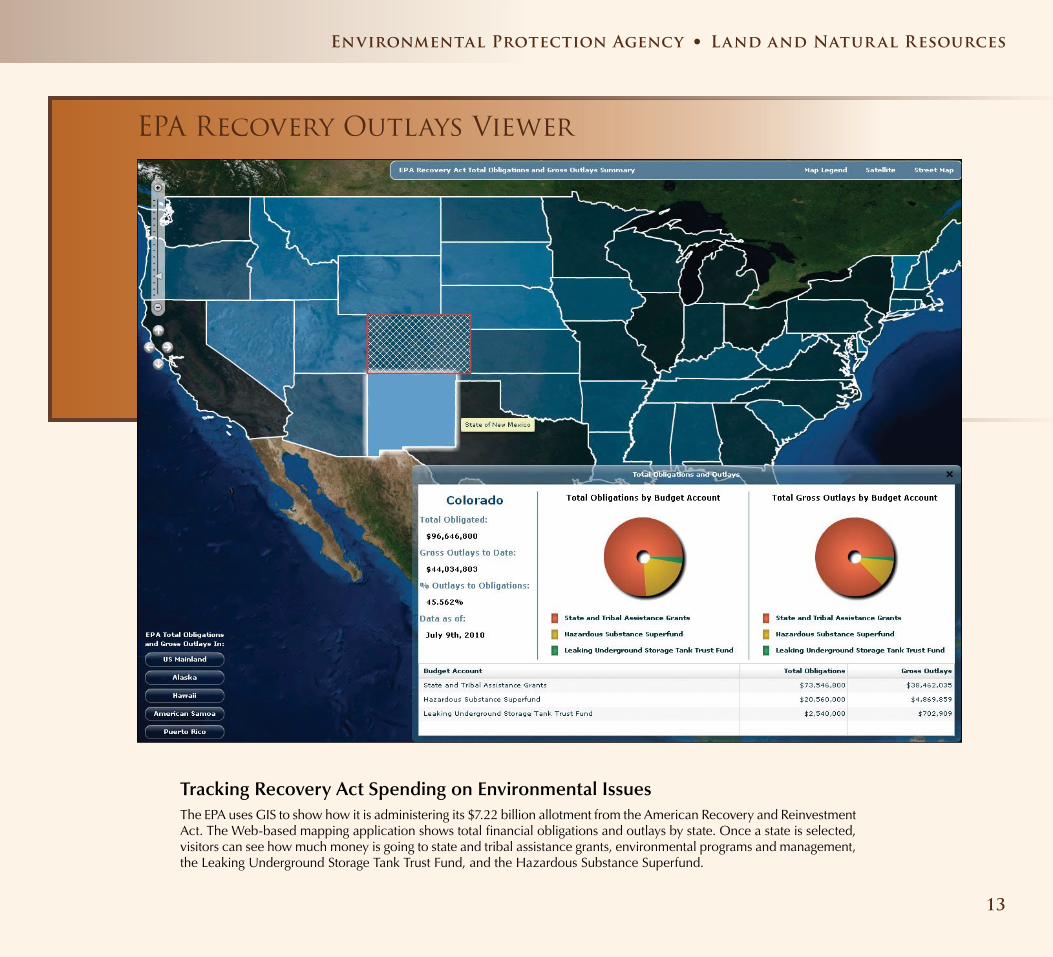
EPA Recovery Outlays Viewer
Tracking Recovery Act Spending on Environmental IssuesThe EPA uses GIS to show how it is administering its $7.22 billion allotment from the American Recovery and Reinvestment Act. The Web-based mapping application shows total financial obligations and outlays by state. Once a state is selected, visitors can see how much money is going to state and tribal assistance grants, environmental programs and management, the Leaking Underground Storage Tank Trust Fund, and the Hazardous Substance Superfund.
Environmental Protection Agency • Land and Natur al Resources
13
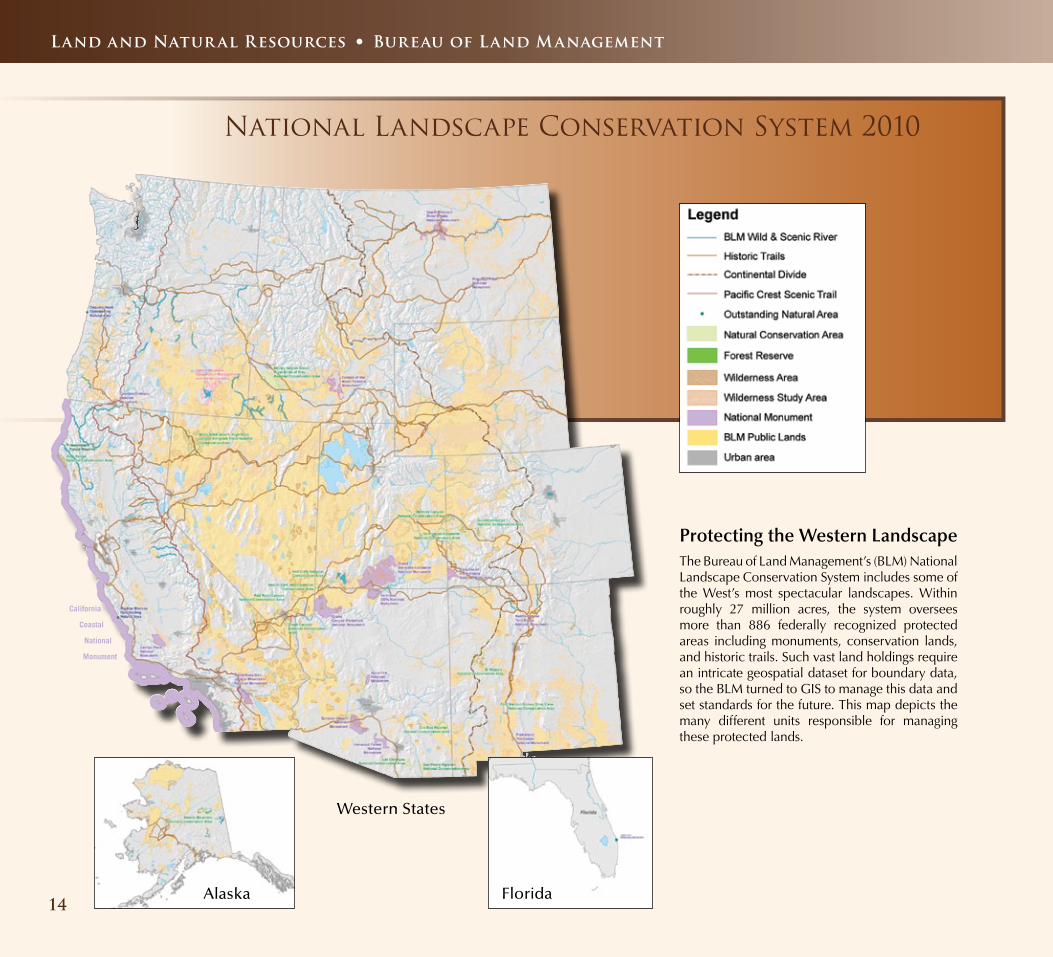
National Landscape Conservation System 2010
Protecting the Western LandscapeThe Bureau of Land Management’s (BLM) National Landscape Conservation System includes some of the West’s most spectacular landscapes. Within roughly 27 million acres, the system oversees more than 886 federally recognized protected areas including monuments, conservation lands, and historic trails. Such vast land holdings require an intricate geospatial dataset for boundary data, so the BLM turned to GIS to manage this data and set standards for the future. This map depicts the many different units responsible for managing these protected lands.
Alaska Florida
Western States
California
Coastal
National
Monument
Land and Natur al Resources • Bureau of Land Management
14

Ridge to Rivers Trail System
Preserving Boise’s FoothillsIn 1992, the “Ridge to Rivers” public-private partnership was formed to protect and manage Boise, Idaho’s, distinctive foothills, and the extensive trail system that links the city with its neighboring natural public lands. To ensure public access and responsible use of more than 130 miles of roads and trails — some of which cross private lands — the partnership uses GIS to map the trail system and manage information on land ownership and use.
Bureau of Land Management • Land and Natur al Resources
15
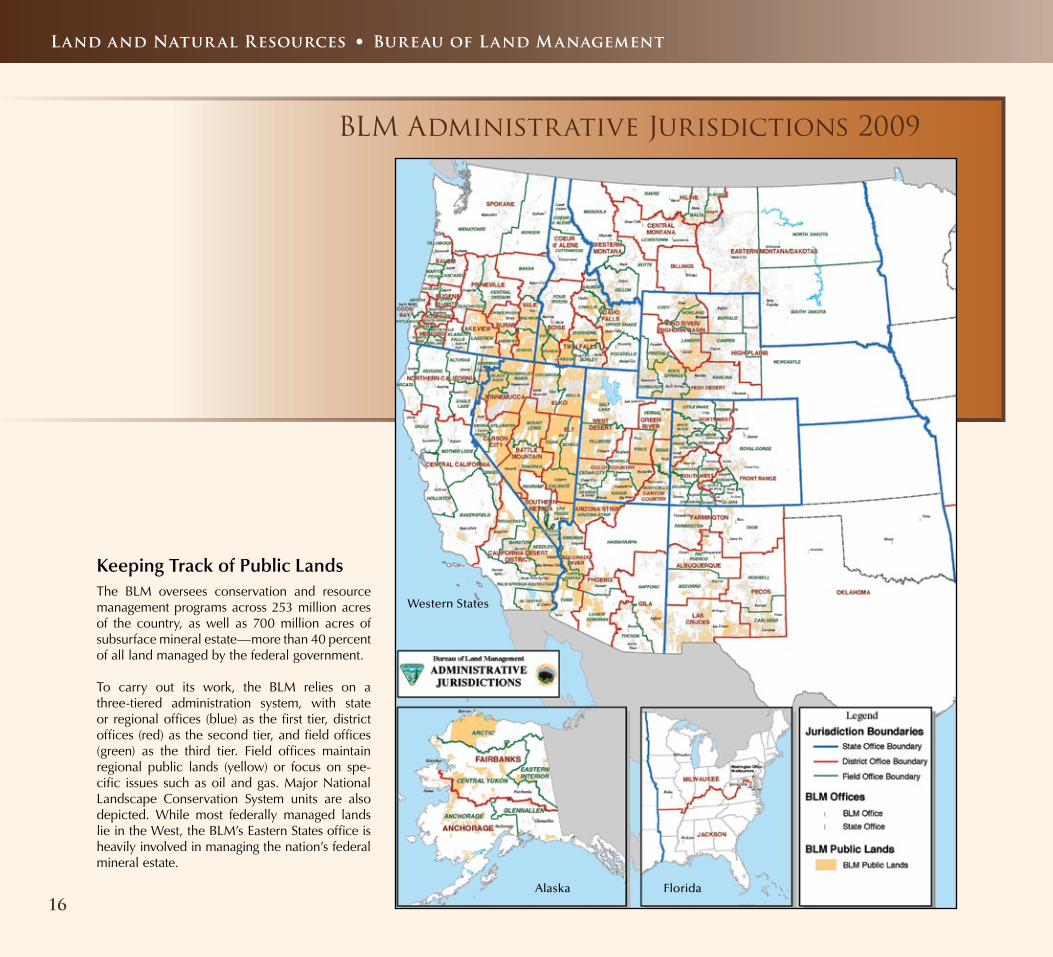
BLM Administrative Jurisdictions 2009
Alaska
Western States
Florida
Keeping Track of Public LandsThe BLM oversees conservation and resource management programs across 253 million acres of the country, as well as 700 million acres of subsurface mineral estate — more than 40 percent of all land managed by the federal government.
To carry out its work, the BLM relies on a three-tiered administration system, with state or regional offices (blue) as the first tier, district offices (red) as the second tier, and field offices (green) as the third tier. Field offices maintain regional public lands (yellow) or focus on spe-cific issues such as oil and gas. Major National Landscape Conservation System units are also depicted. While most federally managed lands lie in the West, the BLM’s Eastern States office is heavily involved in managing the nation’s federal mineral estate.
Land and Natur al Resources • Bureau of Land Management
16
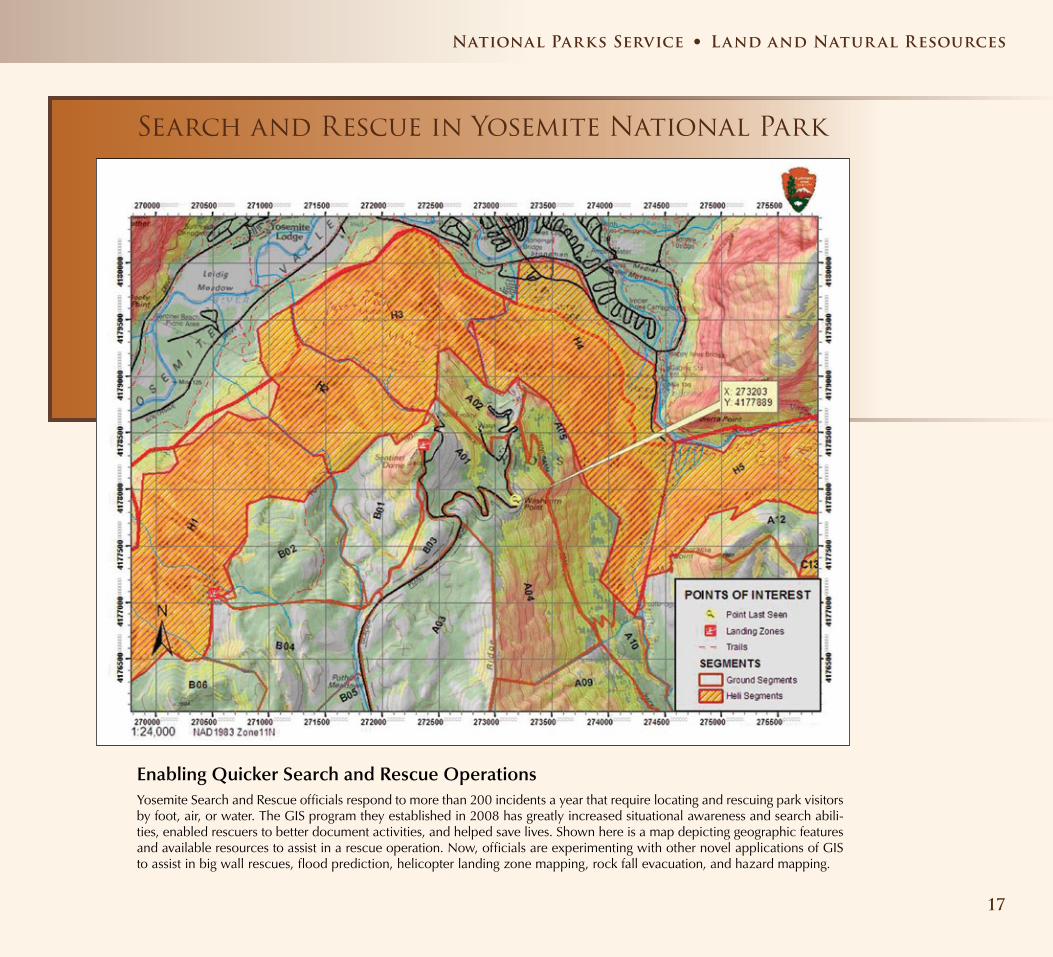
Search and Rescue in Yosemite National Park
Enabling Quicker Search and Rescue OperationsYosemite Search and Rescue officials respond to more than 200 incidents a year that require locating and rescuing park visitors by foot, air, or water. The GIS program they established in 2008 has greatly increased situational awareness and search abili-ties, enabled rescuers to better document activities, and helped save lives. Shown here is a map depicting geographic features and available resources to assist in a rescue operation. Now, officials are experimenting with other novel applications of GIS to assist in big wall rescues, flood prediction, helicopter landing zone mapping, rock fall evacuation, and hazard mapping.
17
National Parks Service • Land and Natur al Resources
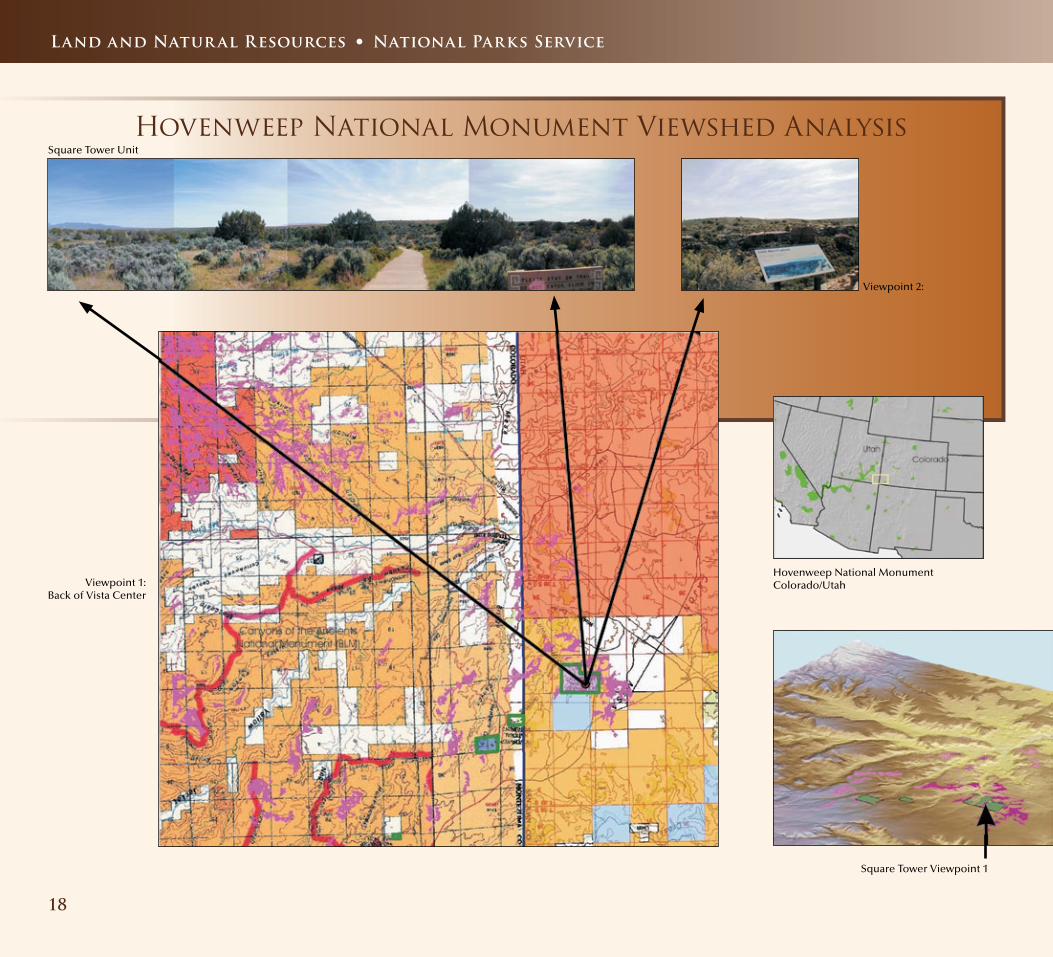
Hovenweep National Monument Viewshed AnalysisSquare Tower Unit
Viewpoint 2:
Hovenweep National MonumentColorado/Utah
Square Tower Viewpoint 1
Viewpoint 1:Back of Vista Center
Land and Natur al Resources • National Parks Service
18
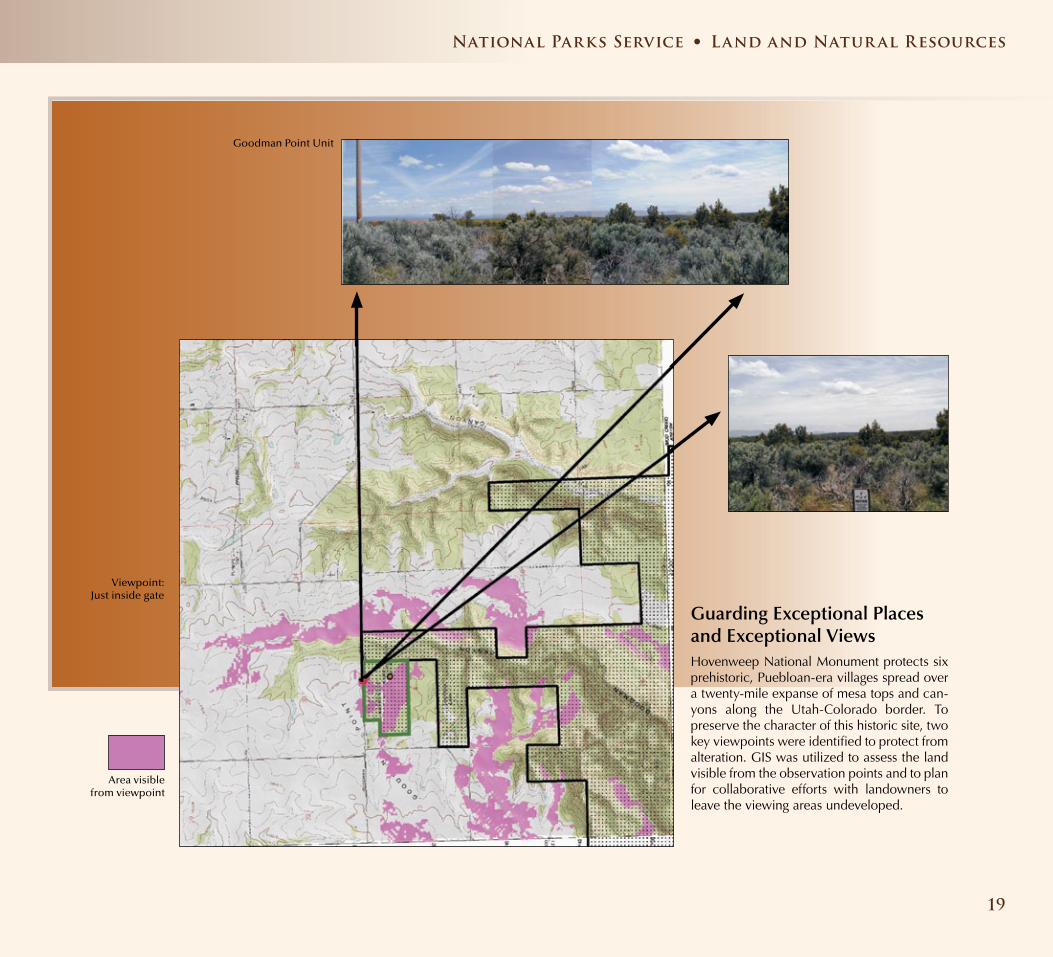
Area visible from viewpoint
Goodman Point Unit
Viewpoint:Just inside gate
Guarding Exceptional Places and Exceptional ViewsHovenweep National Monument protects six prehistoric, Puebloan-era villages spread over a twenty-mile expanse of mesa tops and can-yons along the Utah-Colorado border. To preserve the character of this historic site, two key viewpoints were identified to protect from alteration. GIS was utilized to assess the land visible from the observation points and to plan for collaborative efforts with landowners to leave the viewing areas undeveloped.
National Parks Service • Land and Natur al Resources
19
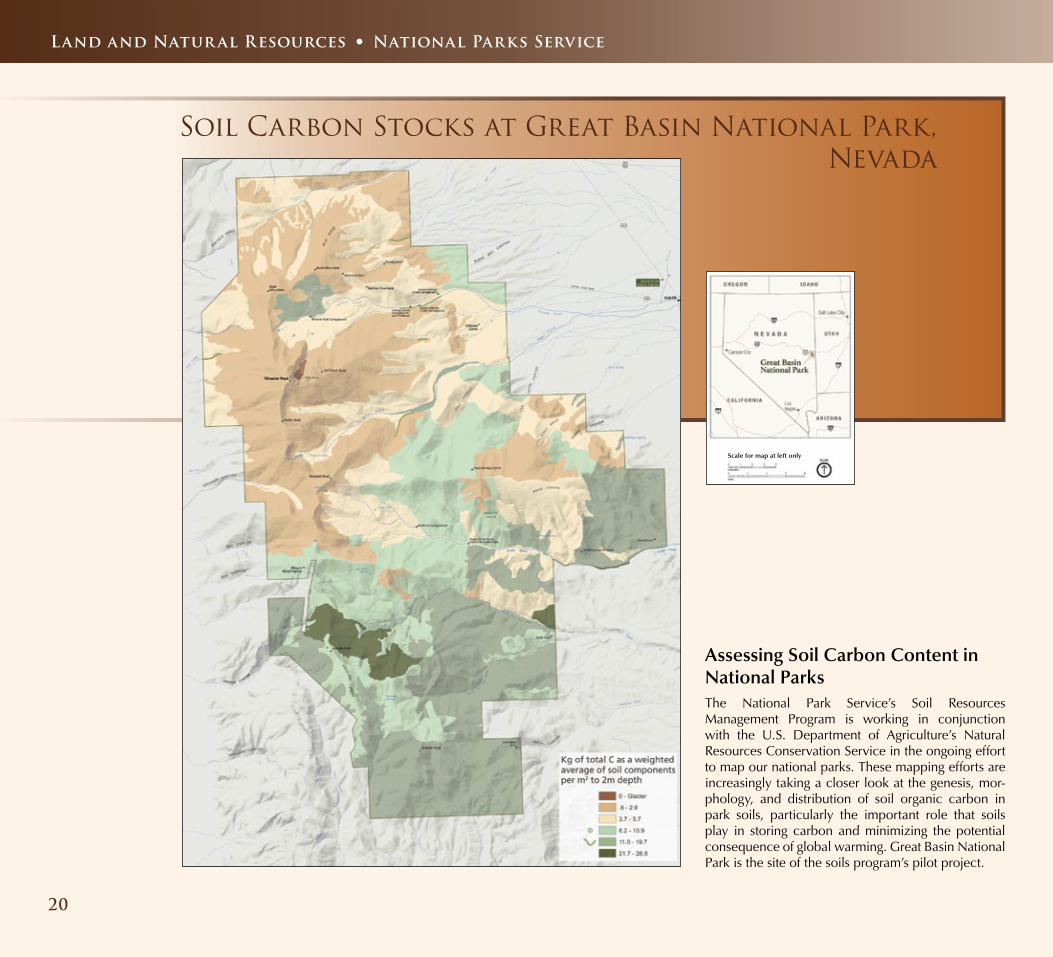
Soil Carbon Stocks at Great Basin National Park, Nevada
Assessing Soil Carbon Content in National ParksThe National Park Service’s Soil Resources Management Program is working in conjunction with the U.S. Department of Agriculture’s Natural Resources Conservation Service in the ongoing effort to map our national parks. These mapping efforts are increasingly taking a closer look at the genesis, mor-phology, and distribution of soil organic carbon in park soils, particularly the important role that soils play in storing carbon and minimizing the potential consequence of global warming. Great Basin National Park is the site of the soils program’s pilot project.
Scale for map at left only
Land and Natur al Resources • National Parks Service
20
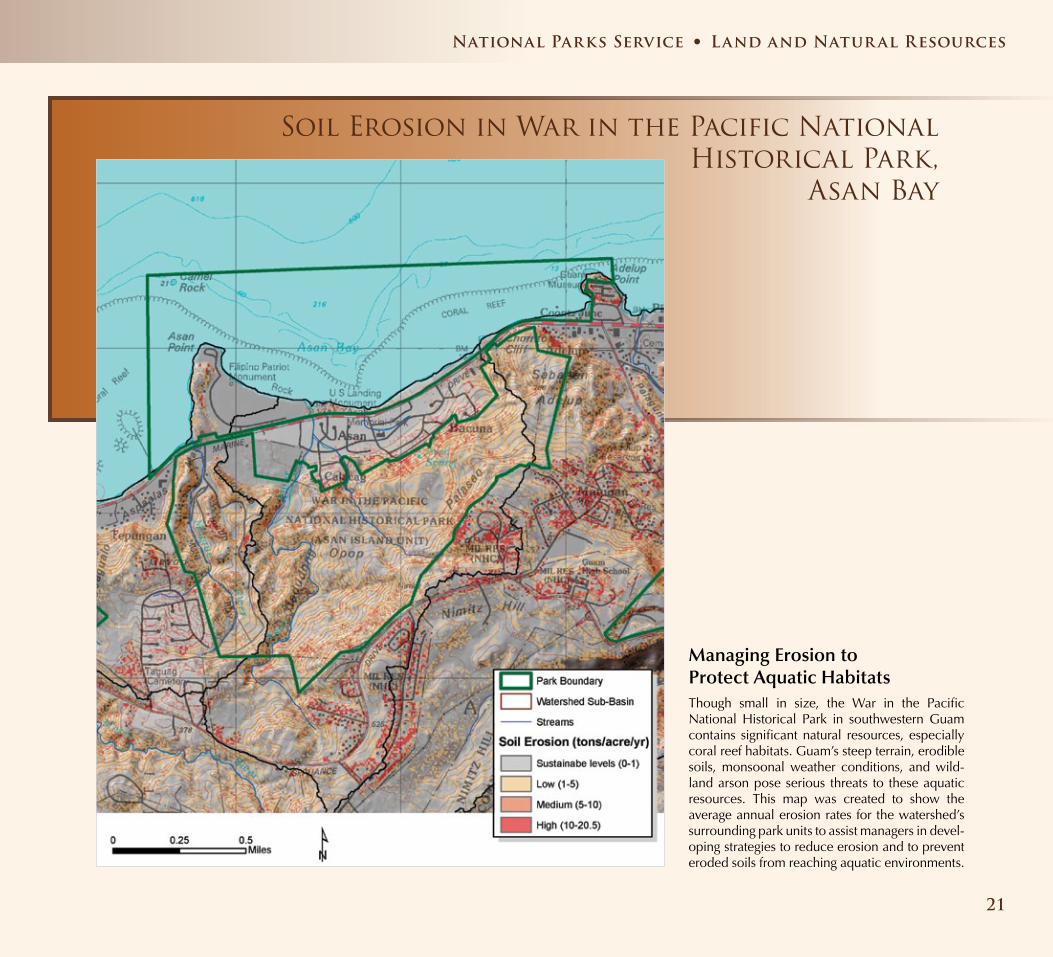
Soil Erosion in War in the Pacific National Historical Park,
Asan Bay
Managing Erosion to Protect Aquatic HabitatsThough small in size, the War in the Pacific National Historical Park in southwestern Guam contains significant natural resources, especially coral reef habitats. Guam’s steep terrain, erodible soils, monsoonal weather conditions, and wild-land arson pose serious threats to these aquatic resources. This map was created to show the average annual erosion rates for the watershed’s surrounding park units to assist managers in devel-oping strategies to reduce erosion and to prevent eroded soils from reaching aquatic environments.
National Parks Service • Land and Natur al Resources
21
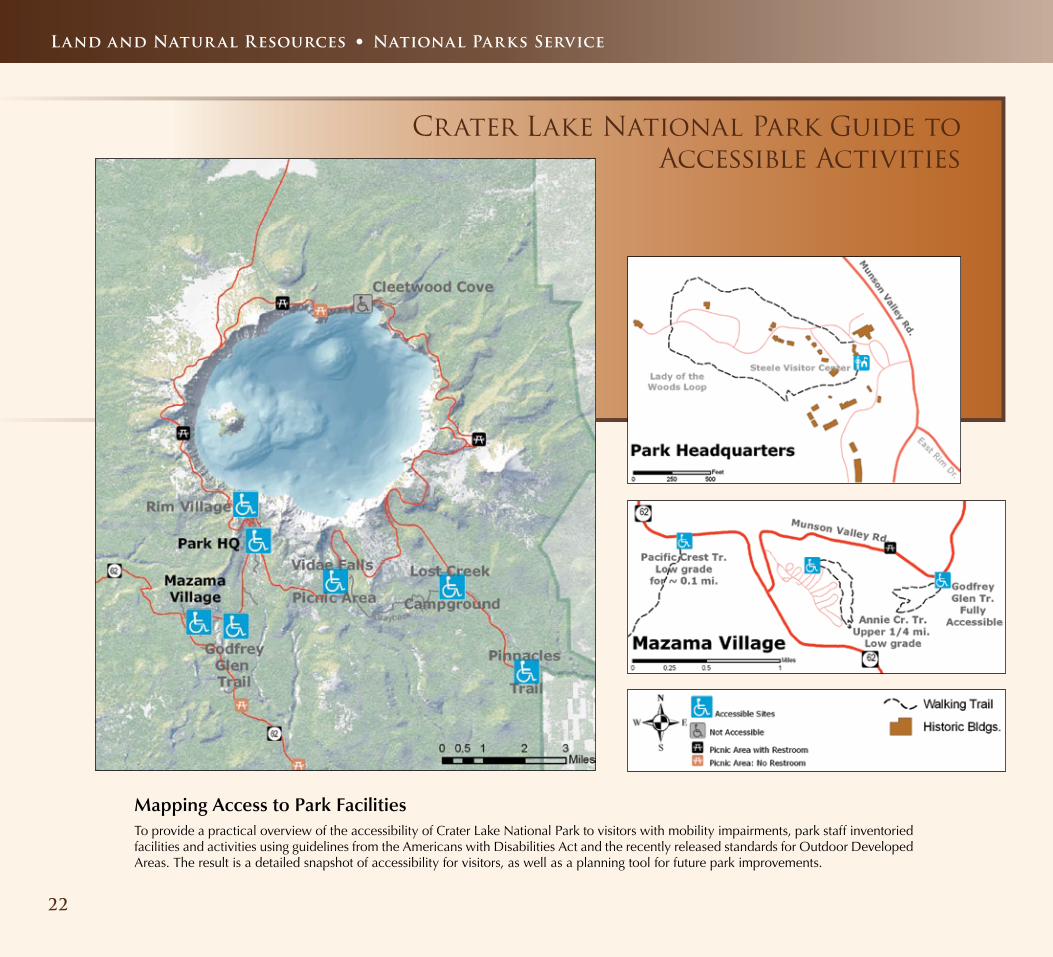
Crater Lake National Park Guide to Accessible Activities
Mapping Access to Park FacilitiesTo provide a practical overview of the accessibility of Crater Lake National Park to visitors with mobility impairments, park staff inventoried facilities and activities using guidelines from the Americans with Disabilities Act and the recently released standards for Outdoor Developed Areas. The result is a detailed snapshot of accessibility for visitors, as well as a planning tool for future park improvements.
Land and Natur al Resources • National Parks Service
22
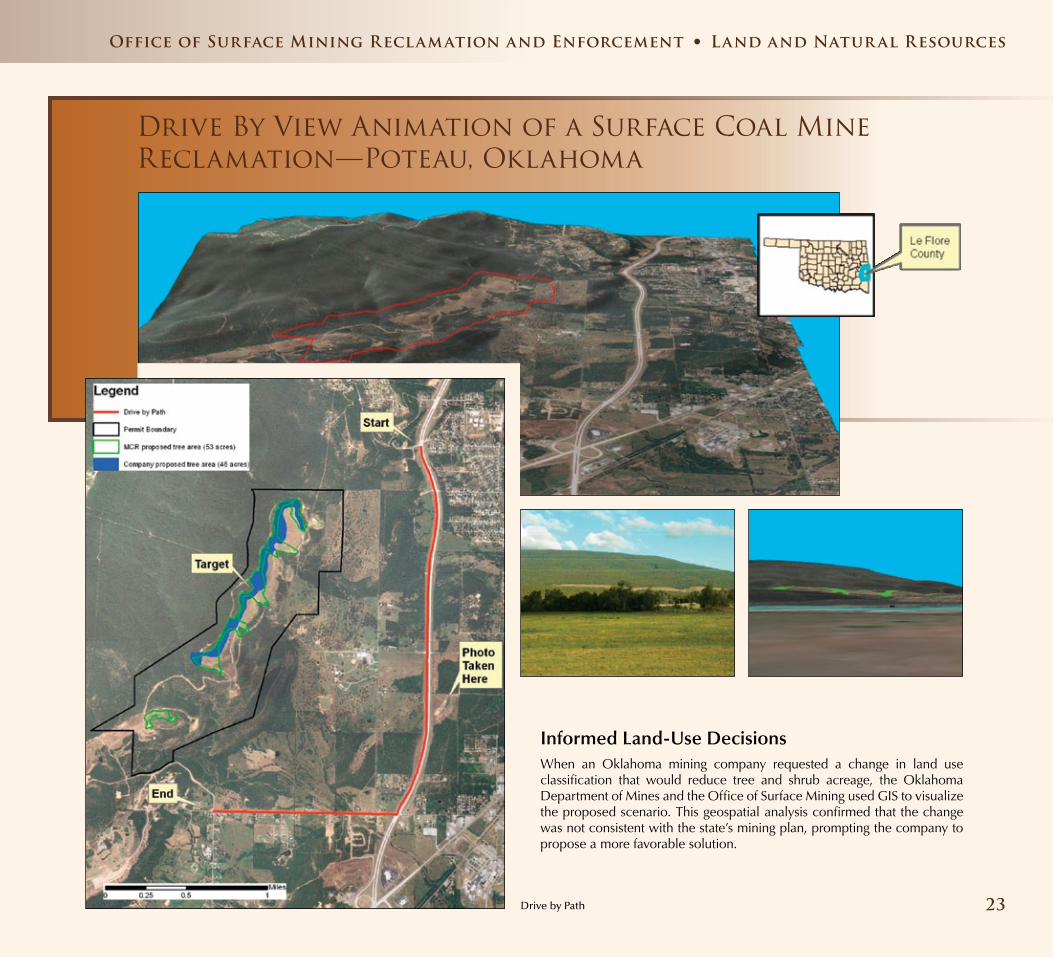
Drive By View Animation of a Surface Coal Mine Reclamation — Poteau, Oklahoma
Informed Land-Use DecisionsWhen an Oklahoma mining company requested a change in land use classification that would reduce tree and shrub acreage, the Oklahoma Department of Mines and the Office of Surface Mining used GIS to visualize the proposed scenario. This geospatial analysis confirmed that the change was not consistent with the state’s mining plan, prompting the company to propose a more favorable solution.
Drive by Path 23
Office of Surface Mining Reclamation and Enforcement • Land and Natur al Resources
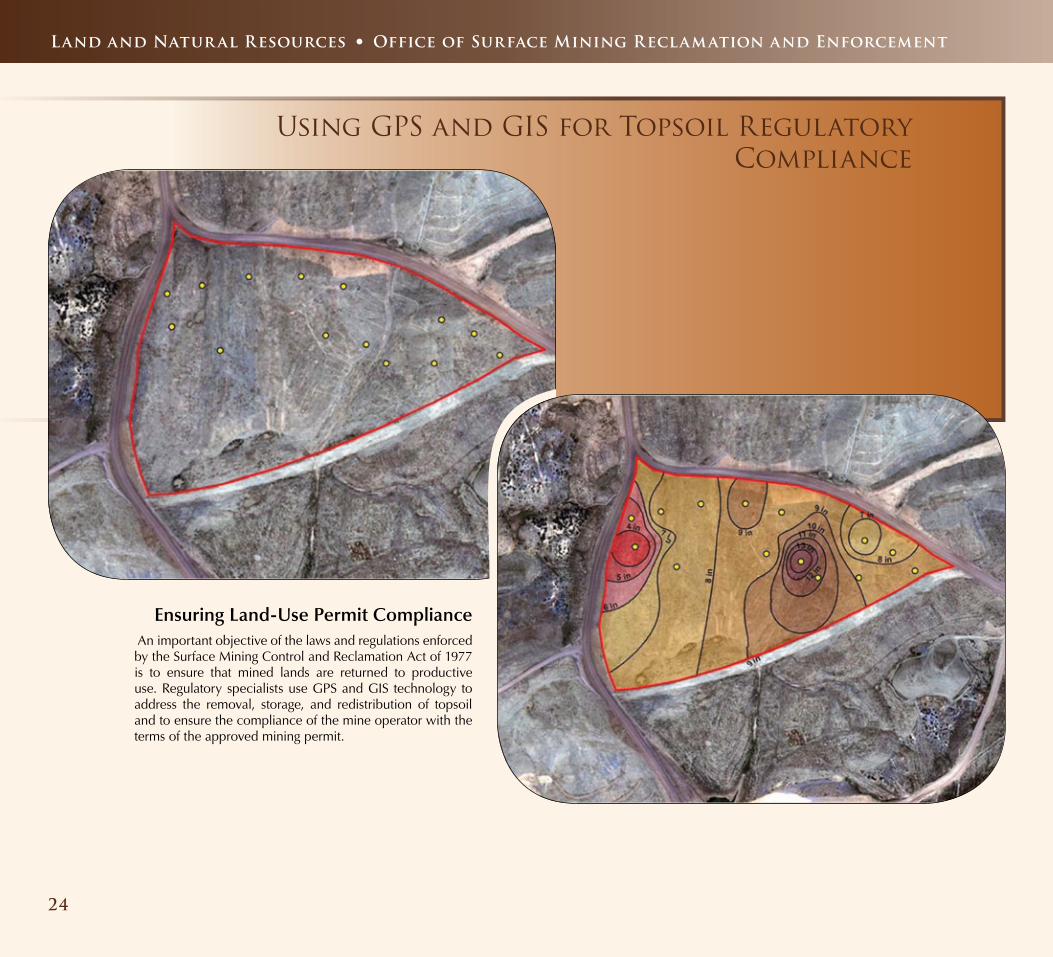
Using GPS and GIS for Topsoil Regulatory Compliance
Ensuring Land-Use Permit Compliance An important objective of the laws and regulations enforced by the Surface Mining Control and Reclamation Act of 1977 is to ensure that mined lands are returned to productive use. Regulatory specialists use GPS and GIS technology to address the removal, storage, and redistribution of topsoil and to ensure the compliance of the mine operator with the terms of the approved mining permit.
Land and Natur al Resources • Office of Surface Mining Reclamation and Enforcement
24
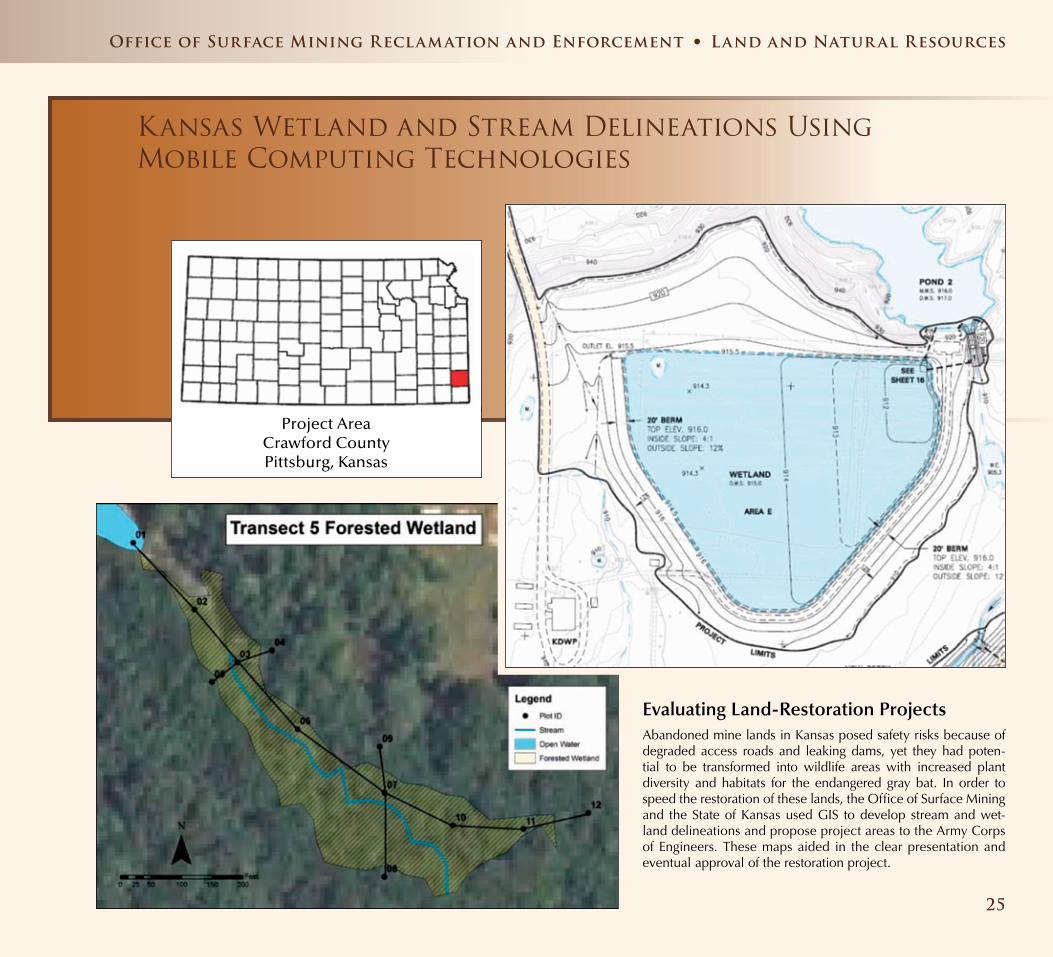
Kansas Wetland and Stream Delineations Using Mobile Computing Technologies
Evaluating Land-Restoration ProjectsAbandoned mine lands in Kansas posed safety risks because of degraded access roads and leaking dams, yet they had poten-tial to be transformed into wildlife areas with increased plant diversity and habitats for the endangered gray bat. In order to speed the restoration of these lands, the Office of Surface Mining and the State of Kansas used GIS to develop stream and wet-land delineations and propose project areas to the Army Corps of Engineers. These maps aided in the clear presentation and eventual approval of the restoration project.
Project AreaCrawford CountyPittsburg, Kansas
Office of Surface Mining Reclamation and Enforcement • Land and Natur al Resources
25

Interbasin Transfer of Mine Water — A Case Study
Modeling the Impact of New Water Facilities The Office of Surface Mining Reclamation and Enforcement developed maps to model the impact of a new water treatment and drainage system for a mine pool near Ohio’s Susquehanna River. This geospatial information guided recommendations for the safe and efficient operations at the new facility.
26
Land and Natur al Resources • Office of Surface Mining Reclamation and Enforcement

Mapping Vulnerability to Disasters in Latin America and the Caribbean, 1900–2007
Measuring Disaster VulnerabilityThe vulnerability of populations and infrastructure to hazardous events is a factor of both the probability of disaster and a community’s ability to cope with the resulting damage. To mitigate and prepare for disaster, authorities must have the ability to accurately identify vulnerable populations and places. Mapping vulner-ability to natural disasters by administrative zones is useful not only in identifying the regions with the great-est vulnerability, but in informing decisions regarding the allocation of relief resources.
Geological Survey • Land and Natur al Resources
27

The North American Breeding Bird Atlas
Combining Datasets to Create a Clearer PictureData from more than twenty published North American Breeding Bird Atlas projects was merged into a central geo-spatial resource for research and con-servation use. This depiction of tufted titmouse distribution demonstrates how compiled datasets may be used to better assess the status of a single spe-cies. Bringing together information from diverse sources on a single map allows for comparison across a region, but viewing combined data should take into account factors such as differences in data-collection methods, ages of atlas data, and different sampling methods.
Land and Natur al Resources • Geological Survey
28
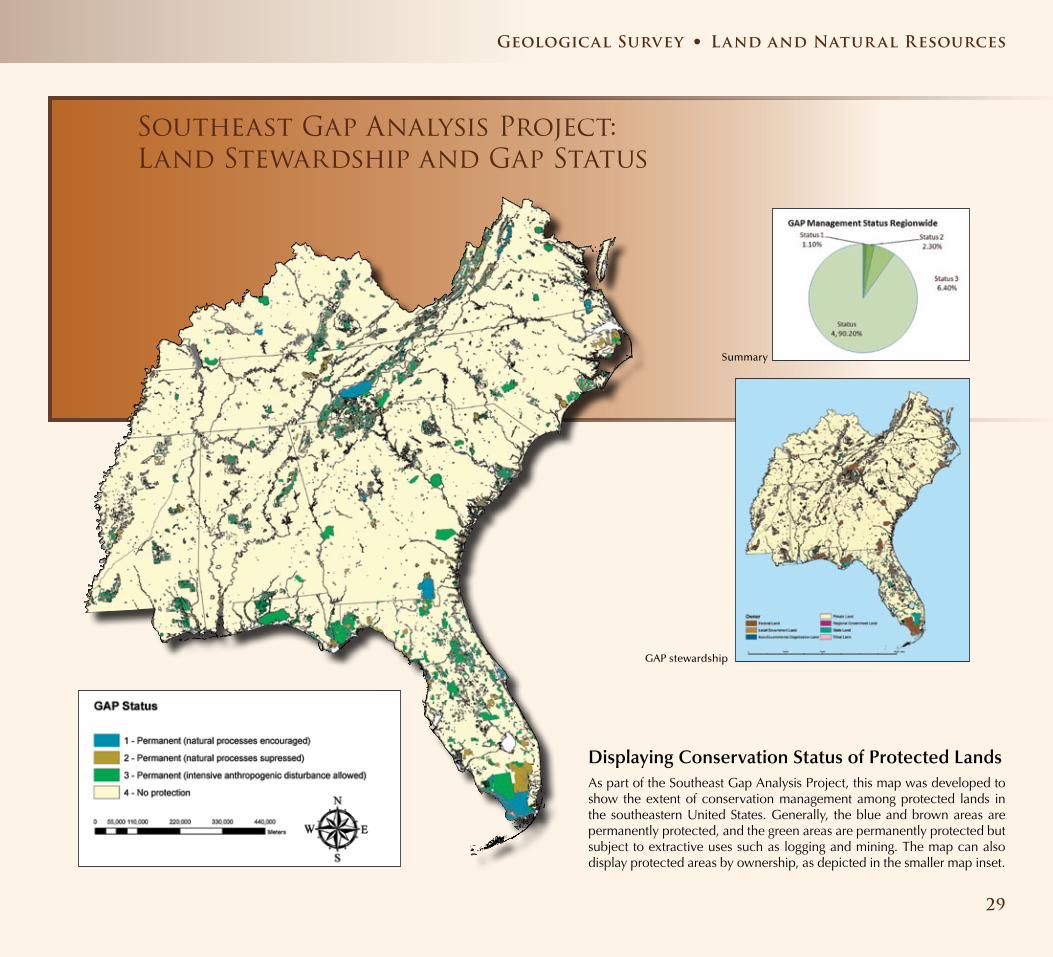
Southeast Gap Analysis Project: Land Stewardship and Gap Status
Displaying Conservation Status of Protected LandsAs part of the Southeast Gap Analysis Project, this map was developed to show the extent of conservation management among protected lands in the southeastern United States. Generally, the blue and brown areas are permanently protected, and the green areas are permanently protected but subject to extractive uses such as logging and mining. The map can also display protected areas by ownership, as depicted in the smaller map inset.
Summary
GAP stewardship
Geological Survey • Land and Natur al Resources
29
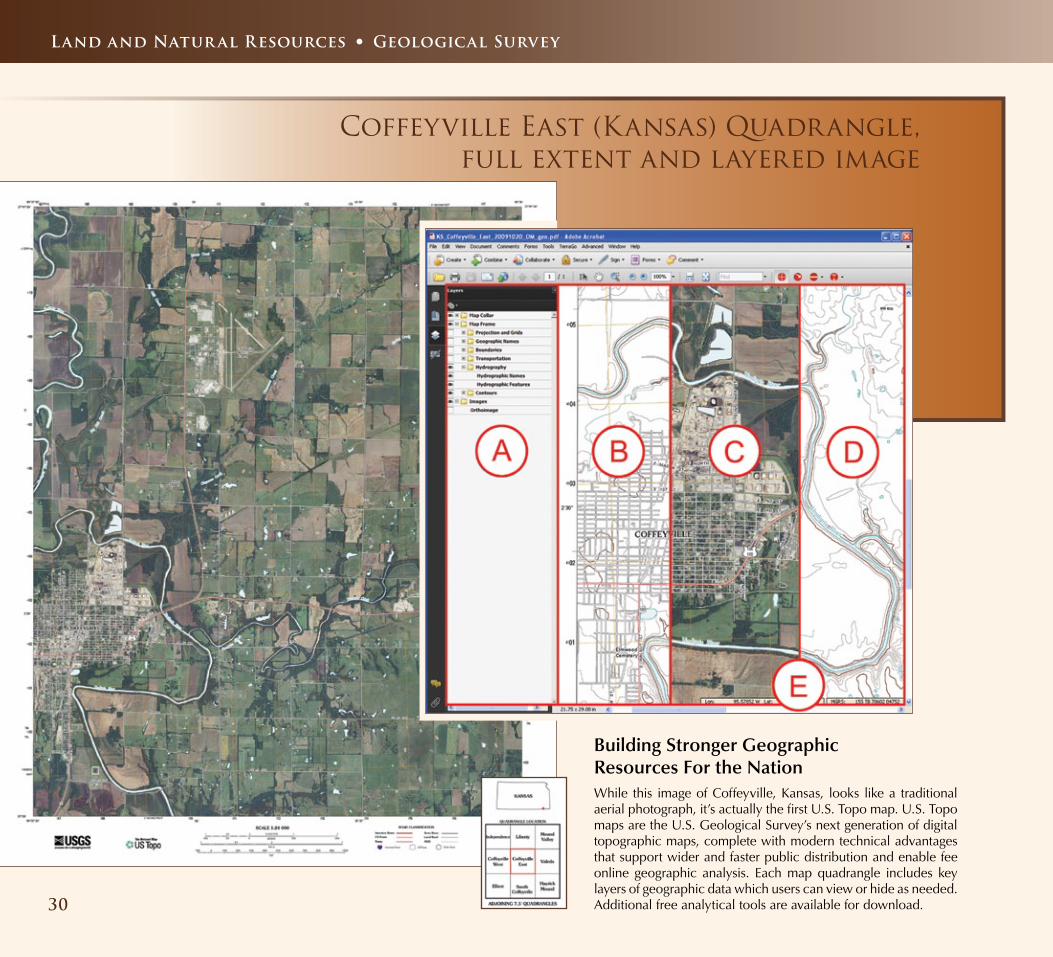
Coffeyville East (Kansas) Quadrangle, full extent and layered image
Building Stronger Geographic Resources For the NationWhile this image of Coffeyville, Kansas, looks like a traditional aerial photograph, it’s actually the first U.S. Topo map. U.S. Topo maps are the U.S. Geological Survey’s next generation of digital topographic maps, complete with modern technical advantages that support wider and faster public distribution and enable fee online geographic analysis. Each map quadrangle includes key layers of geographic data which users can view or hide as needed. Additional free analytical tools are available for download.
Land and Natur al Resources • Geological Survey
30
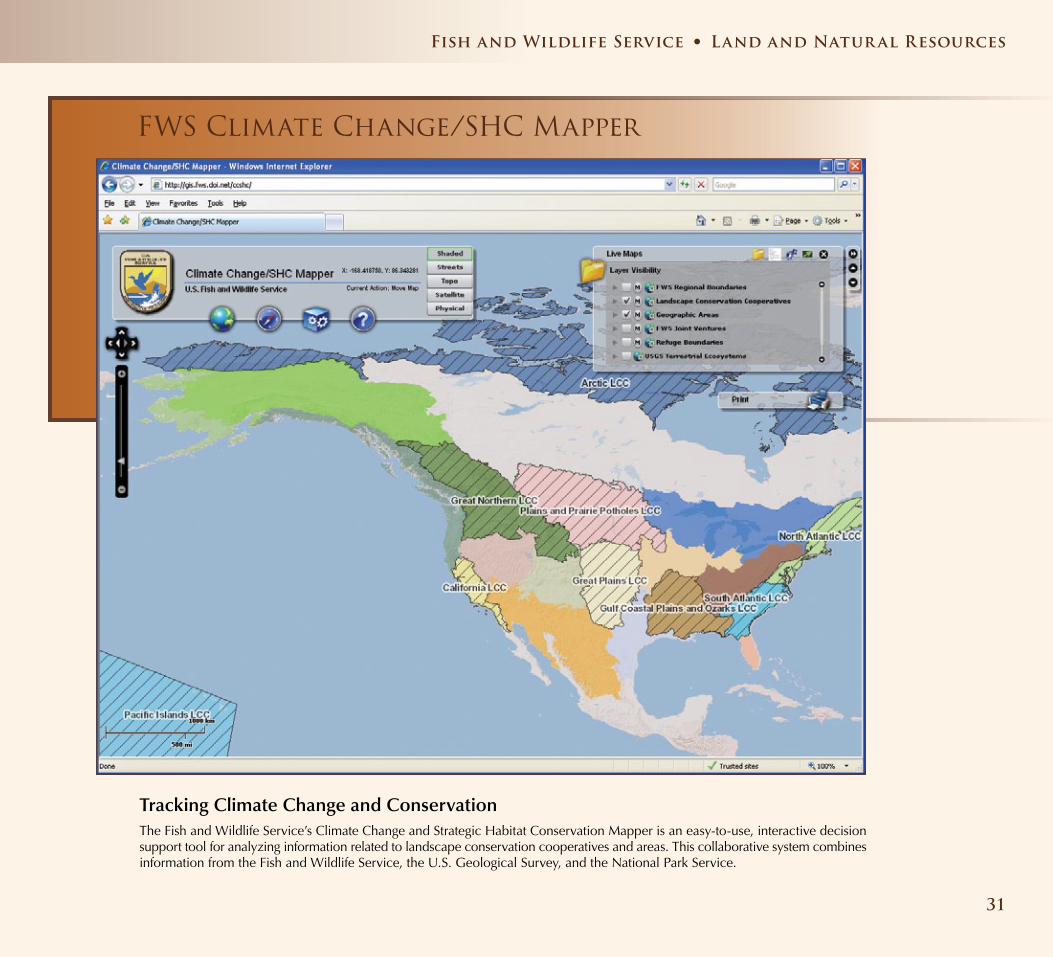
FWS Climate Change/SHC Mapper
Tracking Climate Change and ConservationThe Fish and Wildlife Service’s Climate Change and Strategic Habitat Conservation Mapper is an easy-to-use, interactive decision support tool for analyzing information related to landscape conservation cooperatives and areas. This collaborative system combines information from the Fish and Wildlife Service, the U.S. Geological Survey, and the National Park Service.
31
Fish and Wildlife Service • Land and Natur al Resources
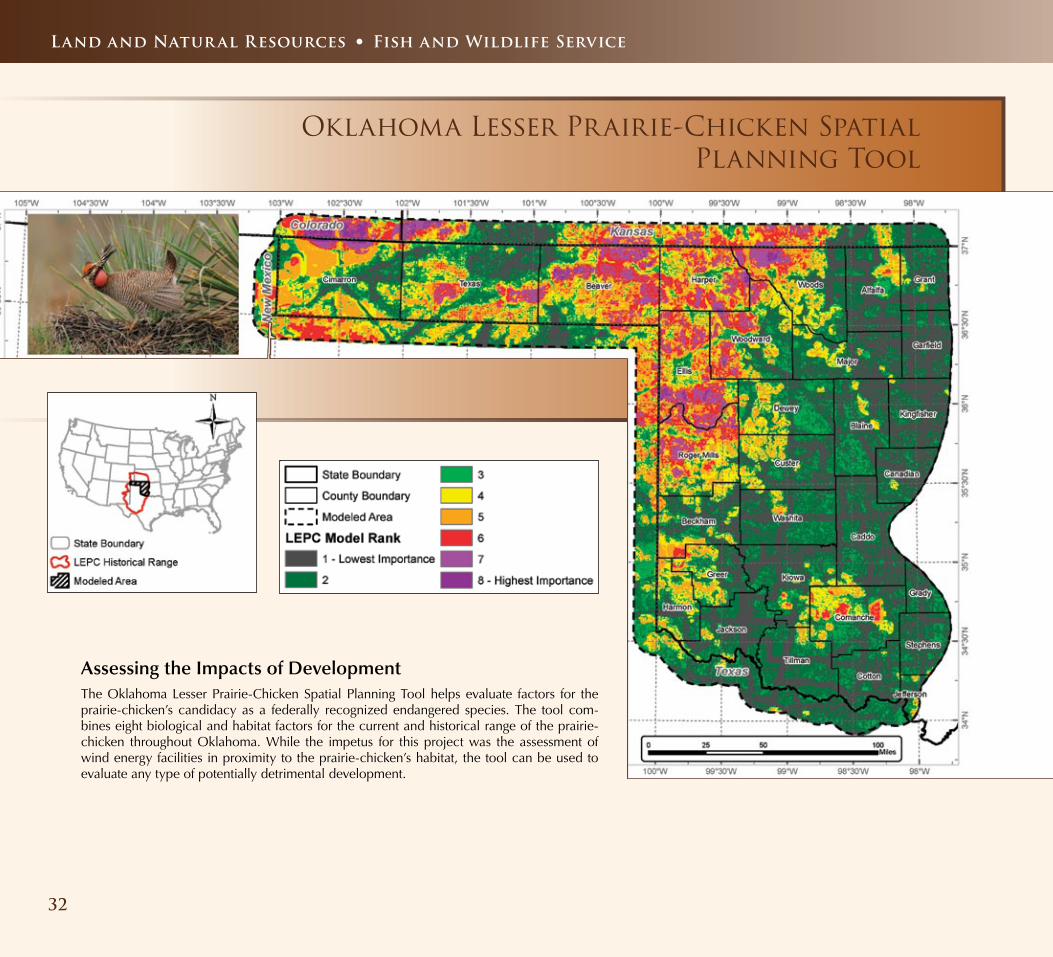
Oklahoma Lesser Prairie-Chicken Spatial Planning Tool
Assessing the Impacts of DevelopmentThe Oklahoma Lesser Prairie-Chicken Spatial Planning Tool helps evaluate factors for the prairie-chicken’s candidacy as a federally recognized endangered species. The tool com-bines eight biological and habitat factors for the current and historical range of the prairie-chicken throughout Oklahoma. While the impetus for this project was the assessment of wind energy facilities in proximity to the prairie-chicken’s habitat, the tool can be used to evaluate any type of potentially detrimental development.
Land and Natur al Resources • Fish and Wildlife Service
32
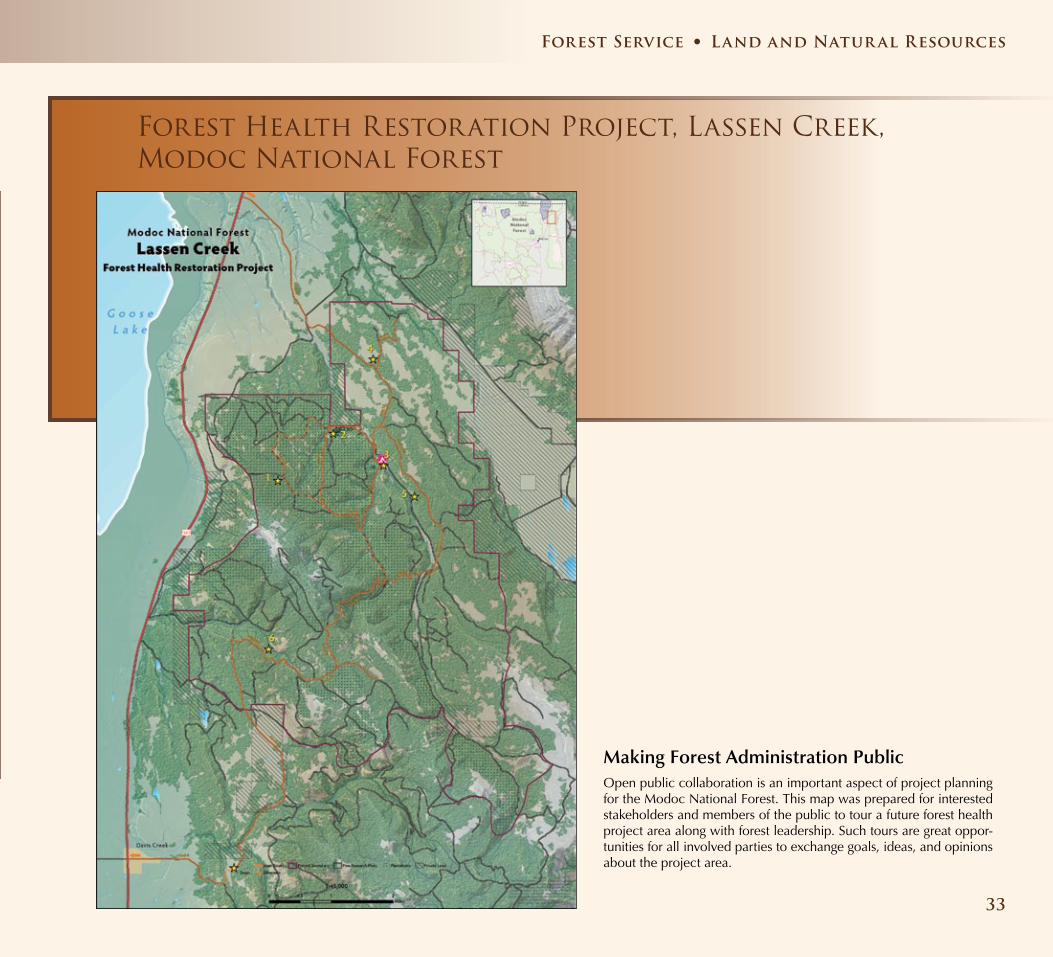
Forest Health Restoration Project, Lassen Creek, Modoc National Forest
Making Forest Administration PublicOpen public collaboration is an important aspect of project planning for the Modoc National Forest. This map was prepared for interested stakeholders and members of the public to tour a future forest health project area along with forest leadership. Such tours are great oppor-tunities for all involved parties to exchange goals, ideas, and opinions about the project area.
33
Forest Service • Land and Natur al Resources
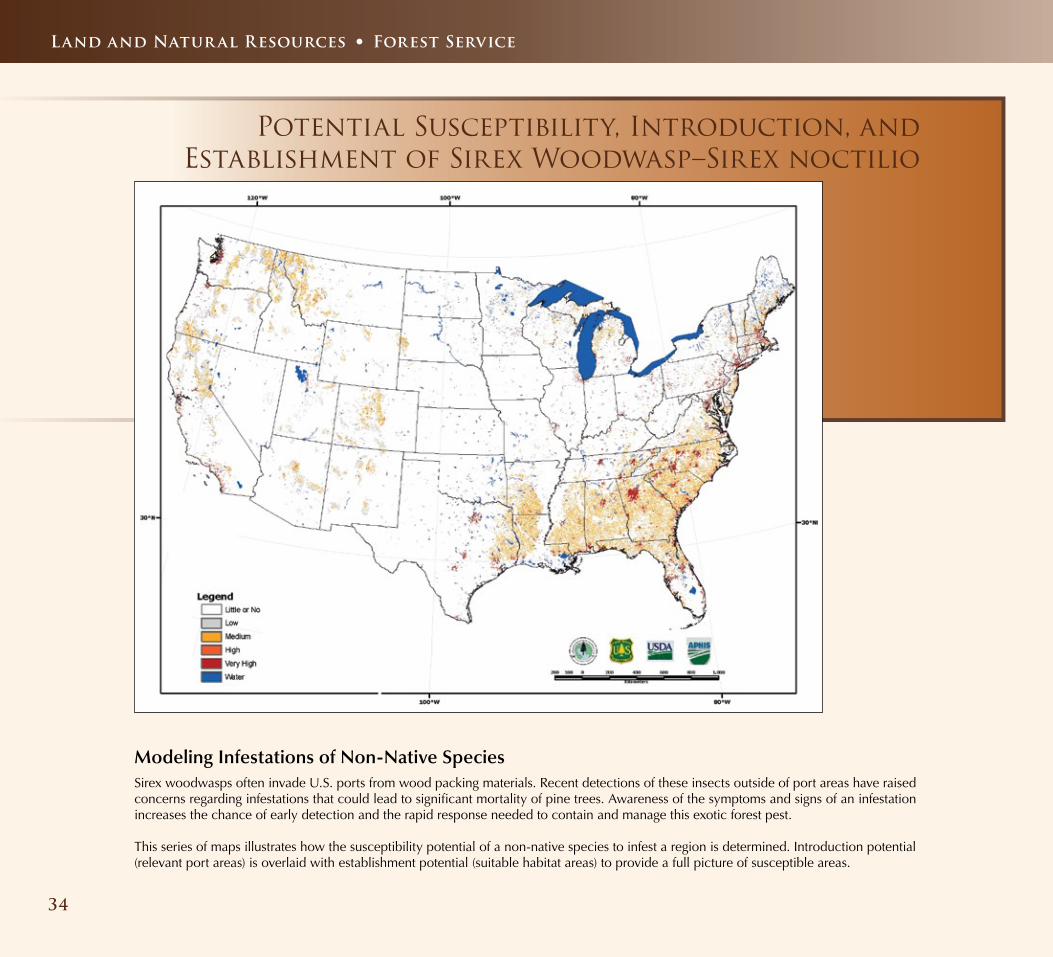
Potential Susceptibility, Introduction, and Establishment of Sirex Woodwasp–Sirex noctilio
Modeling Infestations of Non-Native SpeciesSirex woodwasps often invade U.S. ports from wood packing materials. Recent detections of these insects outside of port areas have raised concerns regarding infestations that could lead to significant mortality of pine trees. Awareness of the symptoms and signs of an infestation increases the chance of early detection and the rapid response needed to contain and manage this exotic forest pest.
This series of maps illustrates how the susceptibility potential of a non-native species to infest a region is determined. Introduction potential (relevant port areas) is overlaid with establishment potential (suitable habitat areas) to provide a full picture of susceptible areas.
Land and Natur al Resources • Forest Service
34
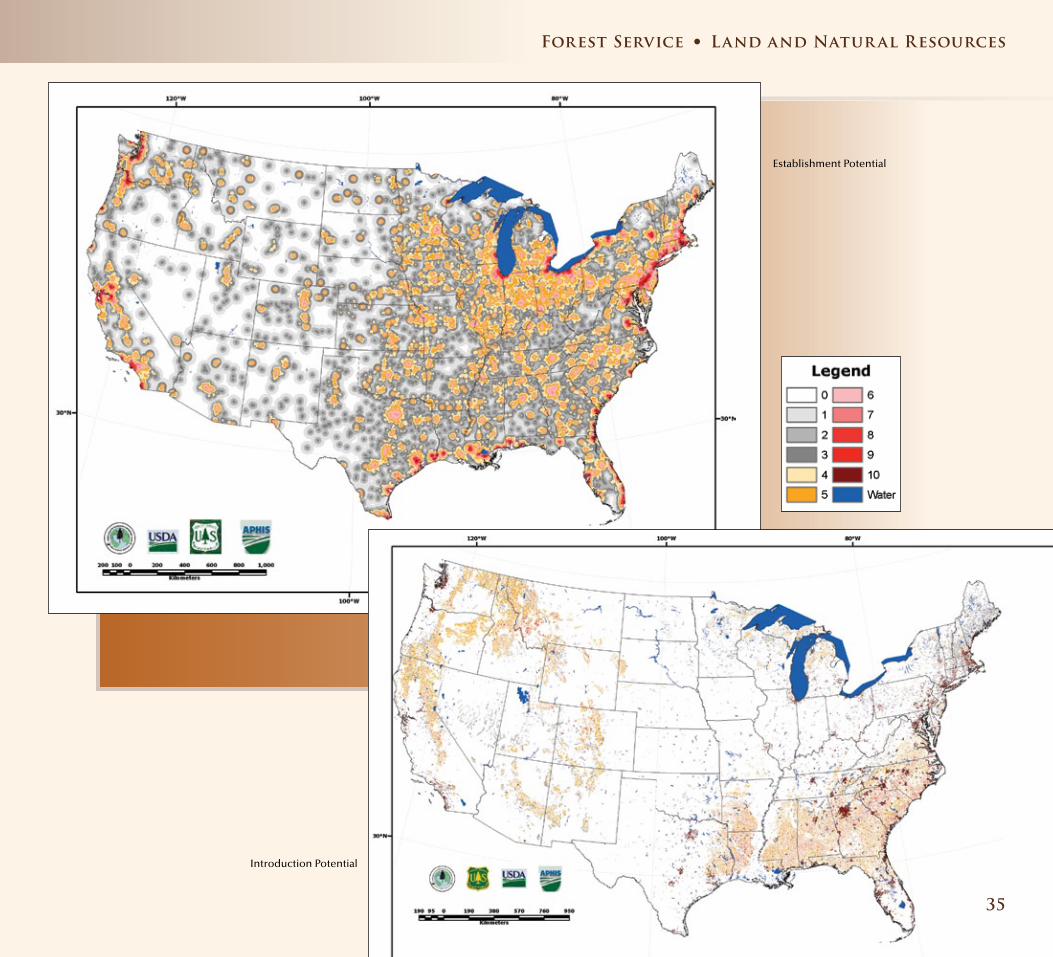
Introduction Potential
Establishment Potential
35
Forest Service • Land and Natur al Resources
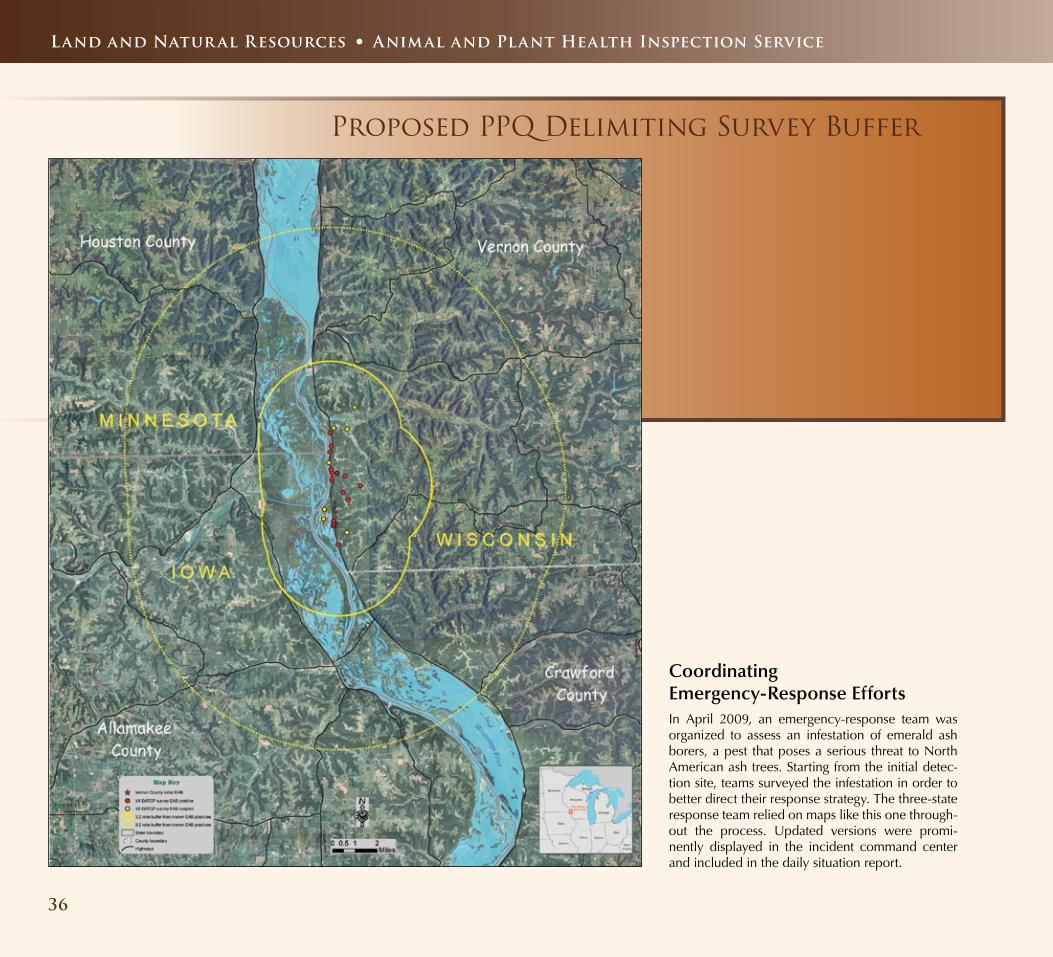
Proposed PPQ Delimiting Survey Buffer
Coordinating Emergency-Response EffortsIn April 2009, an emergency-response team was organized to assess an infestation of emerald ash borers, a pest that poses a serious threat to North American ash trees. Starting from the initial detec-tion site, teams surveyed the infestation in order to better direct their response strategy. The three-state response team relied on maps like this one through-out the process. Updated versions were promi-nently displayed in the incident command center and included in the daily situation report.
Land and Natur al Resources • Animal and Plant Health Inspection Service
36
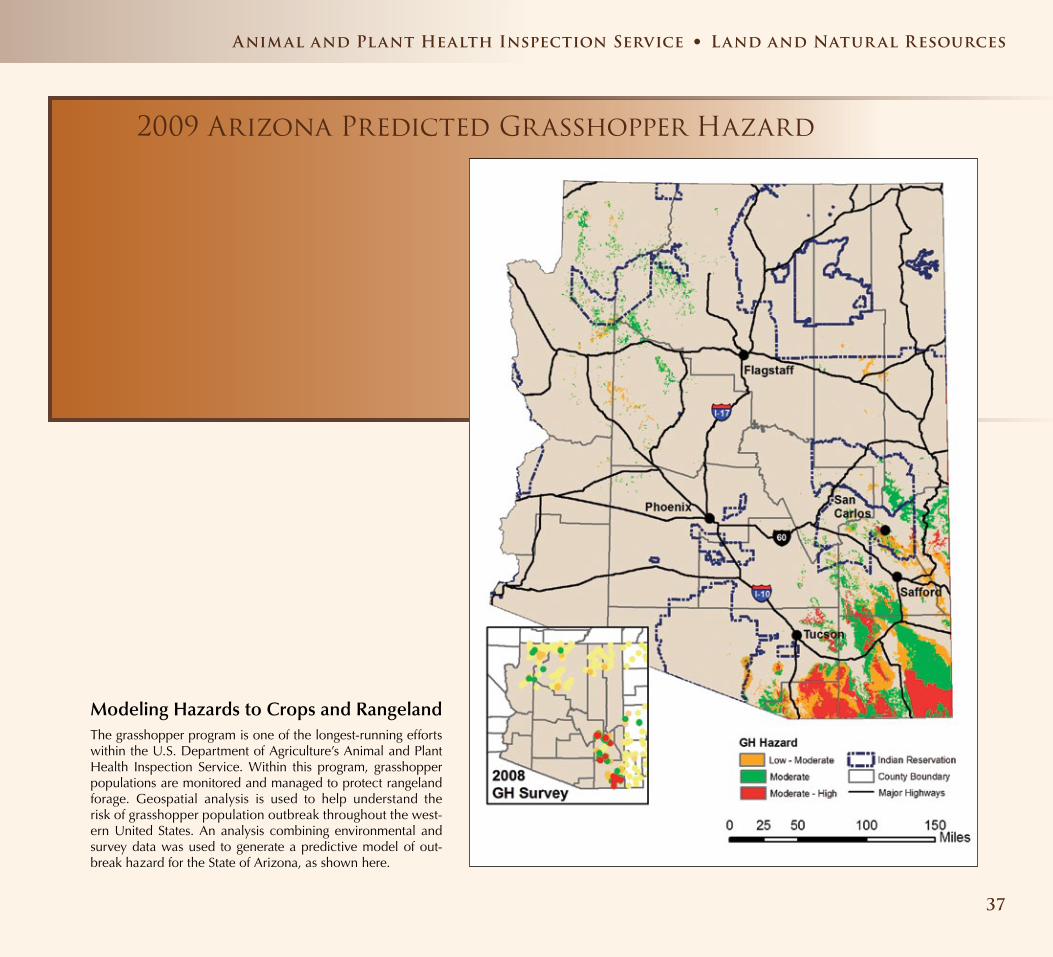
2009 Arizona Predicted Grasshopper Hazard
Modeling Hazards to Crops and RangelandThe grasshopper program is one of the longest-running efforts within the U.S. Department of Agriculture’s Animal and Plant Health Inspection Service. Within this program, grasshopper populations are monitored and managed to protect rangeland forage. Geospatial analysis is used to help understand the risk of grasshopper population outbreak throughout the west-ern United States. An analysis combining environmental and survey data was used to generate a predictive model of out-break hazard for the State of Arizona, as shown here.
Animal and Plant Health Inspection Service • Land and Natur al Resources
37

2009 Cropland Data Layers
Tracking the Area and Variety of CroplandThe U.S. Department of Agriculture maintains a detailed map of cropland throughout the country. Data layers indicate the type of crop cover and serve as a resource for a variety of government and research activities.
Florida data not available at time of publication
38
Land and Natur al Resources • National Agriculture Statistics Service
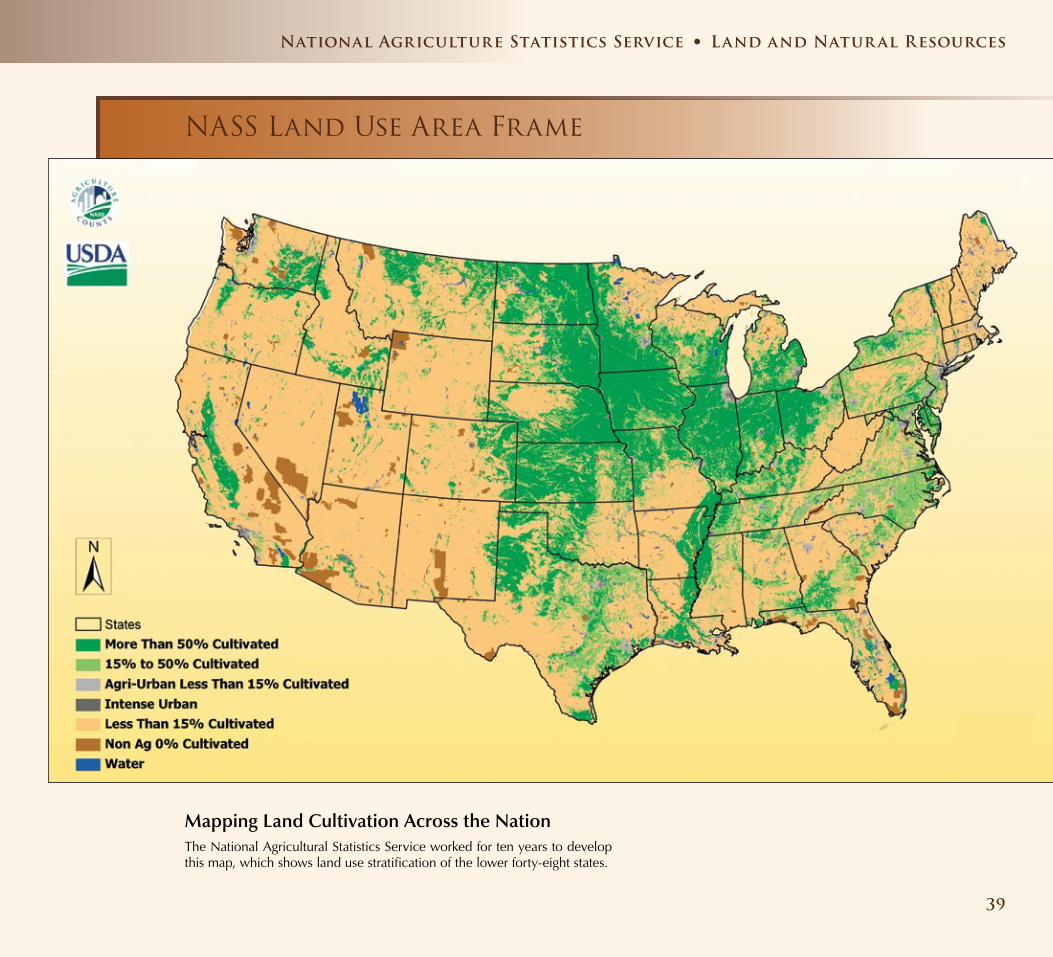
NASS Land Use Area Frame
Mapping Land Cultivation Across the NationThe National Agricultural Statistics Service worked for ten years to develop this map, which shows land use stratification of the lower forty-eight states.
39
National Agriculture Statistics Service • Land and Natur al Resources
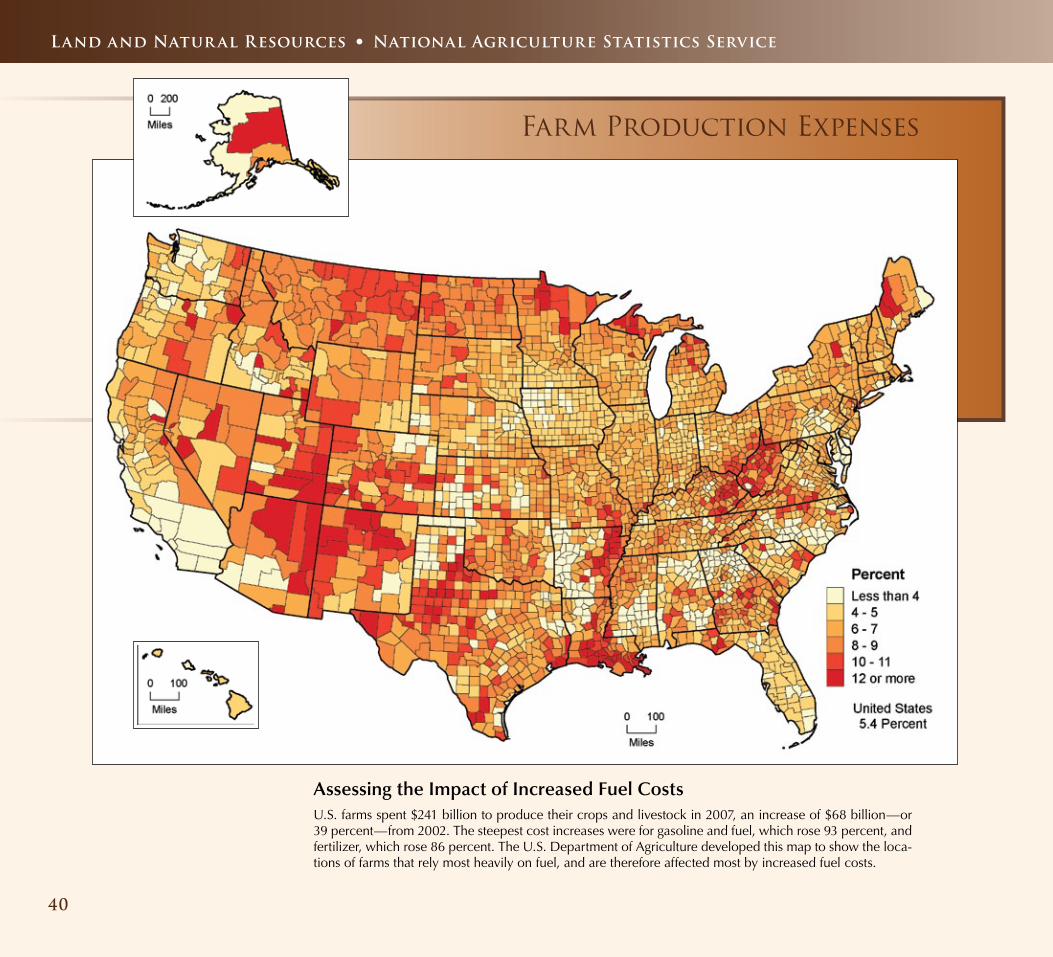
Farm Production Expenses
Assessing the Impact of Increased Fuel CostsU.S. farms spent $241 billion to produce their crops and livestock in 2007, an increase of $68 billion — or 39 percent — from 2002. The steepest cost increases were for gasoline and fuel, which rose 93 percent, and fertilizer, which rose 86 percent. The U.S. Department of Agriculture developed this map to show the loca-tions of farms that rely most heavily on fuel, and are therefore affected most by increased fuel costs.
Land and Natur al Resources • National Agriculture Statistics Service
40
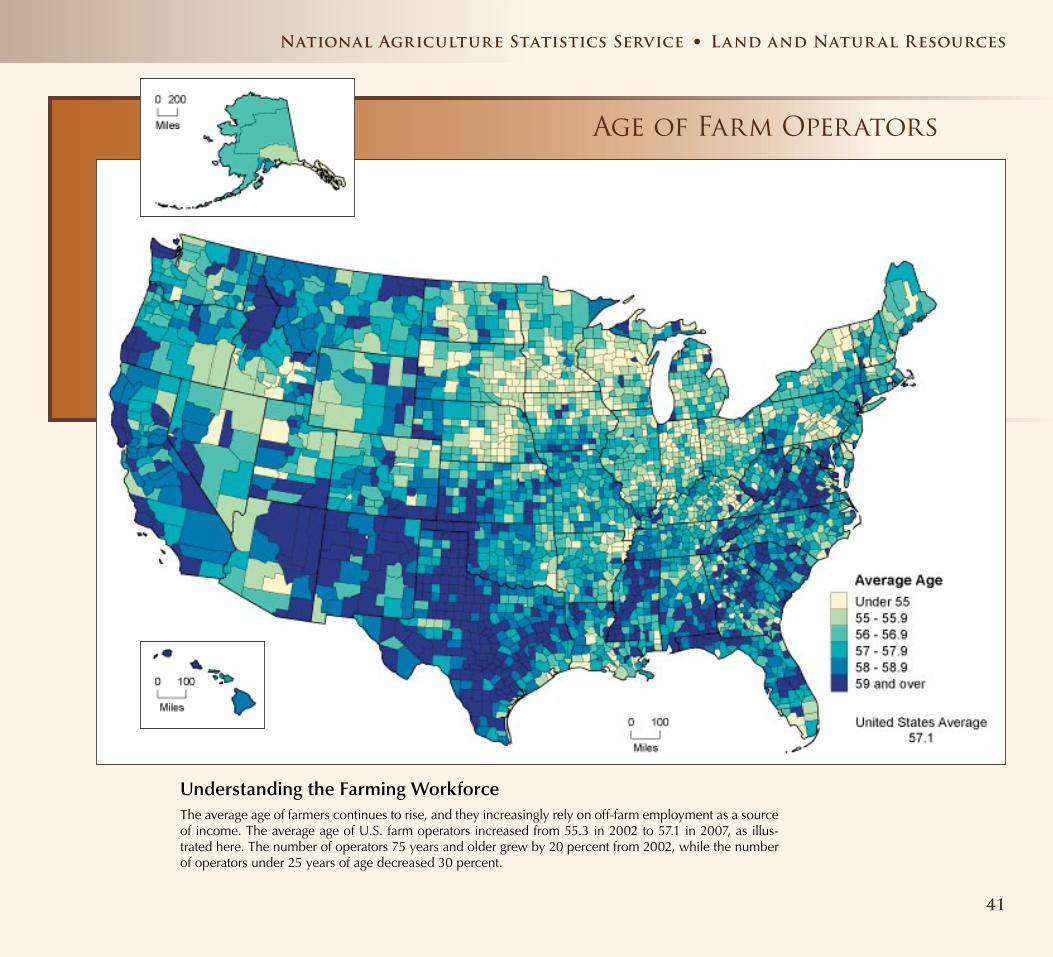
Age of Farm Operators
Understanding the Farming WorkforceThe average age of farmers continues to rise, and they increasingly rely on off-farm employment as a source of income. The average age of U.S. farm operators increased from 55.3 in 2002 to 57.1 in 2007, as illus-trated here. The number of operators 75 years and older grew by 20 percent from 2002, while the number of operators under 25 years of age decreased 30 percent.
41
National Agriculture Statistics Service • Land and Natur al Resources
42
Land and Natur al Resources • Agricultur al Research Service
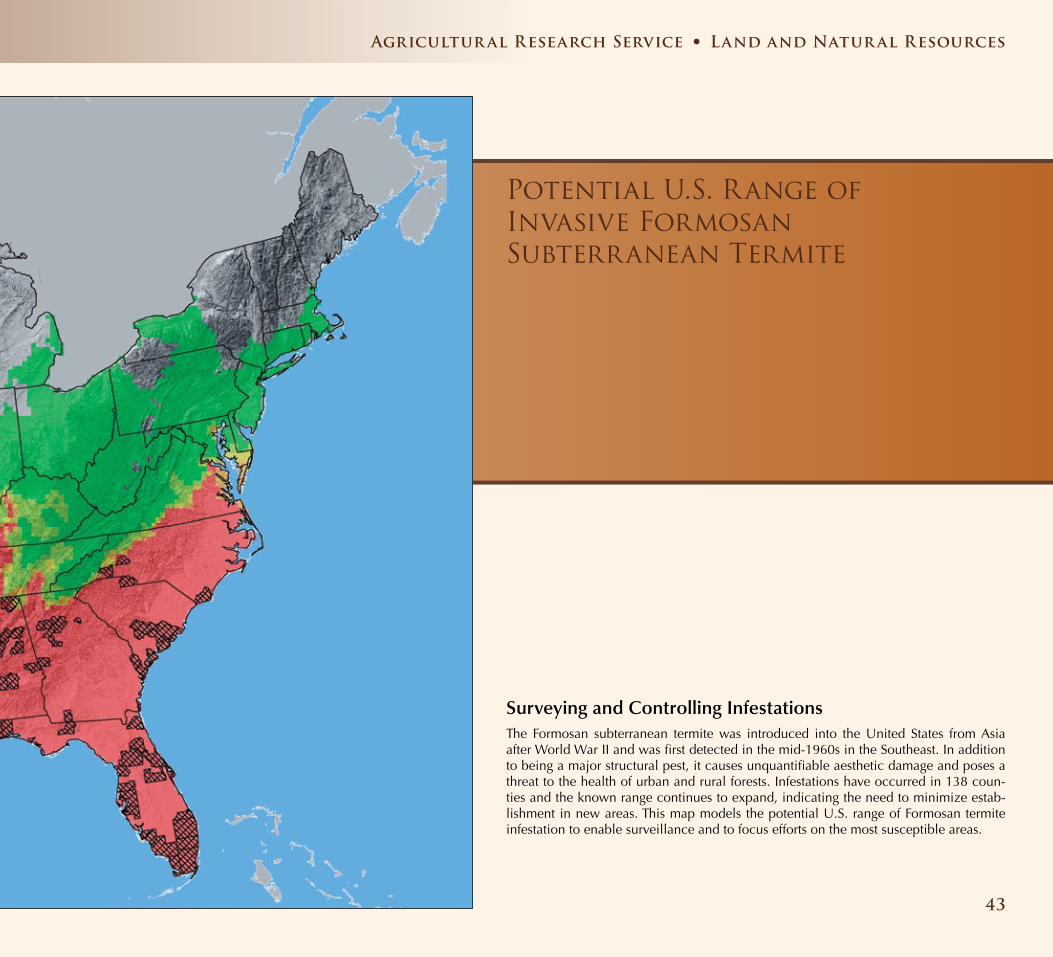
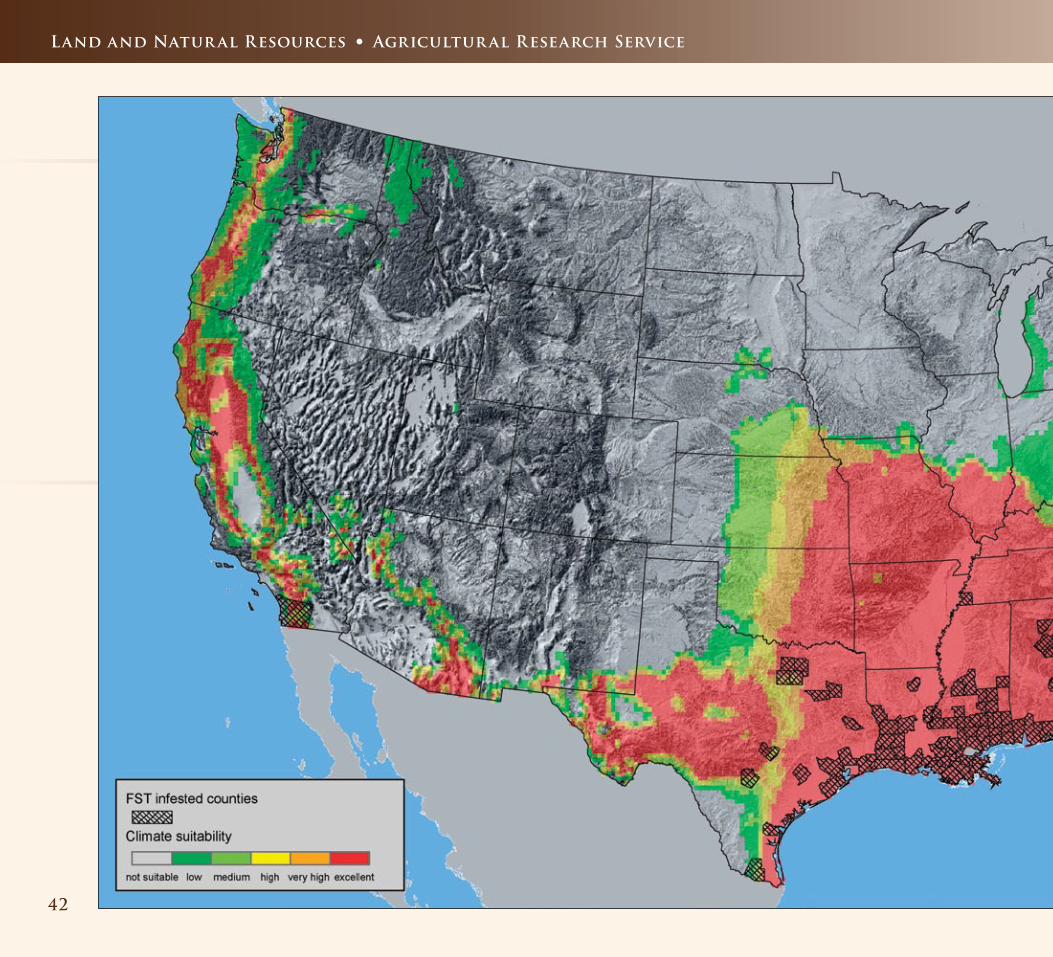
Potential U.S. Range of Invasive Formosan Subterranean Termite
Surveying and Controlling InfestationsThe Formosan subterranean termite was introduced into the United States from Asia after World War II and was first detected in the mid-1960s in the Southeast. In addition to being a major structural pest, it causes unquantifiable aesthetic damage and poses a threat to the health of urban and rural forests. Infestations have occurred in 138 coun-ties and the known range continues to expand, indicating the need to minimize estab-lishment in new areas. This map models the potential U.S. range of Formosan termite infestation to enable surveillance and to focus efforts on the most susceptible areas.
Agricultur al Research Service • Land and Natur al Resources
43

Supporting Agriculture through Seasonal Acreage Map Creation, Gophertown, Minnesota
Acre SummaryTotal Acres 189.18Total CRP 3.98Cropland 22.78
Charting American FarmlandFor each acreage reporting season, the Farm Service Agency creates millions of farm maps based on Common Land Units, which indicate a contiguous boundary, a single owner, a con-sistent land cover, and other factors. This example from a farm in Minnesota shows land use areas and their acreages.
The agency currently maintains information on more than 16 million land units in a national geospatial database, and is also building datasets that identify conservation practices, grain-storage facility locations, planting histories, food warehouses, and fertilizer facilities. This information can be archived and queried to help support market-oriented, economically and environmentally sound agriculture practices.
Land and Natur al Resources • Farm Service Agency
44
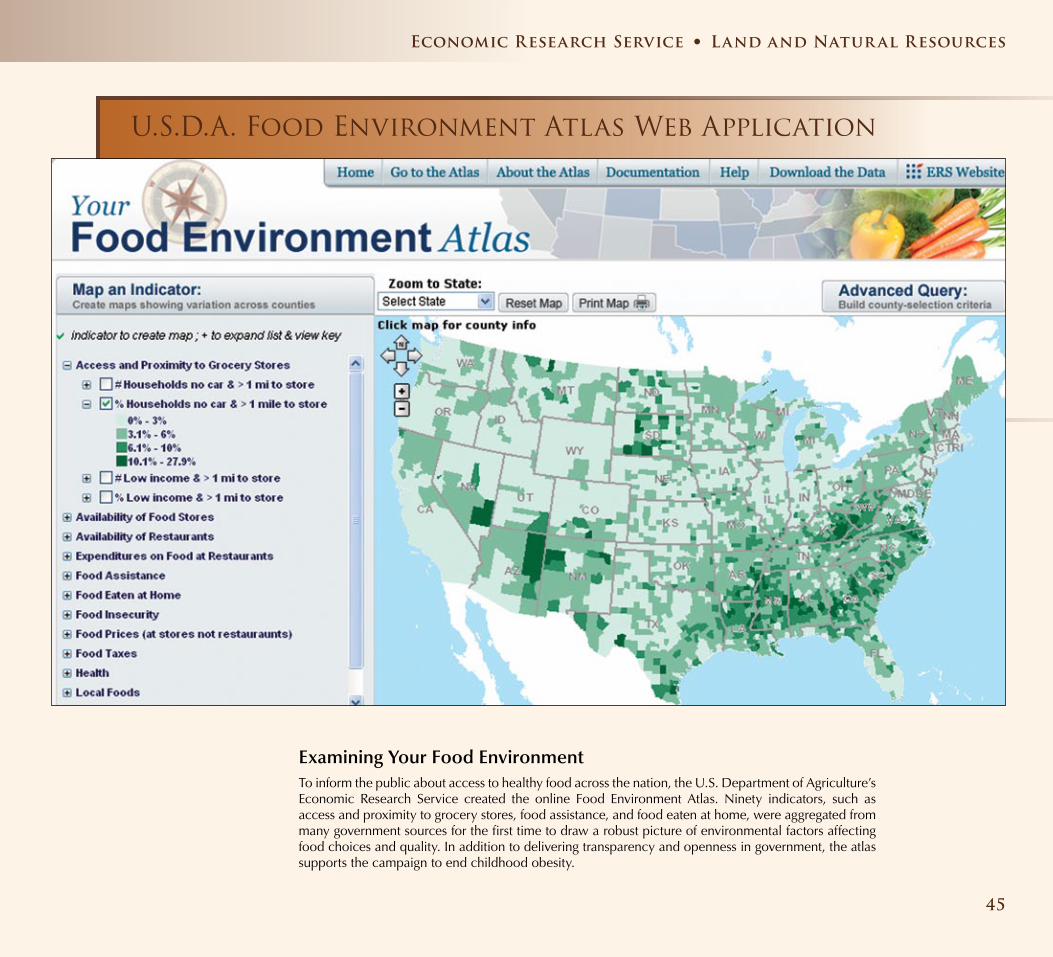
U.S.D.A. Food Environment Atlas Web Application
Examining Your Food EnvironmentTo inform the public about access to healthy food across the nation, the U.S. Department of Agriculture’s Economic Research Service created the online Food Environment Atlas. Ninety indicators, such as access and proximity to grocery stores, food assistance, and food eaten at home, were aggregated from many government sources for the first time to draw a robust picture of environmental factors affecting food choices and quality. In addition to delivering transparency and openness in government, the atlas supports the campaign to end childhood obesity.
45
Economic Research Service • Land and Natur al Resources