Embed Size (px)
Citation preview
Chapter 1: Introduction
A tanker car carrying chlorine has overturned in Louisville, Kentucky. The dispatch officer on duty at the local emergency management agency logs this event into the crisis information management system (CIMS). The emergency operations manager on duty at the agency considers the gravity of the situation and decides to activate the emergency operations center (EOC) to evaluate and respond to the emergency. The manager is faced with a barrage of potential situations that will affect people and property across a wide area of the region. The first and most significant piece of information needed is exactly where this incident has occurred. Conventional 9-1-1 dispatch mapping applications can accurately locate such incidents on a street map. First responders can then be dispatched along designated routes to the site to secure the safety of people and property affected by the event.
A quick dispatch of first responders to the overturned tanker directly addresses the incident at hand, in this case, the chlorine spilling out of the tanker car. But what about the many other factors that influence how this event unfolds? Louisville is a large city in the Midwest along the Ohio River where flooding is a significant hazard. It borders the state of Indiana, so multijurisdictional issues are at play if and when a hazardous event occurs that crosses boundaries. Where are the roads and rail lines that transport hazardous materials? Who are the people that live in the neighbor-hood of the incident? Are there any schools, churches, or other locations nearby where large groups of people assemble? What is the traffic flow on adjacent roads at that time of day? Which way was the wind blowing when the incident occurred? These are all pieces of information that help the emergency operations manager characterize the incident and minimize the
2 — Enabling Comprehensive Situational Awareness
risk to the surrounding community. This information, when stored and managed as data that is tagged to locations on the earth (georeferenced) within a geographic information system (GIS), can be used to effectively support the entire emergency management workflow from beginning to end.
The 9-1-1 mapping application will route first responders to the site quickly, and they will do whatever is necessary to ensure public safety as soon as possible. But, knowing what is happening at the site of the incident and in the surrounding area is also critical to emer-gency response and incident management. Knowing the wind direc-tion at the site of the tanker accident lets the emergency operations manager and the on-scene incident commander determine which neighborhood is affected by a potentially poisonous plume of toxic air. Knowing how many people live in that neighborhood ensures that the incident commander can determine fast and effective arrange-ments to relocate them to areas away from danger. Awareness of local traffic conditions around the site facilitates effective rerouting of passenger vehicles away from the hazard zone, while at the same time allowing emergency vehicles access to the site. This situational aware-ness, coupled with the expertise and experience that an emergency manager brings to the job, yields a professional who can make effec-tive decisions in critical situations. The ability to make accurate judg-ments and draw rational inferences from situational knowledge at all stages of a significant event is what saves lives and secures property.
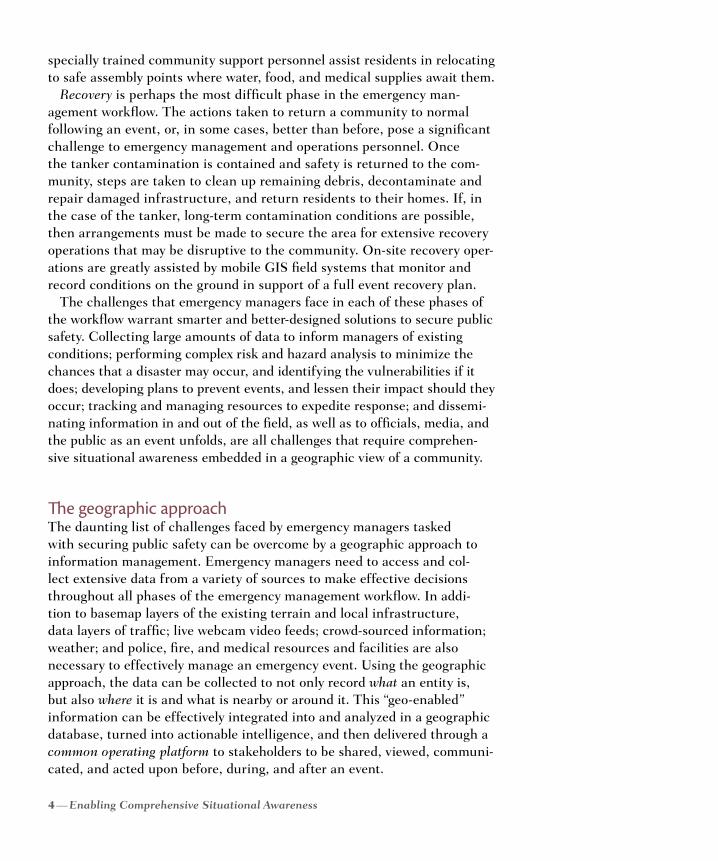
This knowledge, however, cannot secure the greatest public safety if it is not embedded in a well-defined organizational work-flow that prescribes tried-and-true best practices for each emer-gency management phase of an event: mitigation, preparedness, response, and recovery. Each phase presents different parameters that challenge managers and operations personnel tasked with secur-ing public safety. GIS offers tools designed to enhance situational awareness during each of these emergency management phases.
Emergency management workflowEmergency managers are charged with protecting communities and reducing vulnerabilities. The consequences and costs of natural disasters, such as Hurricane Katrina and the Japanese earthquake and subsequent tsunami, and human-induced tragedies and catastrophes, such as September 11 and the Gulf oil spill, have taught us that we can no longer wait to respond until after a disaster occurs. The emphasis must be on preventing such events from occurring in the first place and reducing their consequences when they do. This mission has become increasingly complex because public
Chapter 1: Introduction — 3
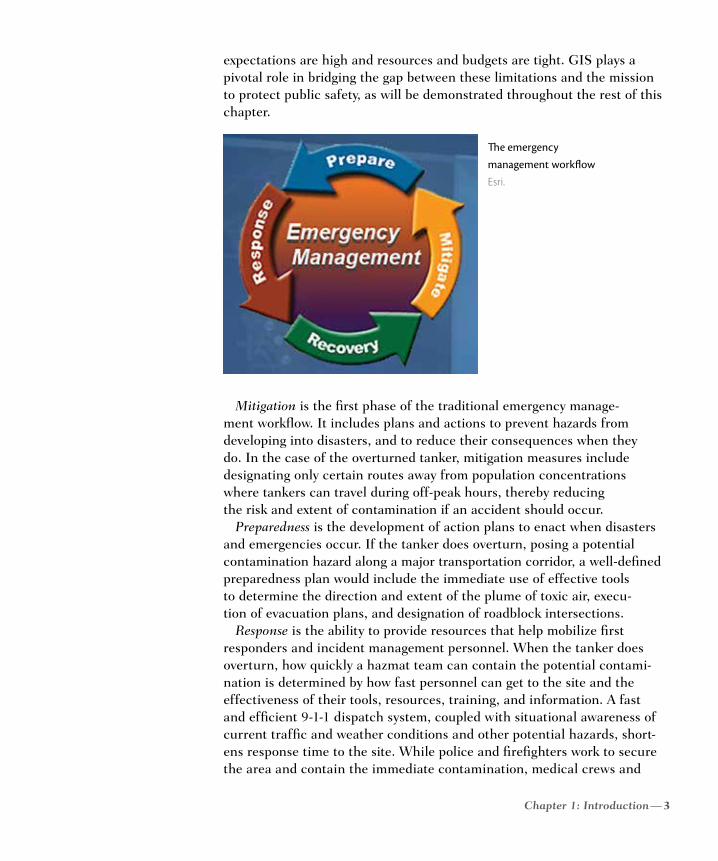
expectations are high and resources and budgets are tight. GIS plays a pivotal role in bridging the gap between these limitations and the mission to protect public safety, as will be demonstrated throughout the rest of this chapter.
Mitigation is the first phase of the traditional emergency manage-ment workflow. It includes plans and actions to prevent hazards from developing into disasters, and to reduce their consequences when they do. In the case of the overturned tanker, mitigation measures include designating only certain routes away from population concentrations where tankers can travel during off-peak hours, thereby reducing the risk and extent of contamination if an accident should occur.
Preparedness is the development of action plans to enact when disasters and emergencies occur. If the tanker does overturn, posing a potential contamination hazard along a major transportation corridor, a well-defined preparedness plan would include the immediate use of effective tools to determine the direction and extent of the plume of toxic air, execu-tion of evacuation plans, and designation of roadblock intersections.
Response is the ability to provide resources that help mobilize first responders and incident management personnel. When the tanker does overturn, how quickly a hazmat team can contain the potential contami-nation is determined by how fast personnel can get to the site and the effectiveness of their tools, resources, training, and information. A fast and efficient 9-1-1 dispatch system, coupled with situational awareness of current traffic and weather conditions and other potential hazards, short-ens response time to the site. While police and firefighters work to secure the area and contain the immediate contamination, medical crews and
The emergency management workflow Esri.
4 — Enabling Comprehensive Situational Awareness
specially trained community support personnel assist residents in relocating to safe assembly points where water, food, and medical supplies await them.
Recovery is perhaps the most difficult phase in the emergency man-agement workflow. The actions taken to return a community to normal following an event, or, in some cases, better than before, pose a significant challenge to emergency management and operations personnel. Once the tanker contamination is contained and safety is returned to the com-munity, steps are taken to clean up remaining debris, decontaminate and repair damaged infrastructure, and return residents to their homes. If, in the case of the tanker, long-term contamination conditions are possible, then arrangements must be made to secure the area for extensive recovery operations that may be disruptive to the community. On-site recovery oper-ations are greatly assisted by mobile GIS field systems that monitor and record conditions on the ground in support of a full event recovery plan.
The challenges that emergency managers face in each of these phases of the workflow warrant smarter and better-designed solutions to secure public safety. Collecting large amounts of data to inform managers of existing conditions; performing complex risk and hazard analysis to minimize the chances that a disaster may occur, and identifying the vulnerabilities if it does; developing plans to prevent events, and lessen their impact should they occur; tracking and managing resources to expedite response; and dissemi-nating information in and out of the field, as well as to officials, media, and the public as an event unfolds, are all challenges that require comprehen-sive situational awareness embedded in a geographic view of a community.
The geographic approachThe daunting list of challenges faced by emergency managers tasked with securing public safety can be overcome by a geographic approach to information management. Emergency managers need to access and col-lect extensive data from a variety of sources to make effective decisions throughout all phases of the emergency management workflow. In addi-tion to basemap layers of the existing terrain and local infrastructure, data layers of traffic; live webcam video feeds; crowd-sourced information; weather; and police, fire, and medical resources and facilities are also necessary to effectively manage an emergency event. Using the geographic approach, the data can be collected to not only record what an entity is, but also where it is and what is nearby or around it. This “geo-enabled” information can be effectively integrated into and analyzed in a geographic database, turned into actionable intelligence, and then delivered through a common operating platform to stakeholders to be shared, viewed, communi-cated, and acted upon before, during, and after an event.
Chapter 1: Introduction — 5
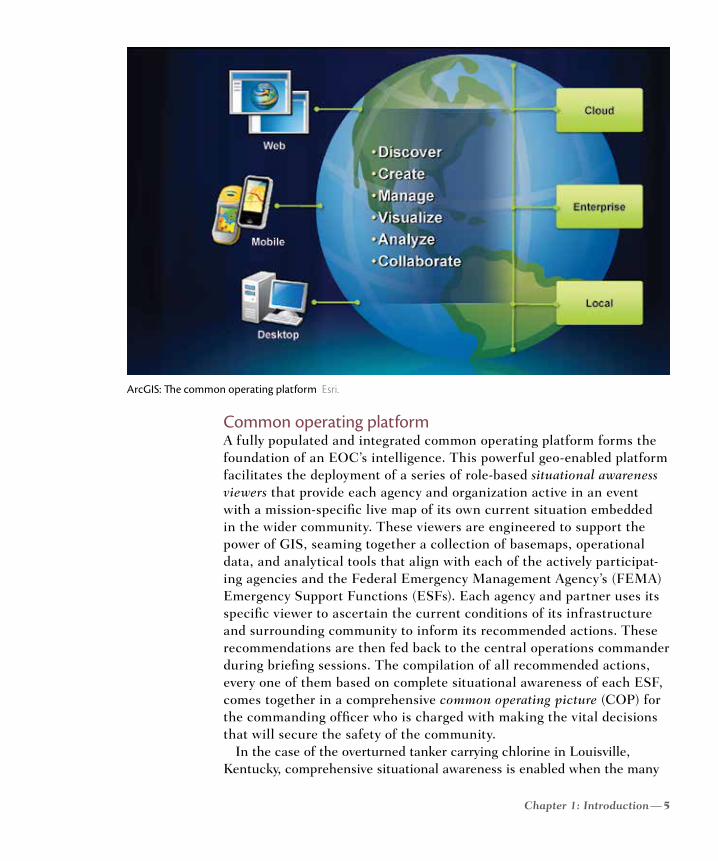
Common operating platformA fully populated and integrated common operating platform forms the foundation of an EOC’s intelligence. This powerful geo-enabled platform facilitates the deployment of a series of role-based situational awareness viewers that provide each agency and organization active in an event with a mission-specific live map of its own current situation embedded in the wider community. These viewers are engineered to support the power of GIS, seaming together a collection of basemaps, operational data, and analytical tools that align with each of the actively participat-ing agencies and the Federal Emergency Management Agency’s (FEMA) Emergency Support Functions (ESFs). Each agency and partner uses its specific viewer to ascertain the current conditions of its infrastructure and surrounding community to inform its recommended actions. These recommendations are then fed back to the central operations commander during briefing sessions. The compilation of all recommended actions, every one of them based on complete situational awareness of each ESF, comes together in a comprehensive common operating picture (COP) for the commanding officer who is charged with making the vital decisions that will secure the safety of the community.
In the case of the overturned tanker carrying chlorine in Louisville, Kentucky, comprehensive situational awareness is enabled when the many
ArcGIS: The common operating platform Esri.
6 — Enabling Comprehensive Situational Awareness
previously unconnected datasets, workflows, and operations are integrated into one geographic platform providing a shared view of the region.
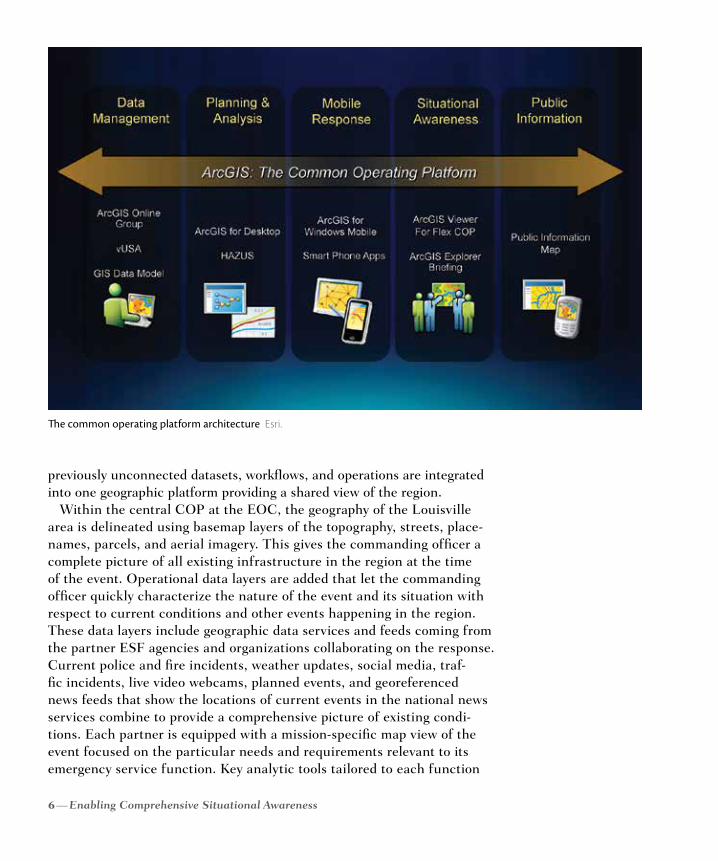
Within the central COP at the EOC, the geography of the Louisville area is delineated using basemap layers of the topography, streets, place-names, parcels, and aerial imagery. This gives the commanding officer a complete picture of all existing infrastructure in the region at the time of the event. Operational data layers are added that let the commanding officer quickly characterize the nature of the event and its situation with respect to current conditions and other events happening in the region. These data layers include geographic data services and feeds coming from the partner ESF agencies and organizations collaborating on the response. Current police and fire incidents, weather updates, social media, traf-fic incidents, live video webcams, planned events, and georeferenced news feeds that show the locations of current events in the national news services combine to provide a comprehensive picture of existing condi-tions. Each partner is equipped with a mission-specific map view of the event focused on the particular needs and requirements relevant to its emergency service function. Key analytic tools tailored to each function
The common operating platform architecture Esri.
Chapter 1: Introduction — 7
use the basemap data and operational information to geographically evaluate and determine the potential impact of the event and then present recommended actions to the central commanding officer, who can then quickly determine who is affected and what to do to minimize the risk.
In order for this common operating platform to be effectively used to support the emergency management workflow, a number of critical component patterns are needed, including data management practices, planning and analysis models, field operations and maneuvers, and situational awareness capabilities.
Data managementEmergency management personnel are required to collect data from agencies in the community and from the public to be as fully informed as possible. This inflow of disparate data is a huge challenge for managers who are responsible for assessing and characterizing vulnerabilities to protect the public and infrastructure across jurisdictions. The GIS platform can be used to organize data through its geographic location. Data is then available for analysis and operational use to support mitigation, preparation, response, and recovery.
Geo-enabled data contains many descriptive characteristics about features in an area of concern. In the case of the overturned tanker, these may include the names of streets under the plume of toxic air, and the names, addresses, and phone numbers of property owners living there. Accompanying this descriptive information is the coordinate position of each feature so it can be placed on a map in the correct location. The pairing of descriptive, or attribute, information with coordinate, or geographic, information transforms a database into a geodatabase, empowering an emergency manager with situational awareness of an event as it unfolds and affects the surrounding area.
Because all events occur at a location, GIS provides the common capa-bility, as the lowest common denominator, to contextualize all of the data geographically. The greatest capability and security is realized when the data that characterizes a community, and an event that may be threatening its safety, is stored in an integ rated geodatabase and managed within a GIS on a stable hardware and software platform that can accommodate the great extent of detailed databases and aerial imagery needed to be informed.
Data management does not only pertain to organizing attributes about the features on the ground. It also includes arranging and indexing documents and plans linked to locations in the field. Floor plans, documents detailing evacuation procedures, and photographs of buildings and conditions can also be managed within the GIS by their geographic relationship to features in the field. During stressful situations when an event is unfolding, fumbling around
8 — Enabling Comprehensive Situational Awareness
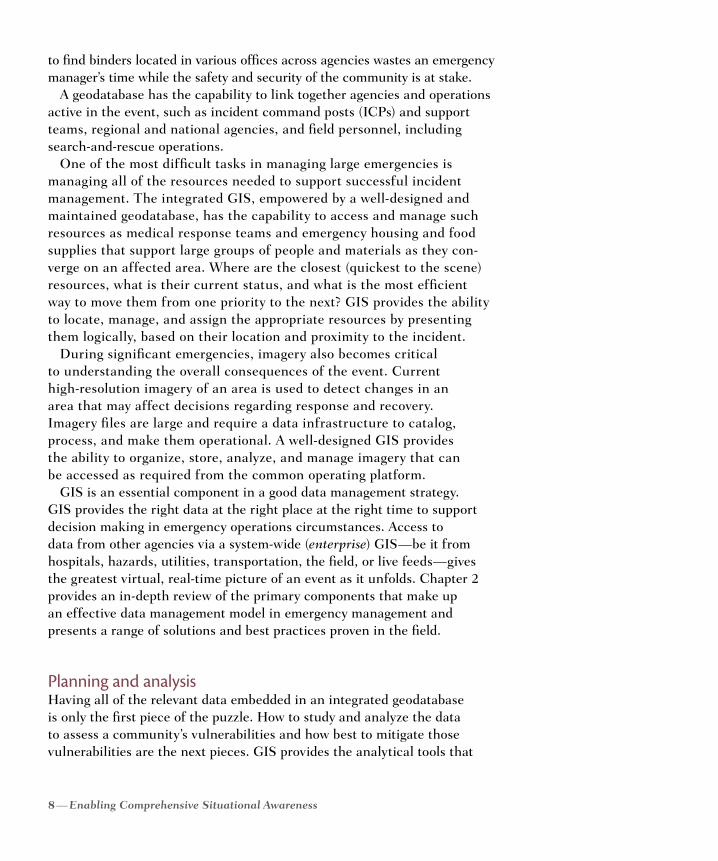
to find binders located in various offices across agencies wastes an emergency manager’s time while the safety and security of the community is at stake.
A geodatabase has the capability to link together agencies and operations active in the event, such as incident command posts (ICPs) and support teams, regional and national agencies, and field personnel, including search-and-rescue operations.
One of the most difficult tasks in managing large emergencies is managing all of the resources needed to support successful incident management. The integrated GIS, empowered by a well-designed and maintained geodatabase, has the capability to access and manage such resources as medical response teams and emergency housing and food supplies that support large groups of people and materials as they con-verge on an affected area. Where are the closest (quickest to the scene) resources, what is their current status, and what is the most efficient way to move them from one priority to the next? GIS provides the ability to locate, manage, and assign the appropriate resources by presenting them logically, based on their location and proximity to the incident.
During significant emergencies, imagery also becomes critical to understanding the overall consequences of the event. Current high-resolution imagery of an area is used to detect changes in an area that may affect decisions regarding response and recovery. Imagery files are large and require a data infrastructure to catalog, process, and make them operational. A well-designed GIS provides the ability to organize, store, analyze, and manage imagery that can be accessed as required from the common operating platform.
GIS is an essential component in a good data management strategy. GIS provides the right data at the right place at the right time to support decision making in emergency operations circumstances. Access to data from other agencies via a system-wide (enterprise) GIS—be it from hospitals, hazards, utilities, transportation, the field, or live feeds—gives the greatest virtual, real-time picture of an event as it unfolds. Chapter 2 provides an in-depth review of the primary components that make up an effective data management model in emergency management and presents a range of solutions and best practices proven in the field.
Planning and analysisHaving all of the relevant data embedded in an integrated geodatabase is only the first piece of the puzzle. How to study and analyze the data to assess a community’s vulnerabilities and how best to mitigate those vulnerabilities are the next pieces. GIS provides the analytical tools that
Chapter 1: Introduction — 9
allow scientists and decision makers to see how events and policies affect communities. Revealing land-use changes that occur in response to new transportation routes, tracking demographic shifts as economic conditions change in a community, illustrating the geologic profile of a region, and monitoring the flow of water within a watershed are only a few examples of how GIS is used to model the natural and human landscapes.
As typical as these methods of geographic analysis have been over the past two decades, they have for the most part remained within the domain of well-trained GIS professionals. Sophisticated models built using high-level programming languages ensured that such tools would not easily integrate into everyday decision support systems used by managers trained in professions other than GIS.
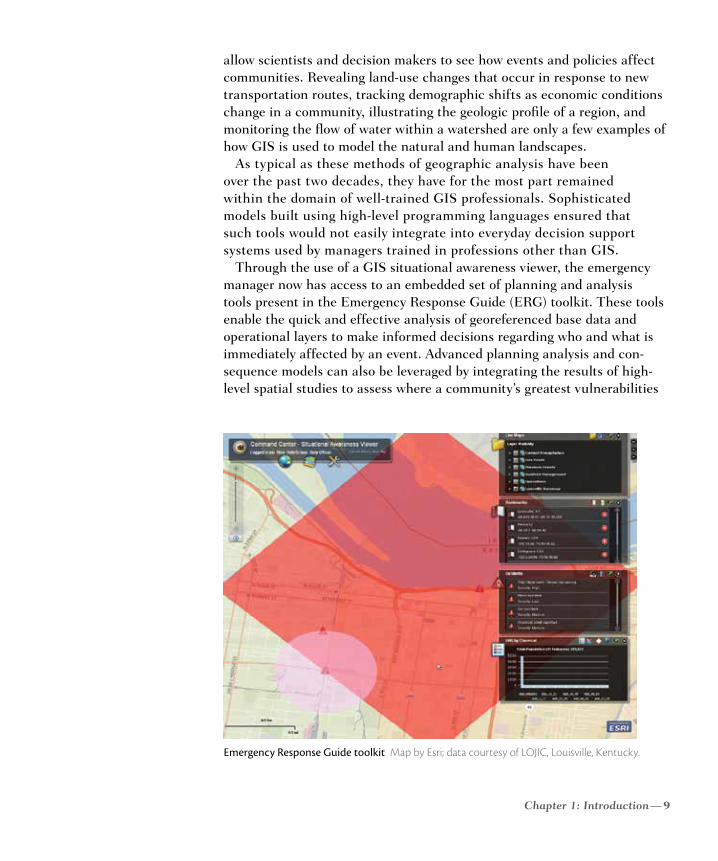
Through the use of a GIS situational awareness viewer, the emergency manager now has access to an embedded set of planning and analysis tools present in the Emergency Response Guide (ERG) toolkit. These tools enable the quick and effective analysis of georeferenced base data and operational layers to make informed decisions regarding who and what is immediately affected by an event. Advanced planning analysis and con-sequence models can also be leveraged by integrating the results of high-level spatial studies to assess where a community’s greatest vulnerabilities
Emergency Response Guide toolkit Map by Esri; data courtesy of LOJIC, Louisville, Kentucky.
10 — Enabling Comprehensive Situational Awareness
are, where mitigation priorities should be, and where contingency plans need to be developed. Through the use of a GIS situational awareness viewer, managers can also justify budget needs in support of mitigation plans by illustrating the potential consequences of an emergency event.
In the case of the overturned tanker, mitigation plans developed with the use of GIS can be put into operation effectively, allowing quick action to reduce the risk the overturned tanker will pose to the sur-rounding community. As emergency planners manage natural and technological hazards in the area, they can quickly deploy the embed-ded ERG to model the direction of the plume of toxic chemicals and calculate the number of people living within the affected area.
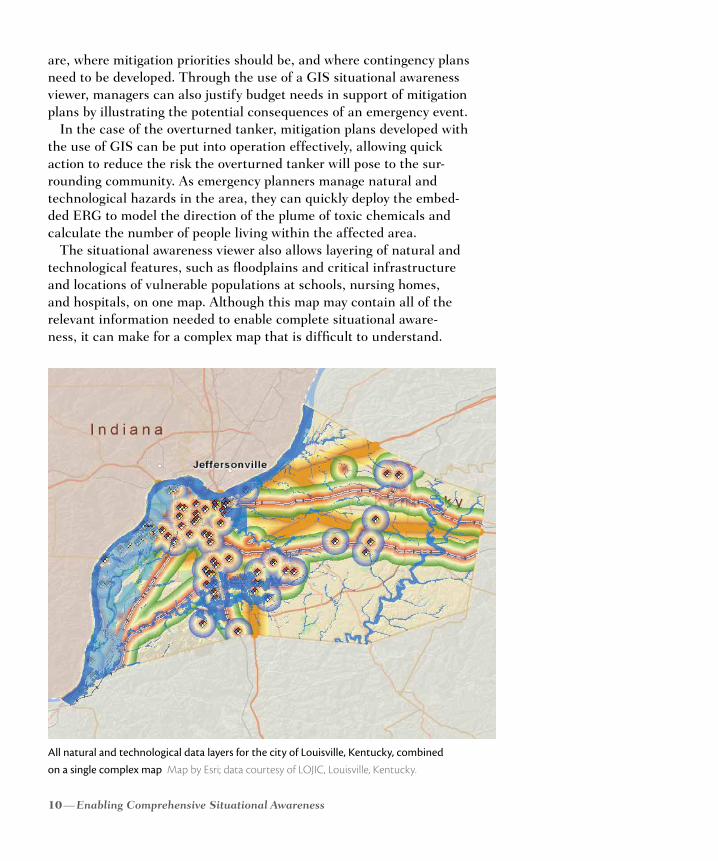
The situational awareness viewer also allows layering of natural and technological features, such as floodplains and critical infrastructure and locations of vulnerable populations at schools, nursing homes, and hospitals, on one map. Although this map may contain all of the relevant information needed to enable complete situational aware-ness, it can make for a complex map that is difficult to understand.
All natural and technological data layers for the city of Louisville, Kentucky, combined on a single complex map Map by Esri; data courtesy of LOJIC, Louisville, Kentucky.
Chapter 1: Introduction — 11
The maps resulting from these analyses can be integrated into the common operating platform and made available to emergency opera-tions personnel through their situational awareness viewer. Better and more-informed decisions can then be made based upon the potential threat to lives and property. Having the ability to integrate the results of risk and hazard assessments into the platform and to display them in the situational awareness viewer puts the good work of planners into an operational context. This improves upon the planning stages of emergency management, as well as upon mitiga-tion and preparedness. The results of GIS analysis are now available
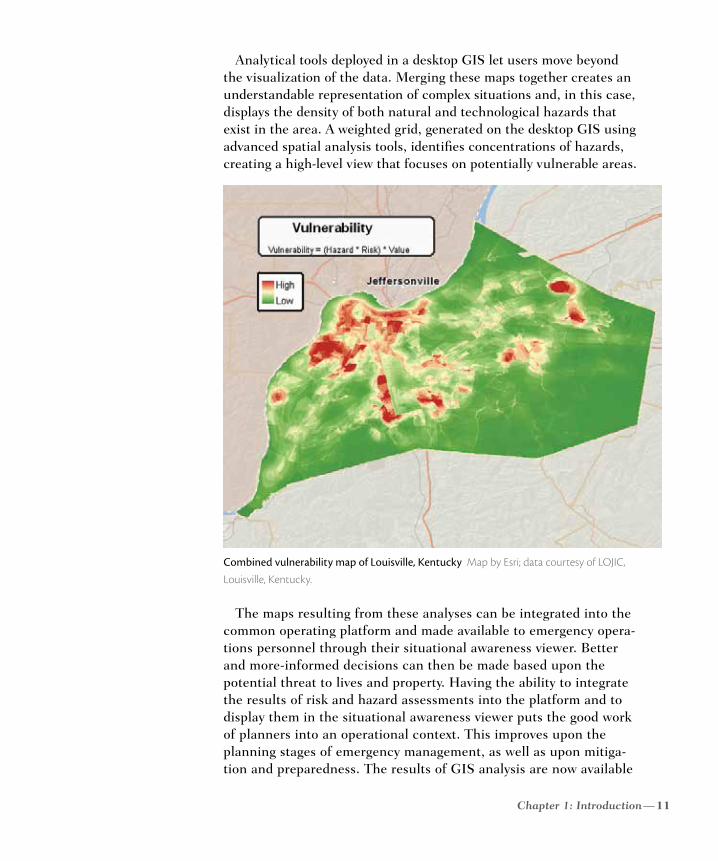
Combined vulnerability map of Louisville, Kentucky Map by Esri; data courtesy of LOJIC,
Louisville, Kentucky.
Analytical tools deployed in a desktop GIS let users move beyond the visualization of the data. Merging these maps together creates an understandable representation of complex situations and, in this case, displays the density of both natural and technological hazards that exist in the area. A weighted grid, generated on the desktop GIS using advanced spatial analysis tools, identifies concentrations of hazards, creating a high-level view that focuses on potentially vulnerable areas.
12 — Enabling Comprehensive Situational Awareness
and accessible beyond the domain of the highly trained GIS profes-sional. They are now at the fingertips of personnel working at emer-gency operations centers and planning agencies nationwide.
These tools and analyses are fully explored in chapter 3. Vulnerability analysis is reviewed, and examples of how the results are used by man-agers in the command center and in the field are shown. Additional modeling examples presented include analysis of the potential effects of natural hazards, including earthquakes, floods, and wind events, and fire management strategies in urban and rural communities.
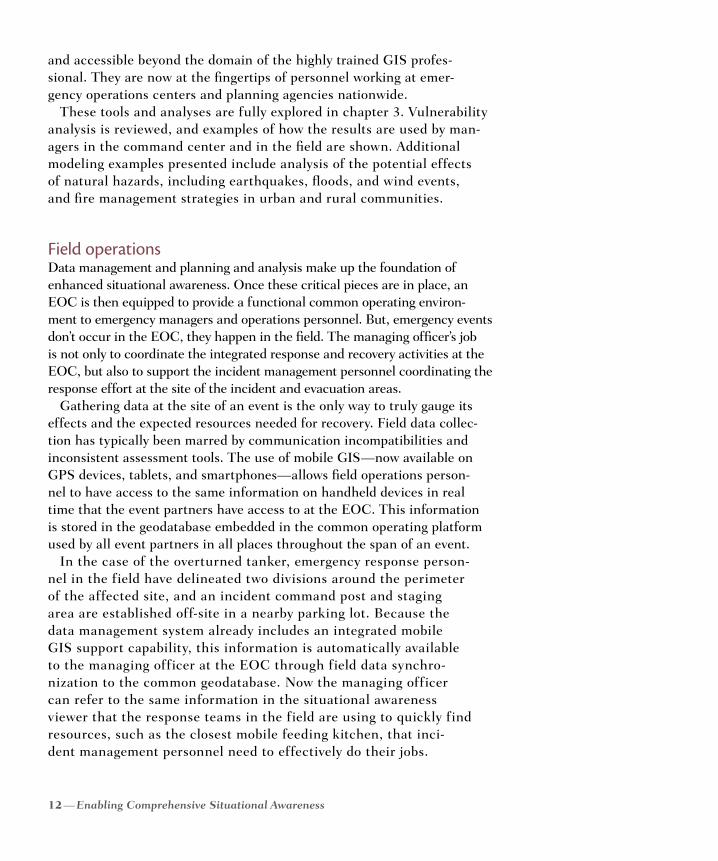
Field operationsData management and planning and analysis make up the foundation of enhanced situational awareness. Once these critical pieces are in place, an EOC is then equipped to provide a functional common operating environ-ment to emergency managers and operations personnel. But, emergency events don’t occur in the EOC, they happen in the field. The managing officer’s job is not only to coordinate the integrated response and recovery activities at the EOC, but also to support the incident management personnel coordinating the response effort at the site of the incident and evacuation areas.
Gathering data at the site of an event is the only way to truly gauge its effects and the expected resources needed for recovery. Field data collec-tion has typically been marred by communication incompatibilities and inconsistent assessment tools. The use of mobile GIS—now available on GPS devices, tablets, and smartphones—allows field operations person-nel to have access to the same information on handheld devices in real time that the event partners have access to at the EOC. This information is stored in the geodatabase embedded in the common operating platform used by all event partners in all places throughout the span of an event.
In the case of the overturned tanker, emergency response person-nel in the field have delineated two divisions around the perimeter of the affected site, and an incident command post and staging area are established off-site in a nearby parking lot. Because the data management system already includes an integrated mobile GIS support capability, this information is automatically available to the managing officer at the EOC through field data synchro-nization to the common geodatabase. Now the managing officer can refer to the same information in the situational awareness viewer that the response teams in the field are using to quickly find resources, such as the closest mobile feeding kitchen, that inci-dent management personnel need to effectively do their jobs.
Chapter 1: Introduction — 13
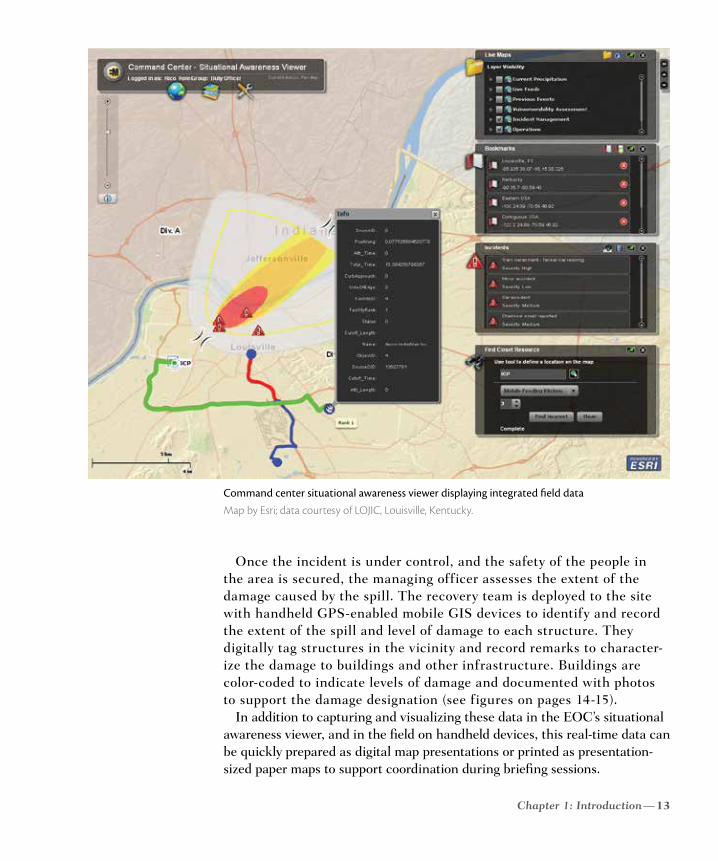
Command center situational awareness viewer displaying integrated field data Map by Esri; data courtesy of LOJIC, Louisville, Kentucky.
Once the incident is under control, and the safety of the people in the area is secured, the managing officer assesses the extent of the damage caused by the spill. The recovery team is deployed to the site with handheld GPS-enabled mobile GIS devices to identify and record the extent of the spill and level of damage to each structure. They digitally tag structures in the vicinity and record remarks to character-ize the damage to buildings and other infrastructure. Buildings are color-coded to indicate levels of damage and documented with photos to support the damage designation (see figures on pages 14-15).
In addition to capturing and visualizing these data in the EOC’s situational awareness viewer, and in the field on handheld devices, this real-time data can be quickly prepared as digital map presentations or printed as presentation- sized paper maps to support coordination during briefing sessions.
14 — Enabling Comprehensive Situational Awareness
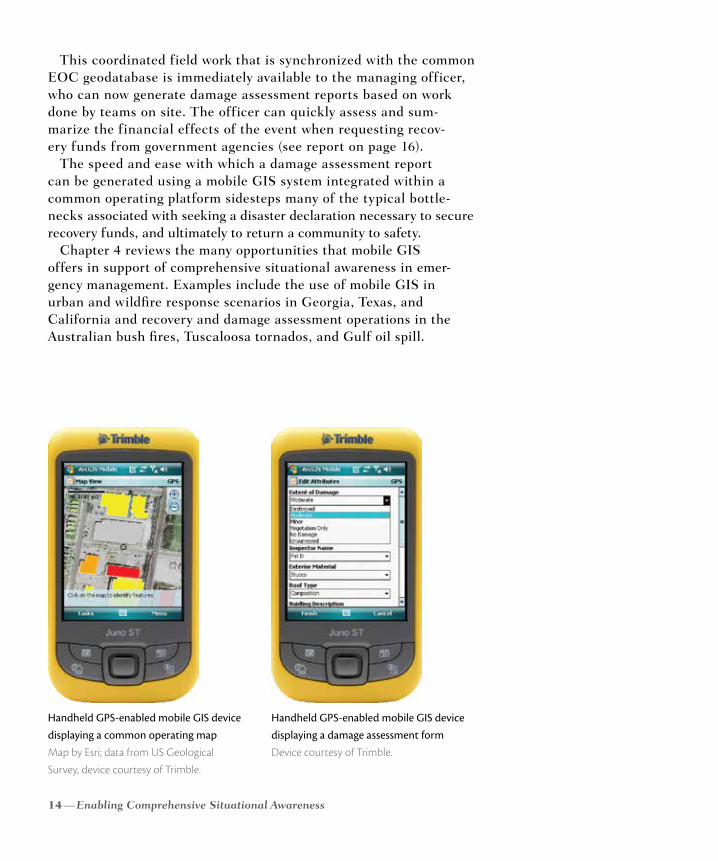
Handheld GPS-enabled mobile GIS device displaying a common operating map Map by Esri; data from US Geological
Survey, device courtesy of Trimble.
Handheld GPS-enabled mobile GIS device displaying a damage assessment form Device courtesy of Trimble.
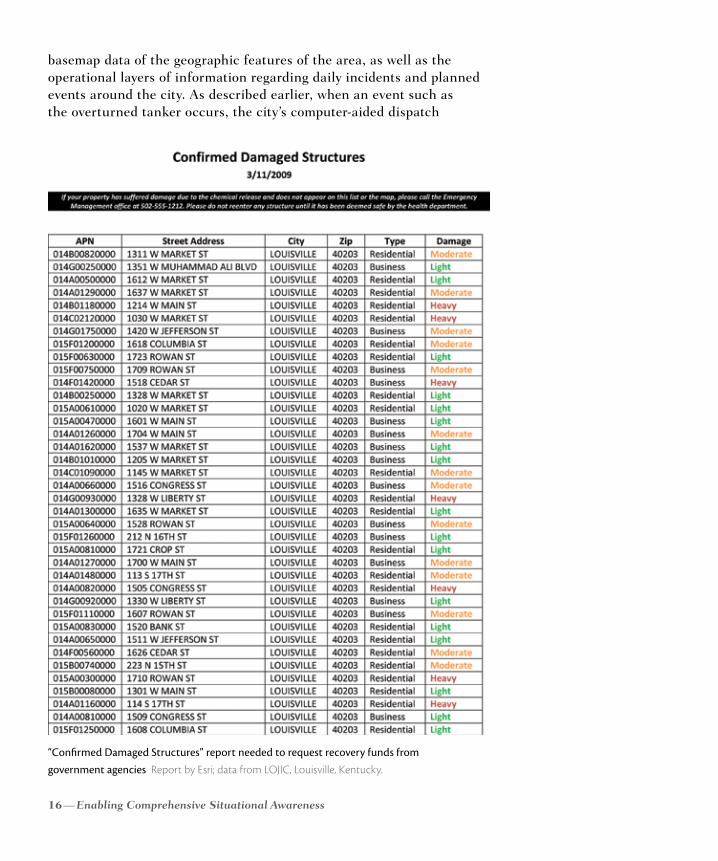
This coordinated field work that is synchronized with the common EOC geodatabase is immediately available to the managing officer, who can now generate damage assessment reports based on work done by teams on site. The officer can quickly assess and sum-marize the financial effects of the event when requesting recov-ery funds from government agencies (see report on page 16).
The speed and ease with which a damage assessment report can be generated using a mobile GIS system integrated within a common operating platform sidesteps many of the typical bottle-necks associated with seeking a disaster declaration necessary to secure recovery funds, and ultimately to return a community to safety.
Chapter 4 reviews the many opportunities that mobile GIS offers in support of comprehensive situational awareness in emer-gency management. Examples include the use of mobile GIS in urban and wildfire response scenarios in Georgia, Texas, and California and recovery and damage assessment operations in the Australian bush fires, Tuscaloosa tornados, and Gulf oil spill.
Chapter 1: Introduction — 15
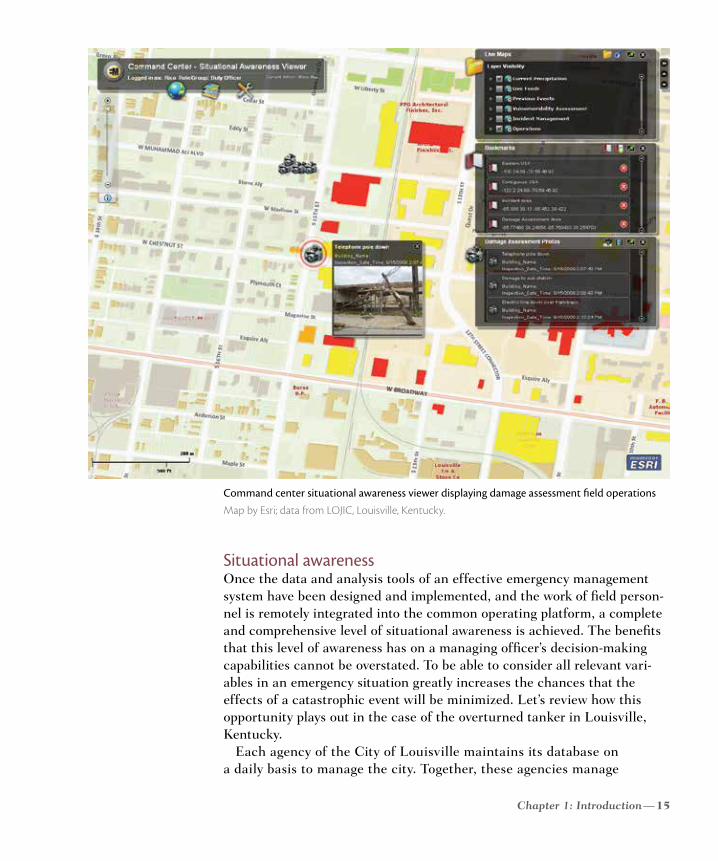
Situational awarenessOnce the data and analysis tools of an effective emergency management system have been designed and implemented, and the work of field person-nel is remotely integrated into the common operating platform, a complete and comprehensive level of situational awareness is achieved. The benefits that this level of awareness has on a managing officer’s decision-making capabilities cannot be overstated. To be able to consider all relevant vari-ables in an emergency situation greatly increases the chances that the effects of a catastrophic event will be minimized. Let’s review how this opportunity plays out in the case of the overturned tanker in Louisville, Kentucky.
Each agency of the City of Louisville maintains its database on a daily basis to manage the city. Together, these agencies manage
Command center situational awareness viewer displaying damage assessment field operations Map by Esri; data from LOJIC, Louisville, Kentucky.
16 — Enabling Comprehensive Situational Awareness
“Confirmed Damaged Structures” report needed to request recovery funds from government agencies Report by Esri; data from LOJIC, Louisville, Kentucky.
basemap data of the geographic features of the area, as well as the operational layers of information regarding daily incidents and planned events around the city. As described earlier, when an event such as the overturned tanker occurs, the city’s computer-aided dispatch
Chapter 1: Introduction — 17
(CAD) system alerts safety officials that a high-priority incident is in progress and requires immediate response. The incident is logged into the CIMS and, depending on the extent and magnitude of the event, the local EOC may be activated to its appropriate operations level. All relevant agencies and departments are summoned to the EOC to prepare a coordinated response to secure public safety.
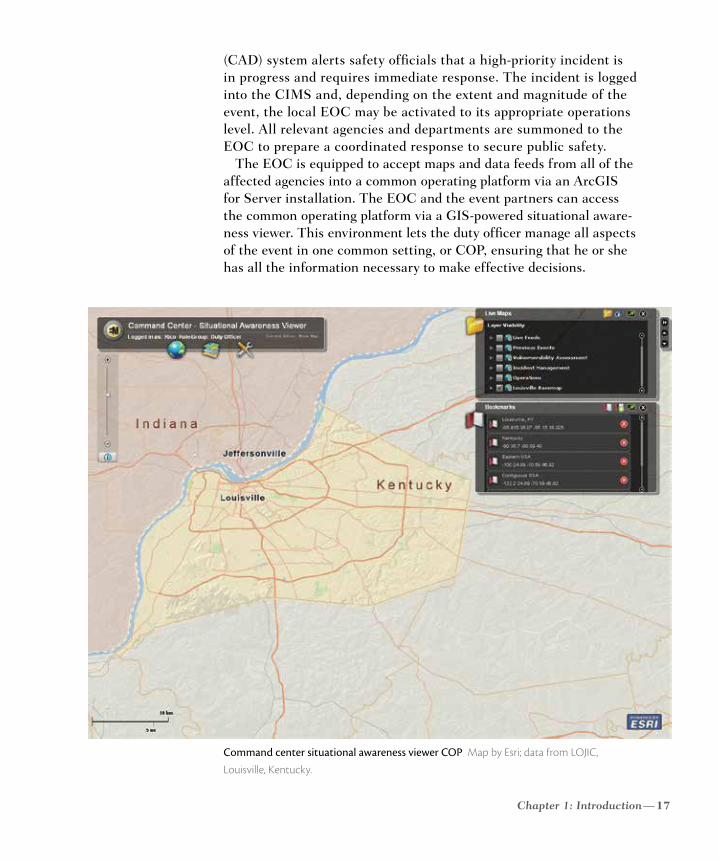
The EOC is equipped to accept maps and data feeds from all of the affected agencies into a common operating platform via an ArcGIS for Server installation. The EOC and the event partners can access the common operating platform via a GIS-powered situational aware-ness viewer. This environment lets the duty officer manage all aspects of the event in one common setting, or COP, ensuring that he or she has all the information necessary to make effective decisions.
Command center situational awareness viewer COP Map by Esri; data from LOJIC,
Louisville, Kentucky.
18 — Enabling Comprehensive Situational Awareness
Once this event takes place, the managing officer quickly undertakes three tasks that effectively support the response and management of this critical incident:
u Determination of who and what is affected u Determination of what actions to take to reduce the negative effects of the incident
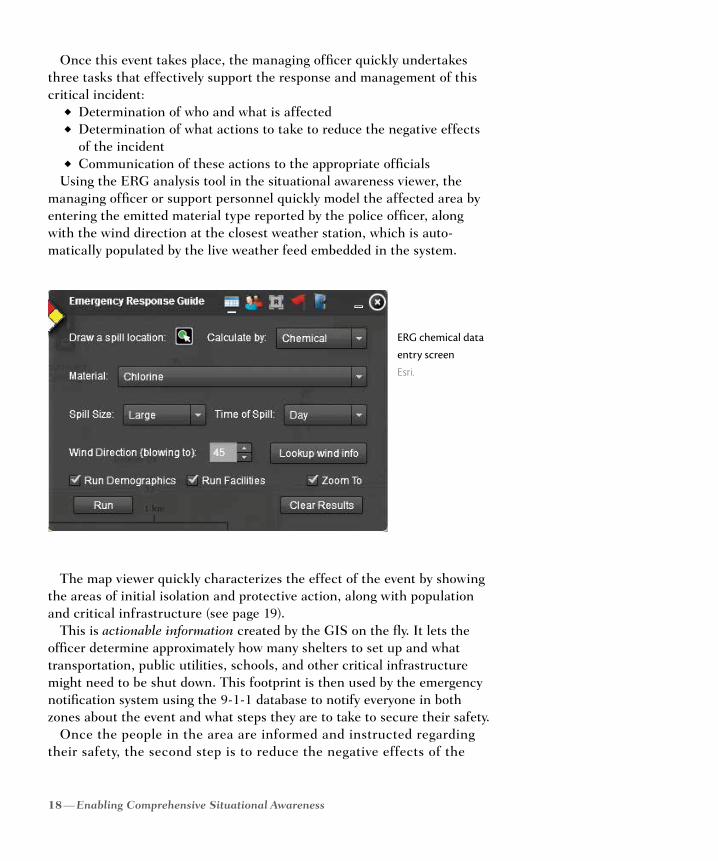
u Communication of these actions to the appropriate officialsUsing the ERG analysis tool in the situational awareness viewer, the
managing officer or support personnel quickly model the affected area by entering the emitted material type reported by the police officer, along with the wind direction at the closest weather station, which is auto-matically populated by the live weather feed embedded in the system.
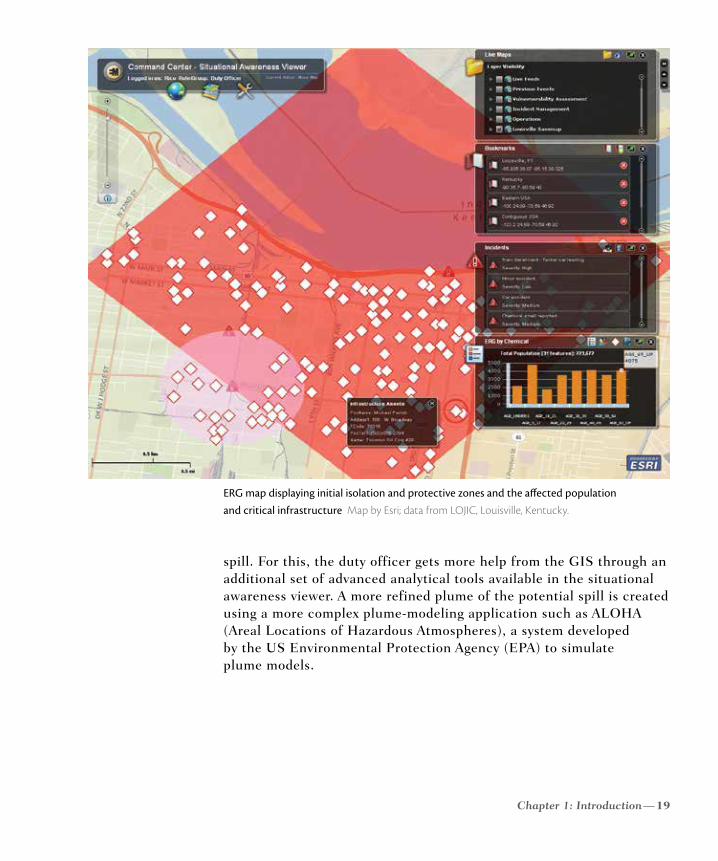
The map viewer quickly characterizes the effect of the event by showing the areas of initial isolation and protective action, along with population and critical infrastructure (see page 19).
This is actionable information created by the GIS on the fly. It lets the officer determine approximately how many shelters to set up and what transportation, public utilities, schools, and other critical infrastructure might need to be shut down. This footprint is then used by the emergency notification system using the 9-1-1 database to notify everyone in both zones about the event and what steps they are to take to secure their safety.
Once the people in the area are informed and instructed regarding their safety, the second step is to reduce the negative effects of the
ERG chemical data entry screen Esri.
Chapter 1: Introduction — 19
ERG map displaying initial isolation and protective zones and the affected population and critical infrastructure Map by Esri; data from LOJIC, Louisville, Kentucky.
spill. For this, the duty officer gets more help from the GIS through an additional set of advanced analytical tools available in the situational awareness viewer. A more refined plume of the potential spill is created using a more complex plume-modeling application such as ALOHA (Areal Locations of Hazardous Atmospheres), a system developed by the US Environmental Protection Agency (EPA) to simulate plume models.
20 — Enabling Comprehensive Situational Awareness
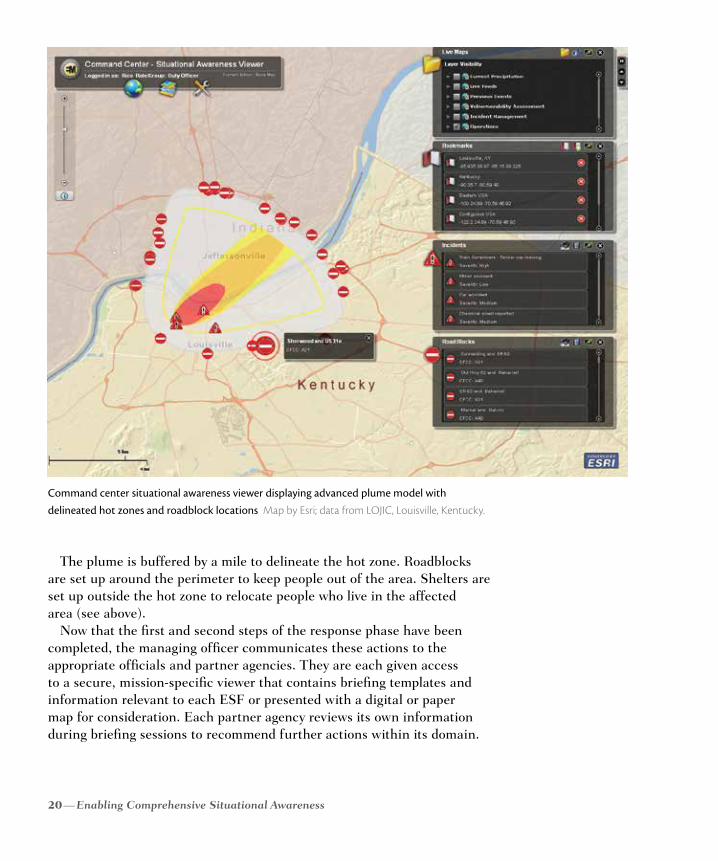
The plume is buffered by a mile to delineate the hot zone. Roadblocks are set up around the perimeter to keep people out of the area. Shelters are set up outside the hot zone to relocate people who live in the affected area (see above).
Now that the first and second steps of the response phase have been completed, the managing officer communicates these actions to the appropriate officials and partner agencies. They are each given access to a secure, mission-specific viewer that contains briefing templates and information relevant to each ESF or presented with a digital or paper map for consideration. Each partner agency reviews its own information during briefing sessions to recommend further actions within its domain.
Command center situational awareness viewer displaying advanced plume model with delineated hot zones and roadblock locations Map by Esri; data from LOJIC, Louisville, Kentucky.
Chapter 1: Introduction — 21
This scenario illustrates how effective the situational awareness viewer is in supporting a highly coordinated effort by participating agencies and response teams to quickly and effectively secure public safety in the most efficient manner. Chapter 5 provides a range of examples of how the geographic approach to emergency management provides effec-tive planning and operations tools to secure public safety. The National Level Exercise is explored to illustrate the effectiveness of these tools.
These four workflow patterns make up the legs that support the ArcGIS common operating platform. Data management, planning and analysis, field operations, and situational awareness are what GIS does to systematically support emergency management work-flow. If any one of these legs is broken, we lose the capability to pro-vide a comprehensive systematic approach to emergency operations.
Chapter 6 is a guide to configuring key components of the ArcGIS common operating platform that deliver actionable information to managers and commanders. Selected templates and tools are explored that publish data embedded in the platform, bringing it to those making the critical decisions that save lives and protect property. Focus is on the implementation and configuration of key situational awareness viewers and map products using sample data provided from Naperville, Illinois. Configuration notes addressing how the viewers can be configured specifically for your jurisdiction are also presented to support the implementation of a system that enables the greatest situational awareness of emergency events in your own community. Best practices for ArcGIS for Desktop and ArcGIS for Server software configurations, hardware assemblies, applications, data, and resources to build the optimal system for effective emer-gency management planning and operations also are reviewed. This information is essential to the emergency manager and support staff implementing comprehensive situational awareness systems.