Embed Size (px)
Citation preview
Appendix L
KPMG IT Benchmarking
IT Plan Review- Benchmarking
17 May 2019
kpmg.com.au
2SA Water Our Plan 2020-24
1© 2018 KPMG, an Australian partnership and a member firm of the KPMG network of independent member firms affiliated with KPMG International Cooperative (“KPMG International”), a Swiss entity. All rights reserved. The KPMG name and logo are registered trademarks or trademarks of KPMG International. Liability limited by a scheme approved under Professional Standards Legislation.
Document Classification: KPMG Confidential
1
ContentsPage
Summary 2
Benchmarking assessment 7
Appendix - Digital Maturity Assessment 18
Important Notice
Inherent Limitations
This report has been prepared as outlined in the Scope Section. The services provided in connection with this engagement comprise an advisory engagement, which is not subject to assurance or other standards issued by the Australian Auditing and Assurance Standards Board and, consequently no opinions or conclusions intended to convey assurance have been expressed.
No warranty of completeness, accuracy or reliability is given in relation to the statements and representations made by, and the information and documentation provided by, South Australian Water Corporation (SA Water) and its personnel consulted as part of the process.
KPMG have indicated within this report the sources of the information provided. We have not sought to independently verify those sources unless otherwise noted within the report.
KPMG is under no obligation in any circumstance to update this report, in either oral or written form, for events occurring after the report has been issued in final form.
The findings in this report have been formed on the above basis.
Third Party Reliance
This report is solely for the purpose set out in the Scope Section and for SA Water’s information, and is not to be used for any other purpose or distributed to any other party without KPMG’s prior written consent. KPMG consent to the release of the report to ESCOSA and their Customer Negotiation Committee (CNC).
This report has been prepared at the request of SA Water in accordance with the terms of your letter of acceptance dated 5 March 2019. Other than our responsibility to SA Water, neither KPMG nor any member or employee of KPMG undertakes responsibility arising in any way from reliance placed by a third party on this report. Any reliance placed is that party’s sole responsibility.
Benchmarking
Benchmarking analysis can provide broad, indicative evidence of comparative performance or levels of investment between organisations, but should not be used as the sole measure of effectiveness or efficiency as many factors can impact the analysis. Whilst effort has been made to provide a valid comparison between similar organisations, factors such as size, geography, industry segment, investment cycle, business model and scope etc. will all play a part in the resultant metric values. Care should be taken in drawing any conclusions on the basis of this benchmarking analysis alone.
KPMG shall not be held liable should any future trends or outcomes presented in this report not eventuate.
3SA Water Our Plan 2020-24
Summary
4SA Water Our Plan 2020-24
3© 2018 KPMG, an Australian partnership and a member firm of the KPMG network of independent member firms affiliated with KPMG International Cooperative (“KPMG International”), a Swiss entity. All rights reserved. The KPMG name and logo are registered trademarks or trademarks of KPMG International. Liability limited by a scheme approved under Professional Standards Legislation.
Document Classification: KPMG Confidential
3
Scope
SA Water has asked KPMG to compare its current and forecast IT expenditure against its peers in the water and utilities sectors.
Benchmarking is one of many elements that can be used to demonstrate the prudency and efficiency of expenditure forecasts.
This paper provides a summary of the findings from KPMG’s benchmarking analysis, through a comparison with similar industry organisations across a range of metrics. Industry trends together with SA Water’s self-assessed digital capability maturity are used to contextualise the benchmark data.
Our approach
We have used a number of confidential and publicly available sources of information to generate robust benchmarking data.
We have then tested the outputs of this benchmarking analysis against demonstrated industry trends.
Lastly, we have tested SA Water’s aspirations for improvement in its digital capability maturity against what we would expect of a modern customer centric utility business and against its proposed IT program.
Introduction
The Essential Services Commission of South Australia (ESCOSA) is responsible for the economic regulation of the water industry in South Australia. SAW is required to lodge a regulatory submission with ESCOSA for assessment of their revenue requirement for the 2020-2024 regulatory period (RBP20). As part of this submission, IT plans for the upcoming period are reviewed to ensure their expenditure forecasts are both prudent and efficient.
ESCOSA 1 has challenged SAW to:
• provide water and sewerage services at the lowest sustainable price for the quality and reliability levels valued by customers, and
• have in place sound long-term asset management, operating and financing strategies, which support the provision of services for customers today and tomorrow.
To deliver the lowest sustainable prices for the services that SAW’s customers value, ESCOSA seeks to set regulated revenue to reflect the prudent and efficient cost of its services. ESCOSA has defined expenditure as prudent where there is clear justification for that activity . This will be informed by an assessment of whether the expenditure is driven by:
• a legislative or regulatory obligation, which SA Water must comply with
• an expectation that the activity will deliver benefits to consumers that outweigh the costs, or
• a clear expectation from customers that an outcome should be achieved, and that they are willing to pay for that outcome.
ESCOSA has defined expenditure as efficient where it represents the lowest sustainable (or ‘long-term’) cost of achieving the intended outcome.
BackgroundSAW is assessing the
prudency and efficiency of its
current and proposed IT
expenditure.
The findings will be presented
to ESCOSA’s Customer
Negotiation Committee and
ESCOSA to inform the next
regulatory submission in
2020.
1 SA Water Regulatory Determination 2020: Guidance Paper 4 (prudent and efficient expenditure) (henceforth Guidance Paper 4),
5SA Water Our Plan 2020-24
4© 2018 KPMG, an Australian partnership and a member firm of the KPMG network of independent member firms affiliated with KPMG International Cooperative (“KPMG International”), a Swiss entity. All rights reserved. The KPMG name and logo are registered trademarks or trademarks of KPMG International. Liability limited by a scheme approved under Professional Standards Legislation.
Document Classification: KPMG Confidential
4
Process
In undertaking benchmarking analysis of SA Water's current and forecast IT expenditure, KPMG has sourced information from:
• KPMG’s bi-annual Utilities IT Benchmarking Survey
• KPMG Source – our global platform for the provision of benchmark data, tools and methodologies
• Publically available information such as annual reports and regulatory proposals, for peer water utilities, and
• The Harvey Nash/KPMG CIO Survey 2018 To enable a valid comparison across businesses of different sizes, we have normalised these metrics on a per end user or per customer basis, or determined IT expenditure as a percentage of corporate expenditure/revenue.
Capex
Of the three capex benchmarking metrics:
• SA Water’s historical capex as a percentage of total corporate capex is slightly below the historical benchmark average, being 3.7% lower. This increases to 55.6% higher than the historical benchmark average, when considering forecast capex in the next regulatory period.
• SA Water’s historical capex per corporate end user is in line with the historical benchmark average, being 4.5% higher. This increases to 45.3% higher than the historical benchmark average, when considering forecast capex in the next regulatory period.
• SA Water’s historical capex per customer is 23.6% higher than the historical benchmark average. This increases to 65.3% higher than the historical benchmark average, when considering forecast capex in the next regulatory period.
Benchmarking analysisOpex
Of the three opex benchmarking metrics:
• SA Water’s historical opex as a percentage of total corporate capex is lower than the historical benchmark average by 40.4%. This reduces to 28.4% below than the historical benchmark average, when considering forecast opex in the next regulatory period.
• SA Water’s historical opex per corporate end user is lower than the historical benchmark average by 20.3%. This reduces to 17.5% lower than the historical benchmark average, when considering forecast opex in the next regulatory period.
• SA Water’s historical opex per customer is 1.2% lower than the historical benchmark average. This improves slightly to 1.9% lower than the historical benchmark average, when considering forecast opex in the next regulatory period.
Total expenditure
It is also important to look at total IT expenditure, as different businesses will adopt different IT strategies. For example insourcing vs outsourcing, or licensing vs system build. This will impact the balance between IT capex and opex, implying that it is important to consider total IT expenditure.
SA Water’s total historical IT expenditure (opex plus capex) as a proportion of corporate revenue is lower than the historical benchmark average by 42.3%. This reduces to 28.2% lower than the historical benchmark average, when considering forecast opex in the next regulatory period. SA Water’s total IT expenditure per user ($30,567) is currently in line with Gartner’s global average for the sector ($30,317)1.
6SA Water Our Plan 2020-24
5© 2018 KPMG, an Australian partnership and a member firm of the KPMG network of independent member firms affiliated with KPMG International Cooperative (“KPMG International”), a Swiss entity. All rights reserved. The KPMG name and logo are registered trademarks or trademarks of KPMG International. Liability limited by a scheme approved under Professional Standards Legislation.
Document Classification: KPMG Confidential
5
• Operational Innovation – the optimisation of enterprise operations, a very traditional goal for IT in the utilities sector, and digital transformation. Both these aspects are reflected in the initiatives noted above as well as Integrated Operations and Workforce Collaboration and Mobility initiatives.
Trends in IT expenditureSurvey data and anecdotal evidence of utility businesses demonstrate that IT expenditure is forecast to continue increasing. For example:
• Almost half (49%) of Australian respondents to the KPMG/Harvey Nash CIO survey indicated that their IT budgets were increasing 2.
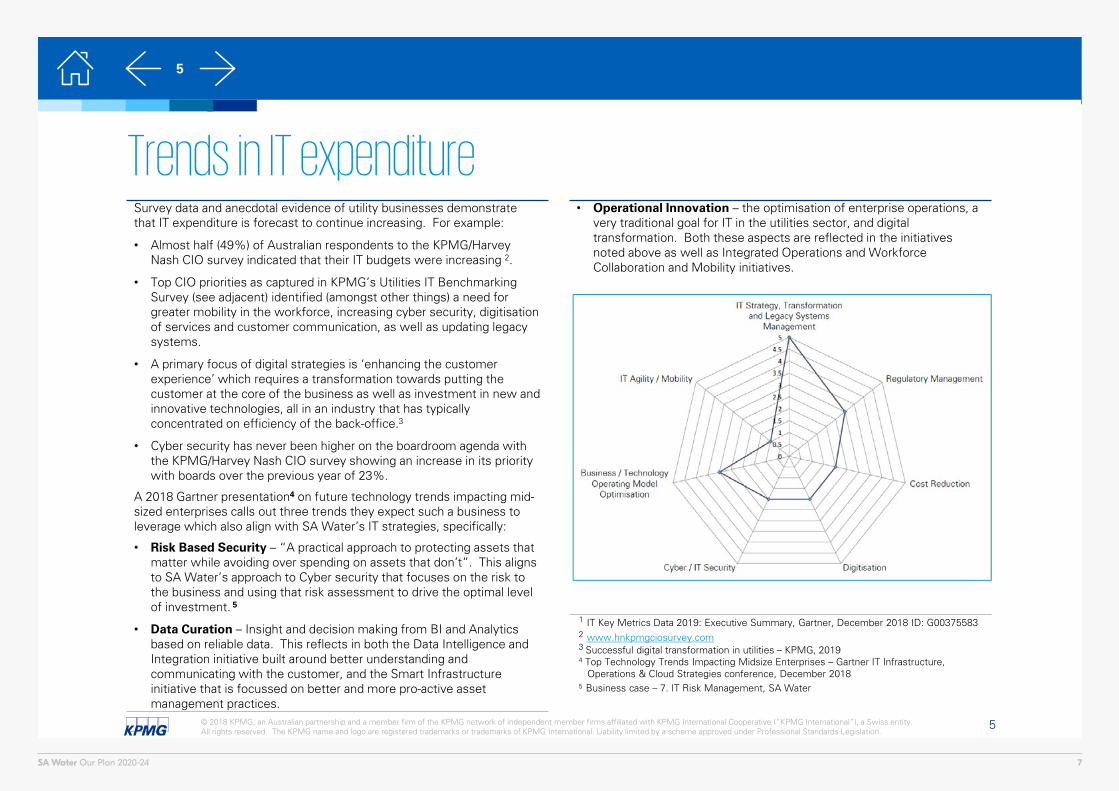
• Top CIO priorities as captured in KPMG’s Utilities IT Benchmarking Survey (see adjacent) identified (amongst other things) a need for greater mobility in the workforce, increasing cyber security, digitisation of services and customer communication, as well as updating legacy systems.
• A primary focus of digital strategies is ‘enhancing the customer experience’ which requires a transformation towards putting the customer at the core of the business as well as investment in new and innovative technologies, all in an industry that has typically concentrated on efficiency of the back-office.3
• Cyber security has never been higher on the boardroom agenda with the KPMG/Harvey Nash CIO survey showing an increase in its priority with boards over the previous year of 23%.
A 2018 Gartner presentation4 on future technology trends impacting mid-sized enterprises calls out three trends they expect such a business to leverage which also align with SA Water’s IT strategies, specifically:
• Risk Based Security – “A practical approach to protecting assets that matter while avoiding over spending on assets that don’t”. This aligns to SA Water’s approach to Cyber security that focuses on the risk to the business and using that risk assessment to drive the optimal level of investment. 5
• Data Curation – Insight and decision making from BI and Analytics based on reliable data. This reflects in both the Data Intelligence and Integration initiative built around better understanding and communicating with the customer, and the Smart Infrastructure initiative that is focussed on better and more pro-active asset management practices.
1 IT Key Metrics Data 2019: Executive Summary, Gartner, December 2018 ID: G003755832 www.hnkpmgciosurvey.com3 Successful digital transformation in utilities – KPMG, 20194 Top Technology Trends Impacting Midsize Enterprises – Gartner IT Infrastructure,
Operations & Cloud Strategies conference, December 20185 Business case – 7. IT Risk Management, SA Water
7SA Water Our Plan 2020-24
6© 2018 KPMG, an Australian partnership and a member firm of the KPMG network of independent member firms affiliated with KPMG International Cooperative (“KPMG International”), a Swiss entity. All rights reserved. The KPMG name and logo are registered trademarks or trademarks of KPMG International. Liability limited by a scheme approved under Professional Standards Legislation.
Document Classification: KPMG Confidential
6
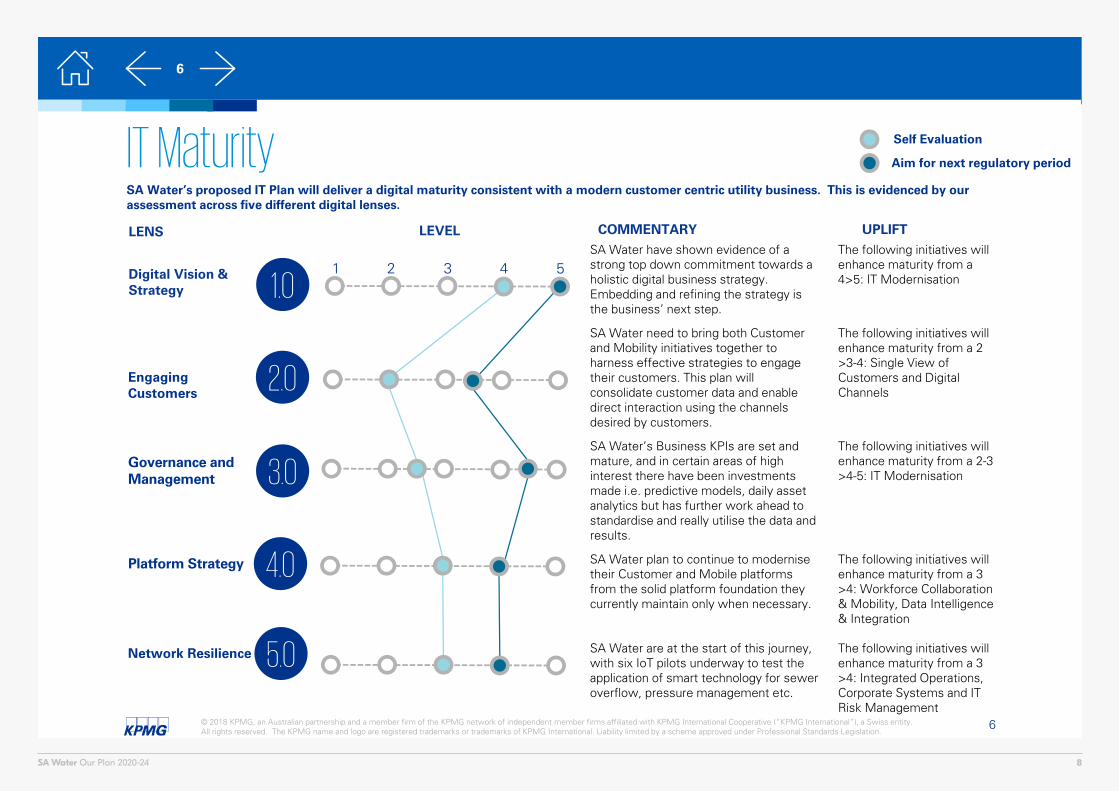
SA Water’s proposed IT Plan will deliver a digital maturity consistent with a modern customer centric utility business. This is evidenced by our assessment across five different digital lenses.
IT Maturity
1
Platform Strategy
Network Resilience
Governance and Management
Digital Vision &Strategy
EngagingCustomers
1.0
2.0
3.0
5.0
4.0
2 3 4 5SA Water have shown evidence of a strong top down commitment towards a holistic digital business strategy. Embedding and refining the strategy is the business’ next step.
The following initiatives will enhance maturity from a 4>5: IT Modernisation
SA Water need to bring both Customer and Mobility initiatives together to harness effective strategies to engage their customers. This plan will consolidate customer data and enable direct interaction using the channels desired by customers.
The following initiatives will enhance maturity from a 2 >3-4: Single View of Customers and Digital Channels
SA Water’s Business KPIs are set and mature, and in certain areas of high interest there have been investments made i.e. predictive models, daily asset analytics but has further work ahead to standardise and really utilise the data and results.
The following initiatives will enhance maturity from a 2-3 >4-5: IT Modernisation
SA Water plan to continue to modernise their Customer and Mobile platforms from the solid platform foundation they currently maintain only when necessary.
The following initiatives will enhance maturity from a 3 >4: Workforce Collaboration & Mobility, Data Intelligence & Integration
SA Water are at the start of this journey, with six IoT pilots underway to test the application of smart technology for sewer overflow, pressure management etc.
The following initiatives will enhance maturity from a 3 >4: Integrated Operations, Corporate Systems and IT Risk Management
LENS LEVEL COMMENTARY
Self Evaluation
Aim for next regulatory period
UPLIFT
8SA Water Our Plan 2020-24
Benchmarking assessment
9SA Water Our Plan 2020-24
8© 2018 KPMG, an Australian partnership and a member firm of the KPMG network of independent member firms affiliated with KPMG International Cooperative (“KPMG International”), a Swiss entity. All rights reserved. The KPMG name and logo are registered trademarks or trademarks of KPMG International. Liability limited by a scheme approved under Professional Standards Legislation.
Document Classification: KPMG Confidential
8
KPMG Bi-annual Utilities IT Benchmarking Survey
A core source data for our benchmarking comparison are the results of the 2018 KPMG Utilities IT Benchmarking Survey. This survey utilises confidentially sourced information together with publically available data from the Australian Energy Regulator to benchmark the IT expenditure and strategies of Australian electricity and gas distributors. These organisations, whist not operating in the water industry, do have very common characteristics to SA Water and therefore provide a reasonable comparison. For example, they all invest in, operate and maintain networks of critical assets necessary for the provision of essential services to customers
Strategy and maturity
We have performed our benchmarking analysis in the context of SA Water’s digital capability maturity, an assessment of which is provided, and the strategies/areas of focus of other water utilities in Australia as well as comparative international and national organisations.
This enables us to form a view on whether the type and extent of expenditure being proposed by SA Water is reasonable given their stated strategic direction, and if it is in line with the trends in the industry.
The following page summarises the financial benchmark analysis undertaken, with detailed charts provided thereafter. We then provide a summary of SA Water’s alignment to strategic IT trends in the industry. The detailed framework used by SA Water to assess its digital capability maturity is provided in the appendix.
Financial benchmarking
Benchmarking is a quantitative or data driven approach used widely by governments, regulators, businesses and consumers around the world to measure how efficient firms are at delivering services over time and compared with their peers.
To test the suitability of SAW’s IT Plan, we have compared it to:
• IT expenditure of comparable Australian water businesses;
• IT expenditure of comparable Australian utility businesses; and
• Other global and national benchmarks and survey data.
Benchmarking other Australian water businesses
In benchmarking SA Water against its peers, we have sourced financial information from publically available sources such as annual reports and regulatory submissions for the following:
• City West Water• Hunter Water Corporation• South East Water Ltd• Sydney Water Corporation• Unitywater• Water Corporation—Perth• Yarra Valley Water• Taswater
This section provides details of the results of our benchmarking assessment of SA Water’s historic and forecast IT operating and capital expenditure, together with a comparison of their strategic focus to the trends we are aware of across the industry.
Benchmark data has been sourced from:
• KPMG’s bi-annual Utilities IT Benchmarking Survey
• KPMG Source – our global platform for the provision of benchmark data, tools and methodologies.
• Publically available information such as annual reports and regulatory proposals, for peer water utilities
• The Harvey Nash/KPMG CIO Survey 2018 1
• Other publically quoted relevant benchmarks.
1 www.hnkpmgciosurvey.com
10SA Water Our Plan 2020-24
9© 2018 KPMG, an Australian partnership and a member firm of the KPMG network of independent member firms affiliated with KPMG International Cooperative (“KPMG International”), a Swiss entity. All rights reserved. The KPMG name and logo are registered trademarks or trademarks of KPMG International. Liability limited by a scheme approved under Professional Standards Legislation.
Document Classification: KPMG Confidential
9
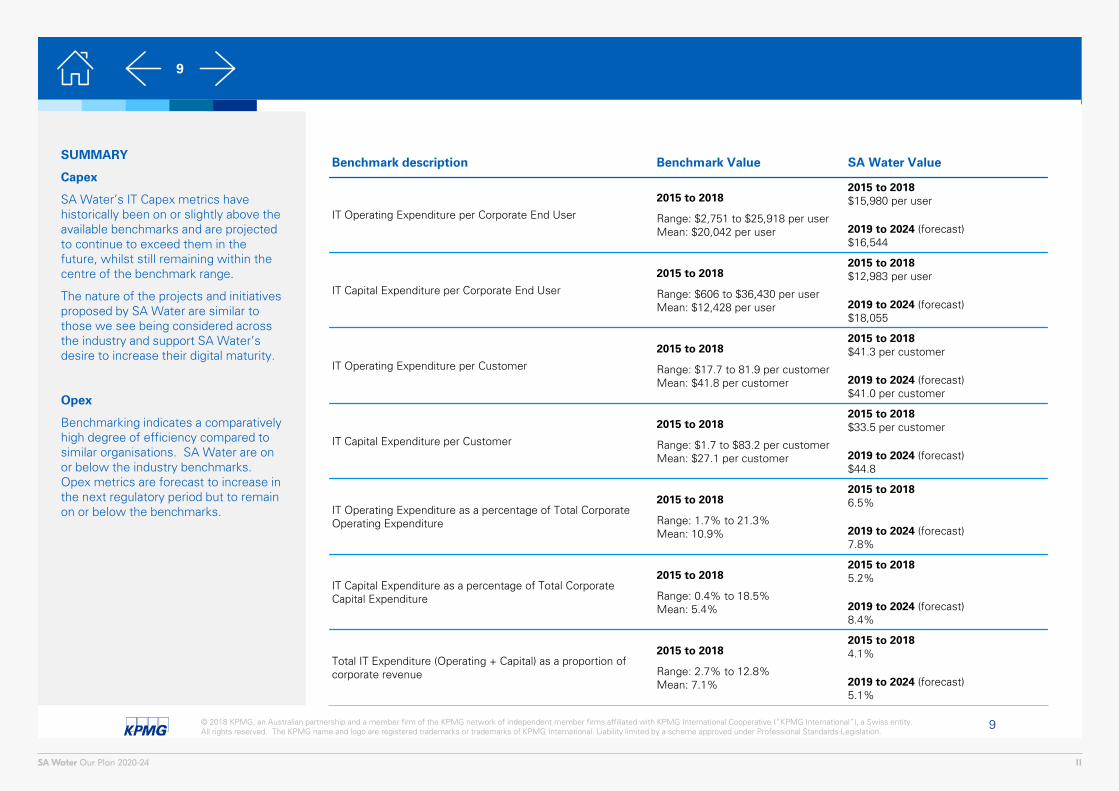
SUMMARY
Capex
SA Water’s IT Capex metrics have historically been on or slightly above the available benchmarks and are projected to continue to exceed them in the future, whilst still remaining within the centre of the benchmark range.
The nature of the projects and initiatives proposed by SA Water are similar to those we see being considered across the industry and support SA Water’s desire to increase their digital maturity.
Opex
Benchmarking indicates a comparatively high degree of efficiency compared to similar organisations. SA Water are on or below the industry benchmarks. Opex metrics are forecast to increase in the next regulatory period but to remain on or below the benchmarks.
Benchmark description Benchmark Value SA Water Value
IT Operating Expenditure per Corporate End User
2015 to 2018
Range: $2,751 to $25,918 per userMean: $20,042 per user
2015 to 2018$15,980 per user
2019 to 2024 (forecast)$16,544
IT Capital Expenditure per Corporate End User
2015 to 2018
Range: $606 to $36,430 per userMean: $12,428 per user
2015 to 2018$12,983 per user
2019 to 2024 (forecast)$18,055
IT Operating Expenditure per Customer
2015 to 2018
Range: $17.7 to 81.9 per customerMean: $41.8 per customer
2015 to 2018$41.3 per customer
2019 to 2024 (forecast)$41.0 per customer
IT Capital Expenditure per Customer
2015 to 2018
Range: $1.7 to $83.2 per customerMean: $27.1 per customer
2015 to 2018$33.5 per customer
2019 to 2024 (forecast)$44.8
IT Operating Expenditure as a percentage of Total Corporate Operating Expenditure
2015 to 2018
Range: 1.7% to 21.3%Mean: 10.9%
2015 to 20186.5%
2019 to 2024 (forecast)7.8%
IT Capital Expenditure as a percentage of Total Corporate Capital Expenditure
2015 to 2018
Range: 0.4% to 18.5%Mean: 5.4%
2015 to 20185.2%
2019 to 2024 (forecast)8.4%
Total IT Expenditure (Operating + Capital) as a proportion of corporate revenue
2015 to 2018
Range: 2.7% to 12.8%Mean: 7.1%
2015 to 20184.1%
2019 to 2024 (forecast)5.1%
11SA Water Our Plan 2020-24
10© 2018 KPMG, an Australian partnership and a member firm of the KPMG network of independent member firms affiliated with KPMG International Cooperative (“KPMG International”), a Swiss entity. All rights reserved. The KPMG name and logo are registered trademarks or trademarks of KPMG International. Liability limited by a scheme approved under Professional Standards Legislation.
Document Classification: KPMG Confidential
10
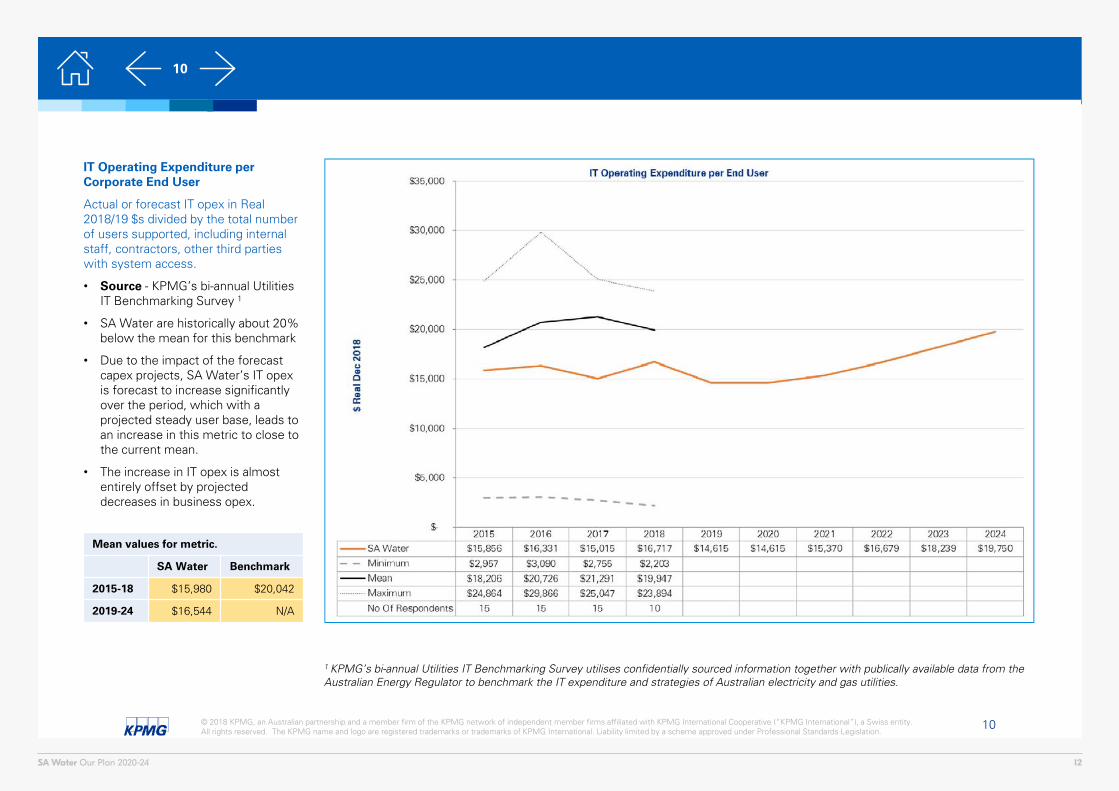
IT Operating Expenditure per Corporate End User
Actual or forecast IT opex in Real 2018/19 $s divided by the total number of users supported, including internal staff, contractors, other third parties with system access.
• Source - KPMG’s bi-annual Utilities IT Benchmarking Survey 1
• SA Water are historically about 20% below the mean for this benchmark
• Due to the impact of the forecast capex projects, SA Water’s IT opex is forecast to increase significantly over the period, which with a projected steady user base, leads to an increase in this metric to close to the current mean.
• The increase in IT opex is almost entirely offset by projected decreases in business opex.
1 KPMG’s bi-annual Utilities IT Benchmarking Survey utilises confidentially sourced information together with publically available data from the Australian Energy Regulator to benchmark the IT expenditure and strategies of Australian electricity and gas utilities.
Mean values for metric.
SA Water Benchmark
2015-18 $15,980 $20,042
2019-24 $16,544 N/A
12SA Water Our Plan 2020-24
11© 2018 KPMG, an Australian partnership and a member firm of the KPMG network of independent member firms affiliated with KPMG International Cooperative (“KPMG International”), a Swiss entity. All rights reserved. The KPMG name and logo are registered trademarks or trademarks of KPMG International. Liability limited by a scheme approved under Professional Standards Legislation.
Document Classification: KPMG Confidential
11
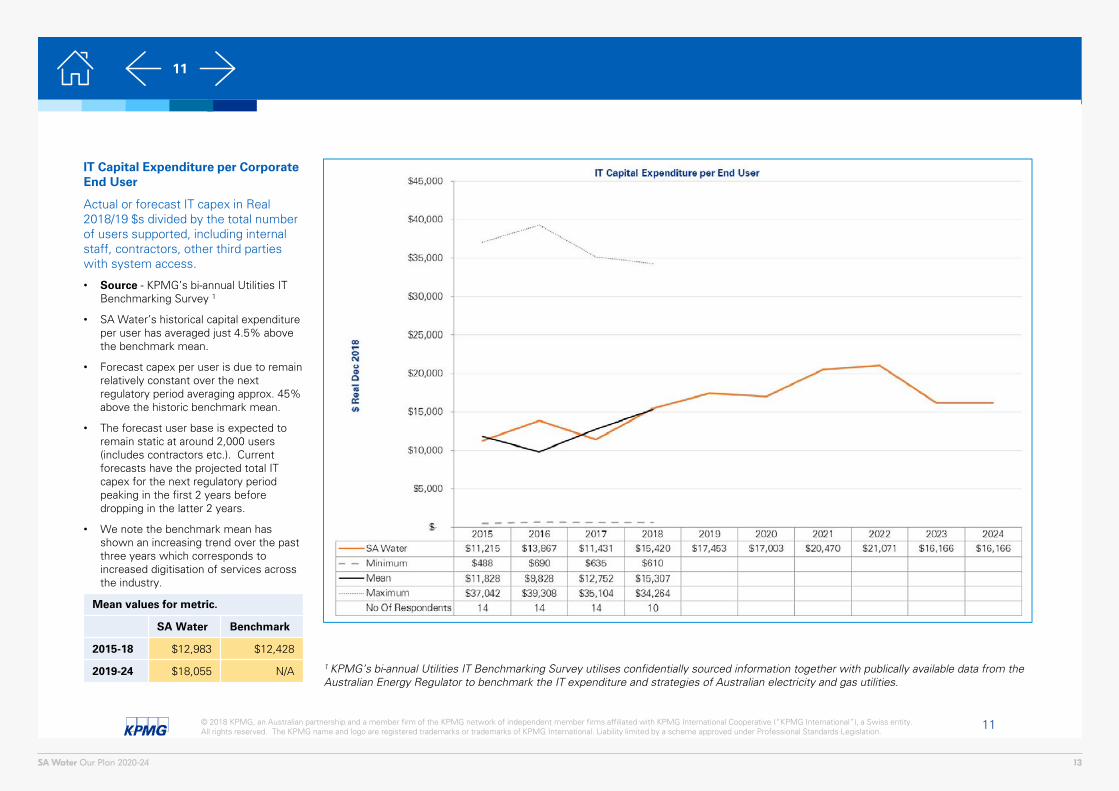
IT Capital Expenditure per Corporate End User
Actual or forecast IT capex in Real 2018/19 $s divided by the total number of users supported, including internal staff, contractors, other third parties with system access.
• Source - KPMG’s bi-annual Utilities IT Benchmarking Survey 1
• SA Water’s historical capital expenditure per user has averaged just 4.5% above the benchmark mean.
• Forecast capex per user is due to remain relatively constant over the next regulatory period averaging approx. 45% above the historic benchmark mean.
• The forecast user base is expected to remain static at around 2,000 users (includes contractors etc.). Current forecasts have the projected total IT capex for the next regulatory period peaking in the first 2 years before dropping in the latter 2 years.
• We note the benchmark mean has shown an increasing trend over the past three years which corresponds to increased digitisation of services across the industry.
1 KPMG’s bi-annual Utilities IT Benchmarking Survey utilises confidentially sourced information together with publically available data from the Australian Energy Regulator to benchmark the IT expenditure and strategies of Australian electricity and gas utilities.
Mean values for metric.
SA Water Benchmark
2015-18 $12,983 $12,428
2019-24 $18,055 N/A
13SA Water Our Plan 2020-24
12© 2018 KPMG, an Australian partnership and a member firm of the KPMG network of independent member firms affiliated with KPMG International Cooperative (“KPMG International”), a Swiss entity. All rights reserved. The KPMG name and logo are registered trademarks or trademarks of KPMG International. Liability limited by a scheme approved under Professional Standards Legislation.
Document Classification: KPMG Confidential
12
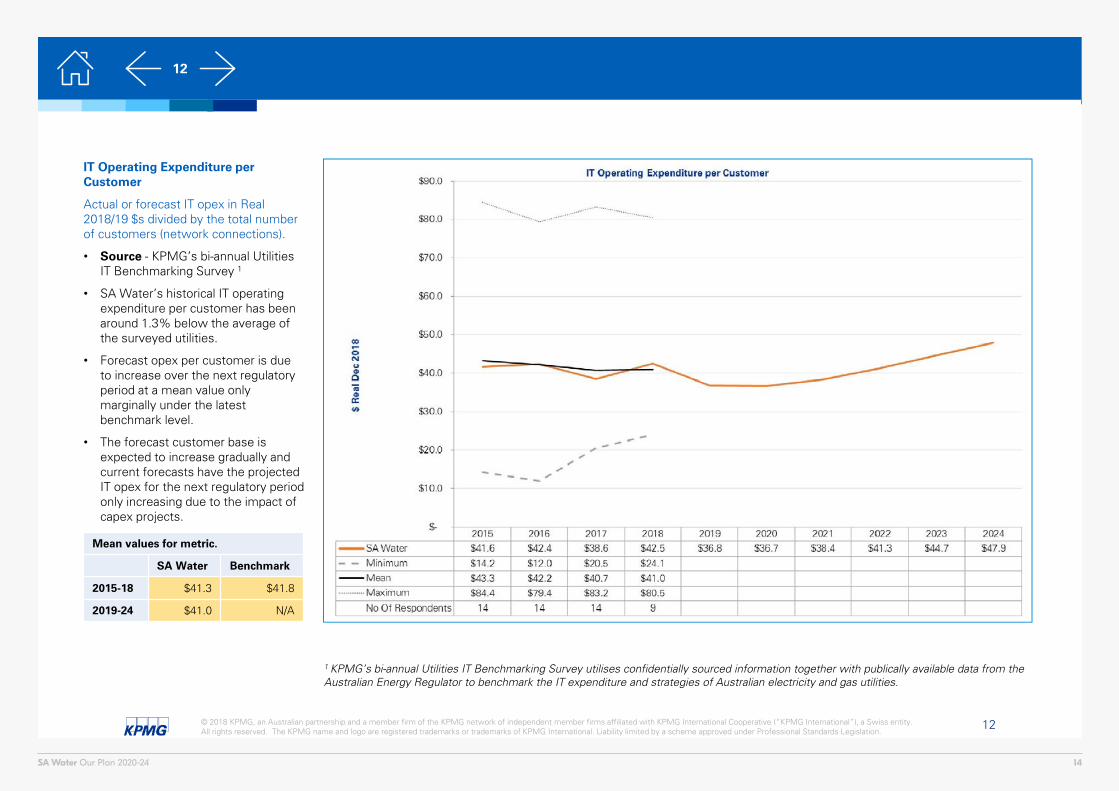
IT Operating Expenditure per Customer
Actual or forecast IT opex in Real 2018/19 $s divided by the total number of customers (network connections).
• Source - KPMG’s bi-annual Utilities IT Benchmarking Survey 1
• SA Water’s historical IT operating expenditure per customer has been around 1.3% below the average of the surveyed utilities.
• Forecast opex per customer is due to increase over the next regulatory period at a mean value only marginally under the latest benchmark level.
• The forecast customer base is expected to increase gradually and current forecasts have the projected IT opex for the next regulatory period only increasing due to the impact of capex projects.
1 KPMG’s bi-annual Utilities IT Benchmarking Survey utilises confidentially sourced information together with publically available data from the Australian Energy Regulator to benchmark the IT expenditure and strategies of Australian electricity and gas utilities.
Mean values for metric.
SA Water Benchmark
2015-18 $41.3 $41.8
2019-24 $41.0 N/A
14SA Water Our Plan 2020-24
13© 2018 KPMG, an Australian partnership and a member firm of the KPMG network of independent member firms affiliated with KPMG International Cooperative (“KPMG International”), a Swiss entity. All rights reserved. The KPMG name and logo are registered trademarks or trademarks of KPMG International. Liability limited by a scheme approved under Professional Standards Legislation.
Document Classification: KPMG Confidential
13
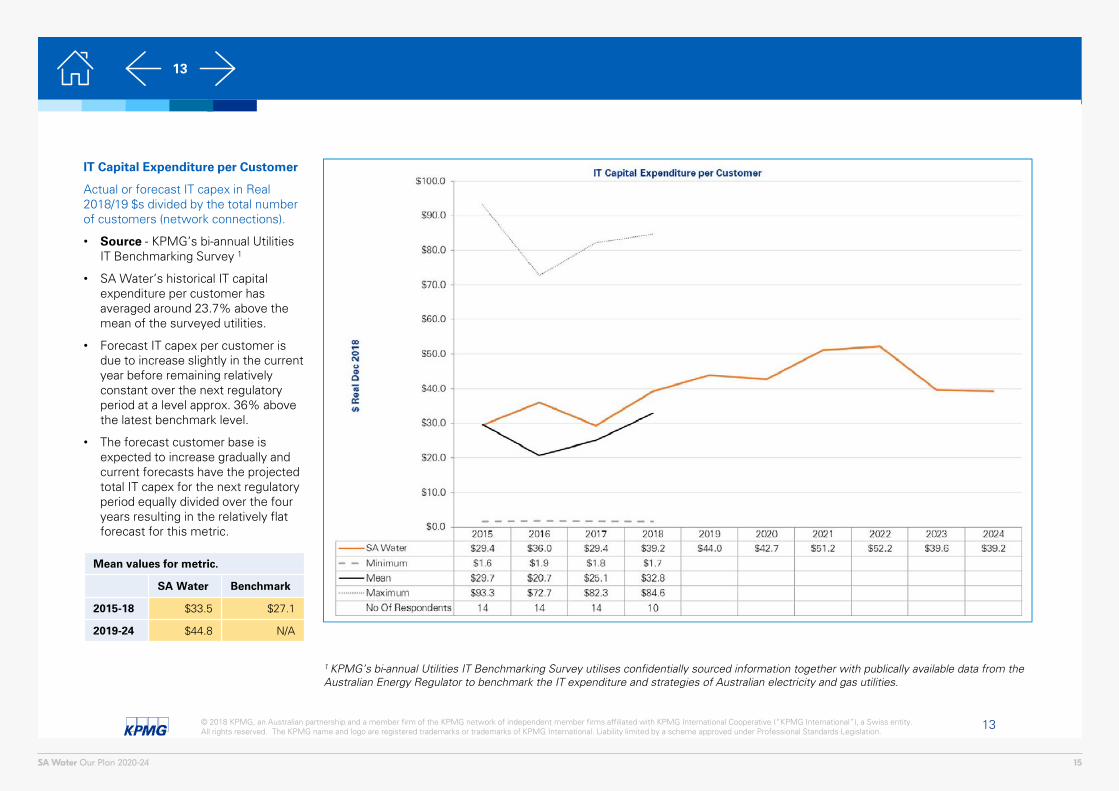
IT Capital Expenditure per Customer
Actual or forecast IT capex in Real 2018/19 $s divided by the total number of customers (network connections).
• Source - KPMG’s bi-annual Utilities IT Benchmarking Survey 1
• SA Water’s historical IT capital expenditure per customer has averaged around 23.7% above the mean of the surveyed utilities.
• Forecast IT capex per customer is due to increase slightly in the current year before remaining relatively constant over the next regulatory period at a level approx. 36% above the latest benchmark level.
• The forecast customer base is expected to increase gradually and current forecasts have the projected total IT capex for the next regulatory period equally divided over the four years resulting in the relatively flat forecast for this metric.
1 KPMG’s bi-annual Utilities IT Benchmarking Survey utilises confidentially sourced information together with publically available data from the Australian Energy Regulator to benchmark the IT expenditure and strategies of Australian electricity and gas utilities.
Mean values for metric.
SA Water Benchmark
2015-18 $33.5 $27.1
2019-24 $44.8 N/A
15SA Water Our Plan 2020-24
14© 2018 KPMG, an Australian partnership and a member firm of the KPMG network of independent member firms affiliated with KPMG International Cooperative (“KPMG International”), a Swiss entity. All rights reserved. The KPMG name and logo are registered trademarks or trademarks of KPMG International. Liability limited by a scheme approved under Professional Standards Legislation.
Document Classification: KPMG Confidential
14
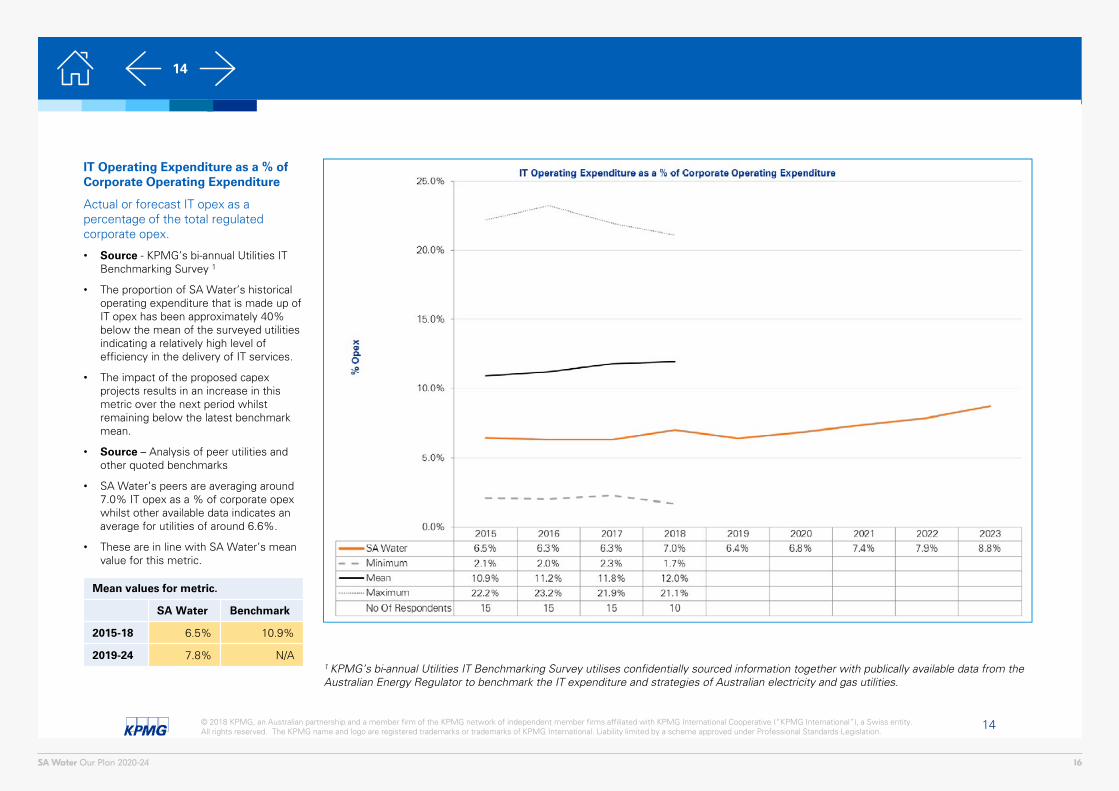
IT Operating Expenditure as a % of Corporate Operating Expenditure
Actual or forecast IT opex as a percentage of the total regulated corporate opex.
• Source - KPMG’s bi-annual Utilities IT Benchmarking Survey 1
• The proportion of SA Water’s historical operating expenditure that is made up of IT opex has been approximately 40% below the mean of the surveyed utilities indicating a relatively high level of efficiency in the delivery of IT services.
• The impact of the proposed capex projects results in an increase in this metric over the next period whilst remaining below the latest benchmark mean.
• Source – Analysis of peer utilities and other quoted benchmarks
• SA Water’s peers are averaging around 7.0% IT opex as a % of corporate opex whilst other available data indicates an average for utilities of around 6.6%.
• These are in line with SA Water’s mean value for this metric.
1 KPMG’s bi-annual Utilities IT Benchmarking Survey utilises confidentially sourced information together with publically available data from the Australian Energy Regulator to benchmark the IT expenditure and strategies of Australian electricity and gas utilities.
Mean values for metric.
SA Water Benchmark
2015-18 6.5% 10.9%
2019-24 7.8% N/A
16SA Water Our Plan 2020-24
15© 2018 KPMG, an Australian partnership and a member firm of the KPMG network of independent member firms affiliated with KPMG International Cooperative (“KPMG International”), a Swiss entity. All rights reserved. The KPMG name and logo are registered trademarks or trademarks of KPMG International. Liability limited by a scheme approved under Professional Standards Legislation.
Document Classification: KPMG Confidential
15
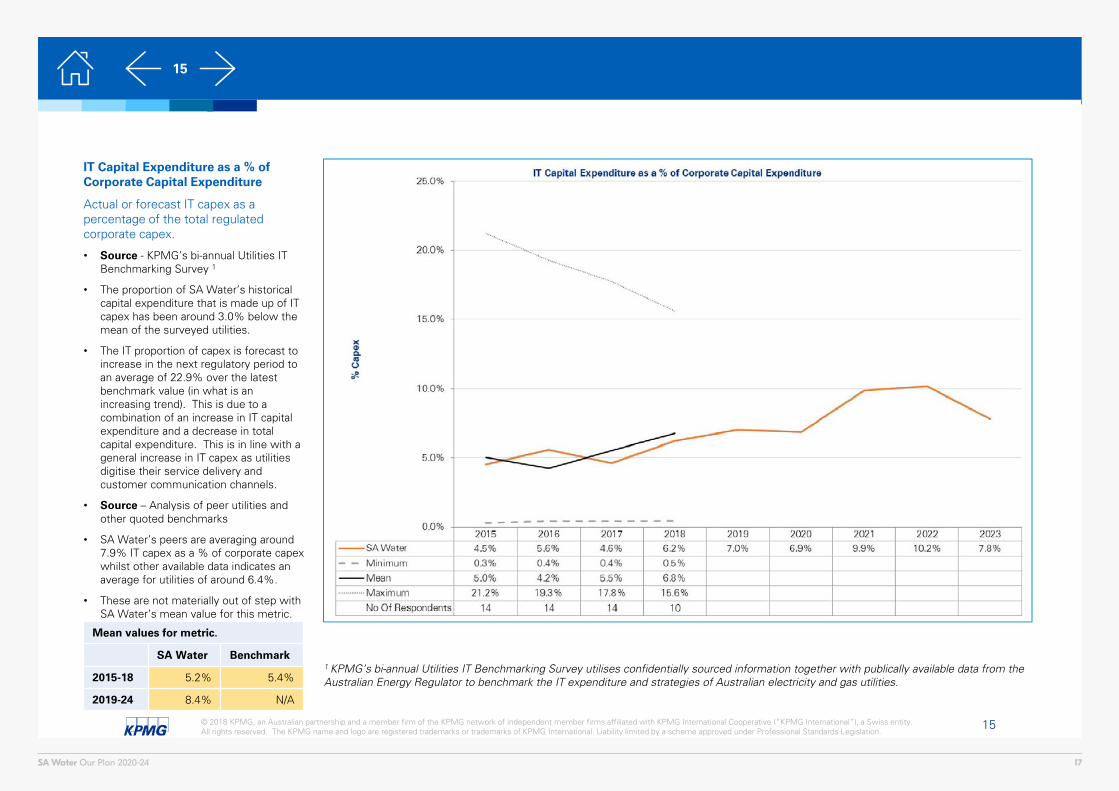
IT Capital Expenditure as a % of Corporate Capital Expenditure
Actual or forecast IT capex as a percentage of the total regulated corporate capex.
• Source - KPMG’s bi-annual Utilities IT Benchmarking Survey 1
• The proportion of SA Water’s historical capital expenditure that is made up of IT capex has been around 3.0% below the mean of the surveyed utilities.
• The IT proportion of capex is forecast to increase in the next regulatory period to an average of 22.9% over the latest benchmark value (in what is an increasing trend). This is due to a combination of an increase in IT capital expenditure and a decrease in total capital expenditure. This is in line with a general increase in IT capex as utilities digitise their service delivery and customer communication channels.
• Source – Analysis of peer utilities and other quoted benchmarks
• SA Water’s peers are averaging around 7.9% IT capex as a % of corporate capex whilst other available data indicates an average for utilities of around 6.4%.
• These are not materially out of step with SA Water’s mean value for this metric.
1 KPMG’s bi-annual Utilities IT Benchmarking Survey utilises confidentially sourced information together with publically available data from the Australian Energy Regulator to benchmark the IT expenditure and strategies of Australian electricity and gas utilities.
Mean values for metric.
SA Water Benchmark
2015-18 5.2% 5.4%
2019-24 8.4% N/A
17SA Water Our Plan 2020-24
16© 2018 KPMG, an Australian partnership and a member firm of the KPMG network of independent member firms affiliated with KPMG International Cooperative (“KPMG International”), a Swiss entity. All rights reserved. The KPMG name and logo are registered trademarks or trademarks of KPMG International. Liability limited by a scheme approved under Professional Standards Legislation.
Document Classification: KPMG Confidential
16
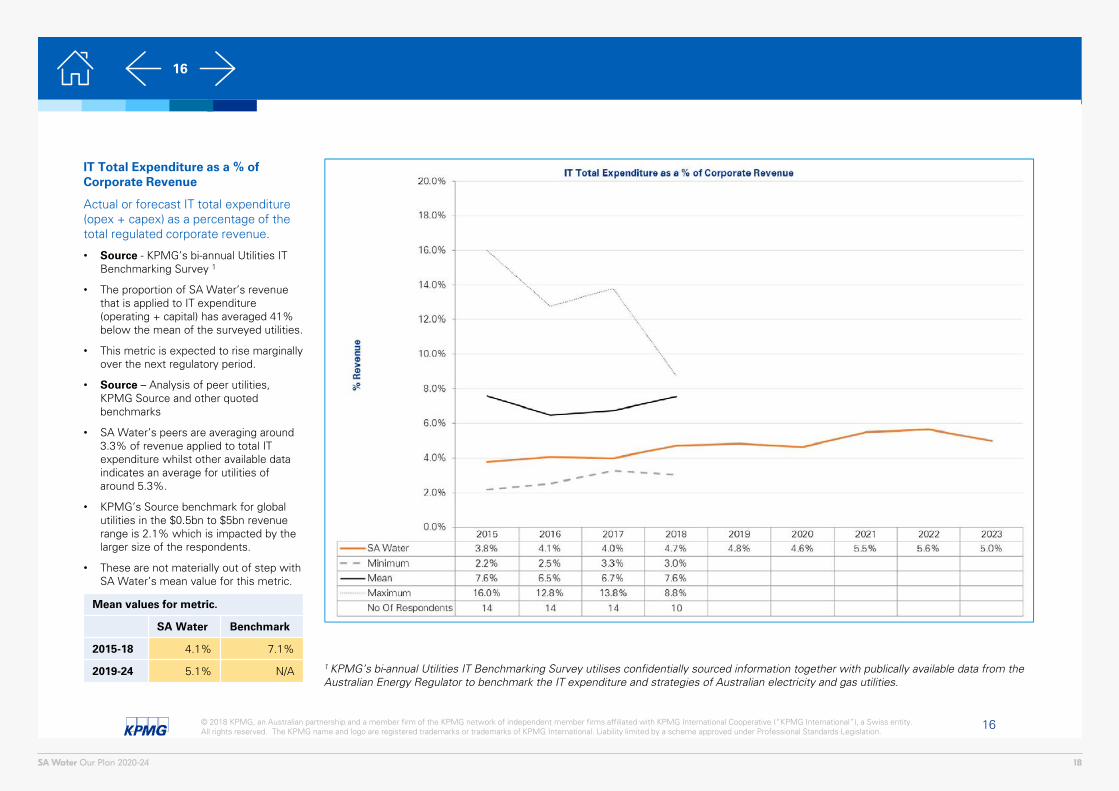
IT Total Expenditure as a % of Corporate Revenue
Actual or forecast IT total expenditure (opex + capex) as a percentage of the total regulated corporate revenue.
• Source - KPMG’s bi-annual Utilities IT Benchmarking Survey 1
• The proportion of SA Water’s revenue that is applied to IT expenditure (operating + capital) has averaged 41% below the mean of the surveyed utilities.
• This metric is expected to rise marginally over the next regulatory period.
• Source – Analysis of peer utilities, KPMG Source and other quoted benchmarks
• SA Water’s peers are averaging around 3.3% of revenue applied to total IT expenditure whilst other available data indicates an average for utilities of around 5.3%.
• KPMG’s Source benchmark for global utilities in the $0.5bn to $5bn revenue range is 2.1% which is impacted by the larger size of the respondents.
• These are not materially out of step with SA Water’s mean value for this metric.
1 KPMG’s bi-annual Utilities IT Benchmarking Survey utilises confidentially sourced information together with publically available data from the Australian Energy Regulator to benchmark the IT expenditure and strategies of Australian electricity and gas utilities.
Mean values for metric.
SA Water Benchmark
2015-18 4.1% 7.1%
2019-24 5.1% N/A
18SA Water Our Plan 2020-24
17© 2018 KPMG, an Australian partnership and a member firm of the KPMG network of independent member firms affiliated with KPMG International Cooperative (“KPMG International”), a Swiss entity. All rights reserved. The KPMG name and logo are registered trademarks or trademarks of KPMG International. Liability limited by a scheme approved under Professional Standards Legislation.
Document Classification: KPMG Confidential
17
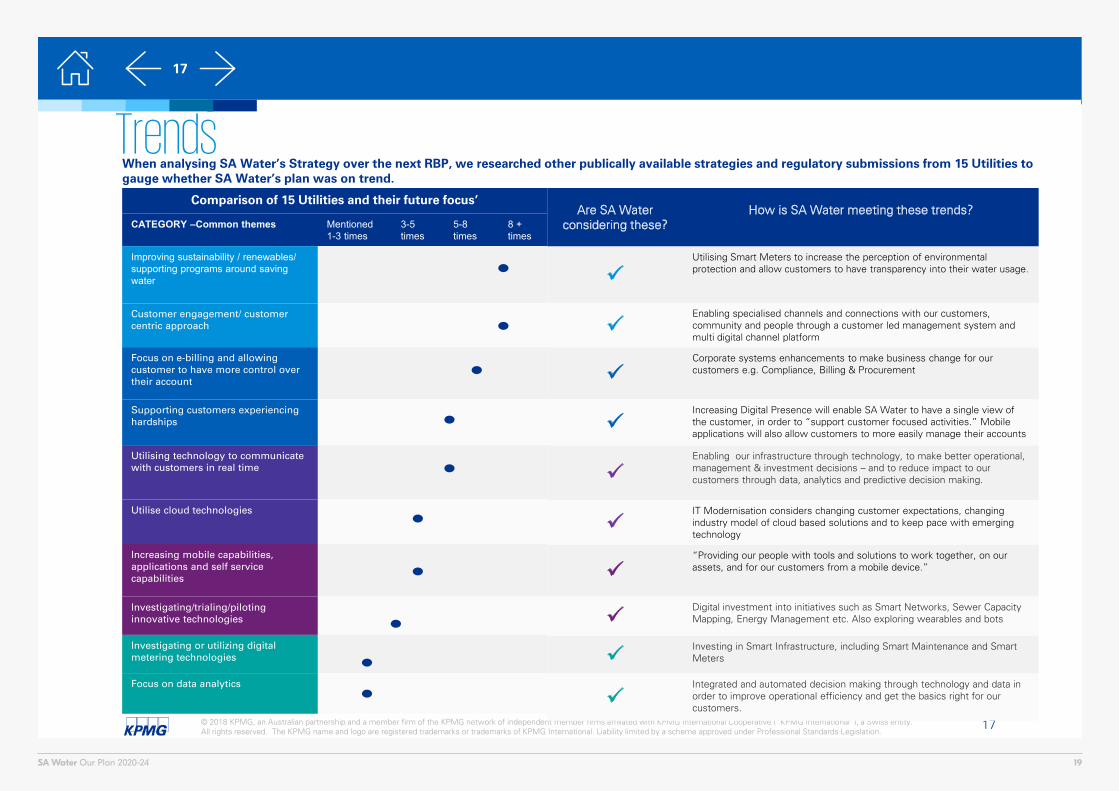
TrendsWhen analysing SA Water’s Strategy over the next RBP, we researched other publically available strategies and regulatory submissions from 15 Utilities to gauge whether SA Water’s plan was on trend.
Are SA Water considering these?
How is SA Water meeting these trends?
Utilising Smart Meters to increase the perception of environmental protection and allow customers to have transparency into their water usage.
Enabling specialised channels and connections with our customers, community and people through a customer led management system and multi digital channel platform
Corporate systems enhancements to make business change for our customers e.g. Compliance, Billing & Procurement
Increasing Digital Presence will enable SA Water to have a single view of the customer, in order to “support customer focused activities.” Mobile applications will also allow customers to more easily manage their accounts
Enabling our infrastructure through technology, to make better operational, management & investment decisions – and to reduce impact to our customers through data, analytics and predictive decision making.
IT Modernisation considers changing customer expectations, changing industry model of cloud based solutions and to keep pace with emerging technology
“Providing our people with tools and solutions to work together, on our assets, and for our customers from a mobile device.”
Digital investment into initiatives such as Smart Networks, Sewer Capacity Mapping, Energy Management etc. Also exploring wearables and bots
Investing in Smart Infrastructure, including Smart Maintenance and Smart Meters
Integrated and automated decision making through technology and data in order to improve operational efficiency and get the basics right for our customers.
Comparison of 15 Utilities and their future focus’
CATEGORY –Common themes Mentioned 1-3 times
3-5times
5-8 times
8 + times
Improving sustainability / renewables/ supporting programs around saving water
Customer engagement/ customer centric approach
Focus on e-billing and allowing customer to have more control over their account
Supporting customers experiencinghardships
Utilising technology to communicate with customers in real time
Utilise cloud technologies
Increasing mobile capabilities, applications and self service capabilities
Investigating/trialing/piloting innovative technologies
Investigating or utilizing digital metering technologies
Focus on data analytics
19SA Water Our Plan 2020-24
Appendix – Digital Capability Maturity
20SA Water Our Plan 2020-24
19© 2018 KPMG, an Australian partnership and a member firm of the KPMG network of independent member firms affiliated with KPMG International Cooperative (“KPMG International”), a Swiss entity. All rights reserved. The KPMG name and logo are registered trademarks or trademarks of KPMG International. Liability limited by a scheme approved under Professional Standards Legislation.
Document Classification: KPMG Confidential
19
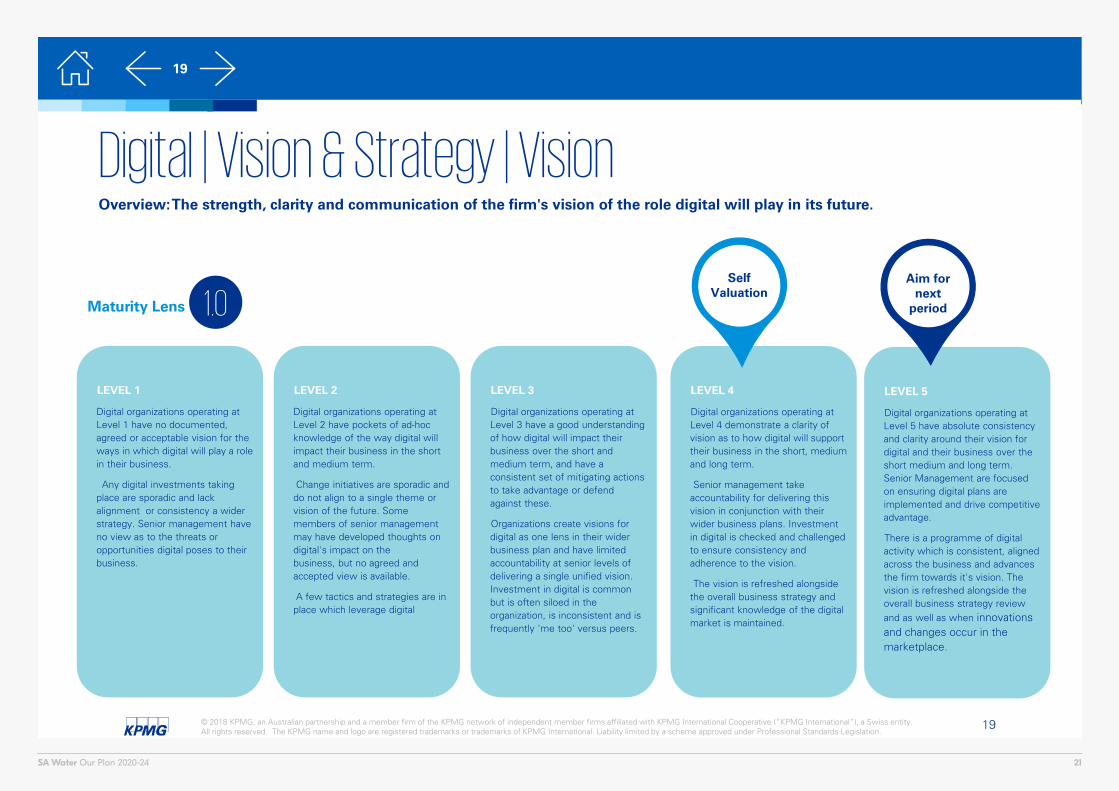
Maturity Lens
Digital | Vision & Strategy | VisionOverview: The strength, clarity and communication of the firm's vision of the role digital will play in its future.
LEVEL 1
Digital organizations operating at Level 1 have no documented, agreed or acceptable vision for the ways in which digital will play a role in their business.
Any digital investments taking place are sporadic and lack alignment or consistency a wider strategy. Senior management have no view as to the threats or opportunities digital poses to their business.
LEVEL 2
Digital organizations operating at Level 2 have pockets of ad-hoc knowledge of the way digital will impact their business in the short and medium term.
Change initiatives are sporadic and do not align to a single theme or vision of the future. Some members of senior management may have developed thoughts on digital's impact on the business, but no agreed and accepted view is available.
A few tactics and strategies are in place which leverage digital
LEVEL 3
Digital organizations operating at Level 3 have a good understanding of how digital will impact their business over the short and medium term, and have a consistent set of mitigating actions to take advantage or defend against these.
Organizations create visions for digital as one lens in their wider business plan and have limited accountability at senior levels of delivering a single unified vision. Investment in digital is common but is often siloed in the organization, is inconsistent and is frequently 'me too' versus peers.
LEVEL 4
Digital organizations operating at Level 4 demonstrate a clarity of vision as to how digital will support their business in the short, medium and long term.
Senior management take accountability for delivering this vision in conjunction with their wider business plans. Investment in digital is checked and challenged to ensure consistency and adherence to the vision.
The vision is refreshed alongside the overall business strategy and significant knowledge of the digital market is maintained.
LEVEL 5
Digital organizations operating at Level 5 have absolute consistency and clarity around their vision for digital and their business over the short medium and long term. Senior Management are focused on ensuring digital plans are implemented and drive competitive advantage.
There is a programme of digital activity which is consistent, aligned across the business and advances the firm towards it's vision. The vision is refreshed alongside the overall business strategy review and as well as when innovations and changes occur in the marketplace.
Self Valuation
Aim for next
period1.0
21SA Water Our Plan 2020-24
20© 2018 KPMG, an Australian partnership and a member firm of the KPMG network of independent member firms affiliated with KPMG International Cooperative (“KPMG International”), a Swiss entity. All rights reserved. The KPMG name and logo are registered trademarks or trademarks of KPMG International. Liability limited by a scheme approved under Professional Standards Legislation.
Document Classification: KPMG Confidential
20
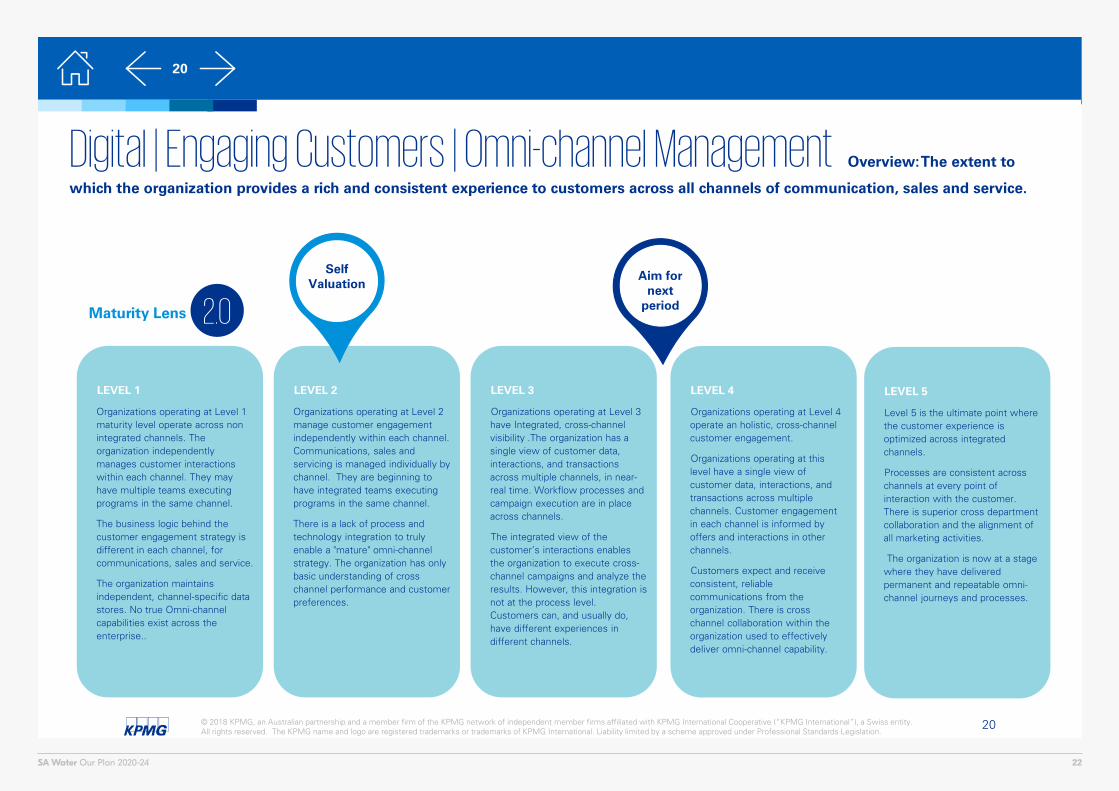
Maturity Lens
Digital | Engaging Customers | Omni-channel Management Overview: The extent to
which the organization provides a rich and consistent experience to customers across all channels of communication, sales and service.
LEVEL 1
Organizations operating at Level 1 maturity level operate across non integrated channels. The organization independently manages customer interactions within each channel. They may have multiple teams executing programs in the same channel.
The business logic behind the customer engagement strategy is different in each channel, for communications, sales and service.
The organization maintains independent, channel-specific data stores. No true Omni-channel capabilities exist across the enterprise..
LEVEL 2
Organizations operating at Level 2 manage customer engagement independently within each channel. Communications, sales and servicing is managed individually by channel. They are beginning to have integrated teams executing programs in the same channel.
There is a lack of process and technology integration to truly enable a "mature" omni-channel strategy. The organization has only basic understanding of cross channel performance and customer preferences.
LEVEL 3
Organizations operating at Level 3 have Integrated, cross-channel visibility .The organization has a single view of customer data, interactions, and transactions across multiple channels, in near-real time. Workflow processes and campaign execution are in place across channels.
The integrated view of the customer’s interactions enables the organization to execute cross-channel campaigns and analyze the results. However, this integration is not at the process level. Customers can, and usually do, have different experiences in different channels.
LEVEL 4
Organizations operating at Level 4 operate an holistic, cross-channel customer engagement.
Organizations operating at this level have a single view of customer data, interactions, and transactions across multiple channels. Customer engagement in each channel is informed by offers and interactions in other channels.
Customers expect and receive consistent, reliable communications from the organization. There is cross channel collaboration within the organization used to effectively deliver omni-channel capability.
LEVEL 5
Level 5 is the ultimate point where the customer experience is optimized across integrated channels.
Processes are consistent across channels at every point of interaction with the customer. There is superior cross department collaboration and the alignment of all marketing activities.
The organization is now at a stage where they have delivered permanent and repeatable omni-channel journeys and processes.
2.0
Self Valuation
Aim for next
period
22SA Water Our Plan 2020-24
21© 2018 KPMG, an Australian partnership and a member firm of the KPMG network of independent member firms affiliated with KPMG International Cooperative (“KPMG International”), a Swiss entity. All rights reserved. The KPMG name and logo are registered trademarks or trademarks of KPMG International. Liability limited by a scheme approved under Professional Standards Legislation.
Document Classification: KPMG Confidential
21
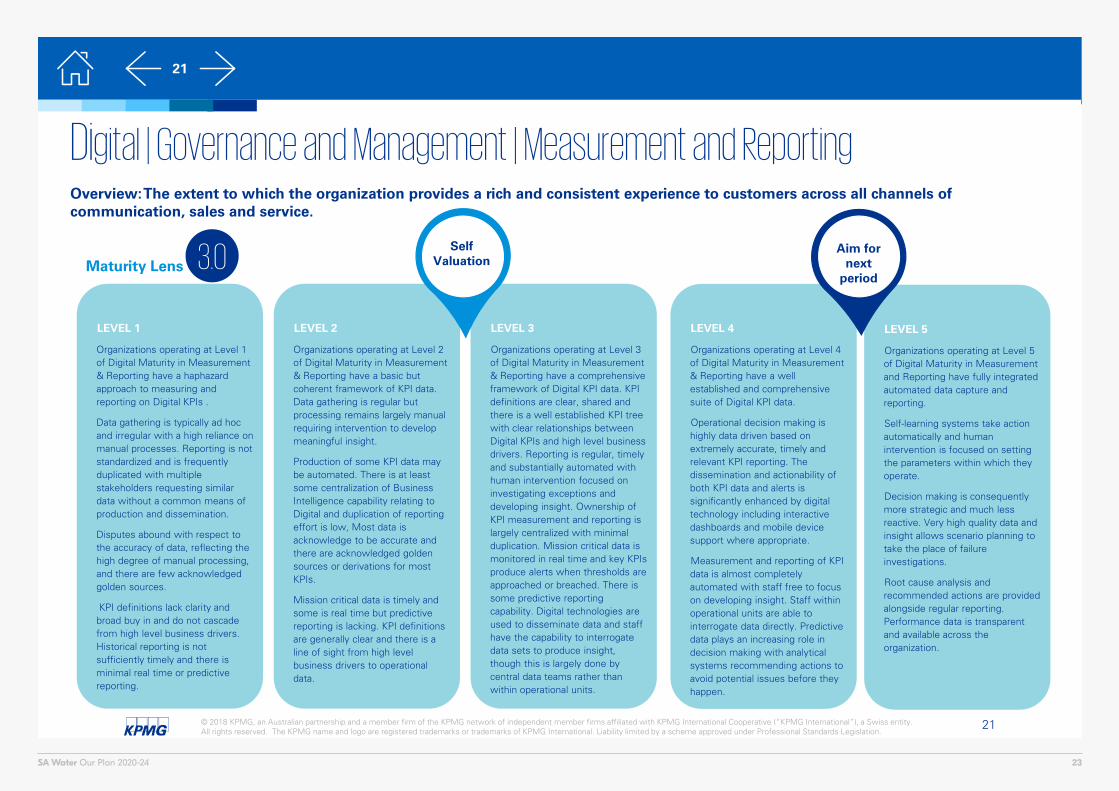
Maturity Lens
Digital | Governance and Management | Measurement and ReportingOverview: The extent to which the organization provides a rich and consistent experience to customers across all channels of communication, sales and service.
LEVEL 1
Organizations operating at Level 1 of Digital Maturity in Measurement & Reporting have a haphazard approach to measuring and reporting on Digital KPIs .
Data gathering is typically ad hoc and irregular with a high reliance on manual processes. Reporting is not standardized and is frequently duplicated with multiple stakeholders requesting similar data without a common means of production and dissemination.
Disputes abound with respect to the accuracy of data, reflecting the high degree of manual processing, and there are few acknowledged golden sources.
KPI definitions lack clarity and broad buy in and do not cascade from high level business drivers. Historical reporting is not sufficiently timely and there is minimal real time or predictive reporting.
LEVEL 2
Organizations operating at Level 2 of Digital Maturity in Measurement & Reporting have a basic but coherent framework of KPI data. Data gathering is regular but processing remains largely manual requiring intervention to develop meaningful insight.
Production of some KPI data may be automated. There is at least some centralization of Business Intelligence capability relating to Digital and duplication of reporting effort is low, Most data is acknowledge to be accurate and there are acknowledged golden sources or derivations for most KPIs.
Mission critical data is timely and some is real time but predictive reporting is lacking. KPI definitions are generally clear and there is a line of sight from high level business drivers to operational data.
LEVEL 3
Organizations operating at Level 3 of Digital Maturity in Measurement & Reporting have a comprehensive framework of Digital KPI data. KPI definitions are clear, shared and there is a well established KPI tree with clear relationships between Digital KPIs and high level business drivers. Reporting is regular, timely and substantially automated with human intervention focused on investigating exceptions and developing insight. Ownership of KPI measurement and reporting is largely centralized with minimal duplication. Mission critical data is monitored in real time and key KPIs produce alerts when thresholds are approached or breached. There is some predictive reporting capability. Digital technologies are used to disseminate data and staff have the capability to interrogate data sets to produce insight, though this is largely done by central data teams rather than within operational units.
LEVEL 4
Organizations operating at Level 4 of Digital Maturity in Measurement & Reporting have a well established and comprehensive suite of Digital KPI data.
Operational decision making is highly data driven based on extremely accurate, timely and relevant KPI reporting. The dissemination and actionability of both KPI data and alerts is significantly enhanced by digital technology including interactive dashboards and mobile device support where appropriate.
Measurement and reporting of KPI data is almost completely automated with staff free to focus on developing insight. Staff within operational units are able to interrogate data directly. Predictive data plays an increasing role in decision making with analytical systems recommending actions to avoid potential issues before they happen.
LEVEL 5
Organizations operating at Level 5 of Digital Maturity in Measurement and Reporting have fully integrated automated data capture and reporting.
Self-learning systems take action automatically and human intervention is focused on setting the parameters within which they operate.
Decision making is consequently more strategic and much less reactive. Very high quality data and insight allows scenario planning to take the place of failure investigations.
Root cause analysis and recommended actions are provided alongside regular reporting. Performance data is transparent and available across the organization.
3.0 Aim for next
period
Self Valuation
23SA Water Our Plan 2020-24
22© 2018 KPMG, an Australian partnership and a member firm of the KPMG network of independent member firms affiliated with KPMG International Cooperative (“KPMG International”), a Swiss entity. All rights reserved. The KPMG name and logo are registered trademarks or trademarks of KPMG International. Liability limited by a scheme approved under Professional Standards Legislation.
Document Classification: KPMG Confidential
22
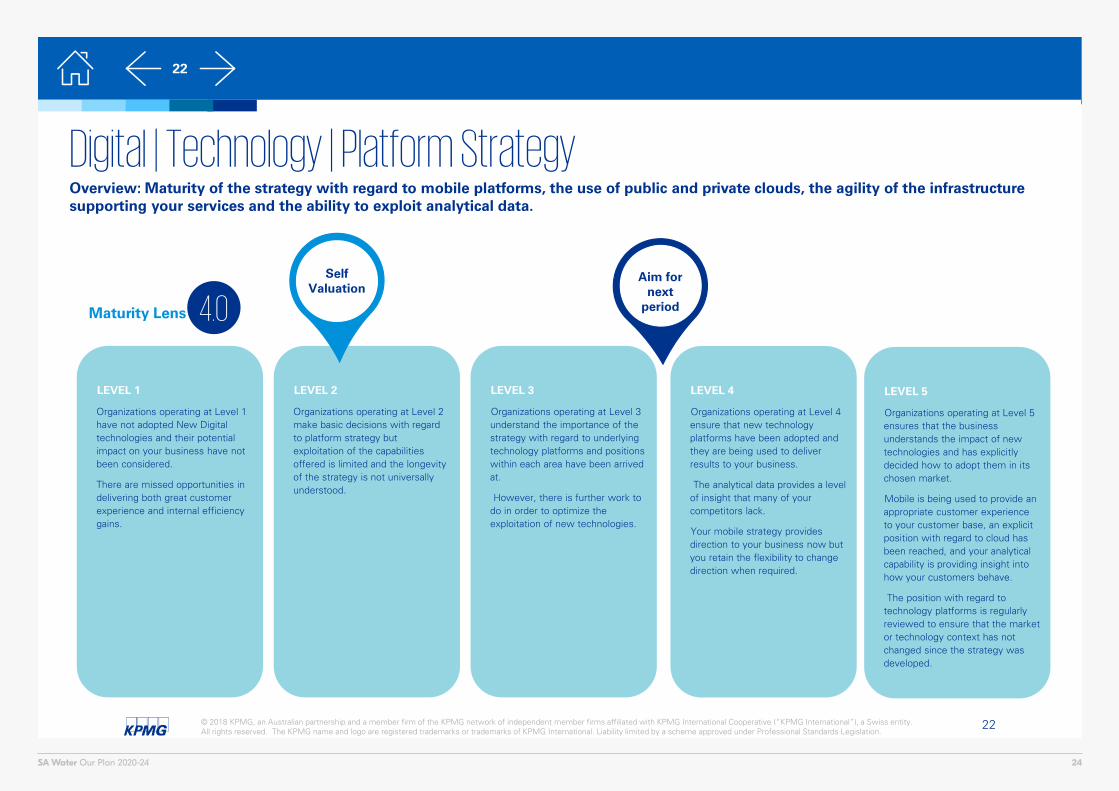
Maturity Lens
Digital | Technology | Platform StrategyOverview: Maturity of the strategy with regard to mobile platforms, the use of public and private clouds, the agility of the infrastructure supporting your services and the ability to exploit analytical data.
LEVEL 1
Organizations operating at Level 1 have not adopted New Digital technologies and their potential impact on your business have not been considered.
There are missed opportunities in delivering both great customer experience and internal efficiency gains.
LEVEL 2
Organizations operating at Level 2 make basic decisions with regard to platform strategy but exploitation of the capabilities offered is limited and the longevity of the strategy is not universally understood.
LEVEL 3
Organizations operating at Level 3 understand the importance of the strategy with regard to underlying technology platforms and positions within each area have been arrived at.
However, there is further work to do in order to optimize the exploitation of new technologies.
LEVEL 4
Organizations operating at Level 4 ensure that new technology platforms have been adopted and they are being used to deliver results to your business.
The analytical data provides a level of insight that many of your competitors lack.
Your mobile strategy provides direction to your business now but you retain the flexibility to change direction when required.
LEVEL 5
Organizations operating at Level 5 ensures that the business understands the impact of new technologies and has explicitly decided how to adopt them in its chosen market.
Mobile is being used to provide an appropriate customer experience to your customer base, an explicit position with regard to cloud has been reached, and your analytical capability is providing insight into how your customers behave.
The position with regard to technology platforms is regularly reviewed to ensure that the market or technology context has not changed since the strategy was developed.
4.0Aim for
next period
Self Valuation
24SA Water Our Plan 2020-24
23© 2018 KPMG, an Australian partnership and a member firm of the KPMG network of independent member firms affiliated with KPMG International Cooperative (“KPMG International”), a Swiss entity. All rights reserved. The KPMG name and logo are registered trademarks or trademarks of KPMG International. Liability limited by a scheme approved under Professional Standards Legislation.
Document Classification: KPMG Confidential
23
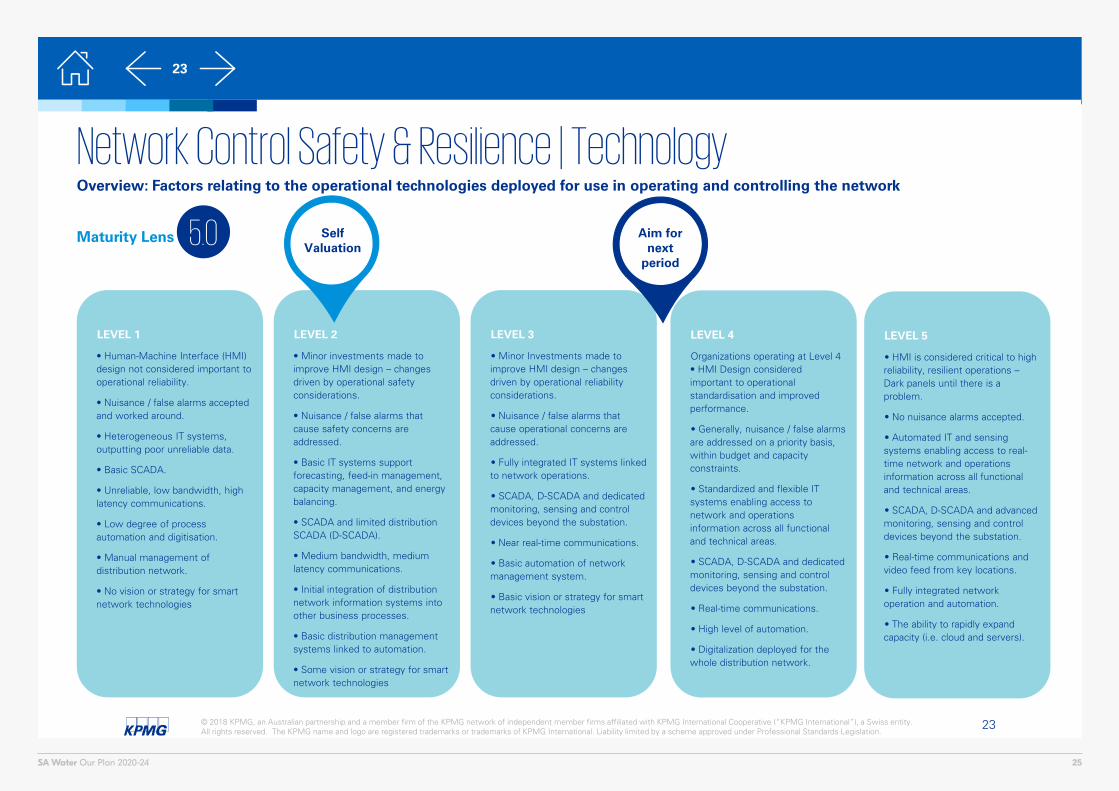
Maturity Lens
Network Control Safety & Resilience | Technology Overview: Factors relating to the operational technologies deployed for use in operating and controlling the network
LEVEL 1
• Human-Machine Interface (HMI) design not considered important to operational reliability.
• Nuisance / false alarms accepted and worked around.
• Heterogeneous IT systems, outputting poor unreliable data.
• Basic SCADA.
• Unreliable, low bandwidth, high latency communications.
• Low degree of process automation and digitisation.
• Manual management of distribution network.
• No vision or strategy for smart network technologies
LEVEL 2
• Minor investments made to improve HMI design – changes driven by operational safety considerations.
• Nuisance / false alarms that cause safety concerns are addressed.
• Basic IT systems support forecasting, feed-in management, capacity management, and energy balancing.
• SCADA and limited distribution SCADA (D-SCADA).
• Medium bandwidth, medium latency communications.
• Initial integration of distribution network information systems into other business processes.
• Basic distribution management systems linked to automation.
• Some vision or strategy for smart network technologies
LEVEL 3
• Minor Investments made to improve HMI design – changes driven by operational reliability considerations.
• Nuisance / false alarms that cause operational concerns are addressed.
• Fully integrated IT systems linked to network operations.
• SCADA, D-SCADA and dedicated monitoring, sensing and control devices beyond the substation.
• Near real-time communications.
• Basic automation of network management system.
• Basic vision or strategy for smart network technologies
LEVEL 4
Organizations operating at Level 4 • HMI Design considered important to operational standardisation and improved performance.
• Generally, nuisance / false alarms are addressed on a priority basis, within budget and capacity constraints.
• Standardized and flexible IT systems enabling access to network and operations information across all functional and technical areas.
• SCADA, D-SCADA and dedicated monitoring, sensing and control devices beyond the substation.
• Real-time communications.
• High level of automation.
• Digitalization deployed for the whole distribution network.
LEVEL 5
• HMI is considered critical to high reliability, resilient operations –Dark panels until there is a problem.
• No nuisance alarms accepted.
• Automated IT and sensing systems enabling access to real-time network and operations information across all functional and technical areas.
• SCADA, D-SCADA and advanced monitoring, sensing and control devices beyond the substation.
• Real-time communications and video feed from key locations.
• Fully integrated network operation and automation.
• The ability to rapidly expand capacity (i.e. cloud and servers).
5.0 Aim for next
period
Self Valuation
25SA Water Our Plan 2020-24
Document Classification: KPMG Confidential
kpmg.com.au
© 2019 KPMG, an Australian partnership and a member firm of the KPMG network of independent member firms affiliated with KPMG International Cooperative (“KPMG International”), a Swiss entity. All rights reserved.
The KPMG name and logo are registered trademarks or trademarks of KPMG International.
Liability limited by a scheme approved under Professional Standards Legislation.
The information contained in this document is of a general nature and is not intended to address the objectives, financial situation or needs of any particular individual or entity. It is provided for information purposes only and does not constitute, nor should it be regarded in any manner whatsoever, as advice and is not intended to influence a person in making a decision, including, if applicable, in relation to any financial product or an interest in a financial product. Although we endeavour to provide accurate and timely information, there can be no guarantee that such information is accurate as of the date it is received or that it will continue to be accurate in the future. No one should act on such information without appropriate professional advice after a thorough examination of the particular situation.
To the extent permissible by law, KPMG and its associated entities shall not be liable for any errors, omissions, defects or misrepresentations in the information or for any loss or damage suffered by persons who use or rely on such information (including for reasons of negligence, negligent misstatement or otherwise).
Contact us
Tim WhiteDirector, Utilities Policy & Regulation+61 408 066 [email protected]
Eamonn CorriganHead, Utilities Policy & Regulation+61 428 231 [email protected]
Malcolm HewsonAssociate Director+61 405 191 [email protected]
26SA Water Our Plan 2020-24