Embed Size (px)
Citation preview
Singleton Council
Financial Assessment and Benchmarking Report
3 October 2012
Prepared by NSW Treasury Corporation as part of the Local Infrastructure Renewal Scheme
Singleton Council Page 2
Disclaimer
This report has been prepared by New South Wales Treasury Corporation (TCorp) in accordance with
the appointment of TCorp by the Division of Local Government (DLG) as detailed in TCorp’s letters of
22 December 2011 and 28 May 2012. The report has been prepared as part of the Local Infrastructure
Renewal Scheme (LIRS) announced by the NSW Government.
The report has been prepared based on information provided to TCorp as set out in Section 2.2 of this
report. TCorp has relied on this information and has not verified or audited the accuracy, reliability or
currency of the information provided to it for the purpose of preparation of the report. TCorp and its
directors, officers and employees make no representation as to the accuracy, reliability or
completeness of the information contained in the report.
In addition, TCorp does not warrant or guarantee the outcomes or projections contained in this report.
The projections and outcomes contained in the report do not necessarily take into consideration the
commercial risks, various external factors or the possibility of poor performance by the Council all of
which may negatively impact the financial capability and sustainability of the Council. The TCorp report
focuses on whether the Council has reasonable capacity, based on the information provided to TCorp,
to take on additional borrowings within prudent risk parameters and the limits of its financial projections.
The report has been prepared for Singleton Council, the LIRS Assessment Panel and the DLG. TCorp
shall not be liable to Singleton Council or have any liability to any third party under the law of contract,
tort and the principles of restitution or unjust enrichment or otherwise for any loss, expense or damage
which may arise from or be incurred or suffered as a result of reliance on anything contained in this
report.
Singleton Council Page 3
Index
Section 1 Executive Summary .......................................................................................................... 4
Section 2 Introduction ....................................................................................................................... 6
2.1: Purpose of Report ................................................................................................................. 6
2.2: Scope and Methodology ........................................................................................................ 6
2.3: Overview of the Local Government Area ............................................................................... 8
2.4: LIRS Application .................................................................................................................... 8
Section 3 Review of Financial Performance and Position ................................................................. 9
3.1: Revenue ................................................................................................................................ 9
3.2: Expenses ............................................................................................................................. 10
3.3: Operating Results ................................................................................................................ 11
3.4: Financial Management Indicators ........................................................................................ 12
3.5: Statement of Cashflows....................................................................................................... 13
3.6: Capital Expenditure ............................................................................................................. 13
3.7: Specific Risks to Council ..................................................................................................... 16
Section 4 Review of Financial Forecasts ........................................................................................ 17
4.1: Operating Results ................................................................................................................ 17
4.2: Financial Management Indicators ........................................................................................ 18
4.3: Capital Expenditure ............................................................................................................. 21
4.4: Financial Model Assumption Review ................................................................................... 22
4.5: Borrowing Capacity ............................................................................................................. 23
Section 5 Benchmarking ................................................................................................................. 24
Section 6 Conclusion and Recommendations ................................................................................ 30
Appendix A Historical Financial Information Tables ....................................................................... 31
Appendix B Glossary ..................................................................................................................... 34
Singleton Council Page 4
Section 1 Executive Summary
This report provides an independent assessment of Singleton Council’s (the Council) financial capacity
and its ability to undertake additional borrowings. The analysis is based on a review of the historical
performance, current financial position, and long term financial forecasts. It also benchmarks the
Council against its peers using key ratios.
The report is primarily focused on the financial capacity of the Council to undertake additional
borrowings as part of the Local Infrastructure Renewal Scheme (LIRS).
Council has made one application for the timber bridge replacement program at Bourke’s Crossing for
$2.2m.
TCorp’s approach has been to:
Review the most recent three years of Council’s consolidated financial results
Conduct a detailed review of the Council’s 10 year financial forecasts. The review of the
financial forecasts focused on the particular Council fund that was undertaking the proposed
debt commitment. For the Council, the project is being funded from the General Fund so we
focused our review on the General Fund
The Council has been well managed over the review period based on the following observations:
Council has improved its operating results over the last three years with an operating surplus
(excluding capital grants and contributions) in 2011
Approximately 64% of the Council’s revenue base is derived from own sourced revenue
(annual charges, and user charges and fees). They can rely upon these revenue streams on
an ongoing basis for financial flexibility
Operating expenses appear to be generally well managed
Council’s performance indicators are all strong and improving over the period
The Council reported $12.1m of infrastructure backlog in 2011 with an infrastructure asset value of
$319.6m. This is a relatively small level of backlog compared to other NSW councils although it is
increasing and needs to be addressed. Other observations include:
The infrastructure backlog has almost doubled since 2009
Council has spent less than required on maintenance in two of the last three years
Council is forecasting to spend more than required in the first two years of its financial
forecast and then substantially less than required over the remaining years of the forecast
The key observations from our review of Council’s 10 year forecasts for its General Fund are:
The General Fund shows operating deficit positions are expected in six of the 10 years when
capital grants and contributions are excluded
The 10 year financial forecasts include a capital expenditure program that reduces over time
and appears to be lower than what may be required to maintain a sound asset base. The
impact of this lower level of capital investment is that other ratios such as cash reserves and
Singleton Council Page 5
liquidity continue to improve over time as investments are not made into new or renewal
assets and cash is held
Overall it appears that the Council will have ample liquidity throughout the next 10 year period
to service all short term liabilities and currently scheduled capital expenditure and related long
term liabilities
Council’s level of fiscal flexibility is sound as within the General Fund, own source revenue is
trending higher and reaches a level above 70% during the forecast period
With the exception of our comments regarding the future capital program, other key
assumptions within the financial forecasts are considered to be reasonable
In our view, the Council has the capacity to undertake the additional borrowings of $2.2m for the LIRS
project. This is based on the following analysis:
The DSCR remains well above a benchmark of 2.0x in the 10 year forecast
The Interest Cover Ratio is well above the benchmark of 4.0x in the 10 year forecast
Council’s liquidity is sound
In respect of the Benchmarking analysis TCorp has compared the Council’s key ratios, on a
consolidated basis, with other councils in DLG group 4. The key observations are:
Council’s financial flexibility, as indicated by the Operating Ratio and Own Source Operating
Revenue Ratio, is generally above the group’s average
Council was in a sufficiently liquid position which is forecast to be above the group’s average
liquidity level over the medium term
Council has a lower level of gearing to its peers and its DSCR and Interest Cover Ratio were
above benchmark and the group’s average over the review period
Council has a comparatively low level of Infrastructure Backlog and high level of asset
maintenance, however its Building and Infrastructure Asset Renewal and Capital Expenditure
Ratios have been at or below the group’s average in the past three years
Singleton Council Page 6
Section 2 Introduction
2.1: Purpose of Report
This report provides the Council with an independent assessment of their financial capacity and
performance measured against a peer group of councils which will complement their internal due
diligence, and the IP&R system of the Council and the DLG.
The report is to be provided to the LIRS Assessment Panel for its use in considering applications
received under the LIRS.
The key areas focused on are:
The financial capacity of the Council to undertake additional borrowings
The financial performance of the Council in comparison to a range of similar councils and
measured against prudent benchmarks
2.2: Scope and Methodology
TCorp’s approach was to:
Review the most recent three years of the Council’s consolidated audited accounts using
financial ratio analysis. In undertaking the ratio analysis TCorp has utilised ratio’s
substantially consistent with those used by Queensland Treasury Corporation (QTC) initially in
its review of Queensland Local Government (2008), and subsequently updated in 2011
Conduct a detailed review of the Council’s 10 year financial forecasts including a review of the
key assumptions that underpin the financial forecasts. The review of the financial forecasts
focused on the particular Council fund that was undertaking the proposed debt commitment.
For example where a project is being funded from the General fund we focussed our review
on the General fund
Identify significant changes to future financial forecasts from existing financial performance
and highlight risks associated with such forecasts
Conduct a benchmark review of a Council’s performance against its peer group
Prepare a report that provides an overview of the Council’s existing and forecast financial
position and its capacity to meet increased debt commitments
Conduct a high level review of the Council’s IP&R documents for factors which could impact
the Council’s financial capacity and performance
In undertaking its work, TCorp relied on:
Council’s audited financial statements (2008/09 to 2010/11)
Council’s financial forecast model
Council’s IP&R documents
Discussions with Council officers
Council’s submissions to the DLG as part of their LIRS application
Other publicly available information such as information published on the IPART website
Singleton Council Page 7
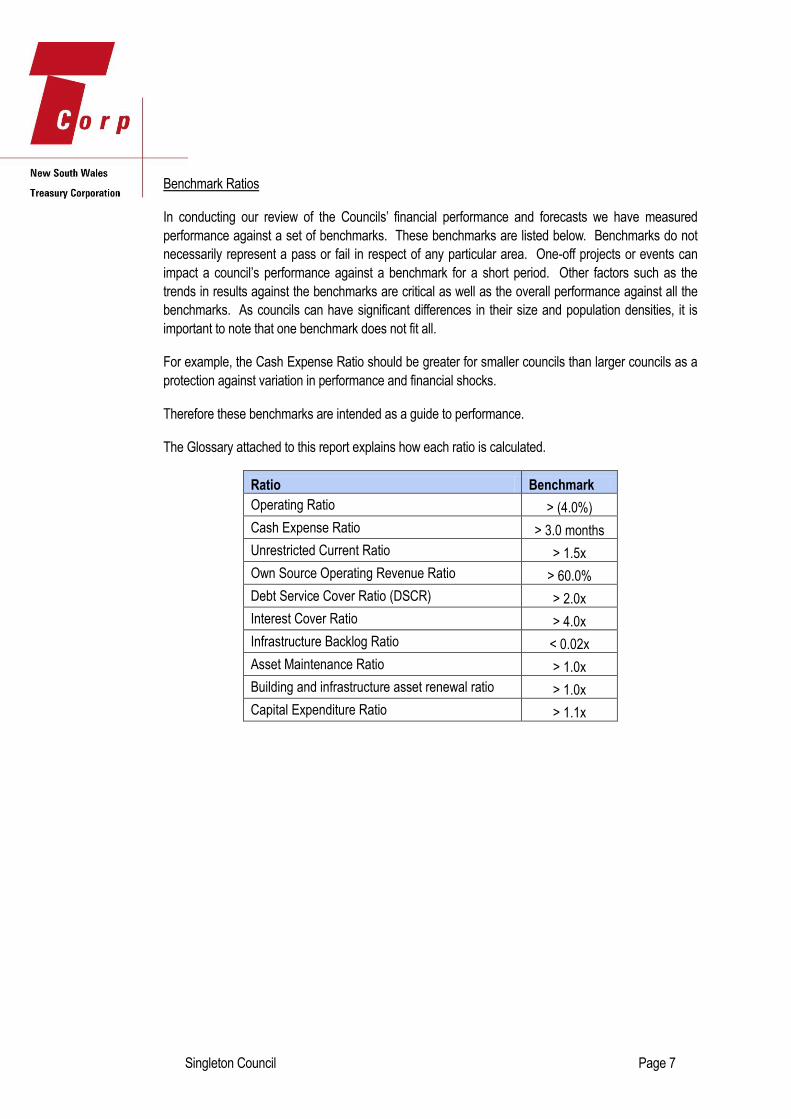
Benchmark Ratios
In conducting our review of the Councils’ financial performance and forecasts we have measured
performance against a set of benchmarks. These benchmarks are listed below. Benchmarks do not
necessarily represent a pass or fail in respect of any particular area. One-off projects or events can
impact a council’s performance against a benchmark for a short period. Other factors such as the
trends in results against the benchmarks are critical as well as the overall performance against all the
benchmarks. As councils can have significant differences in their size and population densities, it is
important to note that one benchmark does not fit all.
For example, the Cash Expense Ratio should be greater for smaller councils than larger councils as a
protection against variation in performance and financial shocks.
Therefore these benchmarks are intended as a guide to performance.
The Glossary attached to this report explains how each ratio is calculated.
Ratio Benchmark
Operating Ratio > (4.0%)
Cash Expense Ratio > 3.0 months
Unrestricted Current Ratio > 1.5x
Own Source Operating Revenue Ratio > 60.0%
Debt Service Cover Ratio (DSCR) > 2.0x
Interest Cover Ratio > 4.0x
Infrastructure Backlog Ratio < 0.02x
Asset Maintenance Ratio > 1.0x
Building and infrastructure asset renewal ratio > 1.0x
Capital Expenditure Ratio > 1.1x
Singleton Council Page 8
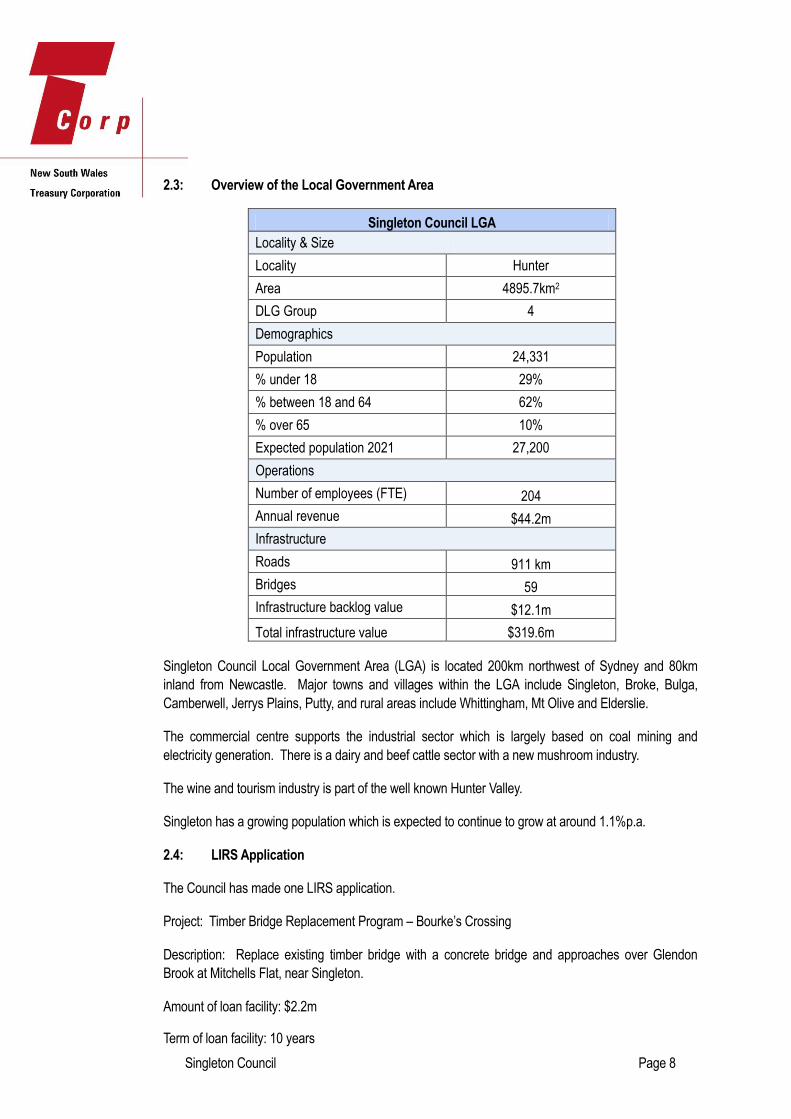
2.3: Overview of the Local Government Area
Singleton Council LGA
Locality & Size
Locality Hunter
Area 4895.7km2
DLG Group 4
Demographics
Population 24,331
% under 18 29%
% between 18 and 64 62%
% over 65 10%
Expected population 2021 27,200
Operations
Number of employees (FTE) 204
Annual revenue $44.2m
Infrastructure
Roads 911 km
Bridges 59
Infrastructure backlog value $12.1m
Total infrastructure value $319.6m
Singleton Council Local Government Area (LGA) is located 200km northwest of Sydney and 80km
inland from Newcastle. Major towns and villages within the LGA include Singleton, Broke, Bulga,
Camberwell, Jerrys Plains, Putty, and rural areas include Whittingham, Mt Olive and Elderslie.
The commercial centre supports the industrial sector which is largely based on coal mining and
electricity generation. There is a dairy and beef cattle sector with a new mushroom industry.
The wine and tourism industry is part of the well known Hunter Valley.
Singleton has a growing population which is expected to continue to grow at around 1.1%p.a.
2.4: LIRS Application
The Council has made one LIRS application.
Project: Timber Bridge Replacement Program – Bourke’s Crossing
Description: Replace existing timber bridge with a concrete bridge and approaches over Glendon
Brook at Mitchells Flat, near Singleton.
Amount of loan facility: $2.2m
Term of loan facility: 10 years
Singleton Council Page 9
Section 3 Review of Financial Performance and Position
In reviewing the financial performance of the Council, TCorp has based its review on the annual
audited accounts of the Council unless otherwise stated.
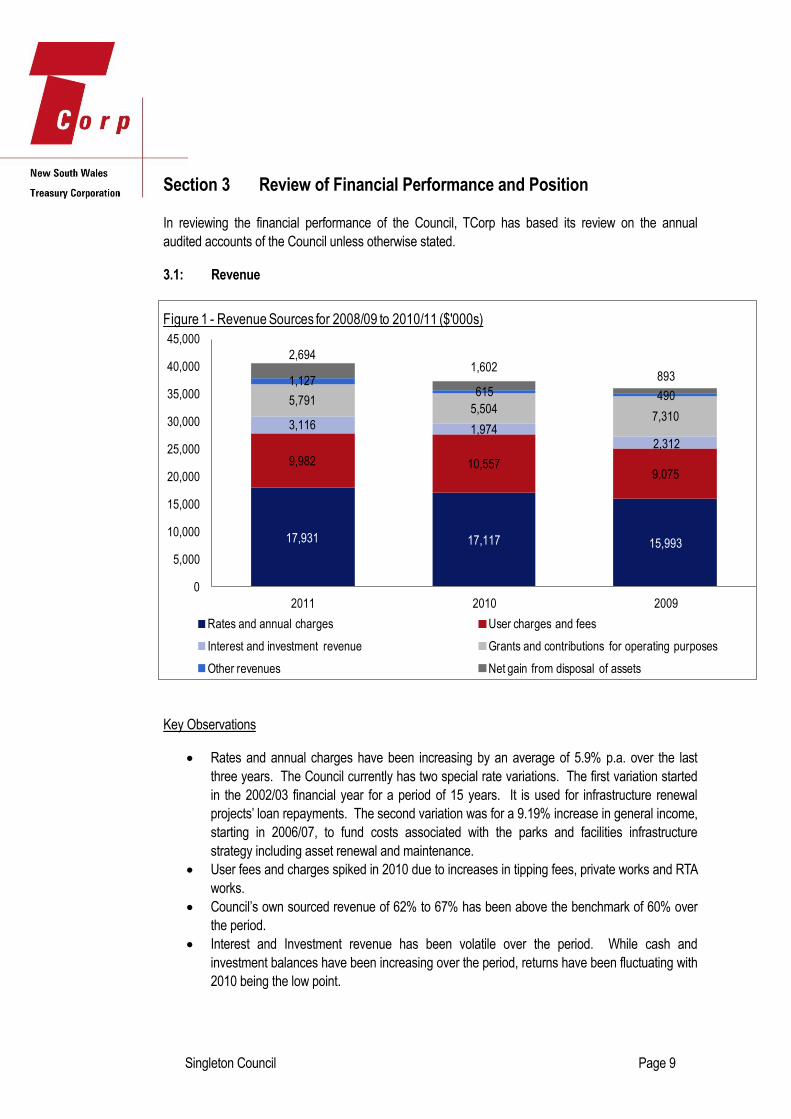
3.1: Revenue
Key Observations
Rates and annual charges have been increasing by an average of 5.9% p.a. over the last
three years. The Council currently has two special rate variations. The first variation started
in the 2002/03 financial year for a period of 15 years. It is used for infrastructure renewal
projects’ loan repayments. The second variation was for a 9.19% increase in general income,
starting in 2006/07, to fund costs associated with the parks and facilities infrastructure
strategy including asset renewal and maintenance.
User fees and charges spiked in 2010 due to increases in tipping fees, private works and RTA
works.
Council’s own sourced revenue of 62% to 67% has been above the benchmark of 60% over
the period.
Interest and Investment revenue has been volatile over the period. While cash and
investment balances have been increasing over the period, returns have been fluctuating with
2010 being the low point.
17,931 17,117 15,993
9,982 10,5579,075
3,116 1,9742,312
5,7915,504
7,310
1,127615 490
2,6941,602
893
0
5,000
10,000
15,000
20,000
25,000
30,000
35,000
40,000
45,000
2011 2010 2009
Figure 1 - Revenue Sources for 2008/09 to 2010/11 ($'000s)
Rates and annual charges User charges and fees
Interest and investment revenue Grants and contributions for operating purposes
Other revenues Net gain from disposal of assets

Singleton Council Page 10
Operating grants and contributions fell substantially in 2010 due to specific purpose transport
grants for flood works and road to recovery finishing.
3.2: Expenses
Key Observations
Employee costs have been rising by an average of 4.9% p.a. over the period. The increases
were broadly over most categories including salaries and wages, leave entitlements, workers
compensation insurance and a reduced level of cost capitalisation.
Materials and contract expenses dropped sharply in 2010 due to a $1.6m reduction in raw
materials caused by a spike in raw materials in 2009. Excluding the 2010 spike, materials
and contract expenses have only grown by 1% p.a. since 2008
Depreciation and amortisation has been volatile over the period mainly within the roads,
bridges and footpaths category. In 2010 there was a $33.6m transfer to roads, bridges and
footpaths, which is a correction of previous overstated depreciation in previous years, which
increased the written down value substantially. In 2011, depreciation on roads, bridges and
footpaths reduced by $1m due to increases in the assessed useful life of the assets.
Other expenses have been increasing by around $0.5m p.a. due to increases in the waste
and emergency services levies, street lighting and insurance costs
The Council appears to manage its expenses well with no stand out increases noted besides
the depreciation and amortisation expenses comments above
14,276 13,699 12,963
531 393 444
13,104 12,831 14,476
8,334 8,900 8,581
3,497 2,885 2,396
0
5,000
10,000
15,000
20,000
25,000
30,000
35,000
40,000
45,000
2011 2010 2009
Figure 2 - Expenses for 2008/09 to 2010/11 ($'000s)
Employees Borrowing costs Materials and contract expenses
Depreciation and amortisation Other expenses
Singleton Council Page 11
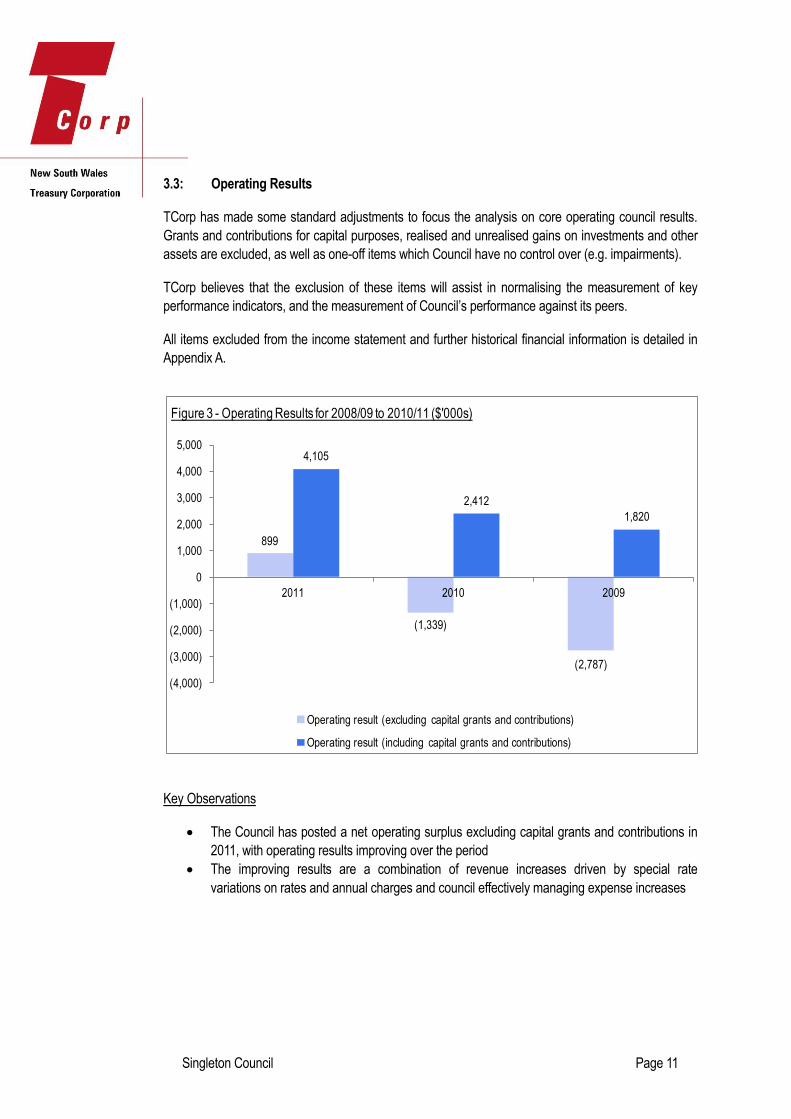
3.3: Operating Results
TCorp has made some standard adjustments to focus the analysis on core operating council results.
Grants and contributions for capital purposes, realised and unrealised gains on investments and other
assets are excluded, as well as one-off items which Council have no control over (e.g. impairments).
TCorp believes that the exclusion of these items will assist in normalising the measurement of key
performance indicators, and the measurement of Council’s performance against its peers.
All items excluded from the income statement and further historical financial information is detailed in
Appendix A.
Key Observations
The Council has posted a net operating surplus excluding capital grants and contributions in
2011, with operating results improving over the period
The improving results are a combination of revenue increases driven by special rate
variations on rates and annual charges and council effectively managing expense increases
899
(1,339)
(2,787)
4,105
2,412
1,820
(4,000)
(3,000)
(2,000)
(1,000)
0
1,000
2,000
3,000
4,000
5,000
2011 2010 2009
Figure 3 - Operating Results for 2008/09 to 2010/11 ($'000s)
Operating result (excluding capital grants and contributions)
Operating result (including capital grants and contributions)
Singleton Council Page 12
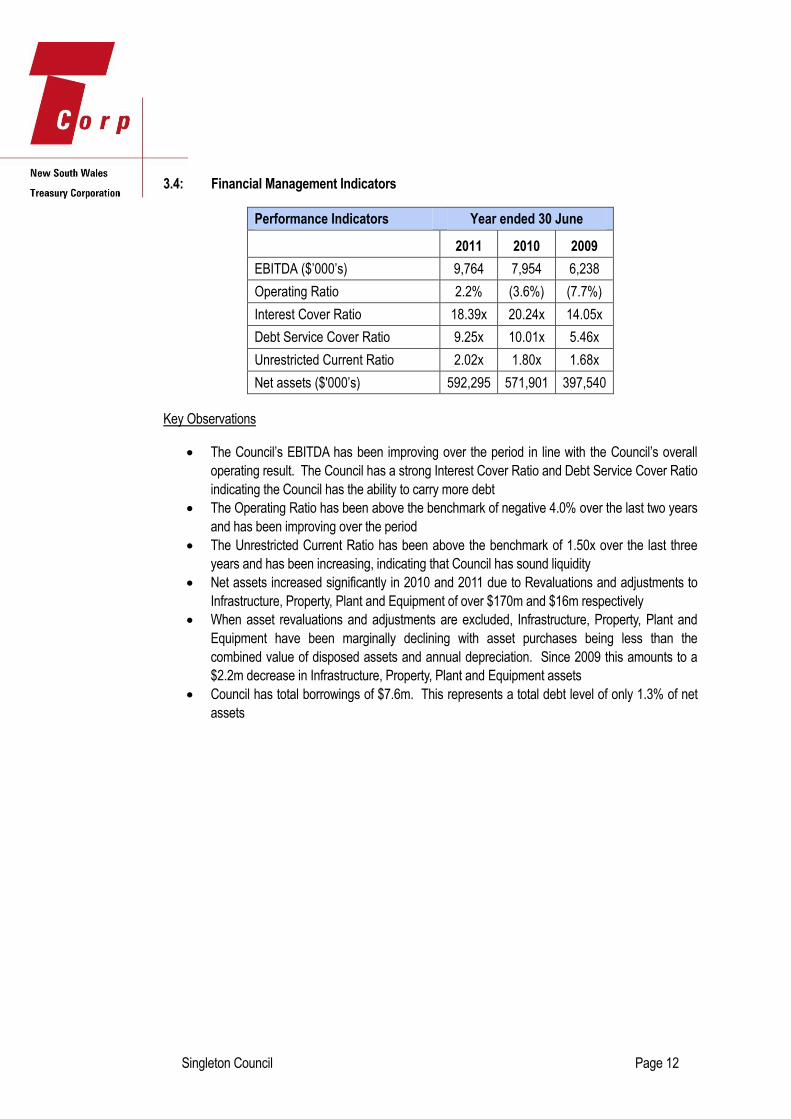
3.4: Financial Management Indicators
Performance Indicators Year ended 30 June
2011 2010 2009
EBITDA ($’000’s) 9,764 7,954 6,238
Operating Ratio 2.2% (3.6%) (7.7%)
Interest Cover Ratio 18.39x 20.24x 14.05x
Debt Service Cover Ratio 9.25x 10.01x 5.46x
Unrestricted Current Ratio 2.02x 1.80x 1.68x
Net assets ($'000’s) 592,295 571,901 397,540
Key Observations
The Council’s EBITDA has been improving over the period in line with the Council’s overall
operating result. The Council has a strong Interest Cover Ratio and Debt Service Cover Ratio
indicating the Council has the ability to carry more debt
The Operating Ratio has been above the benchmark of negative 4.0% over the last two years
and has been improving over the period
The Unrestricted Current Ratio has been above the benchmark of 1.50x over the last three
years and has been increasing, indicating that Council has sound liquidity
Net assets increased significantly in 2010 and 2011 due to Revaluations and adjustments to
Infrastructure, Property, Plant and Equipment of over $170m and $16m respectively
When asset revaluations and adjustments are excluded, Infrastructure, Property, Plant and
Equipment have been marginally declining with asset purchases being less than the
combined value of disposed assets and annual depreciation. Since 2009 this amounts to a
$2.2m decrease in Infrastructure, Property, Plant and Equipment assets
Council has total borrowings of $7.6m. This represents a total debt level of only 1.3% of net
assets
Singleton Council Page 13
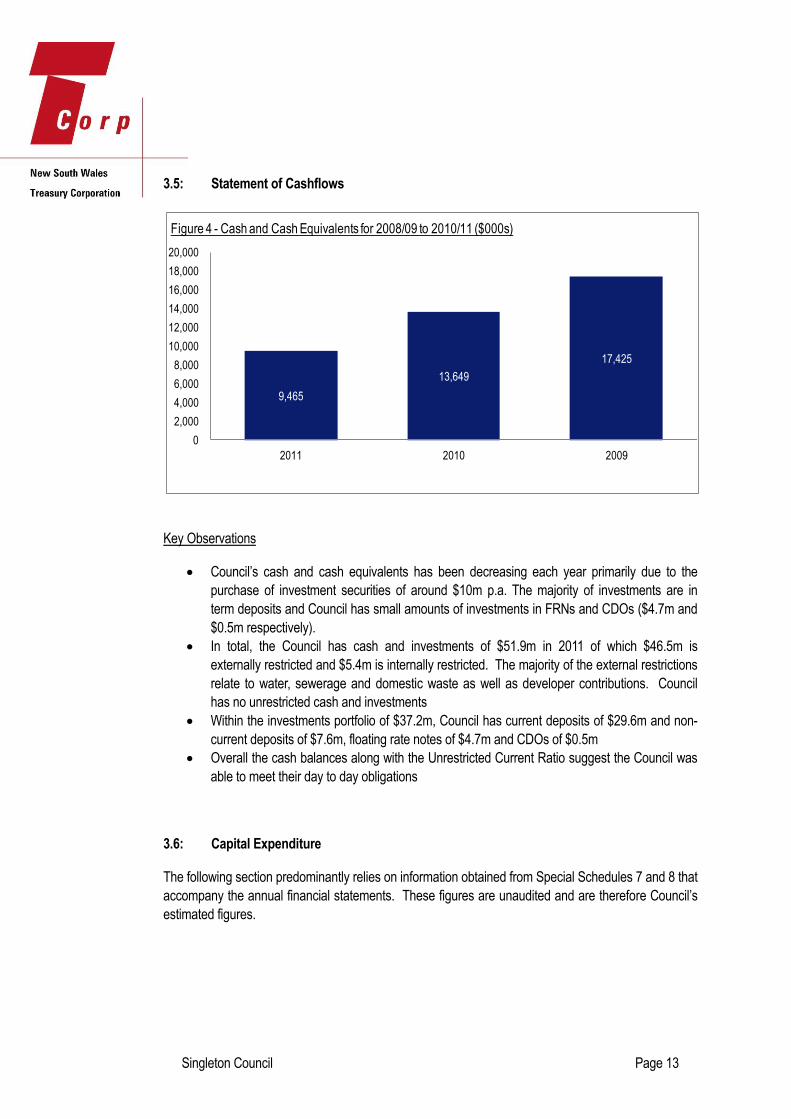
3.5: Statement of Cashflows
Key Observations
Council’s cash and cash equivalents has been decreasing each year primarily due to the
purchase of investment securities of around $10m p.a. The majority of investments are in
term deposits and Council has small amounts of investments in FRNs and CDOs ($4.7m and
$0.5m respectively).
In total, the Council has cash and investments of $51.9m in 2011 of which $46.5m is
externally restricted and $5.4m is internally restricted. The majority of the external restrictions
relate to water, sewerage and domestic waste as well as developer contributions. Council
has no unrestricted cash and investments
Within the investments portfolio of $37.2m, Council has current deposits of $29.6m and non-
current deposits of $7.6m, floating rate notes of $4.7m and CDOs of $0.5m
Overall the cash balances along with the Unrestricted Current Ratio suggest the Council was
able to meet their day to day obligations
3.6: Capital Expenditure
The following section predominantly relies on information obtained from Special Schedules 7 and 8 that
accompany the annual financial statements. These figures are unaudited and are therefore Council’s
estimated figures.
9,465
13,649
17,425
0
2,000
4,000
6,000
8,000
10,000
12,000
14,000
16,000
18,000
20,000
2011 2010 2009
Figure 4 - Cash and Cash Equivalents for 2008/09 to 2010/11 ($000s)
Singleton Council Page 14
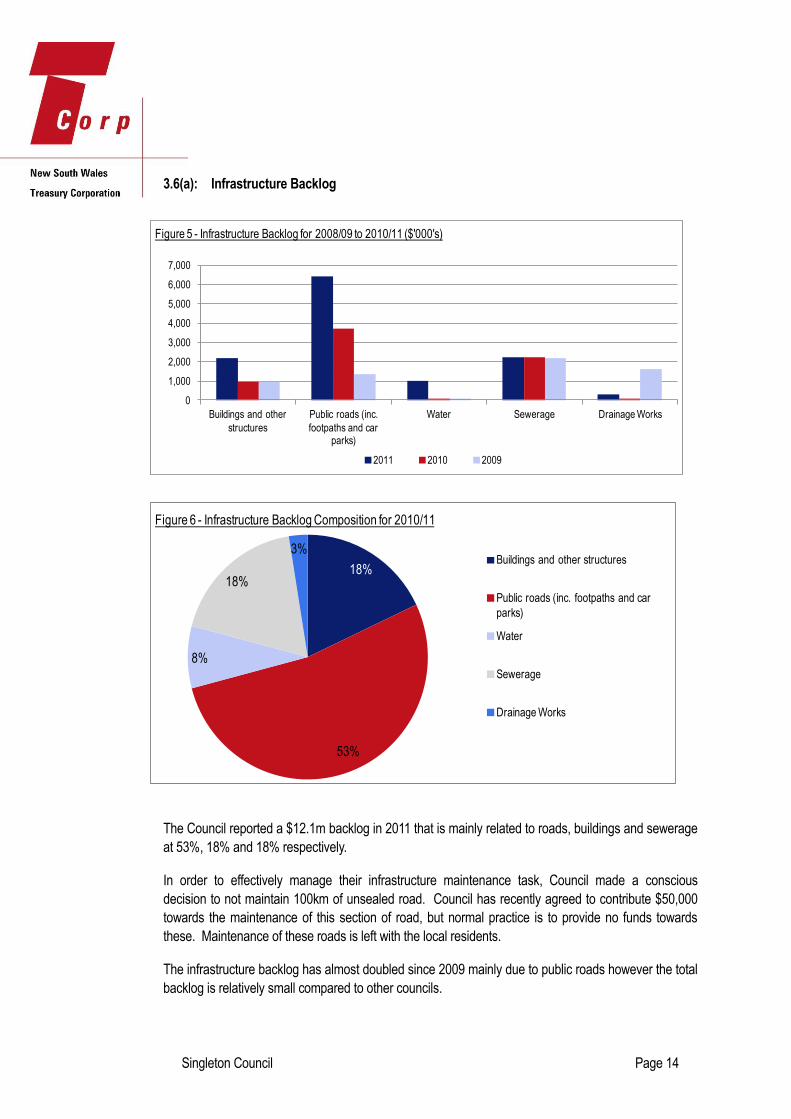
3.6(a): Infrastructure Backlog
The Council reported a $12.1m backlog in 2011 that is mainly related to roads, buildings and sewerage
at 53%, 18% and 18% respectively.
In order to effectively manage their infrastructure maintenance task, Council made a conscious
decision to not maintain 100km of unsealed road. Council has recently agreed to contribute $50,000
towards the maintenance of this section of road, but normal practice is to provide no funds towards
these. Maintenance of these roads is left with the local residents.
The infrastructure backlog has almost doubled since 2009 mainly due to public roads however the total
backlog is relatively small compared to other councils.
18%
53%
8%
18%
3%
Figure 6 - Infrastructure Backlog Composition for 2010/11
Buildings and other structures
Public roads (inc. footpaths and car
parks)
Water
Sewerage
Drainage Works
0
1,000
2,000
3,000
4,000
5,000
6,000
7,000
Buildings and other
structures
Public roads (inc.
footpaths and car parks)
Water Sewerage Drainage Works
Figure 5 - Infrastructure Backlog for 2008/09 to 2010/11 ($'000's)
2011 2010 2009
Singleton Council Page 15
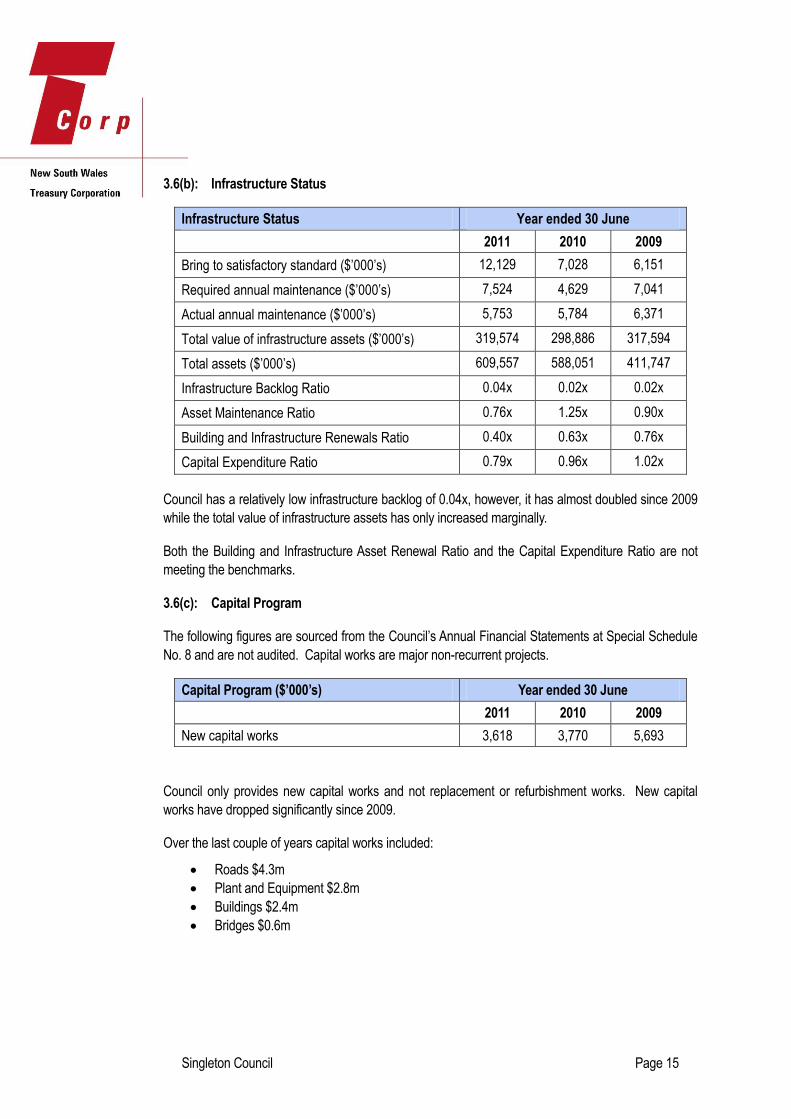
3.6(b): Infrastructure Status
Infrastructure Status Year ended 30 June
2011 2010 2009
Bring to satisfactory standard ($’000’s) 12,129 7,028 6,151
Required annual maintenance ($’000’s) 7,524 4,629 7,041
Actual annual maintenance ($’000’s) 5,753 5,784 6,371
Total value of infrastructure assets ($’000’s) 319,574 298,886 317,594
Total assets ($’000’s) 609,557 588,051 411,747
Infrastructure Backlog Ratio 0.04x 0.02x 0.02x
Asset Maintenance Ratio 0.76x 1.25x 0.90x
Building and Infrastructure Renewals Ratio 0.40x 0.63x 0.76x
Capital Expenditure Ratio 0.79x 0.96x 1.02x
Council has a relatively low infrastructure backlog of 0.04x, however, it has almost doubled since 2009
while the total value of infrastructure assets has only increased marginally.
Both the Building and Infrastructure Asset Renewal Ratio and the Capital Expenditure Ratio are not
meeting the benchmarks.
3.6(c): Capital Program
The following figures are sourced from the Council’s Annual Financial Statements at Special Schedule
No. 8 and are not audited. Capital works are major non-recurrent projects.
Capital Program ($’000’s) Year ended 30 June
2011 2010 2009
New capital works 3,618 3,770 5,693
Council only provides new capital works and not replacement or refurbishment works. New capital
works have dropped significantly since 2009.
Over the last couple of years capital works included:
Roads $4.3m
Plant and Equipment $2.8m
Buildings $2.4m
Bridges $0.6m
Singleton Council Page 16
3.7: Specific Risks to Council
Environmental and natural disasters. Singleton has had two natural disaster declarations in
the last three years. Council’s management of this risk is substantially reliant on being able to
receive both State and Federal funding under various “natural disaster” funds.
Ageing population. The NSW Statistical Local Area Population Projections, 2006-2036 shows
that the proportion of people over 65 in Singleton will increase from 10% in 2006 to 18% in
2036. An ageing population places pressure on existing infrastructure and services, with
consideration required for future service requirements that may have implications in terms of
future service provision.
Council has a long term SRV that is due to finish in 2018. Council will need to either adjust to
slower income growth from 2018 or consider other options for replacing this income stream.
Employee costs. Employee costs have been growing at around 4.9% over the last three
years. This level of growth is above the average employee cost levels that should be
achieved.
Deterioration of Council infrastructure assets. Over the last three years the infrastructure
backlog has almost doubled and actual maintenance has been reducing while required
maintenance has been increasing. If this trend continues the Council’s infrastructure backlog
will continue to grow and may be reflected in lower quality infrastructure assets.
Singleton Council Page 17
Section 4 Review of Financial Forecasts
The financial model shows the projected financial statements and assumptions for the next 10 years.
The model we received included the $2.2m loan with the LIRS subsidy and the capital cost of the
Timber Bridge Replacement Program. We have manually removed the subsidy from the model
because the outcome of the LIRS application was not available at the time of writing this report.
The LIRS loan relates to the General Fund, therefore we have focused our financial analysis solely
upon this Fund. Council’s consolidated position includes both a Water and Sewer Fund however these
are operated as independent entities, which unlike the General Fund are able to adjust the appropriate
fees and charges to meet all future operating and investing expenses.
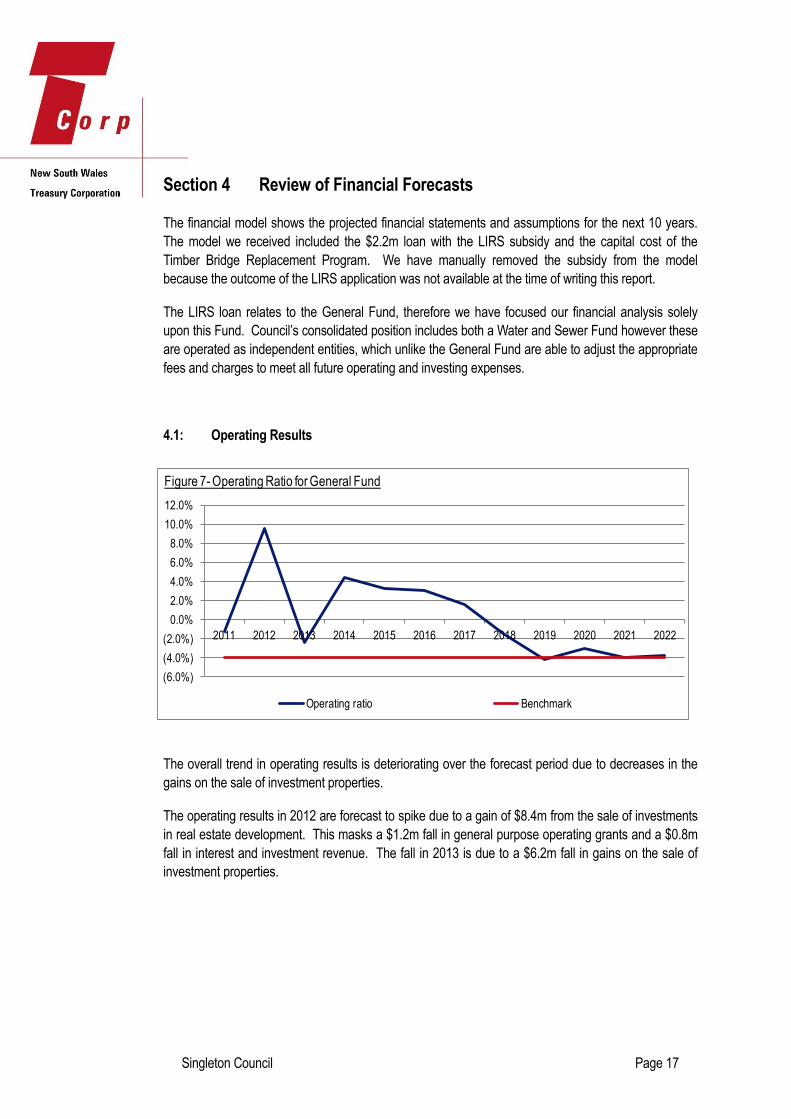
4.1: Operating Results
The overall trend in operating results is deteriorating over the forecast period due to decreases in the
gains on the sale of investment properties.
The operating results in 2012 are forecast to spike due to a gain of $8.4m from the sale of investments
in real estate development. This masks a $1.2m fall in general purpose operating grants and a $0.8m
fall in interest and investment revenue. The fall in 2013 is due to a $6.2m fall in gains on the sale of
investment properties.
(6.0%)
(4.0%)
(2.0%)
0.0%
2.0%
4.0%
6.0%
8.0%
10.0%
12.0%
2011 2012 2013 2014 2015 2016 2017 2018 2019 2020 2021 2022
Figure 7- Operating Ratio for General Fund
Operating ratio Benchmark

Singleton Council Page 18
4.2: Financial Management Indicators
Liquidity Ratios
* The unrestricted current ratio for 2011 was not provided for the general fund so we have used the
consolidated unrestricted current ratio.
The Council starts with a strong liquidity position and it increases significantly over the forecast period.
0.0 months
5.0 months
10.0 months
15.0 months
20.0 months
25.0 months
2011 2012 2013 2014 2015 2016 2017 2018 2019 2020 2021 2022
Figure 8 - Cash Expense Ratio for General Fund
Cash expense ratio Benchmark
2.02x
2.96x 2.94x
3.68x3.40x
4.83x5.23x
6.01x6.33x
6.80x 7.02x
7.87x
0.00x
1.00x
2.00x
3.00x
4.00x
5.00x
6.00x
7.00x
8.00x
9.00x
2011 2012 2013 2014 2015 2016 2017 2018 2019 2020 2021 2022
Figure 9 - Unrestricted Current Ratio for General Fund
Benchmark
Singleton Council Page 19
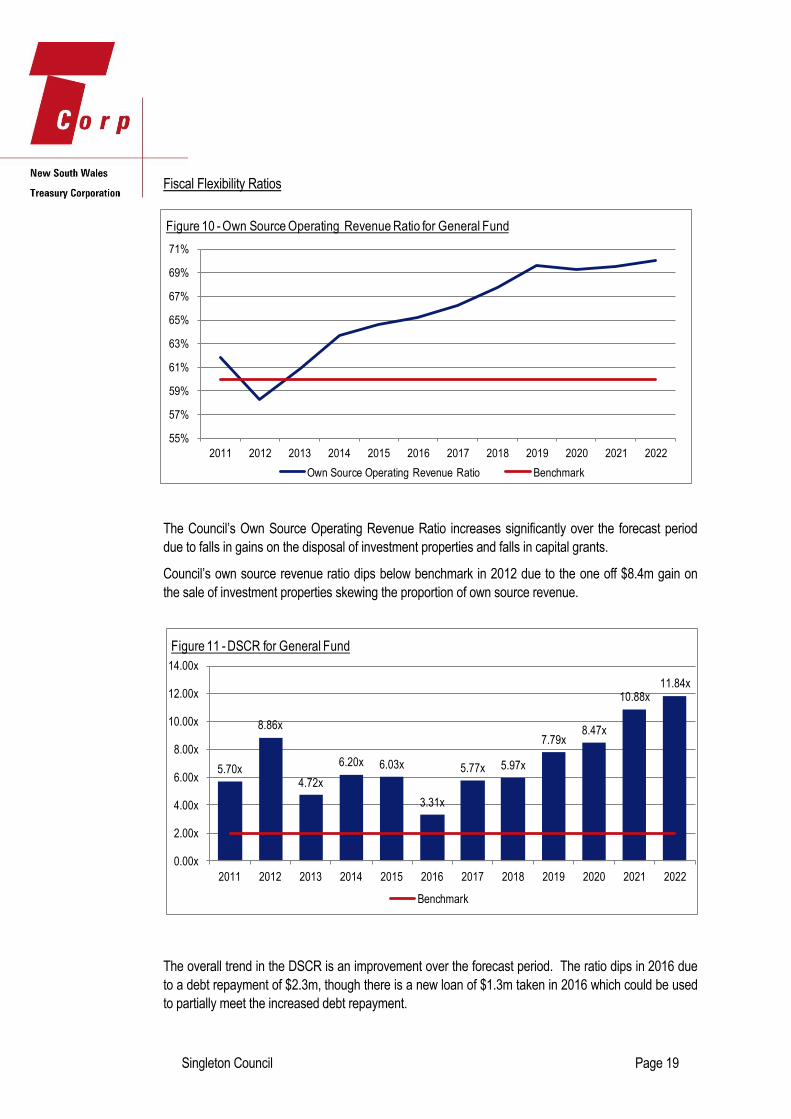
Fiscal Flexibility Ratios
The Council’s Own Source Operating Revenue Ratio increases significantly over the forecast period
due to falls in gains on the disposal of investment properties and falls in capital grants.
Council’s own source revenue ratio dips below benchmark in 2012 due to the one off $8.4m gain on
the sale of investment properties skewing the proportion of own source revenue.
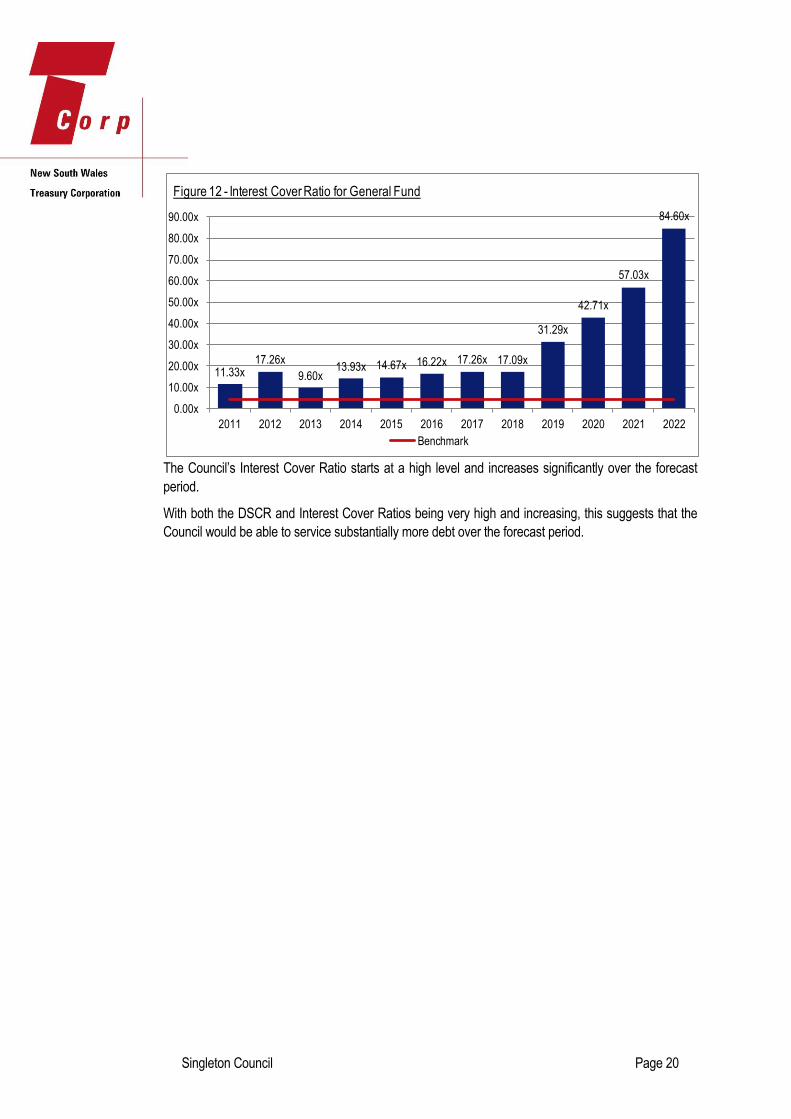
The overall trend in the DSCR is an improvement over the forecast period. The ratio dips in 2016 due
to a debt repayment of $2.3m, though there is a new loan of $1.3m taken in 2016 which could be used
to partially meet the increased debt repayment.
55%
57%
59%
61%
63%
65%
67%
69%
71%
2011 2012 2013 2014 2015 2016 2017 2018 2019 2020 2021 2022
Figure 10 - Own Source Operating Revenue Ratio for General Fund
Own Source Operating Revenue Ratio Benchmark
5.70x
8.86x
4.72x
6.20x 6.03x
3.31x
5.77x 5.97x
7.79x8.47x
10.88x11.84x
0.00x
2.00x
4.00x
6.00x
8.00x
10.00x
12.00x
14.00x
2011 2012 2013 2014 2015 2016 2017 2018 2019 2020 2021 2022
Figure 11 - DSCR for General Fund
Benchmark
Singleton Council Page 20
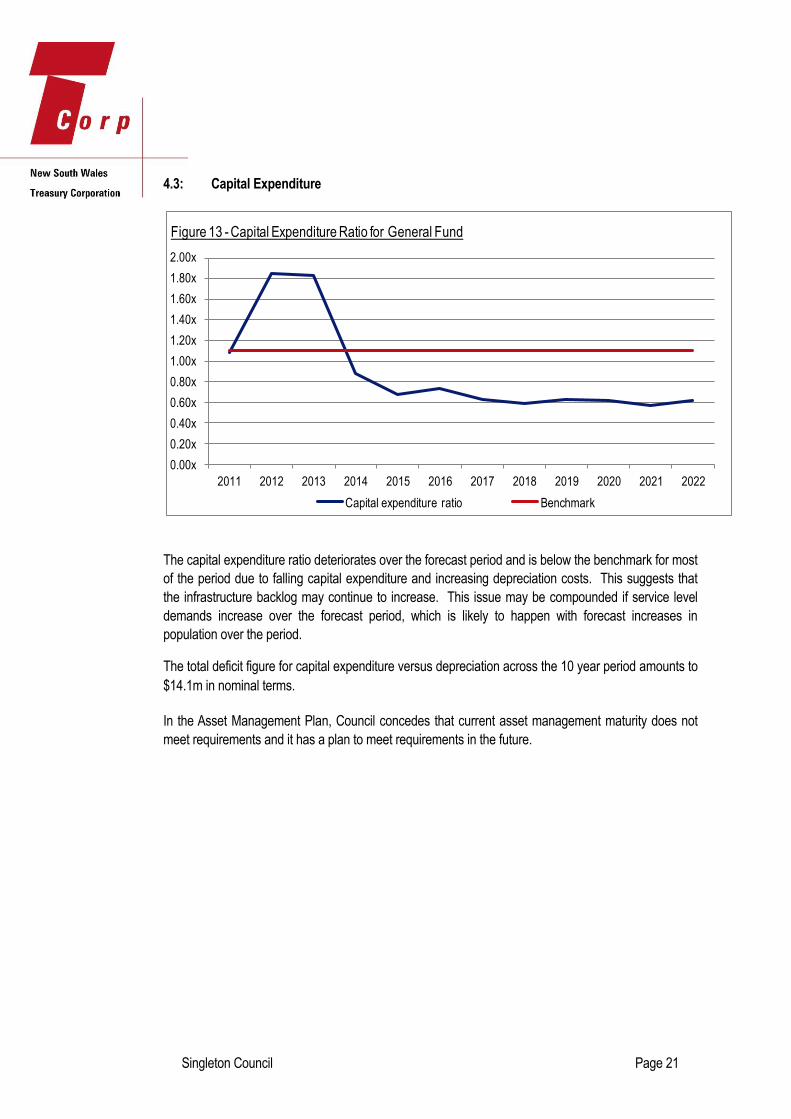
The Council’s Interest Cover Ratio starts at a high level and increases significantly over the forecast
period.
With both the DSCR and Interest Cover Ratios being very high and increasing, this suggests that the
Council would be able to service substantially more debt over the forecast period.
11.33x17.26x
9.60x13.93x 14.67x 16.22x 17.26x 17.09x
31.29x
42.71x
57.03x
84.60x
0.00x
10.00x
20.00x
30.00x
40.00x
50.00x
60.00x
70.00x
80.00x
90.00x
2011 2012 2013 2014 2015 2016 2017 2018 2019 2020 2021 2022
Figure 12 - Interest Cover Ratio for General Fund
Benchmark
Singleton Council Page 21
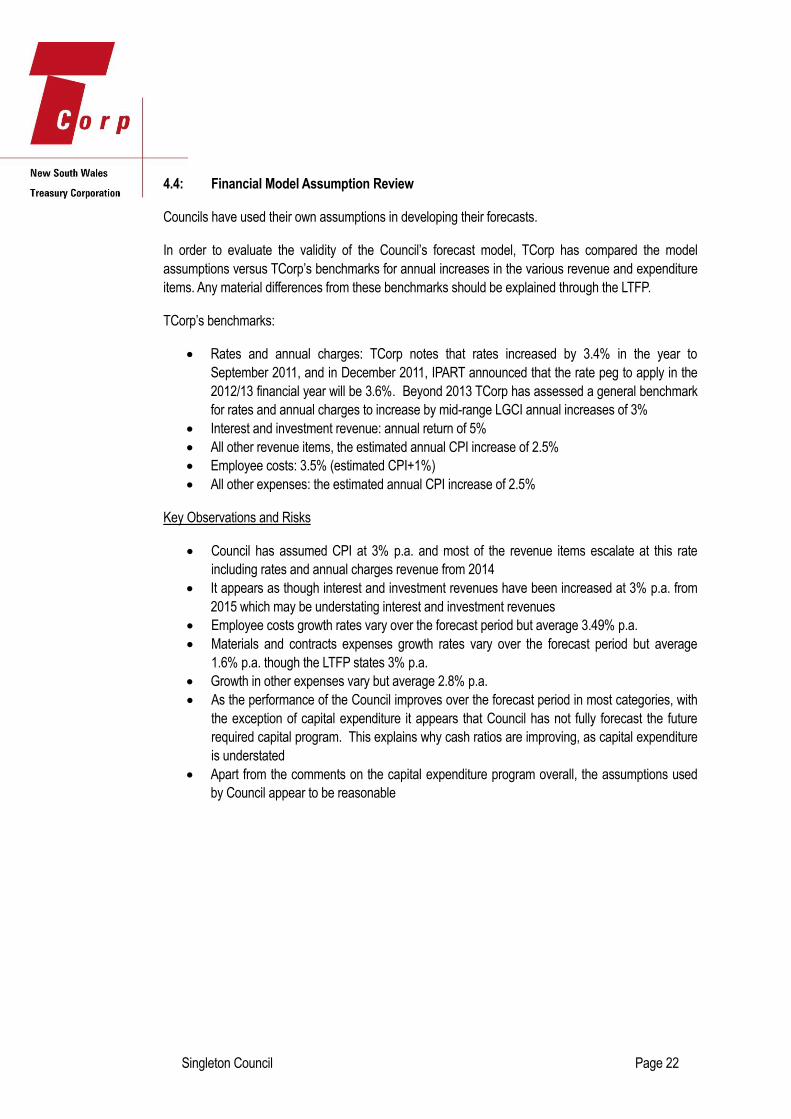
4.3: Capital Expenditure
The capital expenditure ratio deteriorates over the forecast period and is below the benchmark for most
of the period due to falling capital expenditure and increasing depreciation costs. This suggests that
the infrastructure backlog may continue to increase. This issue may be compounded if service level
demands increase over the forecast period, which is likely to happen with forecast increases in
population over the period.
The total deficit figure for capital expenditure versus depreciation across the 10 year period amounts to
$14.1m in nominal terms.
In the Asset Management Plan, Council concedes that current asset management maturity does not
meet requirements and it has a plan to meet requirements in the future.
0.00x
0.20x
0.40x
0.60x
0.80x
1.00x
1.20x
1.40x
1.60x
1.80x
2.00x
2011 2012 2013 2014 2015 2016 2017 2018 2019 2020 2021 2022
Figure 13 - Capital Expenditure Ratio for General Fund
Capital expenditure ratio Benchmark
Singleton Council Page 22
4.4: Financial Model Assumption Review
Councils have used their own assumptions in developing their forecasts.
In order to evaluate the validity of the Council’s forecast model, TCorp has compared the model
assumptions versus TCorp’s benchmarks for annual increases in the various revenue and expenditure
items. Any material differences from these benchmarks should be explained through the LTFP.
TCorp’s benchmarks:
Rates and annual charges: TCorp notes that rates increased by 3.4% in the year to
September 2011, and in December 2011, IPART announced that the rate peg to apply in the
2012/13 financial year will be 3.6%. Beyond 2013 TCorp has assessed a general benchmark
for rates and annual charges to increase by mid-range LGCI annual increases of 3%
Interest and investment revenue: annual return of 5%
All other revenue items, the estimated annual CPI increase of 2.5%
Employee costs: 3.5% (estimated CPI+1%)
All other expenses: the estimated annual CPI increase of 2.5%
Key Observations and Risks
Council has assumed CPI at 3% p.a. and most of the revenue items escalate at this rate
including rates and annual charges revenue from 2014
It appears as though interest and investment revenues have been increased at 3% p.a. from
2015 which may be understating interest and investment revenues
Employee costs growth rates vary over the forecast period but average 3.49% p.a.
Materials and contracts expenses growth rates vary over the forecast period but average
1.6% p.a. though the LTFP states 3% p.a.
Growth in other expenses vary but average 2.8% p.a.
As the performance of the Council improves over the forecast period in most categories, with
the exception of capital expenditure it appears that Council has not fully forecast the future
required capital program. This explains why cash ratios are improving, as capital expenditure
is understated
Apart from the comments on the capital expenditure program overall, the assumptions used
by Council appear to be reasonable
Singleton Council Page 23
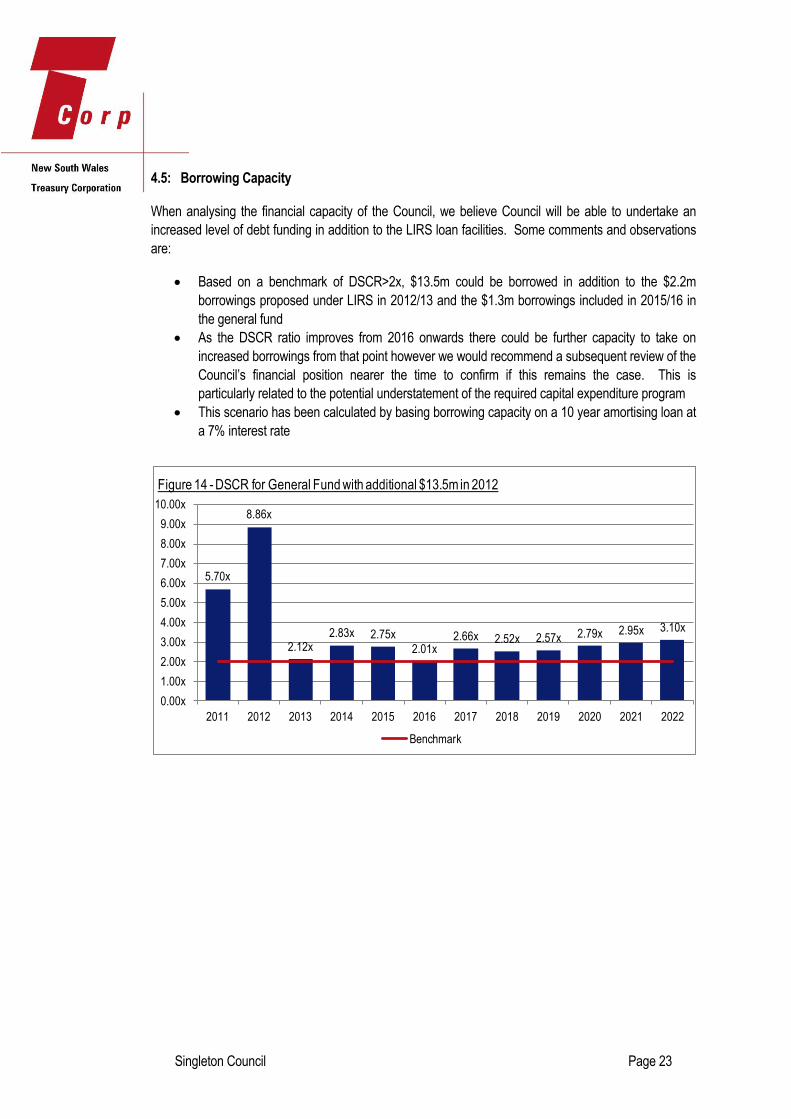
4.5: Borrowing Capacity
When analysing the financial capacity of the Council, we believe Council will be able to undertake an
increased level of debt funding in addition to the LIRS loan facilities. Some comments and observations
are:
Based on a benchmark of DSCR>2x, $13.5m could be borrowed in addition to the $2.2m
borrowings proposed under LIRS in 2012/13 and the $1.3m borrowings included in 2015/16 in
the general fund
As the DSCR ratio improves from 2016 onwards there could be further capacity to take on
increased borrowings from that point however we would recommend a subsequent review of the
Council’s financial position nearer the time to confirm if this remains the case. This is
particularly related to the potential understatement of the required capital expenditure program
This scenario has been calculated by basing borrowing capacity on a 10 year amortising loan at
a 7% interest rate
5.70x
8.86x
2.12x2.83x 2.75x
2.01x2.66x 2.52x 2.57x 2.79x 2.95x 3.10x
0.00x
1.00x
2.00x
3.00x
4.00x
5.00x
6.00x
7.00x
8.00x
9.00x
10.00x
2011 2012 2013 2014 2015 2016 2017 2018 2019 2020 2021 2022
Figure 14 - DSCR for General Fund with additional $13.5m in 2012
Benchmark
Singleton Council Page 24
Section 5 Benchmarking and Comparisons with Other Councils
As discussed in section 2 of this report, each council’s performance has been assessed against ten key
benchmark ratios. The benchmarking assessment has been conducted on a consolidated basis (that is,
for councils that operate more than one fund, the results of all funds are included). This section of the
report compares the Council’s performance with its peers in the same DLG Group. The Council is in
DLG Group 4. There are 32 councils in this group and at the time of preparing this report, we have data
for 19 of these councils.
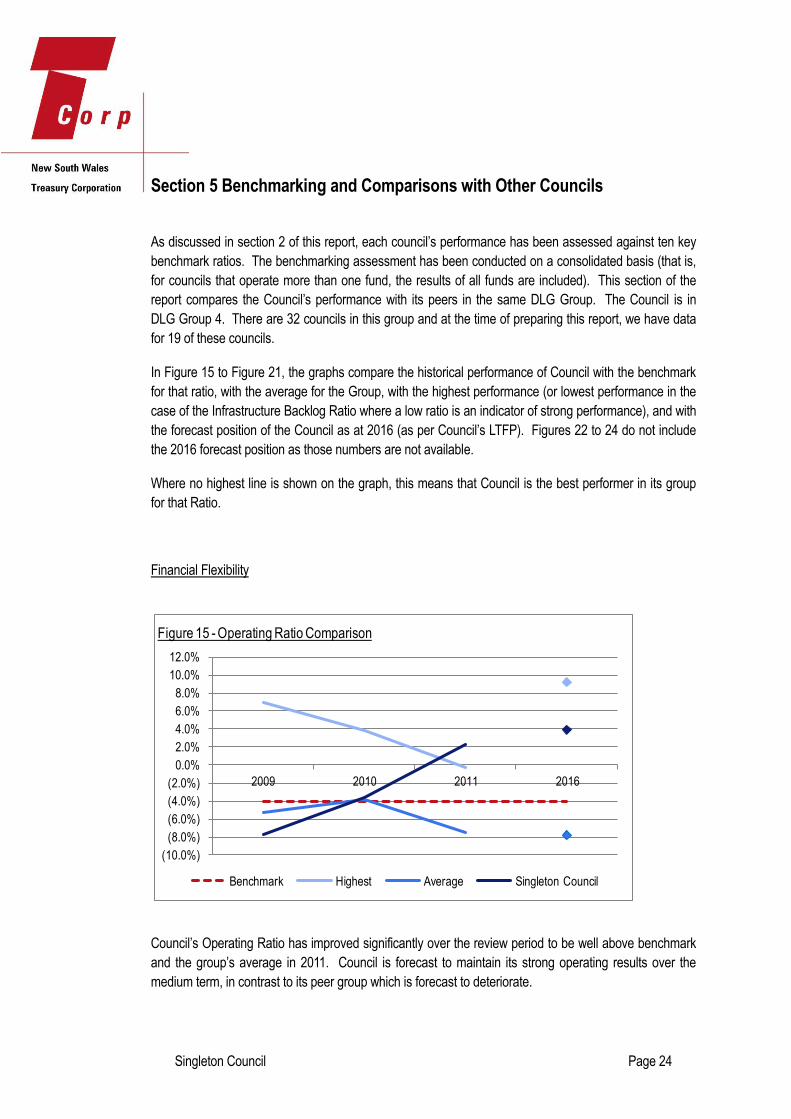
In Figure 15 to Figure 21, the graphs compare the historical performance of Council with the benchmark
for that ratio, with the average for the Group, with the highest performance (or lowest performance in the
case of the Infrastructure Backlog Ratio where a low ratio is an indicator of strong performance), and with
the forecast position of the Council as at 2016 (as per Council’s LTFP). Figures 22 to 24 do not include
the 2016 forecast position as those numbers are not available.
Where no highest line is shown on the graph, this means that Council is the best performer in its group
for that Ratio.
Financial Flexibility
Council’s Operating Ratio has improved significantly over the review period to be well above benchmark
and the group’s average in 2011. Council is forecast to maintain its strong operating results over the
medium term, in contrast to its peer group which is forecast to deteriorate.
(10.0%)
(8.0%)
(6.0%)
(4.0%)
(2.0%)
0.0%
2.0%
4.0%
6.0%
8.0%
10.0%
12.0%
2009 2010 2011 2016
Figure 15 - Operating Ratio Comparison
Benchmark Highest Average Singleton Council
Singleton Council Page 25
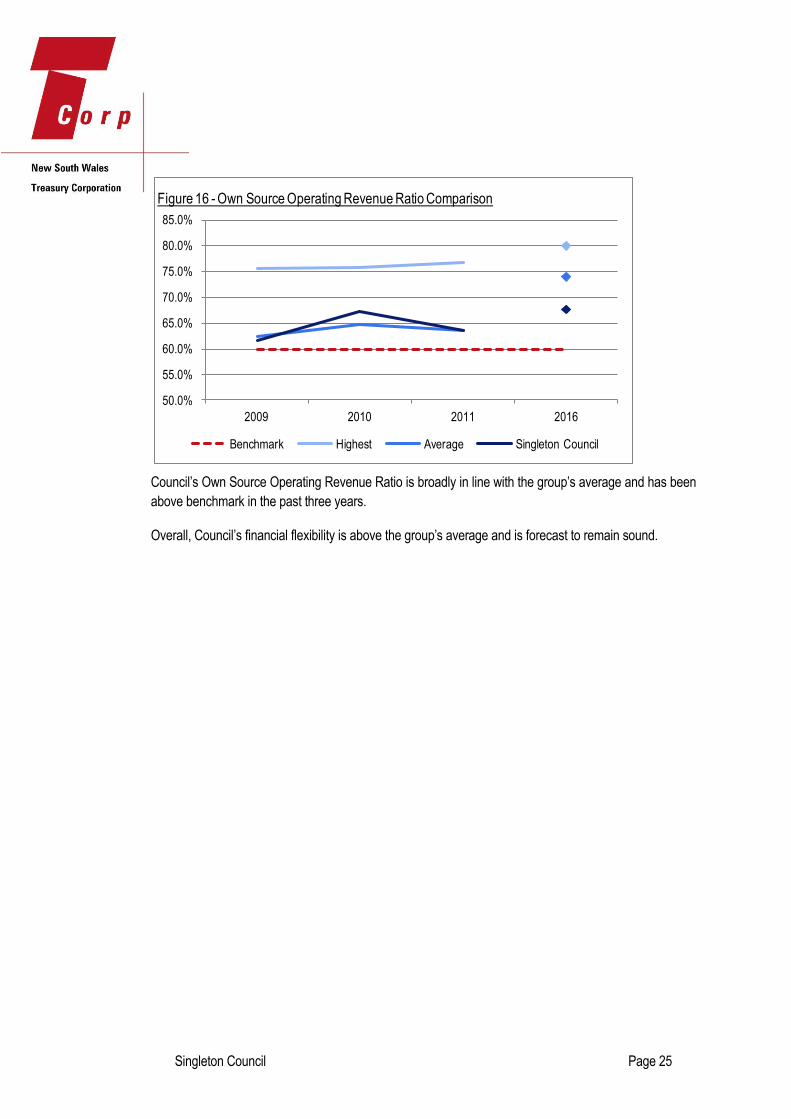
Council’s Own Source Operating Revenue Ratio is broadly in line with the group’s average and has been
above benchmark in the past three years.
Overall, Council’s financial flexibility is above the group’s average and is forecast to remain sound.
50.0%
55.0%
60.0%
65.0%
70.0%
75.0%
80.0%
85.0%
2009 2010 2011 2016
Figure 16 - Own Source Operating Revenue Ratio Comparison
Benchmark Highest Average Singleton Council
Singleton Council Page 26
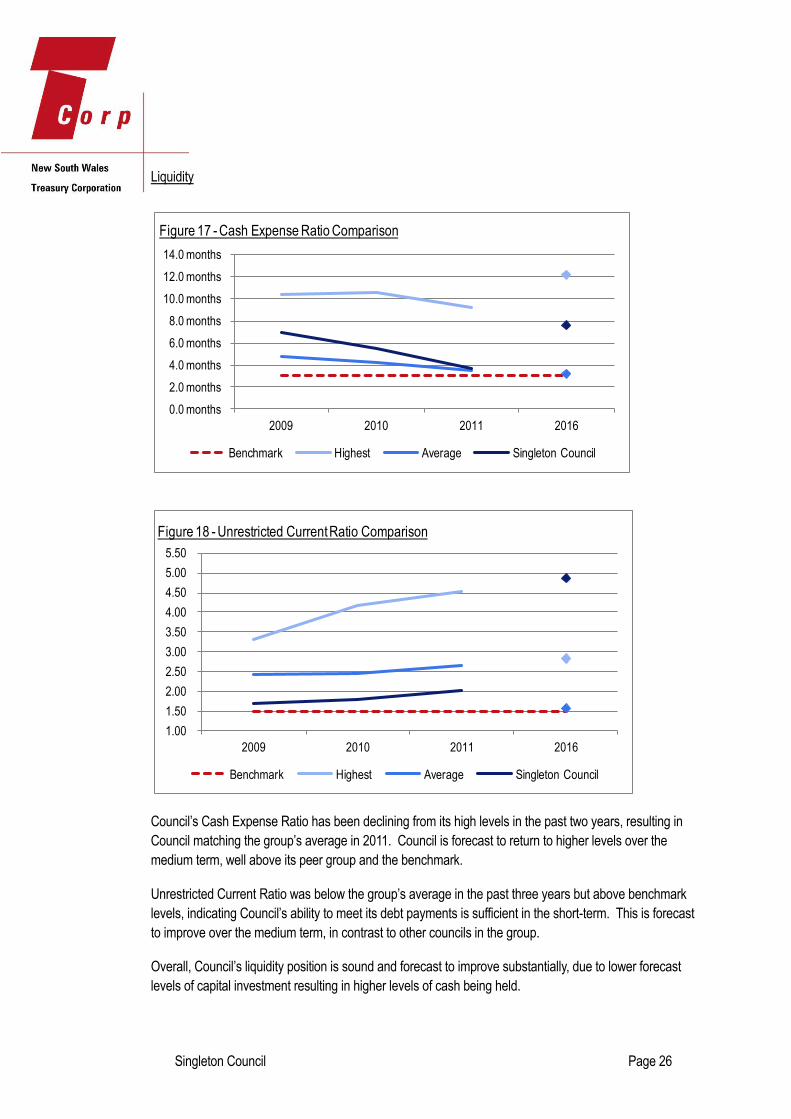
Liquidity
Council’s Cash Expense Ratio has been declining from its high levels in the past two years, resulting in
Council matching the group’s average in 2011. Council is forecast to return to higher levels over the
medium term, well above its peer group and the benchmark.
Unrestricted Current Ratio was below the group’s average in the past three years but above benchmark
levels, indicating Council’s ability to meet its debt payments is sufficient in the short-term. This is forecast
to improve over the medium term, in contrast to other councils in the group.
Overall, Council’s liquidity position is sound and forecast to improve substantially, due to lower forecast
levels of capital investment resulting in higher levels of cash being held.
0.0 months
2.0 months
4.0 months
6.0 months
8.0 months
10.0 months
12.0 months
14.0 months
2009 2010 2011 2016
Figure 17 - Cash Expense Ratio Comparison
Benchmark Highest Average Singleton Council
1.00
1.50
2.00
2.50
3.00
3.50
4.00
4.50
5.00
5.50
2009 2010 2011 2016
Figure 18 - Unrestricted Current Ratio Comparison
Benchmark Highest Average Singleton Council
Singleton Council Page 27
Debt Servicing
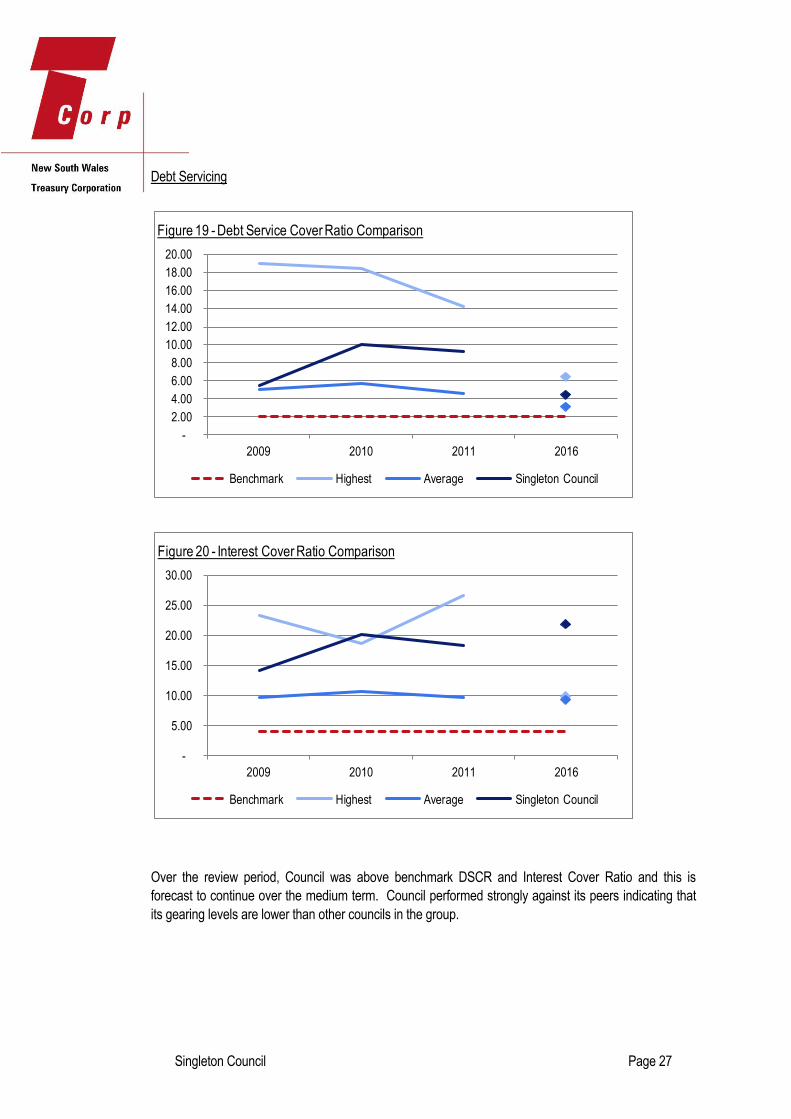
Over the review period, Council was above benchmark DSCR and Interest Cover Ratio and this is
forecast to continue over the medium term. Council performed strongly against its peers indicating that
its gearing levels are lower than other councils in the group.
-
2.00
4.00
6.00
8.00
10.00
12.00
14.00
16.00
18.00
20.00
2009 2010 2011 2016
Figure 19 - Debt Service Cover Ratio Comparison
Benchmark Highest Average Singleton Council
-
5.00
10.00
15.00
20.00
25.00
30.00
2009 2010 2011 2016
Figure 20 - Interest Cover Ratio Comparison
Benchmark Highest Average Singleton Council
Singleton Council Page 28
Asset Renewal and Capital Works
-
0.50
1.00
1.50
2.00
2.50
3.00
2009 2010 2011 2016
Figure 21 - Capital Expenditure Ratio Comparison
Benchmark Highest Average Singleton Council
-
0.20
0.40
0.60
0.80
1.00
1.20
1.40
2009 2010 2011
Figure 22 - Asset Maintenance Ratio Comparison
Benchmark Highest Average Singleton Council
Singleton Council Page 29
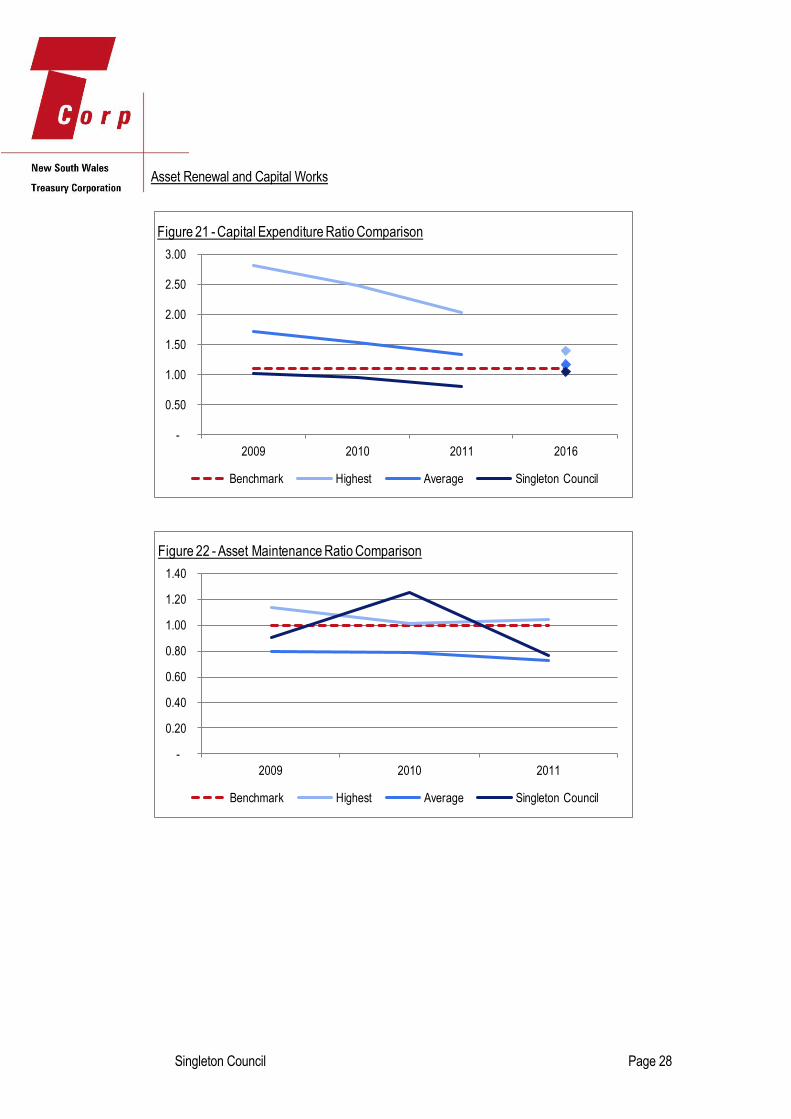
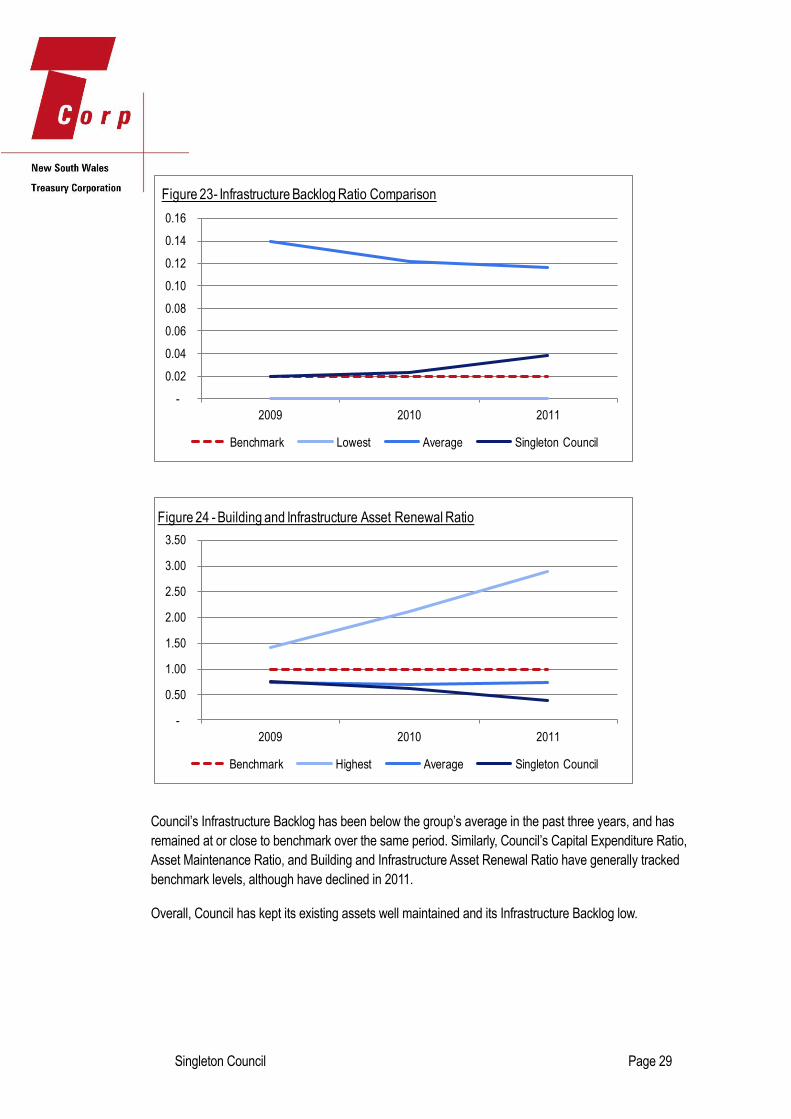
Council’s Infrastructure Backlog has been below the group’s average in the past three years, and has
remained at or close to benchmark over the same period. Similarly, Council’s Capital Expenditure Ratio,
Asset Maintenance Ratio, and Building and Infrastructure Asset Renewal Ratio have generally tracked
benchmark levels, although have declined in 2011.
Overall, Council has kept its existing assets well maintained and its Infrastructure Backlog low.
-
0.02
0.04
0.06
0.08
0.10
0.12
0.14
0.16
2009 2010 2011
Figure 23- Infrastructure Backlog Ratio Comparison
Benchmark Lowest Average Singleton Council
-
0.50
1.00
1.50
2.00
2.50
3.00
3.50
2009 2010 2011
Figure 24 - Building and Infrastructure Asset Renewal Ratio
Benchmark Highest Average Singleton Council
Singleton Council Page 30
Section 6 Conclusion and Recommendations
Based on our review of both the historic financial information and the 10 year financial forecast within
Council’s long term financial plan we consider Council to be in a sound financial position. Both past
performance and the financial forecasts support our findings that Council has sufficient financial capacity
to service the additional borrowings proposed under its LIRS applications.
As noted in our report, the forecast analysis has been focused on the General Fund where the LIRS
application relates, whereas the historical analysis has focused on the consolidated Audited Accounts.
We base our recommendation on the following key points:
Council has sufficient capacity to manage the additional $2.2m debt supported by a DSCR and
Interest Cover Ratio above the benchmarks in all 10 years of its financial forecast and has the
capacity to service additional debt of $13.5m
Council has ample liquidity to manage their short term liabilities during the 10 year forecast
period
Council has maintained control of expenses in the past three years except for the comments on
the depreciation expenses
Council has a relatively low level of borrowings at $7.6m, only 1.3% of net assets
Council has a relatively small infrastructure backlog at $12.1m that equates to 3.8% of total
infrastructure, property, plant and equipment assets
However we would also recommend that the following points be considered:
Operating deficit results excluding capital grants and contributions are forecast to start in 2018
and then stabilise over the remaining forecast period. These operating deficit results are all
close to the benchmark of negative 4%. This is a significant issue that could impact the long
term financial sustainability of the Council. We recommend Council considers its options for
improving its performance in this area, either by further and on-going cost controls, or securing
new or additional revenue in future years
Whilst depreciation is fully funded by sufficient capital expenditure in the first two years of the
financial forecasts, it appears that for the last eight years of the forecast a much lower level of
capital expenditure has been forecast. We would therefore recommend these figures be
reviewed by Council and would recommend ongoing analysis to verify them in the future
Council has indicated that their Asset Management Plan requires further refinement and as the
IP&R system is an ongoing process we believe that the Council will become more accomplished
in providing data that will interlink between the IP&R documents and the financial forecasts
As Council improves its Asset Management Plan it should ensure that the financial forecasts accurately
reflect required levels of capital expenditure. This will then have flow on effects to cash reserves and
borrowing needs that could be used to meet the updated capital expenditure required
Singleton Council Page 31
Appendix A Historical Financial Information Tables
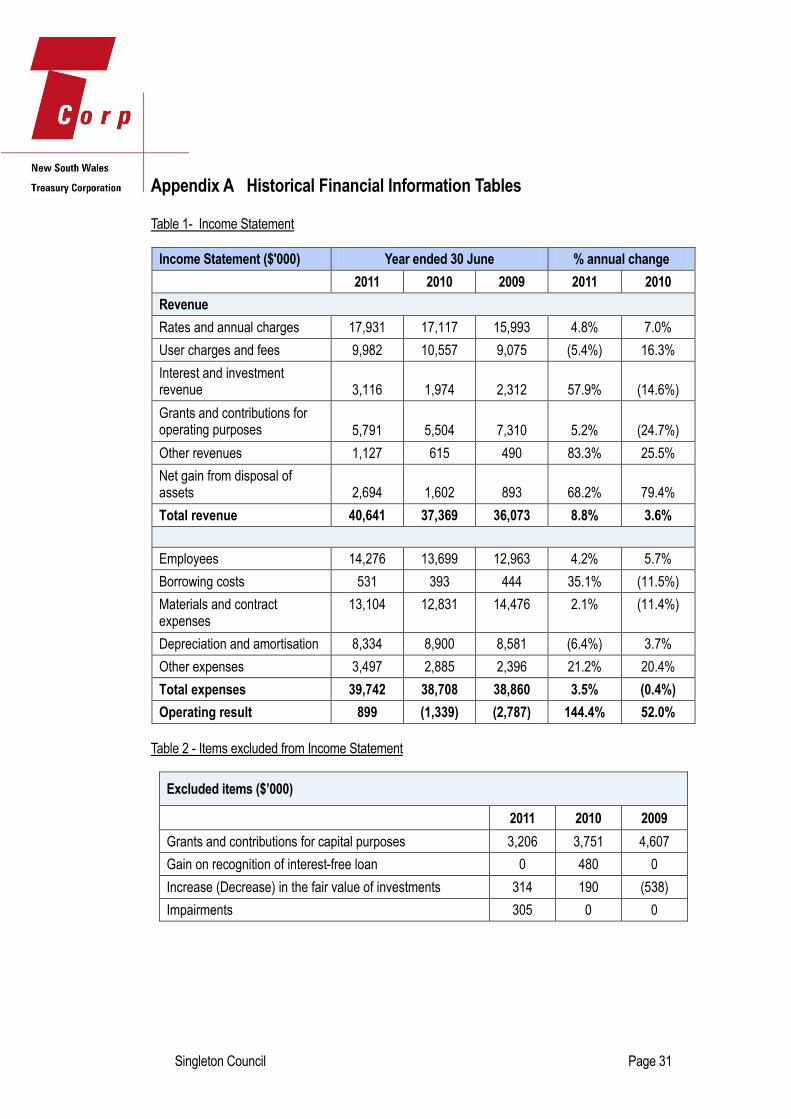
Table 1- Income Statement
Income Statement ($'000) Year ended 30 June % annual change
2011 2010 2009 2011 2010
Revenue
Rates and annual charges 17,931 17,117 15,993 4.8% 7.0%
User charges and fees 9,982 10,557 9,075 (5.4%) 16.3%
Interest and investment revenue 3,116 1,974 2,312 57.9% (14.6%)
Grants and contributions for operating purposes 5,791 5,504 7,310 5.2% (24.7%)
Other revenues 1,127 615 490 83.3% 25.5%
Net gain from disposal of assets 2,694 1,602 893 68.2% 79.4%
Total revenue 40,641 37,369 36,073 8.8% 3.6%
Employees 14,276 13,699 12,963 4.2% 5.7%
Borrowing costs 531 393 444 35.1% (11.5%)
Materials and contract expenses
13,104 12,831 14,476 2.1% (11.4%)
Depreciation and amortisation 8,334 8,900 8,581 (6.4%) 3.7%
Other expenses 3,497 2,885 2,396 21.2% 20.4%
Total expenses 39,742 38,708 38,860 3.5% (0.4%)
Operating result 899 (1,339) (2,787) 144.4% 52.0%
Table 2 - Items excluded from Income Statement
Excluded items ($’000)
2011 2010 2009
Grants and contributions for capital purposes 3,206 3,751 4,607
Gain on recognition of interest-free loan 0 480 0
Increase (Decrease) in the fair value of investments 314 190 (538)
Impairments 305 0 0
Singleton Council Page 32
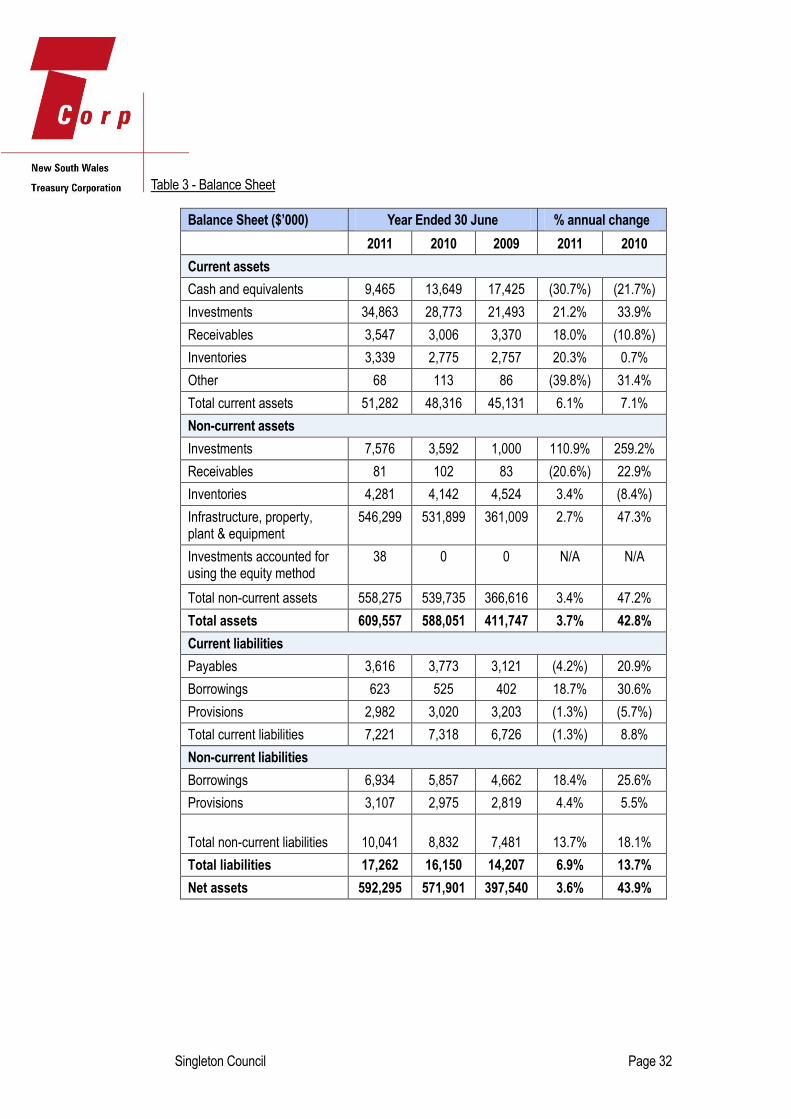
Table 3 - Balance Sheet
Balance Sheet ($’000) Year Ended 30 June % annual change
2011 2010 2009 2011 2010
Current assets
Cash and equivalents 9,465 13,649 17,425 (30.7%) (21.7%)
Investments 34,863 28,773 21,493 21.2% 33.9%
Receivables 3,547 3,006 3,370 18.0% (10.8%)
Inventories 3,339 2,775 2,757 20.3% 0.7%
Other 68 113 86 (39.8%) 31.4%
Total current assets 51,282 48,316 45,131 6.1% 7.1%
Non-current assets
Investments 7,576 3,592 1,000 110.9% 259.2%
Receivables 81 102 83 (20.6%) 22.9%
Inventories 4,281 4,142 4,524 3.4% (8.4%)
Infrastructure, property, plant & equipment
546,299 531,899 361,009 2.7% 47.3%
Investments accounted for using the equity method
38 0 0 N/A N/A
Total non-current assets 558,275 539,735 366,616 3.4% 47.2%
Total assets 609,557 588,051 411,747 3.7% 42.8%
Current liabilities
Payables 3,616 3,773 3,121 (4.2%) 20.9%
Borrowings 623 525 402 18.7% 30.6%
Provisions 2,982 3,020 3,203 (1.3%) (5.7%)
Total current liabilities 7,221 7,318 6,726 (1.3%) 8.8%
Non-current liabilities
Borrowings 6,934 5,857 4,662 18.4% 25.6%
Provisions 3,107 2,975 2,819 4.4% 5.5%
Total non-current liabilities 10,041 8,832 7,481 13.7% 18.1%
Total liabilities 17,262 16,150 14,207 6.9% 13.7%
Net assets 592,295 571,901 397,540 3.6% 43.9%
Singleton Council Page 33
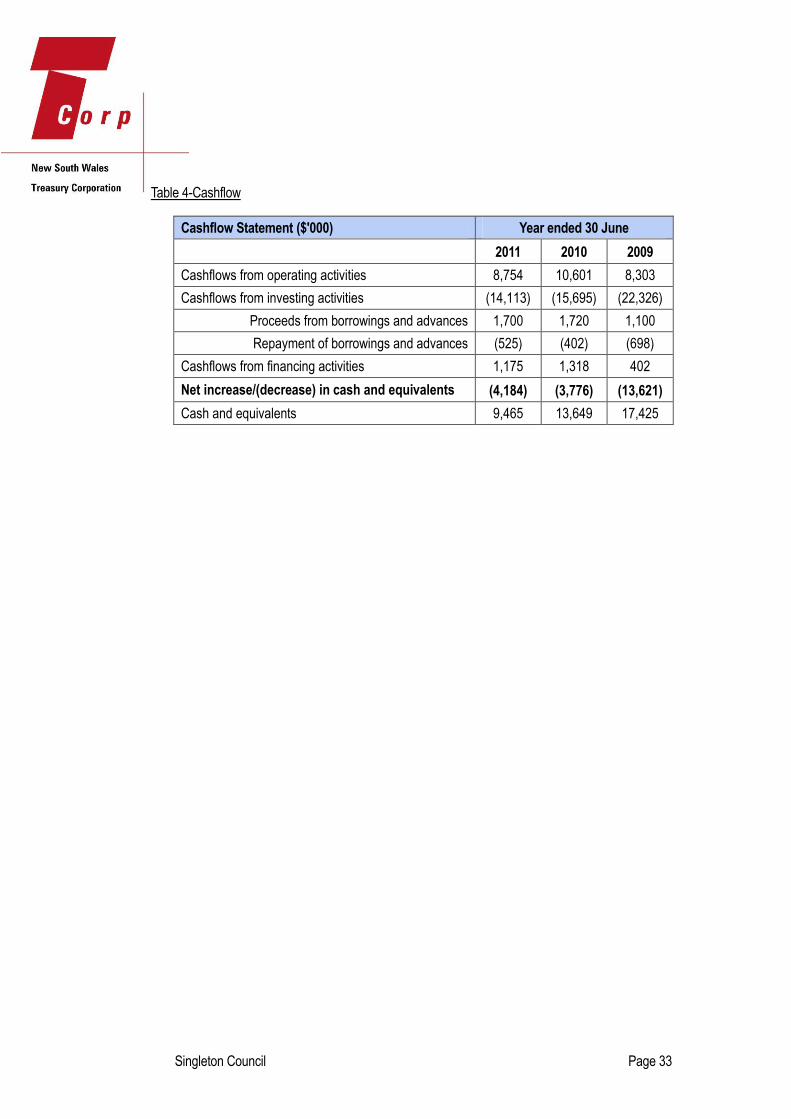
Table 4-Cashflow
Cashflow Statement ($'000) Year ended 30 June
2011 2010 2009
Cashflows from operating activities 8,754 10,601 8,303
Cashflows from investing activities (14,113) (15,695) (22,326)
Proceeds from borrowings and advances 1,700 1,720 1,100
Repayment of borrowings and advances (525) (402) (698)
Cashflows from financing activities 1,175 1,318 402
Net increase/(decrease) in cash and equivalents (4,184) (3,776) (13,621)
Cash and equivalents 9,465 13,649 17,425
Singleton Council Page 34
Appendix B Glossary
Asset Revaluations
In assessing the financial sustainability of NSW councils, IPART found that not all councils reported
assets at fair value.1 In a circular to all councils in March 20092, DLG required all NSW councils to
revalue their infrastructure assets to recognise the fair value of these assets by the end of the 2009/10
financial year.
Collateralised Debt Obligation (CDO)
CDOs are structured financial securities that banks use to repackage individual loans into a product that
can be sold to investors on the secondary market.
In 2007 concerns were heightened in relation to the decline in the “sub-prime” mortgage market in the
USA and possible exposure of some NSW councils, holding CDOs and other structured investment
products, to losses.
In order to clarify the exposure of NSW councils to any losses, a review was conducted by the DLG with
representatives from the Department of Premier and Cabinet and NSW Treasury.
A revised Ministerial investment Order was released by the DLG on 18 August 2008 in response to the
review, suspending investments in CDOs, with transitional provisions to provide for existing investments.
Division of Local Government (DLG)
DLG is a division of the NSW Department of Premier and Cabinet and is responsible for local
government across NSW. DLG’s organisational purpose is “to strengthen the local government sector”
and its organisational outcome is “successful councils engaging and supporting their communities”.
Operating within several strategic objectives DLG has a policy, legislative, investigative and program
focus in matters ranging from local government finance, infrastructure, governance, performance,
collaboration and community engagement. DLG strives to work collaboratively with the local government
sector and is the key adviser to the NSW Government on local government matters.
Depreciation of Infrastructure Assets
Linked to the asset revaluations process stated above, IPART’s analysis of case study councils found
that this revaluation process resulted in sharp increases in the value of some council’s assets. In some
cases this has led to significantly higher depreciation charges, and will contribute to higher reported
operating deficits.
1IPART “Revenue Framework for Local Government” December 2009 p.83
2 DLG “Recognition of certain assets at fair value” March 2009
Singleton Council Page 35
EBITDA
EBITDA is an acronym for “earnings before interest, taxes, depreciation, and amortisation”. It is often
used to measure the cash earnings that can be used to pay interest and repay principal.
Grants and Contributions for Capital Purposes
Councils receive various capital grants and contributions that are nearly always 100% specific in nature.
Due to the fact that they are specifically allocated in respect of capital expenditure they are excluded from
the operational result for a council in TCorp’s analysis of a council’s financial position.
Grants and Contributions for Operating Purposes
General purpose grants are distributed through the NSW Local Government Grants Commission. When
distributing the general component each council receives a minimum amount, which would be the
amount if 30% of all funds were allocated on a per capita basis. When distributing the other 70%, the
Grants Commission attempts to assess the extent of relative disadvantage between councils. The
approach taken considers cost disadvantage in the provision of services on the one hand and an
assessment of revenue raising capacity on the other.
Councils also receive specific operating grants for one-off specific projects that are distributed to be spent
directly on the project that the funding was allocated to.
Independent Commission Against Corruption (ICAC)
ICAC was established by the NSW Government in 1989 in response to growing community concern
about the integrity of public administration in NSW.
The jurisdiction of the ICAC extends to all NSW public sector agencies (except the NSW Police Force)
and employees, including government departments, local councils, members of Parliament, ministers,
the judiciary and the governor. The ICAC's jurisdiction also extends to those performing public official
functions.
Independent Pricing and Regulatory Tribunal (IPART)
IPART has four main functions relating to the 152 local councils in NSW. Each year, IPART determines
the rate peg, or the allowable annual increase in general income for councils. They also review and
determine council applications for increases in general income above the rate peg, known as “Special
Rate Variations”. They approve increases in council minimum rates. They also review council
development contributions plans that propose contribution levels that exceed caps set by the
Government.
Infrastructure Backlog
Infrastructure backlog is defined as the estimated cost to bring infrastructure to a satisfactory standard,
measured at a particular point in time. It is unaudited and stated within Special Schedule 7 that
accompanies the council’s audited annual financial statements.
Singleton Council Page 36
Integrated Planning and Reporting (IP&R) Framework
As part of the NSW Government’s commitment to a strong and sustainable local government system, the
Local Government Amendment (Planning and Reporting) Act 2009 was assented on 1 October 2009.
From this legislative reform the IP&R framework was devised to replace the former Management Plan
and Social Plan with an integrated framework. It also includes a new requirement to prepare a long-term
Community Strategic Plan and Resourcing Strategy. The other essential elements of the new framework
are a Long-Term Financial Plan (LTFP), Operational Plan and Delivery Program and an Asset
Management Plan.
Local Government Cost Index (LGCI)
The LGCI is a measure of movements in the unit costs incurred by NSW councils for ordinary council
activities funded from general rate revenue. The LGCI is designed to measure how much the price of a
fixed “basket” of inputs acquired by councils in a given period compares with the price of the same set of
inputs in the base period. The LGCI is measured by IPART.
Net Assets
Net Assets is measured as total assets less total liabilities. The Asset Revaluations over the past years
have resulted in a high level of volatility in many councils’ Net Assets figure. Consequently, in the short
term the value of Net Assets is not necessarily an informative indicator of performance. In the medium to
long term however, this is a key indicator of a council’s capacity to add value to its operations. Over time,
Net Assets should increase at least in line with inflation plus an allowance for increased population and/or
improved or increased services. Declining Net Assets is a key indicator of the council’s assets not being
able to sustain ongoing operations.
Roads and Maritime Services (RMS)
The NSW State Government agency with responsibility for roads and maritime services, formerly the
Roads and Traffic Authority (RTA).
Section 64 Contribution
Development Servicing Plans (DSPs) are made under the provisions of Section 64 of the Local
Government Act 1993 and Sections 305 to 307 of the Water Management Act 2000.
DSPs outline the developer charges applicable to developments for Water, Sewer and Stormwater
within each Local Government Area.
Section 94 Contribution
Section 94 of the Environmental Planning and Assessment Act 1979 allows councils to collect
contributions from the development of land in order to help meet the additional demand for community
and open space facilities generated by that development.
It is a monetary contribution levied on developers at the development application stage to help pay for
additional community facilities and/or infrastructure such as provision of libraries; community facilities;
open space; roads; drainage; and the provision of car parking in commercial areas.
Singleton Council Page 37
The contribution is determined based on a formula which should be contained in each council's
Section 94 Contribution Plan, which also identifies the basis for levying the contributions and the works
to be undertaken with the funds raised.
Special Rate Variation (SRV)
A SRV allows councils to increase general income above the rate peg, under the provisions of the Local
Government Act 1993. There are two types of special rate variations that a council may apply for:
a single year variation (section 508(2)) or
a multi-year variation for between two to seven years (section 508A).
The applications are reviewed and approved by IPART.
Singleton Council Page 38
Ratio Explanations
Asset Maintenance Ratio
Benchmark = Greater than 1.0x
Ratio = actual asset maintenance / required asset maintenance
This ratio compares actual versus required annual asset maintenance, as detailed in Special Schedule 7.
A ratio of above 1.0x indicates that the council is investing enough funds within the year to stop the
infrastructure backlog from growing.
Building and Infrastructure Renewals Ratio
Benchmark = Greater than 1.0x
Ratio = Asset renewals / depreciation of building and infrastructure assets
This ratio compares the proportion spent on infrastructure asset renewals and the asset’s deterioration
measured by its accounting depreciation. Asset renewal represents the replacement or refurbishment of
existing assets to an equivalent capacity or performance as opposed to the acquisition of new assets or
the refurbishment of old assets that increase capacity or performance.
Cash Expense Cover Ratio
Benchmark = Greater than 3.0 months
Ratio = current year’s cash and cash equivalents / (total expenses – depreciation – interest costs) * 12
This liquidity ratio indicates the number of months a council can continue paying for its immediate
expenses without additional cash inflow.
Capital Expenditure Ratio
Benchmark = Greater than 1.1x
Ratio = annual capital expenditure / annual depreciation
This indicates the extent to which a council is forecasting to expand its asset base with capital
expenditure spent on both new assets, and replacement and renewal of existing assets.
Debt Service Cover Ratio (DSCR)
Benchmark = Greater than 2.0x
Ratio = operating results before interest and depreciation (EBITDA) / principal repayments (from the
statement of cash flows) + borrowing interest costs (from the income statement)
This ratio measures the availability of cash to service debt including interest, principal and lease
payments
Singleton Council Page 39
Infrastructure Backlog Ratio
Benchmark = Less than 0.02x
Ratio = estimated cost to bring assets to a satisfactory condition (from Special Schedule 7) / total
infrastructure assets (from Special Schedule 7)
This ratio shows what proportion the backlog is against total value of a council’s infrastructure.
Interest Cover Ratio
Benchmark = Greater than 4.0x
Ratio = EBITDA / interest expense (from the income statement)
This ratio indicates the extent to which a council can service its interest bearing debt and take on
additional borrowings. It measures the burden of the current interest expense upon a council’s operating
cash.
Operating Ratio
Benchmark = Better than negative 4%
Ratio = (operating revenue excluding capital grants and contributions – operating expenses) / operating
revenue excluding capital grants and contributions
This ratio measures a council’s ability to contain operating expenditure within operating revenue.
Own Source Operating Revenue Ratio
Benchmark = Greater than 60%
Ratio = rates, utilities and charges / total operating revenue (inclusive of capital grants and contributions)
This ratio measures the level of a council’s fiscal flexibility. It is the degree of reliance on external funding
sources such as operating grants and contributions. A council’s financial flexibility improves the higher the
level of its own source revenue.
Unrestricted Current Ratio
Benchmark = 1.5x (taken from the IPART December 2009 Revenue Framework for Local Government
report)
Ratio = Current assets less all external restrictions / current liabilities less specific purpose liabilities
Restrictions placed on various funding sources (e.g. Section 94 developer contributions, RMS
contributions) complicate the traditional current ratio because cash allocated to specific projects are
restricted and cannot be used to meet a council’s other operating and borrowing costs. The Unrestricted
Current Ratio is specific to local government and is designed to represent a council’s ability to meet debt
payments as they fall due.