Embed Size (px)
Citation preview
Assessment and Benchmarking Programme
Case Study
NZTE Result and Performance Measurement
System
November 2012
2
Contents
FOREWORD ........................................................................................................................... 4
Acknowledgements .................................................................................................................. 4
EXECUTIVE SUMMARY ......................................................................................................... 5
A SYSTEM DESCRIPTION .................................................................................................. 6
1. Introduction to New Zealand Trade and Enterprise ....................................................... 6
1.1 NZTE mandate ........................................................................................................................ 6
1.2 NZTE strategy ......................................................................................................................... 7
1.3 Result and performance measurement system: the logical framework................................ 8
2. Design of the measurement system .............................................................................. 9
2.1 Objectives ............................................................................................................................... 9
2.2 Structure and hierarchy of measures ..................................................................................... 9
2.3 Dashboards ........................................................................................................................... 10
3. Measurement collection and reporting ......................................................................... 14
3.1 Sources of information ......................................................................................................... 14
3.2 Process of recording and verification ................................................................................... 15
3.3 Definition of baselines and targets ...................................................................................... 15
3.4 Attribution and time lags between activities and results .................................................... 15
4. Using results and performance information ................................................................. 16
4.1 Dashboards as effective management and control tools .................................................... 16
4.2 Use of results to assess allocation of resources, budget and plans ..................................... 17
4.3 Result measurement system and staff assessment ............................................................. 18
B SYSTEM DEVELOPMENT AND IMPLEMENTATION PROCESS .................................. 19
5. Clear determination of purpose ................................................................................... 19
6. Definition of vision and strategy ................................................................................... 20
6.1 Leadership ............................................................................................................................ 20
6.2 Coordinating team................................................................................................................ 20
6.3 Support infrastructure .......................................................................................................... 21
6.4 Developing and testing prototypes ...................................................................................... 21
6.5 Cascading to all areas and levels of the organization .......................................................... 22
6.6 Communication, training and guidelines ............................................................................. 22
6.7 Learning and improvement process ..................................................................................... 22
C. CONCLUSIONS ............................................................................................................. 23
7. Benefits and lessons ................................................................................................... 23
3
7.1 Benefits experienced so far .................................................................................................. 23
7.2 Lessons learned .................................................................................................................... 24
8 What next? .................................................................................................................. 25
Appendix I: NZTE set of KPIs ............................................................................................... 26
Table 1 One Team Dashboard ................................................................................................................. 13
Table 2 International Team Dashboard .................................................................................................... 13
Table 3 Customer Team Dashboard ........................................................................................................ 13
Table 4 Sources of Information ................................................................................................................ 14
Figure 1 NZTE Purpose and Focus............................................................................................................ 6
Figure 2 NZTE Result and Performance Measurement System: Logical Framework ............................... 8
Figure 3 Key Performance Indicators (KPIs) .............................................................................................. 9
Figure 4 Cascading down from the Statement of Intent ........................................................................... 11
Figure 5 NZTE Dashboard – June 2012 .................................................................................................. 12
Figure 6 Corporate values ........................................................................................................................ 18
Figure 7 The change process ................................................................................................................... 21
4
FOREWORD
The International Trade Centre (ITC) established the Assessment and Benchmarking programme to
help Trade Promotion Organizations (TPOs) improve their performance. The programme developed a
specific model and system of assessment that benchmarks actual practices of TPOs through a set of
225 indicators of good practice organized in four main areas: leadership and direction; resources and
processes; products and service delivery; and measurement and results. The ability to compare
practices and results is recognized as a valuable tool for improving performance. However, TPOs
wanting to compare their practice and performance have been hindered by a lack of information from
comparable organizations. By establishing a set of relevant measures and benchmarks, ITC’s
Assessment and Benchmarking programme allows TPOs to benefit from the knowledge and experience
of their peers. Learning from others with similar challenges enhances and accelerates the process of
performance improvement.
The programme developed not only a model of assessment, but also a self-assessment questionnaire,
a data processing and scoring system, a standard reporting format, service delivery guidelines and a
specially designed web platform to access all features of the system as well as information and
resources to support participating TPOs in their process of change.
This paper is the first in a series of case studies on specific examples of good practice applied by
leading TPOs. The study presents the process followed and the features adopted by a leading TPO to
successfully develop and implement a result measurement system, a key area that determines the
performance of any TPO.
The purpose of the study is to serve as an example and inspiration as well as to encourage other TPOs
to undertake the efforts that are necessary to develop their own system. The study does not intend to
offer a template that can be copied as each TPO should develop its own system responding to its own
needs and its own strategy. The study concentrates more on the process followed and the challenges
involved as well as the great benefits that can be obtained from a well-designed and well-functioning
result measurement system.
Note
Since the publication of this report, NZTE has continued to refine its understanding and measurement of
impact on both individual firms and the performance of its Focus 500 portfolio. NZTE is embracing new
technologies and analytic approaches to more actively manage their customers and deliver the right
services at the right time. Results measurement is a dynamic journey and continuous improvement is
essential to maximise impact and deliver towards the New Zealand Government’s goal of increasing
exports to GDP to 40% by 2025.
Acknowledgements
This case study was completed by Mr José Prunello, Chief Trade Support Institutions Strengthening,
International Trade Centre, with the invaluable support in New Zealand Trade and Enterprise (NZTE) of
Ms Megan Hurnard, Director Performance and Evaluation.
The International Trade Centre wishes to thank the Chief Executive Officer, management and staff of
NZTE who provided information, insights, expertise and time to contribute to the success of this case
study.
5
EXECUTIVE SUMMARY
New Zealand Trade and Enterprise (NZTE) has developed a result and performance measurement
system that is fit for purpose and well designed. Measurement, collection and reporting processes are
robust, consistent and reliable and the system regularly generates valuable information on the
organization´s performance - and on client satisfaction - that is analysed and used effectively to manage
and improve operations. The process of development and implementation of the performance
measurement system has already produced tangible benefits for the organization and provides useful
insights and lessons that could be of use to other trade promotion organizations (TPOs).
NZTE´s result and performance measurement system is based on clear and specific objectives fully
aligned with the organization´s mandate and strategy. The system is integrated into a result framework
using a clear, related and balanced hierarchy of measures (e.g. inputs – outputs – impact – outcome)1
that are cascaded to all levels of the organization.
The organization has comprehensive collection and reporting processes. Measurement units and
collection frequency are clearly defined and the organization has developed guidelines and
implemented the necessary controls and training to ensure the consistency and reliability of the
information to be reported. Measurement is embedded in the organization as a core business process.
Targets for all measures and indicators have been defined mostly based on quality historical data. The
system builds on existing and well-proven systems of customer relationship management, financial
management, customer surveys and staff surveys and takes into account time lags between activities
and effects and between different levels of the hierarchy. Moreover, the organization has consistent
processes to register and prove attribution where needed.
The organization analyses and uses the results effectively. The system enables the Chief Executive
Officer (CEO), the management team, the Board of Directors and the Government to assess how the
organization is advancing towards the achievement of its strategic goals. Moreover, it allows teams and
individual staff members to assess their progress against specific deliverables and goals.
The process of change has benefited from the strong leadership of the CEO and his management team,
in close collaboration with NZTE´s main stakeholders, notably the levels of Government to which the
organization reports. Development and implementation took more than 18 months under the
coordination of two staff members who worked almost exclusively to drive the project, but also with the
involvement of all categories of staff across the organization.
Development of the system continues but the organization has already experienced tangible benefits
including higher visibility and credibility, a clear sense of direction for staff and stakeholders, an
improvement in the process of staff performance evaluation and useful information to guide the
allocation of resources and the management of operations. The experience also provides interesting
insights and lessons to other TPOs interested in developing their own result measurement systems
including issues related to transparency, leadership, clarity of objectives and strategy, balance in the set
of indicators, the importance of integrity management and staff behaviour and the management of the
change process.
1 This report uses the terminology used by NZTE that, in some aspects, varies slightly from the terminology used
by ITC.
6
A SYSTEM DESCRIPTION
1. Introduction to New Zealand Trade and Enterprise
1.1 NZTE mandate
New Zealand Trade and Enterprise (NZTE) is a Crown Agency established under the NZTE Act 2003
following the merger of Industry New Zealand and the New Zealand Trade Development Board. The
organization is governed by a Board and responds to the Minister for Economic Development and the
Minister of Trade. NZTE, in August 2012, employed around 500 full-time equivalent (FTE) staff of which
43% is placed overseas. More than 70% of all staff is engaged in customer-facing activities.
The NZTE Act clearly specifies the mandate and main purpose of the organization:
To support the development of internationally competitive New Zealand (NZ) business
To facilitate the development and implementation of strategies, programmes, and activities for
trade, industry, and regional development as directed by the Government.2
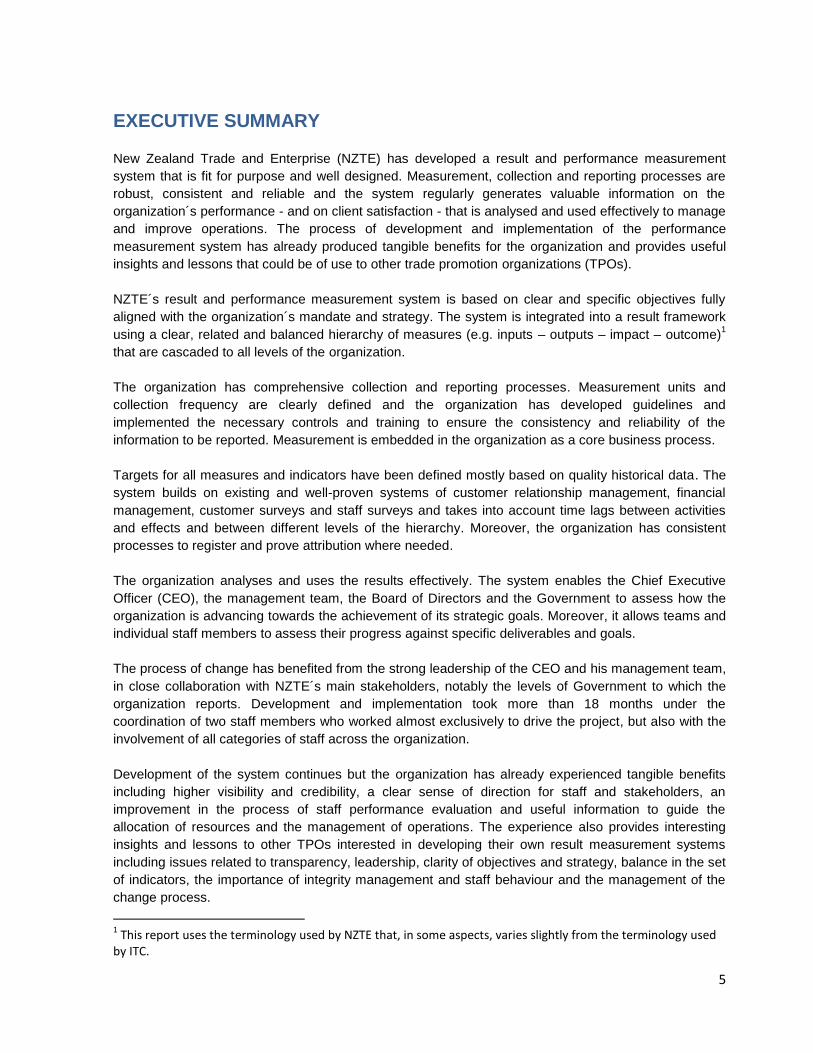
NZTE has chosen to express this mandate through a clear organizational purpose statement:
To unleash the international potential of New Zealand businesses to build the nation’s lasting prosperity.
Figure 1: NZTE Purpose and Focus
Based on this mandate, the organization determines the main focus of its activities through a document
called the Statement of Intent (SOI). The SOI is a binding document that commits the organization to
deliver specific outputs and outcomes in exchange for the resources received. In this respect, the SOI,
the Act and the organizational strategy are fundamental documents that are at the basis of NZTE´s
result measurement system.
2 New Zealand Trade and Enterprise Act of 2003.
7
The current SOI, established for the period 2012-2015, specifies three main categories of activities
(output classes) for NZTE:
Services to develop business capability, including those activities directed at improving the
competitiveness and export capability of firms
International business growth services, including trade promotion, outward investment support
and foreign direct investment attraction
Services to support sector development and special events also referred to as ‘high impact
programmes’ (HIPs).
It is worth noting that these output classes, as well as the revision of the subsequent set of result and
performance measures, were refreshed in 2010 and 2011 through a joint project carried out between
NZTE and the Ministry for Economic Development (MED) (now the Ministry for Business, Innovation
and Employment (MBIE)) in close consultation with the Treasury. This collaboration is extremely
important as it demonstrates how NZTE developed its result and performance measurement system in
close collaboration with the primary agency (MBIE) responsible both for its funding and for evaluating
NZTE’s performance.
1.2 NZTE strategy
In order to carry out its mandate and deliver its outcomes, NZTE has developed a strategy that has
three main lines:
Targeted services for a designated range of internationalising companies (intensive engagement
with 500 high growth potential customers, and ‘light touch’ services to an additional 1,500
customers)
Targeted services for groups of related companies, through multi-customer high impact
programmes (HIPs)
Targeted activity in key markets, as outlined in the NZ-Inc (multi-agency) country strategies.
It is important to note that NZTE focuses its activity on a group of approximately 2000 firms, with 500 of
these receiving more intensive services. Engagement occurs individually or in groups through the
preparation and execution of international business development plans (“engagement plans”) that could
involve a suite of different services throughout different stages of their internationalization. Services may
involve the support of other New Zealand agencies (“NZ-Inc”) as well as support to attract capital or
invest abroad, depending on customer needs.
‘Improvement challenges’
To support the effective and efficient delivery of this strategy, NZTE developed a three-year (2011/12;
2012/13 and 2013/14) performance improvement work programme structured around a series of
‘improvement challenges’. The improvement challenges cover both internally and externally focused
changes, from engaging with customers and service development, through to developing the
organization’s people and processes. All are intended to enable NZTE to deliver better against its
purpose of unleashing the international potential of New Zealand businesses.
8
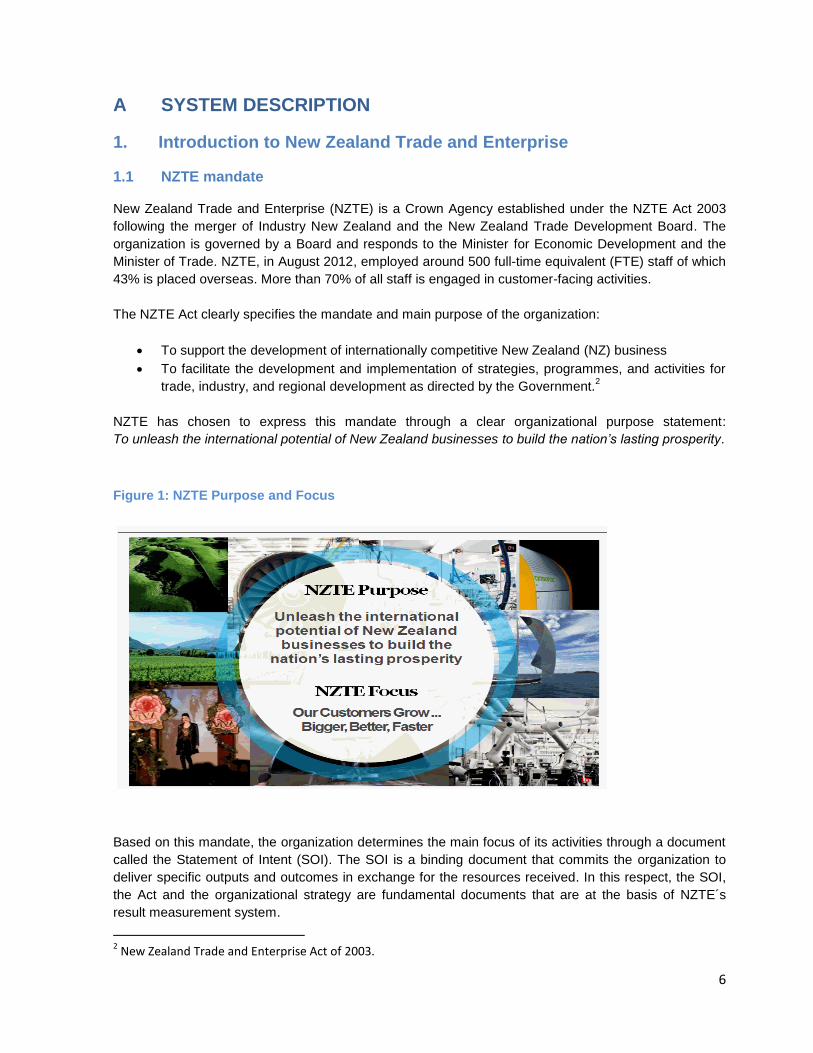
1.3 Result and performance measurement system: the logical framework
NZTE has developed its result and performance measurement system to be fully consistent with the
organization’s mandate and strategy. The system is integrated into a complete framework that relates
efficiency and effectiveness and links inputs to desired outputs, outcomes and impact. Indeed, this was
one of the main concerns of the joint NZTE-MBIE-Treasury team that developed and decided on the
main set of key performance indicators (KPIs) on which the system is built.
The project team started from the organizational mandate (purpose), revised the main output classes,
considered the main lines of the corporate strategy and, from this base, subsequently developed the
indicators that best fitted the framework. The framework provides a snapshot of how NZTE activities
contribute to the government’s key economic development priority.3 The framework introduces the way
that NZTE will demonstrate its contribution opening the way to the definition of KPIs.
Figure 2: NZTE Result and Performance Measurement System: Logical Framework
3 The Framework included in this report uses the terminology used by NZTE that, in some aspects, varies slightly
from the terminology used by ITC.
Government key priority Build a more productive and competitive economy
NZTE outcome Increased business internationalization for NZTE customers
NZTE impacts
Enhanced business
management capability
Increased international revenue for NZTE
customers
How NZTE will demonstrate
its effectiveness
Percentage of
businesses that have
changed or intend to
make changes to
improve their businesses
as a result of their
interaction with a
Regional Partner
*Annual growth in international revenue for
NZTE’s intensively account-managed
customers
*Total value of investment deals effected with
NZTE involvement
*Case studies completed show that NZTE
activities demonstrate positive net economic
impact for New Zealand
NZTE output classes
Services to develop
business capability
International
business
growth services
Services to support
sector development
and special events
9
2. Design of the measurement system
2.1 Objectives
Result and performance measurement systems normally serve a multiplicity of purposes. The three
main objectives of NZTE’s system can be summarized as:
Assessing value: Measuring the impact or effectiveness in delivering the organization’s main
purpose of increasing the international growth of NZ business
Managing internal drivers: Following key operational and enabling factors or ‘internal
engines’, including values and behaviours, that are necessary to support change and deliver on
the purpose
Measuring efficiency factors: Ensuring productivity and the highest possible value for the
resources that the Government invests through the organization.
In terms of managing the internal drivers, the system supports leadership in the provision of a strong sense of direction to all staff in relation to where the organization adds value and where it wants to go. Clarity of direction should support motivation and the behaviour that will be necessary to reach the intended results.
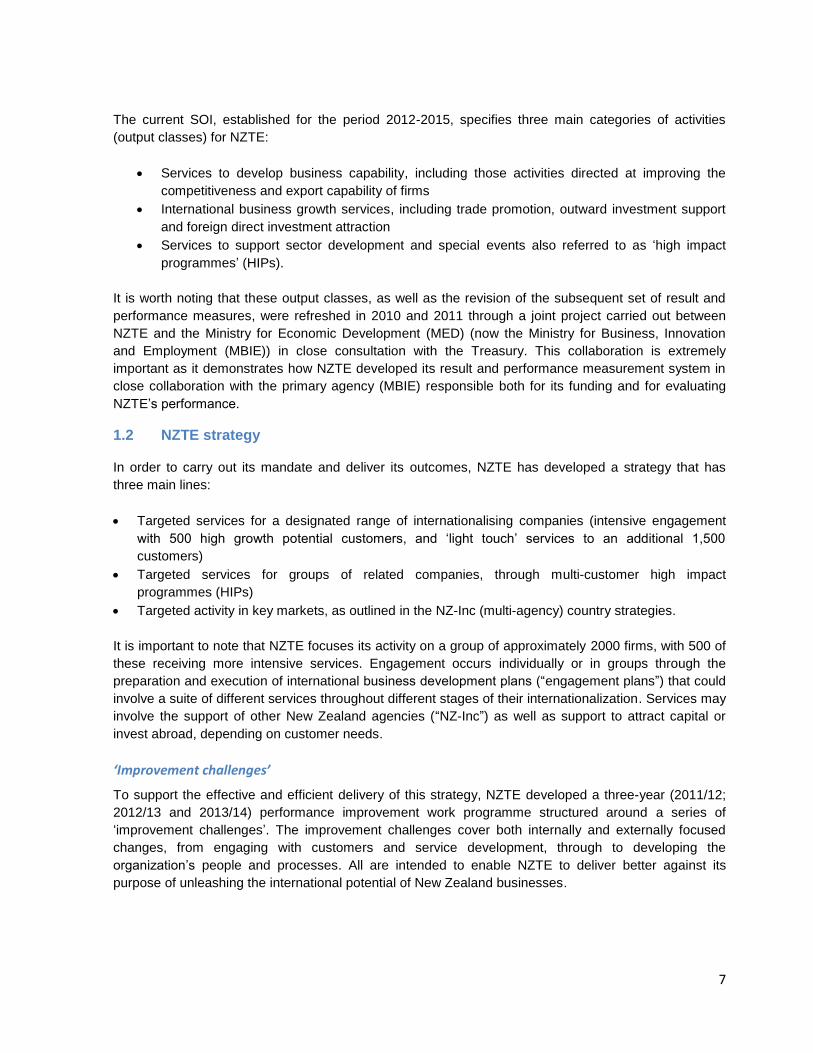
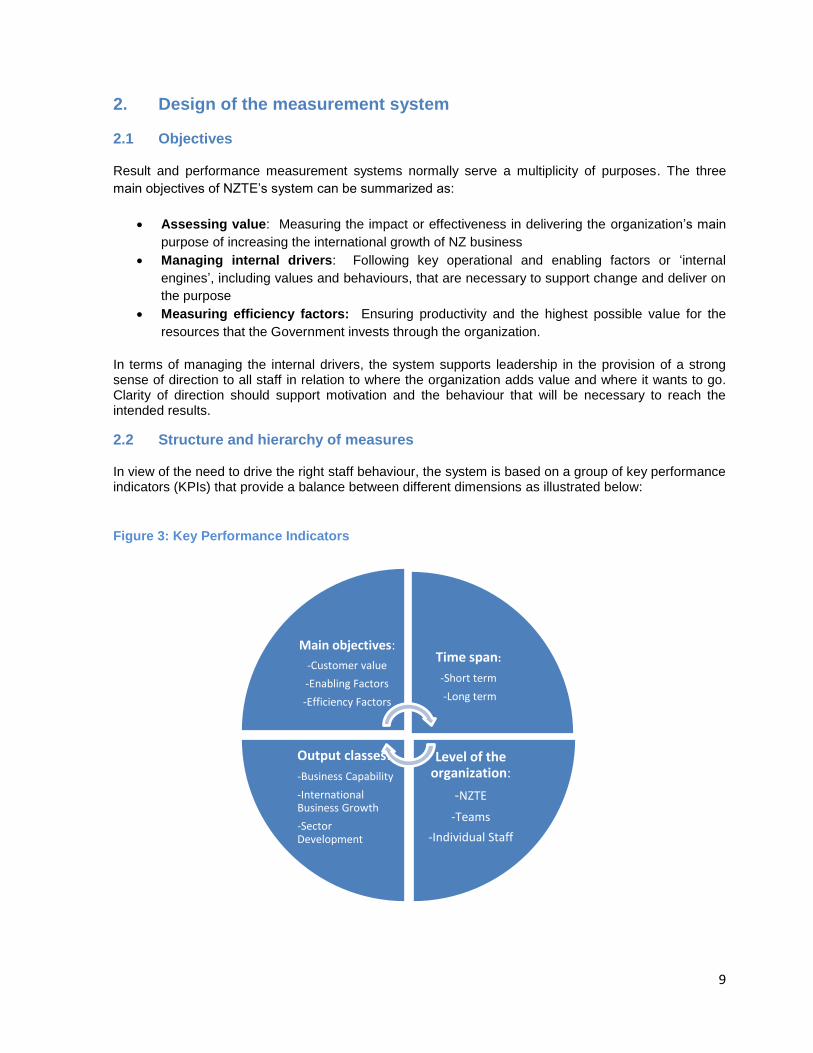
2.2 Structure and hierarchy of measures
In view of the need to drive the right staff behaviour, the system is based on a group of key performance indicators (KPIs) that provide a balance between different dimensions as illustrated below:
Figure 3: Key Performance Indicators
Main objectives:
-Customer value
-Enabling Factors
-Efficiency Factors
Time span:
-Short term
-Long term
Level of the organization:
-NZTE
-Teams
-Individual Staff
Output classes:
-Business Capability
-International Business Growth
-Sector Development
10
The organization has thus developed a suite of KPIs4 that tries to balance the different dimensions of
the system. The intention is to provide a balanced set of signals to drive staff behaviour and to support
organizational change. Some indicators point at short-term goals like those related to process
improvement (improvement challenges); others are more related to mid- to long-term goals like
customer value (customer export growth and deals closed with NZTE assistance); other indicators
encourage teamwork (through the definition of team objectives). Yet others look at encouraging staff to
work with customers in the development of more medium- to long-term business objectives (like the
ones measuring the implementation of high impact programmes and other commercial outcomes).
Many KPIs have an overall organizational dimension (‘One Team’), others have a team dimension and
there is also the specification of goals at individual staff level to emphasize the contribution that each
staff member and each team makes to the achievement of the overall organizational goals.
A closer look at the suite of KPIs will help to understand how they point to the different dimensions.
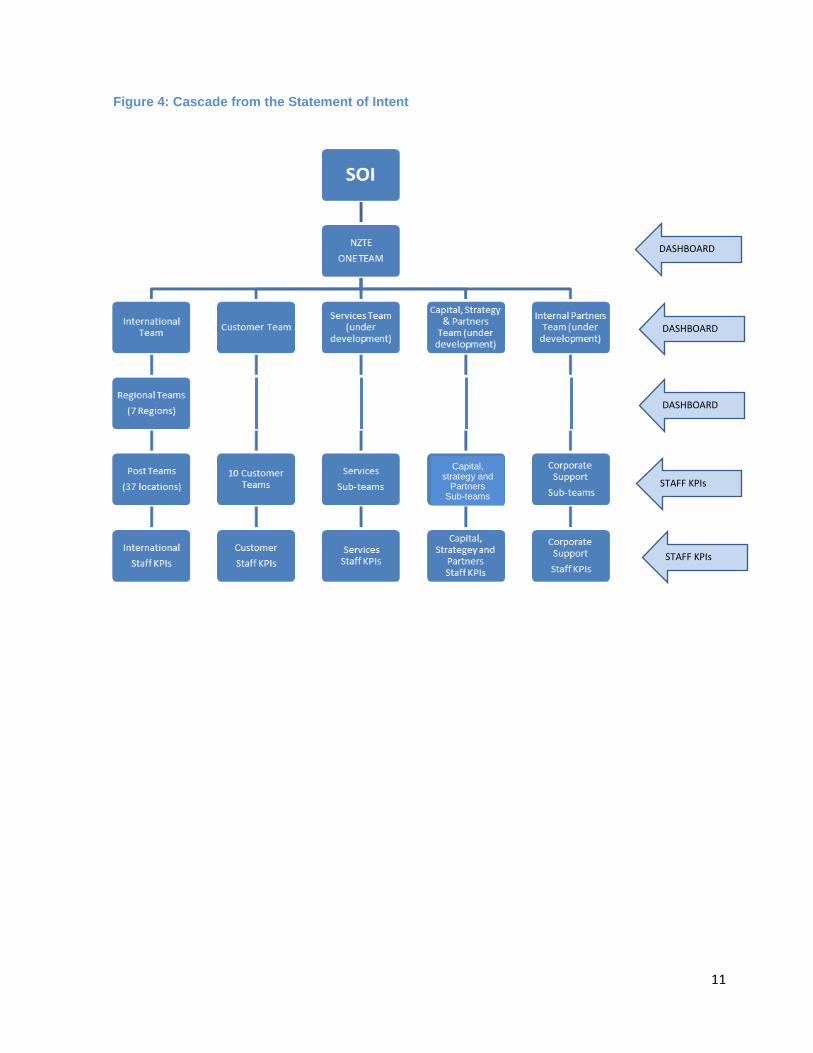
2.3 Dashboards
The system of KPIs is organized and presented in a set of ‘dashboards’ that roughly follows the NZTE
organizational structure and provides a practical and quick visual reference for the organization. The
Statement of Intent (SOI) specifies the outputs and outcomes that NZTE is expected to deliver during a
given period. The system of KPIs is directly derived from the SOI and it is cascaded down for NZTE as
a whole (One Team dashboard), for teams (group/team dashboards) and increasingly for each
individual staff member (individual performance plans). As a result, the contribution of each staff
member be tracked back up to the outputs and outcomes specified in the SOI and, ultimately, to the
overall purpose of the organization.
4 Appendix I includes a more detailed description and definition of each of the KPIs
11
Figure 4: Cascade from the Statement of Intent
STAFF KPIs
DASHBOARD
DASHBOARD
DASHBOARD
STAFF KPIs
Capital, strategy and
Partners Sub-teams
12
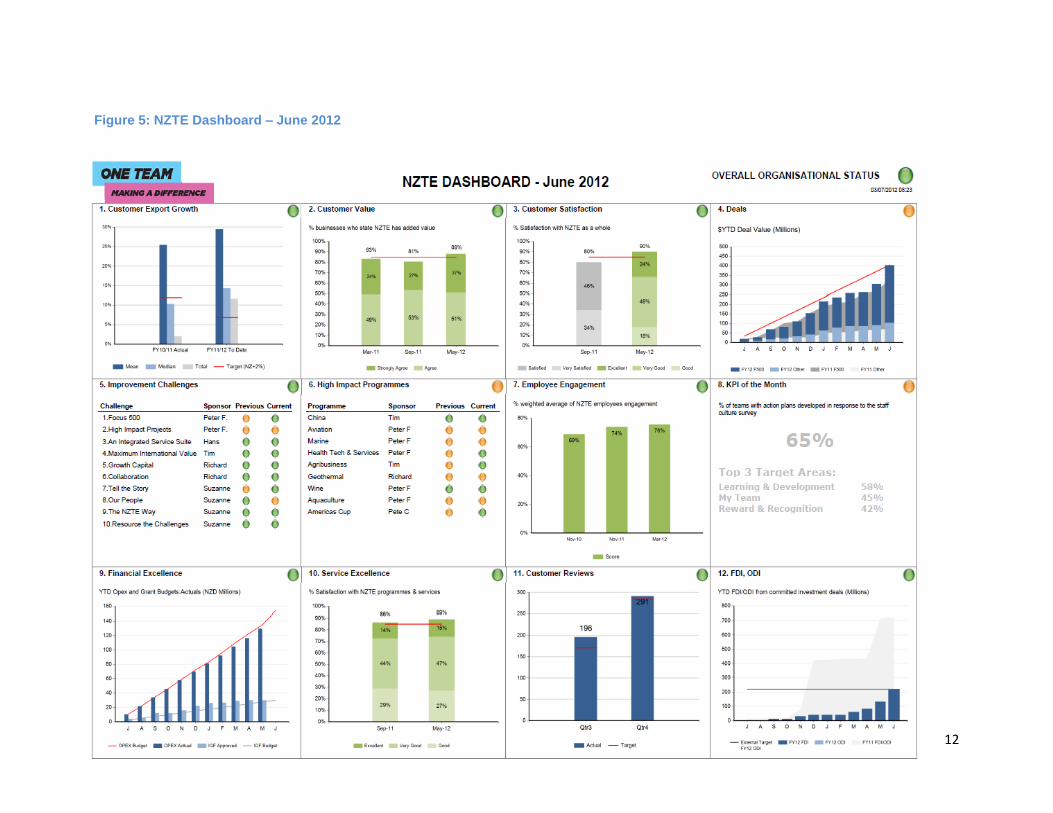
Figure 5: NZTE Dashboard – June 2012
13
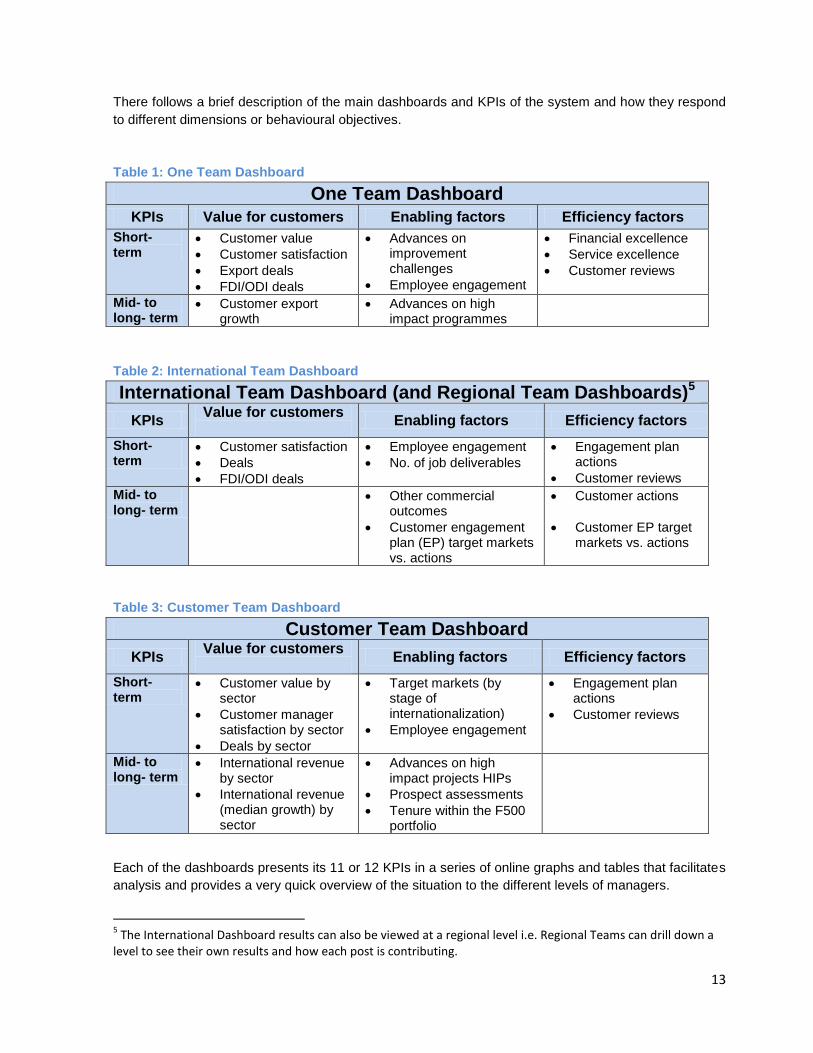
There follows a brief description of the main dashboards and KPIs of the system and how they respond
to different dimensions or behavioural objectives.
Table 1: One Team Dashboard
One Team Dashboard KPIs Value for customers Enabling factors Efficiency factors
Short- term
Customer value
Customer satisfaction
Export deals
FDI/ODI deals
Advances on improvement challenges
Employee engagement
Financial excellence
Service excellence
Customer reviews
Mid- to long- term
Customer export growth
Advances on high impact programmes
Table 2: International Team Dashboard
International Team Dashboard (and Regional Team Dashboards)5
KPIs Value for customers
Enabling factors Efficiency factors
Short- term
Customer satisfaction
Deals
FDI/ODI deals
Employee engagement
No. of job deliverables
Engagement plan actions
Customer reviews
Mid- to long- term
Other commercial outcomes
Customer engagement plan (EP) target markets vs. actions
Customer actions
Customer EP target markets vs. actions
Table 3: Customer Team Dashboard
Customer Team Dashboard
KPIs Value for customers
Enabling factors Efficiency factors
Short- term
Customer value by sector
Customer manager satisfaction by sector
Deals by sector
Target markets (by stage of internationalization)
Employee engagement
Engagement plan actions
Customer reviews
Mid- to long- term
International revenue by sector
International revenue (median growth) by sector
Advances on high impact projects HIPs
Prospect assessments
Tenure within the F500 portfolio
Each of the dashboards presents its 11 or 12 KPIs in a series of online graphs and tables that facilitates
analysis and provides a very quick overview of the situation to the different levels of managers.
5 The International Dashboard results can also be viewed at a regional level i.e. Regional Teams can drill down a
level to see their own results and how each post is contributing.
14
3. Measurement collection and reporting
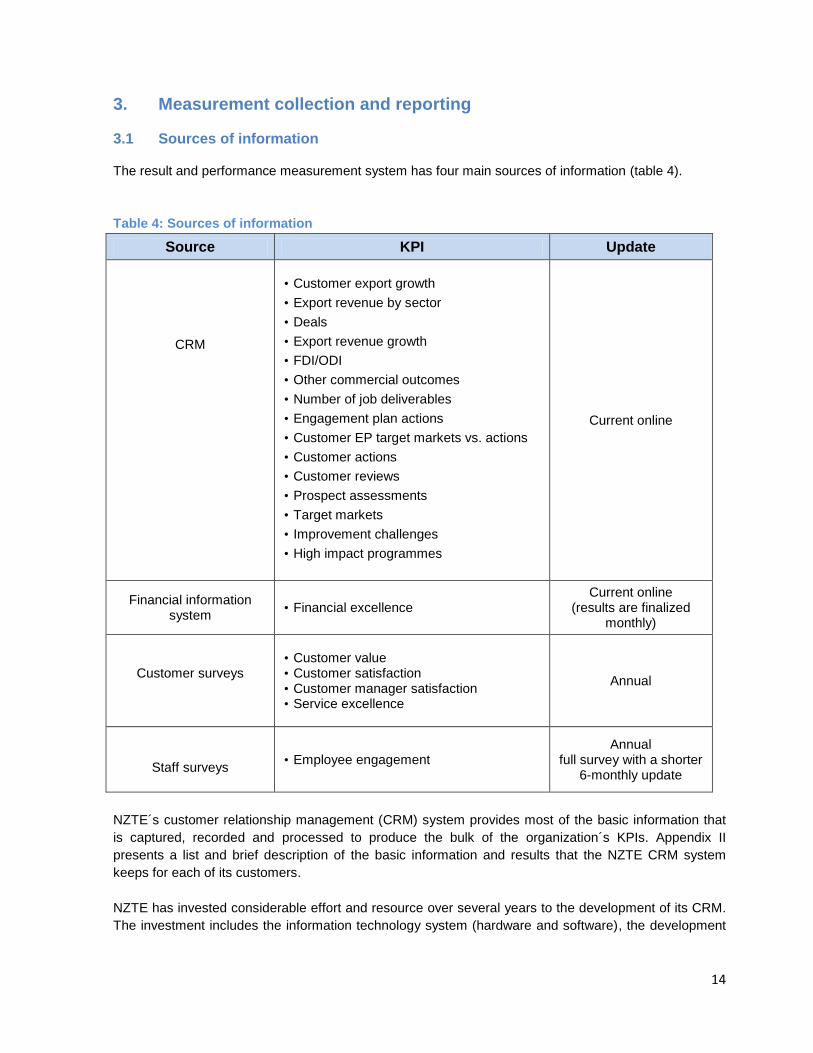
3.1 Sources of information
The result and performance measurement system has four main sources of information (table 4).
Table 4: Sources of information
Source KPI Update
CRM
• Customer export growth
• Export revenue by sector
• Deals
• Export revenue growth
• FDI/ODI
• Other commercial outcomes
• Number of job deliverables
• Engagement plan actions
• Customer EP target markets vs. actions
• Customer actions
• Customer reviews
• Prospect assessments
• Target markets
• Improvement challenges
• High impact programmes
Current online
Financial information system
• Financial excellence
Current online (results are finalized
monthly)
Customer surveys
• Customer value • Customer satisfaction • Customer manager satisfaction • Service excellence
Annual
Staff surveys
• Employee engagement
Annual full survey with a shorter
6-monthly update
NZTE´s customer relationship management (CRM) system provides most of the basic information that
is captured, recorded and processed to produce the bulk of the organization´s KPIs. Appendix II
presents a list and brief description of the basic information and results that the NZTE CRM system
keeps for each of its customers.
NZTE has invested considerable effort and resource over several years to the development of its CRM.
The investment includes the information technology system (hardware and software), the development
15
of service delivery guidelines and customer relationship protocols, and internal communications and
training to ensure a consistent level of recording and use by all staff.
3.2 Process of recording and verification
The organization has paid substantial attention to developing clear guidelines and definitions to ensure
proper and consistent recording of customer financial data (revenues) and results of NZTE assistance
(deals, other commercial outcomes, FDI/ODI). In general, the recording of a customer’s basic
information, financial data and results of NZTE assistance is done directly in the CRM by:
Customer managers
International business development managers
Service team managers (of special capacity-building programmes like Better by Lean, Better by
Strategy, Beachheads)
To avoid survey fatigue, managers try, to the largest extent possible, to obtain result information (leads,
deals, FDI/ODI deals and other commercial outcomes) through as many indirect sources as possible
before consulting the customer for confirmation. However, customer-facing staff maintain relationships
with their customers with regular communication, so ultimately the information can be obtained directly
from the business in New Zealand or from their in-market staff or partners (local staff, agents,
representatives, distributors, etc.) overseas.
Registration of results must be backed by supporting records that detail the activities that NZTE carried
out for the customer that are directly linked with the result. Records are verified by team leaders (for
customer managers) and post and regional managers (for international business development staff),
and a record is made in the CRM in a special field (progress/results).
The Director of Performance and Evaluation conducts regular quality checks by cross-checking the
information. The integrity and accuracy of results (leads, deals, FDI/ODI deals and other commercial
outcomes) are further controlled by:
An independent internal steering group specially created to check results
Internal auditor (Audit and Assurance Director)
Annual external auditor (Audit New Zealand)
All KPIs listed in NZTE’s Statement of Intent are subject to a full external audit by Audit New Zealand.
3.3 Definition of baselines and targets
NZTE has determined most targets for KPIs on the basis of improvements on historical results. In many
cases the organization has had relatively consistent results for several years and these faciltiate the
determination of the targets (e.g. customer satisfaction, financial excellence, service excellence). In
other cases, where the organization has changed the definition and determination of the indicators, the
setting of baselines and targets is more difficult (e.g. deals).
3.4 Attribution and time lags between activities and results
The ease and ability to demonstrate attribution differs across the suite of KPIs. The results measured in
terms of customer value, customer satisfaction, service excellence, employee engagement, financial
excellence as well as all those related to advances in the implementation of operations (improvement
16
challenges, HIPs, customer reviews, etc.) are directly linked to the activities/outputs and level of
performance of the organization. As a result, the attribution is more clear and direct.
The major challenges in terms of attribution are found (as for most trade support institutions) in
measuring the effects of NZTE outputs on the outcomes of its customers as well as its effects on the
economic performance of the country. For NZTE, the challenge is mostly centred on demonstrating the
level of NZTE’s contribution to customer export growth, deals and foreign direct investment/outward
direct investment (FDI/ODI) deals.
To demonstrate its contribution on deals and FDI/ODI, NZTE is able to use its records of
activities/outputs delivered to each customer. NZTE has been operating a relatively well-structured
CRM with information on activities delivered to each of its main customers for over three years.
Although the consistency of the information included in the CRM may vary, it could be said that, in
general, NZTE has sufficient records of its activities with its intensively-managed customers to be able
to trace back and link them to the results.
The greatest challenge for NZTE is to demonstrate its effective contribution to the export growth of its
group of approximately 500 high growth potential, intensively-managed customers. Here the level of
contribution is substantially less direct as export performance will depend on a large variety of factors
that are beyond the control of NZTE and, in many aspects, also beyond the control of the customers
themselves. However, NZTE still considers that this KPI is extremely important to measure both the
advances on the strategic purpose of contributing to the increased business internationalization of its
customers and also to measure advances towards the ultimate goal of contributing to the government
key priority of building a more productive and competitive economy (see the NZTE Result and
Performance Measurement System: logical framework shown previously). To overcome this challenge
and to improve on the estimation of the economic impact, NZTE has begun conducting case studies to
investigate in more detail the complex set of effects and causal relationships of its activities with
selected customers.
4. Using results and performance information
4.1 Dashboards as effective management and control tools
NZTE’s result measurement system has been instrumental in raising the profile and credibility of the
organization. It has also enabled the Government and the Board of Directors to be more confident about
how the organization is advancing towards the achievement of its strategic goals. The system has also
facilitated and sped up reporting processes.
NZTE’s CEO meets monthly with the Ministers of Economic Development and Trade and uses the
dashboard to assist with discussions around progress against the organization’s KPIs. There is
Ministerial interest in the links between activities, outputs and outcomes. Value for money or the return
that the Government gets on its investment through the organization is an important consideration – but
not the only factor. The Government is also interested in how NZTE is building business capability and
the effects this has on business productivity, along with the growth of New Zealand’s export economy.
Hence the importance of the KPIs beyond the ones centred on measuring export growth and deals.
These regular meetings help to focus on a particular issue through the analysis of its specific indicator.
NZTE has received positive feedback on the information to date.
17
In addition to regular meetings with the two Ministers, NZTE provides a weekly report with highlights on
activities and successes. The result measurement system also provides precise and concrete data for
requests for information or questions from Ministers and other Members of Parliament.
There has been an increase in the visibility of both the organization and in how and where NZTE is
making a difference. In addition, the system has helped to facilitate an increase in trust from the
Government and from the Board as it includes hard data based on clear definitions and obtained with
processes that are recognized as robust. The visibility of the organization has also increased among
other partner agencies and stakeholders. NZTE’s CEO has used the dashboard with other partner
agencies that have a more direct contact with NZTE (Ministry for Business, Innovation and Employment,
Ministry of Foreign Affairs and Trade, Ministry of Primary Industries, Tourism NZ and Education NZ).
The dashboard is part of the regular agenda for NZTE Board meetings. The result measurement system
improves Board confidence that the organization is actually implementing its workplans and is
advancing towards the achievement of its strategic goals. It is important also for the Board to ensure
that the organization complies with the objectives specified in the SOI.
The system is also used by the different levels of management to monitor how the organization is
delivering on its plan.
The CEO values the transparency, strong communicational value and motivational effect of the system.
It increases the level of accountability of everyone in the organization, starting with the CEO and
management team in relation to the Government and the Board. It exposes very clearly the degree of
implementation in and value added by all areas of the organization. In terms of leadership and
communication, the dashboard, with a smaller set of KPIs, helps to focus staff on the priorities for
action: ‘What’s measured gets done’. Indeed, the system has helped to improve behaviour and increase
the level of engagement of employees. Staff response has been generally positive as most valued the
contribution of the measurement system to clarify roles and responsibilities, provide a clearer sense of
direction, indicate what is important for senior management and help demonstrate their contribution and
successes.
General Managers (GMs) have indicated the value of the dashboard to highlight areas for improvement.
An example was the lack of consistency of service delivery across different areas of the organization.
The identification of this issue led to the development of clearer service delivery guidelines. Likewise,
the GM International has been able to better analyse the reasons behind the differences in results
across different regions and overseas posts by looking not only at issues related to staff performance,
but also at factors related to the portfolio of clients, services and markets.
4.2 Use of results to assess allocation of resources, budget and plans
The purpose and use of the result measurement system is pre-eminently operational with little effect on
the determination and review of the organizational strategy. However, in the long term, results in client
satisfaction and in achieving goals across different customer segments, services or markets will help
NZTE understand better where customers want to go and where NZTE can add more value. Therefore,
results might be useful in the future to refresh some aspects of the strategy.
In terms of allocation of resources, the International Team has already used analysis of data and results
to rearrange the allocation of resources between different regions and posts.
18
4.3 Result measurement system and staff assessment
NZTE’s result measurement system is cascaded by teams (see Dashboards) and increasingly trickled
down to all staff in the organization. Individual performance plans are designed to give all staff (a) a
clear understanding of what their contribution is to the results and performance of the organization and
(b) a high level of commitment to the types of behaviour that will contribute to the achievement of those
results. However, the particular set of KPIs included in each staff performance development plan
depends on the role and position within the organization. Staff assessment is structured in two
dimensions:
Demonstrated behaviour defined in terms of corporate values and evaluated by the reporting
manager
Achievement of deliverables, measured by individual staff KPIs.
Each of the two dimensions carries equal weight in the overall rating of staff performance.
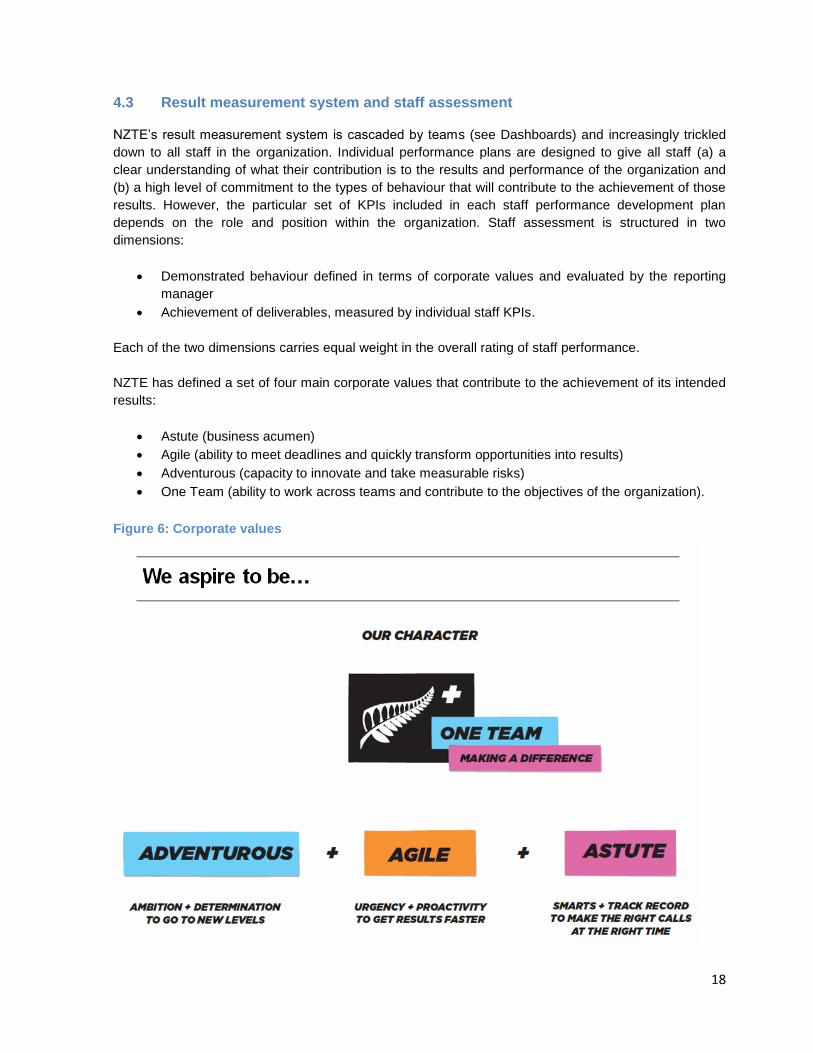
NZTE has defined a set of four main corporate values that contribute to the achievement of its intended
results:
Astute (business acumen)
Agile (ability to meet deadlines and quickly transform opportunities into results)
Adventurous (capacity to innovate and take measurable risks)
One Team (ability to work across teams and contribute to the objectives of the organization).
Figure 6: Corporate values
19
In terms of delivering results, each individual staff member is expected to contribute to around seven
KPIs, including two KPIs that are common to all staff in the organization:
Customer export growth
Customer satisfaction
The achievement of ‘employee engagement’ goals is also an important KPI added to the CEO, General
Managers and Directors using the ‘one-up responsibility’ principle (responsibility for the level of
engagement of staff under the direct responsibility of the position).
The other KPIs to be included in each staff assessment plan will depend on the team and position of the
employee. In the case of the Customer, International, Service and Capital teams, there are team
specific targets, depending on their area/sector/region/post. In the case of corporate support positions,
there are specific objectives depending on their respective functional areas and working plans.
Annual salary adjustments are related to performance ratings which, as mentioned, are derived from an
equal consideration of performance in terms of behaviour and delivery of results.
B SYSTEM DEVELOPMENT AND IMPLEMENTATION PROCESS
5. Clear determination of purpose
Although the organization began developing the current system of measurement in 2008, the process
accelerated and the system consolidated its current shape as a result of some key changes in 2010/11,
which included new leadership in the organization, an external performance improvement assessment
of NZTE, and a review of the organization´s output classes and corresponding performance measures.
The States Services Commission (SSC) is the New Zealand Government’s department in charge of
appointing and performance monitoring public service chief executives. They also have a role in
ensuring the good performance of public agencies. Since late 2009, the Department of the Prime
Minister and Cabinet (DPMC), the Treasury and the SSC have been jointly entrusted by the
Government with conducting performance improvement assessments of public agencies within a
programme known as the Performance Improvement Framework (PIF).
The PIF for NZTE was conducted during the second half of 2010 and the report completed and
published in May 20116. The PIF undertakes a review of the agency´s fitness-for-purpose not only for
today, but also for the future. It assessment looks at what the agencies do well and what are their major
issues and weaknesses, to prepare an action plan for improvement.
The PIF was important for the development of the measurement system because it highlighted issues
related to leadership and workforce development, clarity around vision, strategy and purpose, culture
and values, and customer focus that the measurement system is now addressing.
The Output Class Review and Performance Measures project was undertaken by a joint team with
representatives from the Ministry of Economic Development (now MBIE), the Treasury and NZTE from
6 Performance Improvement Framework, Formal Review: New Zealand Trade and Enterprise, State Services
Commission, the Treasury, and the Department of the Prime Minister and Cabinet. Wellington, New Zealand May 2011. ISBN 978-0-478-36148-3, Web address: www.ssc.govt.nz/pif
20
August 2010 until early 2011. The project reviewed and simplified NZTE´s output class structure and
identified the basis of the performance measures necessary to monitor the effective delivery of those
outputs. The project analysed and integrated the findings of a number of other studies and surveys
including customer surveys, consultations with internal and external stakeholders, studies on the
estimation of direct economic impact, cost allocation surveys, strategy review workshops, etc. The
process was collaborative between the three main agencies, had clear objectives and deliverables, and
was tightly managed as a project.
The Output Class Review and Performance Measures project established a clear outputs and outcomes
framework that is at the very core of the system of KPIs. It delivered not only a revised and simplified
set of output classes, providing NZTE with flexibility to respond to changing market conditions and
business needs, but also a set of the main key performance indicators to be developed by NZTE.
6. Definition of vision and strategy
The PIF and the output class review were supported by a refreshment of the organization’s vision and
strategy. The starting point was the Government’s Business Growth Agenda and, in particular, the
aspiration of lifting the export economy from 30% to 40% of GDP by 2025. The NZTE vision was
refreshed to make it highly aspirational. Called the “Greatest Imaginable Challenge” (GIC), it aims to
double the export growth of NZTE’s customers by 2015. Starting from this challenge, the strategy
concentrated on focusing on 500 high growth potential customers, working with groups of customers in
high impact projects, and increasing the coordination and collaboration with other NZ agencies. The
result measurement system further reflects these strategic objectives.
6.1 Leadership
Change would have not taken place without the firm support of the Government, the Board and the
CEO who provided strong direction and leadership behind the process.
The Government has placed a great deal of importance in improving the justification and the
performance of the public sector through clear identification of the purpose and outcomes of each
agency.
On taking over the organization in September 2010, the new CEO gave priority to measuring and
evaluating performance in order to understand the impact of NZTE activities, to make key operational
decisions and to ensure more efficiency and effectiveness. In his own words: ‘What’s measured, gets
done”. He made sure that the priority was clearly understood in all areas and levels of the organization.
6.2 Coordinating team
It is difficult to assess the additional FTE (full time equivalent) time dedicated by the large number of
staff who participated in the development process, over a period of approximately 18 months, from CEO
to Customer Managers and Business Development Managers in the International Team.
The performance measurement system is managed by the Performance and Evaluation team with
technical support from the Information Technology (IT) team In addition, many other people across the
organization contributed to the development. Cross-team involvement is seen as an essential element
in building commitment towards performance measurement becoming a key part of NZTE’s DNA.
21
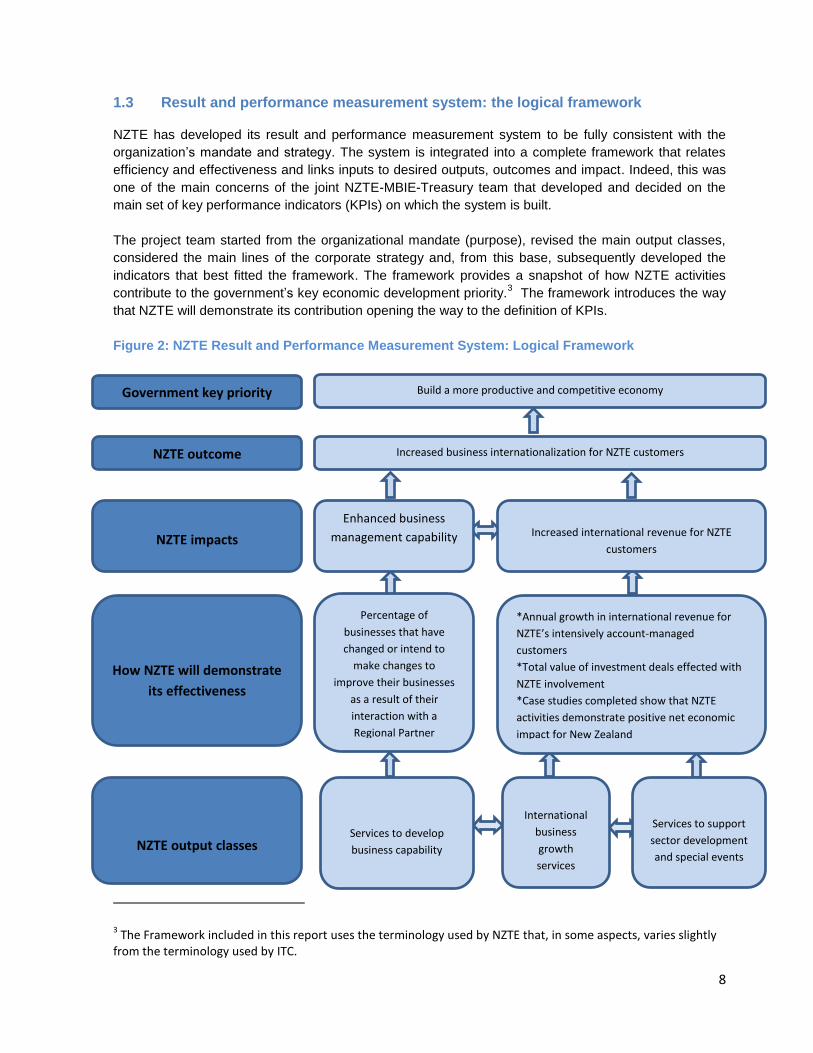
6.3 Support infrastructure
NZTE took a strategic view of its application stack, redesigning and modernizing the core systems to
better support the organization. NZTE was able to leverage this investment by extending both the
application stack and infrastructure to support a business intelligence implementation. This has enabled
NZTE to present its performance information in a visual way, through the use of dashboards. The entire
process (which took at least 18 months) included the preparation of a ‘data warehouse’ to translate the
information supplied by the CRM, the finance section and the customer and staff surveys into
accessible data that could later on be analysed and used to build the reporting tables that integrate the
dashboard.
However, this infrastructure supports more than just the dashboards. It provides the foundation for a
core part of NZTE’s information management and enables the organization to undertake deeper
analysis of the information that sits behind the high-level KPIs.
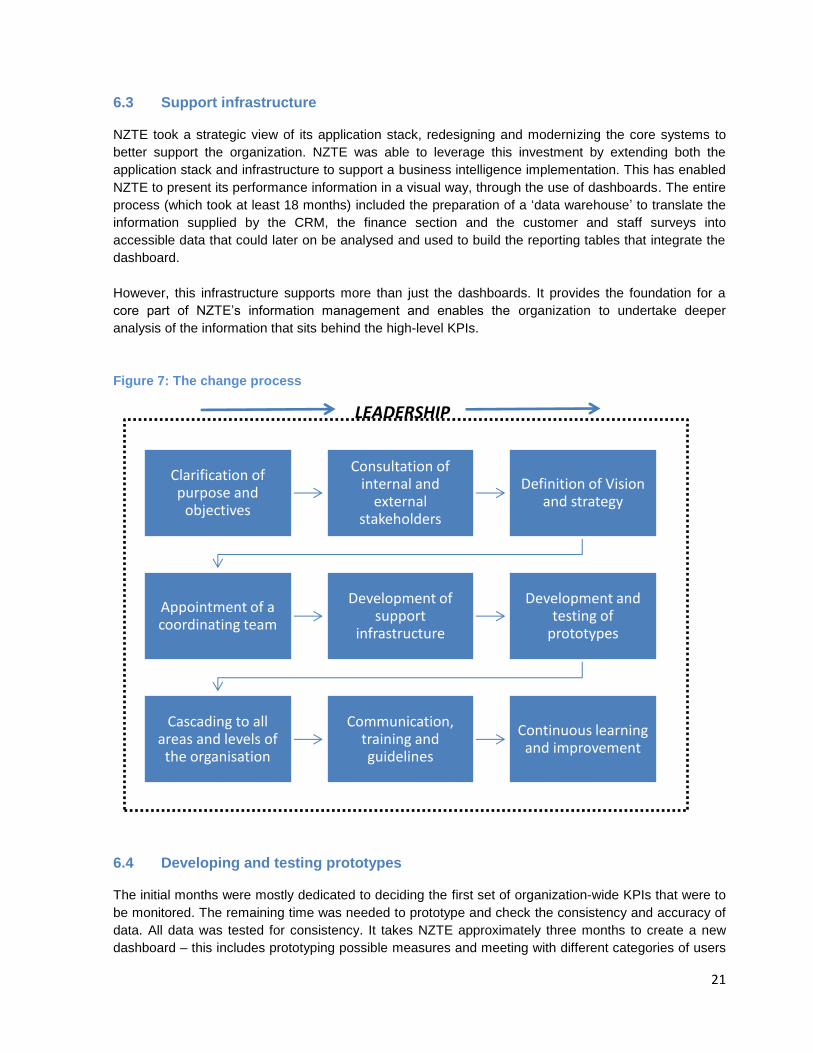
Figure 7: The change process
6.4 Developing and testing prototypes
The initial months were mostly dedicated to deciding the first set of organization-wide KPIs that were to
be monitored. The remaining time was needed to prototype and check the consistency and accuracy of
data. All data was tested for consistency. It takes NZTE approximately three months to create a new
dashboard – this includes prototyping possible measures and meeting with different categories of users
Clarification of purpose and
objectives
Consultation of internal and
external stakeholders
Definition of Vision and strategy
Appointment of a coordinating team
Development of support
infrastructure
Development and testing of
prototypes
Cascading to all areas and levels of the organisation
Communication, training and guidelines
Continuous learning and improvement
LEADERSHIP
22
in an iterative process of trials and decisions on the best type of information and shape. There were at
least 30 different prototypes of the main One Team dashboard with different trials until management
and staff felt comfortable with the current version. Good collaboration between all areas of the business
was instrumental to ensure the success of the project.
6.5 Cascading to all areas and levels of the organization
Once the initial One Team or organization-wide set of KPIs was developed and organized in a
dashboard, the coordinating team worked with organizational teams, as well as with Human Resources
(HR), to cascade the system. As at mid-2012, some teams had advanced more than others. The
International Team was ahead in the definition of their KPIs at different levels (total team, regional
teams and post teams), followed by the Customer Team. The Capital, Strategy & Partners, Services
and Internal Partners teams were next to develop their KPIs and dashboards.
The staff performance assessment process has also been redesigned to reflect the new priorities and
the new set of objectives. HR developed the new staff assessment form and prepared the
corresponding guidelines. The new system of staff performance is to be implemented during the July
2012/June 2013 financial year.
6.6 Communication, training and guidelines
The change process has been supported at each quarterly update conducted by the CEO. He has also
used his weekly blog on the intranet of the organization to emphasise the new priorities and to support
the implementation of the system. General Managers in charge of the main teams have also used their
quarterly team updates and reviews to support the implementation process.
HR has conducted training for managers who have staff management responsibilities on how to conduct
the new staff performance assessment process.
Presentations and guidelines were developed to specify definition of the indicators and to ensure a clear
understanding of roles and responsibilities by all staff, mainly the client-facing staff in charge of
registration and control of the information. The process was supported by training, including online
sessions and webinars for offshore staff.
There was some initial resistance from staff who looked at the system as a compliance need. However,
this view changed as the system became operational and the advantages more evident. With the
support of communication and training, staff could see how they could use the system to focus their
work and to demonstrate their contribution and effectiveness. Recent staff engagement surveys have
demonstrated this change in perceptions.
6.7 Learning and improvement process
The result and performance measurement system of NZTE has been in operation with its new format
and presentation since mid-2011 in the three main dashboards: One Team, International Team (with the
addition of the regional and post team set of KPIs) and Customer Team. However, the system has been
evolving with new derivations and features. Currently IT, International Growth Fund and Capital Team
dashboards are under development. The full implications of the system on staff performance should be
felt during the July 2012/June 2013 financial year, with the introduction of a new performance evaluation
system.

23
The experience of NZTE demonstrates the advantages of starting the process and allowing it to evolve
as the organization gains confidence in its use. It has been a continuous learning and improvement
process that started several years ago and accelerated during 2011 and 2012. Many of the benefits
became evident quite quickly, encouraging the Board, management and staff to continue their efforts
and to constantly improve the system.
C. CONCLUSIONS
7. Benefits and lessons
The application of the NZTE result and performance measurement system was started during the
financial year July 2011/June 2012 and continued with new added features during the first quarter of the
financial year 2012/13. Despite the relatively short period of implementation, the organization has
already experienced relatively clear benefits and identified important lessons that could be of interest to
other trade promotion organizations.
7.1 Benefits experienced so far
Increased visibility, as NZTE has been able to raise its profile with major stakeholders and
partners.
More credibility, thanks to the provision of well-substantiated data about its results and
performance supported by clear and transparent information on its methodology.
Clearer system which enables the Board of Directors and the Government to more closely
follow the activities, advances and results of NZTE, thus avoiding surprises.
Stronger sense of direction for staff to focus on what is important and what are the strategic
priorities, as reflected in the most recent staff engagement surveys. KPIs are an
unequivocal indication of the link between activities and the intended objectives of those
activities.
Stronger focus on delivering. The regular monitoring of key indicators has given staff an
incentive to be more diligent and implement the activities necessary to drive better results.
Results so far support this theory.
Higher motivation, as demonstrated in more recent staff engagement surveys, as staff see
more clearly the link between their individual work and the results/benefits generated.
More objective system to assess staff performance. As staff incorporate quantitative and
qualitative targets, the process of assessing staff performance becomes less subject to
interpretation and more centred on the achievement of goals.
Greater facility for regular and ad hoc reporting. The availability of well-structured
information on results and performance generated by the system made reporting to
shareholders and stakeholders more efficient and less time-consuming.
Clarity on which areas of the organization are relatively weaker, less efficient or less
effective, and that need improvement. The system covers all areas of the organization
making its absolute and relative performance much more evident.
Better allocation of resources as information is available to help the Leadership Team
understand where and how the organization can achieve better results.
24
7.2 Lessons learned
Leadership and transparency
Good leadership is essential. It is not possible to undertake such a fundamental process of
development and change in the way in which an organization operates without a clear
message from government and top management that this is a high priority.
The system greatly enhances transparency and accountability at all levels of the
organization. Leadership should be fully aware of the consequences of applying a result
and performance measurement system. The whole organization becomes more
transparent, internally and externally. The establishment of goals and targets commits the
organization and exposes whether or not goals are being delivered.
Clarity of objectives
A clear understanding of the mandate and strategy is the starting point for any well-based
result measurement system. It is absolutely essential to have a clear idea of what is the
main purpose/role/mandate of the organization and what is the strategy that the
organization will put in place to reach that purpose.
A logical framework that links the strategy to the mandate as well as the activities to the
outputs, outcomes and impact, greatly facilitates the identification of the most appropriate
indicators of performance and results.
Balance of KPIs and staff behaviour
It is important that the system is cascaded down to individual staff members and is properly
linked to individual staff performance. This reinforces the benefits as staff can link their
individual contribution to the overall results of the organization, with positive effects on
motivation and delivery.
The selection of indicators will determine staff behaviour. The set of indicators should be
considered as a portfolio to ensure a certain balance between different objectives and
different intended behaviours. There could be indicators that point towards efficiency while
others point to effectiveness. The system could include indicators that point to short-term
results as well as those that point to intermediate or enabling factors that will ensure results
in the long term. There could be indicators that reflect the contribution of different areas or
levels of the organization and there could be indicators or mechanisms that support
individual efforts while others encourage teamwork.
Focus and direction
In spite of the need to establish a balanced suite of indicators, it is important to limit the
number of indicators to provide a clear message on the organization’s focus. There should
also be a balance between the need to provide different incentives and the need to provide
a strong focus and direction.
Integrity and attribution
It is important that the introduction of such a system be supported by the prior or
complementary promotion of ethical standards that encourage honest behaviour from staff
in recording their own results.
25
The system should also establish a proper system of verification and/or audit of results. It
might be desirable to consider these objectives within the regular internal and external audit
programmes of the organization.
Though not a pre-requisite, the availability of a customer relationship management (CRM)
system greatly facilitates the recording, processing and analysis of information. Moreover, a
CRM can greatly facilitate attribution as it could provide the evidence and linkages between
the activities or support provided to the customers and their results.
Attribution is challenging and there does not seem to be an easy answer to this issue. The
system will vary for each organization. NZTE is addressing the issue with the evidence that
can be provided through the activities registered in the CRM as well as through preparing
case studies to provide more details on causal relations and on impact.
Development and management of the change process
The introduction of a system should be complemented with appropriate guidelines and
training to ensure its effective and consistent application across the organization.
The introduction of a measurement system needs to be properly supported by a strong
internal communication strategy that highlights the importance and priority that the system
has for government and top management.
Collaboration between the trade promotion organization and its main shareholders and
stakeholders is important as those will be the main users or targets of the system.
The appointment of a dedicated team is important to ensure the necessary ownership and
technical capability for the development and introduction of a result and performance
measurement system. The team should be strongly supported by leadership to ensure
collaboration from the whole organization as the project team will need the support and
expertise of many areas in order to develop the system.
The process includes many stages and a set of trials and prototypes, but it is important to
make a start. Benefits will be evident quite quickly and the system should evolve within a
process of continuous learning and improvement.
8 What next?
Since the publication of this report, NZTE has continued to refine its understanding and measurement of
impact on both individual firms and the performance of its Focus 500 portfolio. NZTE is embracing new
technologies and analytic approaches to more actively manage their customers and deliver the right
services at the right time. Results measurement is a dynamic journey and continuous improvement is
essential to maximise impact and deliver towards the New Zealand Government’s goal of increasing
exports to GDP to 40% by 2025.
26
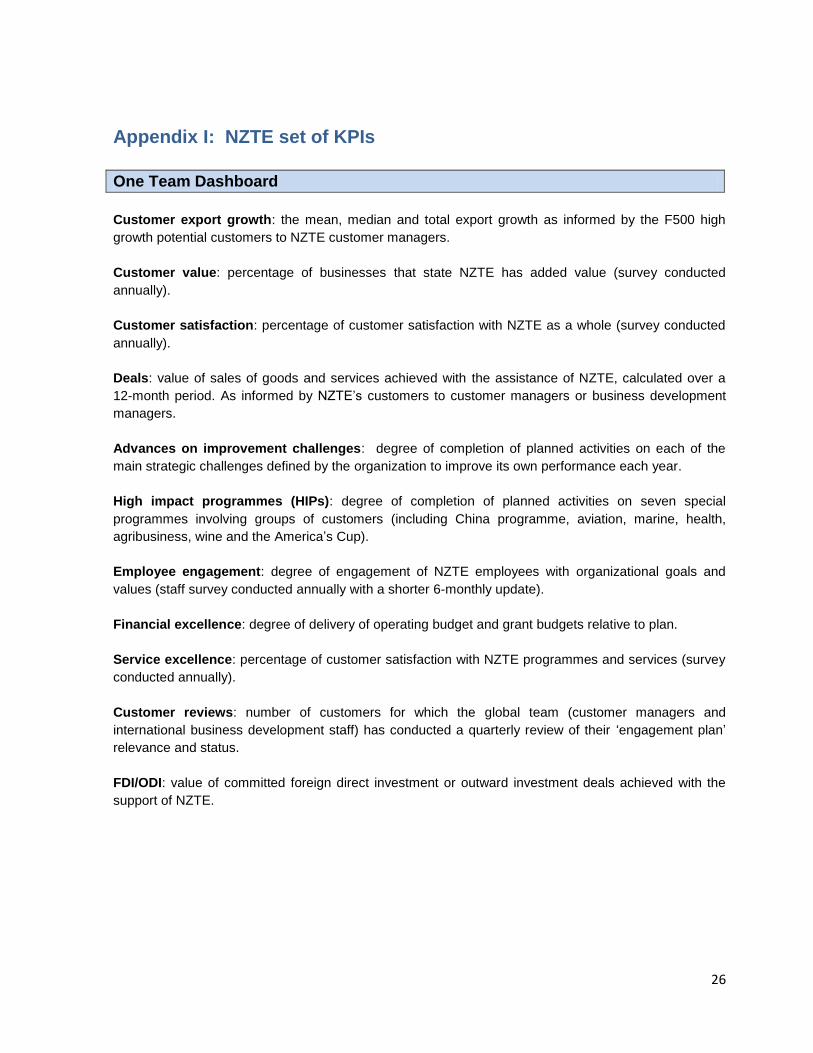
Appendix I: NZTE set of KPIs
One Team Dashboard
Customer export growth: the mean, median and total export growth as informed by the F500 high
growth potential customers to NZTE customer managers.
Customer value: percentage of businesses that state NZTE has added value (survey conducted
annually).
Customer satisfaction: percentage of customer satisfaction with NZTE as a whole (survey conducted
annually).
Deals: value of sales of goods and services achieved with the assistance of NZTE, calculated over a
12-month period. As informed by NZTE’s customers to customer managers or business development
managers.
Advances on improvement challenges: degree of completion of planned activities on each of the
main strategic challenges defined by the organization to improve its own performance each year.
High impact programmes (HIPs): degree of completion of planned activities on seven special
programmes involving groups of customers (including China programme, aviation, marine, health,
agribusiness, wine and the America’s Cup).
Employee engagement: degree of engagement of NZTE employees with organizational goals and
values (staff survey conducted annually with a shorter 6-monthly update).
Financial excellence: degree of delivery of operating budget and grant budgets relative to plan.
Service excellence: percentage of customer satisfaction with NZTE programmes and services (survey
conducted annually).
Customer reviews: number of customers for which the global team (customer managers and
international business development staff) has conducted a quarterly review of their ‘engagement plan’
relevance and status.
FDI/ODI: value of committed foreign direct investment or outward investment deals achieved with the
support of NZTE.
27
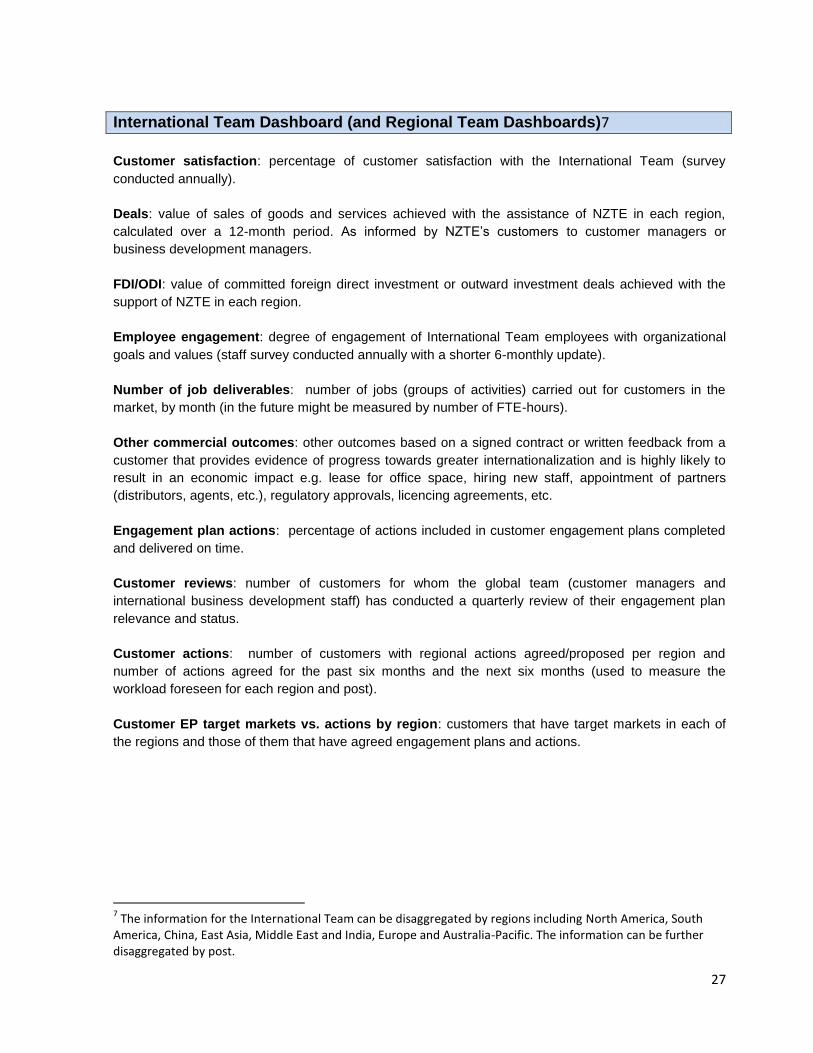
International Team Dashboard (and Regional Team Dashboards)7
Customer satisfaction: percentage of customer satisfaction with the International Team (survey
conducted annually).
Deals: value of sales of goods and services achieved with the assistance of NZTE in each region,
calculated over a 12-month period. As informed by NZTE’s customers to customer managers or
business development managers.
FDI/ODI: value of committed foreign direct investment or outward investment deals achieved with the
support of NZTE in each region.
Employee engagement: degree of engagement of International Team employees with organizational
goals and values (staff survey conducted annually with a shorter 6-monthly update).
Number of job deliverables: number of jobs (groups of activities) carried out for customers in the
market, by month (in the future might be measured by number of FTE-hours).
Other commercial outcomes: other outcomes based on a signed contract or written feedback from a
customer that provides evidence of progress towards greater internationalization and is highly likely to
result in an economic impact e.g. lease for office space, hiring new staff, appointment of partners
(distributors, agents, etc.), regulatory approvals, licencing agreements, etc.
Engagement plan actions: percentage of actions included in customer engagement plans completed
and delivered on time.
Customer reviews: number of customers for whom the global team (customer managers and
international business development staff) has conducted a quarterly review of their engagement plan
relevance and status.
Customer actions: number of customers with regional actions agreed/proposed per region and
number of actions agreed for the past six months and the next six months (used to measure the
workload foreseen for each region and post).
Customer EP target markets vs. actions by region: customers that have target markets in each of
the regions and those of them that have agreed engagement plans and actions.
7 The information for the International Team can be disaggregated by regions including North America, South
America, China, East Asia, Middle East and India, Europe and Australia-Pacific. The information can be further disaggregated by post.
28
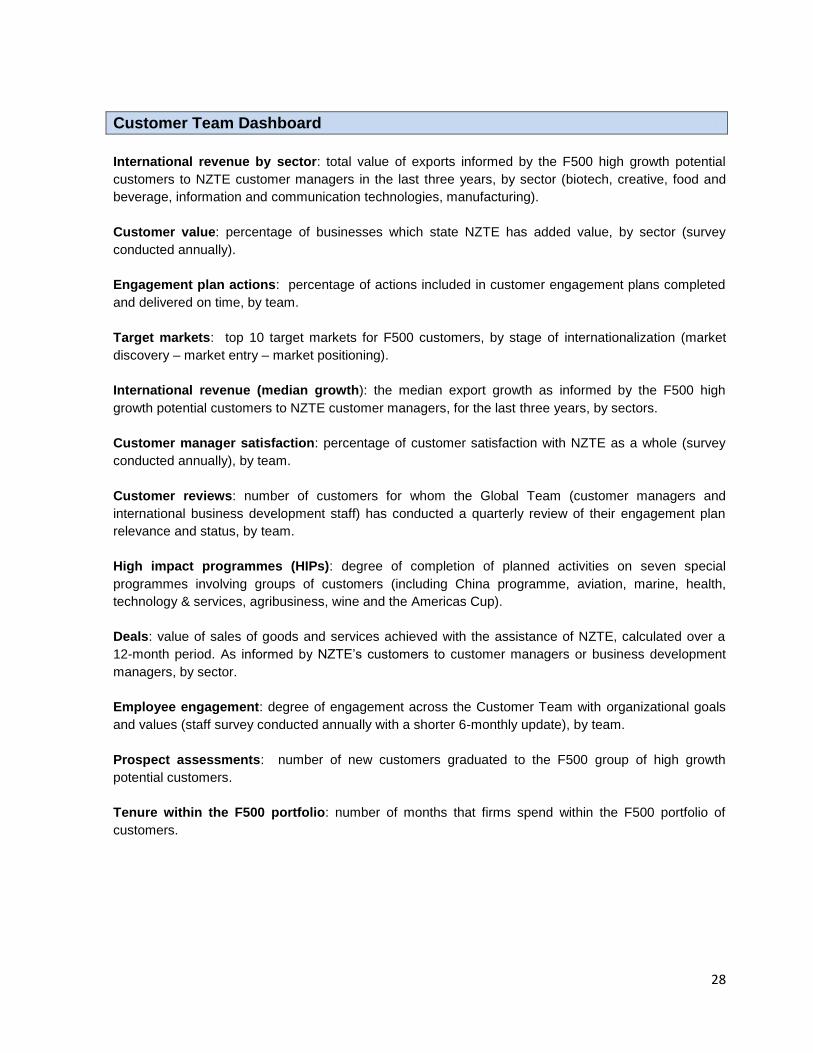
Customer Team Dashboard
International revenue by sector: total value of exports informed by the F500 high growth potential
customers to NZTE customer managers in the last three years, by sector (biotech, creative, food and
beverage, information and communication technologies, manufacturing).
Customer value: percentage of businesses which state NZTE has added value, by sector (survey
conducted annually).
Engagement plan actions: percentage of actions included in customer engagement plans completed
and delivered on time, by team.
Target markets: top 10 target markets for F500 customers, by stage of internationalization (market
discovery – market entry – market positioning).
International revenue (median growth): the median export growth as informed by the F500 high
growth potential customers to NZTE customer managers, for the last three years, by sectors.
Customer manager satisfaction: percentage of customer satisfaction with NZTE as a whole (survey
conducted annually), by team.
Customer reviews: number of customers for whom the Global Team (customer managers and
international business development staff) has conducted a quarterly review of their engagement plan
relevance and status, by team.
High impact programmes (HIPs): degree of completion of planned activities on seven special
programmes involving groups of customers (including China programme, aviation, marine, health,
technology & services, agribusiness, wine and the Americas Cup).
Deals: value of sales of goods and services achieved with the assistance of NZTE, calculated over a
12-month period. As informed by NZTE’s customers to customer managers or business development
managers, by sector.
Employee engagement: degree of engagement across the Customer Team with organizational goals
and values (staff survey conducted annually with a shorter 6-monthly update), by team.
Prospect assessments: number of new customers graduated to the F500 group of high growth
potential customers.
Tenure within the F500 portfolio: number of months that firms spend within the F500 portfolio of
customers.