Embed Size (px)
Citation preview
Smart specialisation benchmarking and assessment pilot study on wind energy
Jimeacutenez Navarro Juan Pablo
Uihlein Andreas
2017
EUR 28515 EN
This publication is a Science for Policy report by the Joint Research Centre (JRC) the European Commissionrsquos
science and knowledge service It aims to provide evidence-based scientific support to the European
policymaking process The scientific output expressed does not imply a policy position of the European
Commission Neither the European Commission nor any person acting on behalf of the Commission is
responsible for the use that might be made of this publication
Contact information
Name Jimeacutenez Navarro Juan Pablo
Address PO Box 2 1755 ZG Petten The Netherlands
Email juan-pablojimenez-navarroeceuropaeu
Tel +31 223 56-5214
JRC Science Hub
httpseceuropaeujrc
JRC106035
EUR 28515 EN
PDF ISBN 978-92-79-66661-2 ISSN 1831-9424 doi102760816204
Luxembourg Publications Office of the European Union 2017
copy European Union 2017
The reuse of the document is authorised provided the source is acknowledged and the original meaning or
message of the texts are not distorted The European Commission shall not be held liable for any consequences
stemming from the reuse
How to cite this report Jimeacutenez-Navarro JP Uihlein A Smart specialisation benchmarking and assessment
pilot study on wind energy EUR 28515 EN doi102760816204
All images copy European Union 2017
Smart specialisation benchmarking and assessment pilot study on wind energy
Smart specialisation Platform on Energy aims at supporting the implementation of regional smart specialisation
strategies and the optimal and effective uptake of cohesion funds in the energy area To that end regional
cooperation is a key element as a way of accelerating successful regional projects This report proposes and
tests a methodology to identify potential regions to work with based on structural similarities and recommends
potential partnership amongst them
i
Contents
Executive summary 2
1 Introduction 4
2 Objective 5
3 Methodology 6
31 Selection of regions 6
32 Identification of energy parameters 6
33 Data collection 8
331 Wind energy deployment 8
332 Academia 8
333 Sectorial structure 8
34 Analysis of similarities amongst regions 9
35 Weighting amp principal component analysis 10
36 Quantification of potential correlation 10
4 Results 11
41 Selection of regions 11
42 Energy parameters 11
421 Socio-economic dimension 11
422 Energy price dimension 13
423 Energy use dimension 15
424 Wind energy deployment dimension 15
425 Academia dimension 16
426 Sectorial structure dimension 18
427 Innovation capacities dimension 19
43 Analysis of similarities 20
431 Dimensional similarity matrixes 20
432 Overall similarity matrix 24
44 Weighting amp Principal component analysis 25
441 Weighting method 25
442 Principal component analysis 26
45 Analysis of potential correlation 28
5 Conclusions 31
Conclusions related to the methodology 31
51 31
52 Conclusions related to wind 32
References 33
List of abbreviations and definitions 35
ii
List of figures 36
List of tables 37
Annexes 38
Annex I Energy price parameters 39
Annex II Energy use 44
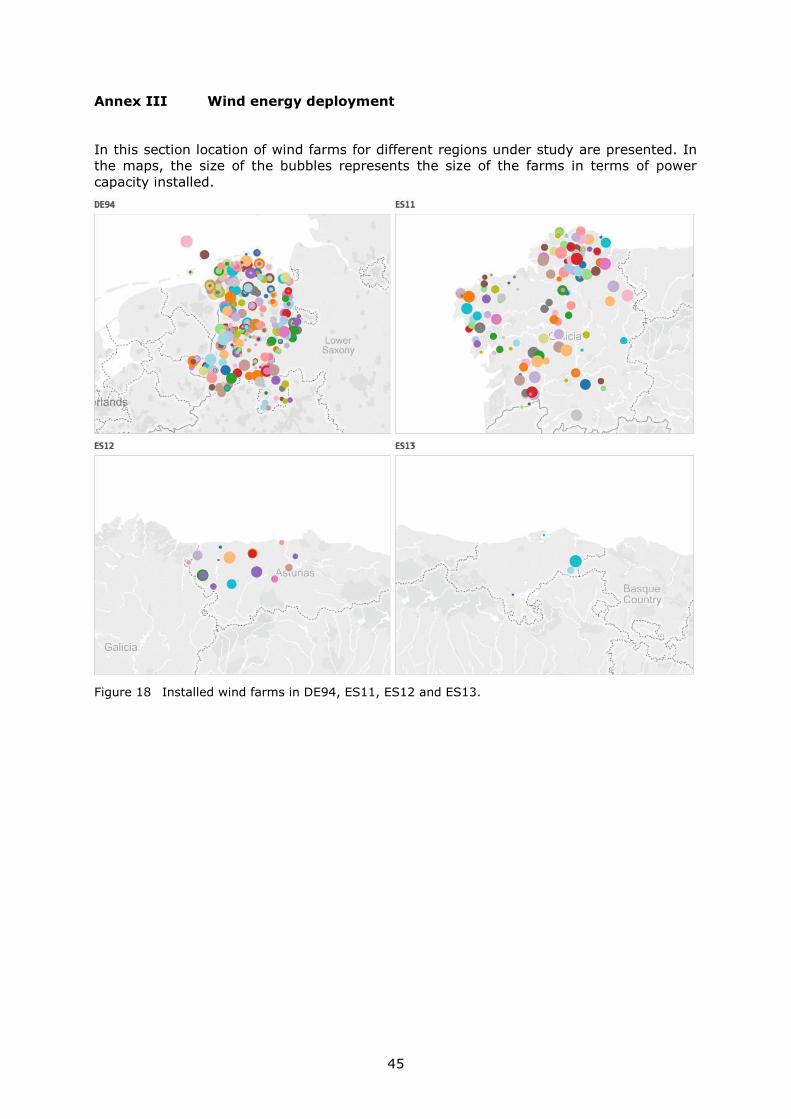
Annex III Wind energy deployment 45
Annex IV Academia indicators 48
Annex V Innovation capacities 50
Annex VI Annex VII Results of PCA analysis for non-weighted dataset 51
1
Authors
Jimeacutenez Navarro Juan Pablo
Uihlein Andreas
2
Executive summary
This work was carried out in the framework of the Smart Specialisation Platform on
Energy (S3PEnergy) It aims at supporting the implementation of regional smart
specialisation strategies and the optimal and effective uptake of cohesion funds in the
energy area
This report aims to foster cooperation amongst regions with common interest in a
particular energy theme which allows mutual learning amongst regions Consequently
the objective of this work is to provide and test a methodology to identify similarities
within a group of regions with a particular interest in wind energy This analysis
facilitates the identification of leading regions and regions with structural similarities and
recommends potential partnerships amongst them
Policy context
Research and innovation strategies for smart specialisation (RIS3) have become a
requirement for those regions that want to take advantage of ESIF funds allocated under
the thematic objective dedicated to strength research technological development and
innovation (TO1) To succeed in the implementation of those strategies cooperation and
mutual learning are key element to take advantage of lessons learnt in the use of
structural funds
Key conclusions
Based on the analysis carried out the cluster of regions that demonstrate interest in a
particular energy technology is a complex exercise Although from a theoretical analysis
some conclusions may be extracted ie the high level of similarities amongst regions
within the same country and some potential regional clusters could be identified
clustering process should follow a bottom-up approach Therefore regions should
describe their specific needs and find ideal partners to advance in solving those needs In
this regard this work provides a methodology to narrow down the number of potential
partners
Main findings
This work reveals the complexity of representing a particular energy technology
deployment by a limited set of parameters Additionally some efforts are still required to
break national data into regional level (NUTS2 level) which actually limits the selection
of parameters to be assessed
Despite the uncertainty concerning which dataset better describes the regional wind
energy status it is demonstrated that a reduced number of variables is enough to
characterise the level of similarities amongst regions Still this conclusion has to be
validated for other technologies and requires extending the number of regions under
analysis
Based on the set of regions under analysis it is worth to highlight the lack of correlation
amongst them for the different dimensions assessed Thus although available wind
energy resource was expected to be the main driver for the deployment of the wind
sector in a region this availability is not correlated with the size of the private sector or
the innovation capacities in the regions However wind innovation capacities are affected
by the economic development of the regions
The analysis also shows how industrial electricity prices are inversely correlated with the
relative GPD in regions having an impact in terms of competitiveness for regions
3
Related and future JRC work
In case this methodology become of interest to regions the methodology could be
applied to other technologies and regions across Europe
4
1 Introduction
Smart specialisation aims at promoting a more efficient uptake of public funding in
research and innovation Energy is a topic with high interest amongst regions registered
at the S3 Platform on smart specialisation [Jimeacutenez Navarro amp Uihlein 2016] Thus under
the umbrella of the Smart Specialisation Platform (S3P) a thematic platform on energy
was set up in 20151 The Smart Specialisation Platform on Energy (S3PEnergy) is the
space where Member States regions and community members receive support for the
optimal and effective uptake of Cohesion Funds for sustainable energy The S3PEnergy
also promotes energy innovation activities at national regional and local level through
the identification of technologies and innovative solutions that support in the most cost-
effective way the EU energy policy priorities
One of the most important aspects of the concept of smart specialisation strategies is
territorial cooperation [European Commission 2011] Lessons learnt may represent a
valuable input in order to succeed in the implementation of national or regional
strategies Therefore the identification of lighthouse regions in specific topics is
fundamental to achieve a similar level of deployment in other regions of Europe
This identification needs a comparison framework that leads to significant conclusions
concerning the status of territorial units in specific aspects Therefore the definition of a
set of key performance indicators (KPI) to determine a fair comparison framework is
required to assess the status of regions in a specific aspect
In the framework of the smart specialisation concept [Foray amp Goenega 2013] a regional
benchmarking methodology has been developed to identify reference regions and to
measure how closefar regions are from each other Proposed benchmarking exercises
include issues related to geo-demography human resources technology structure
sectorial structure or institutions and values [Navarro et al 2014] A benchmarking can
provide into insights about possibilities for learning and transfer of best practisesRegions
with similar structural conditions could benefit most from knowledge transfer and mutual
learning
Regarding energy a regional characterisation through a limited number of indicators is a
complex exercise Firstly because of the energy sector itself shows a high complexity
itself which is difficult to portray with a limited amount if indicators Secondly data is
often not available for several indicators and regions
Therefore the definition of a set of KPIs supported by available data and capable to
characterise the status of a regions energy aspects will contribute to developing a
comparative analysis between regions and finally promote cooperation amongst regions
1 https3platformjrceceuropaeus3p-energy
5
2 Objective
This report aims to facilitate the comparison of the energy sector status for a specific
energy technology of EU regions with the final purpose of identifying most advanced
regions in each aspect as well as establishing a potential group of regions which share
similar characteristics
To this end the objective of this work is to define and test a feasible comparison
framework for a particular energy technology and for a limited set of European regions
This work serves as a case study for further analysis involving other energy technologies
and regions
Therefore the proposed comparison framework is built to be easily replicated for other
regions and technologies and can be considered a proof of concept Once defined and
tested it allows an integrated analysis combining regions and energy technologies
leading to the assessment of the level of similarity amongst technologies or amongst
regions
For the proposed case study wind energy has been selected as an appropriate
technology It does not present a high level of interactions andor overlapping with other
low carbon energy technologies This aspect is expected to facilitate also the data
retrieval process
The selection of regions is based on the information provided in their smart specialisation
strategies Therefore all regions with interest in developing wind energy in their
territories are included in the analysis [Jimeacutenez Navarro amp Uihlein 2016]
The analysis is carried out based on the definition of dimensions containing different
parameters related to wind technology to certain extend As mentioned in the previous
section the main challenges faced in this analysis are the selection of parameters that
could better define the technology status in regions and data availability These two
issues are directly linked since data access limits the initial identification of parameters
Therefore as a proof of concept this analysis explores data availability The
methodology also tests the application of dimensional reduction techniques such as the
principal component analysis in order to simplify the study and detect critical parameters
Considering how difficult it is to set a comprehensive list of parameters that best defines
the status of a technology a realistic list according to available information is presented
Ultimately the proposed analysis allows the integration of new parameters in case new
data becomes available
6
3 Methodology
The proposed methodology is based on the following steps
selection of regions with proven wind energy interests in their smart specialisation
strategies
identification of energy parameters to compare
collection of information from different sources
analysis of energy similarities between regions
quantification of potential correlations
31 Selection of regions
The selected group of regions is composed of those that have declared interest in their
specific smart specialisation strategies according to [EyeRIS3 2015] and included in
[Jimeacutenez Navarro amp Uihlein 2016] This initial list has been revised in a second stage
after the collection of information has been performed to remove regions with poor
information available (Section 4)
32 Identification of energy parameters
Ideally and from a broad perspective the energy sector analysis should include four
main aspects social economic environmental and institutional aspects [IEA 2001]
Some works propose parameters to be considered to analyse sustainable development
[IEA 2001] In the case of specific energy technology status at regional level some of
them may be considered However there is no consensus about the parameters to be
incorporated to characterise regional energy technology status
Next to a lack of consensus on which parameters to include data availability determines
the choice of energy parameters that can be considered In addition to this despite the
fact that at Member State (MS) level available information is enough to establish robust
analysis NUTS2 level means a challenge in terms of data acquisition Most databases
analysed include very detailed information on MS level but not at regional level
Therefore the challenge is to break down national information to regional level a task
that until now remains unsolved for some indicators
Taking into account all the above a list of indicators was developed and is presented in
Table 1 together with the data sources used and the geographical coverage The
proposed list of indicators is organised in seven dimensions that will be used in following
steps to carry out analysis to establish correlation amongst them
7
Table 1 List of indicators used for the wind regional benchmarking
Dimension Elements Parameter Coverage Year Source
Socio-economic
Population Total population Regional 2013 [Eurostat 2015a]
Urban Urban population Regional 2013 [Navarro et al 2014]
Region wealth
Absolute GDP Regional 2013 [Eurostat 2015b]
Relative GDP Regional 2013 [Eurostat 2015b]
Energy price End use energy price before taxes
Gas price for domestic
National 2014 [Eurostat 2015c]
Gas price for industrial
National 2014 [Eurostat 2015d]
Electricity price for domestic
National 2014 [Eurostat 2015e]
Electricity price for
industrial
National 2014 [Eurostat 2015f]
End use
energy price
after taxes
Gas price for
domestic
National 2014 [Eurostat 2015c]
Gas price for
industrial
National 2014 [Eurostat 2015d]
Electricity price for
domestic
National 2014 [Eurostat 2015e]
Electricity price for industrial
National 2014 [Eurostat 2015f]
Energy use Energy demand
Heating degree days
Regional 2009 [Eurostat 2013]
Wind energy deployment
Wind capacity
Installed capacity Regional 2014 GlobalData Renewable UK
Wind production
Capacity factor Regional 2014 [Gonzalez Aparicio et al 2016]
Wind
deployment
Number of wind
farms
Regional 2014 GlobalData
Renewable UK
Academia Universities Number of
universities
Regional 2016 [Scopus 2016]
Regional in-
house Knowledge
Number of
publications
Regional 2016 [Scopus 2016]
Share of wind publications
Regional 2016 [Scopus 2016]
Share of wind publications in the energy area
Regional 2016 [Scopus 2016]
Sectorial structure
Energy sector size
Number of companies with
innovative activities
Regional 2015 [BNEF 2015]
Representativeness
of the region
Regional 2015 [BNEF 2015]
Innovation
capacities
RampD
expenditure
All sectors Regional 2013 [Eurostat 2016a]
Business sector Regional 2013 [Eurostat 2016a]
Government sector Regional 2013 [Eurostat 2016a]
Education sector Regional 2013 [Eurostat 2016a]
Non-profit sector Regional 2013 [Eurostat 2016a]
RampD
personnel and researchers
Number of
researchers
Regional [Eurostat 2016a]
8
33 Data collection
Most of the data could be obtained directly from different data sources and only some of
them (related to the dimensions wind energy deployment academia and sectorial
structure) required specific data processing The following sections briefly explain how
data was retrieved in these cases
331 Wind energy deployment
Concerning wind energy deployment information on the number of wind farms and their
installed capacity has been retrieved from a commercial database [The Wind Power
2015] and completed with data produced by the JRC related to geographical information
It should be noted that 35 of records did not provide enough information neither in
terms of installed capacity nor in terms of geographical information that may lead to a
NUTS2 classification This figure is sufficient to carry out the proposed analysis
Data on electricity production from wind energy was not available in most cases at
regional level However regional capacity factors have been derived based on EMHIRES
[Gonzalez Aparicio et al 2016] With this information wind energy production can be
directly obtained
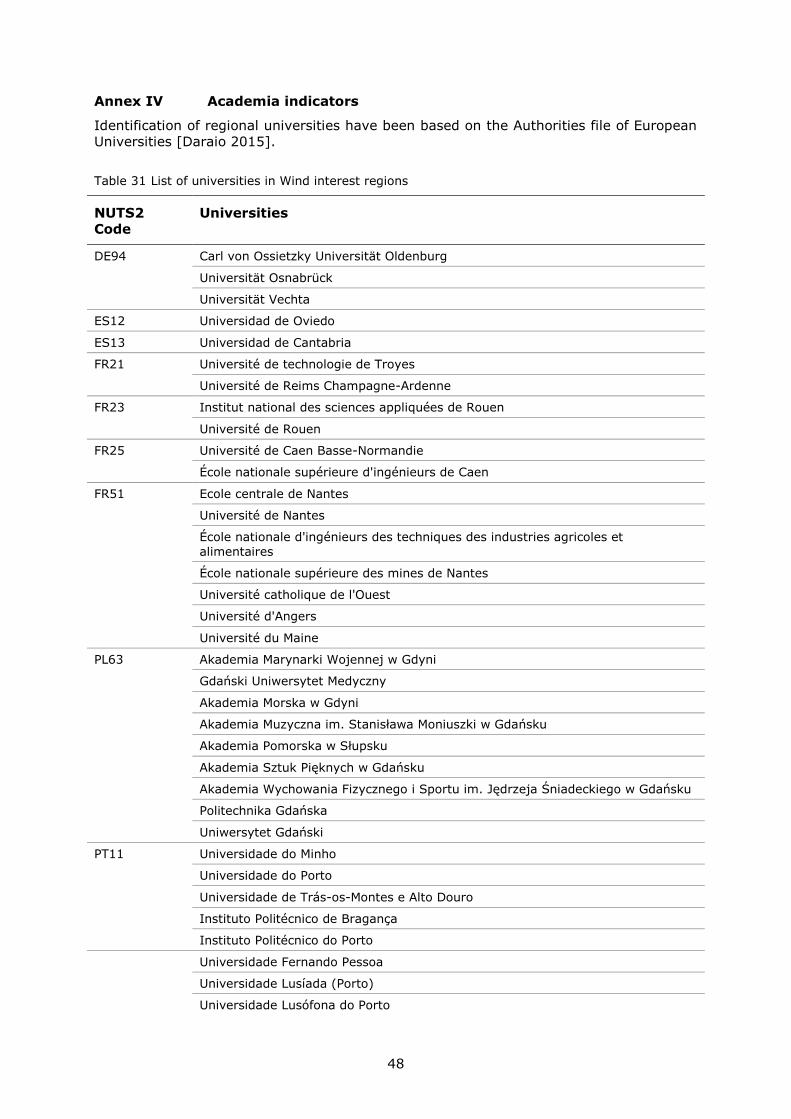
332 Academia
For the analysis of the dimension academia the authorities file of European universities
[Daraio 2015] has been used (Annex IV) Specific wind information in terms of
publication has been retrieved during February 2016 from Scopus [Scopus 2016]
Queries have been developed filtering in the following order universities energy area
and wind
( AF-ID ( University of Exeter 60026479 ) ) AND ( wind ) AND ( LIMIT-
TO ( SUBJAREA ENER ) )
333 Sectorial structure
The analysis of the sectorial structure is based on a comprehensive list of European
active companies working in the field of wind energy including more than 4 000
companies [BNEF 2015] However despite the fact that at country level information is
available information related to city or zip code is not complete (Figure 1) Therefore to
allocate companies in regions coordinates of records based on geographical data
(headquarter place location) have been calculated and classified into NUTS2 areas
According to Figure 1 the lack of information available for a specific country affects also
regions within that country To overcome this issue it has been assumed that regions perform as its related country does In other words if one of the countries has 80 of
geographical data available it is considered that regions in this country will also have the
same share So for a particular region with 100 wind energy companies with information
about geographical location available in a country where the location is know for 80 of
the companies the final sectorial size considered for this region would be 125
companies
9
Figure 1 Share of wind energy companies with no geographical information available
34 Analysis of similarities amongst regions
Once data was collected and processed the benchmarking analysis has been performed
using a dissimilarity or distance matrix (Equation 1)
D= [120782 119941(120783 120784) ⋯ 119941(120783 119951)⋮ 120782 ⋮
119956119962119950 ⋯ 120782]
Equation 1
n = number of parameters considered
d(ij) = distance between region i and j
sym = symmetric elements
Every element of the matrix was calculated by applying the Minkowski distance (Equation
2)
119889(119894 119895) = (sum |119901119894119896 minus 119901119895119896|119903119899
119896=1 )1119903
119903 ge 1
Equation 2
n equiv number of parameters considered
pik equiv value of the parameter k for the region i
d(ij) equiv distance between region i and j
r equiv order of Minkowski distance
10
For this specific analysis a Euclidean distance (r=2) has been assumed Euclidean
distance represents the natural perception of distance between two points and can be
also applicable in multidimensional problems However the Euclidean distance may offer
poor results when parameters present different ranges being those with high ranges
those that tend to dominate [Cornish 2007] To overcome this issue parameters have
been normalised (Equation 3)
119901119894119896prime =
119901119894119896 minus 119901119896
120590119896
Equation 3
pikprime equiv normalised value of the parameter k for the region i
pik equiv value of the parameter k for the region i
pk equiv average value of the parameter k
σk equiv standard deviation of the parameter k
At a first stage no specific weights were introduced meaning all 55 parameters (30
introduced explicitly in Table 1 and energy prices breakdown in Annex I) were weighted
equally (155) For each of the dimensions presented a particular distance matrix was
created
35 Weighting amp principal component analysis
After the similarity analysis weighting and principal component analyses are applied
Weighting analysis is applied to have a clear understanding on the role of different
dimensions By applying weights at dimension level we ensure every one of the seven
dimensions has an equal impact in the description of the regions no matter the amount of
variables within the dimension
The principal component analysis is applied to assess whether it is possible to reduce the
number of parameters or not This analysis determines which parameters better define
the differences between regions and then discard those that do not provide additional
information
36 Quantification of potential correlation
It is important to note that the matrixes presented in section 34 just provide distances
amongst regions but do not explain which region is performing better or worse To
identify those regions with high level of wind deployment a correlation analysis was
carried out in the final step of the proposed methodology This analysis also allowed
establishing relations between dimensions leading to determine key drivers for the
deployment of wind energy in regions
To obtain a final mark per region and dimension the average value of the normalised
parameters under a particular dimension and region has been calculated As a result a
matrix of dimension number of dimensions x number of dimension is obtained
11
4 Results
41 Selection of regions
According to the methodology presented regions that have included wind energy in their
smart specialisation strategy as an interest are presented in Table 2 Taking into account
the limited size of the sector for the case of FR94 in terms of the dimensions sectorial
structure academia and innovation capacities it has been removed The particular
characteristics of FR94 pacific island geographically disconnected from Europe require a
separate analysis and comparison will not provide clear conclusion Therefore the final
analysis covers 12 regions from 7 different European countries
Table 2 Region with wind energy interests
NUTS ID Country code NUTS level RegionCountry name
DE94 DE 3 Weser-Ems
ES11 ES 3 Galicia
ES12 ES 3 Principado de Asturias
ES13 ES 3 Cantabria
FR21 FR 3 Champagne-Ardenne
FR23 FR 3 Haute-Normandie
FR25 FR 3 Basse-Normandie
FR51 FR 3 Pays de la Loire
FR94 FR 3 Reacuteunion
PL63 PL 3 Pomorskie
PT11 PT 3 Norte
SE33 SE 3 Oumlvre Norrland
UKK3 UK 3 Cornwall and Isles of Scilly
Source [EyeRIS3 2015]
This list provides an interesting combination of regions as it mixes both regions from
different countries as well as regions within the same country Having the combination of
regions within the same country and from different countries allows assessing the impact
of national framework effect in the penetration of the technology It should be also
mentioned that a common geographical aspect exists apart from FR94 and SE33 all
regions belong to the Atlantic Arc being therefore coastal regions So it may be
envisaged that one of the main driver for this group of regions is the resource availability
in coastal areas linked to the deployment of off-shore wind
42 Energy parameters
421 Socio-economic dimension
The four parameters considered for the socio-economic dimension are show in Table 3
They give a clear picture of the economic development of regions Figure 2 shows the
absolute and relative gross domestic product (GDP) of regions Spanish regions (Galicia
Asturias and Cantabria) have a similar GDP per inhabitant as well as French regions The
relative GDP in the Swedish region is much higher compared to the other regions exceeding EUR 40 000 per inhabitant On the contrary relative GDP of Pomorskie in
Poland is only about EUR 10 000
12
Table 3 Parameters under the socio-economic dimension
Element Parameter Unit
Population Total population No of inhabitants
Urban Population in urban areas No of inhabitants
Region wealth Absolute gross domestic product EUR
Relative gross domestic product GDPinhabitant
Regarding population values and level of urban population there is no correlation
between regions in the same country (Figure 3) Therefore the effect of the national
economic in the country has a clear impact in the level of average incomes but not in the
way the territory is organised Level of urban or rural population depends on the specific
characteristics of regions
Figure 2 GDP (left) and relative GDP (right) according to region
Figure 3 Population (left) and rate of urban population (right) according to region
13
422 Energy price dimension
For the energy price dimension data considered includes
Energy source electricity or gas
User final or industrial users
Taxes price before or after taxes
Consumption band depending on the energy source
In data presented in Table 4 just energy sources users and taxes are presented to
simplify the understanding of the comprehensive list of parameters However according
to energy pricing schemes levels of consumptions also determine different energy prices
Depending on the energy sources different bandwidths are defined Annex I includes
detailed information about the energy prices
It is also important to note that same prices have been considered per MS Therefore this
dimension does not lead to any difference amongst regions in the same country
Table 4 Parameters under the energy price dimension
Element Parameter Unit
End use energy price before taxes
Gas Price for Domestic EURkWh
Gas Price for Industrial EURkWh
Electricity Price for Domestic EURkWh
Electricity Price for Industrial EURkWh
End use energy price
before taxes
Gas Price for Domestic EURkWh
Gas Price for Industrial EURkWh
Electricity Price for Domestic EURkWh
Electricity Price for Industrial EURkWh
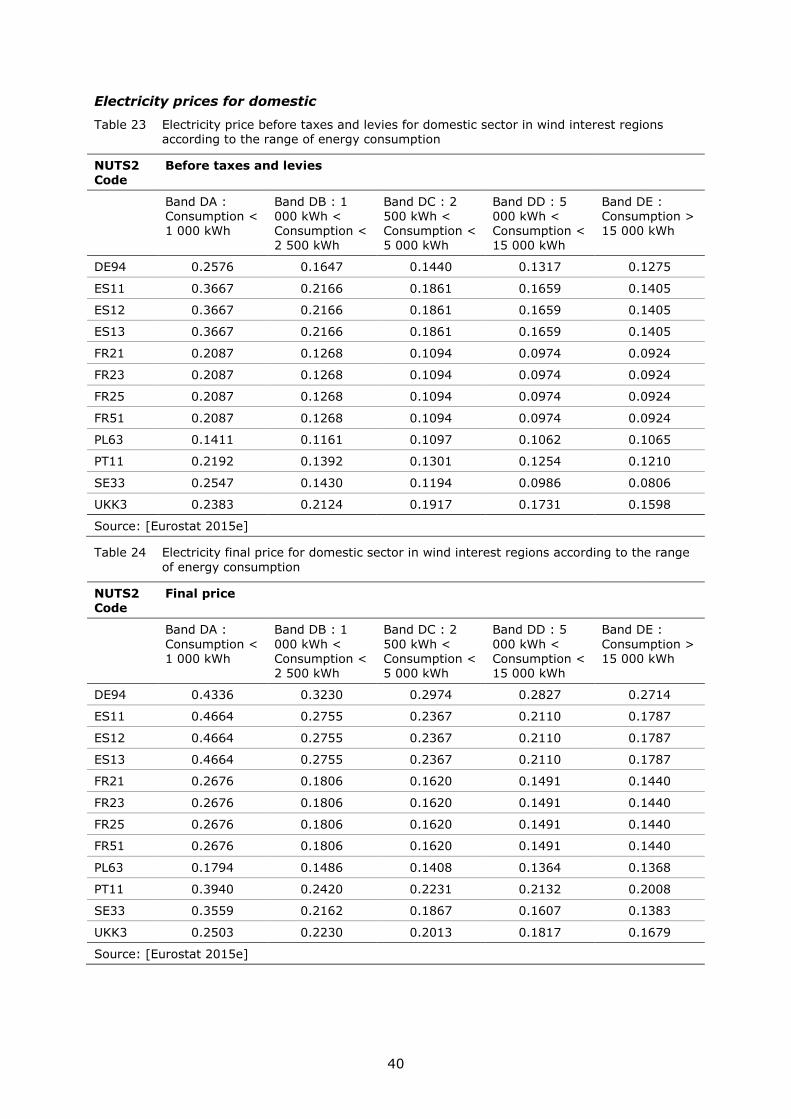
To understand energy prices amongst countries average final energy price per user and
energy source are presented (Figure 4) To represent the average price of electricity for
domestics prices shown in Annex I (Table 24) have been considered
Figure 4 Average final energy prices according to Member State
14
At this stage a first correlation was established with the socio-economic dimension
presented in section 421 We expected that regions with higher GDPinhabitant have
higher energy prices However in case of electricity SE33 - representing Sweden - does
not show the highest domestic energy cost but does for domestic gas prices (Figure 5)
On the contrary PL63 ndash representing Poland- has the lowest price for electricity but not
for gas The case of Portugal is remarkable It shows a high value in the electricity cost
for domestic (025 EURkWh) even though its relative low value in terms of GDP per
inhabitant
Figure 5 Final domestic energy prices and relative GDP according to region
For electricity the industrial price trend is inversely dependent with the relative GDP
increase when the opposite would be expected For the case of gas there is almost no
dependency with GDP (Figure 6) Therefore another important conclusion is that as
economic driver countries with low GDP have to transform their energy market to
achieve at least same prices as those with higher GDP
Figure 6 Final industrial energy prices and relative GDP according to region
15
The correlation between GDP and energy price will be presented and discussed in section
44 in more detail
423 Energy use dimension
The list of proposed parameters is presented in (Table 5) The only parameter for which
complete data is available is the Heating Degree Days (HDD)2 parameter More
information about the data availability for the energy use dimension is available in
Annex II
Table 5 Parameters under the energy use dimension
Element Parameter Unit
Energy demand Heating Degree Days HDD
As expected the Swedish region shows highest HDD followed by the Polish and German
regions (Figure 7) The regions in Spain and Portugal show the lowest number of HDD
Figure 7 Heating Degree Days 2009
424 Wind energy deployment dimension
The parameters used for the assessment of wind energy deployment are shown in Table
6 As mentioned in section 331 wind energy deployment is characterized by three
parameters (number of wind turbines installed wind energy capacity and regional
capacity factor) They are shown in Table 7 From these three parameters both the
average size of wind power plants in the regions as well as the energy produced can be
derived
Table 6 Parameters under the wind energy deployment dimension
Element Parameter Unit
Wind capacity Installed capacity MW wind energy in operation
2 HDD indicate regional heating demand
16
Wind energy production Energy produced GWh produced
Wind deployment Number of wind farms No
Table 7 Results for wind energy deployment
NUTS ID Wind farms (no)
Installed capacity (MW)
Capacity factor ()
DE94 532 3502 025
ES11 180 3405 023
ES12 22 514 015
ES13 4 38 039
FR21 122 1647 016
FR23 25 245 032
FR25 32 258 036
FR51 61 561 032
PL63 35 592 029
PT11 127 1539 023
SE33 30 533 009
UKK3 26 112 056
Figure 8 shows the results of the assessment In most of the cases the electricity
produced correlates with the installed capacity In the case of the UKK3 a very high
capacity factor leads to a relatively high electricity production compared to other regions
Figure 8 Installed wind energy capacity and electricity production from wind
Annex III provides detailed information and maps about wind energy deployment in
every assessed region
425 Academia dimension
Table 8 summarises the parameters used for the academia dimension In addition to the
total number of publications the share of wind publications compared to all publications
in the area of energy and the share of wind publications compared to all publications
have been calculated
17
Table 8 Parameters under the academia dimension
Element Parameter Unit
Universities Number of universities No
Regional in-house knowledge Number of wind publications No
Share of wind publications
Share of wind publications in the energy area
Results from academia dimension show in terms of number of publications in the field of
wind energy high figures for DE94 with a relatively small number of academic entities
(3) in comparison with other regions (Figure 9) Also PT11 represents a high number of
publications from its 9 institutions On the contrary for PL63 the relative importance of
wind is very limited with 20 publications from 9 entities
Figure 9 Number of wind publication vs number of universities
In Figure 10 (left) the share of wind publications compared to the total number of
scientific publications (2016) is shown DE94 ES13 and PT11 show a relatively high
share (057 034 and 028 respectively) Other regions such as the regions in
France Poland and Sweden show very low shares (between 005 and 015 )
When we look at the share of wind publications compared to all scientific publications in
the area of energy (Figure 10 right) we see a similar picture However the Spanish
regions and UKK3 score better with relatively high shares (119 to 179 ) DE94
leads with 274
The complete list of universities considered in the study can be consulted in Annex IV
18
Figure 10 Share of wind publications compared to all (left) and all energy-related (right)
publications
426 Sectorial structure dimension
Table 9 shows the parameters used to assess the sectorial structure of the regions
Table 9 Parameters under the sectorial structure dimension
Element Parameter Unit
Energy sector size Number of wind companies No
Share of wind companies in the regions compared to total number of wind companies in the corresponding MS
Based on the estimations introduced in section 333 the total number of wind energy
companies assumed per regions is presented in Figure 11 Numbers range from 4 for
ES13 to 82 for DE94 It has to be kept in mind that the number of companies is
estimated since for many companies identified the geographical location was not
available (section 333)
Together with the absolute number of wind companies in a region the importance of a
region for the wind sector of their countries is shown in Figure 11 High shares can be
seen for PT11 which hosts about 25 of all Portuguese wind companies DE94 and
PL63 where 107 and 126 of total national companies are located
The share of the wind sectors of all other regions compared to the respective national
wind sector does not exceed 10 However it is important to note that none of the
regions considered includes the capital city of the Member State where often many
companies usually establish their headquarters Just to give an estimation of this effect
the regions of Madrid (ES30) and Icircle de France (FR10) include about 38 and 46 of
national companies in Spain and France respectively This effect of big cities might also
explain the results of PT11 as it includes Porto the second largest city in Portugal
19
Figure 11 Number of wind companies and regional share compared to national level
427 Innovation capacities dimension
In Table 10 the parameters used to assess the dimension innovation capacities are
shown
Table 10 Parameters under the innovation capacities dimension
Element Parameter Unit
RampD expenditure All sectors EURinhabitant
Business sector EURinhabitant
Government sector EURinhabitant
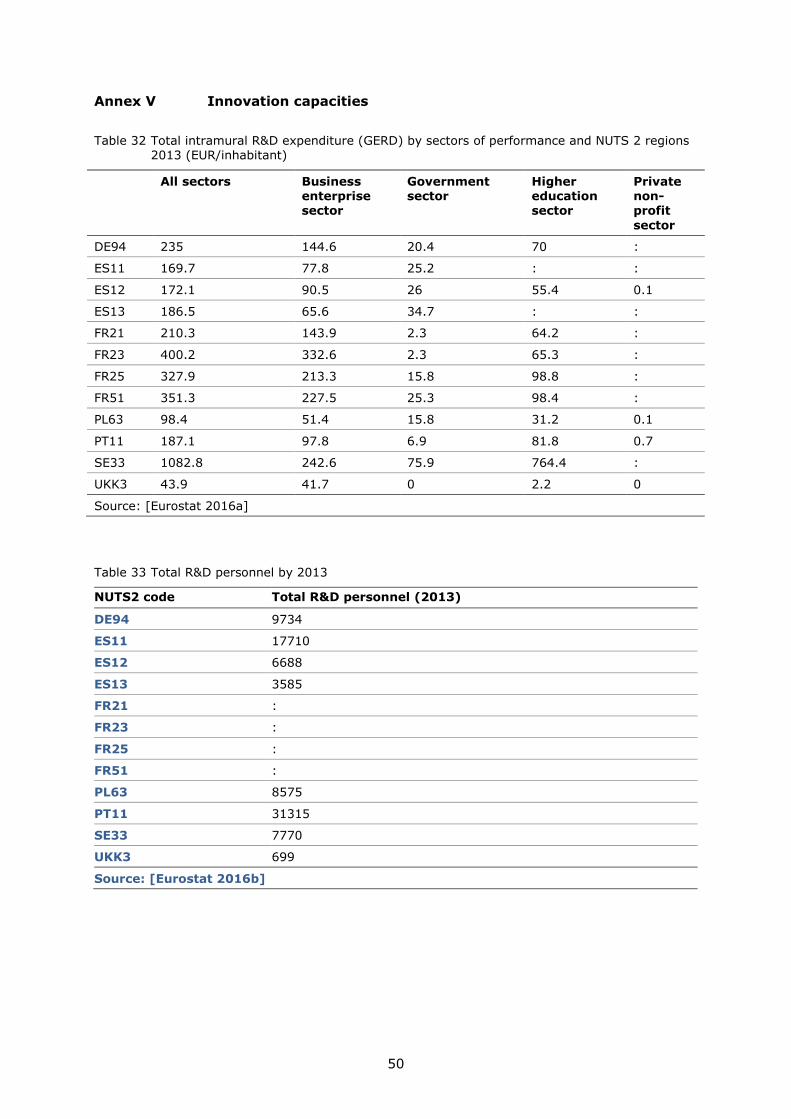
Concerning innovation capacities SE33 shows the largest RampD investments followed by
three French regions (FR23 FR25 FR51) and DE94 RampD investments are smallest in
UKK3 and PL63 When looking at relative numbers (RampD investments per capita) the
gap between SE33 and the other regions is even more pronounced (Annex V)
When we look at the private sector SE33 shows lower levels than FR23 meaning that
the contribution of government higher education and private non-profit sectors is
considerably high The case of UKK is also interesting because here 95 of the
investment comes from private sector On the contrary the share of public investments
is highest in ES13 or PL63 with about 19 and 16 respectively
20
Figure 12 Regional RampD expenditure including private and public sector
43 Analysis of similarities
Similarity matrixes are demonstrated useful for multi dimension comparison and
clustering [Mooi amp Sarstedt 2011] However as similarity matrixes are based on the
relative distance between elements to be compared they do not allow for a ranking or
classification amongst elements In other words they provide a relative comparison to
enable clustering processes The following dimension matrixes give an idea about how
similar regions are A higher value of the element ij in the matrix means a greater
distance between regions i and j
431 Dimensional similarity matrixes
Socio-economic dimension
The similarity matrix for the socio-economic dimension is shown in
Table 11 For this dimension SE33 is the region farthest away from the other regions
showing an average distance of 39 followed by FR51 with an average distance of 347
The two regions that have less in common are PL63 and SE33 with a distance of 487 It
is interesting to recall again the results of the individual parameters of this dimension
population (section 421) where PL63 and SE33 show very similar GDP but a high
difference in relative GDP Also population and urban population are very different for
those two regions A number of regions show high similarity including FR21 FR23 ES13
and UKK3
An interesting observation can be made within regions in the same country Although
from a socio-economic point of view regions within the same country were expected to
show similar values for this dimension the similarity amongst them is low For example
the distance between ES11 and FR21 is lower (171) than the distance between ES11
and ES13 (254)
21
Table 11 Similarity matrix for the socio-economic dimension
Region DE94 ES11 ES12 ES13 FR21 FR23 FR25 FR51 PL63 PT11 SE33 UKK3
DE94 000 161 259 334 197 107 293 194 301 302 437 329
ES11 161 000 220 254 171 134 220 228 168 154 428 254
ES12 259 220 000 180 174 166 291 421 175 336 441 157
ES13 334 254 180 000 150 231 172 443 213 315 315 028
FR21 197 171 174 150 000 102 144 319 234 283 291 150
FR23 107 134 166 231 102 000 226 269 232 281 377 224
FR25 293 220 291 172 144 226 000 334 279 254 234 193
FR51 194 228 421 443 319 269 334 000 393 281 485 449
PL63 301 168 175 213 234 232 279 393 000 203 487 206
PT11 302 154 336 315 283 281 254 281 203 000 473 325
SE33 437 428 441 315 291 377 234 485 487 473 000 333
UKK3 329 254 157 028 150 224 193 449 206 325 333 000
Average 265 217 256 240 201 214 240 347 263 292 391 241
Energy price dimension
In the case of the energy price dimension based on the assumptions of a homogeneous
national energy market price regions in the same country such as the Spanish and
French regions show a distance of 0 (Table 12)
In total 38 different parameters (energy prices) are compared (Annex I) including
industrial and domestic prices gas and electricity prices and prices with and without
taxes So the distance matrix reflects the effects of consumer profile energy sources
and taxation schemes For the energy price Sweden amp United Kingdom and Sweden amp
Germany are the most separated countries meanwhile Poland and France are the closest
when we compare regions from two different countries
Table 12 Distance matrix for the energy price dimension group indicators
Region DE94 ES11 ES12 ES13 FR21 FR23 FR25 FR51 PL63 PT11 SE33 UKK3
DE94 000 786 786 786 951 951 951 951 1020 1079 1306 865
ES11 786 000 000 000 871 871 871 871 1032 758 1109 721
ES12 786 000 000 000 871 871 871 871 1032 758 1109 721
ES13 786 000 000 000 871 871 871 871 1032 758 1109 721
FR21 951 871 871 871 000 000 000 000 644 936 847 949
FR23 951 871 871 871 000 000 000 000 644 936 847 949
FR25 951 871 871 871 000 000 000 000 644 936 847 949
FR51 951 871 871 871 000 000 000 000 644 936 847 949
PL63 1020 1032 1032 1032 644 644 644 644 000 1204 1120 999
PT11 1079 758 758 758 936 936 936 936 1204 000 986 1108
SE33 1306 1109 1109 1109 847 847 847 847 1120 986 000 1380
UKK3 865 721 721 721 949 949 949 949 999 1108 1380 000
Average 948 717 717 717 631 631 631 631 910 945 1046 937
22
Energy use dimension
In this case as only one parameter is considered the distance is the same as what the
Heating Degree Days parameter indicates In the overall similarity matrix which includes
all the parameters (section 432) normalised values for this parameter have been
incorporated
Wind energy deployment dimension
In the case of deployment there is not identified a certain level of proximity amongst
regions in the same country for Spain but it is in the case of French regions The reason
for this behaviour is probably the existence of resources in each region beyond legislation
or national support However as it can be checked for regions in Spain ES11 is far from
the other two even when they are geographically close and it could be assumed similar
levels of available resources
Table 13 Distance matrix for the wind deployment dimension group indicators
Region DE94 ES11 ES12 ES13 FR21 FR23 FR25 FR51 PL63 PT11 SE33 UKK3
DE94 000 240 431 472 324 440 441 405 452 414 342 489
ES11 240 000 268 325 159 287 294 255 299 250 194 367
ES12 431 268 000 195 115 134 167 135 117 064 120 329
ES13 472 325 195 000 238 063 037 082 081 138 282 144
FR21 324 159 115 238 000 180 202 157 180 117 059 337
FR23 440 287 134 063 180 000 033 036 027 075 220 198
FR25 441 294 167 037 202 033 000 046 058 106 246 165
FR51 405 255 135 082 157 036 046 000 056 072 203 197
PL63 452 299 117 081 180 027 058 056 000 067 214 221
PT11 414 250 064 138 117 075 106 072 067 000 149 266
SE33 342 194 120 282 059 220 246 203 214 149 000 391
UKK3 489 367 329 144 337 198 165 197 221 266 391 000
Average 405 267 189 187 188 154 163 149 161 156 220 282
Academia structure dimension
In terms of the role of wind in the academia a national pattern can be observed both for
Spain and France with the exception of FR51 (Table 14) The regions that are most
similar to other regions are SE33 ES12 and FR25 The regions that differ most from the
others are DE94 and PT11 This can be explained by the very high number of scientific
publications and universities in PT11 and the very high number of scientific publications
in DE94 (section 425)
Table 14 Distance matrix for the academia dimension group indicators
Regions DE94 ES11 ES12 ES13 FR21 FR23 FR25 FR51 PL63 PT11 SE33 UKK3
DE94 000 367 327 299 520 538 495 442 535 348 404 325
ES11 367 000 124 149 178 201 155 169 255 357 121 060
ES12 327 124 000 068 204 220 180 227 323 367 103 112
ES13 299 149 068 000 242 259 218 253 349 394 165 133
FR21 520 178 204 242 000 025 025 196 238 465 140 223
23
FR23 538 201 220 259 025 000 047 205 240 475 153 246
FR25 495 155 180 218 025 047 000 185 237 448 120 200
FR51 442 169 227 253 196 205 185 000 100 319 178 220
PL63 535 255 323 349 238 240 237 100 000 371 261 310
PT11 348 357 367 394 465 475 448 319 371 000 352 353
SE33 404 121 103 165 140 153 120 178 261 352 000 141
UKK3 325 060 112 133 223 246 200 220 310 353 141 000
Average 418 194 205 230 223 237 210 227 292 386 194 211
Sectorial structure dimension
For this dimension we have looked at the structure of the wind energy sector in the
region (section 426) Clearly PT11 PL63 and DE94 stand out In the case of DE94 this
is because of a high number of companies while in the case of PT11 and PL63 it is
because the regions share compared to Portugal is very high The Spanish and French
regions show greatest similarities
Table 15 Distance matrix for the sectorial structure dimension group indicators
Regions DE94 ES11 ES12 ES13 FR21 FR23 FR25 FR51 PL63 PT11 SE33 UKK3
DE94 000 144 287 371 356 356 345 333 291 326 281 338
ES11 144 000 145 231 214 214 202 190 160 263 137 198
ES12 287 145 000 085 070 070 058 048 131 308 033 052
ES13 371 231 085 000 021 021 033 046 179 360 102 033
FR21 356 214 070 021 000 000 013 026 158 339 083 023
FR23 356 214 070 021 000 000 013 026 158 339 083 023
FR25 345 202 058 033 013 013 000 013 147 328 070 020
FR51 333 190 048 046 026 026 013 000 136 317 057 025
PL63 291 160 131 179 158 158 147 136 000 181 099 160
PT11 326 263 308 360 339 339 328 317 181 000 276 341
SE33 281 137 033 102 083 083 070 057 099 276 000 073
UKK3 338 198 052 033 023 023 020 025 160 341 073 000
Average 312 191 117 135 118 118 113 111 164 307 117 117
Innovation capacities dimension
Under this dimension the Spanish regions show very high similarities with a maximum
distance of 051 (Table 16) In terms of individual regions SE33 is very distinct from the
other regions since its RampD spending is more than twice compared to the following region
(FR23) as shown in section 427 UKK3 with least RampD investment is also dissimilar
compared to other regions DE94 presents an average in terms of RampD investment and
RampD personnel and thus show highest similarity on average
Table 16 Distance matrix for the innovation capacities dimension group indicators
Regions DE94 ES11 ES12 ES13 FR21 FR23 FR25 FR51 PL63 PT11 SE33 UKK3
24
DE94 000 081 069 112 088 232 086 103 116 085 428 166
ES11 081 000 014 048 134 312 166 177 060 092 456 137
ES12 069 014 000 051 130 301 155 164 071 093 448 145
ES13 112 048 051 000 180 342 193 193 099 140 433 179
FR21 088 134 130 180 000 218 109 154 128 056 494 128
FR23 232 312 301 342 218 000 149 162 334 270 449 345
FR25 086 166 155 193 109 149 000 049 197 144 406 229
FR51 103 177 164 193 154 162 049 000 219 179 366 264
PL63 116 060 071 099 128 334 197 219 000 074 512 080
PT11 085 092 093 140 056 270 144 179 074 000 498 088
SE33 428 456 448 433 494 449 406 366 512 498 000 577
UKK3 166 137 145 179 128 345 229 264 080 088 577 000
Average 142 152 149 179 165 283 171 185 172 156 460 212
432 Overall similarity matrix
All parameters assessed can be combined into one single distance matrix (Table 17)
From this matrix it is clear that regions in the same country have highest similarities
ES11 ES12 and ES13 on the one hand and FR21 FR23 FR25 and FR51 on the other
hand On the contrary the most separated regions are SE33 and UKK3 followed by SE33
and DE94 To understand the reasons behind these results an analysis of correlation was
performed and is presented in section 45 Clearly the similarities are driven by
parameters that could not be retrieved on regional level but where national data had to
be used This was the case for energy prices a dimension which included a high number
of parameters (38) Subsequently we will explore various effects of weighting and PCA
on the results (section 44)
Table 17 Comprehensive overall similarity matrix
Regions DE94 ES11 ES12 ES13 FR21 FR23 FR25 FR51 PL63 PT11 SE33 UKK3
DE94 00 95 105 111 123 128 128 122 133 130 161 116
ES11 95 00 40 50 96 103 100 99 114 93 135 90
ES12 105 40 00 29 94 98 97 102 112 97 134 85
ES13 111 50 29 00 97 101 94 104 114 100 133 79
FR21 123 96 94 97 00 30 27 44 78 115 108 108
FR23 128 103 98 101 30 00 28 38 82 118 111 111
FR25 128 100 97 94 27 28 00 39 79 114 106 106
FR51 122 99 102 104 44 38 39 00 81 110 113 115
PL63 133 114 112 114 78 82 79 81 00 131 139 113
PT11 130 93 97 100 115 118 114 110 131 00 135 129
SE33 161 135 134 133 108 111 106 113 139 135 00 164
UKK3 116 90 85 79 108 111 106 115 113 129 164 00
Average 123 92 90 92 84 86 83 88 107 116 131 111
The overall similarity matrix can also be represented in 2D dimensions which helps
understanding [Buja et al 2008] Figure 13 reinforces the conclusion of similarities
25
amongst regions in the same country PL63 DE94 PT11 and SE33 are show least
similarities
Figure 13 2D distance representation of the overall similarity matrix Non-weighted analysis
44 Weighting amp Principal component analysis
As presented in the previous section the number of parameters under a particular
dimension may affect the multidimensional analysis In particular the energy price
dimension which includes a high number of parameters (48) at MS level produces a
concentration of regions within the same country (see Figure 13) To minimise the effect
of aggregation we have assessed two methods weighting and principal component
analysis
441 Weighting method
In the weighting method we have applied a coefficient for all the parameters within the
same dimension equal to the inverse of the sum of parameters within a given dimension
By doing this we ensure all the dimensions have the same effect in the complete
analysis
Results obtained are shown in Table 18 and Figure 14
Table 18 Comprehensive overall similarity matrix Weighted version
Regions DE94 ES11 ES12 ES13 FR21 FR23 FR25 FR51 PL63 PT11 SE33 UKK3
DE94 000 170 242 279 254 281 273 255 270 263 393 270
26
ES11 170 000 132 176 158 198 174 162 205 188 417 185
ES12 242 132 000 093 115 147 128 145 181 203 403 141
ES13 279 176 093 000 136 154 106 150 191 232 401 096
FR21 254 158 115 136 000 098 087 126 155 237 349 141
FR23 281 198 147 154 098 000 078 107 179 250 361 159
FR25 273 174 128 106 087 078 000 101 162 227 356 120
FR51 255 162 145 150 126 107 101 000 181 207 384 171
PL63 270 205 181 191 155 179 162 181 000 210 326 170
PT11 263 188 203 232 237 250 227 207 210 000 459 240
SE33 393 417 403 401 349 361 356 384 326 459 000 398
UKK3 270 185 141 096 141 159 120 171 170 240 398 000
Average 268 197 176 183 169 183 165 181 203 247 386 190
Figure 14 2D distance representation of the overall similarity matrix Weighted analysis
If Figure 13 and Figure 14 are compared it is clear that when the dimensions are
weighted the effect of parameters at national level is reduced Therefore a weighting
approach is required to avoid national effects
442 Principal component analysis
Once the weighted analysis was carried out the next step was to assess if we can reduce
the number of parameters to the minimum that provides an appropriate variance in the
dataset To do that we perform the principal component analysis [Shlens 2003]
Firstly the PCA is applied to the parameters without applying weights as presented in
section 432 and then to the weighted according (section 441)
27
Some considerations that have to be taken into account when performing the principal
component analysis are
The number of retained components has to be able to explain at least 80 of
variance
Only those parameters with a factor values higher than 020 in absolute value
have been retained
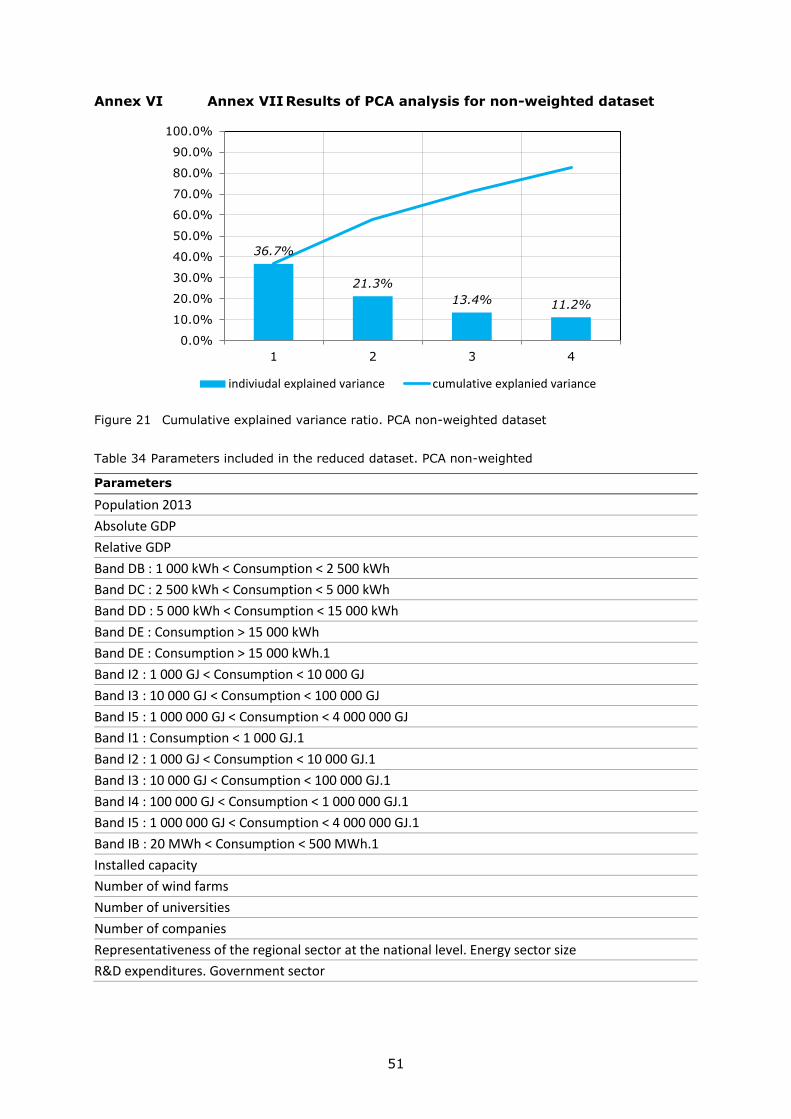
When the PCA is applied to non-weighted data 4 components are required and a total of
23 variables are kept which represent a reduction of 58 compared to the original
dataset (see Annex VI) If data are previously weighted 3 components are required to
explain at least 80 of variance (Figure 21) Then only 12 parameters (78 of
reduction) are sufficient to explain the dataset (Table 19)
Figure 15 Cumulative explained variance ratio PCA weighted dataset
Table 19 Parameters included in the reduced dataset PCA weighted
Dimension Parameters
Socio-economic Relative GDP
Wind energy deployment Installed capacity (MW)
Number of wind farms
Energy demand Heating Degree Days
Academia Number of universities
Number of wind publication
Share of wind publication in the energy area
Share of wind publications
Sectorial structure Number of companies with innovative activities
Representativeness of the regional sector at the
national level Energy sector size
Innovation capacities RampD expenditures All sectors
RampD expenditures Government sector
466
232
114
00
100
200
300
400
500
600
700
800
900
1000
1 2 3
indiviudal explained variance cumulative explanied variance
28
The reduced dataset includes 6 out of 7 dimensions The energy price dimension is the
only dimension not present which was the only dimension with information at MS level
Comparison of results
In order to assess whether the proposed dataset is providing the required information
the 2D regional distance is compared before and after applying the PCA (Figure 16)
Figure 16 2D distance representation of the overall similarity matrix Weighted analysis and dimensional reduction by PCA
As it can be assessed in Figure 16 dimensional reduction has produced similar results
compared to the analysis with the complete dataset From a clustering perspective both
analyses provide a well-defined cluster including ES13 ES12 UKK3 and the 4 French
regions (FR21 FR25 FR23 and FR51) On the other hand in both cases DE94 and SE33
remain as very separate entities
45 Analysis of potential correlation
Further to the information introduced in the previous section the distance matrix is
presented through a graphical correlation matrix providing information about dependency
between dimensions (Figure 17) This matrix is symmetric showing a perfect correlation
in the principal diagonal because each region is compared with itself For the rest of the
elements some interesting conclusions can be extracted
First of all there are no significant correlations between any of the dimensions analysed
The correlation coefficients range from 0002 to 0686 (Table 20) The dimensions that
show a somehow higher correlation are the academia and the sectorial structure
innovation capacities and energy use and wind energy deployment and sectorial
structure
29
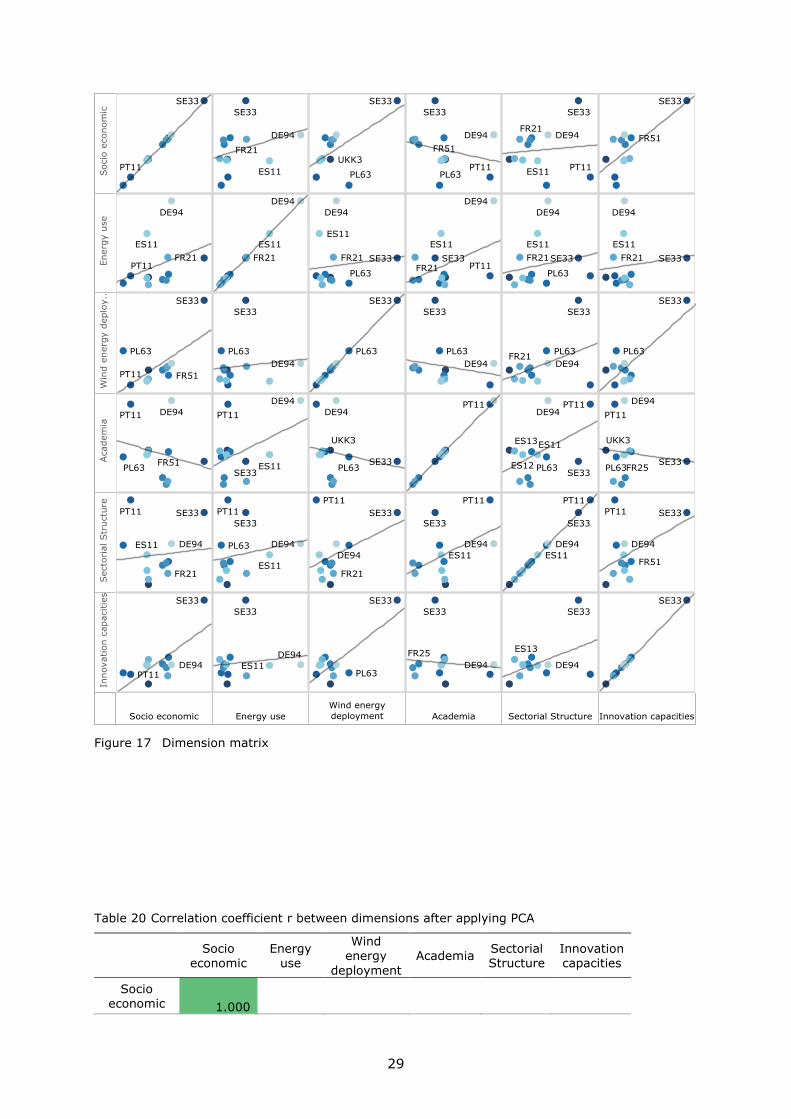
Figure 17 Dimension matrix
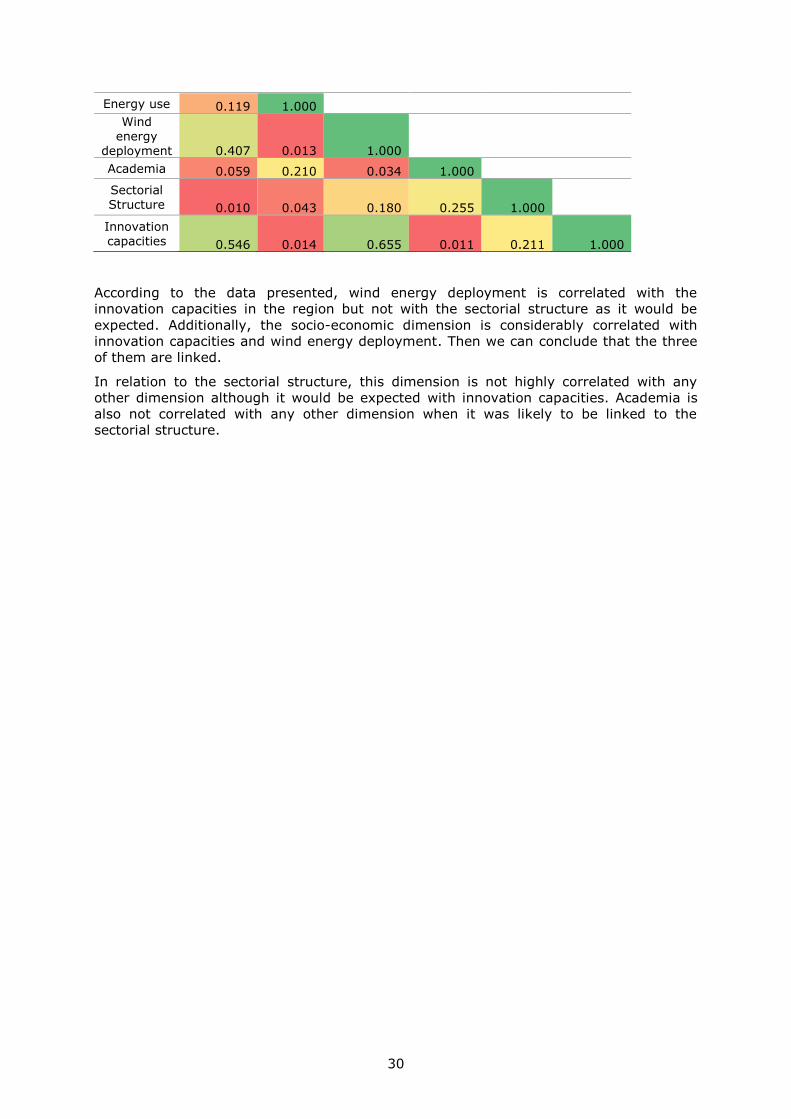
Table 20 Correlation coefficient r between dimensions after applying PCA
Socio economic
Energy use
Wind energy
deployment
Academia Sectorial Structure
Innovation capacities
Socio economic 1000
30
Energy use 0119 1000
Wind energy
deployment 0407 0013 1000 Academia 0059 0210 0034 1000
Sectorial Structure 0010 0043 0180 0255 1000
Innovation capacities 0546 0014 0655 0011 0211 1000
According to the data presented wind energy deployment is correlated with the
innovation capacities in the region but not with the sectorial structure as it would be
expected Additionally the socio-economic dimension is considerably correlated with
innovation capacities and wind energy deployment Then we can conclude that the three
of them are linked
In relation to the sectorial structure this dimension is not highly correlated with any
other dimension although it would be expected with innovation capacities Academia is
also not correlated with any other dimension when it was likely to be linked to the
sectorial structure
31
5 Conclusions
Methodology objective
This pilot study developed a methodology to assess the status or regions related to
energy and applied it to wind energy as a case study The ultimate objective of such
analysis is to identify regions that are possibly more advanced and regions that may
benefit most from learning The methodology helps to understand barriers and gaps
towards regional deployment of energy technologies as well as the identification of the
set of parameters that better defines similarities amongst regions Ultimately the
methodology pursues the creation of regional clusters including regions with similar
problems or level of development
51 Conclusions related to the methodology
Set of parameters and data availability
The main challenge we faced in this analysis was the selection of parameters that could
better define the technology status in regions and data availability These two issues are
directly linked since data access limits initial identification of parameters Therefore as a
proof of concept the analysis explores data availability
Available information varies amongst regions even in the case of same data sources
This situation may prevent from extending the analysis to a larger number of regions
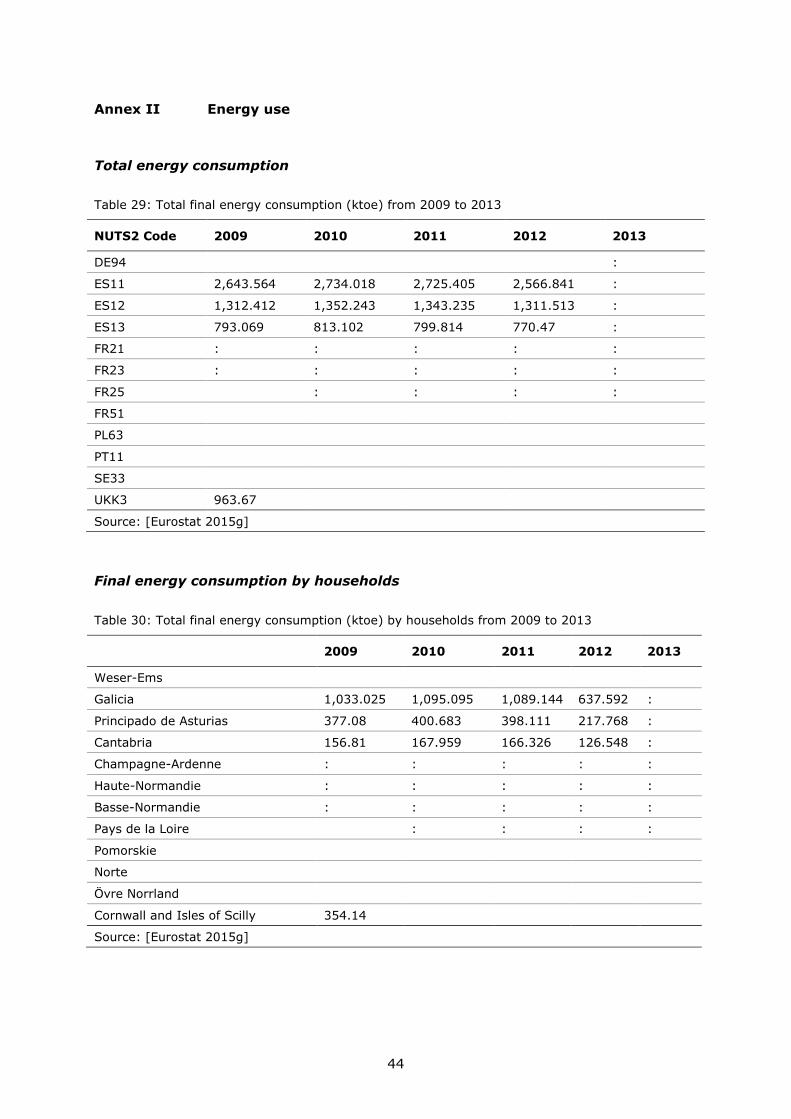
The case of parameters related to energy use (such as final energy consumption) is
especially critical (Table 29 and Table 30) An extended analysis including different
sources may be crucial to map energy supply and demand in regions In any case the
data for the final list of parameters used in this work is available for most of the regions
in Europe Therefore the analysis could be extended to regions but not increased in
terms of new parameters
Lack of regional information
To overcome the lack of information at regional level and in order to carry out extensive
statistical analyses proxy values derived from the national level could be developed
However singularities of regions amongst regions in the same countries will be lost be
interpolating from MS level As presented in the previous sections energy price
dimension comprises a set of parameters defined at MS level Therefore this dimension
increases the level of similarities amongst regions in the same country as it was
discussed in section 422 So data at MS level has to be processed and weighted to
minimise this national effect
Data structure
To simplify the understanding of the data analysis data has been structured in
dimensions that encompass one or several parameters These dimensions allow
comparison between regions and establishing correlations Through these dimensions we
come to conclusions such as the existence of a negative correlation between the socio-
economic status and energy prices or a positive between innovation capacities and the
energy use in regions (Figure 17)
Statistical analysis to reduce number of parameters
Due to the lack of a pre-defined comprehensive list of parameters because of the
complexity of the regional energy systems a dimensional reduction was assessed It was
expected that the dimension energy price may not be needed when defining differences
32
amongst regions Even more some other parameters may not be necessary to determine
regional similarities
For this reason PCA was applied As presented in section 442 the dataset could be
reduced to only 12 parameters instead of 55 As presented in Table 19 all dimensions
remain in the reduced dataset except for the energy price dimension as it was initially
expected
Replicability amp Robustness
As mentioned the initial goal of this study was the definition of a methodology that could
be easily replicated for other energy technology and other regions
Although most of the proposed data is available for every European region the major
drawback of the methodology is that for some further technologies specific parameters
are not easy to define especially for those technologies that show interactions with many
other technologies This is for example the case of heating and cooling technologies that
may appear in combination with renewables and some other energy solutions In any
case the methodology could be easily extended to many other technologies like ocean or
solar (including CSP STE and PV)
In terms of robustness from an statistical point of view it is important to highlight that
the more regions we have the more robust conclusions are In our case 12 regions have
been assessed However if more region from different countries are included results will
be more reliable
Concerning the PCA and due to the limited number of regions it is required to run the
PCA exercise for a different set of regions under different technologies and compare
whether the retained parameters woulc be the same as in the wind pilot case
52 Conclusions related to wind
Based on the analysis carried out the following conclusions can be extracted
Regions within the same country present a high level of similarities even when energy
prices are out of the analysis as in the case of the PCA application (Figure 15)
Regional overview
SE33 remains as outlier in most of the dimension except for Academia and Energy Use
The Spanish and French regions and UKK3 rank similarly This is the reason why they are
good candidates to define a working group based on the variables considered
Although PL63 and PT11 rank low in the socio-economic dimension they show average
values in the other dimensions In particular PT11 ranks high for academia and sectorial
structure
Correlation overview
There is no strong correlation between dimensions Only innovation capacities seem to be
correlated with socio-economic and wind energy deployment dimensions Therefore we
can conclude that innovation support the development of wind energy at the regional
scale
Final mark
Finally to ensure the consistency of the outcomes from the analysis more regions will be
required In the future when more regions show their interest in wind they will be
incorporated in this analysis
33
References
[BNEF 2015] BNEF Bloomberg New Energy Finance
[Buja et al 2008] Buja A Swayne DF Littman ML Dean N Hofmann H and Chen L Data
visualization with multidimensional scaling Journal of Comp and Graph Stats 17
(444ndash472)
[Cornish 2007] Cornish R Statistics 3 1 Cluster Analysis Hierarchical agglomerative
methods Analysis (1ndash5) DOI1041359781412983648
[Daraio 2015] Daraio C The Added Value of the European Map of Excellence and
Specialization ( EMES ) for R amp I Policy Making
[European Commission 2011] European Commission European territorial cooperation
Building bridges between people
[Eurostat 2013] Eurostat Heating degree-days by NUTS 2 regions - monthly data
[Eurostat 2015a] Eurostat Population on 1 January by age sex and NUTS 2 region
Available at httpappssoeurostateceuropaeunuishowdo
[Eurostat 2015b] Eurostat Gross domestic product (GDP) at current market prices by
NUTS 2 regions
[Eurostat 2015c] Eurostat Gas prices for domestic consumers - bi-annual data (from
2007 onwards) URL httpappssoeurostateceuropaeunuishowdo
[Eurostat 2015d] Eurostat Gas prices for industrial consumers - bi-annual data (from
2007 onwards)
[Eurostat 2015e] Eurostat Electricity prices for domestic consumers - bi-annual data
(from 2007 onwards) URL httpappssoeurostateceuropaeunuishowdo
[Eurostat 2015f] Eurostat Electricity prices for industrial consumers - bi-annual data
(from 2007 onwards)
[Eurostat 2015g] Eurostat Energy primary production and final consumption by NUTS 2
regions - 1 000 tonnes of oil equivalent Available at
httpappssoeurostateceuropaeunuishowdo
[Eurostat 2016a] Eurostat Total intramural RampD expenditure (GERD) by sectors of
performance and NUTS 2 regions
[Eurostat 2016b] Eurostat Total RampD personnel and researchers by sectors of
performance sex and NUTS 2 regions
[EyeRIS3 2015] EyeRIS3 URL https3platformjrceceuropaeumap
[Foray amp Goenega 2013] Foray D and Goenega X The Goals of Smart Specialisation
(18) DOI10279120158
[Gonzalez Aparicio et al 2016] Gonzalez Aparicio I Andreas Z Francesco C Fabio M and
Thomas H EMHIRES dataset Part I Wind power generation
[IEA 2001] International Energy Agency Indicators for Sustainable Energy Development
(20)
[Jimeacutenez Navarro amp Uihlein 2016] Jimeacutenez Navarro JP and Uihlein A Mapping regional
energy interests for S3PEnergy
[Mooi amp Sarstedt 2011] Mooi E and Sarstedt M Cluster Analysis Springer Berlin
Heidelberg Berlin Heidelberg Available at httpdxdoiorg101007978-3-642-
12541-6_9
[Navarro et al 2014] Navarro M Gibaja JJ Franco S Murciego A Gianelle C Hegy FB
and Kleibrink A Regional benchmarking in the smart specialisation process
Identification of reference regions based on structural similarity (1ndash35)
34
[Scopus 2016] Scopus Scopus URL httpwwwscopuscom
[Shlens 2003] Shlens J A tutorial on principal component analysis
[The Wind Power 2015] The Wind Power The wind power wind farm dataset
35
List of abbreviations and definitions
GDP Gross Domestic Product
HDD Heating Degree Days
KPI Key Performance Indicators
KTOE Kilo tonne of Oil Equivalent
MS Member State
NUTS Nomenclature of territorial units for statistics
PCA Principal Component Analysis
RIS3 Regional Research and Innovation Strategies for Smart Specialisation
36
List of figures
Figure 1 Share of wind energy companies with no geographical information available 9
Figure 2 GDP (left) and relative GDP (right) according to region 12
Figure 3 Population (left) and rate of urban population (right) according to region 12
Figure 4 Average final energy prices according to Member State 13
Figure 5 Final domestic energy prices and relative GDP according to region 14
Figure 6 Final industrial energy prices and relative GDP according to region 14
Figure 7 Heating Degree Days 2009 15
Figure 8 Installed wind energy capacity and electricity production from wind 16
Figure 9 Number of wind publication vs number of universities 17
Figure 10 Share of wind publications compared to all (left) and all energy-related (right)
publications 18
Figure 11 Number of wind companies and regional share compared to national level 19
Figure 12 Regional RampD expenditure including private and public sector 20
Figure 13 2D distance representation of the overall similarity matrix Non-weighted
analysis 25
Figure 14 2D distance representation of the overall similarity matrix Weighted analysis26
Figure 15 Cumulative explained variance ratio PCA weighted dataset 27
Figure 16 2D distance representation of the overall similarity matrix Weighted analysis
and dimensional reduction by PCA 28
Figure 17 Dimension matrix 29
Figure 18 Installed wind farms in DE94 ES11 ES12 and ES13 45
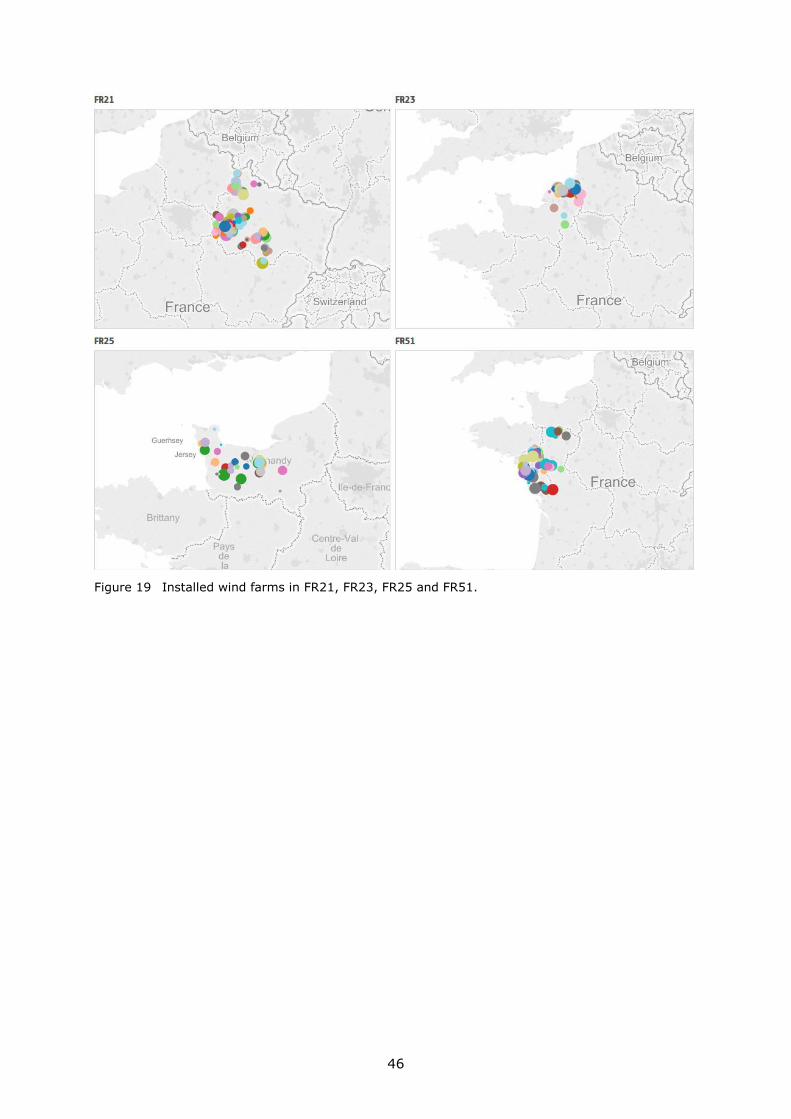
Figure 19 Installed wind farms in FR21 FR23 FR25 and FR51 46
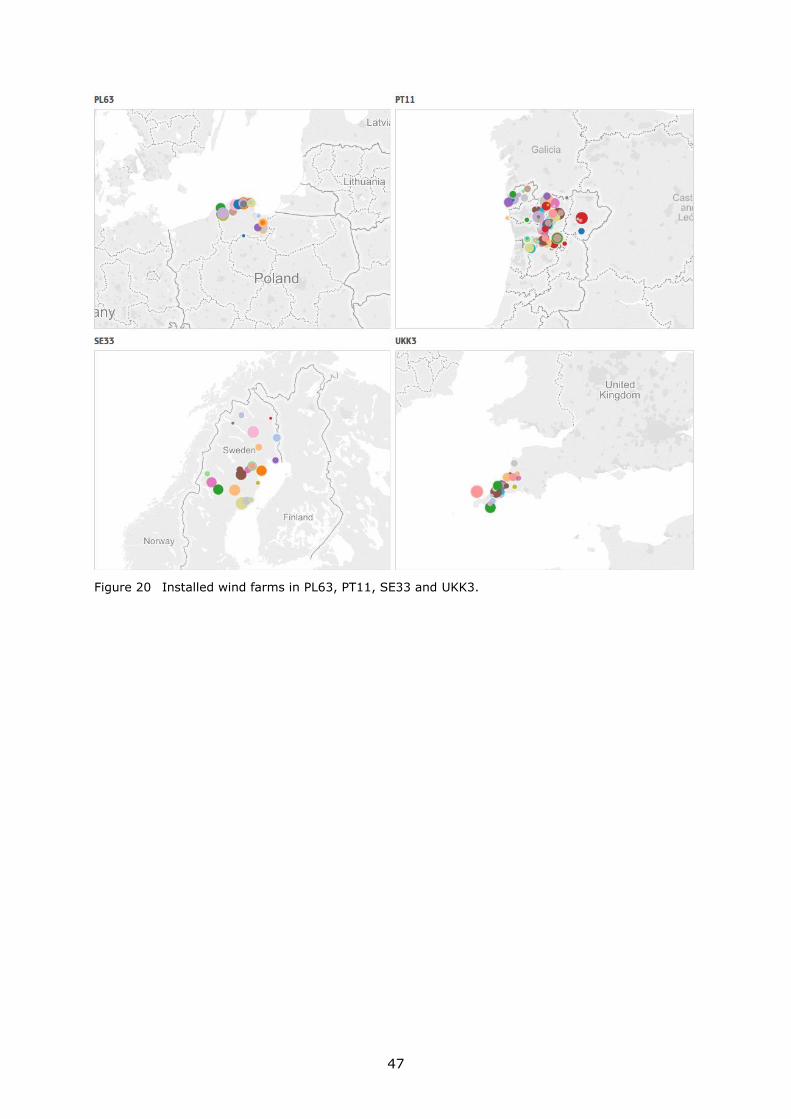
Figure 20 Installed wind farms in PL63 PT11 SE33 and UKK3 47
Figure 21 Cumulative explained variance ratio PCA non-weighted dataset 51
37
List of tables
Table 1 List of indicators used for the wind regional benchmarking 7
Table 2 Region with wind energy interests 11
Table 3 Parameters under the socio-economic dimension 12
Table 4 Parameters under the energy price dimension 13
Table 5 Parameters under the energy use dimension 15
Table 6 Parameters under the wind energy deployment dimension 15
Table 7 Results for wind energy deployment 16
Table 8 Parameters under the academia dimension 17
Table 9 Parameters under the sectorial structure dimension 18
Table 10 Parameters under the innovation capacities dimension 19
Table 11 Similarity matrix for the socio-economic dimension 21
Table 12 Distance matrix for the energy price dimension group indicators 21
Table 13 Distance matrix for the wind deployment dimension group indicators 22
Table 14 Distance matrix for the academia dimension group indicators 22
Table 15 Distance matrix for the sectorial structure dimension group indicators 23
Table 16 Distance matrix for the innovation capacities dimension group indicators 23
Table 17 Comprehensive overall similarity matrix 24
Table 18 Comprehensive overall similarity matrix Weighted version 25
Table 19 Parameters included in the reduced dataset PCA weighted 27
Table 20 Correlation coefficient r between dimensions after applying PCA 29
Table 29 Total final energy consumption (ktoe) from 2009 to 2013 44
Table 30 Total final energy consumption (ktoe) by households from 2009 to 2013 44
Table 31 List of universities in Wind interest regions 48
Table 32 Total intramural RampD expenditure (GERD) by sectors of performance and
NUTS 2 regions 2013 (EURinhabitant) 50
Table 33 Total RampD personnel by 2013 50
Table 34 Parameters included in the reduced dataset PCA non-weighted 51
38
Annexes
39
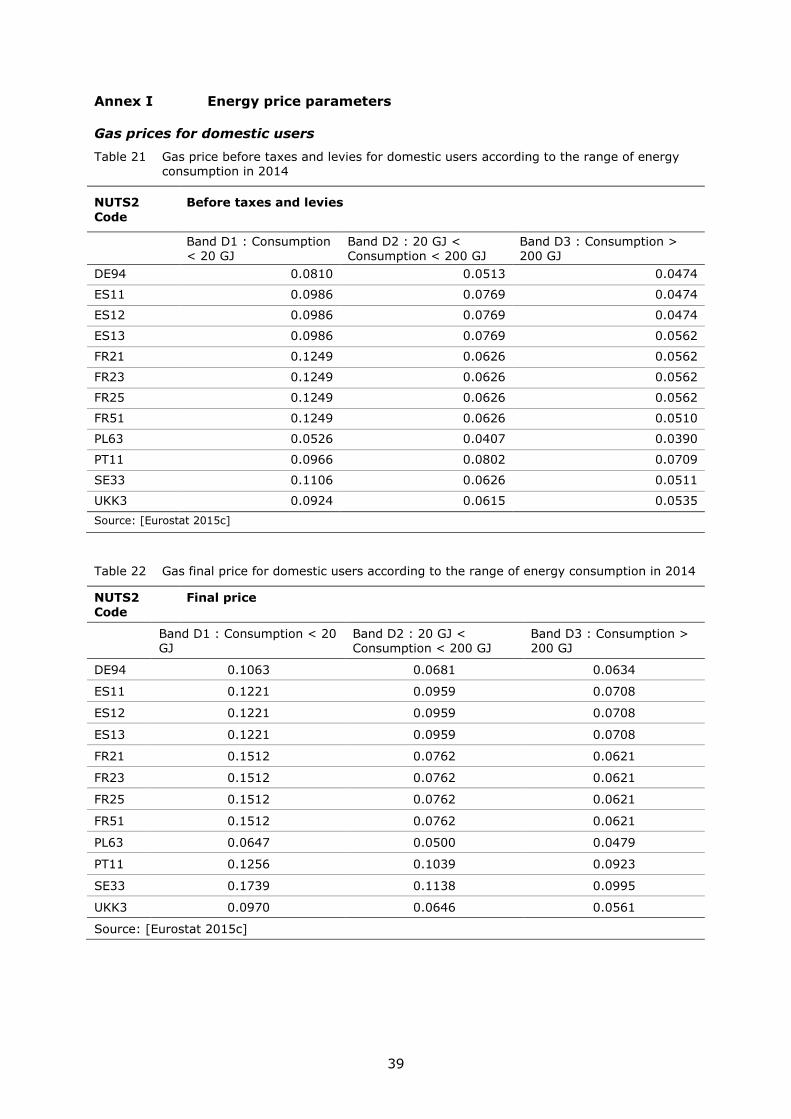
Annex I Energy price parameters
Gas prices for domestic users
Table 21 Gas price before taxes and levies for domestic users according to the range of energy consumption in 2014
NUTS2
Code
Before taxes and levies
Band D1 Consumption lt 20 GJ
Band D2 20 GJ lt Consumption lt 200 GJ
Band D3 Consumption gt 200 GJ
DE94 00810 00513 00474
ES11 00986 00769 00474
ES12 00986 00769 00474
ES13 00986 00769 00562
FR21 01249 00626 00562
FR23 01249 00626 00562
FR25 01249 00626 00562
FR51 01249 00626 00510
PL63 00526 00407 00390
PT11 00966 00802 00709
SE33 01106 00626 00511
UKK3 00924 00615 00535
Source [Eurostat 2015c]
Table 22 Gas final price for domestic users according to the range of energy consumption in 2014
NUTS2 Code
Final price
Band D1 Consumption lt 20 GJ
Band D2 20 GJ lt Consumption lt 200 GJ
Band D3 Consumption gt 200 GJ
DE94 01063 00681 00634
ES11 01221 00959 00708
ES12 01221 00959 00708
ES13 01221 00959 00708
FR21 01512 00762 00621
FR23 01512 00762 00621
FR25 01512 00762 00621
FR51 01512 00762 00621
PL63 00647 00500 00479
PT11 01256 01039 00923
SE33 01739 01138 00995
UKK3 00970 00646 00561
Source [Eurostat 2015c]
40
Electricity prices for domestic
Table 23 Electricity price before taxes and levies for domestic sector in wind interest regions according to the range of energy consumption
NUTS2 Code
Before taxes and levies
Band DA Consumption lt 1 000 kWh
Band DB 1 000 kWh lt Consumption lt 2 500 kWh
Band DC 2 500 kWh lt Consumption lt 5 000 kWh
Band DD 5 000 kWh lt Consumption lt 15 000 kWh
Band DE Consumption gt 15 000 kWh
DE94 02576 01647 01440 01317 01275
ES11 03667 02166 01861 01659 01405
ES12 03667 02166 01861 01659 01405
ES13 03667 02166 01861 01659 01405
FR21 02087 01268 01094 00974 00924
FR23 02087 01268 01094 00974 00924
FR25 02087 01268 01094 00974 00924
FR51 02087 01268 01094 00974 00924
PL63 01411 01161 01097 01062 01065
PT11 02192 01392 01301 01254 01210
SE33 02547 01430 01194 00986 00806
UKK3 02383 02124 01917 01731 01598
Source [Eurostat 2015e]
Table 24 Electricity final price for domestic sector in wind interest regions according to the range
of energy consumption
NUTS2 Code
Final price
Band DA
Consumption lt 1 000 kWh
Band DB 1
000 kWh lt Consumption lt 2 500 kWh
Band DC 2
500 kWh lt Consumption lt 5 000 kWh
Band DD 5
000 kWh lt Consumption lt 15 000 kWh
Band DE
Consumption gt 15 000 kWh
DE94 04336 03230 02974 02827 02714
ES11 04664 02755 02367 02110 01787
ES12 04664 02755 02367 02110 01787
ES13 04664 02755 02367 02110 01787
FR21 02676 01806 01620 01491 01440
FR23 02676 01806 01620 01491 01440
FR25 02676 01806 01620 01491 01440
FR51 02676 01806 01620 01491 01440
PL63 01794 01486 01408 01364 01368
PT11 03940 02420 02231 02132 02008
SE33 03559 02162 01867 01607 01383
UKK3 02503 02230 02013 01817 01679
Source [Eurostat 2015e]
41
Gas prices for industrial
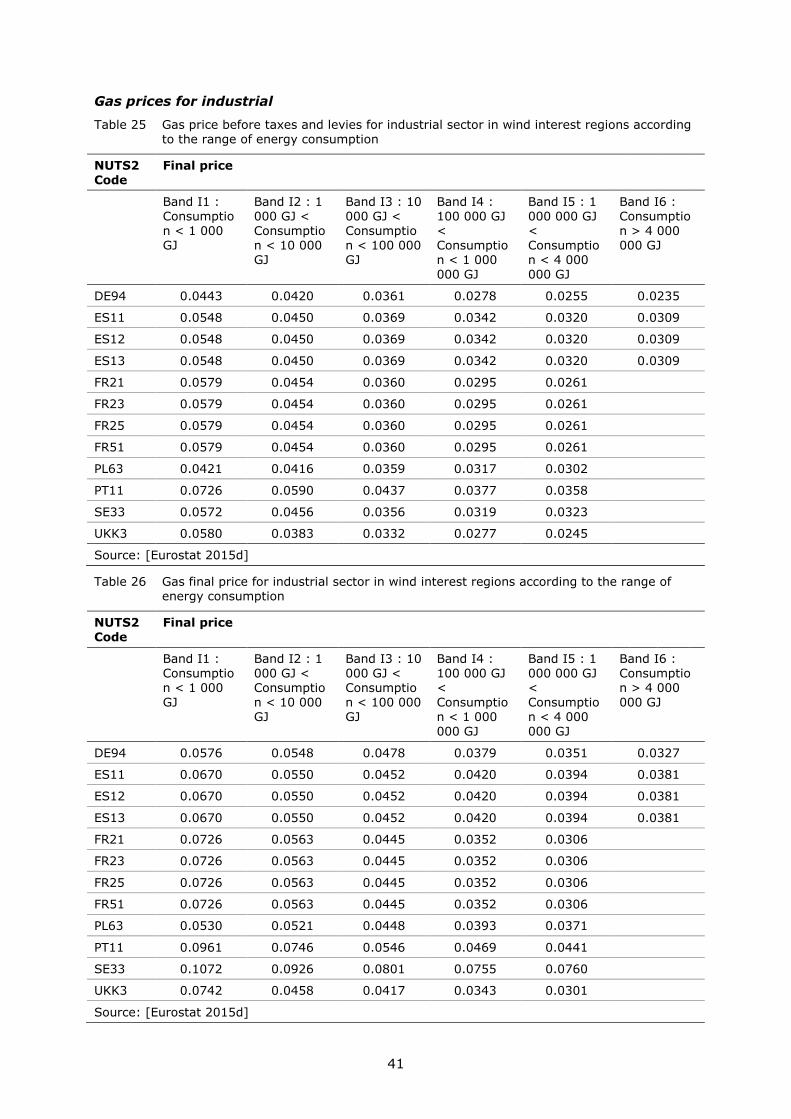
Table 25 Gas price before taxes and levies for industrial sector in wind interest regions according to the range of energy consumption
NUTS2 Code
Final price
Band I1 Consumption lt 1 000 GJ
Band I2 1 000 GJ lt Consumption lt 10 000 GJ
Band I3 10 000 GJ lt Consumption lt 100 000 GJ
Band I4 100 000 GJ lt Consumption lt 1 000 000 GJ
Band I5 1 000 000 GJ lt Consumption lt 4 000 000 GJ
Band I6 Consumption gt 4 000 000 GJ
DE94 00443 00420 00361 00278 00255 00235
ES11 00548 00450 00369 00342 00320 00309
ES12 00548 00450 00369 00342 00320 00309
ES13 00548 00450 00369 00342 00320 00309
FR21 00579 00454 00360 00295 00261
FR23 00579 00454 00360 00295 00261
FR25 00579 00454 00360 00295 00261
FR51 00579 00454 00360 00295 00261
PL63 00421 00416 00359 00317 00302
PT11 00726 00590 00437 00377 00358
SE33 00572 00456 00356 00319 00323
UKK3 00580 00383 00332 00277 00245
Source [Eurostat 2015d]
Table 26 Gas final price for industrial sector in wind interest regions according to the range of energy consumption
NUTS2 Code
Final price
Band I1 Consumption lt 1 000 GJ
Band I2 1 000 GJ lt Consumption lt 10 000 GJ
Band I3 10 000 GJ lt Consumption lt 100 000 GJ
Band I4 100 000 GJ lt Consumption lt 1 000 000 GJ
Band I5 1 000 000 GJ lt Consumption lt 4 000 000 GJ
Band I6 Consumption gt 4 000 000 GJ
DE94 00576 00548 00478 00379 00351 00327
ES11 00670 00550 00452 00420 00394 00381
ES12 00670 00550 00452 00420 00394 00381
ES13 00670 00550 00452 00420 00394 00381
FR21 00726 00563 00445 00352 00306
FR23 00726 00563 00445 00352 00306
FR25 00726 00563 00445 00352 00306
FR51 00726 00563 00445 00352 00306
PL63 00530 00521 00448 00393 00371
PT11 00961 00746 00546 00469 00441
SE33 01072 00926 00801 00755 00760
UKK3 00742 00458 00417 00343 00301
Source [Eurostat 2015d]
42
Electricity prices for industrial
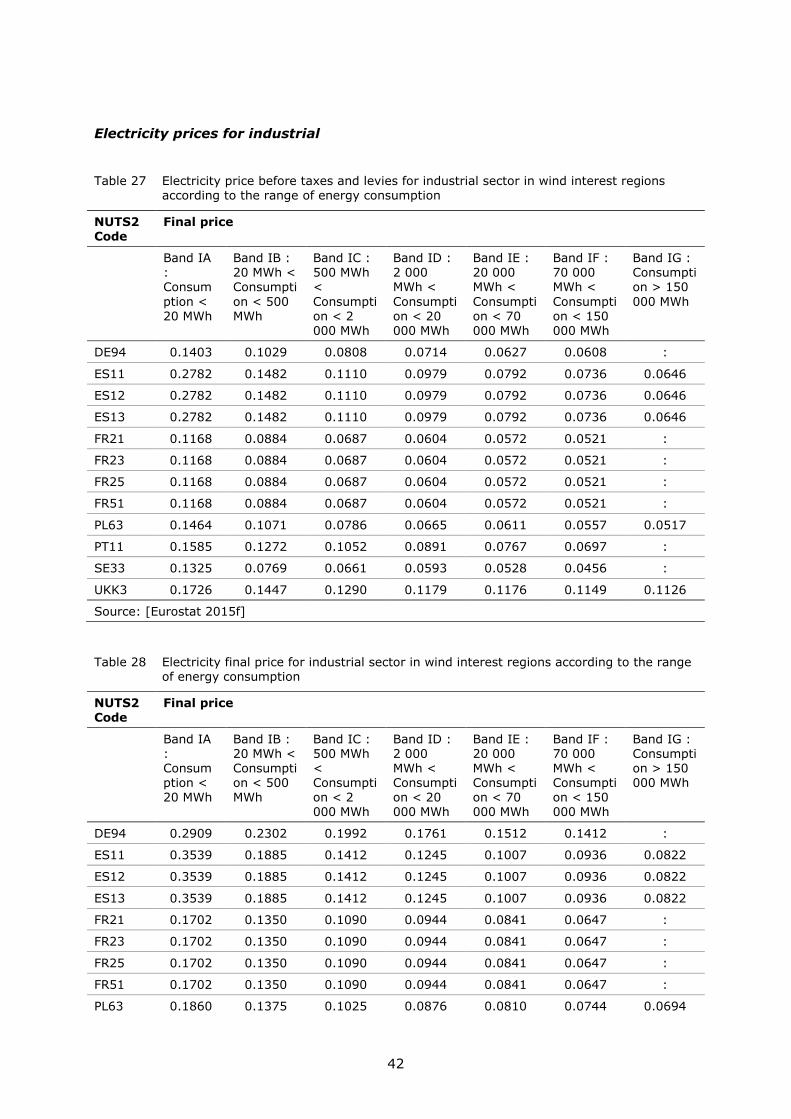
Table 27 Electricity price before taxes and levies for industrial sector in wind interest regions according to the range of energy consumption
NUTS2 Code
Final price
Band IA Consum
ption lt 20 MWh
Band IB 20 MWh lt Consumpti
on lt 500 MWh
Band IC 500 MWh lt
Consumption lt 2 000 MWh
Band ID 2 000 MWh lt
Consumption lt 20 000 MWh
Band IE 20 000 MWh lt
Consumption lt 70 000 MWh
Band IF 70 000 MWh lt
Consumption lt 150 000 MWh
Band IG Consumption gt 150
000 MWh
DE94 01403 01029 00808 00714 00627 00608
ES11 02782 01482 01110 00979 00792 00736 00646
ES12 02782 01482 01110 00979 00792 00736 00646
ES13 02782 01482 01110 00979 00792 00736 00646
FR21 01168 00884 00687 00604 00572 00521
FR23 01168 00884 00687 00604 00572 00521
FR25 01168 00884 00687 00604 00572 00521
FR51 01168 00884 00687 00604 00572 00521
PL63 01464 01071 00786 00665 00611 00557 00517
PT11 01585 01272 01052 00891 00767 00697
SE33 01325 00769 00661 00593 00528 00456
UKK3 01726 01447 01290 01179 01176 01149 01126
Source [Eurostat 2015f]
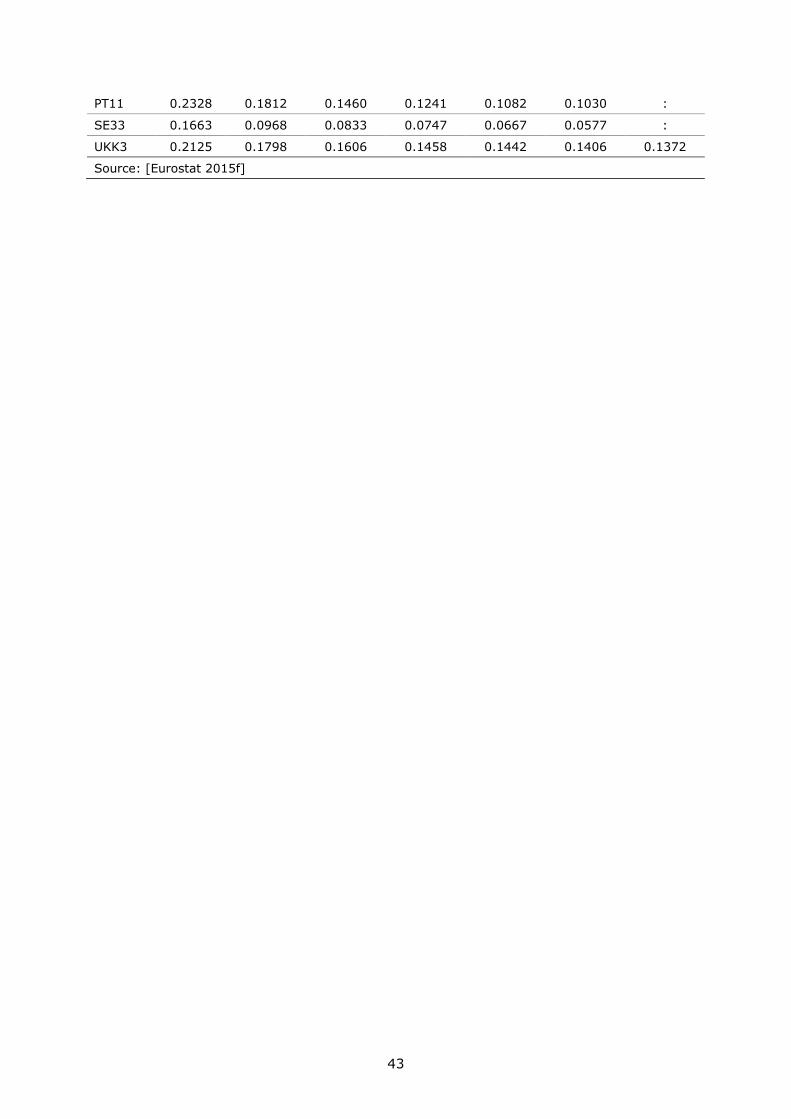
Table 28 Electricity final price for industrial sector in wind interest regions according to the range of energy consumption
NUTS2 Code
Final price
Band IA Consumption lt 20 MWh
Band IB 20 MWh lt Consumption lt 500 MWh
Band IC 500 MWh lt Consumption lt 2 000 MWh
Band ID 2 000 MWh lt Consumption lt 20 000 MWh
Band IE 20 000 MWh lt Consumption lt 70 000 MWh
Band IF 70 000 MWh lt Consumption lt 150 000 MWh
Band IG Consumption gt 150 000 MWh
DE94 02909 02302 01992 01761 01512 01412
ES11 03539 01885 01412 01245 01007 00936 00822
ES12 03539 01885 01412 01245 01007 00936 00822
ES13 03539 01885 01412 01245 01007 00936 00822
FR21 01702 01350 01090 00944 00841 00647
FR23 01702 01350 01090 00944 00841 00647
FR25 01702 01350 01090 00944 00841 00647
FR51 01702 01350 01090 00944 00841 00647
PL63 01860 01375 01025 00876 00810 00744 00694
43
PT11 02328 01812 01460 01241 01082 01030
SE33 01663 00968 00833 00747 00667 00577
UKK3 02125 01798 01606 01458 01442 01406 01372
Source [Eurostat 2015f]
44
Annex II Energy use
Total energy consumption
Table 29 Total final energy consumption (ktoe) from 2009 to 2013
NUTS2 Code 2009 2010 2011 2012 2013
DE94
ES11 2643564 2734018 2725405 2566841
ES12 1312412 1352243 1343235 1311513
ES13 793069 813102 799814 77047
FR21
FR23
FR25
FR51
PL63
PT11
SE33
UKK3 96367
Source [Eurostat 2015g]
Final energy consumption by households
Table 30 Total final energy consumption (ktoe) by households from 2009 to 2013
2009 2010 2011 2012 2013
Weser-Ems
Galicia 1033025 1095095 1089144 637592
Principado de Asturias 37708 400683 398111 217768
Cantabria 15681 167959 166326 126548
Champagne-Ardenne
Haute-Normandie
Basse-Normandie
Pays de la Loire
Pomorskie
Norte
Oumlvre Norrland
Cornwall and Isles of Scilly 35414
Source [Eurostat 2015g]
45
Annex III Wind energy deployment
In this section location of wind farms for different regions under study are presented In
the maps the size of the bubbles represents the size of the farms in terms of power
capacity installed
Figure 18 Installed wind farms in DE94 ES11 ES12 and ES13
46
Figure 19 Installed wind farms in FR21 FR23 FR25 and FR51
47
Figure 20 Installed wind farms in PL63 PT11 SE33 and UKK3
48
Annex IV Academia indicators
Identification of regional universities have been based on the Authorities file of European
Universities [Daraio 2015]
Table 31 List of universities in Wind interest regions
NUTS2
Code
Universities
DE94 Carl von Ossietzky Universitaumlt Oldenburg
Universitaumlt Osnabruumlck
Universitaumlt Vechta
ES12 Universidad de Oviedo
ES13 Universidad de Cantabria
FR21 Universiteacute de technologie de Troyes
Universiteacute de Reims Champagne-Ardenne
FR23 Institut national des sciences appliqueacutees de Rouen
Universiteacute de Rouen
FR25 Universiteacute de Caen Basse-Normandie
Eacutecole nationale supeacuterieure dingeacutenieurs de Caen
FR51 Ecole centrale de Nantes
Universiteacute de Nantes
Eacutecole nationale dingeacutenieurs des techniques des industries agricoles et
alimentaires
Eacutecole nationale supeacuterieure des mines de Nantes
Universiteacute catholique de lOuest
Universiteacute dAngers
Universiteacute du Maine
PL63 Akademia Marynarki Wojennej w Gdyni
Gdański Uniwersytet Medyczny
Akademia Morska w Gdyni
Akademia Muzyczna im Stanisława Moniuszki w Gdańsku
Akademia Pomorska w Słupsku
Akademia Sztuk Pięknych w Gdańsku
Akademia Wychowania Fizycznego i Sportu im Jędrzeja Śniadeckiego w Gdańsku
Politechnika Gdańska
Uniwersytet Gdański
PT11 Universidade do Minho
Universidade do Porto
Universidade de Traacutes-os-Montes e Alto Douro
Instituto Politeacutecnico de Braganccedila
Instituto Politeacutecnico do Porto
Universidade Fernando Pessoa
Universidade Lusiacuteada (Porto)
Universidade Lusoacutefona do Porto
49
Universidade Portucalense Infante D Henrique
SE33 Umearing universitet
Lulearing tekniska universitet
Source [Daraio 2015]
50
Annex V Innovation capacities
Table 32 Total intramural RampD expenditure (GERD) by sectors of performance and NUTS 2 regions 2013 (EURinhabitant)
All sectors Business enterprise sector
Government sector
Higher education sector
Private non-profit
sector
DE94 235 1446 204 70
ES11 1697 778 252
ES12 1721 905 26 554 01
ES13 1865 656 347
FR21 2103 1439 23 642
FR23 4002 3326 23 653
FR25 3279 2133 158 988
FR51 3513 2275 253 984
PL63 984 514 158 312 01
PT11 1871 978 69 818 07
SE33 10828 2426 759 7644
UKK3 439 417 0 22 0
Source [Eurostat 2016a]
Table 33 Total RampD personnel by 2013
NUTS2 code Total RampD personnel (2013)
DE94 9734
ES11 17710
ES12 6688
ES13 3585
FR21
FR23
FR25
FR51
PL63 8575
PT11 31315
SE33 7770
UKK3 699
Source [Eurostat 2016b]
51
Annex VI Annex VII Results of PCA analysis for non-weighted dataset
Figure 21 Cumulative explained variance ratio PCA non-weighted dataset
Table 34 Parameters included in the reduced dataset PCA non-weighted
Parameters
Population 2013
Absolute GDP
Relative GDP
Band DB 1 000 kWh lt Consumption lt 2 500 kWh
Band DC 2 500 kWh lt Consumption lt 5 000 kWh
Band DD 5 000 kWh lt Consumption lt 15 000 kWh
Band DE Consumption gt 15 000 kWh
Band DE Consumption gt 15 000 kWh1
Band I2 1 000 GJ lt Consumption lt 10 000 GJ
Band I3 10 000 GJ lt Consumption lt 100 000 GJ
Band I5 1 000 000 GJ lt Consumption lt 4 000 000 GJ
Band I1 Consumption lt 1 000 GJ1
Band I2 1 000 GJ lt Consumption lt 10 000 GJ1
Band I3 10 000 GJ lt Consumption lt 100 000 GJ1
Band I4 100 000 GJ lt Consumption lt 1 000 000 GJ1
Band I5 1 000 000 GJ lt Consumption lt 4 000 000 GJ1
Band IB 20 MWh lt Consumption lt 500 MWh1
Installed capacity
Number of wind farms
Number of universities
Number of companies
Representativeness of the regional sector at the national level Energy sector size
RampD expenditures Government sector
367
213
134 112
00
100
200
300
400
500
600
700
800
900
1000
1 2 3 4
indiviudal explained variance cumulative explanied variance
Europe Direct is a service to help you find answers
to your questions about the European Union
Freephone number ()
00 800 6 7 8 9 10 11 () The information given is free as are most calls (though some operators phone boxes or hotels may
charge you)
More information on the European Union is available on the internet (httpeuropaeu)
HOW TO OBTAIN EU PUBLICATIONS
Free publications
bull one copy
via EU Bookshop (httpbookshopeuropaeu)
bull more than one copy or postersmaps
from the European Unionrsquos representations (httpeceuropaeurepresent_enhtm) from the delegations in non-EU countries (httpeeaseuropaeudelegationsindex_enhtm)
by contacting the Europe Direct service (httpeuropaeueuropedirectindex_enhtm) or calling 00 800 6 7 8 9 10 11 (freephone number from anywhere in the EU) () () The information given is free as are most calls (though some operators phone boxes or hotels may charge you)
Priced publications
bull via EU Bookshop (httpbookshopeuropaeu)
KJ-N
A-2
8515-E
N-N
doi102760816204
ISBN 978-92-79-66661-2
This publication is a Science for Policy report by the Joint Research Centre (JRC) the European Commissionrsquos
science and knowledge service It aims to provide evidence-based scientific support to the European
policymaking process The scientific output expressed does not imply a policy position of the European
Commission Neither the European Commission nor any person acting on behalf of the Commission is
responsible for the use that might be made of this publication
Contact information
Name Jimeacutenez Navarro Juan Pablo
Address PO Box 2 1755 ZG Petten The Netherlands
Email juan-pablojimenez-navarroeceuropaeu
Tel +31 223 56-5214
JRC Science Hub
httpseceuropaeujrc
JRC106035
EUR 28515 EN
PDF ISBN 978-92-79-66661-2 ISSN 1831-9424 doi102760816204
Luxembourg Publications Office of the European Union 2017
copy European Union 2017
The reuse of the document is authorised provided the source is acknowledged and the original meaning or
message of the texts are not distorted The European Commission shall not be held liable for any consequences
stemming from the reuse
How to cite this report Jimeacutenez-Navarro JP Uihlein A Smart specialisation benchmarking and assessment
pilot study on wind energy EUR 28515 EN doi102760816204
All images copy European Union 2017
Smart specialisation benchmarking and assessment pilot study on wind energy
Smart specialisation Platform on Energy aims at supporting the implementation of regional smart specialisation
strategies and the optimal and effective uptake of cohesion funds in the energy area To that end regional
cooperation is a key element as a way of accelerating successful regional projects This report proposes and
tests a methodology to identify potential regions to work with based on structural similarities and recommends
potential partnership amongst them
i
Contents
Executive summary 2
1 Introduction 4
2 Objective 5
3 Methodology 6
31 Selection of regions 6
32 Identification of energy parameters 6
33 Data collection 8
331 Wind energy deployment 8
332 Academia 8
333 Sectorial structure 8
34 Analysis of similarities amongst regions 9
35 Weighting amp principal component analysis 10
36 Quantification of potential correlation 10
4 Results 11
41 Selection of regions 11
42 Energy parameters 11
421 Socio-economic dimension 11
422 Energy price dimension 13
423 Energy use dimension 15
424 Wind energy deployment dimension 15
425 Academia dimension 16
426 Sectorial structure dimension 18
427 Innovation capacities dimension 19
43 Analysis of similarities 20
431 Dimensional similarity matrixes 20
432 Overall similarity matrix 24
44 Weighting amp Principal component analysis 25
441 Weighting method 25
442 Principal component analysis 26
45 Analysis of potential correlation 28
5 Conclusions 31
Conclusions related to the methodology 31
51 31
52 Conclusions related to wind 32
References 33
List of abbreviations and definitions 35
ii
List of figures 36
List of tables 37
Annexes 38
Annex I Energy price parameters 39
Annex II Energy use 44
Annex III Wind energy deployment 45
Annex IV Academia indicators 48
Annex V Innovation capacities 50
Annex VI Annex VII Results of PCA analysis for non-weighted dataset 51
1
Authors
Jimeacutenez Navarro Juan Pablo
Uihlein Andreas
2
Executive summary
This work was carried out in the framework of the Smart Specialisation Platform on
Energy (S3PEnergy) It aims at supporting the implementation of regional smart
specialisation strategies and the optimal and effective uptake of cohesion funds in the
energy area
This report aims to foster cooperation amongst regions with common interest in a
particular energy theme which allows mutual learning amongst regions Consequently
the objective of this work is to provide and test a methodology to identify similarities
within a group of regions with a particular interest in wind energy This analysis
facilitates the identification of leading regions and regions with structural similarities and
recommends potential partnerships amongst them
Policy context
Research and innovation strategies for smart specialisation (RIS3) have become a
requirement for those regions that want to take advantage of ESIF funds allocated under
the thematic objective dedicated to strength research technological development and
innovation (TO1) To succeed in the implementation of those strategies cooperation and
mutual learning are key element to take advantage of lessons learnt in the use of
structural funds
Key conclusions
Based on the analysis carried out the cluster of regions that demonstrate interest in a
particular energy technology is a complex exercise Although from a theoretical analysis
some conclusions may be extracted ie the high level of similarities amongst regions
within the same country and some potential regional clusters could be identified
clustering process should follow a bottom-up approach Therefore regions should
describe their specific needs and find ideal partners to advance in solving those needs In
this regard this work provides a methodology to narrow down the number of potential
partners
Main findings
This work reveals the complexity of representing a particular energy technology
deployment by a limited set of parameters Additionally some efforts are still required to
break national data into regional level (NUTS2 level) which actually limits the selection
of parameters to be assessed
Despite the uncertainty concerning which dataset better describes the regional wind
energy status it is demonstrated that a reduced number of variables is enough to
characterise the level of similarities amongst regions Still this conclusion has to be
validated for other technologies and requires extending the number of regions under
analysis
Based on the set of regions under analysis it is worth to highlight the lack of correlation
amongst them for the different dimensions assessed Thus although available wind
energy resource was expected to be the main driver for the deployment of the wind
sector in a region this availability is not correlated with the size of the private sector or
the innovation capacities in the regions However wind innovation capacities are affected
by the economic development of the regions
The analysis also shows how industrial electricity prices are inversely correlated with the
relative GPD in regions having an impact in terms of competitiveness for regions
3
Related and future JRC work
In case this methodology become of interest to regions the methodology could be
applied to other technologies and regions across Europe
4
1 Introduction
Smart specialisation aims at promoting a more efficient uptake of public funding in
research and innovation Energy is a topic with high interest amongst regions registered
at the S3 Platform on smart specialisation [Jimeacutenez Navarro amp Uihlein 2016] Thus under
the umbrella of the Smart Specialisation Platform (S3P) a thematic platform on energy
was set up in 20151 The Smart Specialisation Platform on Energy (S3PEnergy) is the
space where Member States regions and community members receive support for the
optimal and effective uptake of Cohesion Funds for sustainable energy The S3PEnergy
also promotes energy innovation activities at national regional and local level through
the identification of technologies and innovative solutions that support in the most cost-
effective way the EU energy policy priorities
One of the most important aspects of the concept of smart specialisation strategies is
territorial cooperation [European Commission 2011] Lessons learnt may represent a
valuable input in order to succeed in the implementation of national or regional
strategies Therefore the identification of lighthouse regions in specific topics is
fundamental to achieve a similar level of deployment in other regions of Europe
This identification needs a comparison framework that leads to significant conclusions
concerning the status of territorial units in specific aspects Therefore the definition of a
set of key performance indicators (KPI) to determine a fair comparison framework is
required to assess the status of regions in a specific aspect
In the framework of the smart specialisation concept [Foray amp Goenega 2013] a regional
benchmarking methodology has been developed to identify reference regions and to
measure how closefar regions are from each other Proposed benchmarking exercises
include issues related to geo-demography human resources technology structure
sectorial structure or institutions and values [Navarro et al 2014] A benchmarking can
provide into insights about possibilities for learning and transfer of best practisesRegions
with similar structural conditions could benefit most from knowledge transfer and mutual
learning
Regarding energy a regional characterisation through a limited number of indicators is a
complex exercise Firstly because of the energy sector itself shows a high complexity
itself which is difficult to portray with a limited amount if indicators Secondly data is
often not available for several indicators and regions
Therefore the definition of a set of KPIs supported by available data and capable to
characterise the status of a regions energy aspects will contribute to developing a
comparative analysis between regions and finally promote cooperation amongst regions
1 https3platformjrceceuropaeus3p-energy
5
2 Objective
This report aims to facilitate the comparison of the energy sector status for a specific
energy technology of EU regions with the final purpose of identifying most advanced
regions in each aspect as well as establishing a potential group of regions which share
similar characteristics
To this end the objective of this work is to define and test a feasible comparison
framework for a particular energy technology and for a limited set of European regions
This work serves as a case study for further analysis involving other energy technologies
and regions
Therefore the proposed comparison framework is built to be easily replicated for other
regions and technologies and can be considered a proof of concept Once defined and
tested it allows an integrated analysis combining regions and energy technologies
leading to the assessment of the level of similarity amongst technologies or amongst
regions
For the proposed case study wind energy has been selected as an appropriate
technology It does not present a high level of interactions andor overlapping with other
low carbon energy technologies This aspect is expected to facilitate also the data
retrieval process
The selection of regions is based on the information provided in their smart specialisation
strategies Therefore all regions with interest in developing wind energy in their
territories are included in the analysis [Jimeacutenez Navarro amp Uihlein 2016]
The analysis is carried out based on the definition of dimensions containing different
parameters related to wind technology to certain extend As mentioned in the previous
section the main challenges faced in this analysis are the selection of parameters that
could better define the technology status in regions and data availability These two
issues are directly linked since data access limits the initial identification of parameters
Therefore as a proof of concept this analysis explores data availability The
methodology also tests the application of dimensional reduction techniques such as the
principal component analysis in order to simplify the study and detect critical parameters
Considering how difficult it is to set a comprehensive list of parameters that best defines
the status of a technology a realistic list according to available information is presented
Ultimately the proposed analysis allows the integration of new parameters in case new
data becomes available
6
3 Methodology
The proposed methodology is based on the following steps
selection of regions with proven wind energy interests in their smart specialisation
strategies
identification of energy parameters to compare
collection of information from different sources
analysis of energy similarities between regions
quantification of potential correlations
31 Selection of regions
The selected group of regions is composed of those that have declared interest in their
specific smart specialisation strategies according to [EyeRIS3 2015] and included in
[Jimeacutenez Navarro amp Uihlein 2016] This initial list has been revised in a second stage
after the collection of information has been performed to remove regions with poor
information available (Section 4)
32 Identification of energy parameters
Ideally and from a broad perspective the energy sector analysis should include four
main aspects social economic environmental and institutional aspects [IEA 2001]
Some works propose parameters to be considered to analyse sustainable development
[IEA 2001] In the case of specific energy technology status at regional level some of
them may be considered However there is no consensus about the parameters to be
incorporated to characterise regional energy technology status
Next to a lack of consensus on which parameters to include data availability determines
the choice of energy parameters that can be considered In addition to this despite the
fact that at Member State (MS) level available information is enough to establish robust
analysis NUTS2 level means a challenge in terms of data acquisition Most databases
analysed include very detailed information on MS level but not at regional level
Therefore the challenge is to break down national information to regional level a task
that until now remains unsolved for some indicators
Taking into account all the above a list of indicators was developed and is presented in
Table 1 together with the data sources used and the geographical coverage The
proposed list of indicators is organised in seven dimensions that will be used in following
steps to carry out analysis to establish correlation amongst them
7
Table 1 List of indicators used for the wind regional benchmarking
Dimension Elements Parameter Coverage Year Source
Socio-economic
Population Total population Regional 2013 [Eurostat 2015a]
Urban Urban population Regional 2013 [Navarro et al 2014]
Region wealth
Absolute GDP Regional 2013 [Eurostat 2015b]
Relative GDP Regional 2013 [Eurostat 2015b]
Energy price End use energy price before taxes
Gas price for domestic
National 2014 [Eurostat 2015c]
Gas price for industrial
National 2014 [Eurostat 2015d]
Electricity price for domestic
National 2014 [Eurostat 2015e]
Electricity price for
industrial
National 2014 [Eurostat 2015f]
End use
energy price
after taxes
Gas price for
domestic
National 2014 [Eurostat 2015c]
Gas price for
industrial
National 2014 [Eurostat 2015d]
Electricity price for
domestic
National 2014 [Eurostat 2015e]
Electricity price for industrial
National 2014 [Eurostat 2015f]
Energy use Energy demand
Heating degree days
Regional 2009 [Eurostat 2013]
Wind energy deployment
Wind capacity
Installed capacity Regional 2014 GlobalData Renewable UK
Wind production
Capacity factor Regional 2014 [Gonzalez Aparicio et al 2016]
Wind
deployment
Number of wind
farms
Regional 2014 GlobalData
Renewable UK
Academia Universities Number of
universities
Regional 2016 [Scopus 2016]
Regional in-
house Knowledge
Number of
publications
Regional 2016 [Scopus 2016]
Share of wind publications
Regional 2016 [Scopus 2016]
Share of wind publications in the energy area
Regional 2016 [Scopus 2016]
Sectorial structure
Energy sector size
Number of companies with
innovative activities
Regional 2015 [BNEF 2015]
Representativeness
of the region
Regional 2015 [BNEF 2015]
Innovation
capacities
RampD
expenditure
All sectors Regional 2013 [Eurostat 2016a]
Business sector Regional 2013 [Eurostat 2016a]
Government sector Regional 2013 [Eurostat 2016a]
Education sector Regional 2013 [Eurostat 2016a]
Non-profit sector Regional 2013 [Eurostat 2016a]
RampD
personnel and researchers
Number of
researchers
Regional [Eurostat 2016a]
8
33 Data collection
Most of the data could be obtained directly from different data sources and only some of
them (related to the dimensions wind energy deployment academia and sectorial
structure) required specific data processing The following sections briefly explain how
data was retrieved in these cases
331 Wind energy deployment
Concerning wind energy deployment information on the number of wind farms and their
installed capacity has been retrieved from a commercial database [The Wind Power
2015] and completed with data produced by the JRC related to geographical information
It should be noted that 35 of records did not provide enough information neither in
terms of installed capacity nor in terms of geographical information that may lead to a
NUTS2 classification This figure is sufficient to carry out the proposed analysis
Data on electricity production from wind energy was not available in most cases at
regional level However regional capacity factors have been derived based on EMHIRES
[Gonzalez Aparicio et al 2016] With this information wind energy production can be
directly obtained
332 Academia
For the analysis of the dimension academia the authorities file of European universities
[Daraio 2015] has been used (Annex IV) Specific wind information in terms of
publication has been retrieved during February 2016 from Scopus [Scopus 2016]
Queries have been developed filtering in the following order universities energy area
and wind
( AF-ID ( University of Exeter 60026479 ) ) AND ( wind ) AND ( LIMIT-
TO ( SUBJAREA ENER ) )
333 Sectorial structure
The analysis of the sectorial structure is based on a comprehensive list of European
active companies working in the field of wind energy including more than 4 000
companies [BNEF 2015] However despite the fact that at country level information is
available information related to city or zip code is not complete (Figure 1) Therefore to
allocate companies in regions coordinates of records based on geographical data
(headquarter place location) have been calculated and classified into NUTS2 areas
According to Figure 1 the lack of information available for a specific country affects also
regions within that country To overcome this issue it has been assumed that regions perform as its related country does In other words if one of the countries has 80 of
geographical data available it is considered that regions in this country will also have the
same share So for a particular region with 100 wind energy companies with information
about geographical location available in a country where the location is know for 80 of
the companies the final sectorial size considered for this region would be 125
companies
9
Figure 1 Share of wind energy companies with no geographical information available
34 Analysis of similarities amongst regions
Once data was collected and processed the benchmarking analysis has been performed
using a dissimilarity or distance matrix (Equation 1)
D= [120782 119941(120783 120784) ⋯ 119941(120783 119951)⋮ 120782 ⋮
119956119962119950 ⋯ 120782]
Equation 1
n = number of parameters considered
d(ij) = distance between region i and j
sym = symmetric elements
Every element of the matrix was calculated by applying the Minkowski distance (Equation
2)
119889(119894 119895) = (sum |119901119894119896 minus 119901119895119896|119903119899
119896=1 )1119903
119903 ge 1
Equation 2
n equiv number of parameters considered
pik equiv value of the parameter k for the region i
d(ij) equiv distance between region i and j
r equiv order of Minkowski distance
10
For this specific analysis a Euclidean distance (r=2) has been assumed Euclidean
distance represents the natural perception of distance between two points and can be
also applicable in multidimensional problems However the Euclidean distance may offer
poor results when parameters present different ranges being those with high ranges
those that tend to dominate [Cornish 2007] To overcome this issue parameters have
been normalised (Equation 3)
119901119894119896prime =
119901119894119896 minus 119901119896
120590119896
Equation 3
pikprime equiv normalised value of the parameter k for the region i
pik equiv value of the parameter k for the region i
pk equiv average value of the parameter k
σk equiv standard deviation of the parameter k
At a first stage no specific weights were introduced meaning all 55 parameters (30
introduced explicitly in Table 1 and energy prices breakdown in Annex I) were weighted
equally (155) For each of the dimensions presented a particular distance matrix was
created
35 Weighting amp principal component analysis
After the similarity analysis weighting and principal component analyses are applied
Weighting analysis is applied to have a clear understanding on the role of different
dimensions By applying weights at dimension level we ensure every one of the seven
dimensions has an equal impact in the description of the regions no matter the amount of
variables within the dimension
The principal component analysis is applied to assess whether it is possible to reduce the
number of parameters or not This analysis determines which parameters better define
the differences between regions and then discard those that do not provide additional
information
36 Quantification of potential correlation
It is important to note that the matrixes presented in section 34 just provide distances
amongst regions but do not explain which region is performing better or worse To
identify those regions with high level of wind deployment a correlation analysis was
carried out in the final step of the proposed methodology This analysis also allowed
establishing relations between dimensions leading to determine key drivers for the
deployment of wind energy in regions
To obtain a final mark per region and dimension the average value of the normalised
parameters under a particular dimension and region has been calculated As a result a
matrix of dimension number of dimensions x number of dimension is obtained
11
4 Results
41 Selection of regions
According to the methodology presented regions that have included wind energy in their
smart specialisation strategy as an interest are presented in Table 2 Taking into account
the limited size of the sector for the case of FR94 in terms of the dimensions sectorial
structure academia and innovation capacities it has been removed The particular
characteristics of FR94 pacific island geographically disconnected from Europe require a
separate analysis and comparison will not provide clear conclusion Therefore the final
analysis covers 12 regions from 7 different European countries
Table 2 Region with wind energy interests
NUTS ID Country code NUTS level RegionCountry name
DE94 DE 3 Weser-Ems
ES11 ES 3 Galicia
ES12 ES 3 Principado de Asturias
ES13 ES 3 Cantabria
FR21 FR 3 Champagne-Ardenne
FR23 FR 3 Haute-Normandie
FR25 FR 3 Basse-Normandie
FR51 FR 3 Pays de la Loire
FR94 FR 3 Reacuteunion
PL63 PL 3 Pomorskie
PT11 PT 3 Norte
SE33 SE 3 Oumlvre Norrland
UKK3 UK 3 Cornwall and Isles of Scilly
Source [EyeRIS3 2015]
This list provides an interesting combination of regions as it mixes both regions from
different countries as well as regions within the same country Having the combination of
regions within the same country and from different countries allows assessing the impact
of national framework effect in the penetration of the technology It should be also
mentioned that a common geographical aspect exists apart from FR94 and SE33 all
regions belong to the Atlantic Arc being therefore coastal regions So it may be
envisaged that one of the main driver for this group of regions is the resource availability
in coastal areas linked to the deployment of off-shore wind
42 Energy parameters
421 Socio-economic dimension
The four parameters considered for the socio-economic dimension are show in Table 3
They give a clear picture of the economic development of regions Figure 2 shows the
absolute and relative gross domestic product (GDP) of regions Spanish regions (Galicia
Asturias and Cantabria) have a similar GDP per inhabitant as well as French regions The
relative GDP in the Swedish region is much higher compared to the other regions exceeding EUR 40 000 per inhabitant On the contrary relative GDP of Pomorskie in
Poland is only about EUR 10 000
12
Table 3 Parameters under the socio-economic dimension
Element Parameter Unit
Population Total population No of inhabitants
Urban Population in urban areas No of inhabitants
Region wealth Absolute gross domestic product EUR
Relative gross domestic product GDPinhabitant
Regarding population values and level of urban population there is no correlation
between regions in the same country (Figure 3) Therefore the effect of the national
economic in the country has a clear impact in the level of average incomes but not in the
way the territory is organised Level of urban or rural population depends on the specific
characteristics of regions
Figure 2 GDP (left) and relative GDP (right) according to region
Figure 3 Population (left) and rate of urban population (right) according to region
13
422 Energy price dimension
For the energy price dimension data considered includes
Energy source electricity or gas
User final or industrial users
Taxes price before or after taxes
Consumption band depending on the energy source
In data presented in Table 4 just energy sources users and taxes are presented to
simplify the understanding of the comprehensive list of parameters However according
to energy pricing schemes levels of consumptions also determine different energy prices
Depending on the energy sources different bandwidths are defined Annex I includes
detailed information about the energy prices
It is also important to note that same prices have been considered per MS Therefore this
dimension does not lead to any difference amongst regions in the same country
Table 4 Parameters under the energy price dimension
Element Parameter Unit
End use energy price before taxes
Gas Price for Domestic EURkWh
Gas Price for Industrial EURkWh
Electricity Price for Domestic EURkWh
Electricity Price for Industrial EURkWh
End use energy price
before taxes
Gas Price for Domestic EURkWh
Gas Price for Industrial EURkWh
Electricity Price for Domestic EURkWh
Electricity Price for Industrial EURkWh
To understand energy prices amongst countries average final energy price per user and
energy source are presented (Figure 4) To represent the average price of electricity for
domestics prices shown in Annex I (Table 24) have been considered
Figure 4 Average final energy prices according to Member State
14
At this stage a first correlation was established with the socio-economic dimension
presented in section 421 We expected that regions with higher GDPinhabitant have
higher energy prices However in case of electricity SE33 - representing Sweden - does
not show the highest domestic energy cost but does for domestic gas prices (Figure 5)
On the contrary PL63 ndash representing Poland- has the lowest price for electricity but not
for gas The case of Portugal is remarkable It shows a high value in the electricity cost
for domestic (025 EURkWh) even though its relative low value in terms of GDP per
inhabitant
Figure 5 Final domestic energy prices and relative GDP according to region
For electricity the industrial price trend is inversely dependent with the relative GDP
increase when the opposite would be expected For the case of gas there is almost no
dependency with GDP (Figure 6) Therefore another important conclusion is that as
economic driver countries with low GDP have to transform their energy market to
achieve at least same prices as those with higher GDP
Figure 6 Final industrial energy prices and relative GDP according to region
15
The correlation between GDP and energy price will be presented and discussed in section
44 in more detail
423 Energy use dimension
The list of proposed parameters is presented in (Table 5) The only parameter for which
complete data is available is the Heating Degree Days (HDD)2 parameter More
information about the data availability for the energy use dimension is available in
Annex II
Table 5 Parameters under the energy use dimension
Element Parameter Unit
Energy demand Heating Degree Days HDD
As expected the Swedish region shows highest HDD followed by the Polish and German
regions (Figure 7) The regions in Spain and Portugal show the lowest number of HDD
Figure 7 Heating Degree Days 2009
424 Wind energy deployment dimension
The parameters used for the assessment of wind energy deployment are shown in Table
6 As mentioned in section 331 wind energy deployment is characterized by three
parameters (number of wind turbines installed wind energy capacity and regional
capacity factor) They are shown in Table 7 From these three parameters both the
average size of wind power plants in the regions as well as the energy produced can be
derived
Table 6 Parameters under the wind energy deployment dimension
Element Parameter Unit
Wind capacity Installed capacity MW wind energy in operation
2 HDD indicate regional heating demand
16
Wind energy production Energy produced GWh produced
Wind deployment Number of wind farms No
Table 7 Results for wind energy deployment
NUTS ID Wind farms (no)
Installed capacity (MW)
Capacity factor ()
DE94 532 3502 025
ES11 180 3405 023
ES12 22 514 015
ES13 4 38 039
FR21 122 1647 016
FR23 25 245 032
FR25 32 258 036
FR51 61 561 032
PL63 35 592 029
PT11 127 1539 023
SE33 30 533 009
UKK3 26 112 056
Figure 8 shows the results of the assessment In most of the cases the electricity
produced correlates with the installed capacity In the case of the UKK3 a very high
capacity factor leads to a relatively high electricity production compared to other regions
Figure 8 Installed wind energy capacity and electricity production from wind
Annex III provides detailed information and maps about wind energy deployment in
every assessed region
425 Academia dimension
Table 8 summarises the parameters used for the academia dimension In addition to the
total number of publications the share of wind publications compared to all publications
in the area of energy and the share of wind publications compared to all publications
have been calculated
17
Table 8 Parameters under the academia dimension
Element Parameter Unit
Universities Number of universities No
Regional in-house knowledge Number of wind publications No
Share of wind publications
Share of wind publications in the energy area
Results from academia dimension show in terms of number of publications in the field of
wind energy high figures for DE94 with a relatively small number of academic entities
(3) in comparison with other regions (Figure 9) Also PT11 represents a high number of
publications from its 9 institutions On the contrary for PL63 the relative importance of
wind is very limited with 20 publications from 9 entities
Figure 9 Number of wind publication vs number of universities
In Figure 10 (left) the share of wind publications compared to the total number of
scientific publications (2016) is shown DE94 ES13 and PT11 show a relatively high
share (057 034 and 028 respectively) Other regions such as the regions in
France Poland and Sweden show very low shares (between 005 and 015 )
When we look at the share of wind publications compared to all scientific publications in
the area of energy (Figure 10 right) we see a similar picture However the Spanish
regions and UKK3 score better with relatively high shares (119 to 179 ) DE94
leads with 274
The complete list of universities considered in the study can be consulted in Annex IV
18
Figure 10 Share of wind publications compared to all (left) and all energy-related (right)
publications
426 Sectorial structure dimension
Table 9 shows the parameters used to assess the sectorial structure of the regions
Table 9 Parameters under the sectorial structure dimension
Element Parameter Unit
Energy sector size Number of wind companies No
Share of wind companies in the regions compared to total number of wind companies in the corresponding MS
Based on the estimations introduced in section 333 the total number of wind energy
companies assumed per regions is presented in Figure 11 Numbers range from 4 for
ES13 to 82 for DE94 It has to be kept in mind that the number of companies is
estimated since for many companies identified the geographical location was not
available (section 333)
Together with the absolute number of wind companies in a region the importance of a
region for the wind sector of their countries is shown in Figure 11 High shares can be
seen for PT11 which hosts about 25 of all Portuguese wind companies DE94 and
PL63 where 107 and 126 of total national companies are located
The share of the wind sectors of all other regions compared to the respective national
wind sector does not exceed 10 However it is important to note that none of the
regions considered includes the capital city of the Member State where often many
companies usually establish their headquarters Just to give an estimation of this effect
the regions of Madrid (ES30) and Icircle de France (FR10) include about 38 and 46 of
national companies in Spain and France respectively This effect of big cities might also
explain the results of PT11 as it includes Porto the second largest city in Portugal
19
Figure 11 Number of wind companies and regional share compared to national level
427 Innovation capacities dimension
In Table 10 the parameters used to assess the dimension innovation capacities are
shown
Table 10 Parameters under the innovation capacities dimension
Element Parameter Unit
RampD expenditure All sectors EURinhabitant
Business sector EURinhabitant
Government sector EURinhabitant
Concerning innovation capacities SE33 shows the largest RampD investments followed by
three French regions (FR23 FR25 FR51) and DE94 RampD investments are smallest in
UKK3 and PL63 When looking at relative numbers (RampD investments per capita) the
gap between SE33 and the other regions is even more pronounced (Annex V)
When we look at the private sector SE33 shows lower levels than FR23 meaning that
the contribution of government higher education and private non-profit sectors is
considerably high The case of UKK is also interesting because here 95 of the
investment comes from private sector On the contrary the share of public investments
is highest in ES13 or PL63 with about 19 and 16 respectively
20
Figure 12 Regional RampD expenditure including private and public sector
43 Analysis of similarities
Similarity matrixes are demonstrated useful for multi dimension comparison and
clustering [Mooi amp Sarstedt 2011] However as similarity matrixes are based on the
relative distance between elements to be compared they do not allow for a ranking or
classification amongst elements In other words they provide a relative comparison to
enable clustering processes The following dimension matrixes give an idea about how
similar regions are A higher value of the element ij in the matrix means a greater
distance between regions i and j
431 Dimensional similarity matrixes
Socio-economic dimension
The similarity matrix for the socio-economic dimension is shown in
Table 11 For this dimension SE33 is the region farthest away from the other regions
showing an average distance of 39 followed by FR51 with an average distance of 347
The two regions that have less in common are PL63 and SE33 with a distance of 487 It
is interesting to recall again the results of the individual parameters of this dimension
population (section 421) where PL63 and SE33 show very similar GDP but a high
difference in relative GDP Also population and urban population are very different for
those two regions A number of regions show high similarity including FR21 FR23 ES13
and UKK3
An interesting observation can be made within regions in the same country Although
from a socio-economic point of view regions within the same country were expected to
show similar values for this dimension the similarity amongst them is low For example
the distance between ES11 and FR21 is lower (171) than the distance between ES11
and ES13 (254)
21
Table 11 Similarity matrix for the socio-economic dimension
Region DE94 ES11 ES12 ES13 FR21 FR23 FR25 FR51 PL63 PT11 SE33 UKK3
DE94 000 161 259 334 197 107 293 194 301 302 437 329
ES11 161 000 220 254 171 134 220 228 168 154 428 254
ES12 259 220 000 180 174 166 291 421 175 336 441 157
ES13 334 254 180 000 150 231 172 443 213 315 315 028
FR21 197 171 174 150 000 102 144 319 234 283 291 150
FR23 107 134 166 231 102 000 226 269 232 281 377 224
FR25 293 220 291 172 144 226 000 334 279 254 234 193
FR51 194 228 421 443 319 269 334 000 393 281 485 449
PL63 301 168 175 213 234 232 279 393 000 203 487 206
PT11 302 154 336 315 283 281 254 281 203 000 473 325
SE33 437 428 441 315 291 377 234 485 487 473 000 333
UKK3 329 254 157 028 150 224 193 449 206 325 333 000
Average 265 217 256 240 201 214 240 347 263 292 391 241
Energy price dimension
In the case of the energy price dimension based on the assumptions of a homogeneous
national energy market price regions in the same country such as the Spanish and
French regions show a distance of 0 (Table 12)
In total 38 different parameters (energy prices) are compared (Annex I) including
industrial and domestic prices gas and electricity prices and prices with and without
taxes So the distance matrix reflects the effects of consumer profile energy sources
and taxation schemes For the energy price Sweden amp United Kingdom and Sweden amp
Germany are the most separated countries meanwhile Poland and France are the closest
when we compare regions from two different countries
Table 12 Distance matrix for the energy price dimension group indicators
Region DE94 ES11 ES12 ES13 FR21 FR23 FR25 FR51 PL63 PT11 SE33 UKK3
DE94 000 786 786 786 951 951 951 951 1020 1079 1306 865
ES11 786 000 000 000 871 871 871 871 1032 758 1109 721
ES12 786 000 000 000 871 871 871 871 1032 758 1109 721
ES13 786 000 000 000 871 871 871 871 1032 758 1109 721
FR21 951 871 871 871 000 000 000 000 644 936 847 949
FR23 951 871 871 871 000 000 000 000 644 936 847 949
FR25 951 871 871 871 000 000 000 000 644 936 847 949
FR51 951 871 871 871 000 000 000 000 644 936 847 949
PL63 1020 1032 1032 1032 644 644 644 644 000 1204 1120 999
PT11 1079 758 758 758 936 936 936 936 1204 000 986 1108
SE33 1306 1109 1109 1109 847 847 847 847 1120 986 000 1380
UKK3 865 721 721 721 949 949 949 949 999 1108 1380 000
Average 948 717 717 717 631 631 631 631 910 945 1046 937
22
Energy use dimension
In this case as only one parameter is considered the distance is the same as what the
Heating Degree Days parameter indicates In the overall similarity matrix which includes
all the parameters (section 432) normalised values for this parameter have been
incorporated
Wind energy deployment dimension
In the case of deployment there is not identified a certain level of proximity amongst
regions in the same country for Spain but it is in the case of French regions The reason
for this behaviour is probably the existence of resources in each region beyond legislation
or national support However as it can be checked for regions in Spain ES11 is far from
the other two even when they are geographically close and it could be assumed similar
levels of available resources
Table 13 Distance matrix for the wind deployment dimension group indicators
Region DE94 ES11 ES12 ES13 FR21 FR23 FR25 FR51 PL63 PT11 SE33 UKK3
DE94 000 240 431 472 324 440 441 405 452 414 342 489
ES11 240 000 268 325 159 287 294 255 299 250 194 367
ES12 431 268 000 195 115 134 167 135 117 064 120 329
ES13 472 325 195 000 238 063 037 082 081 138 282 144
FR21 324 159 115 238 000 180 202 157 180 117 059 337
FR23 440 287 134 063 180 000 033 036 027 075 220 198
FR25 441 294 167 037 202 033 000 046 058 106 246 165
FR51 405 255 135 082 157 036 046 000 056 072 203 197
PL63 452 299 117 081 180 027 058 056 000 067 214 221
PT11 414 250 064 138 117 075 106 072 067 000 149 266
SE33 342 194 120 282 059 220 246 203 214 149 000 391
UKK3 489 367 329 144 337 198 165 197 221 266 391 000
Average 405 267 189 187 188 154 163 149 161 156 220 282
Academia structure dimension
In terms of the role of wind in the academia a national pattern can be observed both for
Spain and France with the exception of FR51 (Table 14) The regions that are most
similar to other regions are SE33 ES12 and FR25 The regions that differ most from the
others are DE94 and PT11 This can be explained by the very high number of scientific
publications and universities in PT11 and the very high number of scientific publications
in DE94 (section 425)
Table 14 Distance matrix for the academia dimension group indicators
Regions DE94 ES11 ES12 ES13 FR21 FR23 FR25 FR51 PL63 PT11 SE33 UKK3
DE94 000 367 327 299 520 538 495 442 535 348 404 325
ES11 367 000 124 149 178 201 155 169 255 357 121 060
ES12 327 124 000 068 204 220 180 227 323 367 103 112
ES13 299 149 068 000 242 259 218 253 349 394 165 133
FR21 520 178 204 242 000 025 025 196 238 465 140 223
23
FR23 538 201 220 259 025 000 047 205 240 475 153 246
FR25 495 155 180 218 025 047 000 185 237 448 120 200
FR51 442 169 227 253 196 205 185 000 100 319 178 220
PL63 535 255 323 349 238 240 237 100 000 371 261 310
PT11 348 357 367 394 465 475 448 319 371 000 352 353
SE33 404 121 103 165 140 153 120 178 261 352 000 141
UKK3 325 060 112 133 223 246 200 220 310 353 141 000
Average 418 194 205 230 223 237 210 227 292 386 194 211
Sectorial structure dimension
For this dimension we have looked at the structure of the wind energy sector in the
region (section 426) Clearly PT11 PL63 and DE94 stand out In the case of DE94 this
is because of a high number of companies while in the case of PT11 and PL63 it is
because the regions share compared to Portugal is very high The Spanish and French
regions show greatest similarities
Table 15 Distance matrix for the sectorial structure dimension group indicators
Regions DE94 ES11 ES12 ES13 FR21 FR23 FR25 FR51 PL63 PT11 SE33 UKK3
DE94 000 144 287 371 356 356 345 333 291 326 281 338
ES11 144 000 145 231 214 214 202 190 160 263 137 198
ES12 287 145 000 085 070 070 058 048 131 308 033 052
ES13 371 231 085 000 021 021 033 046 179 360 102 033
FR21 356 214 070 021 000 000 013 026 158 339 083 023
FR23 356 214 070 021 000 000 013 026 158 339 083 023
FR25 345 202 058 033 013 013 000 013 147 328 070 020
FR51 333 190 048 046 026 026 013 000 136 317 057 025
PL63 291 160 131 179 158 158 147 136 000 181 099 160
PT11 326 263 308 360 339 339 328 317 181 000 276 341
SE33 281 137 033 102 083 083 070 057 099 276 000 073
UKK3 338 198 052 033 023 023 020 025 160 341 073 000
Average 312 191 117 135 118 118 113 111 164 307 117 117
Innovation capacities dimension
Under this dimension the Spanish regions show very high similarities with a maximum
distance of 051 (Table 16) In terms of individual regions SE33 is very distinct from the
other regions since its RampD spending is more than twice compared to the following region
(FR23) as shown in section 427 UKK3 with least RampD investment is also dissimilar
compared to other regions DE94 presents an average in terms of RampD investment and
RampD personnel and thus show highest similarity on average
Table 16 Distance matrix for the innovation capacities dimension group indicators
Regions DE94 ES11 ES12 ES13 FR21 FR23 FR25 FR51 PL63 PT11 SE33 UKK3
24
DE94 000 081 069 112 088 232 086 103 116 085 428 166
ES11 081 000 014 048 134 312 166 177 060 092 456 137
ES12 069 014 000 051 130 301 155 164 071 093 448 145
ES13 112 048 051 000 180 342 193 193 099 140 433 179
FR21 088 134 130 180 000 218 109 154 128 056 494 128
FR23 232 312 301 342 218 000 149 162 334 270 449 345
FR25 086 166 155 193 109 149 000 049 197 144 406 229
FR51 103 177 164 193 154 162 049 000 219 179 366 264
PL63 116 060 071 099 128 334 197 219 000 074 512 080
PT11 085 092 093 140 056 270 144 179 074 000 498 088
SE33 428 456 448 433 494 449 406 366 512 498 000 577
UKK3 166 137 145 179 128 345 229 264 080 088 577 000
Average 142 152 149 179 165 283 171 185 172 156 460 212
432 Overall similarity matrix
All parameters assessed can be combined into one single distance matrix (Table 17)
From this matrix it is clear that regions in the same country have highest similarities
ES11 ES12 and ES13 on the one hand and FR21 FR23 FR25 and FR51 on the other
hand On the contrary the most separated regions are SE33 and UKK3 followed by SE33
and DE94 To understand the reasons behind these results an analysis of correlation was
performed and is presented in section 45 Clearly the similarities are driven by
parameters that could not be retrieved on regional level but where national data had to
be used This was the case for energy prices a dimension which included a high number
of parameters (38) Subsequently we will explore various effects of weighting and PCA
on the results (section 44)
Table 17 Comprehensive overall similarity matrix
Regions DE94 ES11 ES12 ES13 FR21 FR23 FR25 FR51 PL63 PT11 SE33 UKK3
DE94 00 95 105 111 123 128 128 122 133 130 161 116
ES11 95 00 40 50 96 103 100 99 114 93 135 90
ES12 105 40 00 29 94 98 97 102 112 97 134 85
ES13 111 50 29 00 97 101 94 104 114 100 133 79
FR21 123 96 94 97 00 30 27 44 78 115 108 108
FR23 128 103 98 101 30 00 28 38 82 118 111 111
FR25 128 100 97 94 27 28 00 39 79 114 106 106
FR51 122 99 102 104 44 38 39 00 81 110 113 115
PL63 133 114 112 114 78 82 79 81 00 131 139 113
PT11 130 93 97 100 115 118 114 110 131 00 135 129
SE33 161 135 134 133 108 111 106 113 139 135 00 164
UKK3 116 90 85 79 108 111 106 115 113 129 164 00
Average 123 92 90 92 84 86 83 88 107 116 131 111
The overall similarity matrix can also be represented in 2D dimensions which helps
understanding [Buja et al 2008] Figure 13 reinforces the conclusion of similarities
25
amongst regions in the same country PL63 DE94 PT11 and SE33 are show least
similarities
Figure 13 2D distance representation of the overall similarity matrix Non-weighted analysis
44 Weighting amp Principal component analysis
As presented in the previous section the number of parameters under a particular
dimension may affect the multidimensional analysis In particular the energy price
dimension which includes a high number of parameters (48) at MS level produces a
concentration of regions within the same country (see Figure 13) To minimise the effect
of aggregation we have assessed two methods weighting and principal component
analysis
441 Weighting method
In the weighting method we have applied a coefficient for all the parameters within the
same dimension equal to the inverse of the sum of parameters within a given dimension
By doing this we ensure all the dimensions have the same effect in the complete
analysis
Results obtained are shown in Table 18 and Figure 14
Table 18 Comprehensive overall similarity matrix Weighted version
Regions DE94 ES11 ES12 ES13 FR21 FR23 FR25 FR51 PL63 PT11 SE33 UKK3
DE94 000 170 242 279 254 281 273 255 270 263 393 270
26
ES11 170 000 132 176 158 198 174 162 205 188 417 185
ES12 242 132 000 093 115 147 128 145 181 203 403 141
ES13 279 176 093 000 136 154 106 150 191 232 401 096
FR21 254 158 115 136 000 098 087 126 155 237 349 141
FR23 281 198 147 154 098 000 078 107 179 250 361 159
FR25 273 174 128 106 087 078 000 101 162 227 356 120
FR51 255 162 145 150 126 107 101 000 181 207 384 171
PL63 270 205 181 191 155 179 162 181 000 210 326 170
PT11 263 188 203 232 237 250 227 207 210 000 459 240
SE33 393 417 403 401 349 361 356 384 326 459 000 398
UKK3 270 185 141 096 141 159 120 171 170 240 398 000
Average 268 197 176 183 169 183 165 181 203 247 386 190
Figure 14 2D distance representation of the overall similarity matrix Weighted analysis
If Figure 13 and Figure 14 are compared it is clear that when the dimensions are
weighted the effect of parameters at national level is reduced Therefore a weighting
approach is required to avoid national effects
442 Principal component analysis
Once the weighted analysis was carried out the next step was to assess if we can reduce
the number of parameters to the minimum that provides an appropriate variance in the
dataset To do that we perform the principal component analysis [Shlens 2003]
Firstly the PCA is applied to the parameters without applying weights as presented in
section 432 and then to the weighted according (section 441)
27
Some considerations that have to be taken into account when performing the principal
component analysis are
The number of retained components has to be able to explain at least 80 of
variance
Only those parameters with a factor values higher than 020 in absolute value
have been retained
When the PCA is applied to non-weighted data 4 components are required and a total of
23 variables are kept which represent a reduction of 58 compared to the original
dataset (see Annex VI) If data are previously weighted 3 components are required to
explain at least 80 of variance (Figure 21) Then only 12 parameters (78 of
reduction) are sufficient to explain the dataset (Table 19)
Figure 15 Cumulative explained variance ratio PCA weighted dataset
Table 19 Parameters included in the reduced dataset PCA weighted
Dimension Parameters
Socio-economic Relative GDP
Wind energy deployment Installed capacity (MW)
Number of wind farms
Energy demand Heating Degree Days
Academia Number of universities
Number of wind publication
Share of wind publication in the energy area
Share of wind publications
Sectorial structure Number of companies with innovative activities
Representativeness of the regional sector at the
national level Energy sector size
Innovation capacities RampD expenditures All sectors
RampD expenditures Government sector
466
232
114
00
100
200
300
400
500
600
700
800
900
1000
1 2 3
indiviudal explained variance cumulative explanied variance
28
The reduced dataset includes 6 out of 7 dimensions The energy price dimension is the
only dimension not present which was the only dimension with information at MS level
Comparison of results
In order to assess whether the proposed dataset is providing the required information
the 2D regional distance is compared before and after applying the PCA (Figure 16)
Figure 16 2D distance representation of the overall similarity matrix Weighted analysis and dimensional reduction by PCA
As it can be assessed in Figure 16 dimensional reduction has produced similar results
compared to the analysis with the complete dataset From a clustering perspective both
analyses provide a well-defined cluster including ES13 ES12 UKK3 and the 4 French
regions (FR21 FR25 FR23 and FR51) On the other hand in both cases DE94 and SE33
remain as very separate entities
45 Analysis of potential correlation
Further to the information introduced in the previous section the distance matrix is
presented through a graphical correlation matrix providing information about dependency
between dimensions (Figure 17) This matrix is symmetric showing a perfect correlation
in the principal diagonal because each region is compared with itself For the rest of the
elements some interesting conclusions can be extracted
First of all there are no significant correlations between any of the dimensions analysed
The correlation coefficients range from 0002 to 0686 (Table 20) The dimensions that
show a somehow higher correlation are the academia and the sectorial structure
innovation capacities and energy use and wind energy deployment and sectorial
structure
29
Figure 17 Dimension matrix
Table 20 Correlation coefficient r between dimensions after applying PCA
Socio economic
Energy use
Wind energy
deployment
Academia Sectorial Structure
Innovation capacities
Socio economic 1000
30
Energy use 0119 1000
Wind energy
deployment 0407 0013 1000 Academia 0059 0210 0034 1000
Sectorial Structure 0010 0043 0180 0255 1000
Innovation capacities 0546 0014 0655 0011 0211 1000
According to the data presented wind energy deployment is correlated with the
innovation capacities in the region but not with the sectorial structure as it would be
expected Additionally the socio-economic dimension is considerably correlated with
innovation capacities and wind energy deployment Then we can conclude that the three
of them are linked
In relation to the sectorial structure this dimension is not highly correlated with any
other dimension although it would be expected with innovation capacities Academia is
also not correlated with any other dimension when it was likely to be linked to the
sectorial structure
31
5 Conclusions
Methodology objective
This pilot study developed a methodology to assess the status or regions related to
energy and applied it to wind energy as a case study The ultimate objective of such
analysis is to identify regions that are possibly more advanced and regions that may
benefit most from learning The methodology helps to understand barriers and gaps
towards regional deployment of energy technologies as well as the identification of the
set of parameters that better defines similarities amongst regions Ultimately the
methodology pursues the creation of regional clusters including regions with similar
problems or level of development
51 Conclusions related to the methodology
Set of parameters and data availability
The main challenge we faced in this analysis was the selection of parameters that could
better define the technology status in regions and data availability These two issues are
directly linked since data access limits initial identification of parameters Therefore as a
proof of concept the analysis explores data availability
Available information varies amongst regions even in the case of same data sources
This situation may prevent from extending the analysis to a larger number of regions
The case of parameters related to energy use (such as final energy consumption) is
especially critical (Table 29 and Table 30) An extended analysis including different
sources may be crucial to map energy supply and demand in regions In any case the
data for the final list of parameters used in this work is available for most of the regions
in Europe Therefore the analysis could be extended to regions but not increased in
terms of new parameters
Lack of regional information
To overcome the lack of information at regional level and in order to carry out extensive
statistical analyses proxy values derived from the national level could be developed
However singularities of regions amongst regions in the same countries will be lost be
interpolating from MS level As presented in the previous sections energy price
dimension comprises a set of parameters defined at MS level Therefore this dimension
increases the level of similarities amongst regions in the same country as it was
discussed in section 422 So data at MS level has to be processed and weighted to
minimise this national effect
Data structure
To simplify the understanding of the data analysis data has been structured in
dimensions that encompass one or several parameters These dimensions allow
comparison between regions and establishing correlations Through these dimensions we
come to conclusions such as the existence of a negative correlation between the socio-
economic status and energy prices or a positive between innovation capacities and the
energy use in regions (Figure 17)
Statistical analysis to reduce number of parameters
Due to the lack of a pre-defined comprehensive list of parameters because of the
complexity of the regional energy systems a dimensional reduction was assessed It was
expected that the dimension energy price may not be needed when defining differences
32
amongst regions Even more some other parameters may not be necessary to determine
regional similarities
For this reason PCA was applied As presented in section 442 the dataset could be
reduced to only 12 parameters instead of 55 As presented in Table 19 all dimensions
remain in the reduced dataset except for the energy price dimension as it was initially
expected
Replicability amp Robustness
As mentioned the initial goal of this study was the definition of a methodology that could
be easily replicated for other energy technology and other regions
Although most of the proposed data is available for every European region the major
drawback of the methodology is that for some further technologies specific parameters
are not easy to define especially for those technologies that show interactions with many
other technologies This is for example the case of heating and cooling technologies that
may appear in combination with renewables and some other energy solutions In any
case the methodology could be easily extended to many other technologies like ocean or
solar (including CSP STE and PV)
In terms of robustness from an statistical point of view it is important to highlight that
the more regions we have the more robust conclusions are In our case 12 regions have
been assessed However if more region from different countries are included results will
be more reliable
Concerning the PCA and due to the limited number of regions it is required to run the
PCA exercise for a different set of regions under different technologies and compare
whether the retained parameters woulc be the same as in the wind pilot case
52 Conclusions related to wind
Based on the analysis carried out the following conclusions can be extracted
Regions within the same country present a high level of similarities even when energy
prices are out of the analysis as in the case of the PCA application (Figure 15)
Regional overview
SE33 remains as outlier in most of the dimension except for Academia and Energy Use
The Spanish and French regions and UKK3 rank similarly This is the reason why they are
good candidates to define a working group based on the variables considered
Although PL63 and PT11 rank low in the socio-economic dimension they show average
values in the other dimensions In particular PT11 ranks high for academia and sectorial
structure
Correlation overview
There is no strong correlation between dimensions Only innovation capacities seem to be
correlated with socio-economic and wind energy deployment dimensions Therefore we
can conclude that innovation support the development of wind energy at the regional
scale
Final mark
Finally to ensure the consistency of the outcomes from the analysis more regions will be
required In the future when more regions show their interest in wind they will be
incorporated in this analysis
33
References
[BNEF 2015] BNEF Bloomberg New Energy Finance
[Buja et al 2008] Buja A Swayne DF Littman ML Dean N Hofmann H and Chen L Data
visualization with multidimensional scaling Journal of Comp and Graph Stats 17
(444ndash472)
[Cornish 2007] Cornish R Statistics 3 1 Cluster Analysis Hierarchical agglomerative
methods Analysis (1ndash5) DOI1041359781412983648
[Daraio 2015] Daraio C The Added Value of the European Map of Excellence and
Specialization ( EMES ) for R amp I Policy Making
[European Commission 2011] European Commission European territorial cooperation
Building bridges between people
[Eurostat 2013] Eurostat Heating degree-days by NUTS 2 regions - monthly data
[Eurostat 2015a] Eurostat Population on 1 January by age sex and NUTS 2 region
Available at httpappssoeurostateceuropaeunuishowdo
[Eurostat 2015b] Eurostat Gross domestic product (GDP) at current market prices by
NUTS 2 regions
[Eurostat 2015c] Eurostat Gas prices for domestic consumers - bi-annual data (from
2007 onwards) URL httpappssoeurostateceuropaeunuishowdo
[Eurostat 2015d] Eurostat Gas prices for industrial consumers - bi-annual data (from
2007 onwards)
[Eurostat 2015e] Eurostat Electricity prices for domestic consumers - bi-annual data
(from 2007 onwards) URL httpappssoeurostateceuropaeunuishowdo
[Eurostat 2015f] Eurostat Electricity prices for industrial consumers - bi-annual data
(from 2007 onwards)
[Eurostat 2015g] Eurostat Energy primary production and final consumption by NUTS 2
regions - 1 000 tonnes of oil equivalent Available at
httpappssoeurostateceuropaeunuishowdo
[Eurostat 2016a] Eurostat Total intramural RampD expenditure (GERD) by sectors of
performance and NUTS 2 regions
[Eurostat 2016b] Eurostat Total RampD personnel and researchers by sectors of
performance sex and NUTS 2 regions
[EyeRIS3 2015] EyeRIS3 URL https3platformjrceceuropaeumap
[Foray amp Goenega 2013] Foray D and Goenega X The Goals of Smart Specialisation
(18) DOI10279120158
[Gonzalez Aparicio et al 2016] Gonzalez Aparicio I Andreas Z Francesco C Fabio M and
Thomas H EMHIRES dataset Part I Wind power generation
[IEA 2001] International Energy Agency Indicators for Sustainable Energy Development
(20)
[Jimeacutenez Navarro amp Uihlein 2016] Jimeacutenez Navarro JP and Uihlein A Mapping regional
energy interests for S3PEnergy
[Mooi amp Sarstedt 2011] Mooi E and Sarstedt M Cluster Analysis Springer Berlin
Heidelberg Berlin Heidelberg Available at httpdxdoiorg101007978-3-642-
12541-6_9
[Navarro et al 2014] Navarro M Gibaja JJ Franco S Murciego A Gianelle C Hegy FB
and Kleibrink A Regional benchmarking in the smart specialisation process
Identification of reference regions based on structural similarity (1ndash35)
34
[Scopus 2016] Scopus Scopus URL httpwwwscopuscom
[Shlens 2003] Shlens J A tutorial on principal component analysis
[The Wind Power 2015] The Wind Power The wind power wind farm dataset
35
List of abbreviations and definitions
GDP Gross Domestic Product
HDD Heating Degree Days
KPI Key Performance Indicators
KTOE Kilo tonne of Oil Equivalent
MS Member State
NUTS Nomenclature of territorial units for statistics
PCA Principal Component Analysis
RIS3 Regional Research and Innovation Strategies for Smart Specialisation
36
List of figures
Figure 1 Share of wind energy companies with no geographical information available 9
Figure 2 GDP (left) and relative GDP (right) according to region 12
Figure 3 Population (left) and rate of urban population (right) according to region 12
Figure 4 Average final energy prices according to Member State 13
Figure 5 Final domestic energy prices and relative GDP according to region 14
Figure 6 Final industrial energy prices and relative GDP according to region 14
Figure 7 Heating Degree Days 2009 15
Figure 8 Installed wind energy capacity and electricity production from wind 16
Figure 9 Number of wind publication vs number of universities 17
Figure 10 Share of wind publications compared to all (left) and all energy-related (right)
publications 18
Figure 11 Number of wind companies and regional share compared to national level 19
Figure 12 Regional RampD expenditure including private and public sector 20
Figure 13 2D distance representation of the overall similarity matrix Non-weighted
analysis 25
Figure 14 2D distance representation of the overall similarity matrix Weighted analysis26
Figure 15 Cumulative explained variance ratio PCA weighted dataset 27
Figure 16 2D distance representation of the overall similarity matrix Weighted analysis
and dimensional reduction by PCA 28
Figure 17 Dimension matrix 29
Figure 18 Installed wind farms in DE94 ES11 ES12 and ES13 45
Figure 19 Installed wind farms in FR21 FR23 FR25 and FR51 46
Figure 20 Installed wind farms in PL63 PT11 SE33 and UKK3 47
Figure 21 Cumulative explained variance ratio PCA non-weighted dataset 51
37
List of tables
Table 1 List of indicators used for the wind regional benchmarking 7
Table 2 Region with wind energy interests 11
Table 3 Parameters under the socio-economic dimension 12
Table 4 Parameters under the energy price dimension 13
Table 5 Parameters under the energy use dimension 15
Table 6 Parameters under the wind energy deployment dimension 15
Table 7 Results for wind energy deployment 16
Table 8 Parameters under the academia dimension 17
Table 9 Parameters under the sectorial structure dimension 18
Table 10 Parameters under the innovation capacities dimension 19
Table 11 Similarity matrix for the socio-economic dimension 21
Table 12 Distance matrix for the energy price dimension group indicators 21
Table 13 Distance matrix for the wind deployment dimension group indicators 22
Table 14 Distance matrix for the academia dimension group indicators 22
Table 15 Distance matrix for the sectorial structure dimension group indicators 23
Table 16 Distance matrix for the innovation capacities dimension group indicators 23
Table 17 Comprehensive overall similarity matrix 24
Table 18 Comprehensive overall similarity matrix Weighted version 25
Table 19 Parameters included in the reduced dataset PCA weighted 27
Table 20 Correlation coefficient r between dimensions after applying PCA 29
Table 29 Total final energy consumption (ktoe) from 2009 to 2013 44
Table 30 Total final energy consumption (ktoe) by households from 2009 to 2013 44
Table 31 List of universities in Wind interest regions 48
Table 32 Total intramural RampD expenditure (GERD) by sectors of performance and
NUTS 2 regions 2013 (EURinhabitant) 50
Table 33 Total RampD personnel by 2013 50
Table 34 Parameters included in the reduced dataset PCA non-weighted 51
38
Annexes
39
Annex I Energy price parameters
Gas prices for domestic users
Table 21 Gas price before taxes and levies for domestic users according to the range of energy consumption in 2014
NUTS2
Code
Before taxes and levies
Band D1 Consumption lt 20 GJ
Band D2 20 GJ lt Consumption lt 200 GJ
Band D3 Consumption gt 200 GJ
DE94 00810 00513 00474
ES11 00986 00769 00474
ES12 00986 00769 00474
ES13 00986 00769 00562
FR21 01249 00626 00562
FR23 01249 00626 00562
FR25 01249 00626 00562
FR51 01249 00626 00510
PL63 00526 00407 00390
PT11 00966 00802 00709
SE33 01106 00626 00511
UKK3 00924 00615 00535
Source [Eurostat 2015c]
Table 22 Gas final price for domestic users according to the range of energy consumption in 2014
NUTS2 Code
Final price
Band D1 Consumption lt 20 GJ
Band D2 20 GJ lt Consumption lt 200 GJ
Band D3 Consumption gt 200 GJ
DE94 01063 00681 00634
ES11 01221 00959 00708
ES12 01221 00959 00708
ES13 01221 00959 00708
FR21 01512 00762 00621
FR23 01512 00762 00621
FR25 01512 00762 00621
FR51 01512 00762 00621
PL63 00647 00500 00479
PT11 01256 01039 00923
SE33 01739 01138 00995
UKK3 00970 00646 00561
Source [Eurostat 2015c]
40
Electricity prices for domestic
Table 23 Electricity price before taxes and levies for domestic sector in wind interest regions according to the range of energy consumption
NUTS2 Code
Before taxes and levies
Band DA Consumption lt 1 000 kWh
Band DB 1 000 kWh lt Consumption lt 2 500 kWh
Band DC 2 500 kWh lt Consumption lt 5 000 kWh
Band DD 5 000 kWh lt Consumption lt 15 000 kWh
Band DE Consumption gt 15 000 kWh
DE94 02576 01647 01440 01317 01275
ES11 03667 02166 01861 01659 01405
ES12 03667 02166 01861 01659 01405
ES13 03667 02166 01861 01659 01405
FR21 02087 01268 01094 00974 00924
FR23 02087 01268 01094 00974 00924
FR25 02087 01268 01094 00974 00924
FR51 02087 01268 01094 00974 00924
PL63 01411 01161 01097 01062 01065
PT11 02192 01392 01301 01254 01210
SE33 02547 01430 01194 00986 00806
UKK3 02383 02124 01917 01731 01598
Source [Eurostat 2015e]
Table 24 Electricity final price for domestic sector in wind interest regions according to the range
of energy consumption
NUTS2 Code
Final price
Band DA
Consumption lt 1 000 kWh
Band DB 1
000 kWh lt Consumption lt 2 500 kWh
Band DC 2
500 kWh lt Consumption lt 5 000 kWh
Band DD 5
000 kWh lt Consumption lt 15 000 kWh
Band DE
Consumption gt 15 000 kWh
DE94 04336 03230 02974 02827 02714
ES11 04664 02755 02367 02110 01787
ES12 04664 02755 02367 02110 01787
ES13 04664 02755 02367 02110 01787
FR21 02676 01806 01620 01491 01440
FR23 02676 01806 01620 01491 01440
FR25 02676 01806 01620 01491 01440
FR51 02676 01806 01620 01491 01440
PL63 01794 01486 01408 01364 01368
PT11 03940 02420 02231 02132 02008
SE33 03559 02162 01867 01607 01383
UKK3 02503 02230 02013 01817 01679
Source [Eurostat 2015e]
41
Gas prices for industrial
Table 25 Gas price before taxes and levies for industrial sector in wind interest regions according to the range of energy consumption
NUTS2 Code
Final price
Band I1 Consumption lt 1 000 GJ
Band I2 1 000 GJ lt Consumption lt 10 000 GJ
Band I3 10 000 GJ lt Consumption lt 100 000 GJ
Band I4 100 000 GJ lt Consumption lt 1 000 000 GJ
Band I5 1 000 000 GJ lt Consumption lt 4 000 000 GJ
Band I6 Consumption gt 4 000 000 GJ
DE94 00443 00420 00361 00278 00255 00235
ES11 00548 00450 00369 00342 00320 00309
ES12 00548 00450 00369 00342 00320 00309
ES13 00548 00450 00369 00342 00320 00309
FR21 00579 00454 00360 00295 00261
FR23 00579 00454 00360 00295 00261
FR25 00579 00454 00360 00295 00261
FR51 00579 00454 00360 00295 00261
PL63 00421 00416 00359 00317 00302
PT11 00726 00590 00437 00377 00358
SE33 00572 00456 00356 00319 00323
UKK3 00580 00383 00332 00277 00245
Source [Eurostat 2015d]
Table 26 Gas final price for industrial sector in wind interest regions according to the range of energy consumption
NUTS2 Code
Final price
Band I1 Consumption lt 1 000 GJ
Band I2 1 000 GJ lt Consumption lt 10 000 GJ
Band I3 10 000 GJ lt Consumption lt 100 000 GJ
Band I4 100 000 GJ lt Consumption lt 1 000 000 GJ
Band I5 1 000 000 GJ lt Consumption lt 4 000 000 GJ
Band I6 Consumption gt 4 000 000 GJ
DE94 00576 00548 00478 00379 00351 00327
ES11 00670 00550 00452 00420 00394 00381
ES12 00670 00550 00452 00420 00394 00381
ES13 00670 00550 00452 00420 00394 00381
FR21 00726 00563 00445 00352 00306
FR23 00726 00563 00445 00352 00306
FR25 00726 00563 00445 00352 00306
FR51 00726 00563 00445 00352 00306
PL63 00530 00521 00448 00393 00371
PT11 00961 00746 00546 00469 00441
SE33 01072 00926 00801 00755 00760
UKK3 00742 00458 00417 00343 00301
Source [Eurostat 2015d]
42
Electricity prices for industrial
Table 27 Electricity price before taxes and levies for industrial sector in wind interest regions according to the range of energy consumption
NUTS2 Code
Final price
Band IA Consum
ption lt 20 MWh
Band IB 20 MWh lt Consumpti
on lt 500 MWh
Band IC 500 MWh lt
Consumption lt 2 000 MWh
Band ID 2 000 MWh lt
Consumption lt 20 000 MWh
Band IE 20 000 MWh lt
Consumption lt 70 000 MWh
Band IF 70 000 MWh lt
Consumption lt 150 000 MWh
Band IG Consumption gt 150
000 MWh
DE94 01403 01029 00808 00714 00627 00608
ES11 02782 01482 01110 00979 00792 00736 00646
ES12 02782 01482 01110 00979 00792 00736 00646
ES13 02782 01482 01110 00979 00792 00736 00646
FR21 01168 00884 00687 00604 00572 00521
FR23 01168 00884 00687 00604 00572 00521
FR25 01168 00884 00687 00604 00572 00521
FR51 01168 00884 00687 00604 00572 00521
PL63 01464 01071 00786 00665 00611 00557 00517
PT11 01585 01272 01052 00891 00767 00697
SE33 01325 00769 00661 00593 00528 00456
UKK3 01726 01447 01290 01179 01176 01149 01126
Source [Eurostat 2015f]
Table 28 Electricity final price for industrial sector in wind interest regions according to the range of energy consumption
NUTS2 Code
Final price
Band IA Consumption lt 20 MWh
Band IB 20 MWh lt Consumption lt 500 MWh
Band IC 500 MWh lt Consumption lt 2 000 MWh
Band ID 2 000 MWh lt Consumption lt 20 000 MWh
Band IE 20 000 MWh lt Consumption lt 70 000 MWh
Band IF 70 000 MWh lt Consumption lt 150 000 MWh
Band IG Consumption gt 150 000 MWh
DE94 02909 02302 01992 01761 01512 01412
ES11 03539 01885 01412 01245 01007 00936 00822
ES12 03539 01885 01412 01245 01007 00936 00822
ES13 03539 01885 01412 01245 01007 00936 00822
FR21 01702 01350 01090 00944 00841 00647
FR23 01702 01350 01090 00944 00841 00647
FR25 01702 01350 01090 00944 00841 00647
FR51 01702 01350 01090 00944 00841 00647
PL63 01860 01375 01025 00876 00810 00744 00694
43
PT11 02328 01812 01460 01241 01082 01030
SE33 01663 00968 00833 00747 00667 00577
UKK3 02125 01798 01606 01458 01442 01406 01372
Source [Eurostat 2015f]
44
Annex II Energy use
Total energy consumption
Table 29 Total final energy consumption (ktoe) from 2009 to 2013
NUTS2 Code 2009 2010 2011 2012 2013
DE94
ES11 2643564 2734018 2725405 2566841
ES12 1312412 1352243 1343235 1311513
ES13 793069 813102 799814 77047
FR21
FR23
FR25
FR51
PL63
PT11
SE33
UKK3 96367
Source [Eurostat 2015g]
Final energy consumption by households
Table 30 Total final energy consumption (ktoe) by households from 2009 to 2013
2009 2010 2011 2012 2013
Weser-Ems
Galicia 1033025 1095095 1089144 637592
Principado de Asturias 37708 400683 398111 217768
Cantabria 15681 167959 166326 126548
Champagne-Ardenne
Haute-Normandie
Basse-Normandie
Pays de la Loire
Pomorskie
Norte
Oumlvre Norrland
Cornwall and Isles of Scilly 35414
Source [Eurostat 2015g]
45
Annex III Wind energy deployment
In this section location of wind farms for different regions under study are presented In
the maps the size of the bubbles represents the size of the farms in terms of power
capacity installed
Figure 18 Installed wind farms in DE94 ES11 ES12 and ES13
46
Figure 19 Installed wind farms in FR21 FR23 FR25 and FR51
47
Figure 20 Installed wind farms in PL63 PT11 SE33 and UKK3
48
Annex IV Academia indicators
Identification of regional universities have been based on the Authorities file of European
Universities [Daraio 2015]
Table 31 List of universities in Wind interest regions
NUTS2
Code
Universities
DE94 Carl von Ossietzky Universitaumlt Oldenburg
Universitaumlt Osnabruumlck
Universitaumlt Vechta
ES12 Universidad de Oviedo
ES13 Universidad de Cantabria
FR21 Universiteacute de technologie de Troyes
Universiteacute de Reims Champagne-Ardenne
FR23 Institut national des sciences appliqueacutees de Rouen
Universiteacute de Rouen
FR25 Universiteacute de Caen Basse-Normandie
Eacutecole nationale supeacuterieure dingeacutenieurs de Caen
FR51 Ecole centrale de Nantes
Universiteacute de Nantes
Eacutecole nationale dingeacutenieurs des techniques des industries agricoles et
alimentaires
Eacutecole nationale supeacuterieure des mines de Nantes
Universiteacute catholique de lOuest
Universiteacute dAngers
Universiteacute du Maine
PL63 Akademia Marynarki Wojennej w Gdyni
Gdański Uniwersytet Medyczny
Akademia Morska w Gdyni
Akademia Muzyczna im Stanisława Moniuszki w Gdańsku
Akademia Pomorska w Słupsku
Akademia Sztuk Pięknych w Gdańsku
Akademia Wychowania Fizycznego i Sportu im Jędrzeja Śniadeckiego w Gdańsku
Politechnika Gdańska
Uniwersytet Gdański
PT11 Universidade do Minho
Universidade do Porto
Universidade de Traacutes-os-Montes e Alto Douro
Instituto Politeacutecnico de Braganccedila
Instituto Politeacutecnico do Porto
Universidade Fernando Pessoa
Universidade Lusiacuteada (Porto)
Universidade Lusoacutefona do Porto
49
Universidade Portucalense Infante D Henrique
SE33 Umearing universitet
Lulearing tekniska universitet
Source [Daraio 2015]
50
Annex V Innovation capacities
Table 32 Total intramural RampD expenditure (GERD) by sectors of performance and NUTS 2 regions 2013 (EURinhabitant)
All sectors Business enterprise sector
Government sector
Higher education sector
Private non-profit
sector
DE94 235 1446 204 70
ES11 1697 778 252
ES12 1721 905 26 554 01
ES13 1865 656 347
FR21 2103 1439 23 642
FR23 4002 3326 23 653
FR25 3279 2133 158 988
FR51 3513 2275 253 984
PL63 984 514 158 312 01
PT11 1871 978 69 818 07
SE33 10828 2426 759 7644
UKK3 439 417 0 22 0
Source [Eurostat 2016a]
Table 33 Total RampD personnel by 2013
NUTS2 code Total RampD personnel (2013)
DE94 9734
ES11 17710
ES12 6688
ES13 3585
FR21
FR23
FR25
FR51
PL63 8575
PT11 31315
SE33 7770
UKK3 699
Source [Eurostat 2016b]
51
Annex VI Annex VII Results of PCA analysis for non-weighted dataset
Figure 21 Cumulative explained variance ratio PCA non-weighted dataset
Table 34 Parameters included in the reduced dataset PCA non-weighted
Parameters
Population 2013
Absolute GDP
Relative GDP
Band DB 1 000 kWh lt Consumption lt 2 500 kWh
Band DC 2 500 kWh lt Consumption lt 5 000 kWh
Band DD 5 000 kWh lt Consumption lt 15 000 kWh
Band DE Consumption gt 15 000 kWh
Band DE Consumption gt 15 000 kWh1
Band I2 1 000 GJ lt Consumption lt 10 000 GJ
Band I3 10 000 GJ lt Consumption lt 100 000 GJ
Band I5 1 000 000 GJ lt Consumption lt 4 000 000 GJ
Band I1 Consumption lt 1 000 GJ1
Band I2 1 000 GJ lt Consumption lt 10 000 GJ1
Band I3 10 000 GJ lt Consumption lt 100 000 GJ1
Band I4 100 000 GJ lt Consumption lt 1 000 000 GJ1
Band I5 1 000 000 GJ lt Consumption lt 4 000 000 GJ1
Band IB 20 MWh lt Consumption lt 500 MWh1
Installed capacity
Number of wind farms
Number of universities
Number of companies
Representativeness of the regional sector at the national level Energy sector size
RampD expenditures Government sector
367
213
134 112
00
100
200
300
400
500
600
700
800
900
1000
1 2 3 4
indiviudal explained variance cumulative explanied variance
Europe Direct is a service to help you find answers
to your questions about the European Union
Freephone number ()
00 800 6 7 8 9 10 11 () The information given is free as are most calls (though some operators phone boxes or hotels may
charge you)
More information on the European Union is available on the internet (httpeuropaeu)
HOW TO OBTAIN EU PUBLICATIONS
Free publications
bull one copy
via EU Bookshop (httpbookshopeuropaeu)
bull more than one copy or postersmaps
from the European Unionrsquos representations (httpeceuropaeurepresent_enhtm) from the delegations in non-EU countries (httpeeaseuropaeudelegationsindex_enhtm)
by contacting the Europe Direct service (httpeuropaeueuropedirectindex_enhtm) or calling 00 800 6 7 8 9 10 11 (freephone number from anywhere in the EU) () () The information given is free as are most calls (though some operators phone boxes or hotels may charge you)
Priced publications
bull via EU Bookshop (httpbookshopeuropaeu)
KJ-N
A-2
8515-E
N-N
doi102760816204
ISBN 978-92-79-66661-2
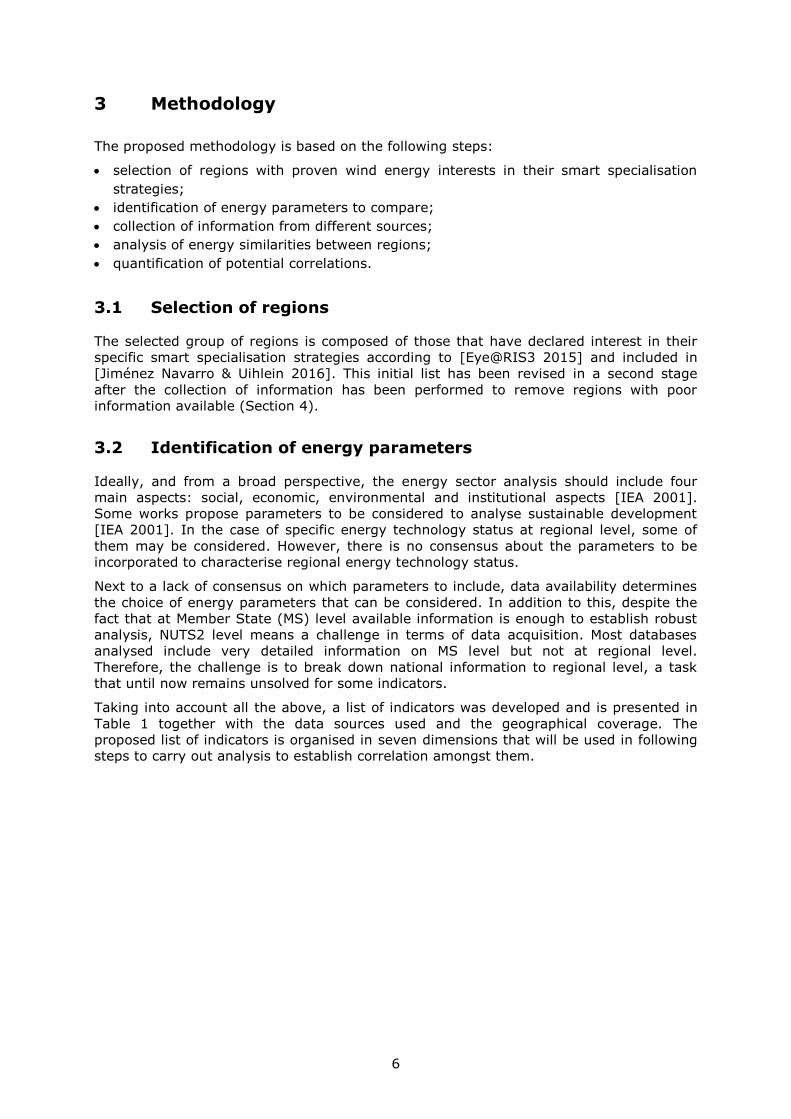
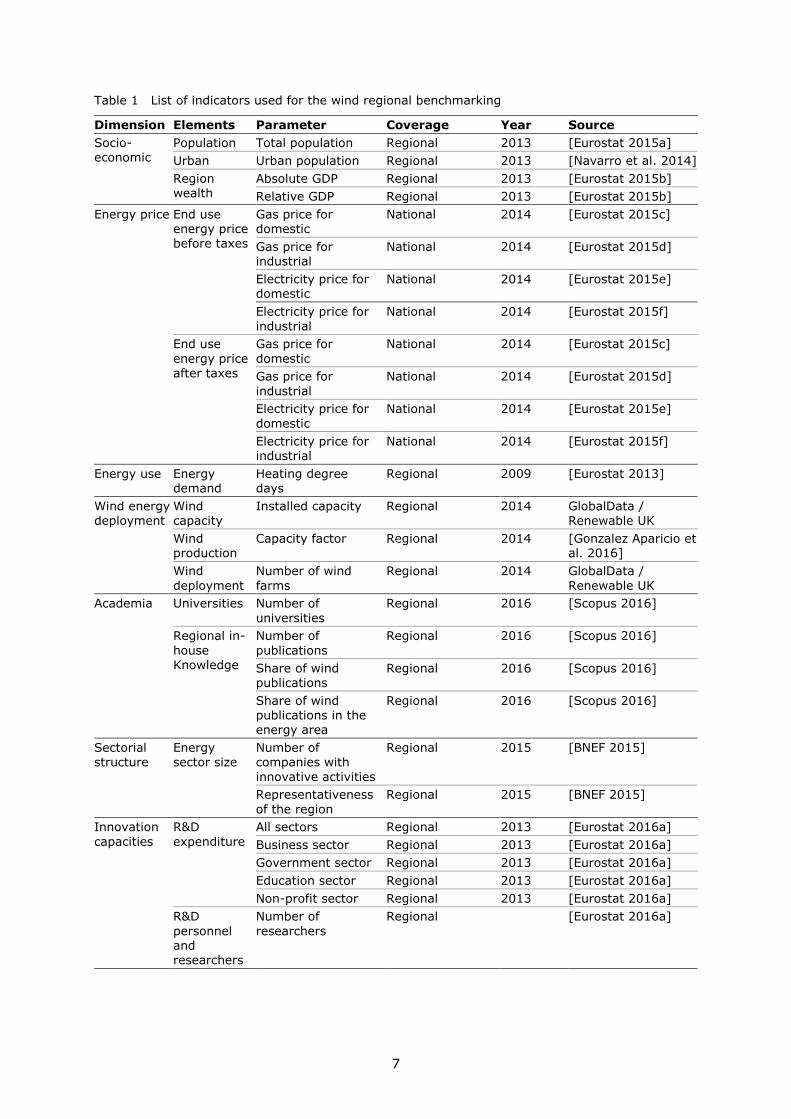
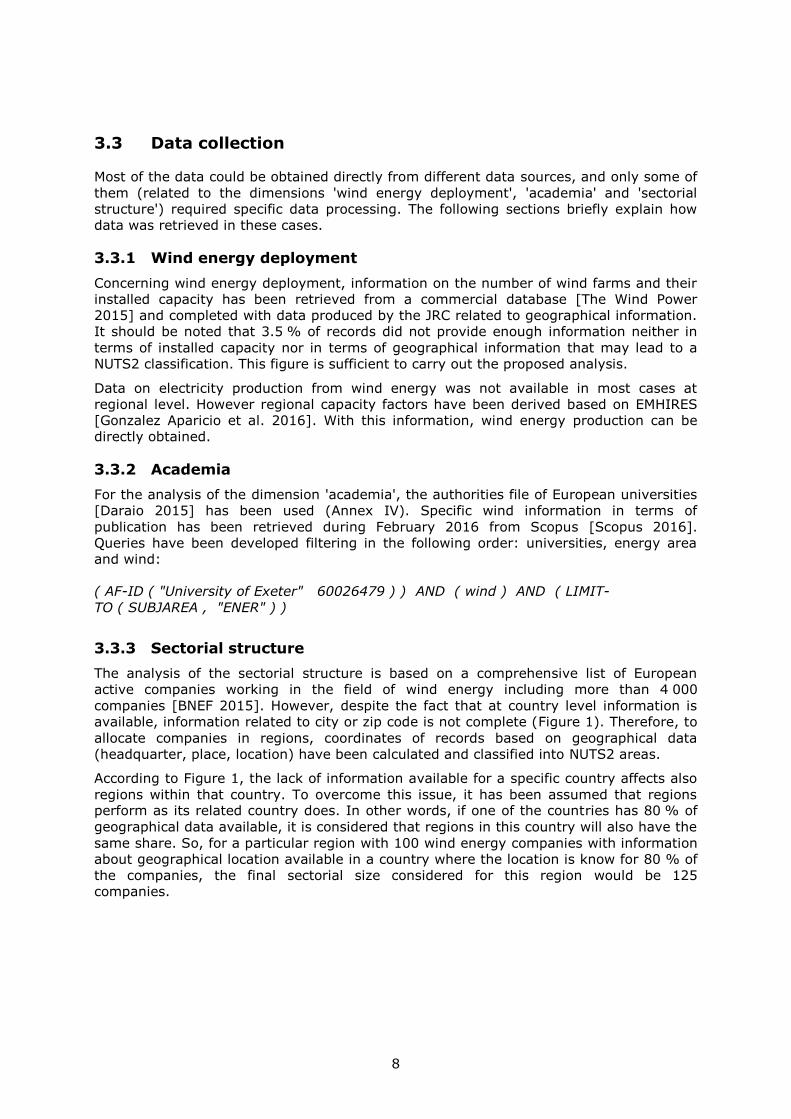
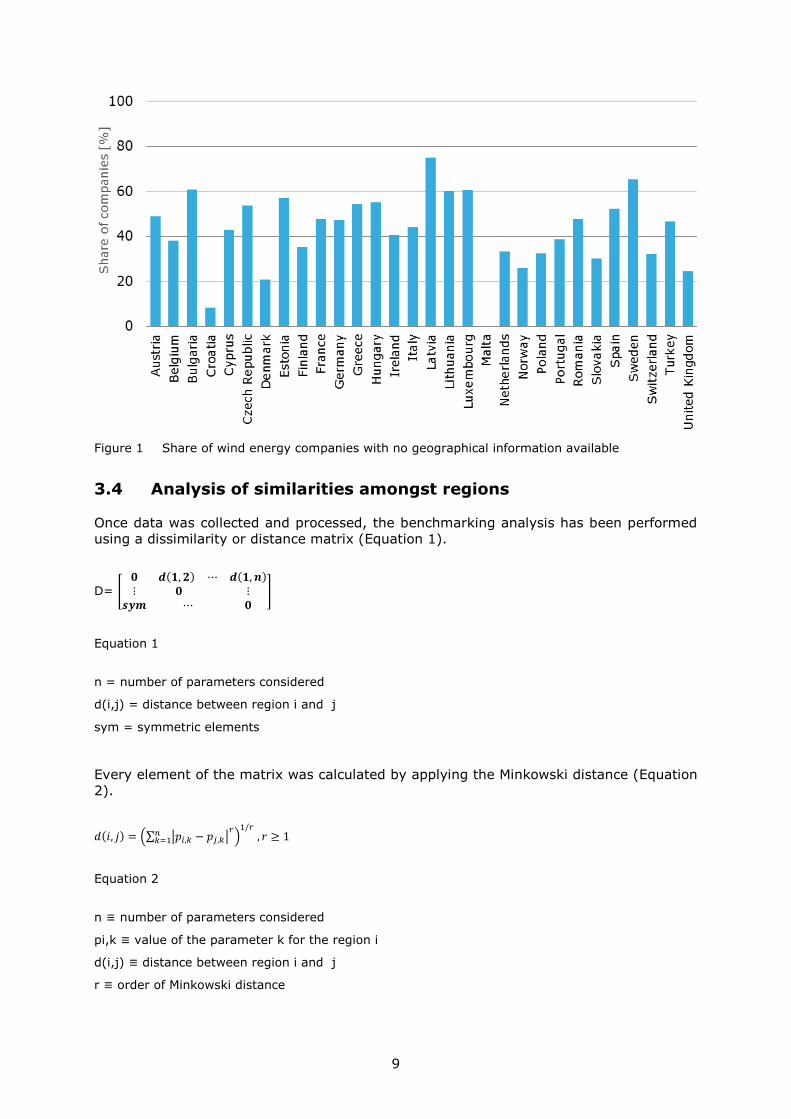
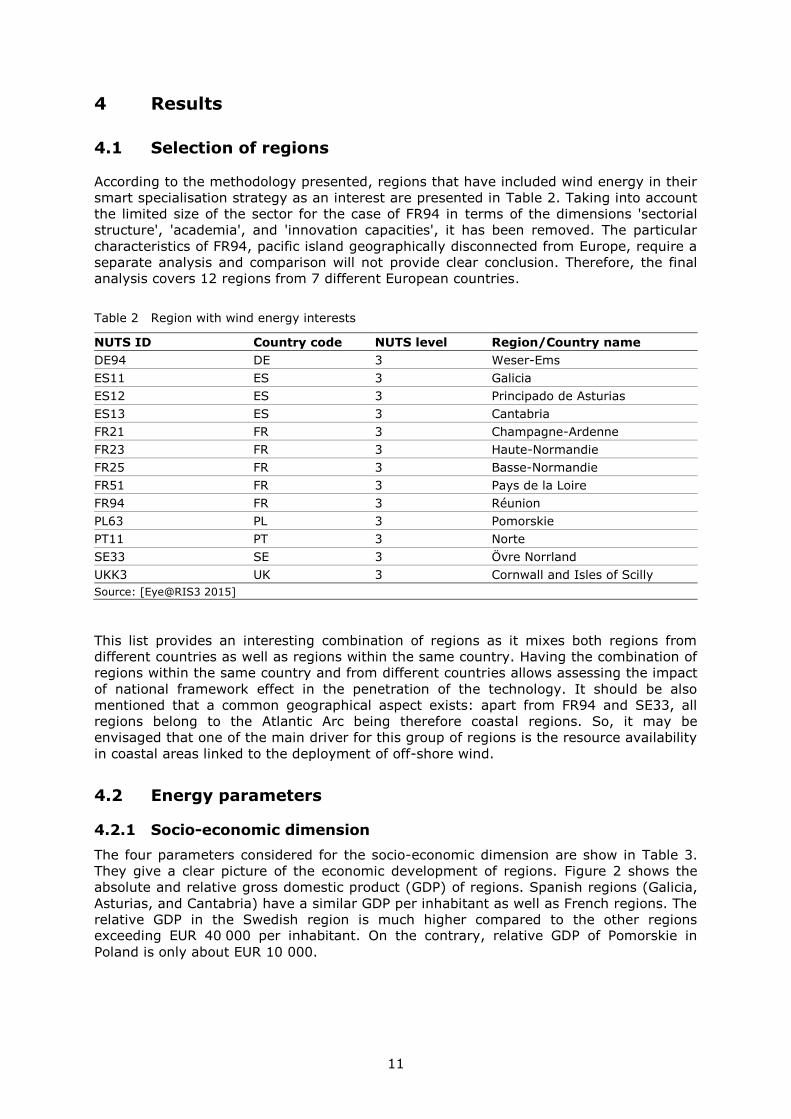
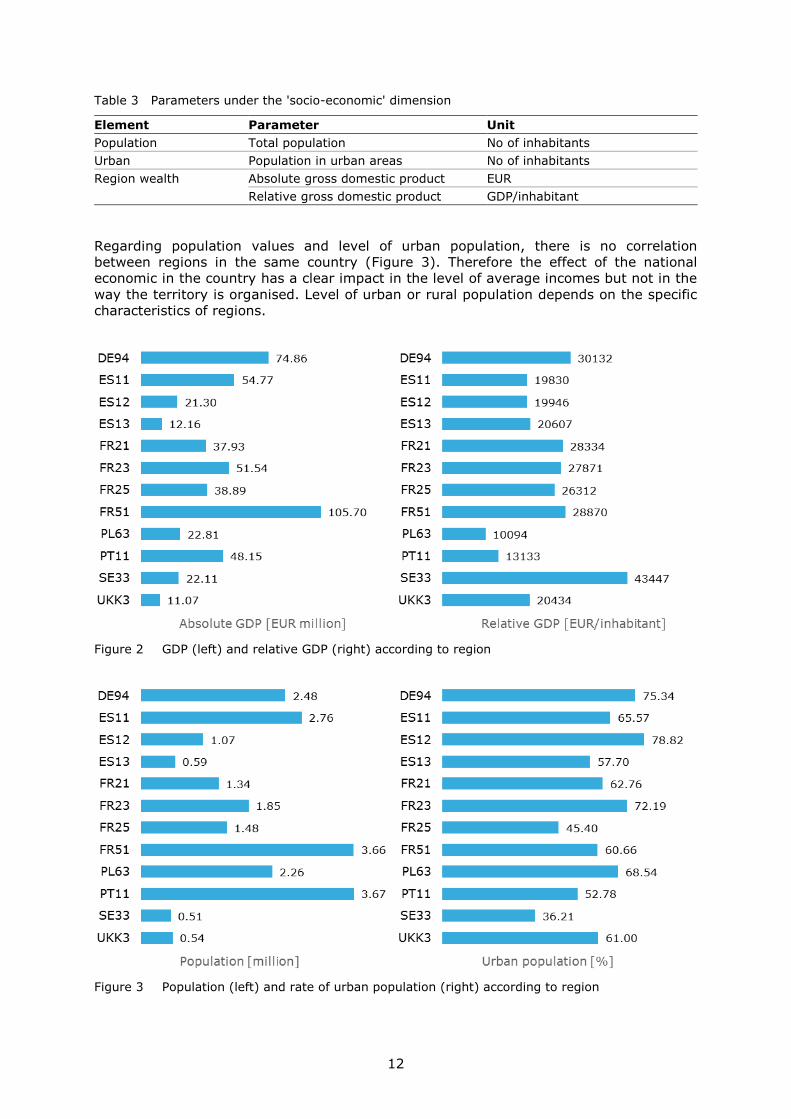
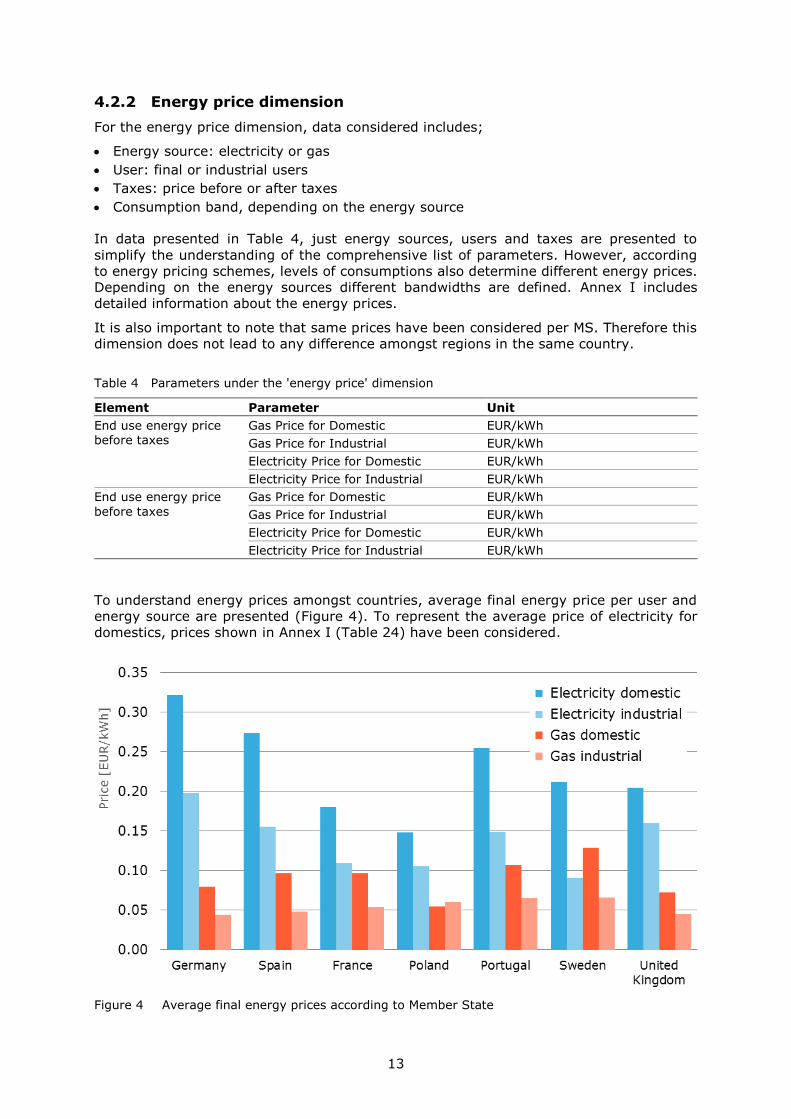
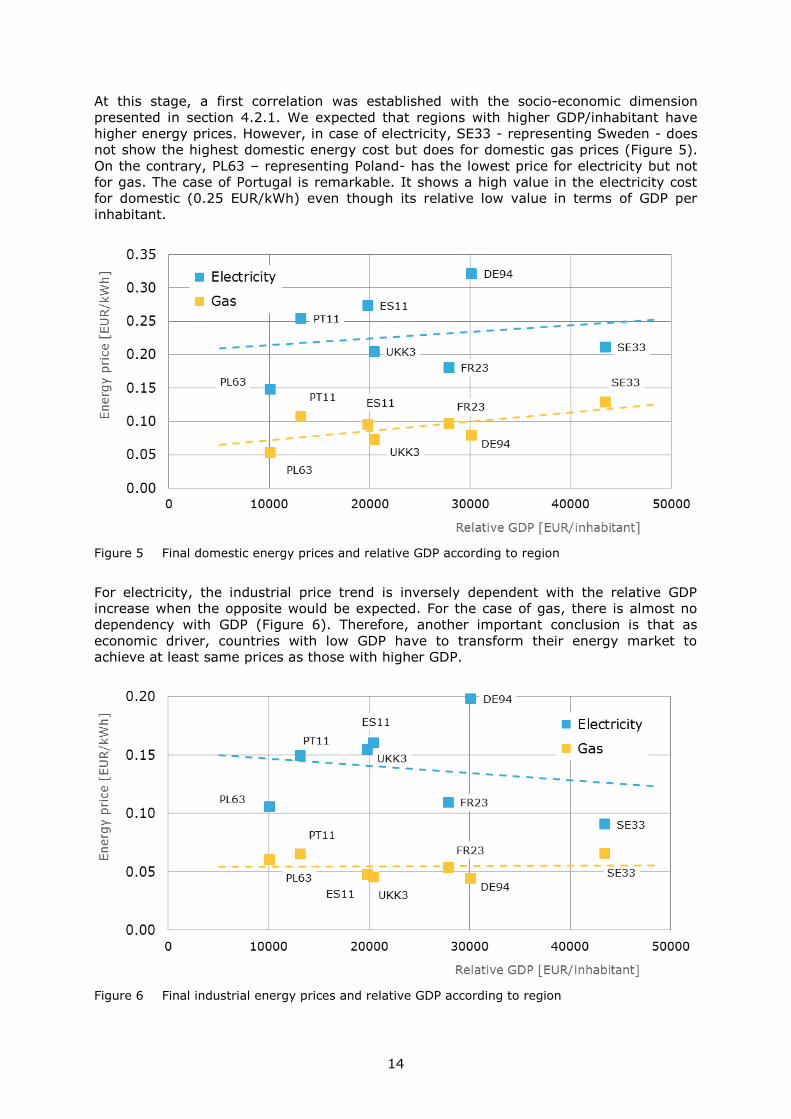
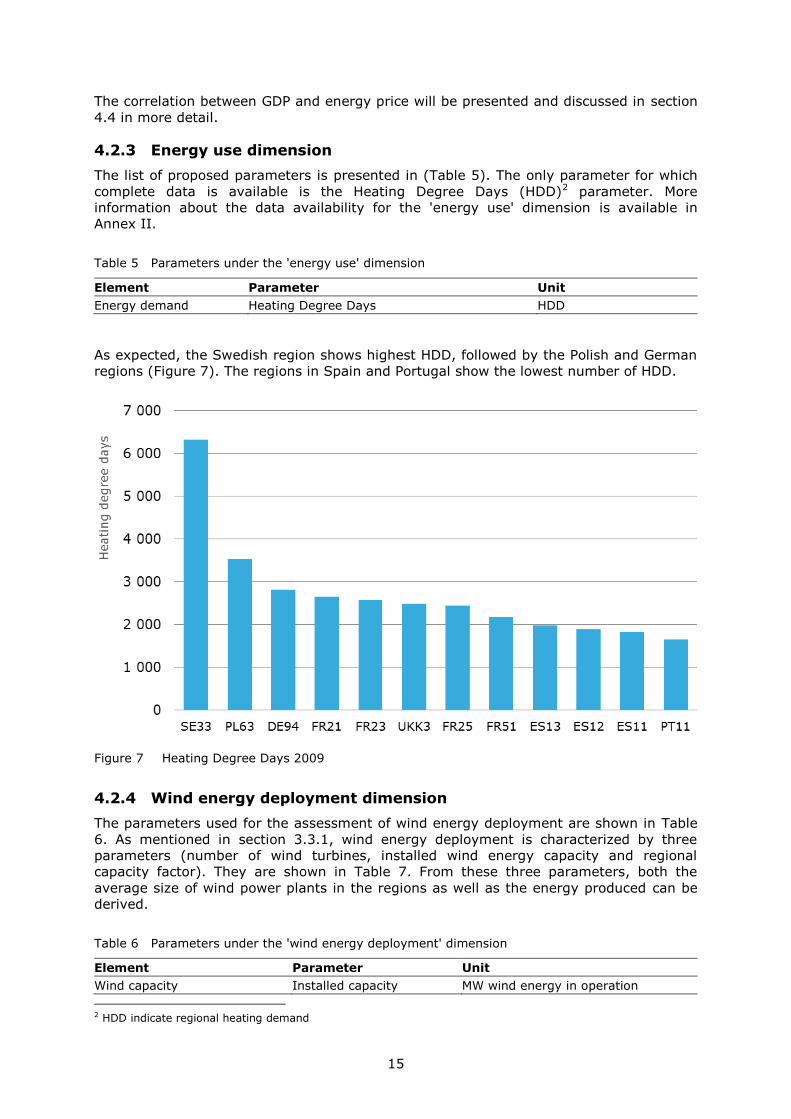
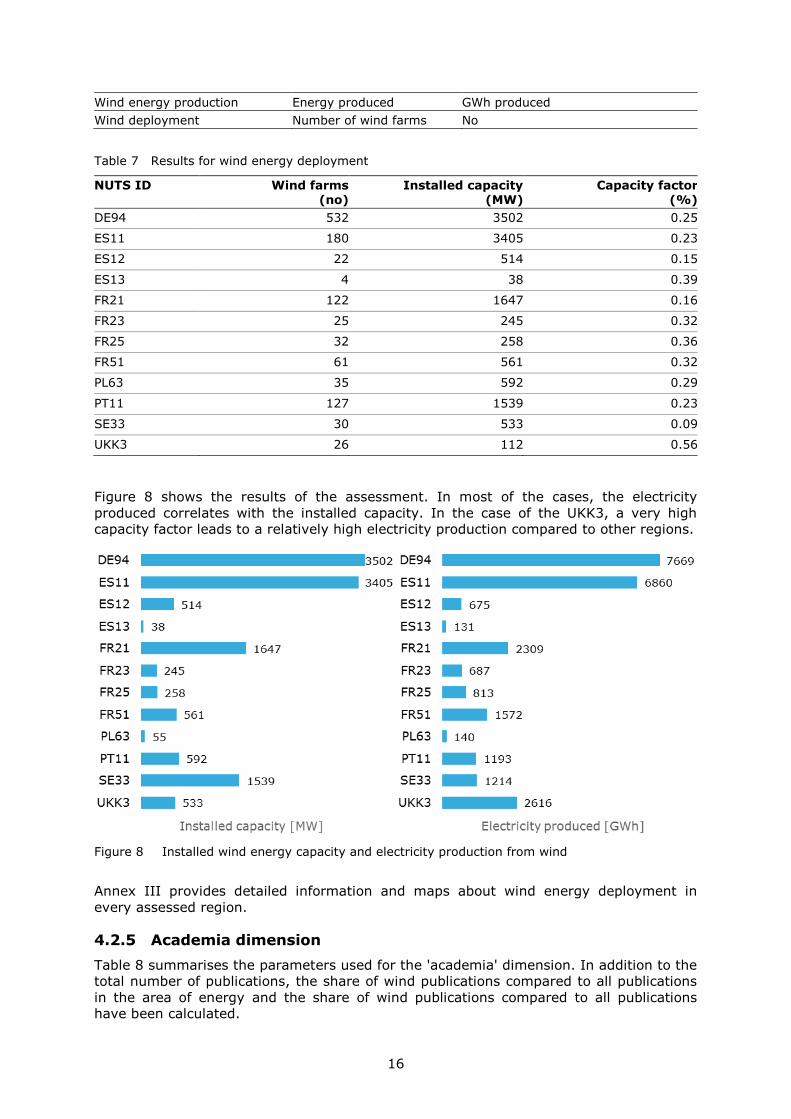
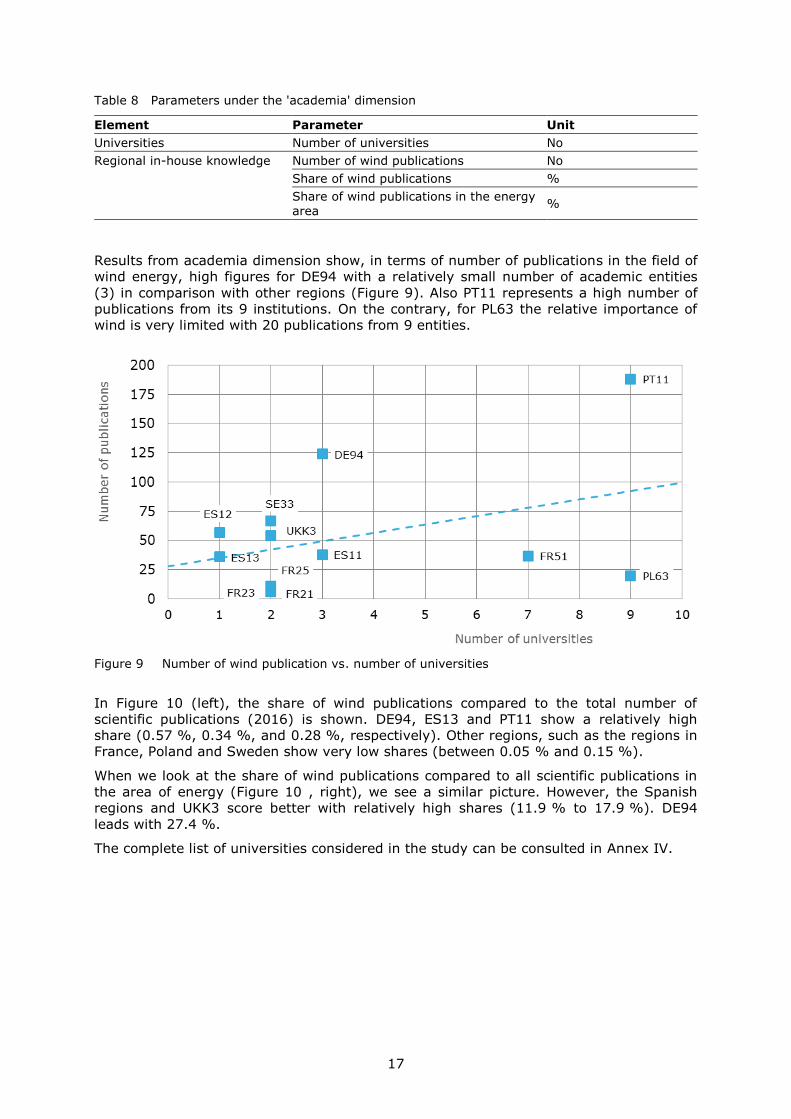
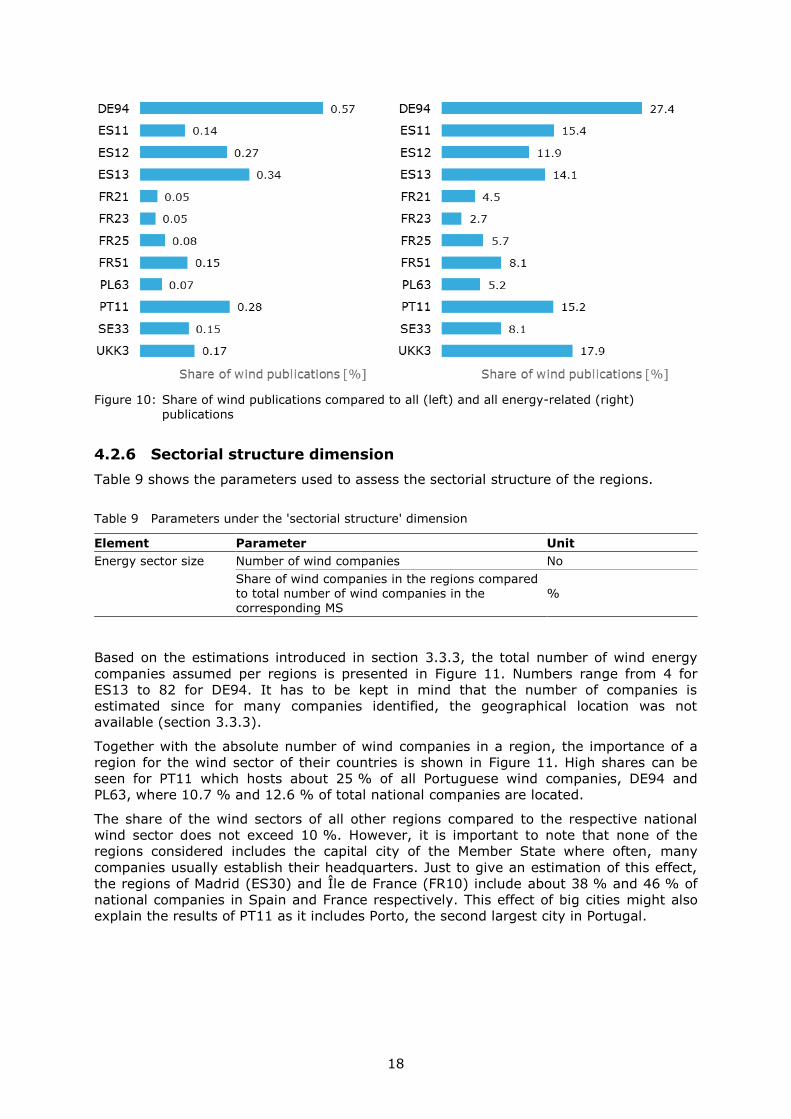
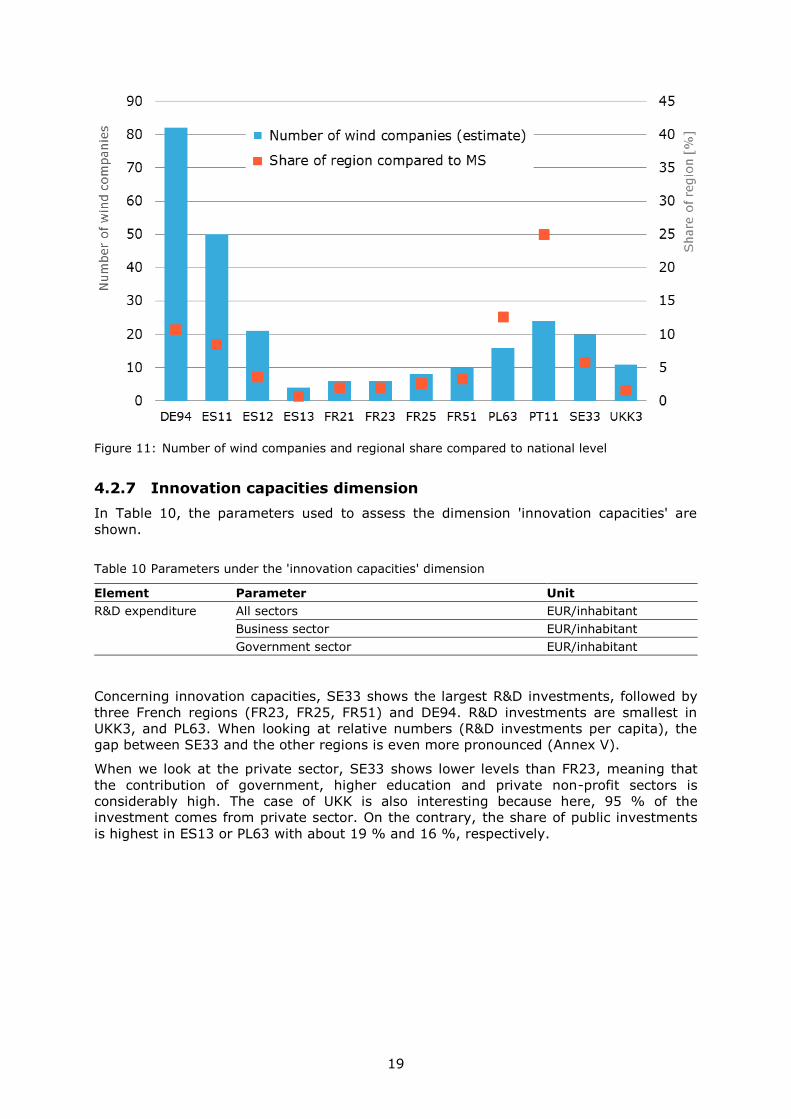
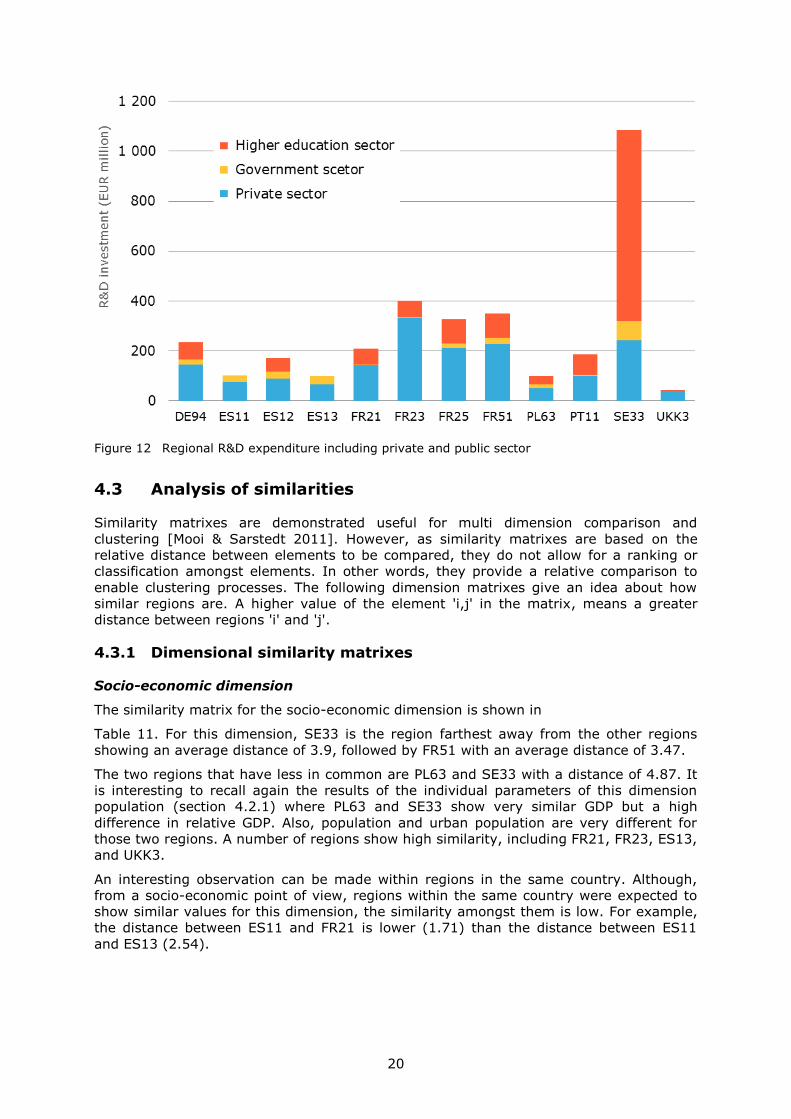
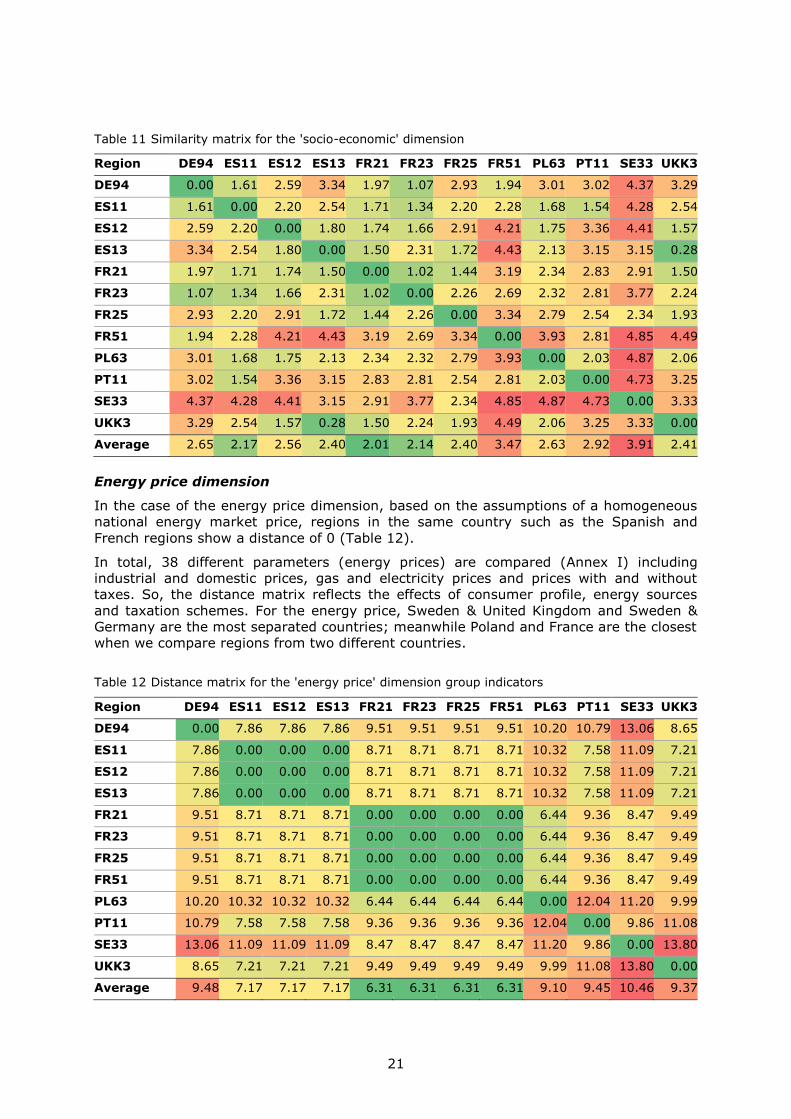
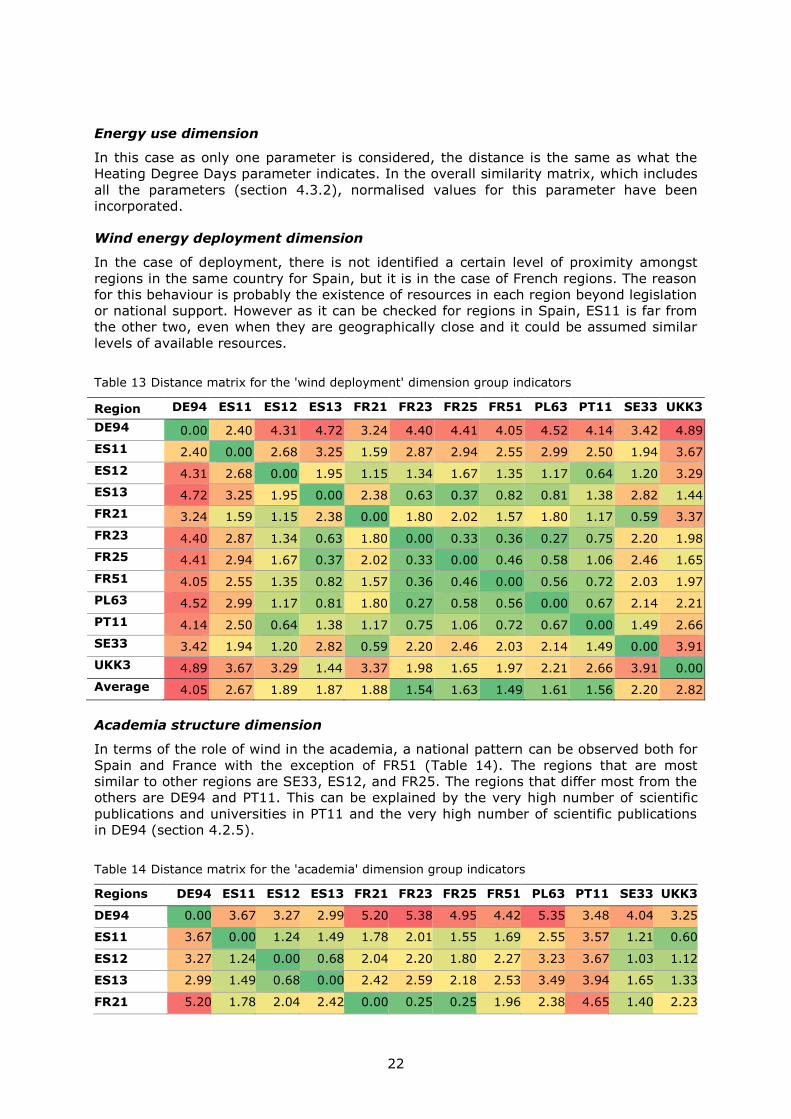
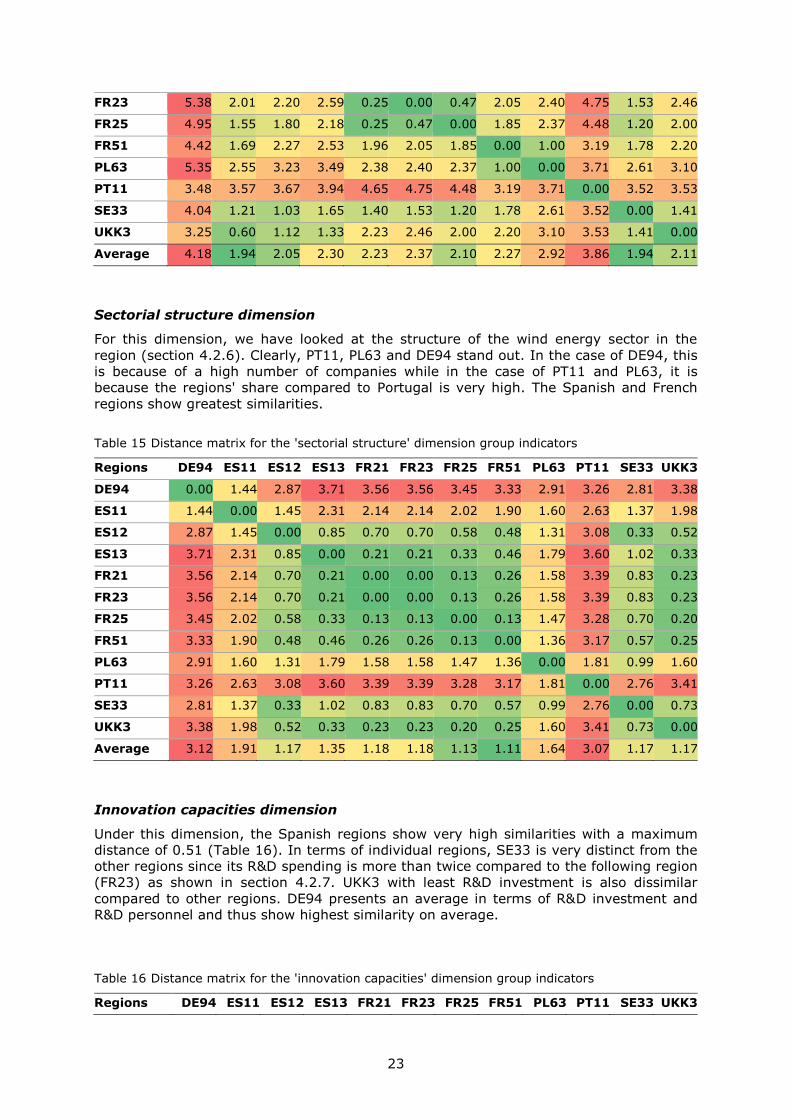
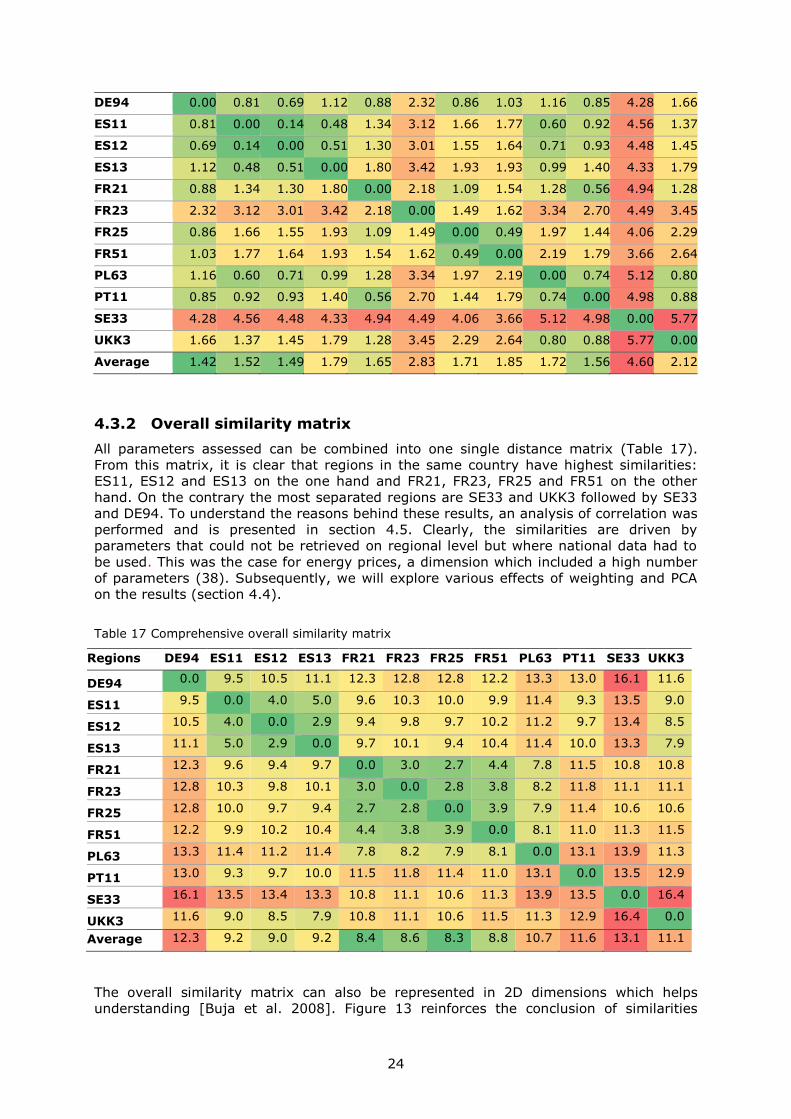
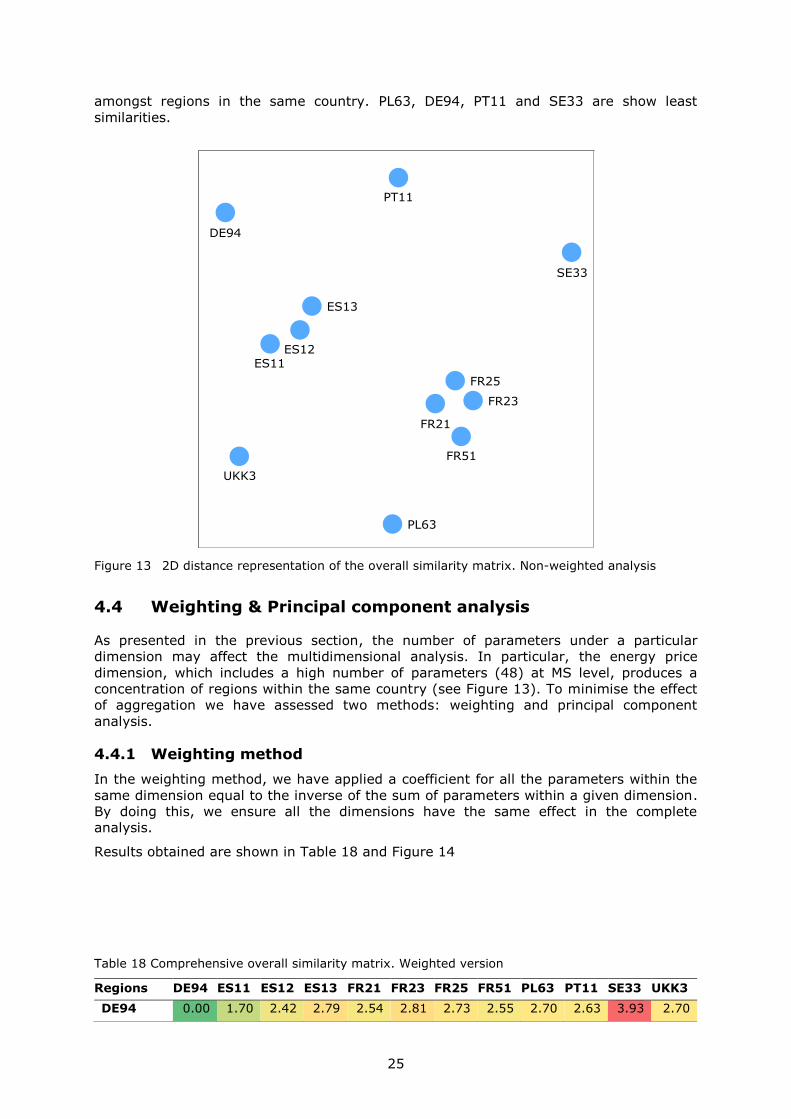
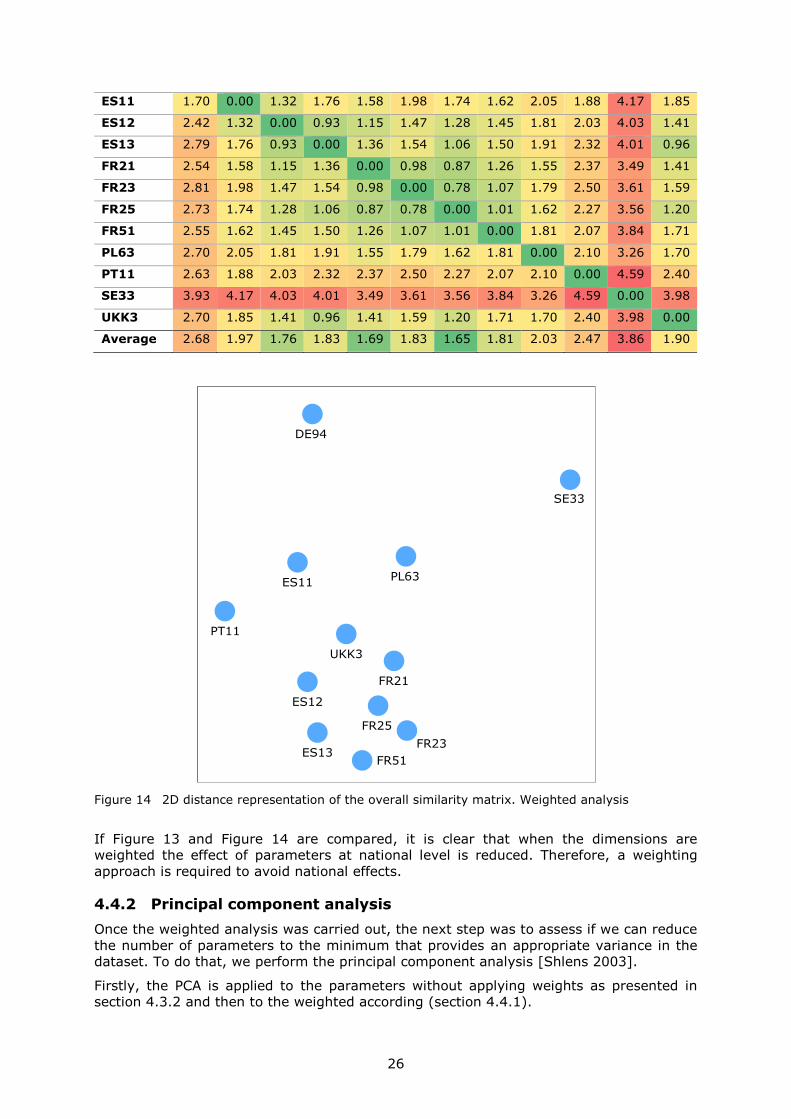
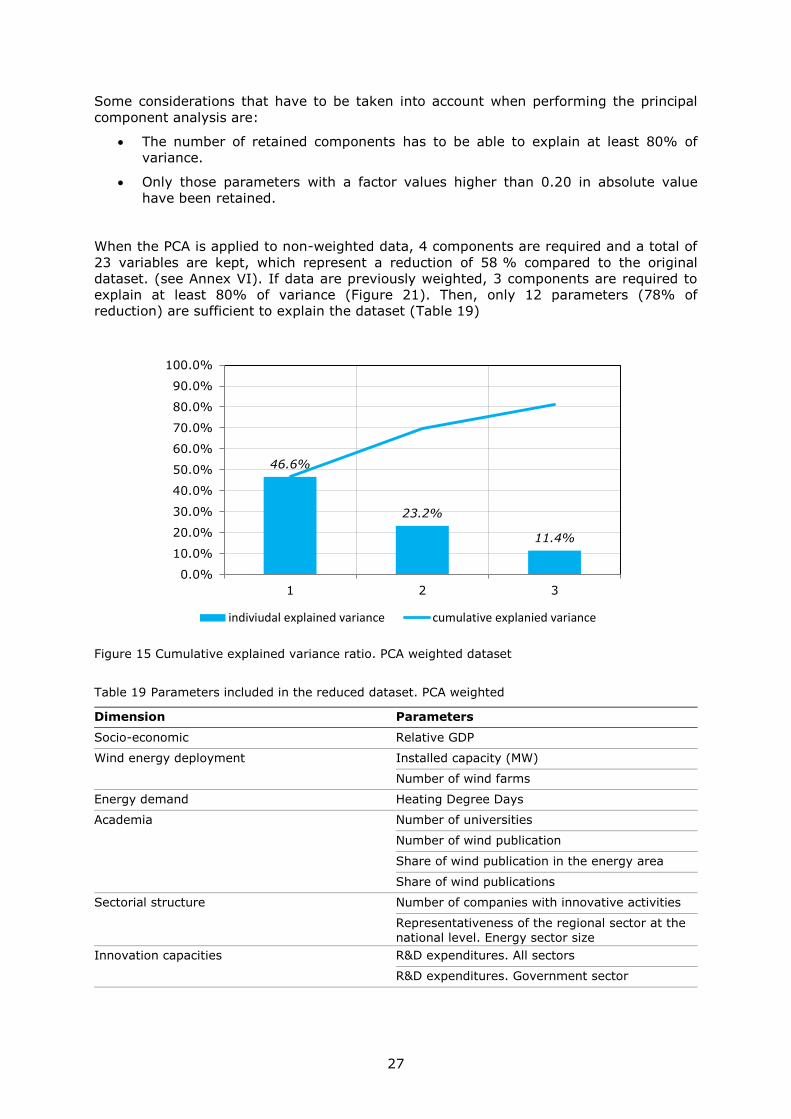
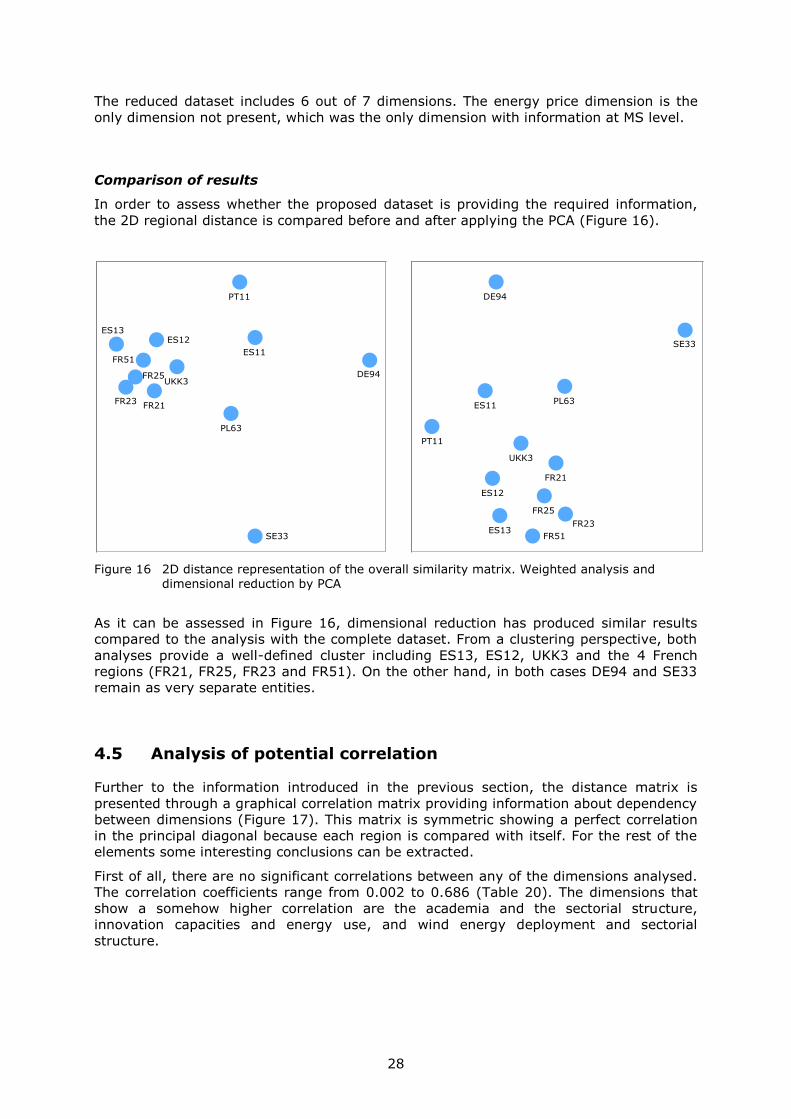