Embed Size (px)
Citation preview

KORN/FERRY INTERNATIONAL WORLDWIDE OFFICES
www.kornferry.com
The Americas
Atlanta404-577-7542
Bogota57-1-658-3000
Boston617-345-0200
Buenos Aires54-11-4114-0000
Calgary403-269-3277
Caracas58-212-285-0067
Chicago312-466-1834
Dallas214-954-1834
Houston713-651-1834
Irvine949-851-1834
Lima51-1-221-4202
Los Angeles310-552-1834
Mexico City*52-55-5201-5400
Miami305-377-4121
Minneapolis612-333-1834
Monterrey*52-81-8220-5959
Montreal514-397-9655
New York212-687-1834
Northern Virginia703-761-7020
Philadelphia215-496-6666
Princeton609-452-8848
Quito*5932-2986-562
Rio de Janeiro55-21-2518-1380
San Francisco415-956-1834
Santiago562-233-4155
São Paulo5511-3708-2222
Seattle206-447-1834
Silicon Valley650-632-1834
Stamford203-359-3350
Toronto416-365-1841
Vancouver604-684-1834
Washington, D.C.202-822-9444
Asia Pacific
Auckland*64-9-309-4900
Bangkok662-636-1466
Beijing8610-6535-9600
Hong Kong852-2971-2700
Jakarta62-21-573-9933
Kuala Lumpur603-2078-1655
Melbourne613-9631-0300
Mumbai91-22-6651-5959
New Delhi91-124-432-1000
Seoul82-2-399-7475
Shanghai86-21-6256-7333
Singapore65-6224-3111
Sydney612-9006-3400
Tokyo81-3-3560-1400
Wellington64-4-460-4900
Europe
Amsterdam31-20-799-9000
Athens30-210-722-8000
Barcelona34-93-217-91-31
Brussels32-2-640-3240
Bucharest*40-21-224-7124
Budapest36-1-346-0600
Copenhagen45-33-28-85-00
Frankfurt49-69-7167-00
Geneva41-22-310-2071
Helsinki358-9-61-22-560
Istanbul*90-212-231-3949
London44-20-7312-3100
Luxembourg35-2-46-43-421
Madrid34-91-701-4380
Milan39-02-80600-1
Moscow*7-495-234-0608
Oslo47-22-82-39-00
Paris33-1-45-61-8686
Prague420-221-033-730
Rome39-06-80687-090
Stockholm46-8-611-5015
Vienna43-1-531-03-0
Warsaw48-22-622-28-29
Zurich41-43-366-77-88
Middle East& Africa
Dubai971-4-2045-777
Johannesburg*27-11-722-1600
*Denotes satellite or affiliate office
BOD06AM
33rd Annual Board of Directors Study
Celebrating More Than Three Decades of Governance Analysis
KORN/FERRY INTERNATIONAL
33rd

33RD BOARD OF DIRECTORS STUDY
1
TABLE OF CONTENTS
Observations and Commentary . . . . . . . . . . . . . . . . . . . . . . . . . . . . . . . . . . . . . . . . . . . . . . . . . . . . . 2
Methodology . . . . . . . . . . . . . . . . . . . . . . . . . . . . . . . . . . . . . . . . . . . . . . . . . . . . . . . . . . . . . . . . . 4
Executive Summary: Highlights of Global Findings . . . . . . . . . . . . . . . . . . . . . . . . . . . . . . . . . . . . . . . 5
Proxy Information . . . . . . . . . . . . . . . . . . . . . . . . . . . . . . . . . . . . . . . . . . . . . . . . . . . . . . . . . . . . . . . . . 10
Size of Board . . . . . . . . . . . . . . . . . . . . . . . . . . . . . . . . . . . . . . . . . . . . . . . . . . . . . . . . . . . . . 10
Inside Directors vs. Outside Directors . . . . . . . . . . . . . . . . . . . . . . . . . . . . . . . . . . . . . . . . . . . . . . 11
Board Composition and Demographics . . . . . . . . . . . . . . . . . . . . . . . . . . . . . . . . . . . . . . . . . . . . 11
Committees by Function . . . . . . . . . . . . . . . . . . . . . . . . . . . . . . . . . . . . . . . . . . . . . . . . . . . . . . . 12
Committee Composition . . . . . . . . . . . . . . . . . . . . . . . . . . . . . . . . . . . . . . . . . . . . . . . . . . . . . 13
Committee Meeting Frequency . . . . . . . . . . . . . . . . . . . . . . . . . . . . . . . . . . . . . . . . . . . . . . . . 14
Full Board Compensation . . . . . . . . . . . . . . . . . . . . . . . . . . . . . . . . . . . . . . . . . . . . . . . . . . . . 14
Annual Retainer Plus Per-Meeting Fee . . . . . . . . . . . . . . . . . . . . . . . . . . . . . . . . . . . . . . . . . . . 15
Committee Compensation . . . . . . . . . . . . . . . . . . . . . . . . . . . . . . . . . . . . . . . . . . . . . . . . . . . . 16
Stock as Director Compensation . . . . . . . . . . . . . . . . . . . . . . . . . . . . . . . . . . . . . . . . . . . . . . . . . 18
Profile of Proxy Companies . . . . . . . . . . . . . . . . . . . . . . . . . . . . . . . . . . . . . . . . . . . . . . . . . . . . . 19
Americas Survey Responses . . . . . . . . . . . . . . . . . . . . . . . . . . . . . . . . . . . . . . . . . . . . . . . . . . . . . . 20
Europe Survey Responses . . . . . . . . . . . . . . . . . . . . . . . . . . . . . . . . . . . . . . . . . . . . . . . . . . . . . . . . 43
Asia Pacific Survey Responses . . . . . . . . . . . . . . . . . . . . . . . . . . . . . . . . . . . . . . . . . . . . . . . . . . . . 62
Conclusion . . . . . . . . . . . . . . . . . . . . . . . . . . . . . . . . . . . . . . . . . . . . . . . . . . . . . . . . . . . . . . . . . . . . 79
About Korn/Ferry International . . . . . . . . . . . . . . . . . . . . . . . . . . . . . . . . . . . . . . . . . . . . . . . . . . . . . 80
About Global Board Services Practice . . . . . . . . . . . . . . . . . . . . . . . . . . . . . . . . . . . . . . . . . . . . . . . 80
2
OBSERVATIONS AND COMMENTARYA director’s dedication is not easily explained. To the uninitiated, serving as a director is seemingly athankless job, a pursuit filled with aggravation, ever-increasing demands, and risks – all for constituencieswith a shared goal of a secure, large return on investment. When asked why they undertake directorships,two-thirds (65 percent) of respondents in the Americas indicate their desire to make a difference.
With the challenges that have arisen during the past five years, there has been ample opportunity to makea difference. The corporate environment today appears to have strengthened the resolve of study participantsrather than defeat them. The majority of those surveyed in Japan (62 percent) and in Europe (55 percent)state they derive greater satisfaction from serving as a director now than they did five years ago. This isalso true of 33 percent of those surveyed in Australasia and 46 percent in the Americas.
Directors energized by challenge take full responsibility for making a difference. They believe the caliber ofan individual and the ability to work with others has the greatest impact on board productivity. In identifyingcriteria influencing boardroom success in Europe, individual and collective board action was found to bethe sole primary driver determining the quality of governance. The majority (68 percent) of these directors inEurope rate their board as “very good” or “excellent” regarding this criterion. Sixty-five percent of directorsin the United Kingdom assign this rating to their boards. Ensuring legal and ethical integrity was determinedto be an expected driver of success, a criterion expected of all boards.
In the Americas, individual and collective board action was also deemed a primary driver, or one criterionhaving the highest impact on board success. Seventy-seven percent of respondents assign an “excellent”or “very good” rating to their board for their individual and collective board action. However, the effects ofsevere regulation can be seen when it comes to the weight given to ensuring legal and ethical integrity.Rather than being seen as an expected driver, this was found to be a primary driver of board success inthe Americas. The vast majority (93 percent) of responding directors in the Americas think their board’sintegrity is beyond question and deserves an “excellent” or “very good” rating.
These findings suggest that directors around the world find established rules to be no guarantee of goodgovernance or corporate performance and may even have counterproductive results.
Despite the desired outcome of improved governance, the majority of survey respondents believe that recentregulations have actually inhibited necessary risk taking and fostered an environment of conservatism. Seventypercent of participants in both the Americas and Japan believe Sarbanes-Oxley has made their boardsmore cautious, 67 percent of those surveyed in Germany share this opinion of The Cromme Commissionrecommendations and 44 percent in France think this to be true of the best practice guidelines in France.
33RD BOARD OF DIRECTORS STUDY
33RD BOARD OF DIRECTORS STUDY
With compliance mandates met, the next step is to replace excessive caution with courage and confidence.To do so, boards must enhance the individual performances within the boardroom. While full board reviewsare commonplace, the vast majority of directors surveyed for this study believe individual reviews should be required. These will undoubtedly aid in strengthening both professional contributions and teamwork andfacilitate an environment that promotes calculated risk-taking and quality decision-making.
Participating board members around the globe report they are eager to help drive companies to greatersuccess. Seventy-three percent of respondents in the Americas state they would like to be more involved in strategic planning, compared with the 56 percent wishing this in 2005. Forty-four percent say they want to assist the CEO in assessing marketing opportunities, up from 14 percent in 2005. When asked whydirectorships might be less appealing, 43 percent of those surveyed in Australasia report their ability to addstrategic value is limited. However, structured CEO performance evaluations, now the norm throughout theworld, do allow directors to provide counsel to the chief executive.
Although regulations have not proven to be a panacea and have been laced with some unintentionalconsequences, the overall impact has proven largely positive. Boards today, while cautious, are moreindependent, diligent and focused than at any other time in corporate memory, and the quality of corporategovernance continues to improve around the globe.
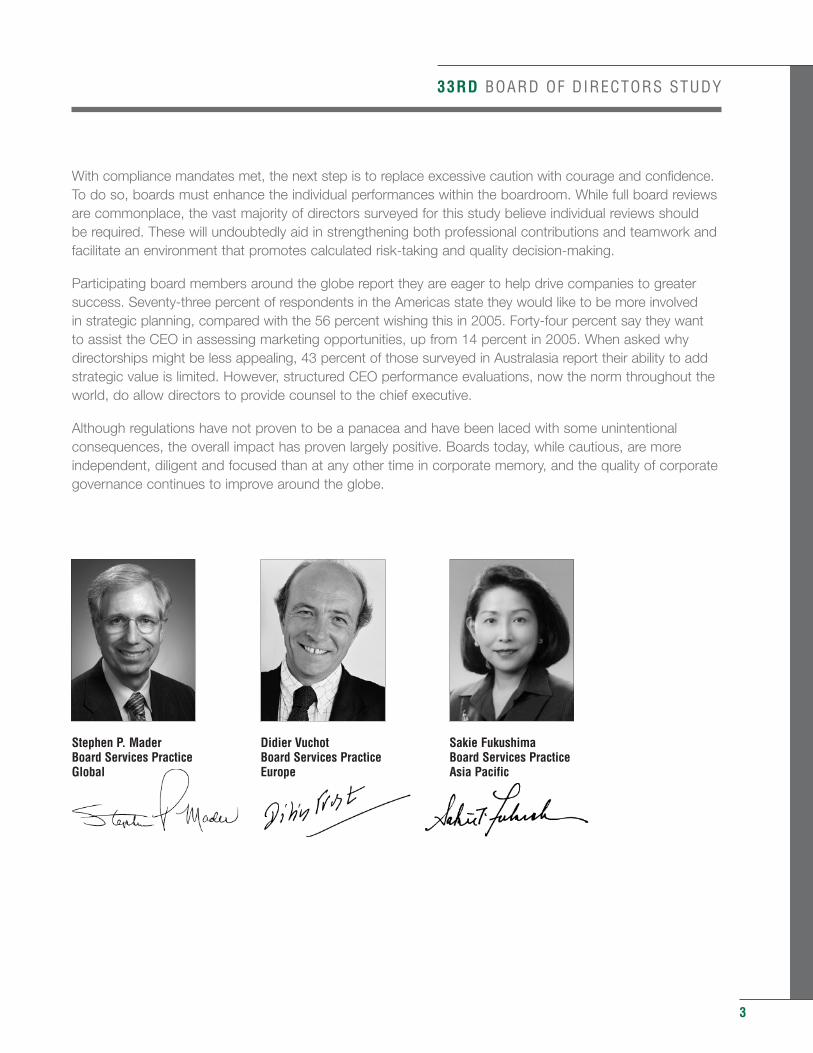
Stephen P. Mader Didier Vuchot Sakie FukushimaBoard Services Practice Board Services Practice Board Services Practice Global Europe Asia Pacific
3
4
METHODOLOGYKorn/Ferry International’s 33rd Annual Board of Directors Study has expanded its analysis of the worldwideevolution of governance. For the first time ever, the study probes deeper to identify the success criteria ofhighly effective boards and the elements that enable a board to maximize performance. This data, reportedin the new Drivers to Board Success and Cluster Analysis sections, measures the relevance of the executionof specific duties to delivery of successful board performance.
For example, while some directors feel their board is excellent in developing yearly goals, they do notconsider this a primary factor to good governance. By linking the value of a particular practice to boardsuccess, the study shows those practices with the strongest potential to influence the quality of governance.
Expectedly, directors diverge in their definitions of success. Using the information gleaned from thesedrivers, boards could be categorized accordingly. The Clusters section highlights data based on type ofboard, evidencing the influence of board culture, region and stage of board maturation in the Americas andin Europe. Questions not included in the Asia Pacific questionnaires precluded us from incorporating theresults from that region.
The Clusters data is particularly meaningful to directors throughout the world dedicated to continuousimprovement. Findings reveal both commonalities and differences, providing a basis for objective evaluationwhen considering adoption of new practices.
Directors from premier organizations in Asia Pacific, Europe and the Americas were invited to share theirviews and information regarding their boards with more than 1,000 directors from 18 nations by returning a completed questionnaire. To better illustrate the differences in governance worldwide, responses have been reported by global region. The Americas comprise Canada, the United States, Brazil and Mexico. The European region encompasses the United Kingdom, France, Germany, Sweden, Switzerland, Austriaand Denmark. Asia Pacific consists of Australia, New Zealand, Japan, China (which includes Hong Kong),Korea, Singapore, Thailand and India. Where meaningful, data is shown by country.
The study also includes a quantitative analysis of proxy data from 896 Fortune 1000 organizations.*Information was reported between July 1, 2005 and June 30, 2006. To provide historical perspective oftrends, comparisons to data reported in previous studies are shown, where appropriate.
In AppreciationThe growing demands made on directors have substantially increased the time board members worldwidemust commit to service. By virtue of their participation, these directors have enabled us to continue ourefforts to provide a unique view of corporate governance in this study.
Korn/Ferry is deeply grateful to these directors who invested their time to share information regarding theirboards, their professional experiences and their opinions.
33RD BOARD OF DIRECTORS STUDY
* Of the 104 companies we were unable to include, 56 were either private/mutual insurance companies, 24 were in the process of a merger/acquisition, 13 were in Chapter 11, three were undergoing SEC investigations, and eight companies did not issue proxiesduring our proxy year.
33RD BOARD OF DIRECTORS STUDY
5
EXECUTIVE SUMMARY: HIGHLIGHTS OF GLOBAL FINDINGSBusiness life cycles, competitive pressures, differing cultures, regulation, politics and forms of ownershipare all factors that influence the actions of directors and are issues often lost in truncated news reports.However, board members around the world are willing to discard obsolete practices and implement newmeasures to ensure better governance, not merely to pacify constituencies.
Findings of this year’s study illustrate aspects of governance common to directors worldwide: dedication to executing responsibilities, an acute awareness of increased demands of service and potential risks, thestruggle to institute appropriate compensation, commitment to improving individual and group performance,and an unswerving confidence in the quality of their boards.
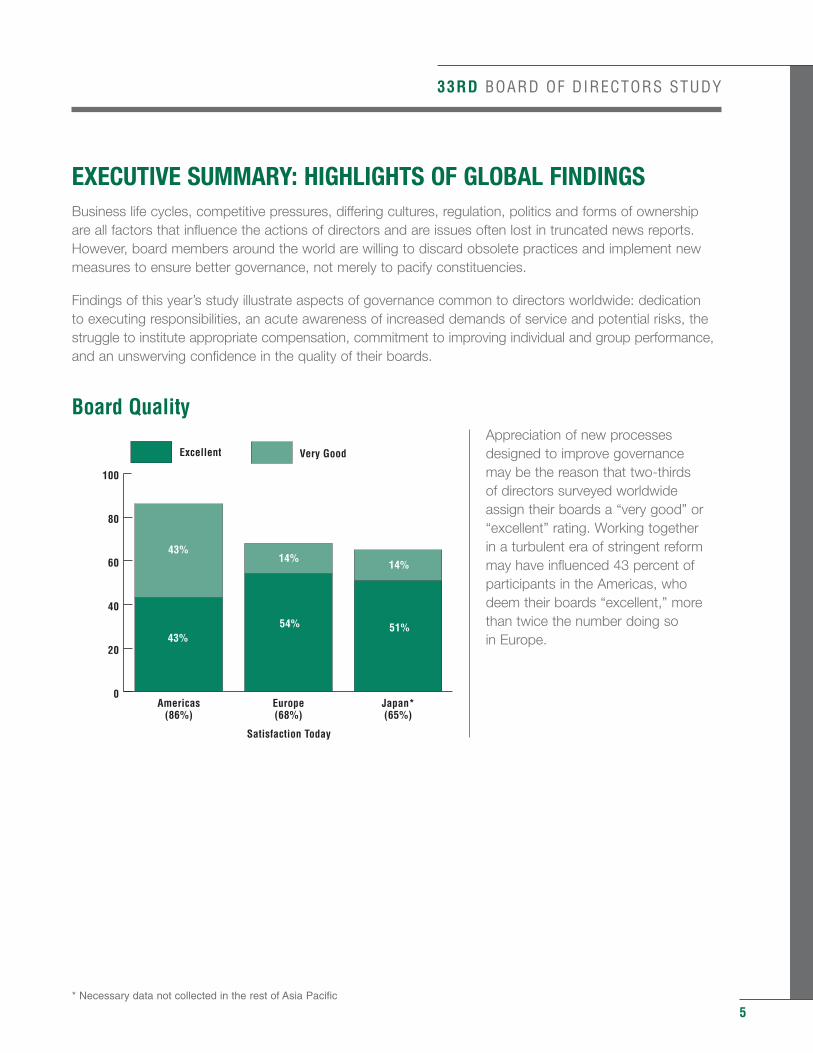
Board QualityAppreciation of new processesdesigned to improve governance may be the reason that two-thirds of directors surveyed worldwide assign their boards a “very good” or“excellent” rating. Working together in a turbulent era of stringent reformmay have influenced 43 percent ofparticipants in the Americas, whodeem their boards “excellent,” morethan twice the number doing so in Europe.
0
20
40
60
80
100
Excellent Very Good
Japan*(65%)
Europe(68%)
Americas(86%)
Satisfaction Today
43%54%
43%14%
14%
51%
* Necessary data not collected in the rest of Asia Pacific
6
33RD BOARD OF DIRECTORS STUDY
Factors in Declining Directorships
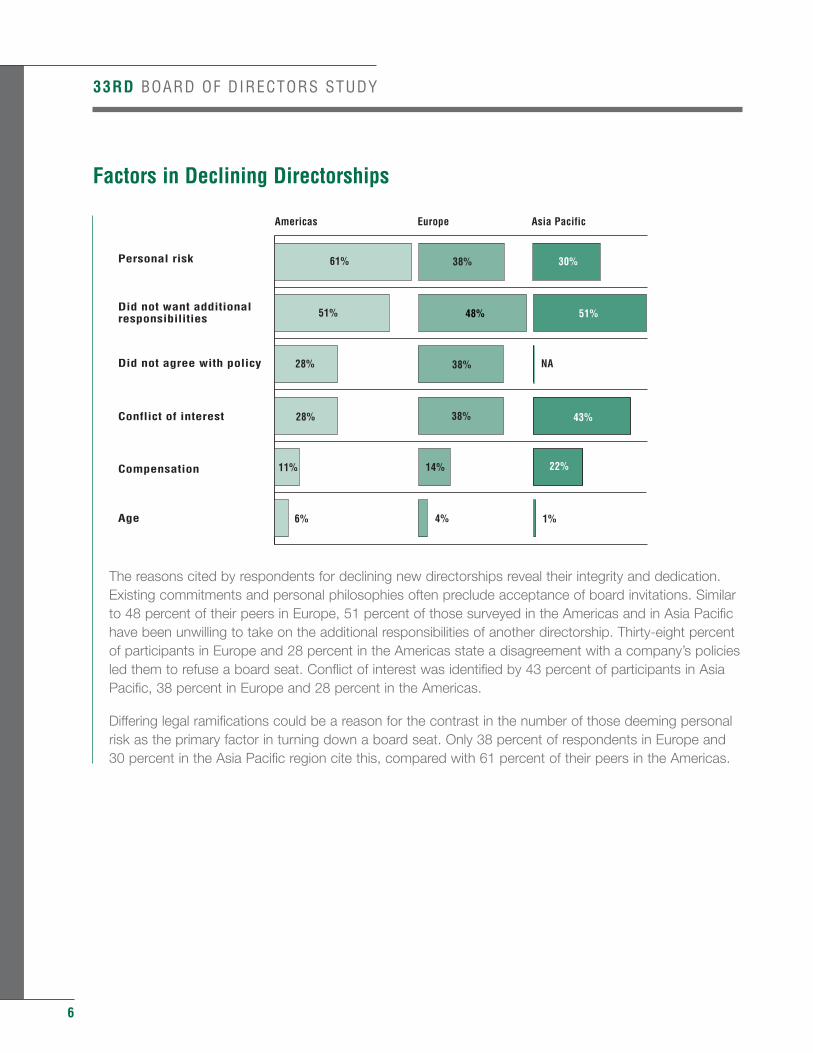
The reasons cited by respondents for declining new directorships reveal their integrity and dedication. Existing commitments and personal philosophies often preclude acceptance of board invitations. Similar to 48 percent of their peers in Europe, 51 percent of those surveyed in the Americas and in Asia Pacific have been unwilling to take on the additional responsibilities of another directorship. Thirty-eight percent of participants in Europe and 28 percent in the Americas state a disagreement with a company’s policies led them to refuse a board seat. Conflict of interest was identified by 43 percent of participants in Asia Pacific, 38 percent in Europe and 28 percent in the Americas.
Differing legal ramifications could be a reason for the contrast in the number of those deeming personal risk as the primary factor in turning down a board seat. Only 38 percent of respondents in Europe and 30 percent in the Asia Pacific region cite this, compared with 61 percent of their peers in the Americas.
Asia Pacific
Europe
Americas
Age
Compensation
Conflict of interest
Did not agree with policy
Did not want additionalresponsibilities
Personal risk
Americas Europe Asia Pacific
61%
51%
28%
28%
4% 1%6%
38%
51%
11% 14% 22%
43%
NA38%
48%
38% 30%
33RD BOARD OF DIRECTORS STUDY
7
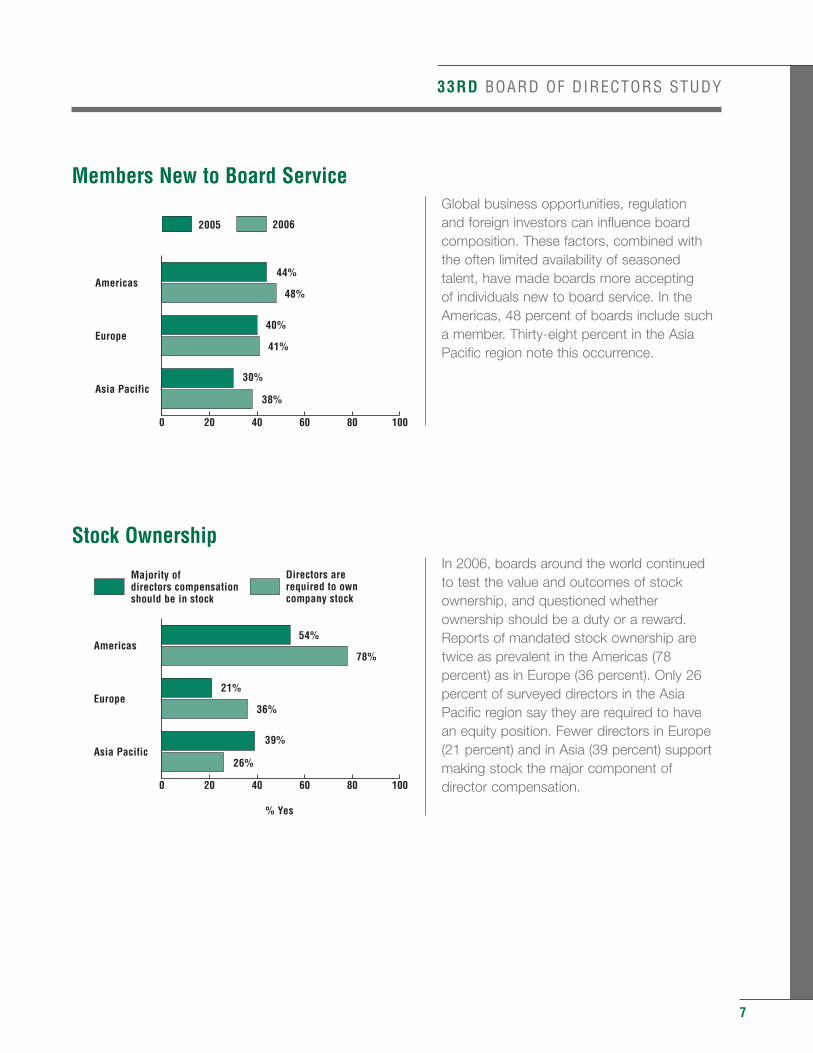
Members New to Board ServiceGlobal business opportunities, regulation and foreign investors can influence boardcomposition. These factors, combined withthe often limited availability of seasonedtalent, have made boards more accepting of individuals new to board service. In theAmericas, 48 percent of boards include sucha member. Thirty-eight percent in the AsiaPacific region note this occurrence.
Stock OwnershipIn 2006, boards around the world continued to test the value and outcomes of stockownership, and questioned whetherownership should be a duty or a reward.Reports of mandated stock ownership aretwice as prevalent in the Americas (78percent) as in Europe (36 percent). Only 26percent of surveyed directors in the AsiaPacific region say they are required to have an equity position. Fewer directors in Europe(21 percent) and in Asia (39 percent) supportmaking stock the major component ofdirector compensation.
0 20 40 60 80 100
2006
2005
Asia Pacific
Europe
Americas 44%
48%
40%
41%
30%
38%
2005 2006
0 20 40 60 80 100
Directors are required to own company stockMajority of directors compensation shoul be in stock
Asia Pacific
Europe
Americas 54%
78%
21%
36%
26%
% Yes
39%
Majority of directors compensation should be in stock
Directors are required to own company stock
8
33RD BOARD OF DIRECTORS STUDY
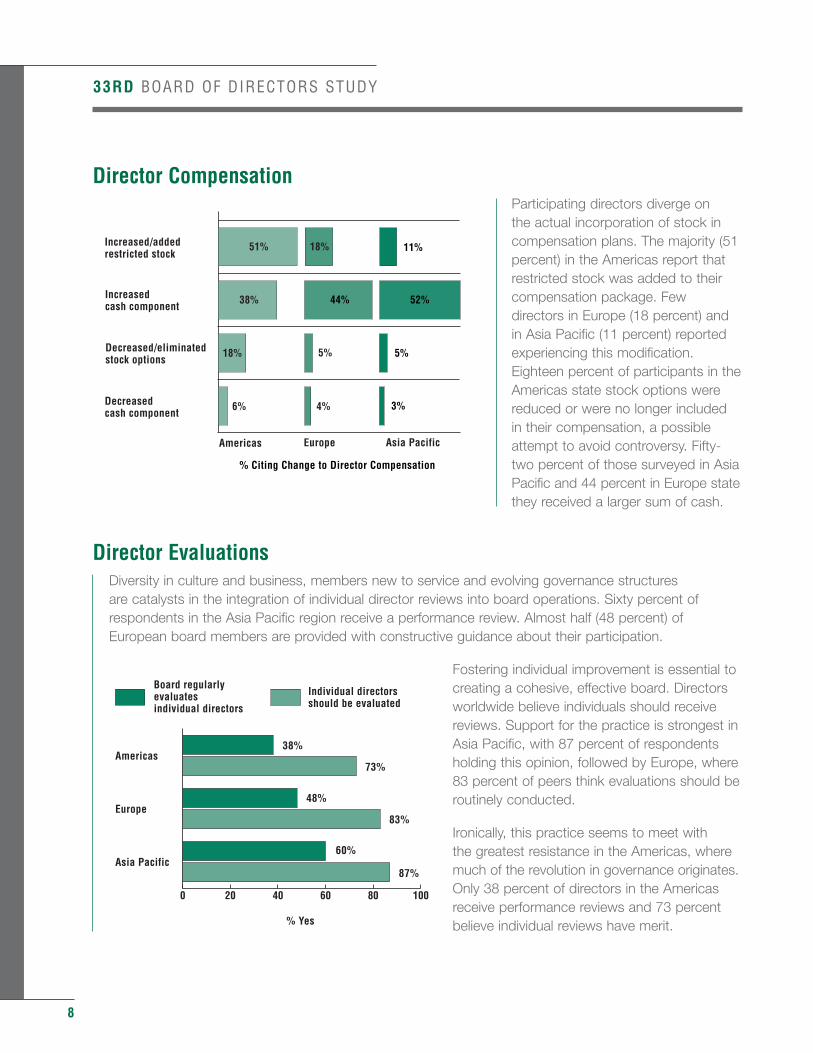
Director CompensationParticipating directors diverge on the actual incorporation of stock incompensation plans. The majority (51percent) in the Americas report thatrestricted stock was added to theircompensation package. Fewdirectors in Europe (18 percent) andin Asia Pacific (11 percent) reportedexperiencing this modification.Eighteen percent of participants in theAmericas state stock options werereduced or were no longer included in their compensation, a possibleattempt to avoid controversy. Fifty-two percent of those surveyed in AsiaPacific and 44 percent in Europe statethey received a larger sum of cash.
Director EvaluationsDiversity in culture and business, members new to service and evolving governance structures are catalysts in the integration of individual director reviews into board operations. Sixty percent of respondents in the Asia Pacific region receive a performance review. Almost half (48 percent) of European board members are provided with constructive guidance about their participation.
Fostering individual improvement is essential tocreating a cohesive, effective board. Directorsworldwide believe individuals should receivereviews. Support for the practice is strongest inAsia Pacific, with 87 percent of respondentsholding this opinion, followed by Europe, where83 percent of peers think evaluations should beroutinely conducted.
Ironically, this practice seems to meet with the greatest resistance in the Americas, wheremuch of the revolution in governance originates.Only 38 percent of directors in the Americasreceive performance reviews and 73 percentbelieve individual reviews have merit.
0 20 40 60 80 100
Individual directors should be evaluatedBoard regularly evaluates individual directors
Asia Pacific
Europe
Americas
Individual directorsshould be evaluated
Board regularly evaluates individual directors
38%
73%
48%
83%
87%
% Yes
60%
Asia Pacific
Europe
Americas
Increased/addedrestricted stock
Increasedcash component
Decreased/eliminatedstock options
Decreasedcash component
Europe
% Citing Change to Director Compensation
Asia Pacific
51%
18% 5%
6% 4% 3%
5%
38% 52%44%
18% 11%
33RD BOARD OF DIRECTORS STUDY
9
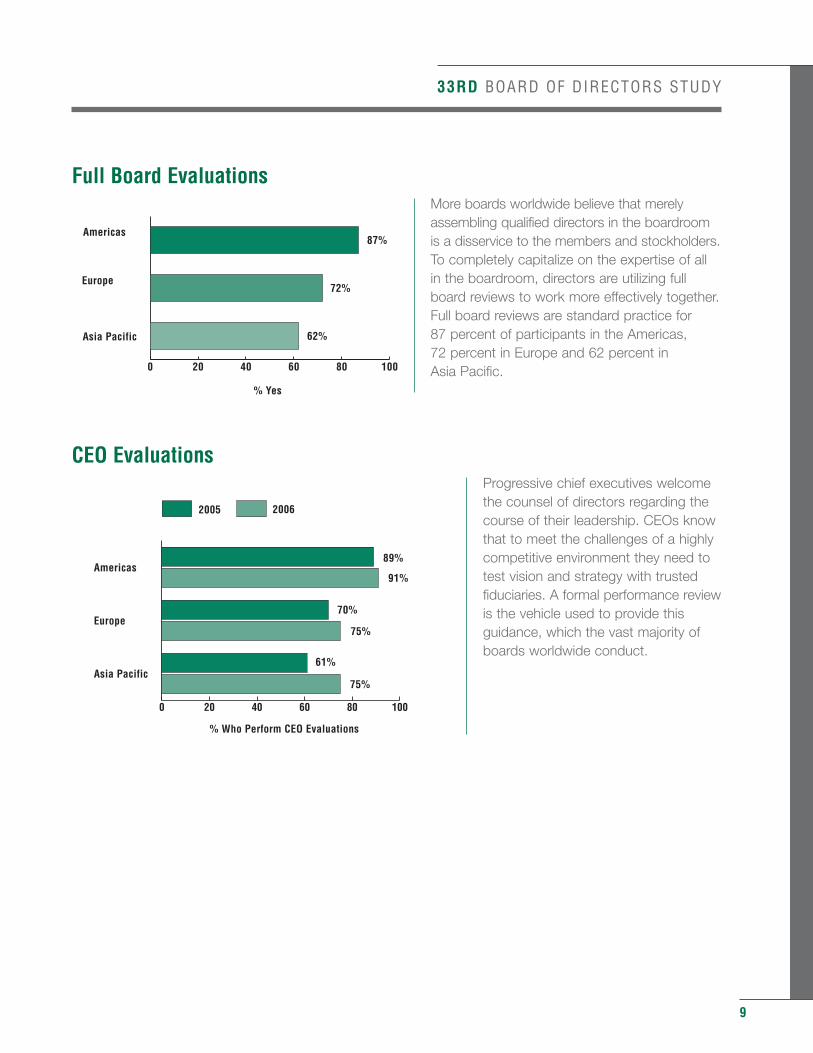
Full Board EvaluationsMore boards worldwide believe that merelyassembling qualified directors in the boardroomis a disservice to the members and stockholders.To completely capitalize on the expertise of allin the boardroom, directors are utilizing fullboard reviews to work more effectively together.Full board reviews are standard practice for 87 percent of participants in the Americas, 72 percent in Europe and 62 percent in Asia Pacific.
CEO EvaluationsProgressive chief executives welcomethe counsel of directors regarding thecourse of their leadership. CEOs knowthat to meet the challenges of a highlycompetitive environment they need totest vision and strategy with trustedfiduciaries. A formal performance reviewis the vehicle used to provide thisguidance, which the vast majority ofboards worldwide conduct.
0 20 40 60 80 100
Asia Pacific
Europe
Americas
72%
% Yes
62%
87%
0 20 40 60 80 100
2006
2005
Asia Pacific
Europe
Americas 89%
91%
70%
75%
61%
75%
% Who Perform CEO Evaluations
2005 2006
10
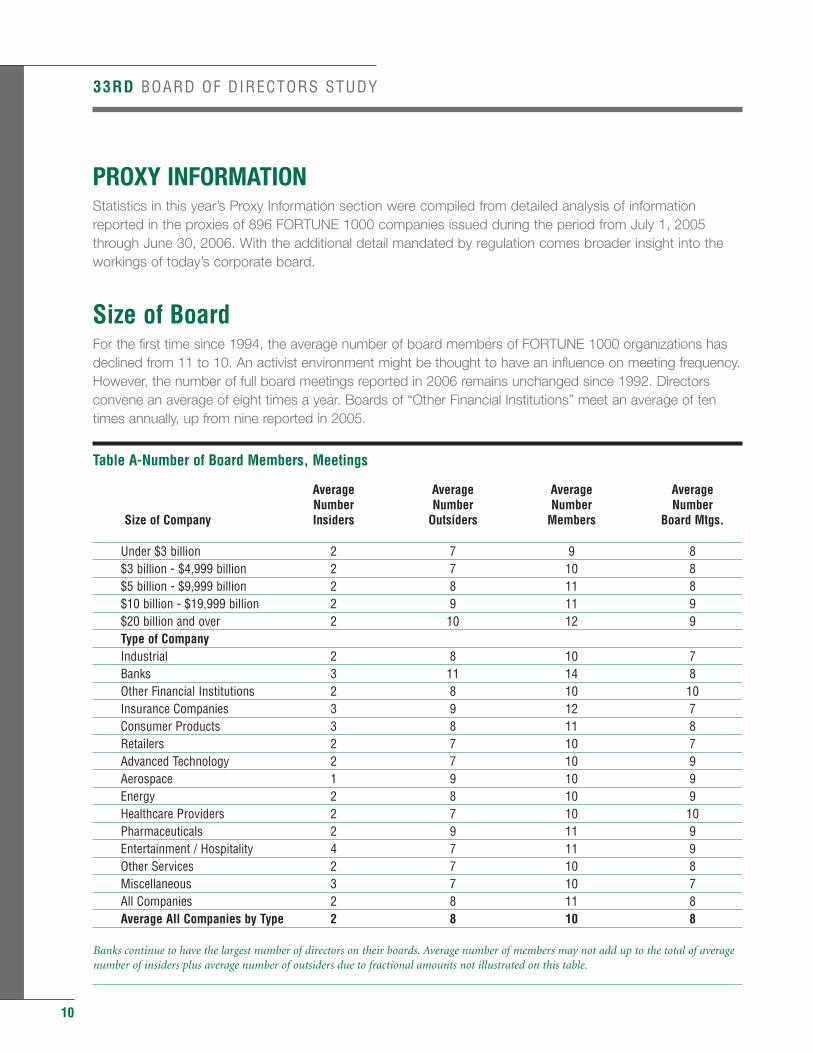
PROXY INFORMATIONStatistics in this year’s Proxy Information section were compiled from detailed analysis of informationreported in the proxies of 896 FORTUNE 1000 companies issued during the period from July 1, 2005through June 30, 2006. With the additional detail mandated by regulation comes broader insight into theworkings of today’s corporate board.
Size of BoardFor the first time since 1994, the average number of board members of FORTUNE 1000 organizations hasdeclined from 11 to 10. An activist environment might be thought to have an influence on meeting frequency.However, the number of full board meetings reported in 2006 remains unchanged since 1992. Directorsconvene an average of eight times a year. Boards of “Other Financial Institutions” meet an average of tentimes annually, up from nine reported in 2005.
Table A-Number of Board Members, Meetings
Average Average Average AverageNumber Number Number Number
Size of Company Insiders Outsiders Members Board Mtgs.
Under $3 billion 2 7 9 8$3 billion - $4,999 billion 2 7 10 8$5 billion - $9,999 billion 2 8 11 8$10 billion - $19,999 billion 2 9 11 9$20 billion and over 2 10 12 9Type of CompanyIndustrial 2 8 10 7Banks 3 11 14 8Other Financial Institutions 2 8 10 10Insurance Companies 3 9 12 7Consumer Products 3 8 11 8Retailers 2 7 10 7Advanced Technology 2 7 10 9Aerospace 1 9 10 9Energy 2 8 10 9Healthcare Providers 2 7 10 10Pharmaceuticals 2 9 11 9Entertainment / Hospitality 4 7 11 9Other Services 2 7 10 8Miscellaneous 3 7 10 7All Companies 2 8 11 8Average All Companies by Type 2 8 10 8
Banks continue to have the largest number of directors on their boards. Average number of members may not add up to the total of averagenumber of insiders plus average number of outsiders due to fractional amounts not illustrated on this table.
33RD BOARD OF DIRECTORS STUDY
33RD BOARD OF DIRECTORS STUDY
Inside Directors vs. Outside DirectorsMost FORTUNE 1000 organizations appear to find that eight outside directors and two inside directorsprovide the optimum balance between governance and management. In “Other Financial Institutions,” the average number of insiders declined from three reported in 2005 to two this year.
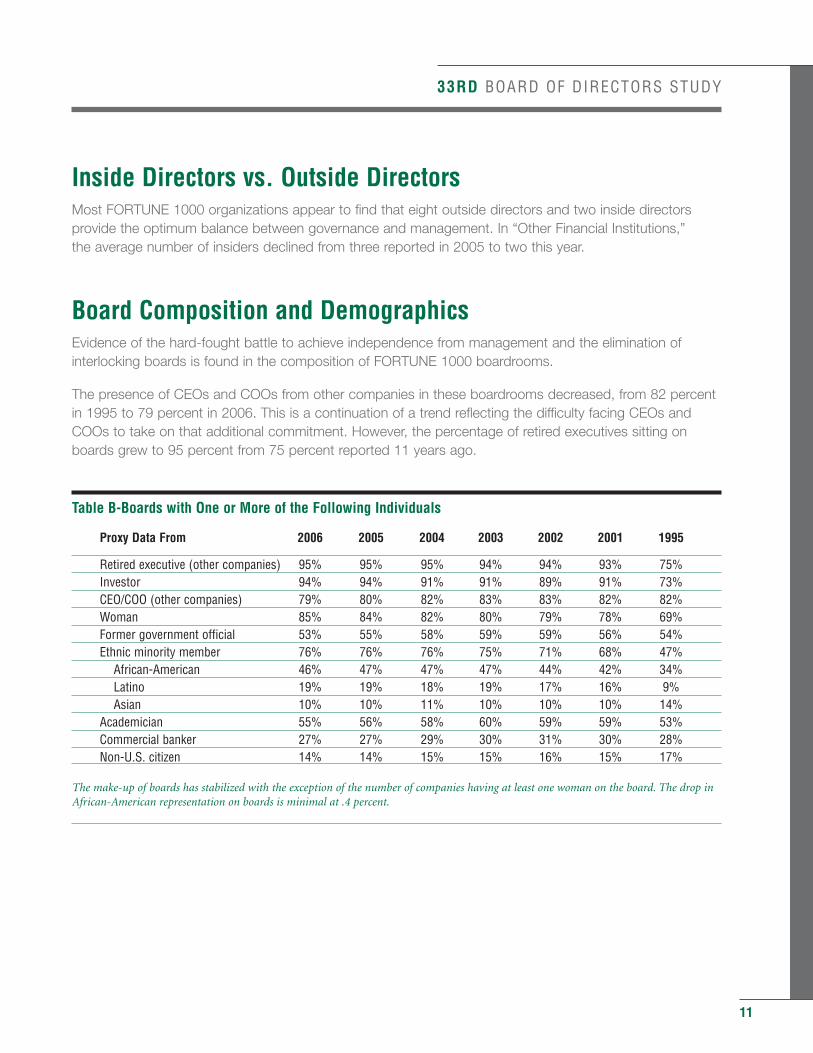
Board Composition and DemographicsEvidence of the hard-fought battle to achieve independence from management and the elimination ofinterlocking boards is found in the composition of FORTUNE 1000 boardrooms.
The presence of CEOs and COOs from other companies in these boardrooms decreased, from 82 percentin 1995 to 79 percent in 2006. This is a continuation of a trend reflecting the difficulty facing CEOs andCOOs to take on that additional commitment. However, the percentage of retired executives sitting onboards grew to 95 percent from 75 percent reported 11 years ago.
Table B-Boards with One or More of the Following Individuals
Proxy Data From 2006 2005 2004 2003 2002 2001 1995
Retired executive (other companies) 95% 95% 95% 94% 94% 93% 75%Investor 94% 94% 91% 91% 89% 91% 73%CEO/COO (other companies) 79% 80% 82% 83% 83% 82% 82%Woman 85% 84% 82% 80% 79% 78% 69%Former government official 53% 55% 58% 59% 59% 56% 54%Ethnic minority member 76% 76% 76% 75% 71% 68% 47%
African-American 46% 47% 47% 47% 44% 42% 34%Latino 19% 19% 18% 19% 17% 16% 9%Asian 10% 10% 11% 10% 10% 10% 14%
Academician 55% 56% 58% 60% 59% 59% 53%Commercial banker 27% 27% 29% 30% 31% 30% 28%Non-U.S. citizen 14% 14% 15% 15% 16% 15% 17%
The make-up of boards has stabilized with the exception of the number of companies having at least one woman on the board. The drop inAfrican-American representation on boards is minimal at .4 percent.
11
12
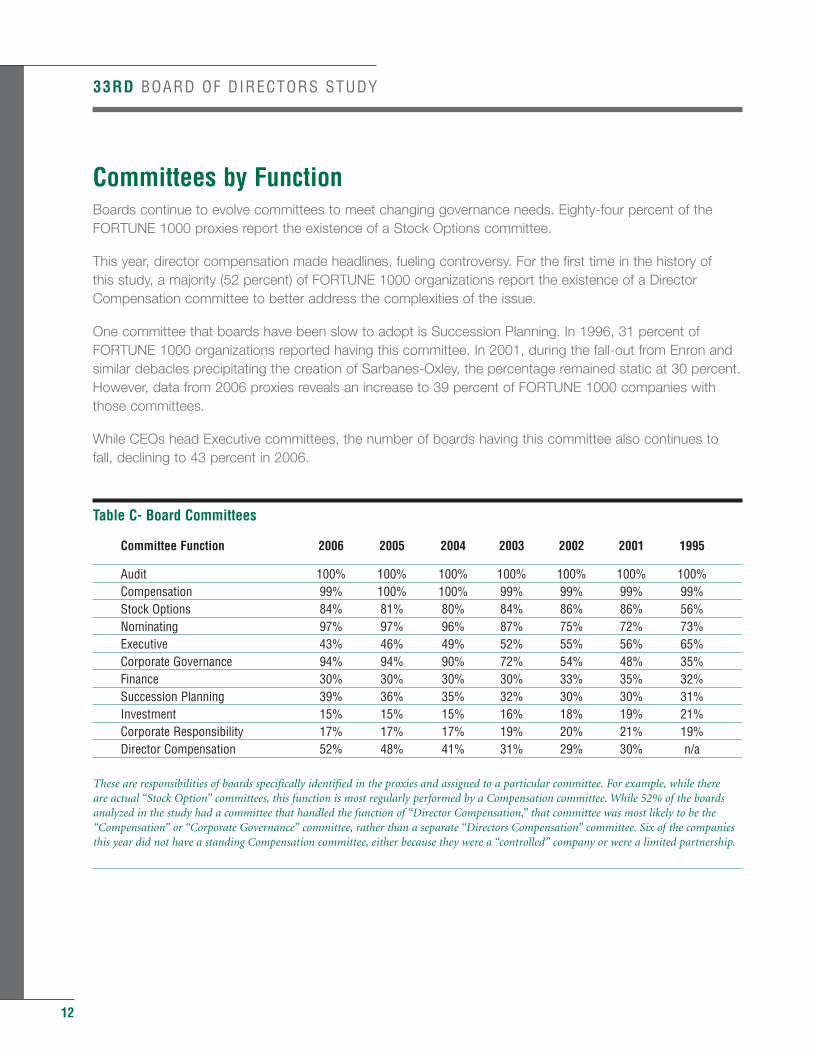
Committees by FunctionBoards continue to evolve committees to meet changing governance needs. Eighty-four percent of theFORTUNE 1000 proxies report the existence of a Stock Options committee.
This year, director compensation made headlines, fueling controversy. For the first time in the history of this study, a majority (52 percent) of FORTUNE 1000 organizations report the existence of a DirectorCompensation committee to better address the complexities of the issue.
One committee that boards have been slow to adopt is Succession Planning. In 1996, 31 percent ofFORTUNE 1000 organizations reported having this committee. In 2001, during the fall-out from Enron andsimilar debacles precipitating the creation of Sarbanes-Oxley, the percentage remained static at 30 percent.However, data from 2006 proxies reveals an increase to 39 percent of FORTUNE 1000 companies withthose committees.
While CEOs head Executive committees, the number of boards having this committee also continues tofall, declining to 43 percent in 2006.
Table C- Board Committees
Committee Function 2006 2005 2004 2003 2002 2001 1995
Audit 100% 100% 100% 100% 100% 100% 100%Compensation 99% 100% 100% 99% 99% 99% 99%Stock Options 84% 81% 80% 84% 86% 86% 56%Nominating 97% 97% 96% 87% 75% 72% 73%Executive 43% 46% 49% 52% 55% 56% 65%Corporate Governance 94% 94% 90% 72% 54% 48% 35%Finance 30% 30% 30% 30% 33% 35% 32%Succession Planning 39% 36% 35% 32% 30% 30% 31%Investment 15% 15% 15% 16% 18% 19% 21%Corporate Responsibility 17% 17% 17% 19% 20% 21% 19%Director Compensation 52% 48% 41% 31% 29% 30% n/a
These are responsibilities of boards specifically identified in the proxies and assigned to a particular committee. For example, while there are actual “Stock Option” committees, this function is most regularly performed by a Compensation committee. While 52% of the boardsanalyzed in the study had a committee that handled the function of “Director Compensation,” that committee was most likely to be the“Compensation” or “Corporate Governance” committee, rather than a separate “Directors Compensation” committee. Six of the companiesthis year did not have a standing Compensation committee, either because they were a “controlled” company or were a limited partnership.
33RD BOARD OF DIRECTORS STUDY
33RD BOARD OF DIRECTORS STUDY
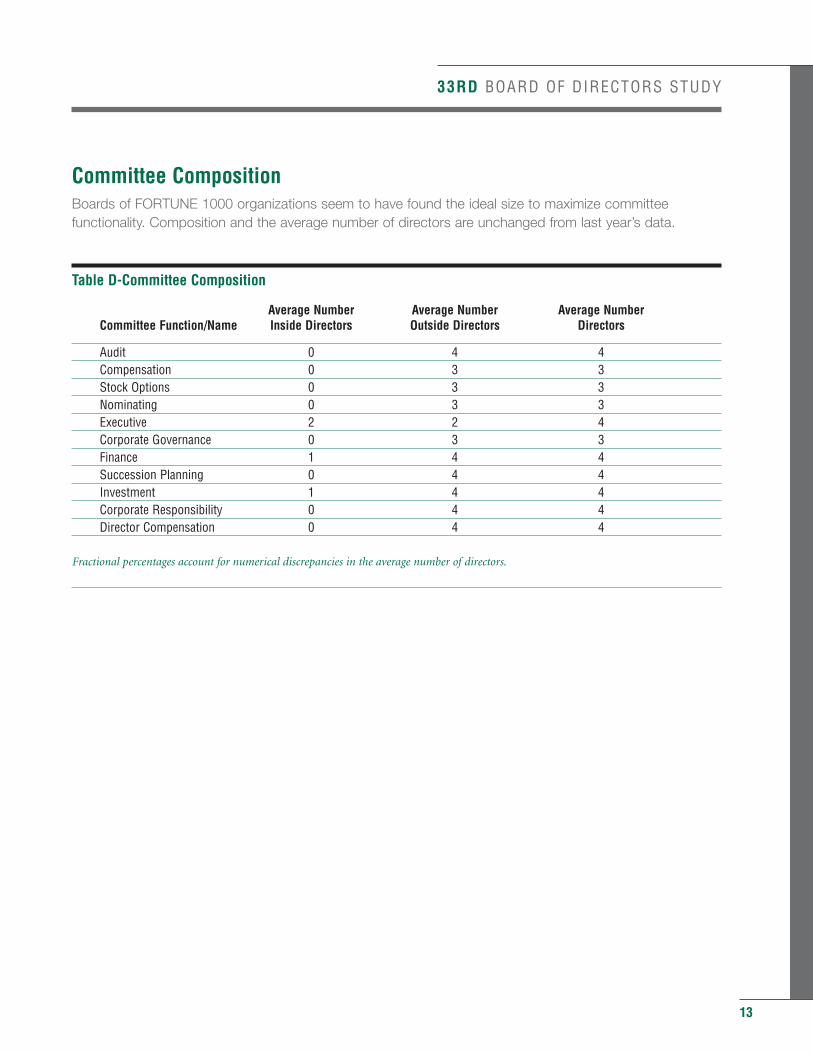
Committee CompositionBoards of FORTUNE 1000 organizations seem to have found the ideal size to maximize committeefunctionality. Composition and the average number of directors are unchanged from last year’s data.
Table D-Committee Composition
Average Number Average Number Average NumberCommittee Function/Name Inside Directors Outside Directors Directors
Audit 0 4 4Compensation 0 3 3Stock Options 0 3 3Nominating 0 3 3Executive 2 2 4Corporate Governance 0 3 3Finance 1 4 4Succession Planning 0 4 4Investment 1 4 4Corporate Responsibility 0 4 4Director Compensation 0 4 4
Fractional percentages account for numerical discrepancies in the average number of directors.
13
14
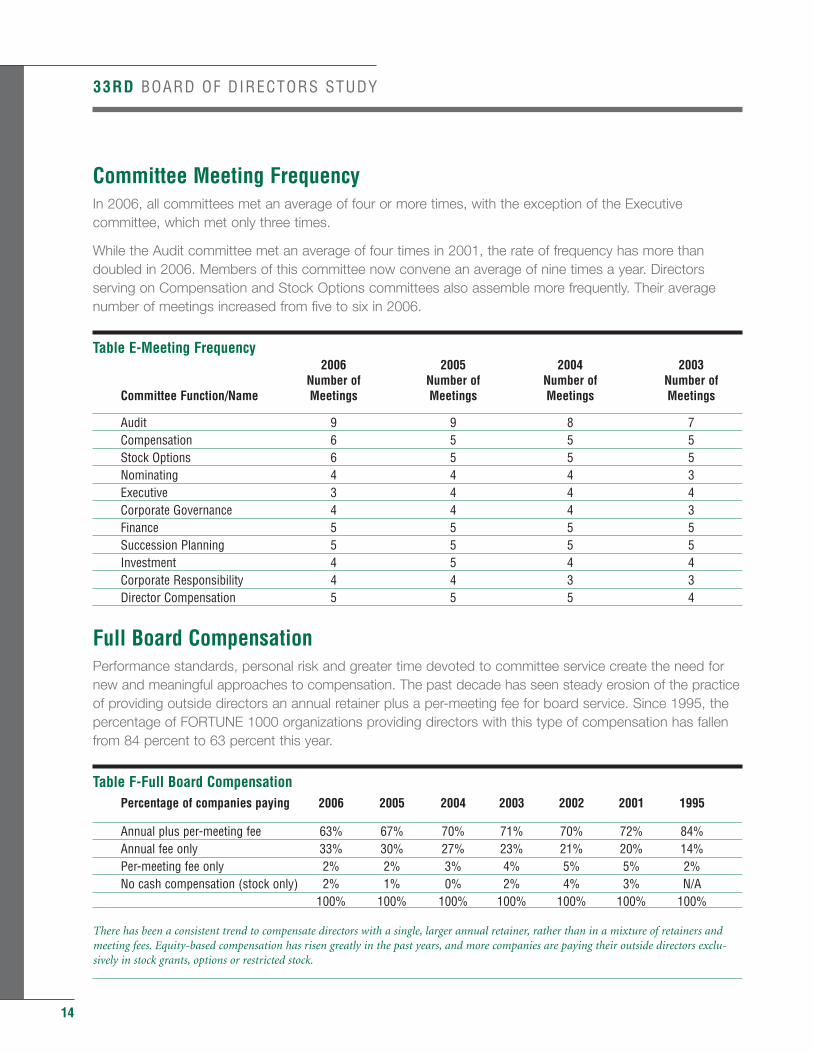
Committee Meeting FrequencyIn 2006, all committees met an average of four or more times, with the exception of the Executivecommittee, which met only three times.
While the Audit committee met an average of four times in 2001, the rate of frequency has more thandoubled in 2006. Members of this committee now convene an average of nine times a year. Directorsserving on Compensation and Stock Options committees also assemble more frequently. Their averagenumber of meetings increased from five to six in 2006.
Table E-Meeting Frequency2006 2005 2004 2003
Number of Number of Number of Number ofCommittee Function/Name Meetings Meetings Meetings Meetings
Audit 9 9 8 7Compensation 6 5 5 5Stock Options 6 5 5 5Nominating 4 4 4 3Executive 3 4 4 4Corporate Governance 4 4 4 3Finance 5 5 5 5Succession Planning 5 5 5 5Investment 4 5 4 4Corporate Responsibility 4 4 3 3Director Compensation 5 5 5 4
Full Board CompensationPerformance standards, personal risk and greater time devoted to committee service create the need fornew and meaningful approaches to compensation. The past decade has seen steady erosion of the practiceof providing outside directors an annual retainer plus a per-meeting fee for board service. Since 1995, thepercentage of FORTUNE 1000 organizations providing directors with this type of compensation has fallenfrom 84 percent to 63 percent this year.
Table F-Full Board CompensationPercentage of companies paying 2006 2005 2004 2003 2002 2001 1995
Annual plus per-meeting fee 63% 67% 70% 71% 70% 72% 84%Annual fee only 33% 30% 27% 23% 21% 20% 14%Per-meeting fee only 2% 2% 3% 4% 5% 5% 2%No cash compensation (stock only) 2% 1% 0% 2% 4% 3% N/A
100% 100% 100% 100% 100% 100% 100%
There has been a consistent trend to compensate directors with a single, larger annual retainer, rather than in a mixture of retainers andmeeting fees. Equity-based compensation has risen greatly in the past years, and more companies are paying their outside directors exclu-sively in stock grants, options or restricted stock.
33RD BOARD OF DIRECTORS STUDY
33RD BOARD OF DIRECTORS STUDY
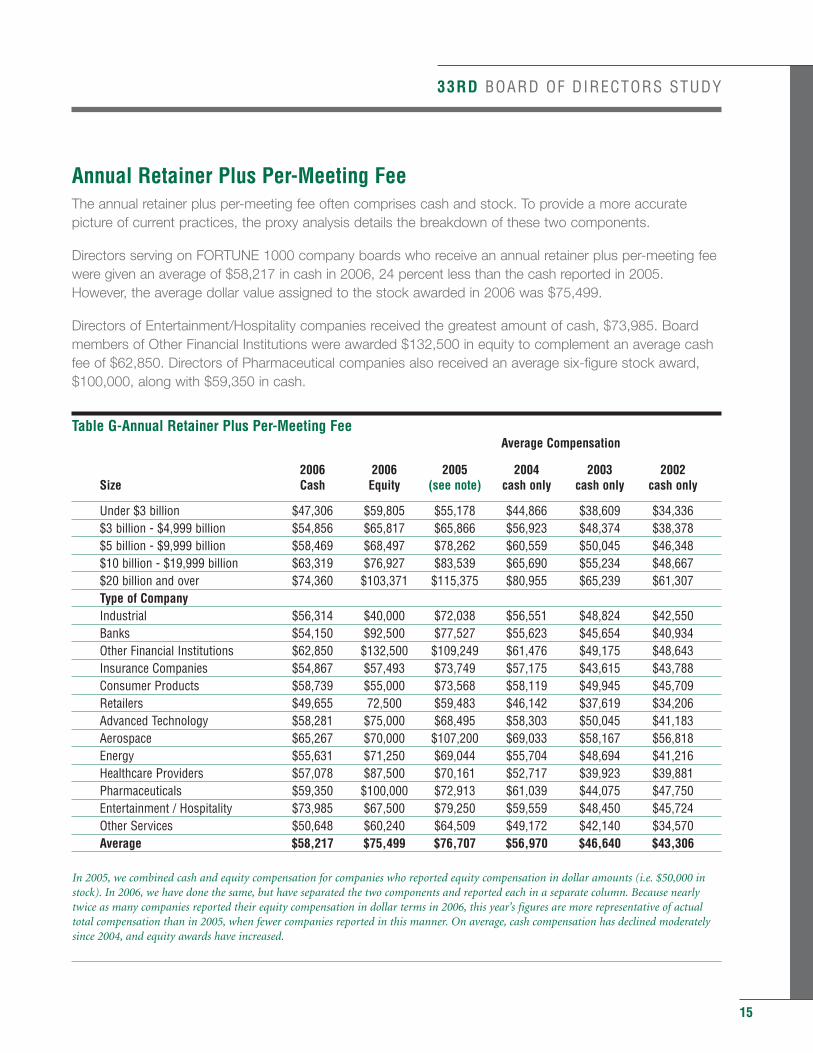
Annual Retainer Plus Per-Meeting FeeThe annual retainer plus per-meeting fee often comprises cash and stock. To provide a more accuratepicture of current practices, the proxy analysis details the breakdown of these two components.
Directors serving on FORTUNE 1000 company boards who receive an annual retainer plus per-meeting feewere given an average of $58,217 in cash in 2006, 24 percent less than the cash reported in 2005.However, the average dollar value assigned to the stock awarded in 2006 was $75,499.
Directors of Entertainment/Hospitality companies received the greatest amount of cash, $73,985. Boardmembers of Other Financial Institutions were awarded $132,500 in equity to complement an average cashfee of $62,850. Directors of Pharmaceutical companies also received an average six-figure stock award,$100,000, along with $59,350 in cash.
Table G-Annual Retainer Plus Per-Meeting FeeAverage Compensation
2006 2006 2005 2004 2003 2002Size Cash Equity (see note) cash only cash only cash only
Under $3 billion $47,306 $59,805 $55,178 $44,866 $38,609 $34,336$3 billion - $4,999 billion $54,856 $65,817 $65,866 $56,923 $48,374 $38,378$5 billion - $9,999 billion $58,469 $68,497 $78,262 $60,559 $50,045 $46,348$10 billion - $19,999 billion $63,319 $76,927 $83,539 $65,690 $55,234 $48,667$20 billion and over $74,360 $103,371 $115,375 $80,955 $65,239 $61,307Type of CompanyIndustrial $56,314 $40,000 $72,038 $56,551 $48,824 $42,550Banks $54,150 $92,500 $77,527 $55,623 $45,654 $40,934Other Financial Institutions $62,850 $132,500 $109,249 $61,476 $49,175 $48,643Insurance Companies $54,867 $57,493 $73,749 $57,175 $43,615 $43,788Consumer Products $58,739 $55,000 $73,568 $58,119 $49,945 $45,709Retailers $49,655 72,500 $59,483 $46,142 $37,619 $34,206Advanced Technology $58,281 $75,000 $68,495 $58,303 $50,045 $41,183Aerospace $65,267 $70,000 $107,200 $69,033 $58,167 $56,818Energy $55,631 $71,250 $69,044 $55,704 $48,694 $41,216Healthcare Providers $57,078 $87,500 $70,161 $52,717 $39,923 $39,881Pharmaceuticals $59,350 $100,000 $72,913 $61,039 $44,075 $47,750Entertainment / Hospitality $73,985 $67,500 $79,250 $59,559 $48,450 $45,724Other Services $50,648 $60,240 $64,509 $49,172 $42,140 $34,570Average $58,217 $75,499 $76,707 $56,970 $46,640 $43,306
In 2005, we combined cash and equity compensation for companies who reported equity compensation in dollar amounts (i.e. $50,000 instock). In 2006, we have done the same, but have separated the two components and reported each in a separate column. Because nearlytwice as many companies reported their equity compensation in dollar terms in 2006, this year’s figures are more representative of actualtotal compensation than in 2005, when fewer companies reported in this manner. On average, cash compensation has declined moderatelysince 2004, and equity awards have increased.
15
16
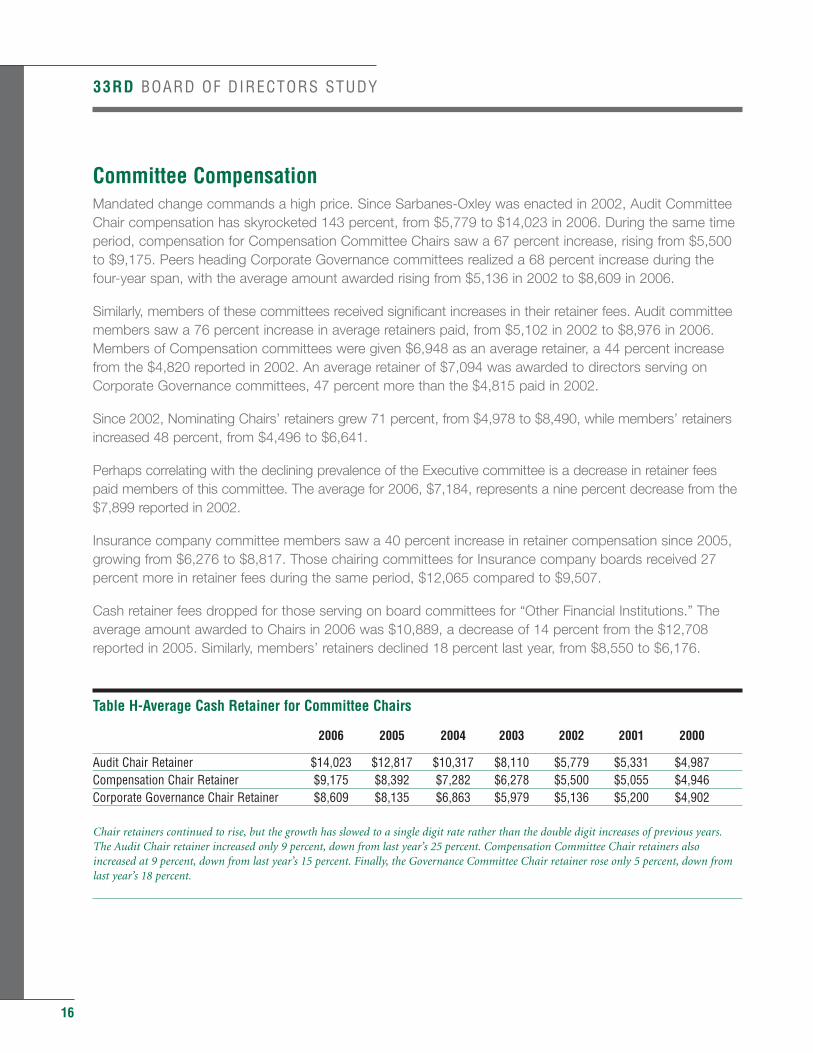
Committee CompensationMandated change commands a high price. Since Sarbanes-Oxley was enacted in 2002, Audit CommitteeChair compensation has skyrocketed 143 percent, from $5,779 to $14,023 in 2006. During the same timeperiod, compensation for Compensation Committee Chairs saw a 67 percent increase, rising from $5,500to $9,175. Peers heading Corporate Governance committees realized a 68 percent increase during thefour-year span, with the average amount awarded rising from $5,136 in 2002 to $8,609 in 2006.
Similarly, members of these committees received significant increases in their retainer fees. Audit committeemembers saw a 76 percent increase in average retainers paid, from $5,102 in 2002 to $8,976 in 2006.Members of Compensation committees were given $6,948 as an average retainer, a 44 percent increasefrom the $4,820 reported in 2002. An average retainer of $7,094 was awarded to directors serving onCorporate Governance committees, 47 percent more than the $4,815 paid in 2002.
Since 2002, Nominating Chairs’ retainers grew 71 percent, from $4,978 to $8,490, while members’ retainersincreased 48 percent, from $4,496 to $6,641.
Perhaps correlating with the declining prevalence of the Executive committee is a decrease in retainer feespaid members of this committee. The average for 2006, $7,184, represents a nine percent decrease from the$7,899 reported in 2002.
Insurance company committee members saw a 40 percent increase in retainer compensation since 2005,growing from $6,276 to $8,817. Those chairing committees for Insurance company boards received 27percent more in retainer fees during the same period, $12,065 compared to $9,507.
Cash retainer fees dropped for those serving on board committees for “Other Financial Institutions.” Theaverage amount awarded to Chairs in 2006 was $10,889, a decrease of 14 percent from the $12,708reported in 2005. Similarly, members’ retainers declined 18 percent last year, from $8,550 to $6,176.
Table H-Average Cash Retainer for Committee Chairs
2006 2005 2004 2003 2002 2001 2000
Audit Chair Retainer $14,023 $12,817 $10,317 $8,110 $5,779 $5,331 $4,987Compensation Chair Retainer $9,175 $8,392 $7,282 $6,278 $5,500 $5,055 $4,946Corporate Governance Chair Retainer $8,609 $8,135 $6,863 $5,979 $5,136 $5,200 $4,902
Chair retainers continued to rise, but the growth has slowed to a single digit rate rather than the double digit increases of previous years.The Audit Chair retainer increased only 9 percent, down from last year’s 25 percent. Compensation Committee Chair retainers alsoincreased at 9 percent, down from last year’s 15 percent. Finally, the Governance Committee Chair retainer rose only 5 percent, down fromlast year’s 18 percent.
33RD BOARD OF DIRECTORS STUDY
33RD BOARD OF DIRECTORS STUDY
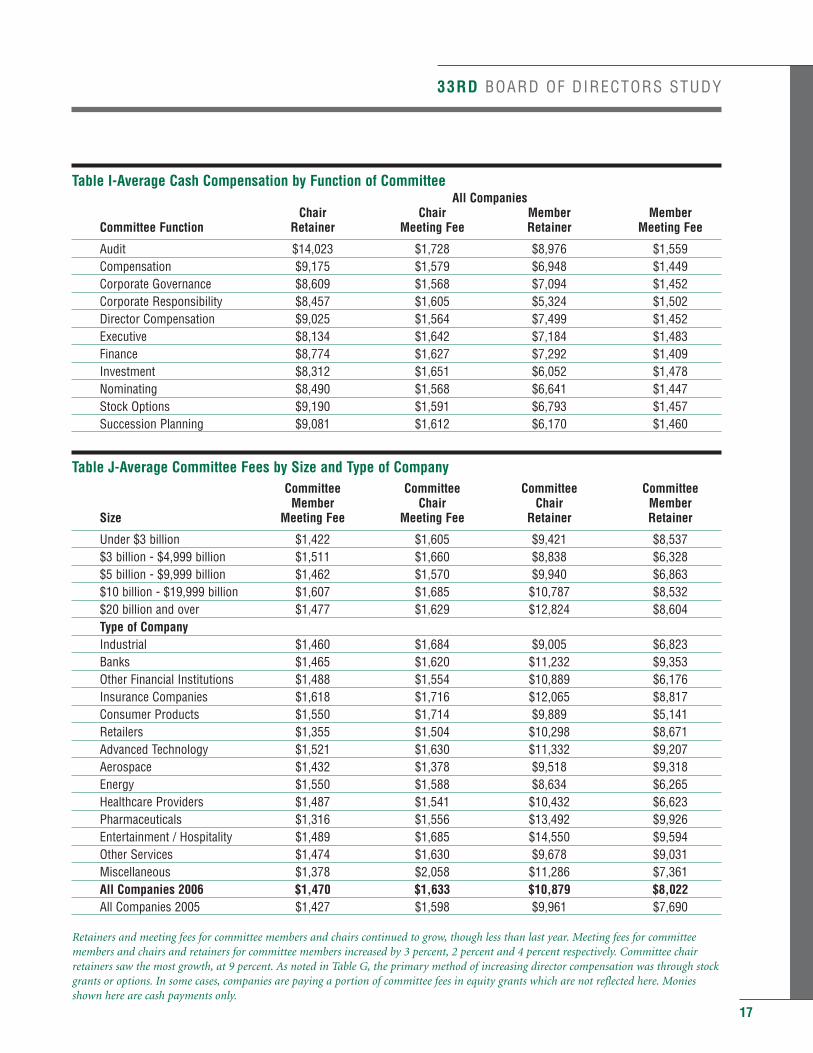
Table I-Average Cash Compensation by Function of CommitteeAll Companies
Chair Chair Member MemberCommittee Function Retainer Meeting Fee Retainer Meeting Fee
Audit $14,023 $1,728 $8,976 $1,559Compensation $9,175 $1,579 $6,948 $1,449Corporate Governance $8,609 $1,568 $7,094 $1,452Corporate Responsibility $8,457 $1,605 $5,324 $1,502Director Compensation $9,025 $1,564 $7,499 $1,452Executive $8,134 $1,642 $7,184 $1,483Finance $8,774 $1,627 $7,292 $1,409Investment $8,312 $1,651 $6,052 $1,478Nominating $8,490 $1,568 $6,641 $1,447Stock Options $9,190 $1,591 $6,793 $1,457Succession Planning $9,081 $1,612 $6,170 $1,460
Table J-Average Committee Fees by Size and Type of CompanyCommittee Committee Committee Committee
Member Chair Chair MemberSize Meeting Fee Meeting Fee Retainer Retainer
Under $3 billion $1,422 $1,605 $9,421 $8,537$3 billion - $4,999 billion $1,511 $1,660 $8,838 $6,328$5 billion - $9,999 billion $1,462 $1,570 $9,940 $6,863$10 billion - $19,999 billion $1,607 $1,685 $10,787 $8,532$20 billion and over $1,477 $1,629 $12,824 $8,604Type of CompanyIndustrial $1,460 $1,684 $9,005 $6,823Banks $1,465 $1,620 $11,232 $9,353Other Financial Institutions $1,488 $1,554 $10,889 $6,176Insurance Companies $1,618 $1,716 $12,065 $8,817Consumer Products $1,550 $1,714 $9,889 $5,141Retailers $1,355 $1,504 $10,298 $8,671Advanced Technology $1,521 $1,630 $11,332 $9,207Aerospace $1,432 $1,378 $9,518 $9,318Energy $1,550 $1,588 $8,634 $6,265Healthcare Providers $1,487 $1,541 $10,432 $6,623Pharmaceuticals $1,316 $1,556 $13,492 $9,926Entertainment / Hospitality $1,489 $1,685 $14,550 $9,594Other Services $1,474 $1,630 $9,678 $9,031Miscellaneous $1,378 $2,058 $11,286 $7,361All Companies 2006 $1,470 $1,633 $10,879 $8,022All Companies 2005 $1,427 $1,598 $9,961 $7,690
Retainers and meeting fees for committee members and chairs continued to grow, though less than last year. Meeting fees for committeemembers and chairs and retainers for committee members increased by 3 percent, 2 percent and 4 percent respectively. Committee chairretainers saw the most growth, at 9 percent. As noted in Table G, the primary method of increasing director compensation was through stockgrants or options. In some cases, companies are paying a portion of committee fees in equity grants which are not reflected here. Moniesshown here are cash payments only.
17
18
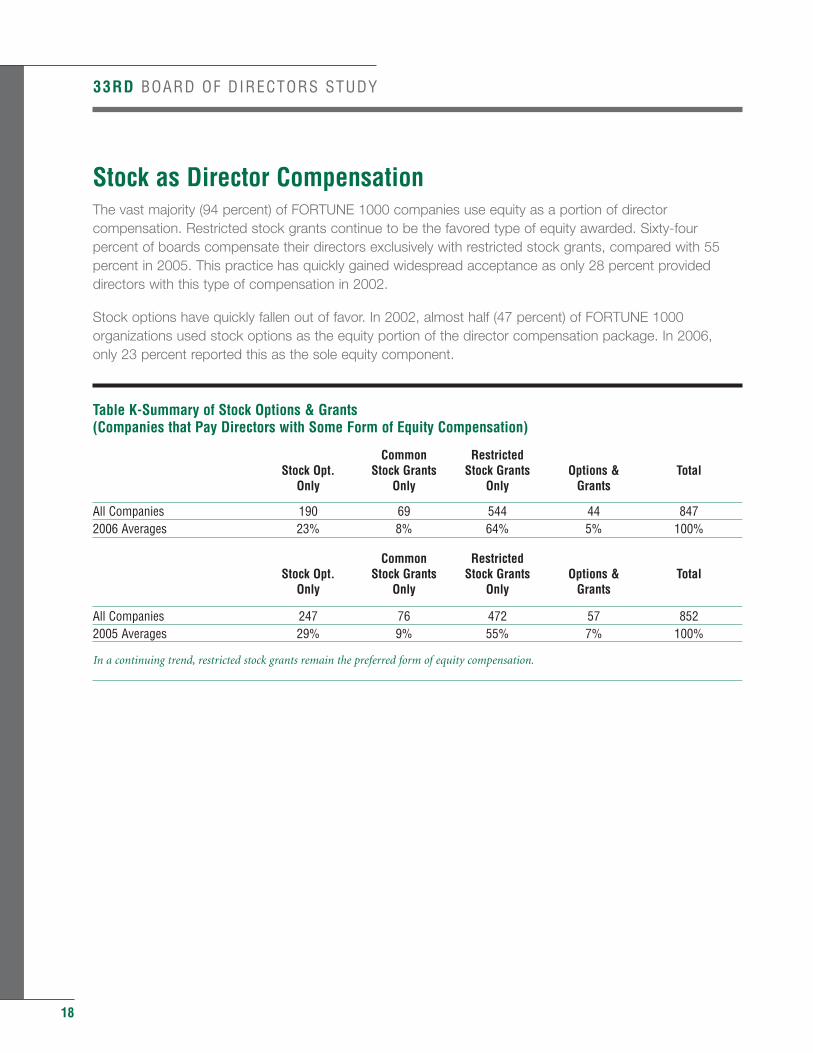
Stock as Director CompensationThe vast majority (94 percent) of FORTUNE 1000 companies use equity as a portion of directorcompensation. Restricted stock grants continue to be the favored type of equity awarded. Sixty-fourpercent of boards compensate their directors exclusively with restricted stock grants, compared with 55percent in 2005. This practice has quickly gained widespread acceptance as only 28 percent provideddirectors with this type of compensation in 2002.
Stock options have quickly fallen out of favor. In 2002, almost half (47 percent) of FORTUNE 1000organizations used stock options as the equity portion of the director compensation package. In 2006, only 23 percent reported this as the sole equity component.
Table K-Summary of Stock Options & Grants (Companies that Pay Directors with Some Form of Equity Compensation)
Common RestrictedStock Opt. Stock Grants Stock Grants Options & Total
Only Only Only Grants
All Companies 190 69 544 44 8472006 Averages 23% 8% 64% 5% 100%
Common RestrictedStock Opt. Stock Grants Stock Grants Options & Total
Only Only Only Grants
All Companies 247 76 472 57 8522005 Averages 29% 9% 55% 7% 100%
In a continuing trend, restricted stock grants remain the preferred form of equity compensation.
33RD BOARD OF DIRECTORS STUDY
33RD BOARD OF DIRECTORS STUDY
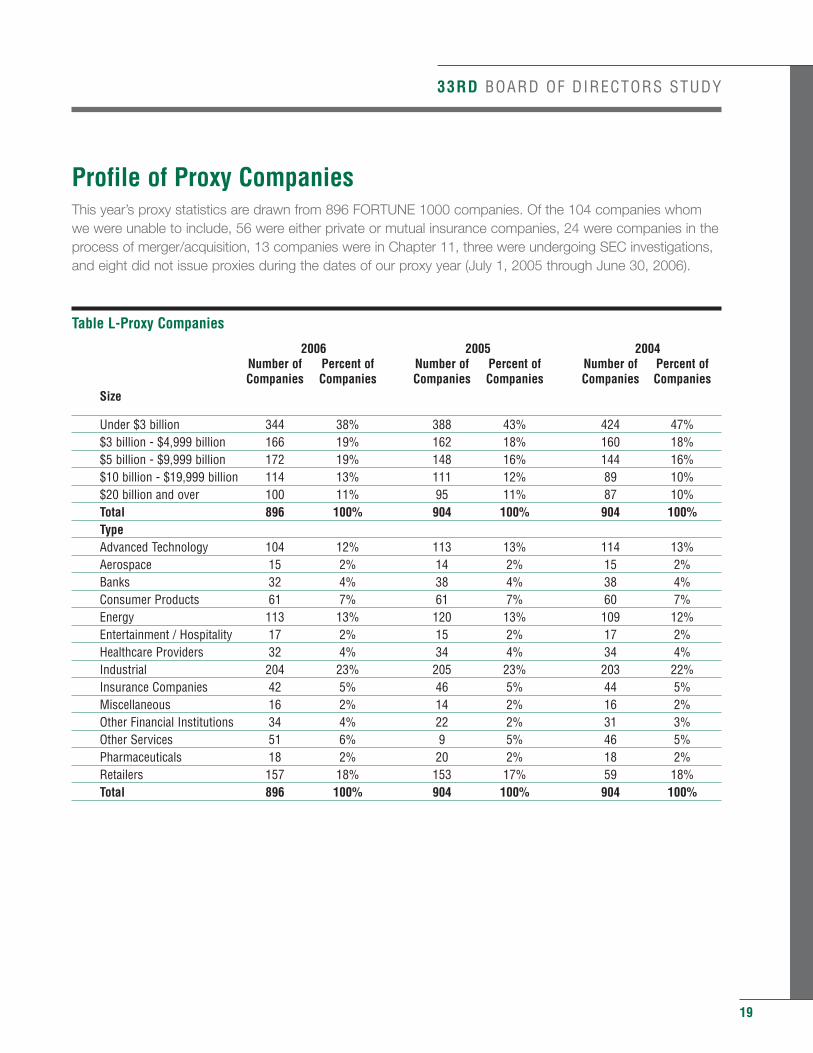
Profile of Proxy CompaniesThis year’s proxy statistics are drawn from 896 FORTUNE 1000 companies. Of the 104 companies whomwe were unable to include, 56 were either private or mutual insurance companies, 24 were companies in theprocess of merger/acquisition, 13 companies were in Chapter 11, three were undergoing SEC investigations,and eight did not issue proxies during the dates of our proxy year (July 1, 2005 through June 30, 2006).
Table L-Proxy Companies
2006 2005 2004Number of Percent of Number of Percent of Number of Percent ofCompanies Companies Companies Companies Companies Companies
Size
Under $3 billion 344 38% 388 43% 424 47%$3 billion - $4,999 billion 166 19% 162 18% 160 18%$5 billion - $9,999 billion 172 19% 148 16% 144 16%$10 billion - $19,999 billion 114 13% 111 12% 89 10%$20 billion and over 100 11% 95 11% 87 10%Total 896 100% 904 100% 904 100%TypeAdvanced Technology 104 12% 113 13% 114 13%Aerospace 15 2% 14 2% 15 2%Banks 32 4% 38 4% 38 4%Consumer Products 61 7% 61 7% 60 7%Energy 113 13% 120 13% 109 12%Entertainment / Hospitality 17 2% 15 2% 17 2%Healthcare Providers 32 4% 34 4% 34 4%Industrial 204 23% 205 23% 203 22%Insurance Companies 42 5% 46 5% 44 5%Miscellaneous 16 2% 14 2% 16 2%Other Financial Institutions 34 4% 22 2% 31 3%Other Services 51 6% 9 5% 46 5%Pharmaceuticals 18 2% 20 2% 18 2%Retailers 157 18% 153 17% 59 18%Total 896 100% 904 100% 904 100%
19
20
BOARD PRACTICES IN THE AMERICAS — SURVEY RESPONSESEvents occurring in 2006 introduced several terms into the vernacular of corporate governance, stockoptions backdating and pretexting among them. Directors responding in the Americas were undeterred bythe ensuing shock waves and remained focused on their fiduciary duties. This year’s findings suggest thatCEO evaluations are now the norm rather than the exception and that management succession and theorganization’s bench strength are respondents’ primary concerns. CEO and director compensationcontinue to evolve, with restricted stock replacing stock options as an equity incentive. For the majority,protecting shareholders brought about an established policy requiring a peer to resign from the board if heor she were fired from his/her primary employment.
These and the following findings are based on responses received from board members of leadingorganizations based in Canada, Latin America, and the United States.
Board Composition
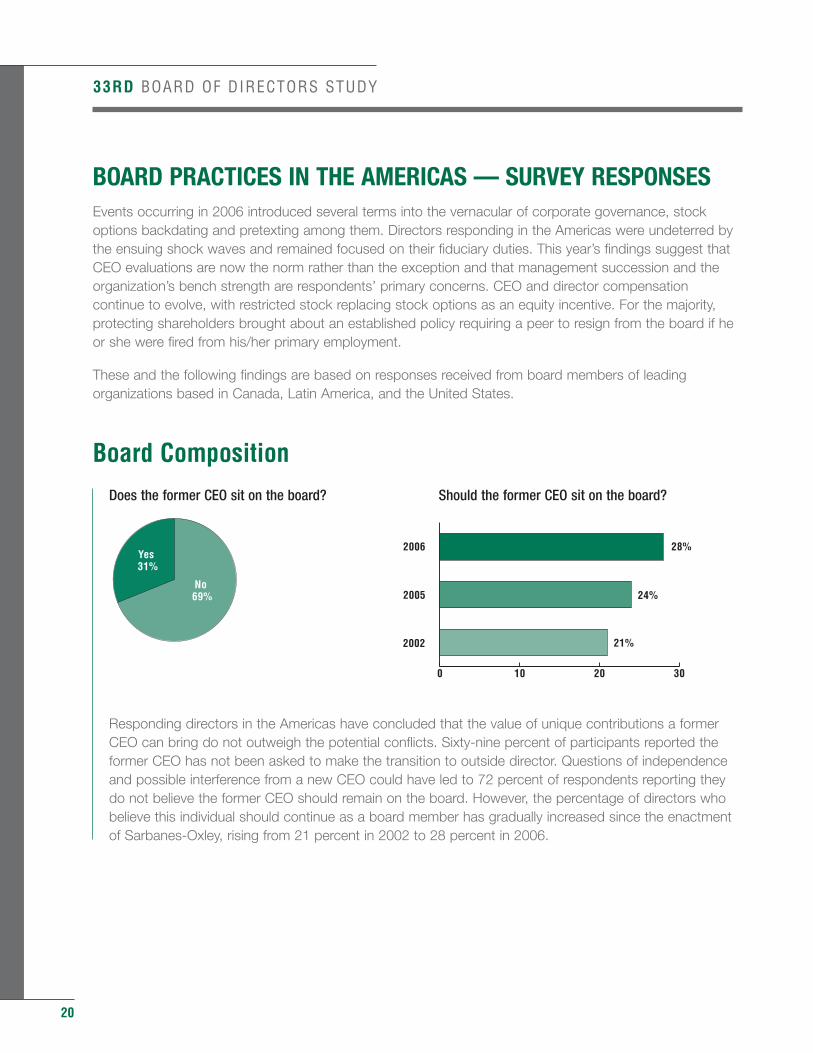
Does the former CEO sit on the board? Should the former CEO sit on the board?
Responding directors in the Americas have concluded that the value of unique contributions a former CEO can bring do not outweigh the potential conflicts. Sixty-nine percent of participants reported the former CEO has not been asked to make the transition to outside director. Questions of independence and possible interference from a new CEO could have led to 72 percent of respondents reporting they do not believe the former CEO should remain on the board. However, the percentage of directors who believe this individual should continue as a board member has gradually increased since the enactment of Sarbanes-Oxley, rising from 21 percent in 2002 to 28 percent in 2006.
33RD BOARD OF DIRECTORS STUDY
No 69%
Yes 31%
0 10 20 30
2002
2005
2006
24%
28%
21%
33RD BOARD OF DIRECTORS STUDY
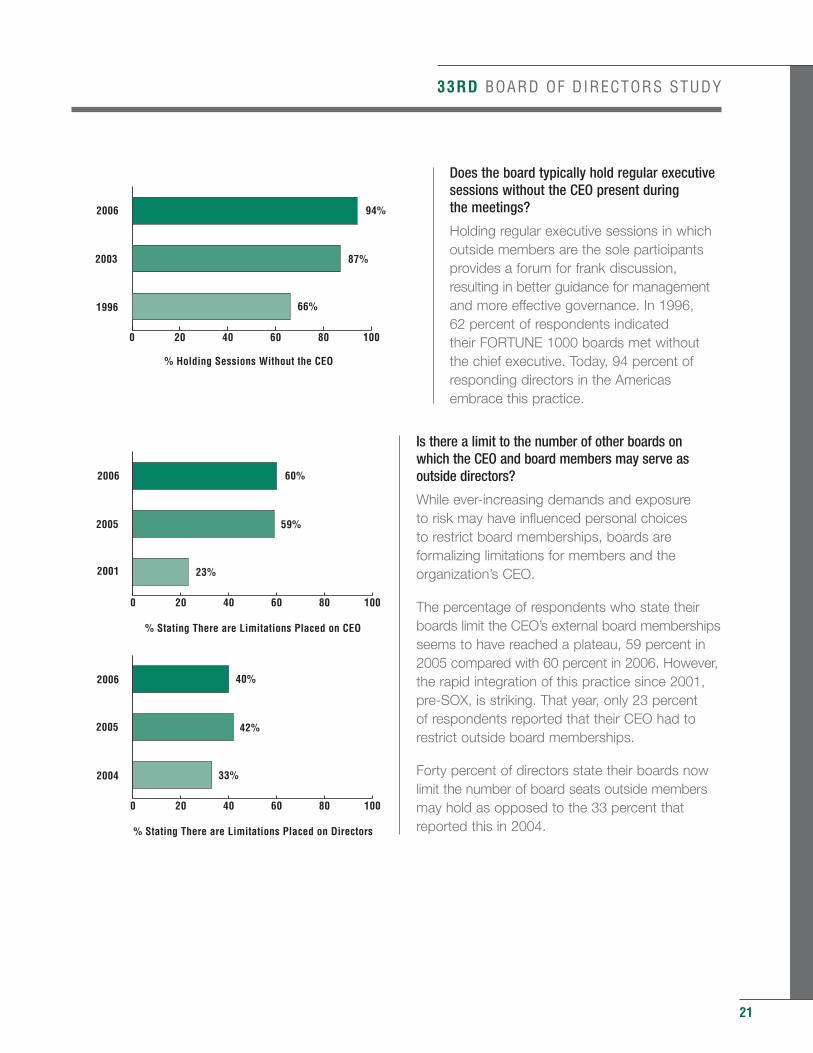
Does the board typically hold regular executivesessions without the CEO present during the meetings?
Holding regular executive sessions in whichoutside members are the sole participantsprovides a forum for frank discussion,resulting in better guidance for managementand more effective governance. In 1996, 62 percent of respondents indicated their FORTUNE 1000 boards met withoutthe chief executive. Today, 94 percent ofresponding directors in the Americasembrace this practice.
Is there a limit to the number of other boards on which the CEO and board members may serve asoutside directors?
While ever-increasing demands and exposure to risk may have influenced personal choices to restrict board memberships, boards areformalizing limitations for members and theorganization’s CEO.
The percentage of respondents who state theirboards limit the CEO’s external board membershipsseems to have reached a plateau, 59 percent in2005 compared with 60 percent in 2006. However,the rapid integration of this practice since 2001,pre-SOX, is striking. That year, only 23 percent of respondents reported that their CEO had torestrict outside board memberships.
Forty percent of directors state their boards nowlimit the number of board seats outside membersmay hold as opposed to the 33 percent thatreported this in 2004.
21
0 20 40 60 80 100
1996
2003
2006
% Holding Sessions Without the CEO
66%
94%
87%
0 20 40 60 80 100
2001
2005
2006
% Stating There are Limitations Placed on CEO
59%
60%
23%
0 20 40 60 80 100
2004
2005
2006
% Stating There are Limitations Placed on Directors
42%
40%
33%
22
Board Service
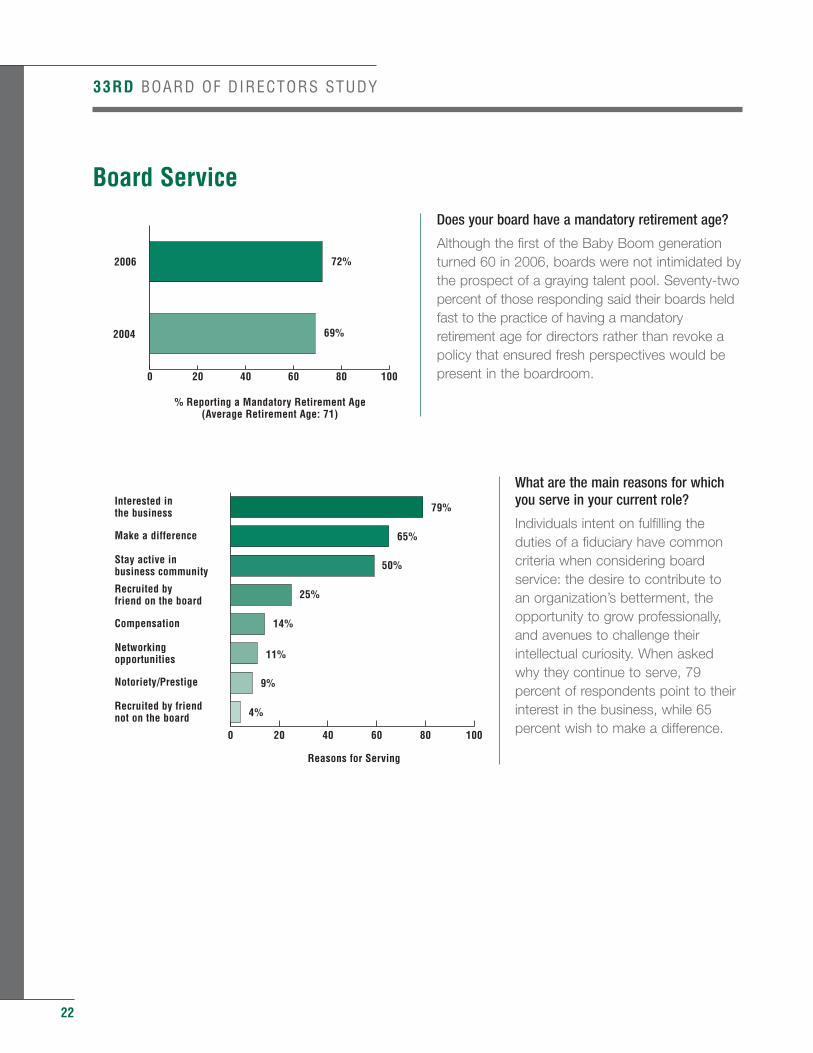
Does your board have a mandatory retirement age?
Although the first of the Baby Boom generationturned 60 in 2006, boards were not intimidated bythe prospect of a graying talent pool. Seventy-twopercent of those responding said their boards heldfast to the practice of having a mandatoryretirement age for directors rather than revoke apolicy that ensured fresh perspectives would bepresent in the boardroom.
What are the main reasons for whichyou serve in your current role?
Individuals intent on fulfilling theduties of a fiduciary have commoncriteria when considering boardservice: the desire to contribute to an organization’s betterment, theopportunity to grow professionally,and avenues to challenge theirintellectual curiosity. When askedwhy they continue to serve, 79percent of respondents point to theirinterest in the business, while 65percent wish to make a difference.
33RD BOARD OF DIRECTORS STUDY
79%
65%
50%
25%
14%
9%
Reasons for Serving
4%
11%
0 20 40 60 80 100
Recruited by friendnot on the board
Notoriety/Prestige
Networkingopportunities
Compensation
Recruited byfriend on the board
Stay active inbusiness community
Make a difference
Interested inthe business
0 20 40 60 80 100
2004
2006
% Reporting a Mandatory Retirement Age(Average Retirement Age: 71)
69%
72%
33RD BOARD OF DIRECTORS STUDY
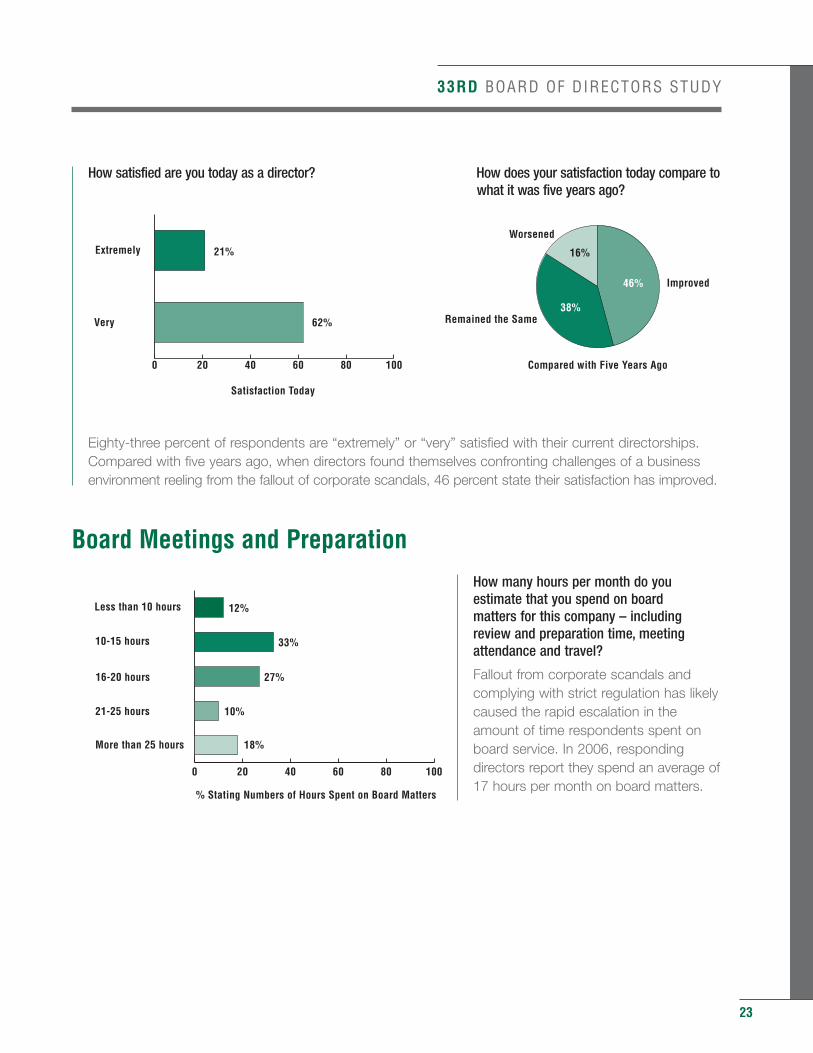
How satisfied are you today as a director? How does your satisfaction today compare to what it was five years ago?
Eighty-three percent of respondents are “extremely” or “very” satisfied with their current directorships. Compared with five years ago, when directors found themselves confronting challenges of a business environment reeling from the fallout of corporate scandals, 46 percent state their satisfaction has improved.
Board Meetings and Preparation
How many hours per month do youestimate that you spend on board matters for this company – includingreview and preparation time, meetingattendance and travel?
Fallout from corporate scandals andcomplying with strict regulation has likelycaused the rapid escalation in theamount of time respondents spent onboard service. In 2006, respondingdirectors report they spend an average of17 hours per month on board matters.
23
0 20 40 60 80 100
Very
Extremely 21%
62%
Satisfaction Today
16%
46%
38%
Compared with Five Years Ago
Improved
Worsened
Remained the Same
0 20 40 60 80 100
More than 25 hours
21-25 hours
16-20 hours
10-15 hours
Less than 10 hours
33%
27%
12%
10%
18%
% Stating Numbers of Hours Spent on Board Matters
24
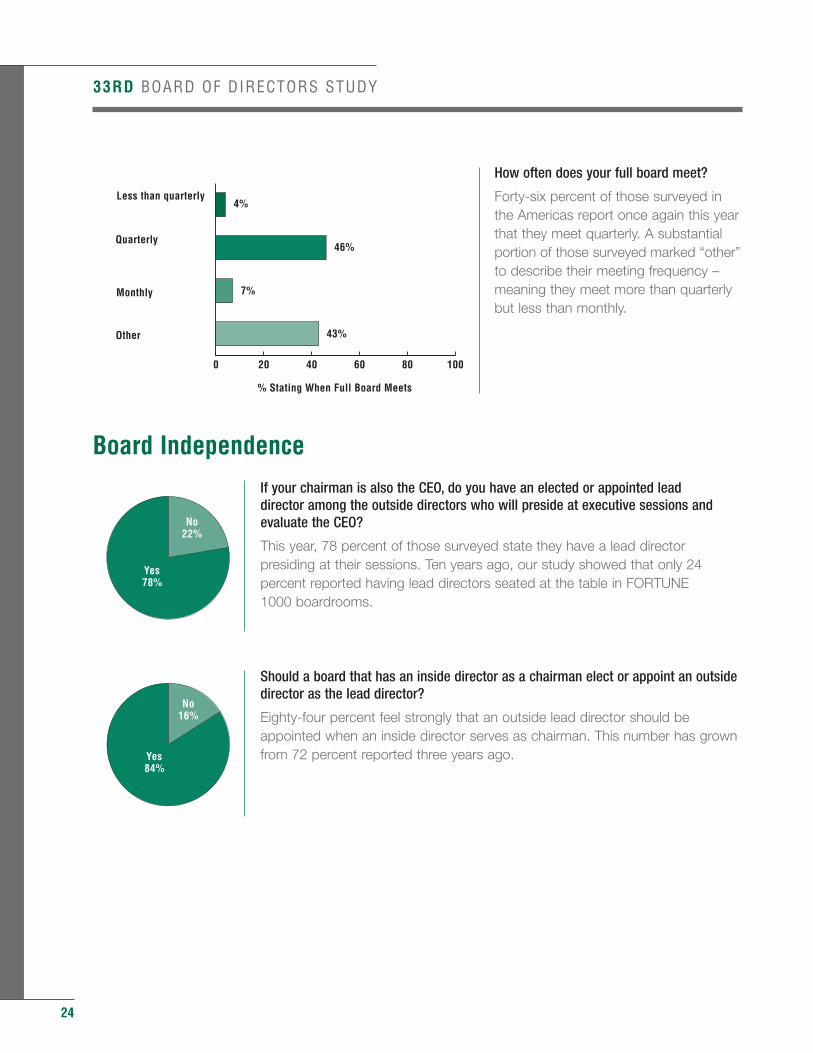
How often does your full board meet?
Forty-six percent of those surveyed inthe Americas report once again this yearthat they meet quarterly. A substantialportion of those surveyed marked “other”to describe their meeting frequency –meaning they meet more than quarterlybut less than monthly.
Board Independence
If your chairman is also the CEO, do you have an elected or appointed lead director among the outside directors who will preside at executive sessions andevaluate the CEO?
This year, 78 percent of those surveyed state they have a lead directorpresiding at their sessions. Ten years ago, our study showed that only 24percent reported having lead directors seated at the table in FORTUNE 1000 boardrooms.
Should a board that has an inside director as a chairman elect or appoint an outsidedirector as the lead director?
Eighty-four percent feel strongly that an outside lead director should beappointed when an inside director serves as chairman. This number has grownfrom 72 percent reported three years ago.
33RD BOARD OF DIRECTORS STUDY
No16%
Yes84%
0 20 40 60 80 100
Other
Monthly
Quarterly
Less than quarterly
46%
4%
7%
43%
% Stating When Full Board Meets
No22%
Yes78%
33RD BOARD OF DIRECTORS STUDY
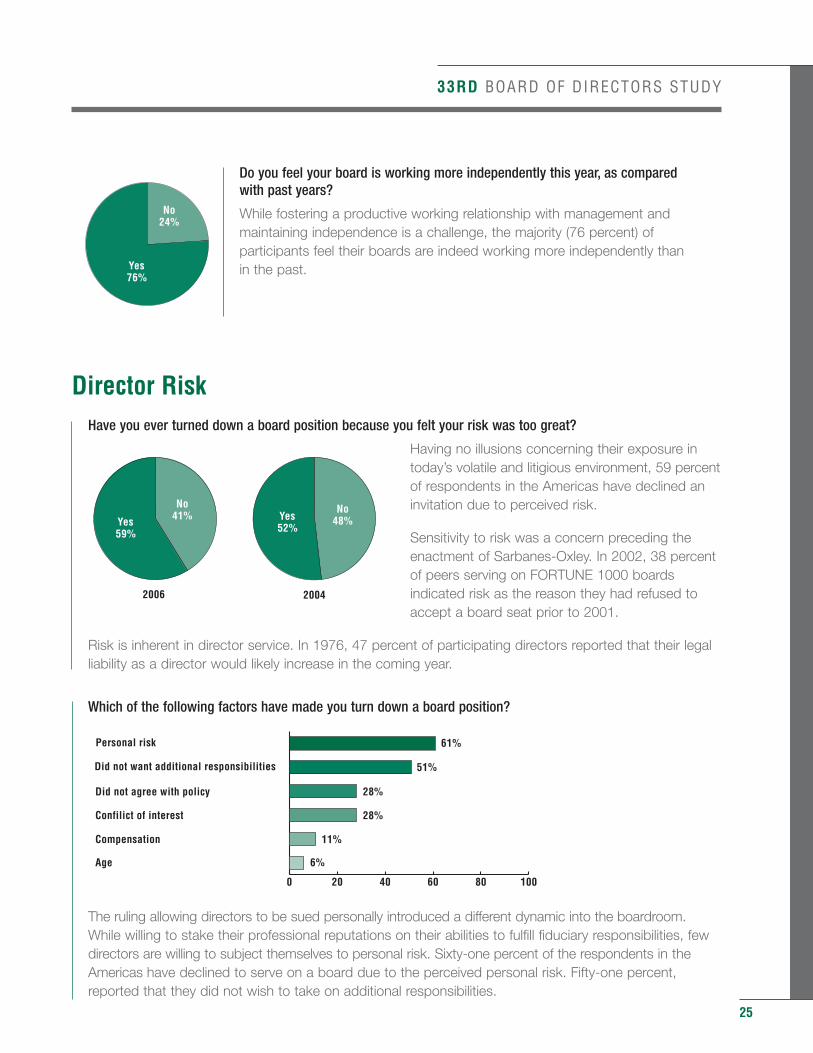
Do you feel your board is working more independently this year, as compared with past years?
While fostering a productive working relationship with management andmaintaining independence is a challenge, the majority (76 percent) ofparticipants feel their boards are indeed working more independently than in the past.
Director RiskHave you ever turned down a board position because you felt your risk was too great?
Having no illusions concerning their exposure intoday’s volatile and litigious environment, 59 percent of respondents in the Americas have declined aninvitation due to perceived risk.
Sensitivity to risk was a concern preceding theenactment of Sarbanes-Oxley. In 2002, 38 percentof peers serving on FORTUNE 1000 boardsindicated risk as the reason they had refused toaccept a board seat prior to 2001.
Risk is inherent in director service. In 1976, 47 percent of participating directors reported that their legal liability as a director would likely increase in the coming year.
Which of the following factors have made you turn down a board position?
The ruling allowing directors to be sued personally introduced a different dynamic into the boardroom. While willing to stake their professional reputations on their abilities to fulfill fiduciary responsibilities, few directors are willing to subject themselves to personal risk. Sixty-one percent of the respondents in the Americas have declined to serve on a board due to the perceived personal risk. Fifty-one percent, reported that they did not wish to take on additional responsibilities.
25
0 20 40 60 80 100
Age
Compensation
Confilict of interest
Did not agree with policy
Did not want additional responsibilities
Personal risk
51%
28%
61%
6%
11%
28%
No48%
No41%Yes
59%
Yes52%
20042006
No24%
Yes76%
26
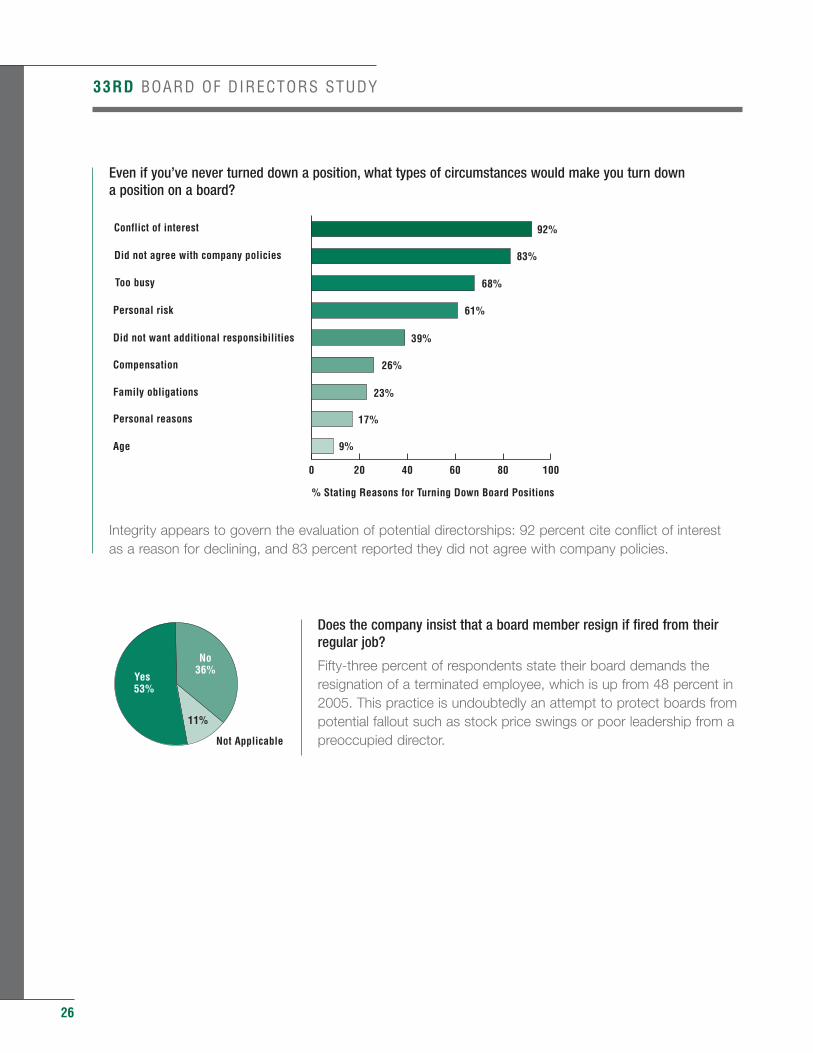
Even if you’ve never turned down a position, what types of circumstances would make you turn down a position on a board?
Integrity appears to govern the evaluation of potential directorships: 92 percent cite conflict of interestas a reason for declining, and 83 percent reported they did not agree with company policies.
Does the company insist that a board member resign if fired from theirregular job?
Fifty-three percent of respondents state their board demands theresignation of a terminated employee, which is up from 48 percent in2005. This practice is undoubtedly an attempt to protect boards frompotential fallout such as stock price swings or poor leadership from apreoccupied director.
33RD BOARD OF DIRECTORS STUDY
11%
No36%
Yes 53%
Not Applicable
0 20 40 60 80 100
Age
Personal reasons
Family obligations
Compensation
Did not want additional responsibilities
Personal risk
Too busy
Did not agree with company policies
Conflict of interest
83%
61%
92%
26%
39%
68%
23%
9%
17%
% Stating Reasons for Turning Down Board Positions
33RD BOARD OF DIRECTORS STUDY
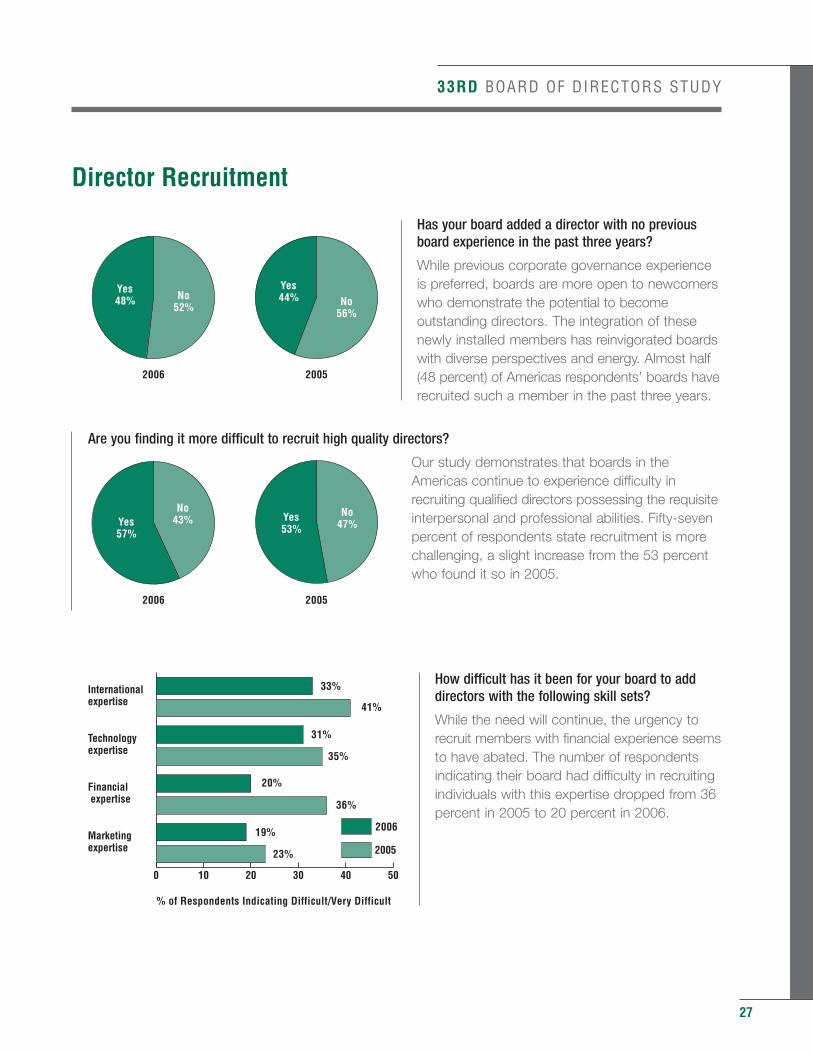
Director Recruitment
Has your board added a director with no previousboard experience in the past three years?
While previous corporate governance experienceis preferred, boards are more open to newcomerswho demonstrate the potential to becomeoutstanding directors. The integration of thesenewly installed members has reinvigorated boardswith diverse perspectives and energy. Almost half(48 percent) of Americas respondents’ boards haverecruited such a member in the past three years.
Are you finding it more difficult to recruit high quality directors?
Our study demonstrates that boards in theAmericas continue to experience difficulty inrecruiting qualified directors possessing the requisiteinterpersonal and professional abilities. Fifty-sevenpercent of respondents state recruitment is morechallenging, a slight increase from the 53 percentwho found it so in 2005.
How difficult has it been for your board to adddirectors with the following skill sets?
While the need will continue, the urgency torecruit members with financial experience seemsto have abated. The number of respondentsindicating their board had difficulty in recruitingindividuals with this expertise dropped from 36percent in 2005 to 20 percent in 2006.
27
No56%
No52%
Yes44%
Yes48%
20052006
No47%
No43% Yes
53%Yes57%
20052006
% Yes
% of Respondents Indicating Difficult/Very Difficult
0 10 20 30 40 50
2005Marketingexpertise
Financial expertise
Technologyexpertise
Internationalexpertise
23%
2006 19%
36%
20%
35%
31%
41%
33%
28
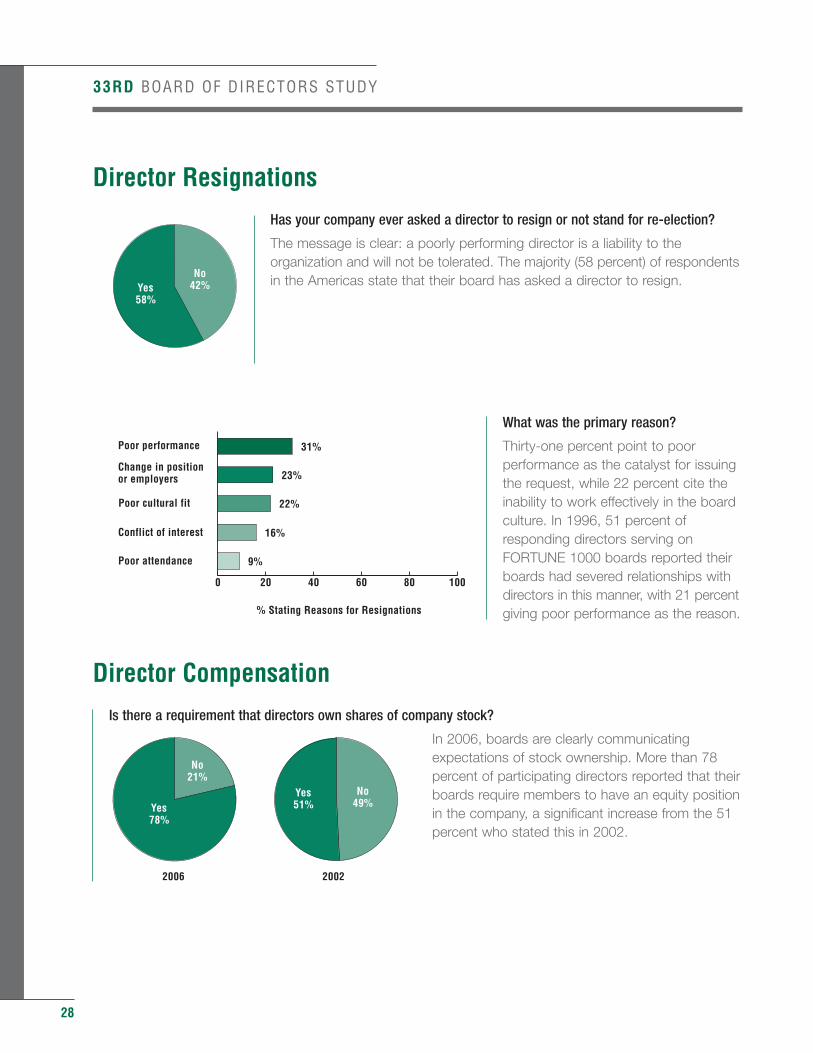
Director Resignations
Has your company ever asked a director to resign or not stand for re-election?
The message is clear: a poorly performing director is a liability to theorganization and will not be tolerated. The majority (58 percent) of respondentsin the Americas state that their board has asked a director to resign.
What was the primary reason?
Thirty-one percent point to poorperformance as the catalyst for issuingthe request, while 22 percent cite theinability to work effectively in the boardculture. In 1996, 51 percent ofresponding directors serving onFORTUNE 1000 boards reported theirboards had severed relationships withdirectors in this manner, with 21 percentgiving poor performance as the reason.
Director Compensation
Is there a requirement that directors own shares of company stock?
In 2006, boards are clearly communicatingexpectations of stock ownership. More than 78percent of participating directors reported that theirboards require members to have an equity positionin the company, a significant increase from the 51percent who stated this in 2002.
33RD BOARD OF DIRECTORS STUDY
No49%
No21%
Yes51%Yes
78%
20022006
No42%Yes
58%
0 20 40 60 80 100
Poor attendance
Conflict of interest
Poor cultural fit
Change in positionor employers
Poor performance
23%
22%
31%
16%
9%
% Stating Reasons for Resignations
33RD BOARD OF DIRECTORS STUDY
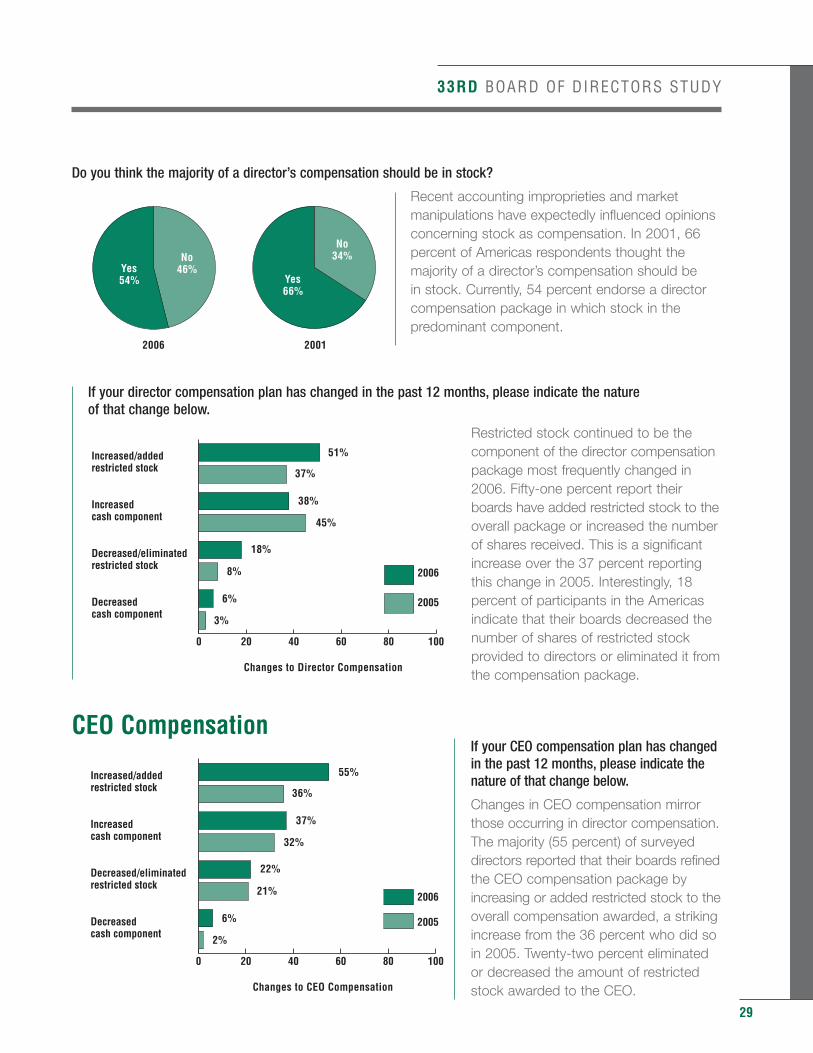
Do you think the majority of a director’s compensation should be in stock?
Recent accounting improprieties and marketmanipulations have expectedly influenced opinionsconcerning stock as compensation. In 2001, 66percent of Americas respondents thought themajority of a director’s compensation should be in stock. Currently, 54 percent endorse a directorcompensation package in which stock in thepredominant component.
If your director compensation plan has changed in the past 12 months, please indicate the nature of that change below.
Restricted stock continued to be thecomponent of the director compensationpackage most frequently changed in2006. Fifty-one percent report theirboards have added restricted stock to theoverall package or increased the numberof shares received. This is a significantincrease over the 37 percent reportingthis change in 2005. Interestingly, 18percent of participants in the Americasindicate that their boards decreased thenumber of shares of restricted stockprovided to directors or eliminated it fromthe compensation package.
CEO CompensationIf your CEO compensation plan has changedin the past 12 months, please indicate thenature of that change below.
Changes in CEO compensation mirrorthose occurring in director compensation.The majority (55 percent) of surveyeddirectors reported that their boards refinedthe CEO compensation package byincreasing or added restricted stock to theoverall compensation awarded, a strikingincrease from the 36 percent who did soin 2005. Twenty-two percent eliminatedor decreased the amount of restrictedstock awarded to the CEO.
29
No34%No
46%Yes66%
Yes54%
20012006
Changes to CEO Compensation
0 20 40 60 80 100
2006
2005Decreasedcash component
Decreased/eliminatedrestricted stock
Increasedcash component
Increased/addedrestricted stock
2%
6%
21%
22%
32%
37%
36%
55%
Changes to Director Compensation
0 20 40 60 80 100
2006
2005Decreasedcash component
Decreased/eliminatedrestricted stock
Increasedcash component
Increased/addedrestricted stock
3%
6%
8%
18%
45%
38%
37%
51%
30
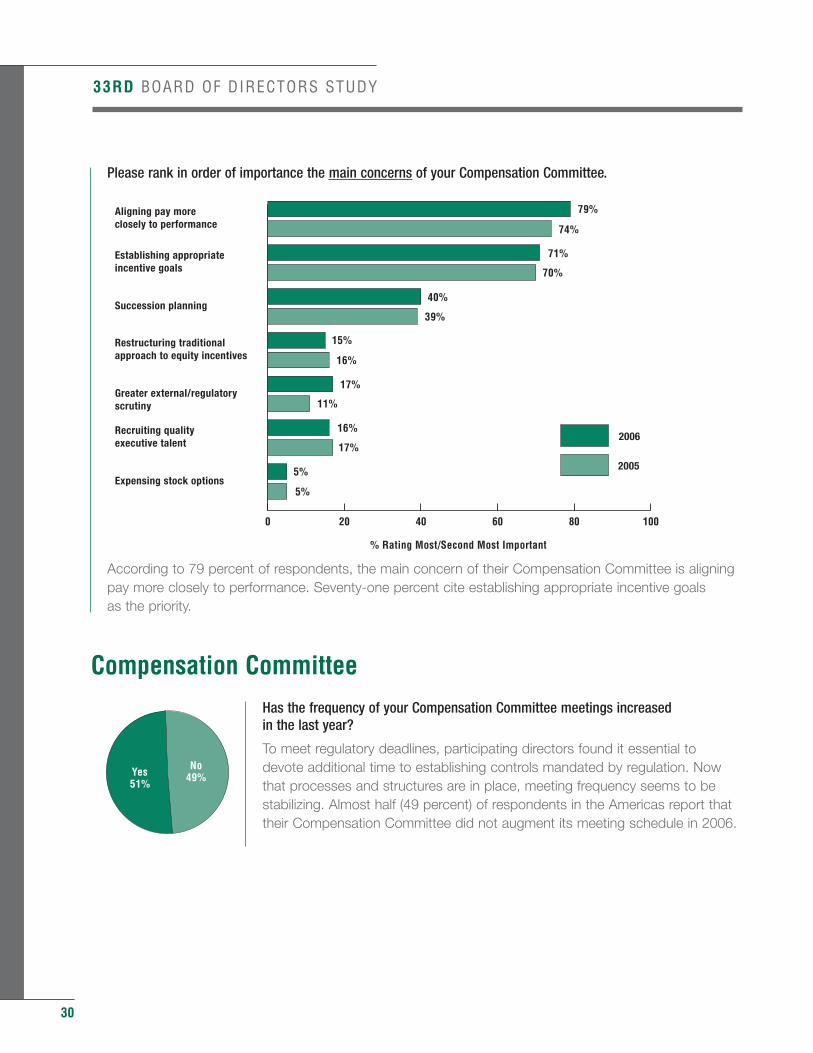
Please rank in order of importance the main concerns of your Compensation Committee.
According to 79 percent of respondents, the main concern of their Compensation Committee is aligning pay more closely to performance. Seventy-one percent cite establishing appropriate incentive goals as the priority.
Compensation Committee
Has the frequency of your Compensation Committee meetings increased in the last year?
To meet regulatory deadlines, participating directors found it essential todevote additional time to establishing controls mandated by regulation. Nowthat processes and structures are in place, meeting frequency seems to bestabilizing. Almost half (49 percent) of respondents in the Americas report thattheir Compensation Committee did not augment its meeting schedule in 2006.
33RD BOARD OF DIRECTORS STUDY
No49%Yes
51%
79%
74%
71%
39%
70%
40%
16%
15%
11%
5%
5%
17%
16%
17%
0 20 40 60 80 100
2006
2005Expensing stock options
Recruiting qualityexecutive talent
Greater external/regulatoryscrutiny
Restructuring traditionalapproach to equity incentives
Succession planning
Establishing appropriateincentive goals
Aligning pay moreclosely to performance
% Rating Most/Second Most Important
33RD BOARD OF DIRECTORS STUDY
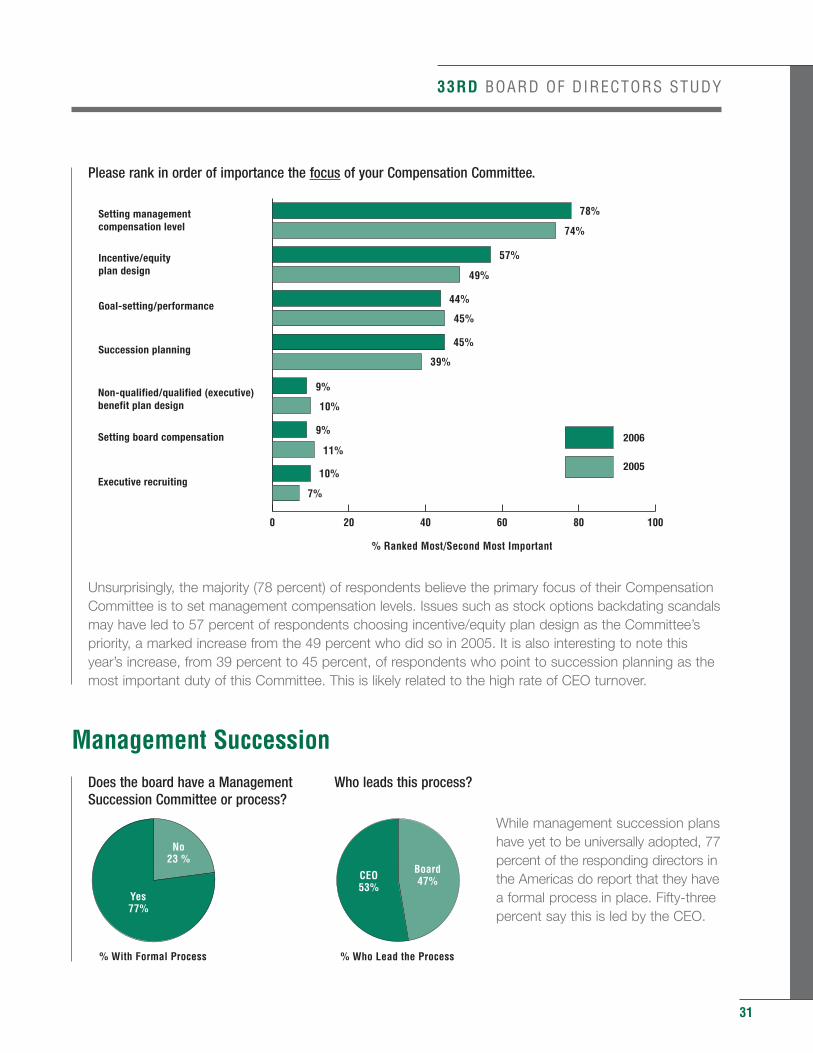
Please rank in order of importance the focus of your Compensation Committee.
Unsurprisingly, the majority (78 percent) of respondents believe the primary focus of their Compensation Committee is to set management compensation levels. Issues such as stock options backdating scandalsmay have led to 57 percent of respondents choosing incentive/equity plan design as the Committee’s priority, a marked increase from the 49 percent who did so in 2005. It is also interesting to note this year’s increase, from 39 percent to 45 percent, of respondents who point to succession planning as the most important duty of this Committee. This is likely related to the high rate of CEO turnover.
Management Succession
Does the board have a Management Who leads this process?Succession Committee or process?
While management succession planshave yet to be universally adopted, 77percent of the responding directors inthe Americas do report that they havea formal process in place. Fifty-threepercent say this is led by the CEO.
31
78%
74%
57%
45%
49%
44%
39%
45%
0 20 40 60 80 100
2005
2006
Executive recruiting
Setting board compensation
Non-qualified/qualified (executive)benefit plan design
Succession planning
Goal-setting/performance
Incentive/equityplan design
Setting managementcompensation level
10%
10%
7%
9%
9%
11%
% Ranked Most/Second Most Important
No23 %
% With Formal Process
Yes77%
Board47%
% Who Lead the Process
CEO53%
32
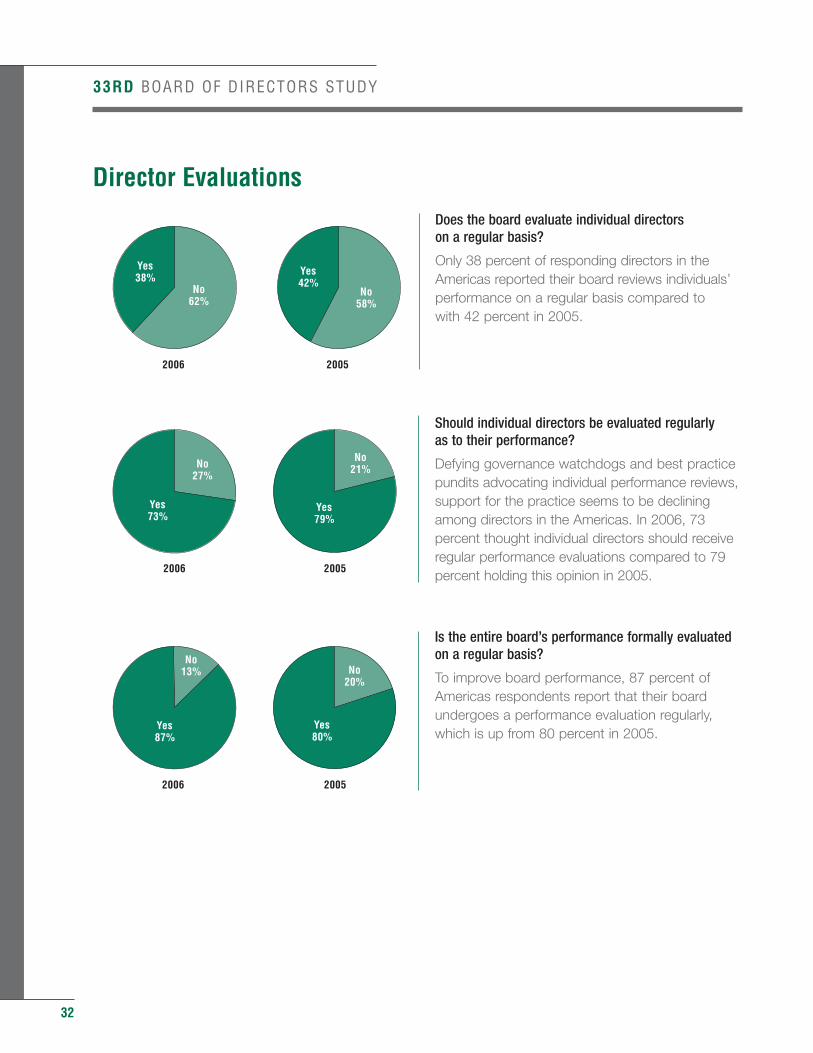
Director Evaluations
Does the board evaluate individual directors on a regular basis?
Only 38 percent of responding directors in theAmericas reported their board reviews individuals’performance on a regular basis compared to with 42 percent in 2005.
Should individual directors be evaluated regularly as to their performance?
Defying governance watchdogs and best practicepundits advocating individual performance reviews,support for the practice seems to be decliningamong directors in the Americas. In 2006, 73percent thought individual directors should receiveregular performance evaluations compared to 79percent holding this opinion in 2005.
Is the entire board’s performance formally evaluatedon a regular basis?
To improve board performance, 87 percent ofAmericas respondents report that their boardundergoes a performance evaluation regularly,which is up from 80 percent in 2005.
33RD BOARD OF DIRECTORS STUDY
No20%
No13%
Yes80%
Yes87%
20052006
No21%No
27%
Yes79%
Yes73%
20052006
No58%
No62%
Yes42%
Yes38%
20052006
33RD BOARD OF DIRECTORS STUDY
CEO Evaluations
Does the board have a formal process for evaluating CEO performance?
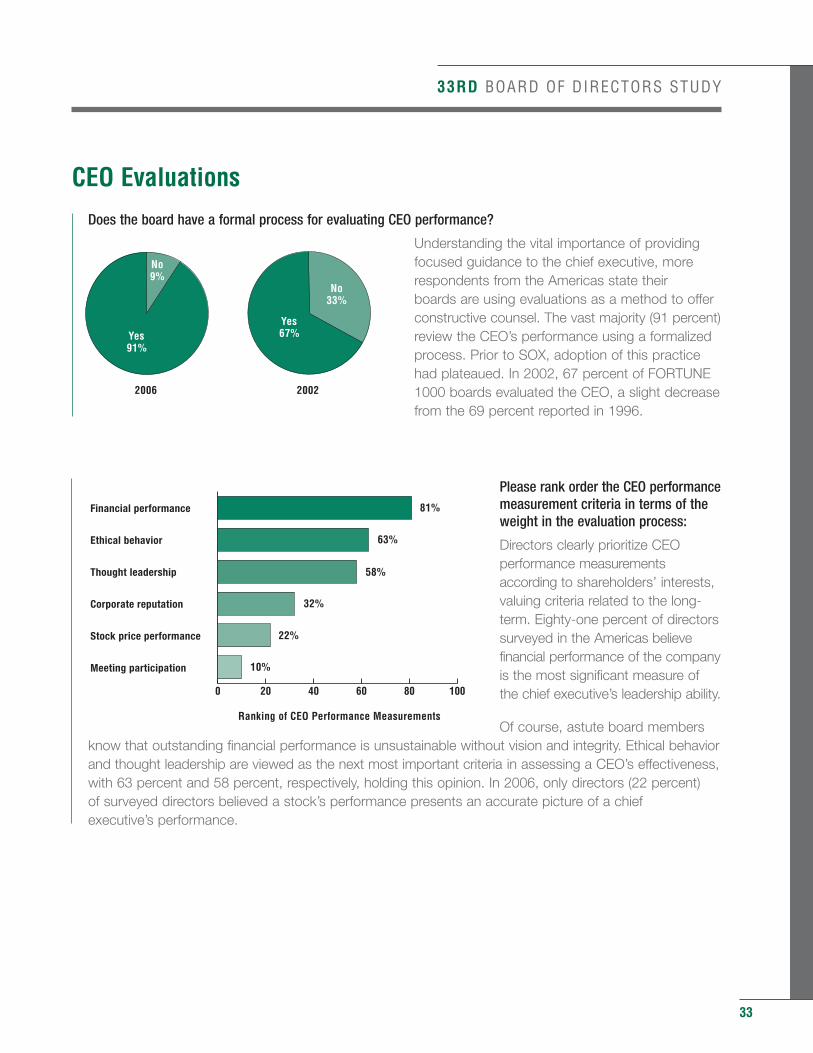
Understanding the vital importance of providingfocused guidance to the chief executive, morerespondents from the Americas state their boards are using evaluations as a method to offerconstructive counsel. The vast majority (91 percent)review the CEO’s performance using a formalizedprocess. Prior to SOX, adoption of this practicehad plateaued. In 2002, 67 percent of FORTUNE1000 boards evaluated the CEO, a slight decreasefrom the 69 percent reported in 1996.
Please rank order the CEO performancemeasurement criteria in terms of theweight in the evaluation process:
Directors clearly prioritize CEOperformance measurementsaccording to shareholders’ interests,valuing criteria related to the long-term. Eighty-one percent of directorssurveyed in the Americas believefinancial performance of the companyis the most significant measure ofthe chief executive’s leadership ability.
Of course, astute board members know that outstanding financial performance is unsustainable without vision and integrity. Ethical behaviorand thought leadership are viewed as the next most important criteria in assessing a CEO’s effectiveness, with 63 percent and 58 percent, respectively, holding this opinion. In 2006, only directors (22 percent) of surveyed directors believed a stock’s performance presents an accurate picture of a chief executive’s performance.
33
No33%
No9%
Yes67%Yes
91%
20022006
Ranking of CEO Performance Measurements
0 20 40 60 80 100
Meeting participation
Stock price performance
Corporate reputation
Thought leadership
Ethical behavior
Financial performance 81%
63%
58%
32%
10%
22%
Sarbanes-Oxley (SOX)
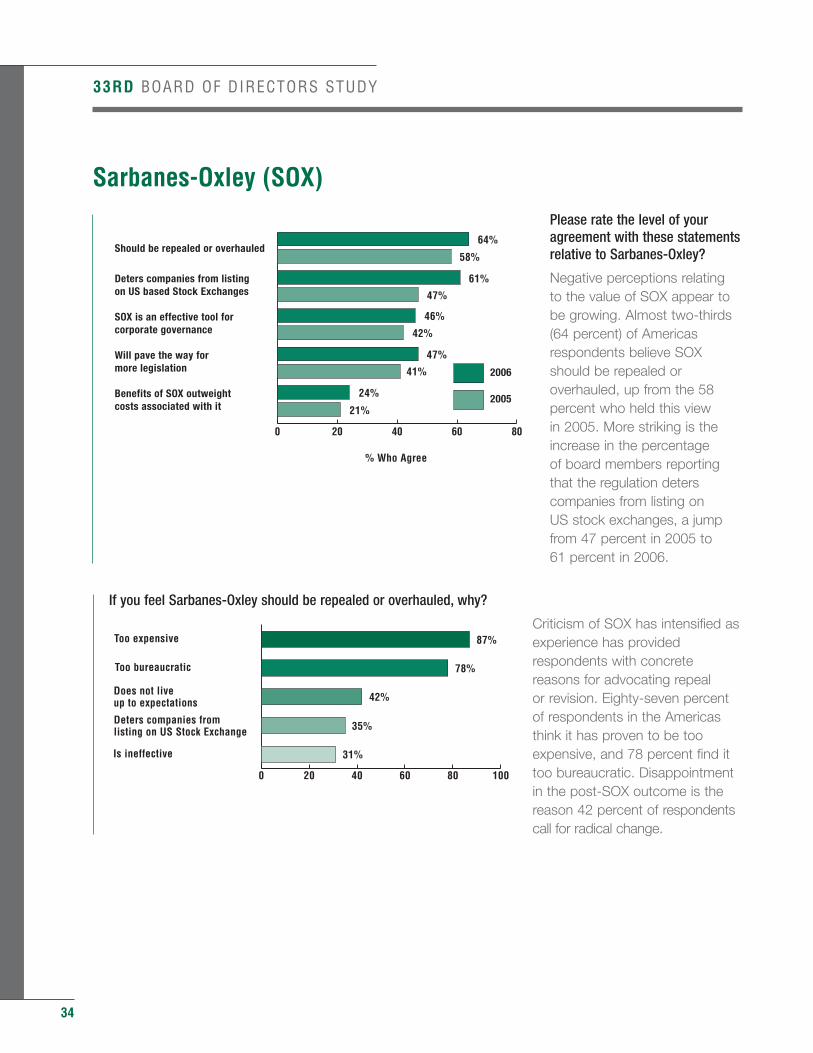
Please rate the level of youragreement with these statementsrelative to Sarbanes-Oxley?
Negative perceptions relating to the value of SOX appear tobe growing. Almost two-thirds(64 percent) of Americasrespondents believe SOXshould be repealed oroverhauled, up from the 58percent who held this view in 2005. More striking is theincrease in the percentage of board members reportingthat the regulation deterscompanies from listing on US stock exchanges, a jumpfrom 47 percent in 2005 to 61 percent in 2006.
If you feel Sarbanes-Oxley should be repealed or overhauled, why?
Criticism of SOX has intensified asexperience has providedrespondents with concretereasons for advocating repeal or revision. Eighty-seven percentof respondents in the Americasthink it has proven to be tooexpensive, and 78 percent find ittoo bureaucratic. Disappointmentin the post-SOX outcome is thereason 42 percent of respondentscall for radical change.
34
33RD BOARD OF DIRECTORS STUDY
0 20 40 60 80 100
Is ineffective
Deters companies fromlisting on US Stock Exchange
Does not liveup to expectations
Too bureaucratic
Too expensive
78%
42%
87%
35%
31%
0 20 40 60 80
2005
2006
Benefits of SOX outweightcosts associated with it
Will pave the way formore legislation
SOX is an effective tool forcorporate governance
Deters companies from listingon US based Stock Exchanges
Should be repealed or overhauled
% Who Agree
58%
47%
46%
41%
42%
47%
21%
24%
64%
61%
33RD BOARD OF DIRECTORS STUDY
35
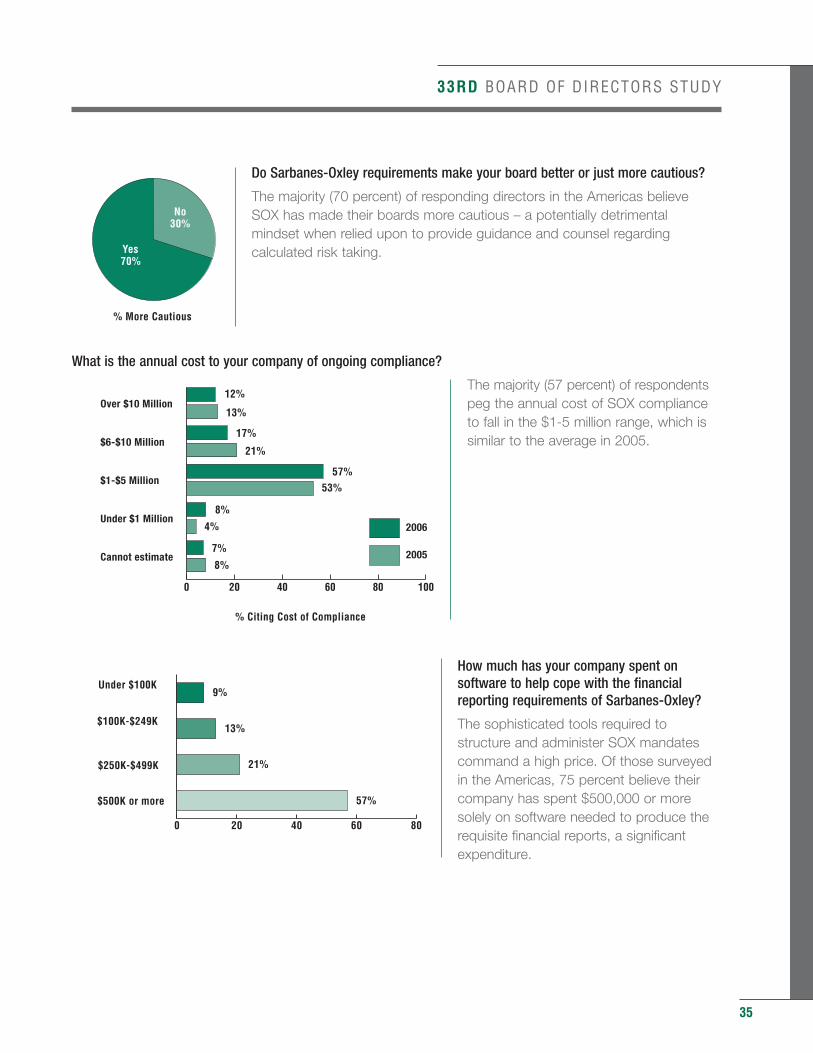
Do Sarbanes-Oxley requirements make your board better or just more cautious?
The majority (70 percent) of responding directors in the Americas believe SOX has made their boards more cautious – a potentially detrimental mindset when relied upon to provide guidance and counsel regardingcalculated risk taking.
What is the annual cost to your company of ongoing compliance?
The majority (57 percent) of respondentspeg the annual cost of SOX complianceto fall in the $1-5 million range, which issimilar to the average in 2005.
How much has your company spent onsoftware to help cope with the financialreporting requirements of Sarbanes-Oxley?
The sophisticated tools required tostructure and administer SOX mandatescommand a high price. Of those surveyedin the Americas, 75 percent believe theircompany has spent $500,000 or moresolely on software needed to produce therequisite financial reports, a significantexpenditure.
0 20 40 60 80 100
2006
2005Cannot estimate
Under $1 Million
$1-$5 Million
$6-$10 Million
Over $10 Million
% Citing Cost of Compliance
12%
13%
17%
21%
57%
4%
53%
8%
8%
7%
No30%
Yes70%
% More Cautious
0 20 40 60 80
$500K or more
$250K-$499K
$100K-$249K
Under $100K
13%
21%
9%
57%
Being a Director
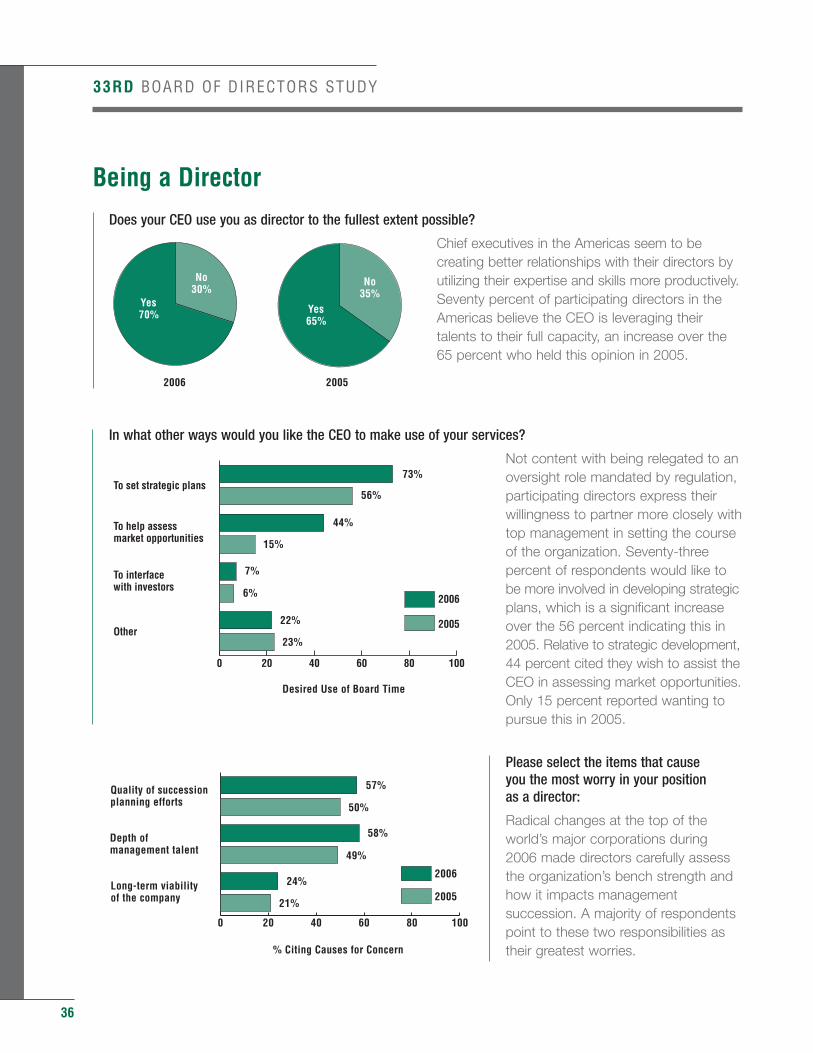
Does your CEO use you as director to the fullest extent possible?
Chief executives in the Americas seem to becreating better relationships with their directors byutilizing their expertise and skills more productively.Seventy percent of participating directors in theAmericas believe the CEO is leveraging theirtalents to their full capacity, an increase over the65 percent who held this opinion in 2005.
In what other ways would you like the CEO to make use of your services?
Not content with being relegated to anoversight role mandated by regulation,participating directors express theirwillingness to partner more closely withtop management in setting the courseof the organization. Seventy-threepercent of respondents would like tobe more involved in developing strategicplans, which is a significant increaseover the 56 percent indicating this in2005. Relative to strategic development,44 percent cited they wish to assist theCEO in assessing market opportunities.Only 15 percent reported wanting topursue this in 2005.
Please select the items that cause you the most worry in your position as a director:
Radical changes at the top of theworld’s major corporations during2006 made directors carefully assessthe organization’s bench strength andhow it impacts managementsuccession. A majority of respondentspoint to these two responsibilities astheir greatest worries.
36
33RD BOARD OF DIRECTORS STUDY
Desired Use of Board Time
0 20 40 60 80 100
2006
2005Other
To interfacewith investors
To help assessmarket opportunities
To set strategic plans
23%
22%
6%
7%
15%
44%
56%
73%
0 20 40 60 80 100
2005
2006Long-term viabilityof the company
Depth ofmanagement talent
Quality of successionplanning efforts
58%
24%
21%
50%
49%
57%
% Citing Causes for Concern
No35%
No30%
Yes65%
Yes70%
20052006
33RD BOARD OF DIRECTORS STUDY
37
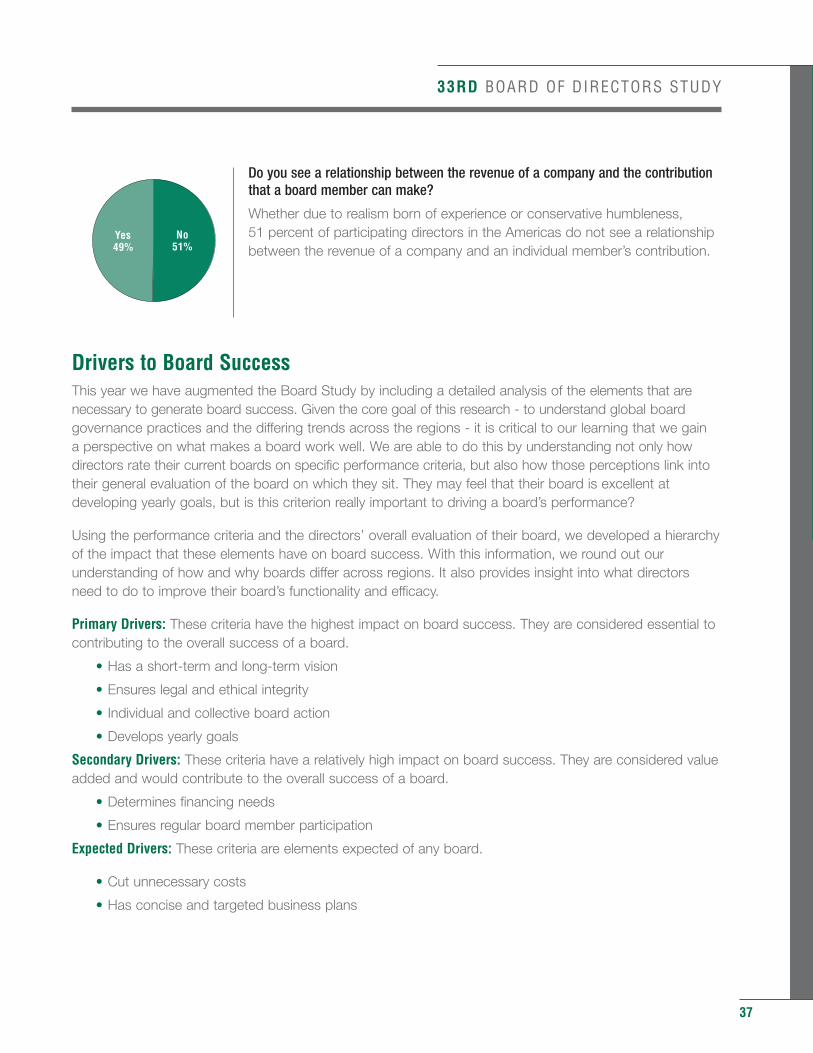
Do you see a relationship between the revenue of a company and the contributionthat a board member can make?
Whether due to realism born of experience or conservative humbleness, 51 percent of participating directors in the Americas do not see a relationshipbetween the revenue of a company and an individual member’s contribution.
Drivers to Board SuccessThis year we have augmented the Board Study by including a detailed analysis of the elements that arenecessary to generate board success. Given the core goal of this research - to understand global boardgovernance practices and the differing trends across the regions - it is critical to our learning that we gain a perspective on what makes a board work well. We are able to do this by understanding not only howdirectors rate their current boards on specific performance criteria, but also how those perceptions link intotheir general evaluation of the board on which they sit. They may feel that their board is excellent atdeveloping yearly goals, but is this criterion really important to driving a board’s performance?
Using the performance criteria and the directors’ overall evaluation of their board, we developed a hierarchyof the impact that these elements have on board success. With this information, we round out ourunderstanding of how and why boards differ across regions. It also provides insight into what directorsneed to do to improve their board’s functionality and efficacy.
Primary Drivers: These criteria have the highest impact on board success. They are considered essential tocontributing to the overall success of a board.
• Has a short-term and long-term vision
• Ensures legal and ethical integrity
• Individual and collective board action
• Develops yearly goals
Secondary Drivers: These criteria have a relatively high impact on board success. They are considered valueadded and would contribute to the overall success of a board.
• Determines financing needs
• Ensures regular board member participation
Expected Drivers: These criteria are elements expected of any board.
• Cut unnecessary costs
• Has concise and targeted business plans
No51%
Yes49%
38
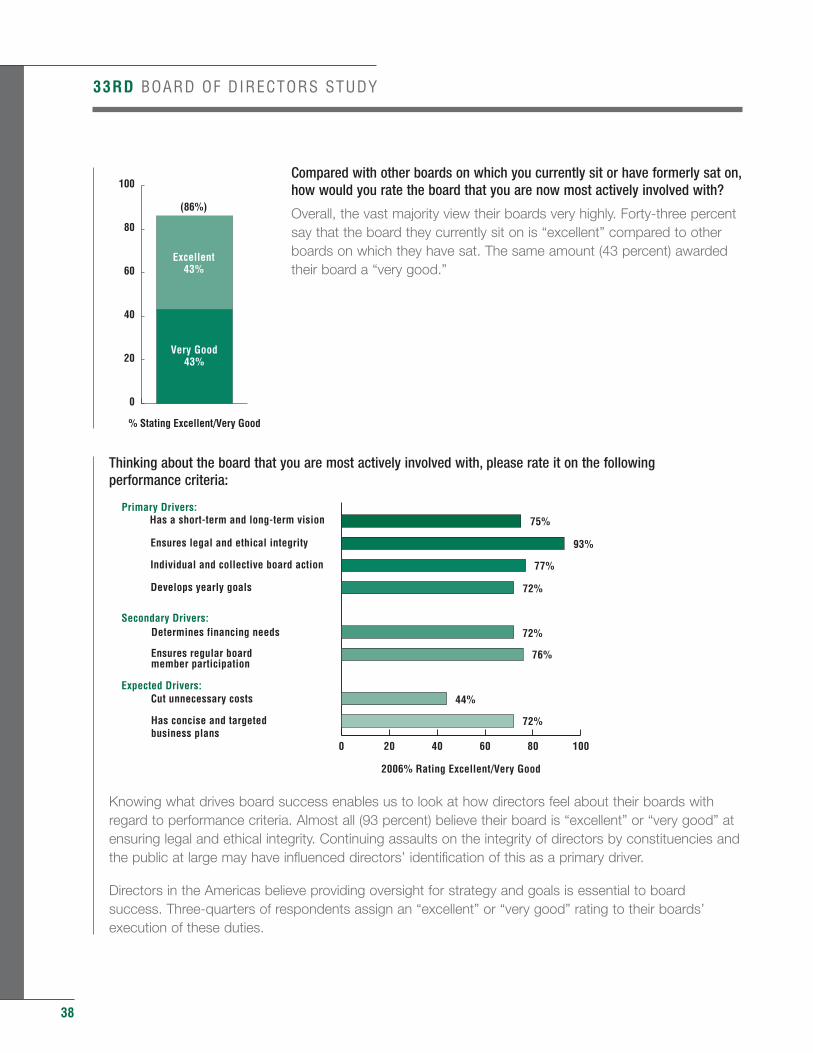
Compared with other boards on which you currently sit or have formerly sat on,how would you rate the board that you are now most actively involved with?
Overall, the vast majority view their boards very highly. Forty-three percentsay that the board they currently sit on is “excellent” compared to otherboards on which they have sat. The same amount (43 percent) awardedtheir board a “very good.”
Thinking about the board that you are most actively involved with, please rate it on the following performance criteria:
Knowing what drives board success enables us to look at how directors feel about their boards with regard to performance criteria. Almost all (93 percent) believe their board is “excellent” or “very good” at ensuring legal and ethical integrity. Continuing assaults on the integrity of directors by constituencies and the public at large may have influenced directors’ identification of this as a primary driver.
Directors in the Americas believe providing oversight for strategy and goals is essential to board success. Three-quarters of respondents assign an “excellent” or “very good” rating to their boards’ execution of these duties.
33RD BOARD OF DIRECTORS STUDY
0 20 40 60 80 100
Has concise and targetedbusiness plans
Cut unnecessary costsExpected Drivers:
Ensures regular boardmember participation
Determines financing needsSecondary Drivers:
Develops yearly goals
Individual and collective board action
Ensures legal and ethical integrity
Has a short-term and long-term visionPrimary Drivers:
93%
72%
75%
76%
72%
77%
44%
72%
2006% Rating Excellent/Very Good
0
20
40
60
80
100
% Stating Excellent/Very Good
Very Good43%
Excellent43%
(86%)
33RD BOARD OF DIRECTORS STUDY
Cluster AnalysisThis year, participating directors throughout the Americas and Europe were categorized and analyzedaccording to common attitudes. The manner in which they were categorized was based on their responses,hence the different classifications used for respondents in the Americas and in Europe. Due to some subtledifferences in the questionnaires, we are unable to provide a cluster analysis for Asia Pacific.
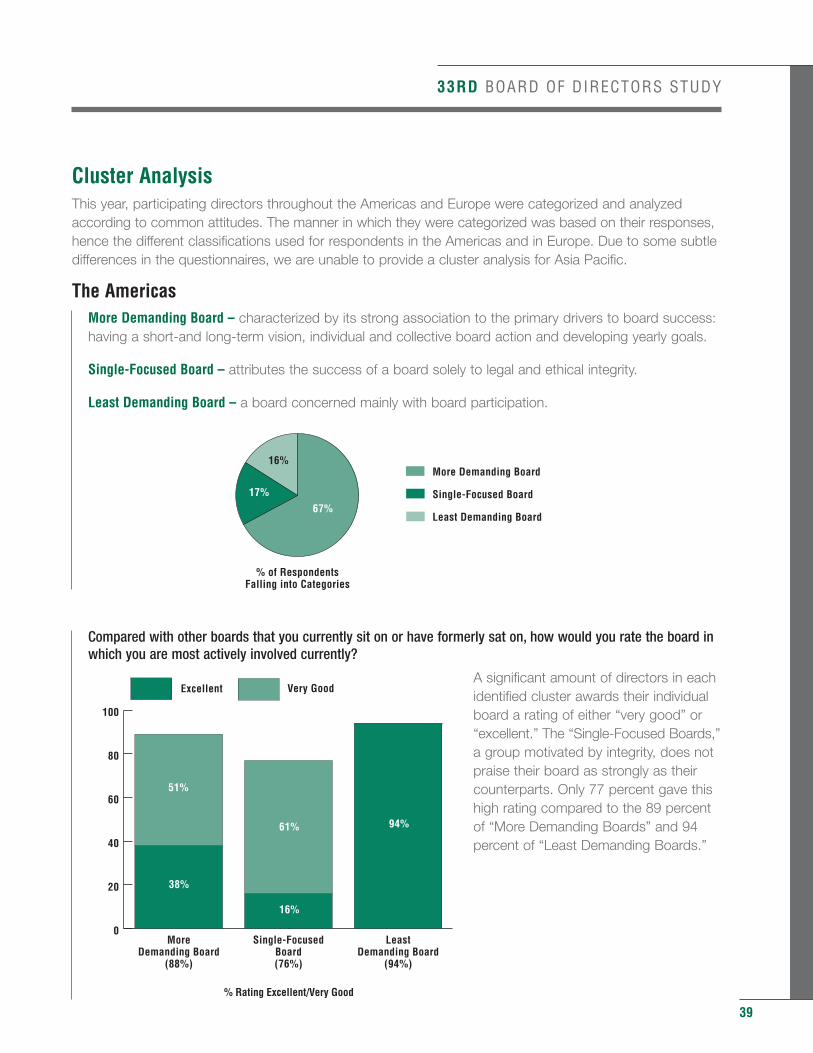
The AmericasMore Demanding Board – characterized by its strong association to the primary drivers to board success: having a short-and long-term vision, individual and collective board action and developing yearly goals.
Single-Focused Board – attributes the success of a board solely to legal and ethical integrity.
Least Demanding Board – a board concerned mainly with board participation.
Compared with other boards that you currently sit on or have formerly sat on, how would you rate the board in which you are most actively involved currently?
A significant amount of directors in eachidentified cluster awards their individualboard a rating of either “very good” or“excellent.” The “Single-Focused Boards,”a group motivated by integrity, does notpraise their board as strongly as theircounterparts. Only 77 percent gave thishigh rating compared to the 89 percentof “More Demanding Boards” and 94percent of “Least Demanding Boards.”
39
0
20
40
60
80
100
Excellent Very Good
LeastDemanding Board
(94%)
Single-FocusedBoard(76%)
MoreDemanding Board
(88%)
% Rating Excellent/Very Good
38%
16%
61% 94%
51%
% of RespondentsFalling into Categories
16%
17%
67%
More Demanding Board
Single-Focused Board
Least Demanding Board
40
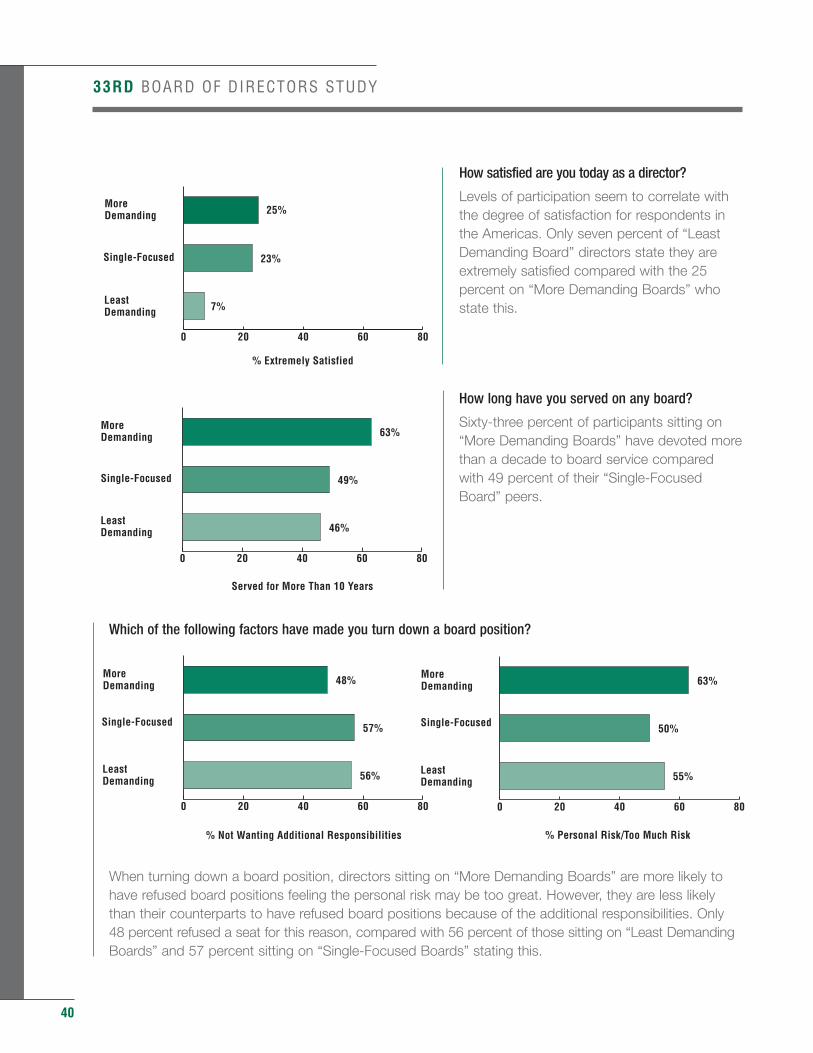
How satisfied are you today as a director?
Levels of participation seem to correlate withthe degree of satisfaction for respondents inthe Americas. Only seven percent of “LeastDemanding Board” directors state they areextremely satisfied compared with the 25percent on “More Demanding Boards” whostate this.
How long have you served on any board?
Sixty-three percent of participants sitting on“More Demanding Boards” have devoted morethan a decade to board service compared with 49 percent of their “Single-Focused Board” peers.
Which of the following factors have made you turn down a board position?
When turning down a board position, directors sitting on “More Demanding Boards” are more likely to have refused board positions feeling the personal risk may be too great. However, they are less likely than their counterparts to have refused board positions because of the additional responsibilities. Only 48 percent refused a seat for this reason, compared with 56 percent of those sitting on “Least Demanding Boards” and 57 percent sitting on “Single-Focused Boards” stating this.
33RD BOARD OF DIRECTORS STUDY
0 20 40 60 80
LeastDemanding
Single-Focused
MoreDemanding
% Extremely Satisfied
23%
25%
7%
0 20 40 60 80
LeastDemanding
Single-Focused
MoreDemanding
Served for More Than 10 Years
49%
46%
63%
0 20 40 60 80
LeastDemanding
Single-Focused
MoreDemanding
% Not Wanting Additional Responsibilities
57%
56%
48%
0 20 40 60 80
LeastDemanding
Single-Focused
MoreDemanding
% Personal Risk/Too Much Risk
50%
55%
63%
33RD BOARD OF DIRECTORS STUDY
Is there a limit to the number of other boards on which the board members may serve as outside directors?
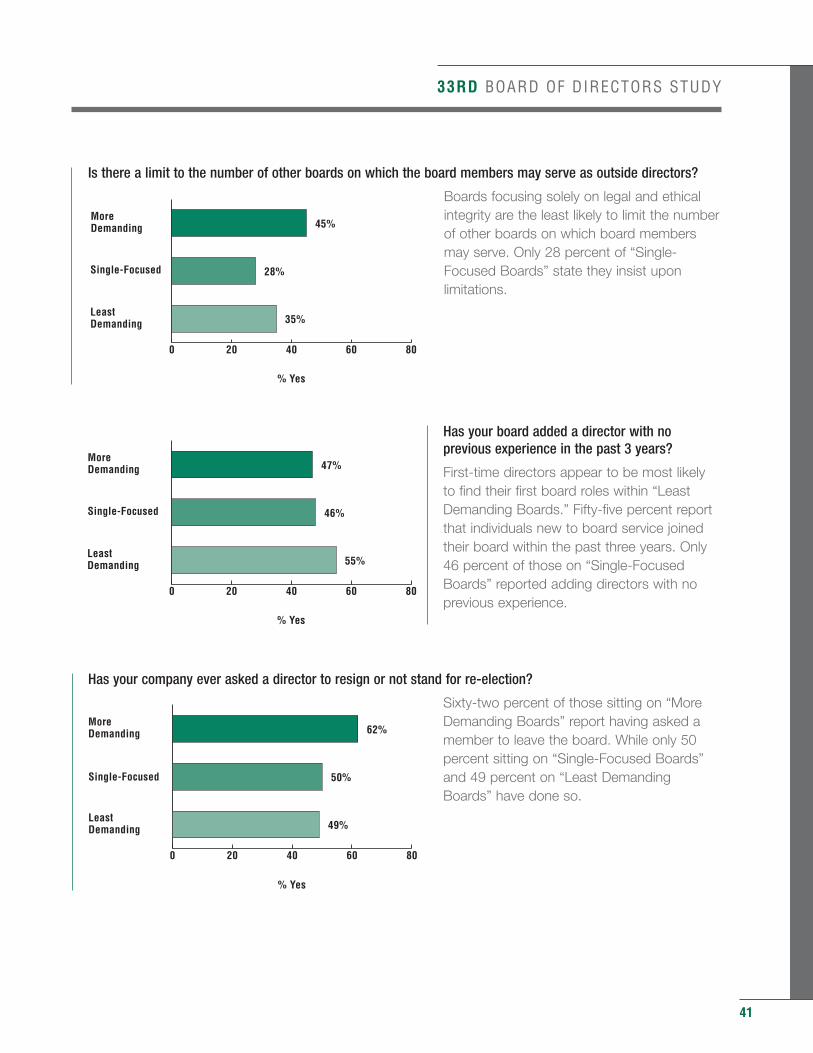
Boards focusing solely on legal and ethicalintegrity are the least likely to limit the numberof other boards on which board membersmay serve. Only 28 percent of “Single-Focused Boards” state they insist uponlimitations.
Has your board added a director with noprevious experience in the past 3 years?
First-time directors appear to be most likely to find their first board roles within “LeastDemanding Boards.” Fifty-five percent reportthat individuals new to board service joinedtheir board within the past three years. Only46 percent of those on “Single-FocusedBoards” reported adding directors with noprevious experience.
Has your company ever asked a director to resign or not stand for re-election?
Sixty-two percent of those sitting on “MoreDemanding Boards” report having asked amember to leave the board. While only 50percent sitting on “Single-Focused Boards”and 49 percent on “Least DemandingBoards” have done so.
41
0 20 40 60 80
LeastDemanding
Single-Focused
MoreDemanding
% Yes
28%
35%
45%
0 20 40 60 80
LeastDemanding
Single-Focused
MoreDemanding
% Yes
46%
55%
47%
0 20 40 60 80
LeastDemanding
Single-Focused
MoreDemanding
% Yes
50%
49%
62%
42
In what other ways would you like the CEO tomake use of your services?
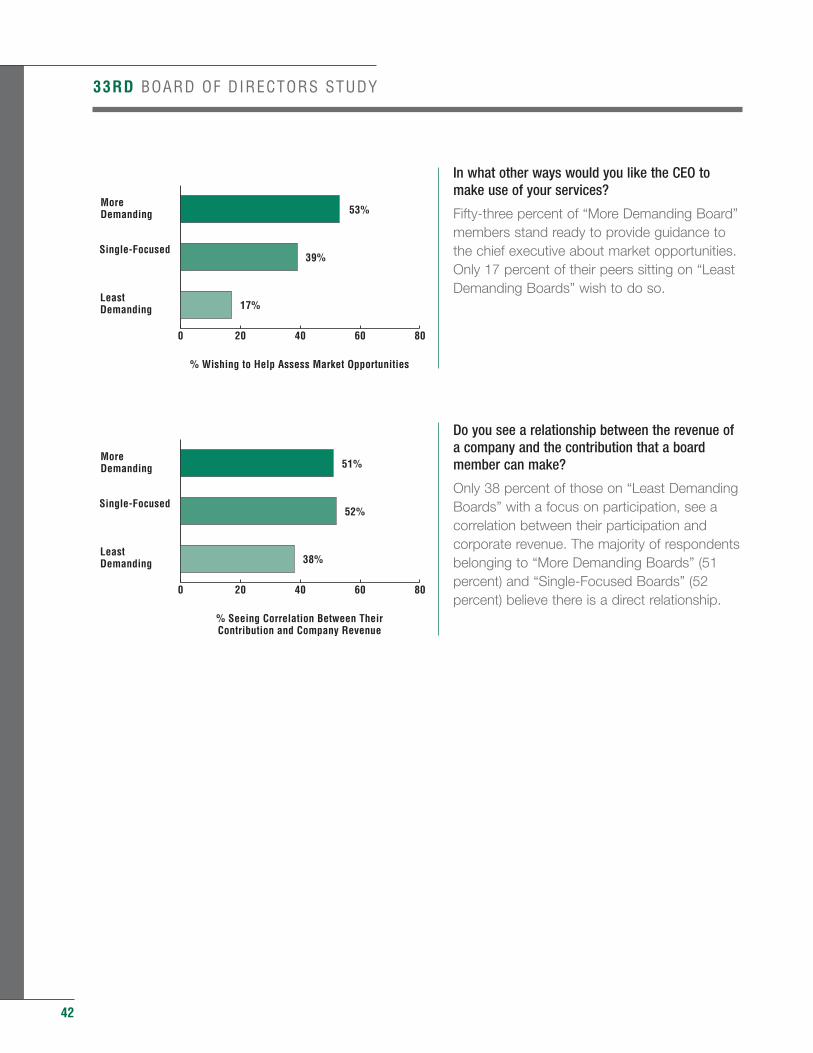
Fifty-three percent of “More Demanding Board”members stand ready to provide guidance tothe chief executive about market opportunities.Only 17 percent of their peers sitting on “LeastDemanding Boards” wish to do so.
Do you see a relationship between the revenue ofa company and the contribution that a boardmember can make?
Only 38 percent of those on “Least DemandingBoards” with a focus on participation, see acorrelation between their participation andcorporate revenue. The majority of respondentsbelonging to “More Demanding Boards” (51percent) and “Single-Focused Boards” (52percent) believe there is a direct relationship.
33RD BOARD OF DIRECTORS STUDY
0 20 40 60 80
LeastDemanding
Single-Focused
MoreDemanding
% Wishing to Help Assess Market Opportunities
39%
17%
53%
0 20 40 60 80
LeastDemanding
Single-Focused
MoreDemanding
% Seeing Correlation Between TheirContribution and Company Revenue
52%
38%
51%
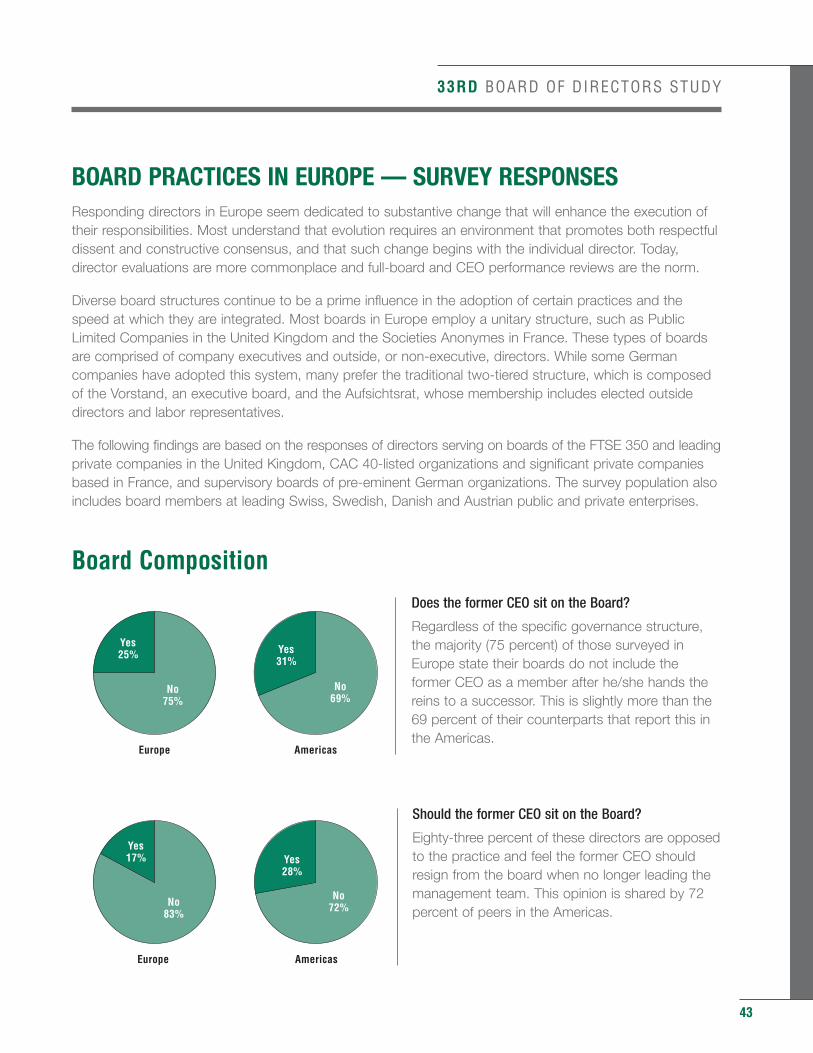
33RD BOARD OF DIRECTORS STUDY
BOARD PRACTICES IN EUROPE — SURVEY RESPONSESResponding directors in Europe seem dedicated to substantive change that will enhance the execution oftheir responsibilities. Most understand that evolution requires an environment that promotes both respectfuldissent and constructive consensus, and that such change begins with the individual director. Today,director evaluations are more commonplace and full-board and CEO performance reviews are the norm.
Diverse board structures continue to be a prime influence in the adoption of certain practices and thespeed at which they are integrated. Most boards in Europe employ a unitary structure, such as PublicLimited Companies in the United Kingdom and the Societies Anonymes in France. These types of boardsare comprised of company executives and outside, or non-executive, directors. While some Germancompanies have adopted this system, many prefer the traditional two-tiered structure, which is composedof the Vorstand, an executive board, and the Aufsichtsrat, whose membership includes elected outsidedirectors and labor representatives.
The following findings are based on the responses of directors serving on boards of the FTSE 350 and leadingprivate companies in the United Kingdom, CAC 40-listed organizations and significant private companiesbased in France, and supervisory boards of pre-eminent German organizations. The survey population alsoincludes board members at leading Swiss, Swedish, Danish and Austrian public and private enterprises.
Board Composition
Does the former CEO sit on the Board?
Regardless of the specific governance structure, the majority (75 percent) of those surveyed inEurope state their boards do not include theformer CEO as a member after he/she hands thereins to a successor. This is slightly more than the69 percent of their counterparts that report this inthe Americas.
Should the former CEO sit on the Board?
Eighty-three percent of these directors are opposedto the practice and feel the former CEO shouldresign from the board when no longer leading themanagement team. This opinion is shared by 72percent of peers in the Americas.
43
No69%
No75%
Yes31%
Yes25%
AmericasEurope
No72%No
83%
Yes28%
Yes17%
AmericasEurope
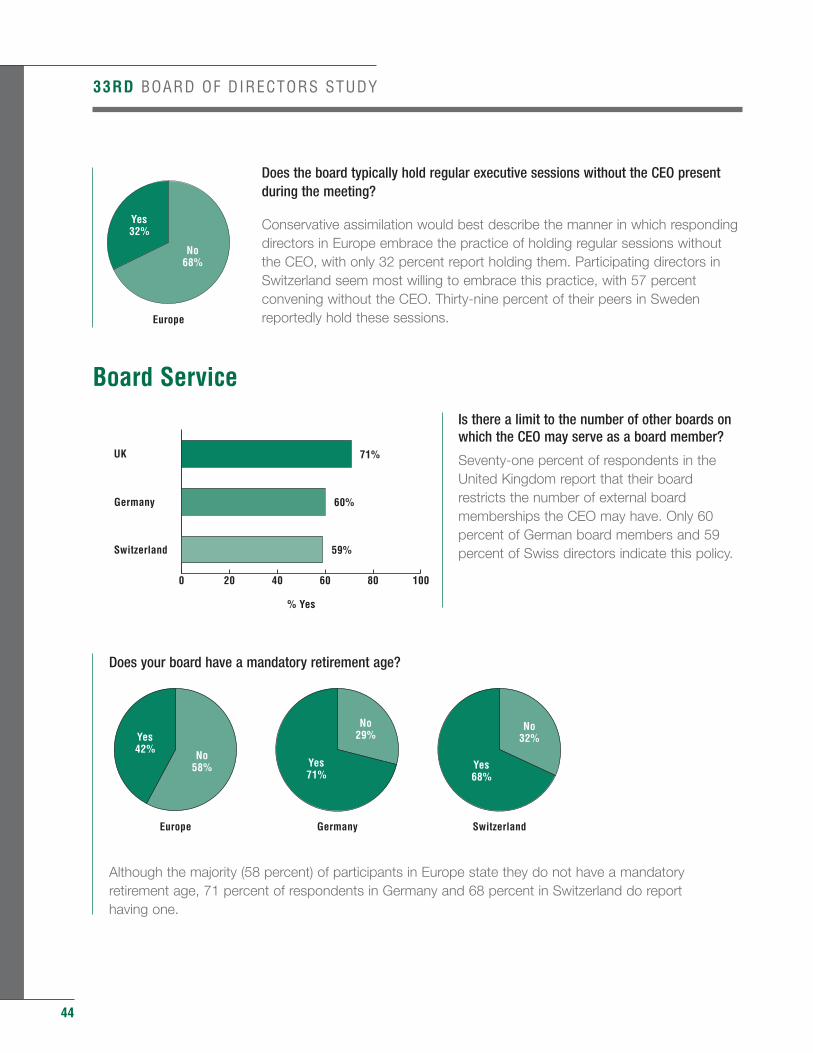
44
Does the board typically hold regular executive sessions without the CEO presentduring the meeting?
Conservative assimilation would best describe the manner in which respondingdirectors in Europe embrace the practice of holding regular sessions withoutthe CEO, with only 32 percent report holding them. Participating directors inSwitzerland seem most willing to embrace this practice, with 57 percentconvening without the CEO. Thirty-nine percent of their peers in Swedenreportedly hold these sessions.
Board Service
Is there a limit to the number of other boards onwhich the CEO may serve as a board member?
Seventy-one percent of respondents in theUnited Kingdom report that their boardrestricts the number of external boardmemberships the CEO may have. Only 60percent of German board members and 59percent of Swiss directors indicate this policy.
Does your board have a mandatory retirement age?
Although the majority (58 percent) of participants in Europe state they do not have a mandatory retirement age, 71 percent of respondents in Germany and 68 percent in Switzerland do report having one.
33RD BOARD OF DIRECTORS STUDY
0 20 40 60 80 100
Switzerland
Germany
UK
% Yes
60%
59%
71%
No32%
No29%
No58% Yes
68%Yes71%
Yes42%
SwitzerlandGermanyEurope
No68%
Yes32%
Europe
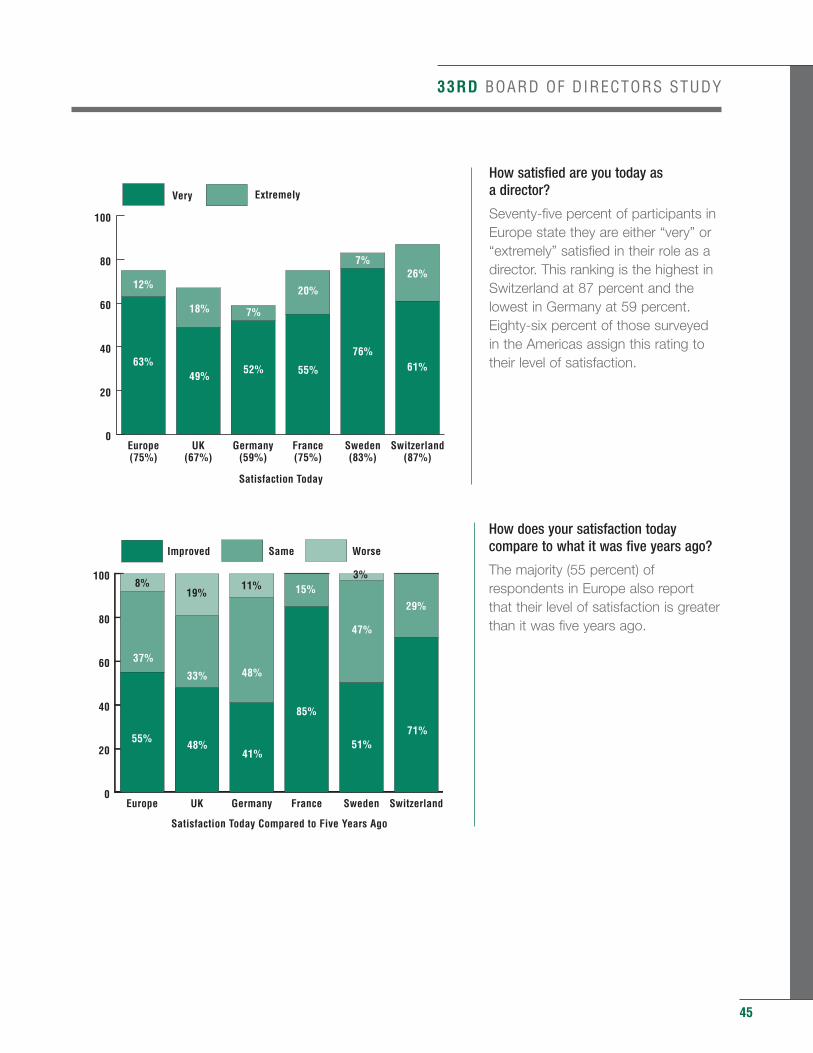
33RD BOARD OF DIRECTORS STUDY
How satisfied are you today as a director?
Seventy-five percent of participants inEurope state they are either “very” or“extremely” satisfied in their role as adirector. This ranking is the highest inSwitzerland at 87 percent and thelowest in Germany at 59 percent.Eighty-six percent of those surveyedin the Americas assign this rating totheir level of satisfaction.
How does your satisfaction todaycompare to what it was five years ago?
The majority (55 percent) ofrespondents in Europe also reportthat their level of satisfaction is greaterthan it was five years ago.
45
0
20
40
60
80
100
ExtremelyVery
Switzerland(87%)
Sweden(83%)
France(75%)
Germany(59%)
UK(67%)
Europe(75%)
Satisfaction Today
63%49%
18%
52%
7%
55%
20%
76%
7%
61%
26%12%
0
20
40
60
80
100
WorseSameImproved
SwitzerlandSwedenFranceGermanyUKEurope
Satisfaction Today Compared to Five Years Ago
47%
3%15%
48%
11%
37%
8%
29%
33%
19%
55%48%
41%
85%
51%71%
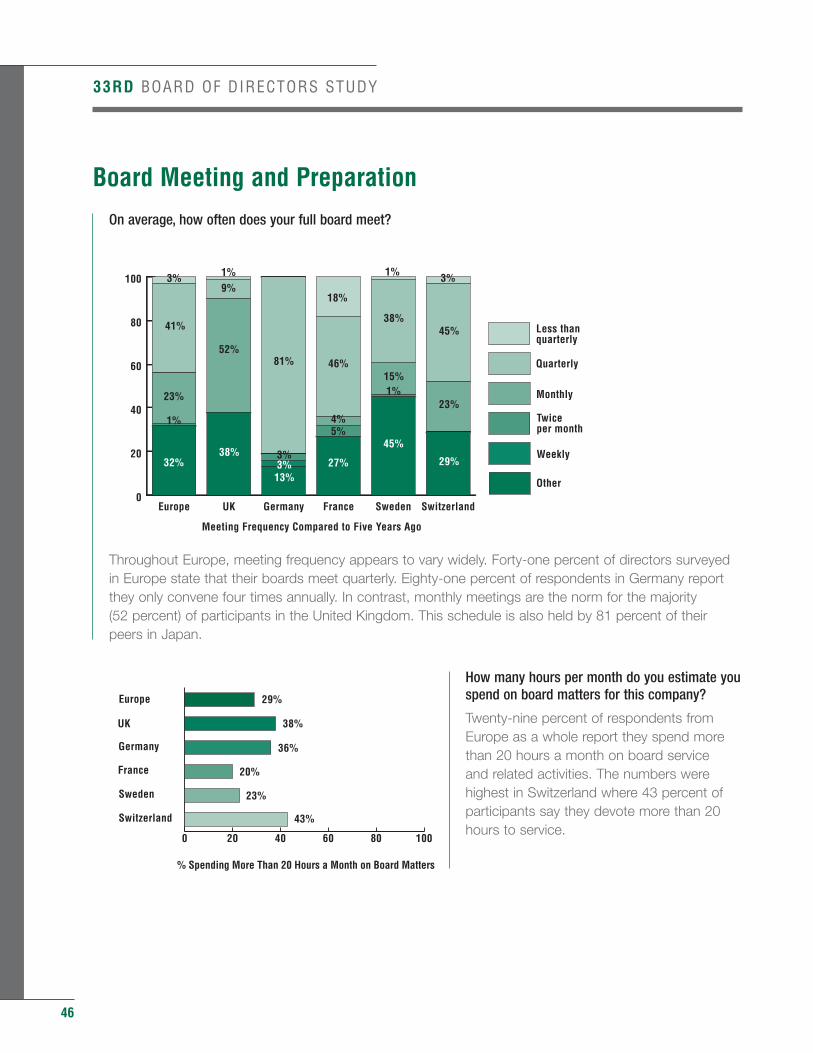
46
Board Meeting and Preparation
On average, how often does your full board meet?
Throughout Europe, meeting frequency appears to vary widely. Forty-one percent of directors surveyed in Europe state that their boards meet quarterly. Eighty-one percent of respondents in Germany report they only convene four times annually. In contrast, monthly meetings are the norm for the majority(52 percent) of participants in the United Kingdom. This schedule is also held by 81 percent of their peers in Japan.
How many hours per month do you estimate youspend on board matters for this company?
Twenty-nine percent of respondents fromEurope as a whole report they spend morethan 20 hours a month on board service and related activities. The numbers werehighest in Switzerland where 43 percent ofparticipants say they devote more than 20hours to service.
33RD BOARD OF DIRECTORS STUDY
0
20
40
60
80
100
Less than quarterly
Quarterly
Monthly
Twice per monthWeekly
Other
SwitzerlandSwedenFranceGermanyUKEurope
Meeting Frequency Compared to Five Years Ago
Less thanquarterly
Quarterly
Monthly
Twiceper month
Weekly
Other
38%
15%
1%
18%
81%
41%
3% 3%
52%
9%1%
32%
1%
23%
38%
13%3%3%
27%
5%4%
46%
45%
1%
29%
23%
45%
0 20 40 60 80 100
Switzerland
Sweden
France
Germany
UK
Europe
38%
20%
29%
43%
23%
36%
% Spending More Than 20 Hours a Month on Board Matters
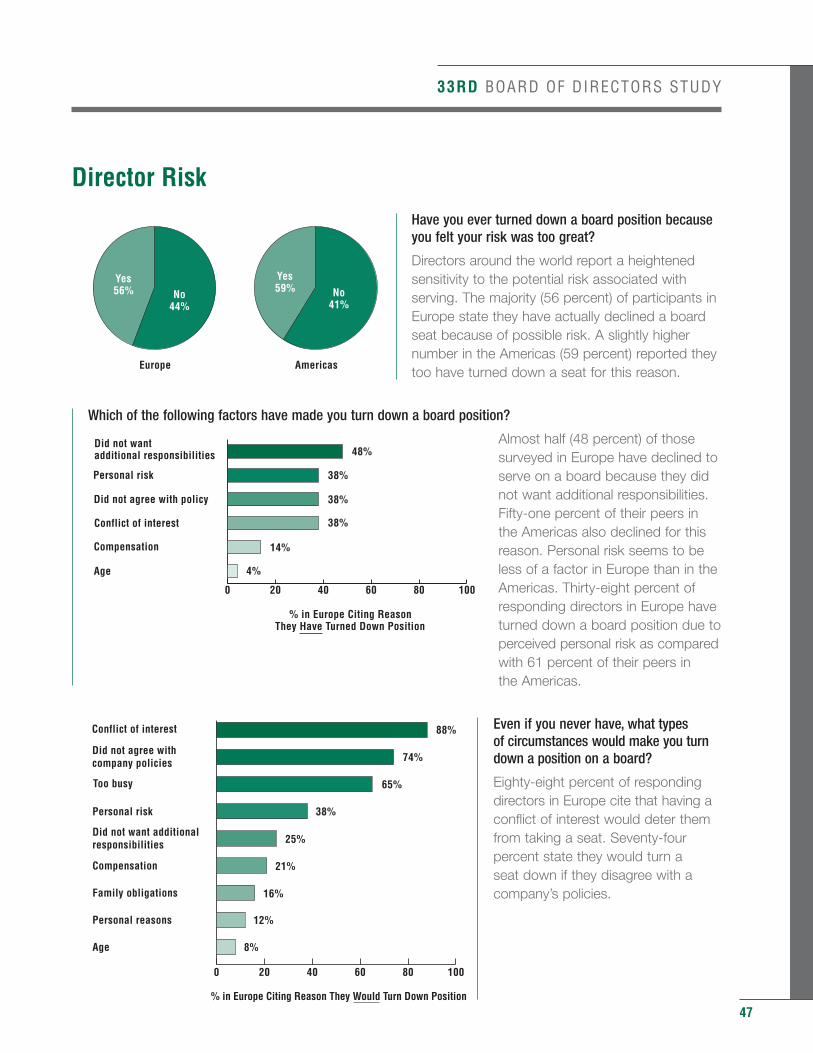
33RD BOARD OF DIRECTORS STUDY
Director Risk
Have you ever turned down a board position becauseyou felt your risk was too great?
Directors around the world report a heightenedsensitivity to the potential risk associated withserving. The majority (56 percent) of participants inEurope state they have actually declined a boardseat because of possible risk. A slightly highernumber in the Americas (59 percent) reported theytoo have turned down a seat for this reason.
Which of the following factors have made you turn down a board position?
Almost half (48 percent) of thosesurveyed in Europe have declined toserve on a board because they didnot want additional responsibilities.Fifty-one percent of their peers inthe Americas also declined for thisreason. Personal risk seems to beless of a factor in Europe than in theAmericas. Thirty-eight percent ofresponding directors in Europe haveturned down a board position due toperceived personal risk as comparedwith 61 percent of their peers in the Americas.
Even if you never have, what types of circumstances would make you turndown a position on a board?
Eighty-eight percent of respondingdirectors in Europe cite that having aconflict of interest would deter themfrom taking a seat. Seventy-fourpercent state they would turn a seat down if they disagree with acompany’s policies.
47
No41%
No44%
Yes56%
Yes59%
AmericasEurope
0 20 40 60 80 100
Age
Compensation
Conflict of interest
Did not agree with policy
Personal risk
Did not wantadditional responsibilities
% in Europe Citing ReasonThey Have Turned Down Position
38%
38%
38%
48%
14%
4%
0 20 40 60 80 100
Age
Personal reasons
Family obligations
Compensation
Did not want additionalresponsibilities
Personal risk
Too busy
Did not agree withcompany policies
Conflict of interest
74%
38%
88%
21%
25%
65%
16%
8%
12%
% in Europe Citing Reason They Would Turn Down Position
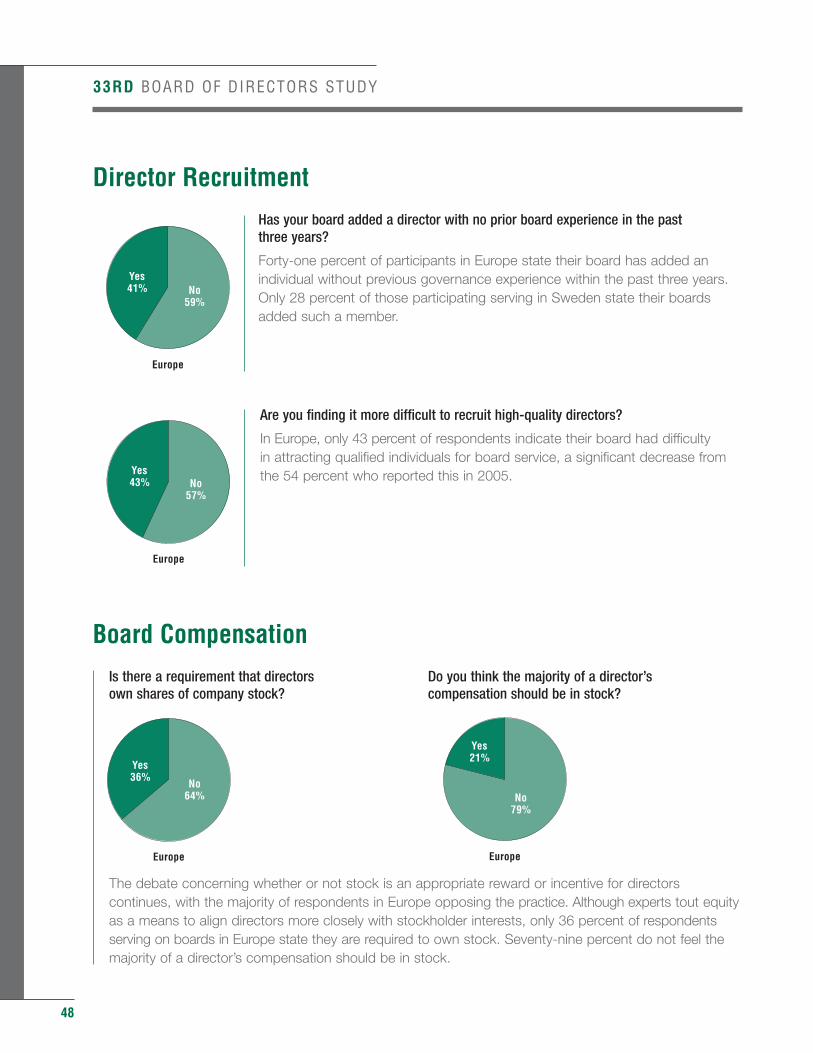
48
Director Recruitment
Has your board added a director with no prior board experience in the past three years?
Forty-one percent of participants in Europe state their board has added anindividual without previous governance experience within the past three years.Only 28 percent of those participating serving in Sweden state their boardsadded such a member.
Are you finding it more difficult to recruit high-quality directors?
In Europe, only 43 percent of respondents indicate their board had difficulty in attracting qualified individuals for board service, a significant decrease fromthe 54 percent who reported this in 2005.
Board Compensation
Is there a requirement that directors Do you think the majority of a director’sown shares of company stock? compensation should be in stock?
The debate concerning whether or not stock is an appropriate reward or incentive for directors continues, with the majority of respondents in Europe opposing the practice. Although experts tout equity as a means to align directors more closely with stockholder interests, only 36 percent of respondents serving on boards in Europe state they are required to own stock. Seventy-nine percent do not feel the majority of a director’s compensation should be in stock.
33RD BOARD OF DIRECTORS STUDY
No43%No
58%No
57%Yes57%
Yes42%
Yes43%
Germany*UKEurope
No60%
No48%No
59%
Yes40%Yes
52%
Yes41%
Germany*UKEurope
No64%
Yes36%
Europe
No79%
Yes21%
Europe
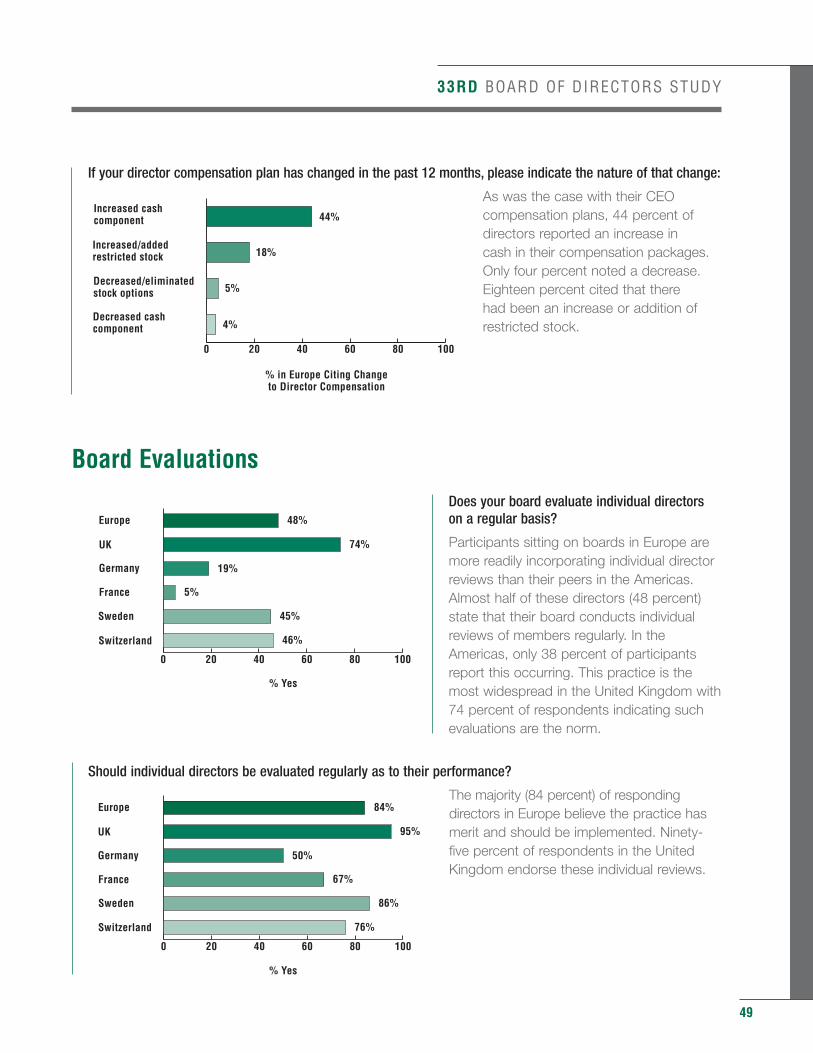
33RD BOARD OF DIRECTORS STUDY
If your director compensation plan has changed in the past 12 months, please indicate the nature of that change:
As was the case with their CEOcompensation plans, 44 percent ofdirectors reported an increase in cash in their compensation packages.Only four percent noted a decrease.Eighteen percent cited that there had been an increase or addition ofrestricted stock.
Board Evaluations
Does your board evaluate individual directorson a regular basis?
Participants sitting on boards in Europe aremore readily incorporating individual directorreviews than their peers in the Americas.Almost half of these directors (48 percent)state that their board conducts individualreviews of members regularly. In theAmericas, only 38 percent of participantsreport this occurring. This practice is themost widespread in the United Kingdom with74 percent of respondents indicating suchevaluations are the norm.
Should individual directors be evaluated regularly as to their performance?
The majority (84 percent) of respondingdirectors in Europe believe the practice hasmerit and should be implemented. Ninety-five percent of respondents in the UnitedKingdom endorse these individual reviews.
49
0 20 40 60 80 100
Decreased cashcomponent
Decreased/eliminatedstock options
Increased/addedrestricted stock
Increased cashcomponent
% in Europe Citing Changeto Director Compensation
18%
5%
44%
4%
0 20 40 60 80 100
Switzerland
Sweden
France
Germany
UK
Europe
% Yes
95%
50%
84%
67%
86%
76%
0 20 40 60 80 100
Switzerland
Sweden
France
Germany
UK
Europe
% Yes
74%
19%
48%
5%
45%
46%
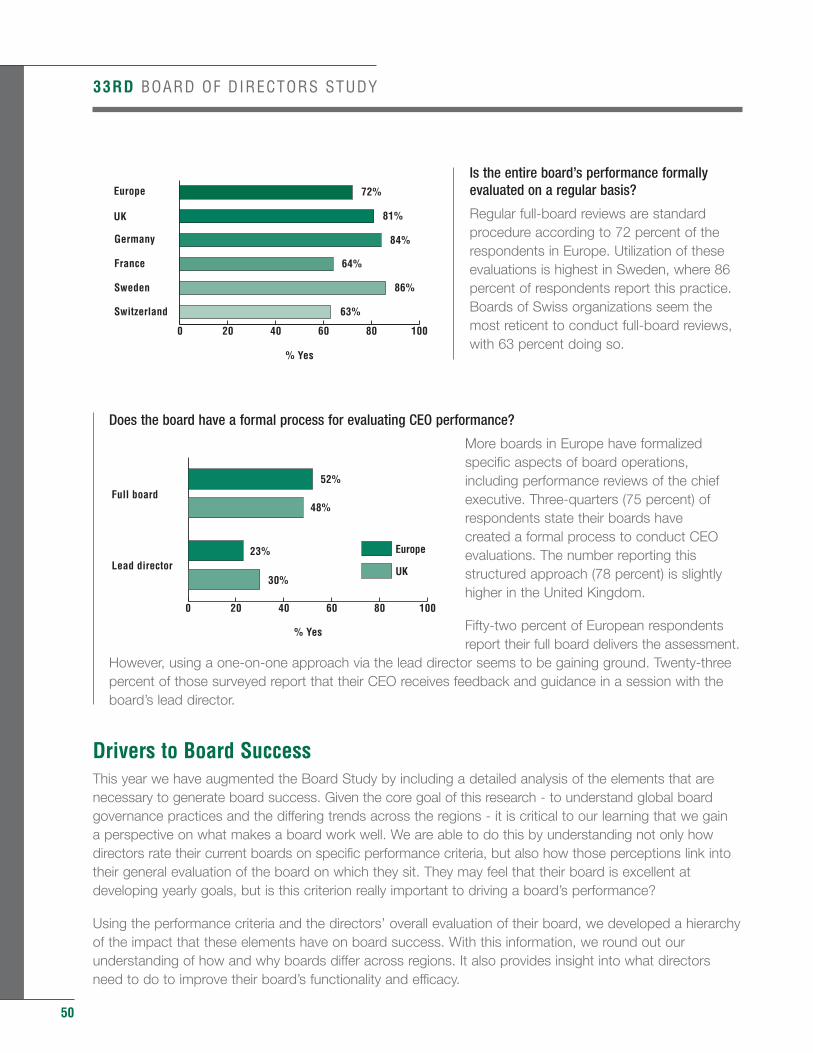
50
Is the entire board’s performance formallyevaluated on a regular basis?
Regular full-board reviews are standardprocedure according to 72 percent of therespondents in Europe. Utilization of theseevaluations is highest in Sweden, where 86percent of respondents report this practice.Boards of Swiss organizations seem themost reticent to conduct full-board reviews,with 63 percent doing so.
Does the board have a formal process for evaluating CEO performance?
More boards in Europe have formalizedspecific aspects of board operations,including performance reviews of the chiefexecutive. Three-quarters (75 percent) ofrespondents state their boards have created a formal process to conduct CEOevaluations. The number reporting thisstructured approach (78 percent) is slightlyhigher in the United Kingdom.
Fifty-two percent of European respondentsreport their full board delivers the assessment.
However, using a one-on-one approach via the lead director seems to be gaining ground. Twenty-three percent of those surveyed report that their CEO receives feedback and guidance in a session with the board’s lead director.
Drivers to Board SuccessThis year we have augmented the Board Study by including a detailed analysis of the elements that arenecessary to generate board success. Given the core goal of this research - to understand global boardgovernance practices and the differing trends across the regions - it is critical to our learning that we gain a perspective on what makes a board work well. We are able to do this by understanding not only howdirectors rate their current boards on specific performance criteria, but also how those perceptions link intotheir general evaluation of the board on which they sit. They may feel that their board is excellent atdeveloping yearly goals, but is this criterion really important to driving a board’s performance?
Using the performance criteria and the directors’ overall evaluation of their board, we developed a hierarchyof the impact that these elements have on board success. With this information, we round out ourunderstanding of how and why boards differ across regions. It also provides insight into what directorsneed to do to improve their board’s functionality and efficacy.
33RD BOARD OF DIRECTORS STUDY
0 20 40 60 80 100
Switzerland
Sweden
France
Germany
UK
Europe
% Yes
81%
84%
72%
64%
86%
63%
0 20 40 60 80 100
Europe
UKLead director
Full board
% Yes
48%
23%
52%
30%
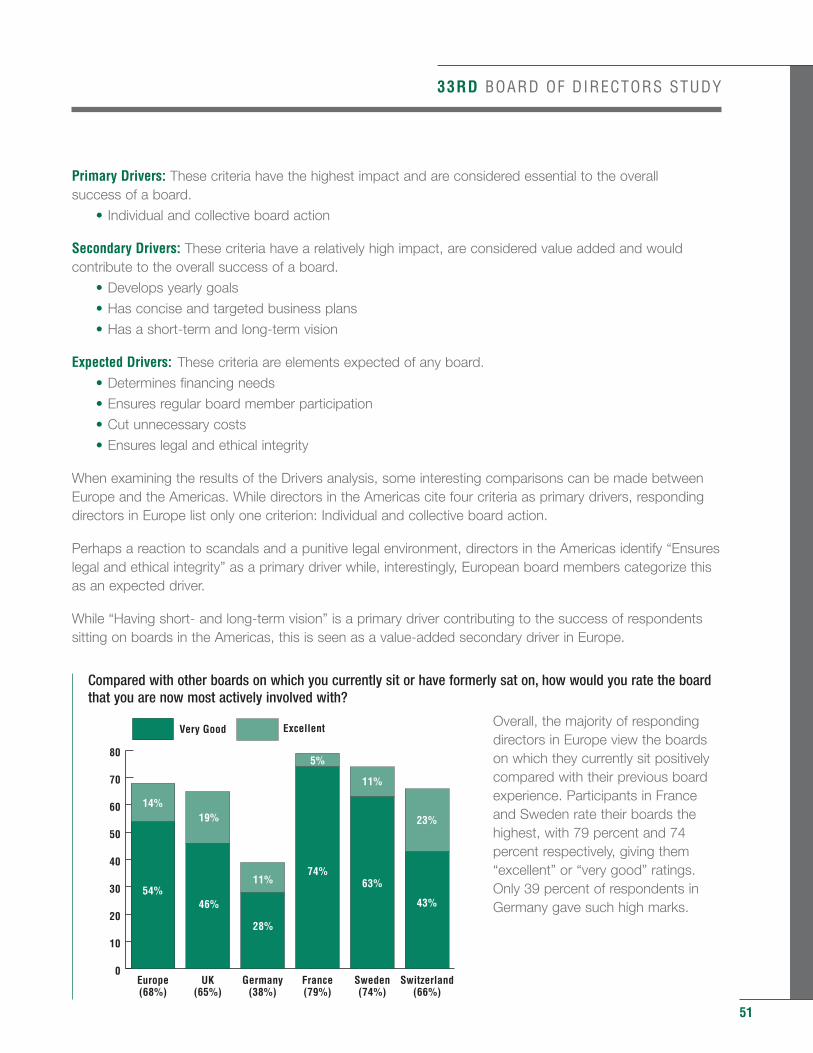
33RD BOARD OF DIRECTORS STUDY
Primary Drivers: These criteria have the highest impact and are considered essential to the overall success of a board.
• Individual and collective board action
Secondary Drivers: These criteria have a relatively high impact, are considered value added and would contribute to the overall success of a board.
• Develops yearly goals
• Has concise and targeted business plans
• Has a short-term and long-term vision
Expected Drivers: These criteria are elements expected of any board.
• Determines financing needs
• Ensures regular board member participation
• Cut unnecessary costs
• Ensures legal and ethical integrity
When examining the results of the Drivers analysis, some interesting comparisons can be made betweenEurope and the Americas. While directors in the Americas cite four criteria as primary drivers, respondingdirectors in Europe list only one criterion: Individual and collective board action.
Perhaps a reaction to scandals and a punitive legal environment, directors in the Americas identify “Ensureslegal and ethical integrity” as a primary driver while, interestingly, European board members categorize thisas an expected driver.
While “Having short- and long-term vision” is a primary driver contributing to the success of respondentssitting on boards in the Americas, this is seen as a value-added secondary driver in Europe.
Compared with other boards on which you currently sit or have formerly sat on, how would you rate the board that you are now most actively involved with?
Overall, the majority of respondingdirectors in Europe view the boardson which they currently sit positivelycompared with their previous boardexperience. Participants in Franceand Sweden rate their boards thehighest, with 79 percent and 74percent respectively, giving them“excellent” or “very good” ratings.Only 39 percent of respondents inGermany gave such high marks.
51
0
10
20
30
40
50
60
70
80
ExcellentVery Good
Switzerland(66%)
Sweden(74%)
France(79%)
Germany(38%)
UK(65%)
Europe(68%)
54%46%
19%
28%
11%74%
5%
63%
11%
43%
23%
14%
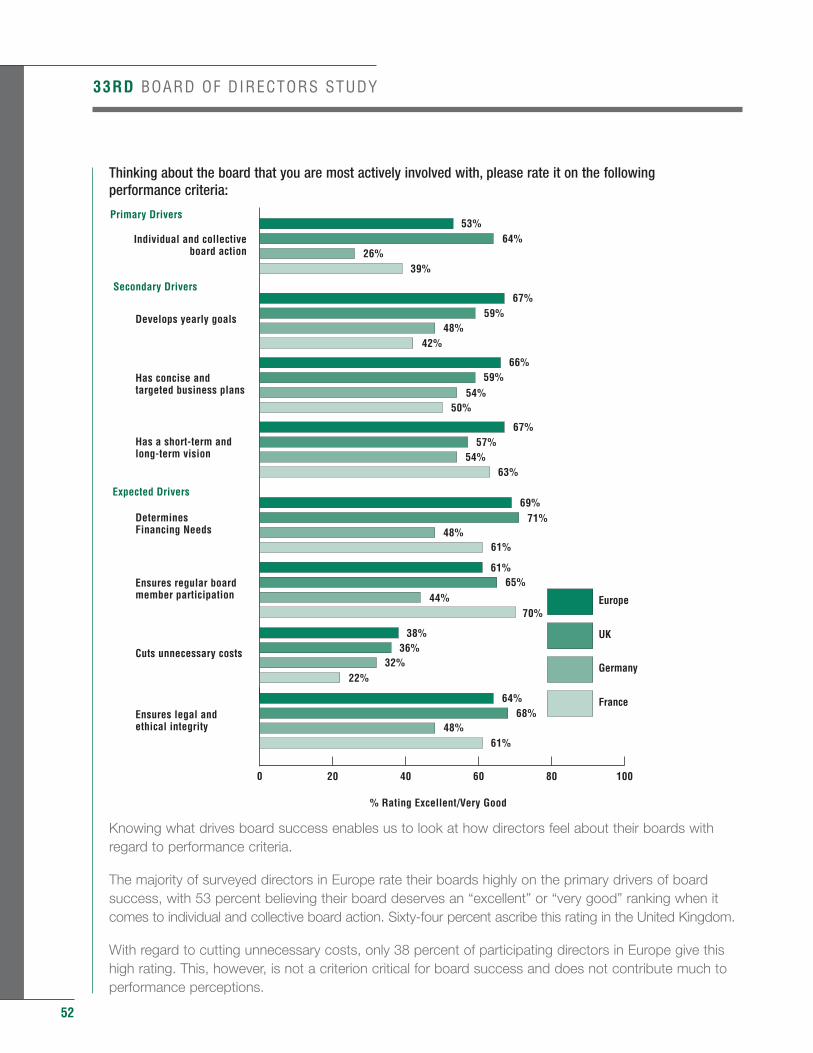
52
Thinking about the board that you are most actively involved with, please rate it on the following performance criteria:
Knowing what drives board success enables us to look at how directors feel about their boards with regard to performance criteria.
The majority of surveyed directors in Europe rate their boards highly on the primary drivers of board success, with 53 percent believing their board deserves an “excellent” or “very good” ranking when it comes to individual and collective board action. Sixty-four percent ascribe this rating in the United Kingdom.
With regard to cutting unnecessary costs, only 38 percent of participating directors in Europe give this high rating. This, however, is not a criterion critical for board success and does not contribute much to performance perceptions.
33RD BOARD OF DIRECTORS STUDY
0 20 40 60 80 100
FranceGermany
UK
EuropeEnsures legal andethical integrity
Cuts unnecessary costs
Ensures regular boardmember participation
DeterminesFinancing Needs
Expected Drivers
Has a short-term andlong-term vision
Has concise andtargeted business plans
Develops yearly goals
Secondary Drivers
Individual and collectiveboard action
Primary Drivers
39% 26%
64%
59% 67%
66% 59%
54% 50%
67% 57%
54% 63%
69% 71%
48% 61%
61% 65%
44% 70%
38% 36%
32% 22%
64% 68%
48% 61%
53%
48% 42%
% Rating Excellent/Very Good
Europe
UK
Germany
France
France
Germany
UK
Europe
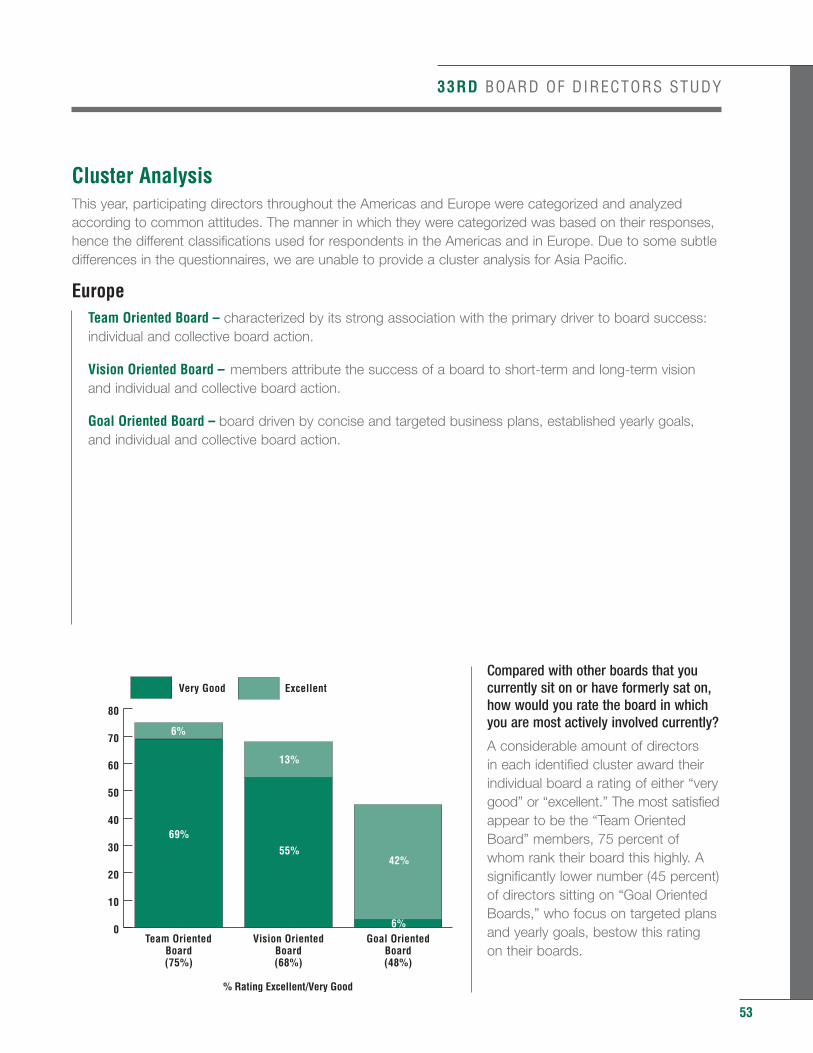
33RD BOARD OF DIRECTORS STUDY
53
Cluster AnalysisThis year, participating directors throughout the Americas and Europe were categorized and analyzedaccording to common attitudes. The manner in which they were categorized was based on their responses,hence the different classifications used for respondents in the Americas and in Europe. Due to some subtledifferences in the questionnaires, we are unable to provide a cluster analysis for Asia Pacific.
EuropeTeam Oriented Board – characterized by its strong association with the primary driver to board success: individual and collective board action.
Vision Oriented Board – members attribute the success of a board to short-term and long-term vision and individual and collective board action.
Goal Oriented Board – board driven by concise and targeted business plans, established yearly goals, and individual and collective board action.
Compared with other boards that youcurrently sit on or have formerly sat on,how would you rate the board in whichyou are most actively involved currently?
A considerable amount of directors in each identified cluster award theirindividual board a rating of either “verygood” or “excellent.” The most satisfiedappear to be the “Team OrientedBoard” members, 75 percent of whom rank their board this highly. Asignificantly lower number (45 percent)of directors sitting on “Goal OrientedBoards,” who focus on targeted plansand yearly goals, bestow this rating on their boards.
0
10
20
30
40
50
60
70
80
ExcellentVery Good
Goal OrientedBoard(48%)
Vision OrientedBoard(68%)
Team OrientedBoard(75%)
% Rating Excellent/Very Good
69%
55%
13%
42%
6%
6%
% of RespondentsFalling into Categories
17%
17%66%
Goal Oriented
Team Oriented Board
Vision Oriented Board
Goal Oriented Board
Team Oriented Board Vision Oriented Board Goal Oriented Board
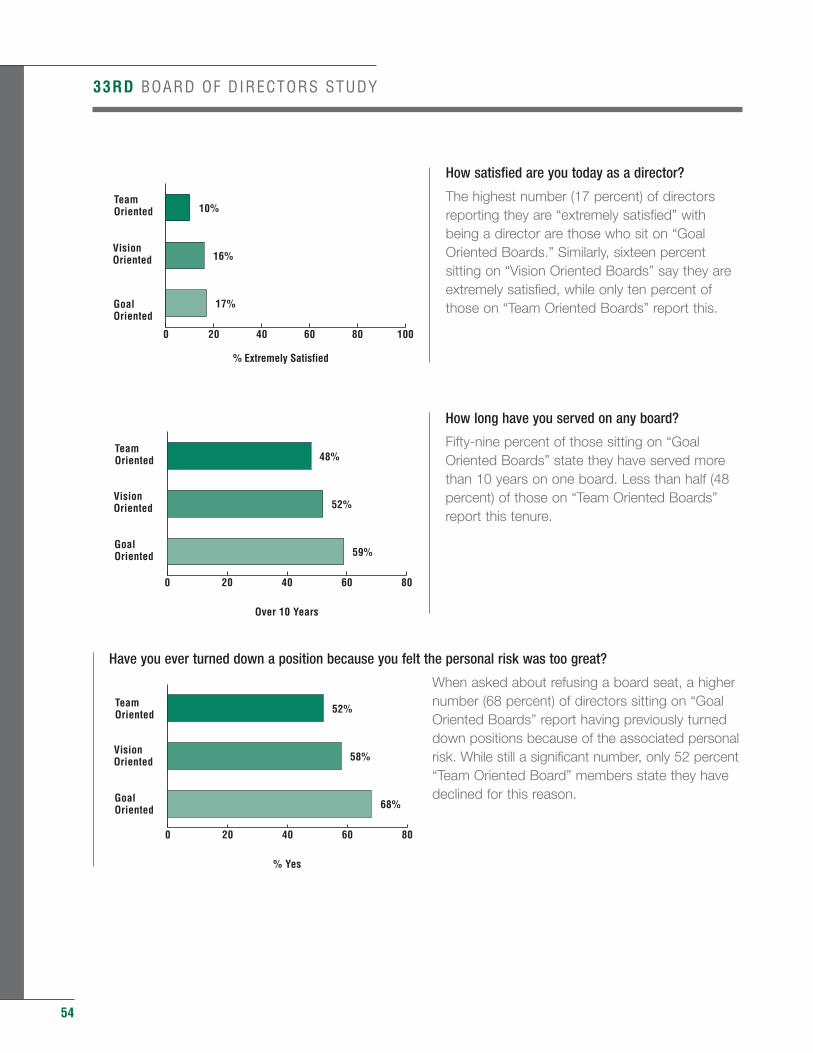
54
How satisfied are you today as a director?
The highest number (17 percent) of directorsreporting they are “extremely satisfied” withbeing a director are those who sit on “GoalOriented Boards.” Similarly, sixteen percentsitting on “Vision Oriented Boards” say they areextremely satisfied, while only ten percent ofthose on “Team Oriented Boards” report this.
How long have you served on any board?
Fifty-nine percent of those sitting on “GoalOriented Boards” state they have served morethan 10 years on one board. Less than half (48percent) of those on “Team Oriented Boards”report this tenure.
Have you ever turned down a position because you felt the personal risk was too great?
When asked about refusing a board seat, a highernumber (68 percent) of directors sitting on “GoalOriented Boards” report having previously turneddown positions because of the associated personalrisk. While still a significant number, only 52 percent“Team Oriented Board” members state they havedeclined for this reason.
33RD BOARD OF DIRECTORS STUDY
0 20 40 60 80 100
GoalOriented
VisionOriented
TeamOriented
16%
17%
10%
% Extremely Satisfied
0 20 40 60 80
GoalOriented
VisionOriented
TeamOriented
Over 10 Years
52%
59%
48%
0 20 40 60 80
GoalOriented
VisionOriented
TeamOriented
% Yes
58%
68%
52%
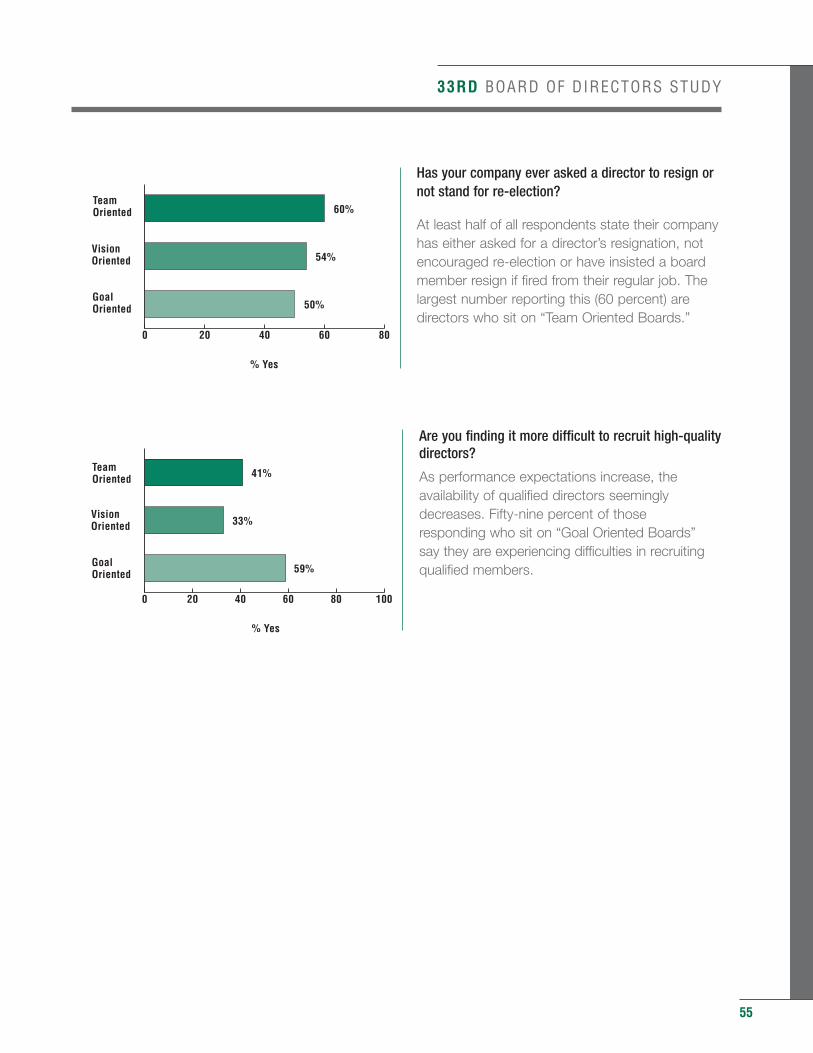
33RD BOARD OF DIRECTORS STUDY
55
Has your company ever asked a director to resign ornot stand for re-election?
At least half of all respondents state their companyhas either asked for a director’s resignation, notencouraged re-election or have insisted a boardmember resign if fired from their regular job. Thelargest number reporting this (60 percent) aredirectors who sit on “Team Oriented Boards.”
Are you finding it more difficult to recruit high-qualitydirectors?
As performance expectations increase, theavailability of qualified directors seeminglydecreases. Fifty-nine percent of those responding who sit on “Goal Oriented Boards” say they are experiencing difficulties in recruitingqualified members.
0 20 40 60 80
GoalOriented
VisionOriented
TeamOriented
% Yes
54%
50%
60%
0 20 40 60 80 100
GoalOriented
VisionOriented
TeamOriented
% Yes
33%
59%
41%
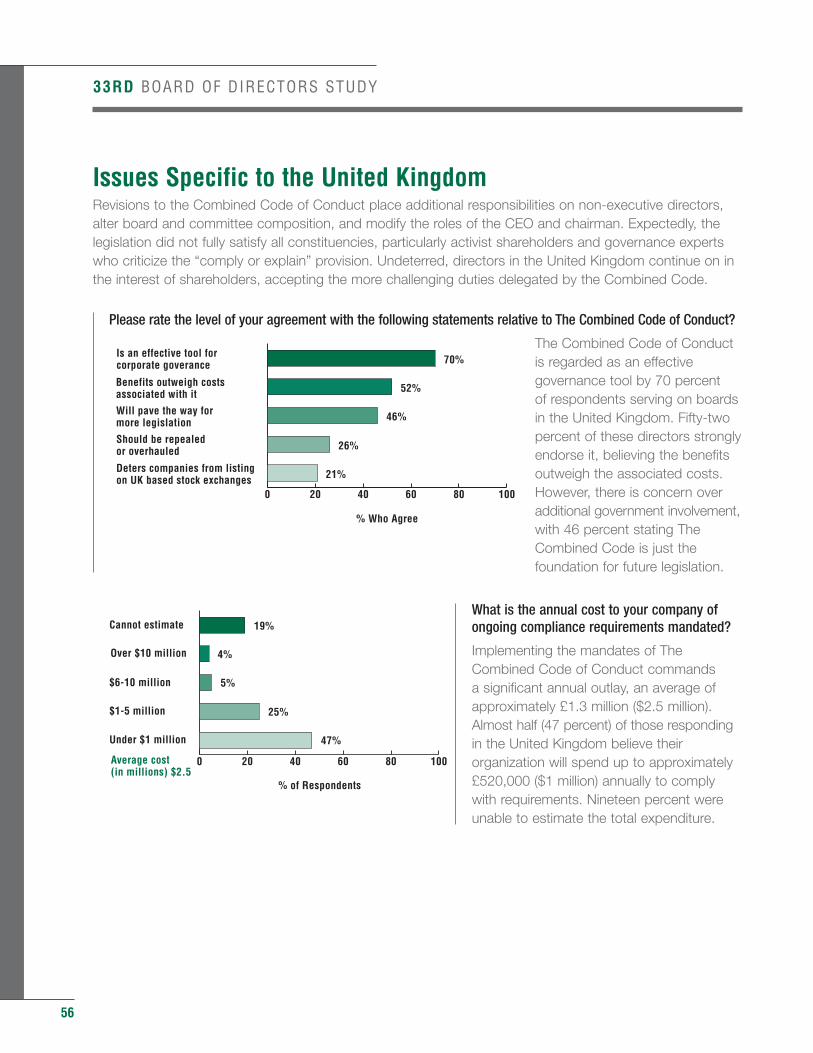
56
Issues Specific to the United KingdomRevisions to the Combined Code of Conduct place additional responsibilities on non-executive directors,alter board and committee composition, and modify the roles of the CEO and chairman. Expectedly, thelegislation did not fully satisfy all constituencies, particularly activist shareholders and governance expertswho criticize the “comply or explain” provision. Undeterred, directors in the United Kingdom continue on inthe interest of shareholders, accepting the more challenging duties delegated by the Combined Code.
Please rate the level of your agreement with the following statements relative to The Combined Code of Conduct?
The Combined Code of Conductis regarded as an effectivegovernance tool by 70 percent of respondents serving on boardsin the United Kingdom. Fifty-twopercent of these directors stronglyendorse it, believing the benefitsoutweigh the associated costs.However, there is concern overadditional government involvement,with 46 percent stating TheCombined Code is just thefoundation for future legislation.
What is the annual cost to your company ofongoing compliance requirements mandated?
Implementing the mandates of TheCombined Code of Conduct commands a significant annual outlay, an average ofapproximately £1.3 million ($2.5 million).Almost half (47 percent) of those respondingin the United Kingdom believe theirorganization will spend up to approximately£520,000 ($1 million) annually to complywith requirements. Nineteen percent wereunable to estimate the total expenditure.
33RD BOARD OF DIRECTORS STUDY
0 20 40 60 80 100
Deters companies from listingon UK based stock exchanges
Should be repealedor overhauled
Will pave the way formore legislation
Benefits outweigh costsassociated with it
Is an effective tool forcorporate goverance
% Who Agree
52%
46%
70%
26%
21%
0 20 40 60 80 100
Under $1 million
$1-5 million
$6-10 million
Over $10 million
Cannot estimate
% of Respondents
Average cost(in millions) $2.5
4%
5%
19%
25%
47%
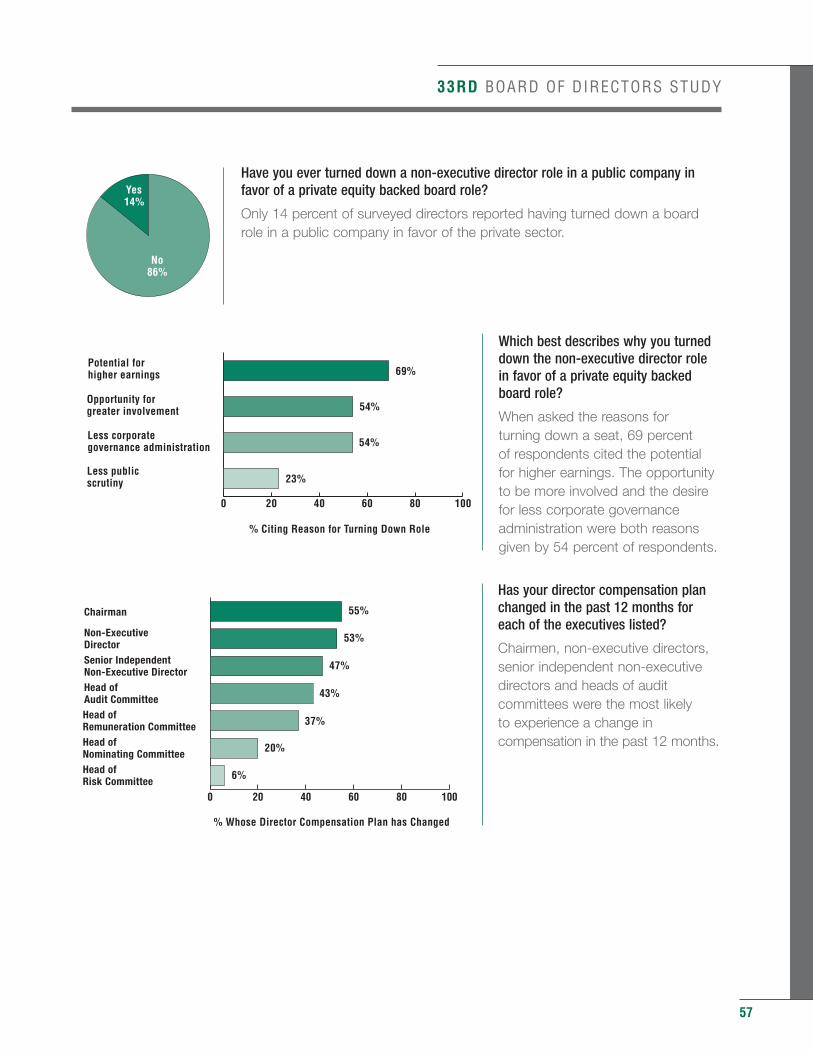
33RD BOARD OF DIRECTORS STUDY
57
Have you ever turned down a non-executive director role in a public company infavor of a private equity backed board role?
Only 14 percent of surveyed directors reported having turned down a boardrole in a public company in favor of the private sector.
Which best describes why you turneddown the non-executive director rolein favor of a private equity backedboard role?
When asked the reasons for turning down a seat, 69 percent of respondents cited the potential for higher earnings. The opportunityto be more involved and the desirefor less corporate governanceadministration were both reasonsgiven by 54 percent of respondents.
Has your director compensation planchanged in the past 12 months foreach of the executives listed?
Chairmen, non-executive directors,senior independent non-executivedirectors and heads of auditcommittees were the most likely to experience a change incompensation in the past 12 months.
0 20 40 60 80 100
Less publicscrutiny
Less corporategovernance administration
Opportunity forgreater involvement
Potential forhigher earnings
54%
54%
69%
23%
% Citing Reason for Turning Down Role
% Whose Director Compensation Plan has Changed
55%
37%
53%
47%
43%
20%
6%
0 20 40 60 80 100
Head ofRisk Committee
Head ofNominating Committee
Head ofRemuneration Committee
Head ofAudit Committee
Senior IndependentNon-Executive Director
Non-ExecutiveDirector
Chairman
No86%
Yes14%
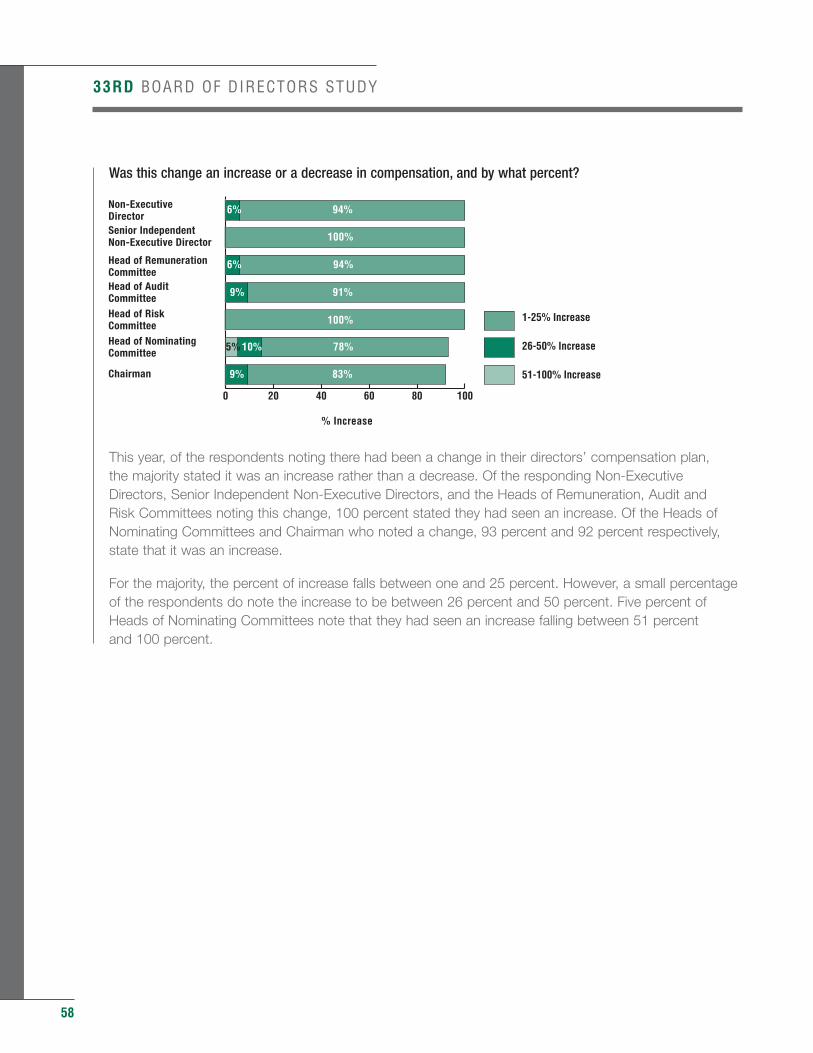
58
33RD BOARD OF DIRECTORS STUDY
Was this change an increase or a decrease in compensation, and by what percent?
This year, of the respondents noting there had been a change in their directors’ compensation plan, the majority stated it was an increase rather than a decrease. Of the responding Non-Executive Directors, Senior Independent Non-Executive Directors, and the Heads of Remuneration, Audit and Risk Committees noting this change, 100 percent stated they had seen an increase. Of the Heads of Nominating Committees and Chairman who noted a change, 93 percent and 92 percent respectively, state that it was an increase.
For the majority, the percent of increase falls between one and 25 percent. However, a small percentageof the respondents do note the increase to be between 26 percent and 50 percent. Five percent of Heads of Nominating Committees note that they had seen an increase falling between 51 percent and 100 percent.
% Increase
0 20 40 60 80 100
1-25% Increase
26-50% Increase
51-100% IncreaseChairman
Head of NominatingCommittee
Head of RiskCommittee
Head of AuditCommittee
Head of RemunerationCommittee
Senior IndependentNon-Executive Director
Non-ExecutiveDirector
83%9%
78%10%5%
100%
94%6%
100%
94%6%
91%9%
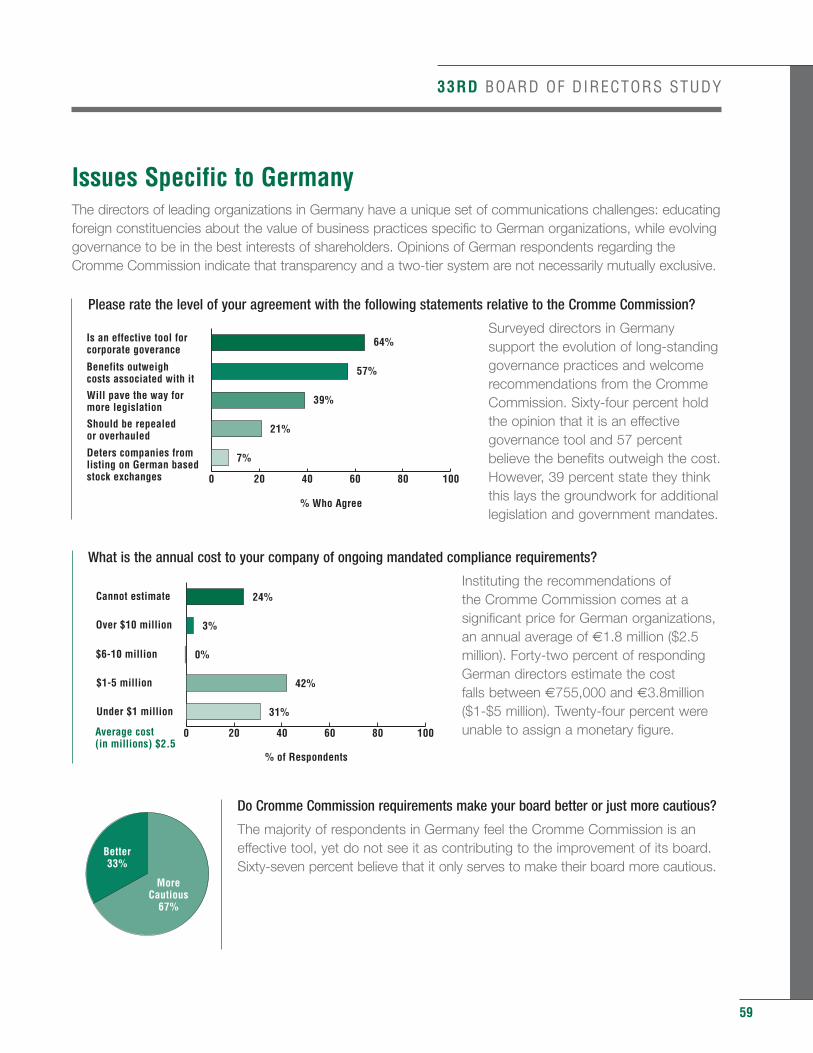
33RD BOARD OF DIRECTORS STUDY
Issues Specific to GermanyThe directors of leading organizations in Germany have a unique set of communications challenges: educatingforeign constituencies about the value of business practices specific to German organizations, while evolvinggovernance to be in the best interests of shareholders. Opinions of German respondents regarding theCromme Commission indicate that transparency and a two-tier system are not necessarily mutually exclusive.
Please rate the level of your agreement with the following statements relative to the Cromme Commission?
Surveyed directors in Germanysupport the evolution of long-standinggovernance practices and welcomerecommendations from the CrommeCommission. Sixty-four percent holdthe opinion that it is an effectivegovernance tool and 57 percentbelieve the benefits outweigh the cost.However, 39 percent state they thinkthis lays the groundwork for additionallegislation and government mandates.
What is the annual cost to your company of ongoing mandated compliance requirements?
Instituting the recommendations of the Cromme Commission comes at asignificant price for German organizations,an annual average of €1.8 million ($2.5million). Forty-two percent of respondingGerman directors estimate the cost falls between €755,000 and €3.8million($1-$5 million). Twenty-four percent wereunable to assign a monetary figure.
Do Cromme Commission requirements make your board better or just more cautious?
The majority of respondents in Germany feel the Cromme Commission is aneffective tool, yet do not see it as contributing to the improvement of its board.Sixty-seven percent believe that it only serves to make their board more cautious.
59
0 20 40 60 80 100
Deters companies fromlisting on German basedstock exchanges
Should be repealedor overhauled
Will pave the way formore legislation
Benefits outweighcosts associated with it
Is an effective tool forcorporate goverance
% Who Agree
57%
39%
64%
21%
7%
MoreCautious
67%
Better33%
0 20 40 60 80 100
Under $1 million
$1-5 million
$6-10 million
Over $10 million
Cannot estimate
% of Respondents
Average cost(in millions) $2.5
3%
0%
24%
42%
31%
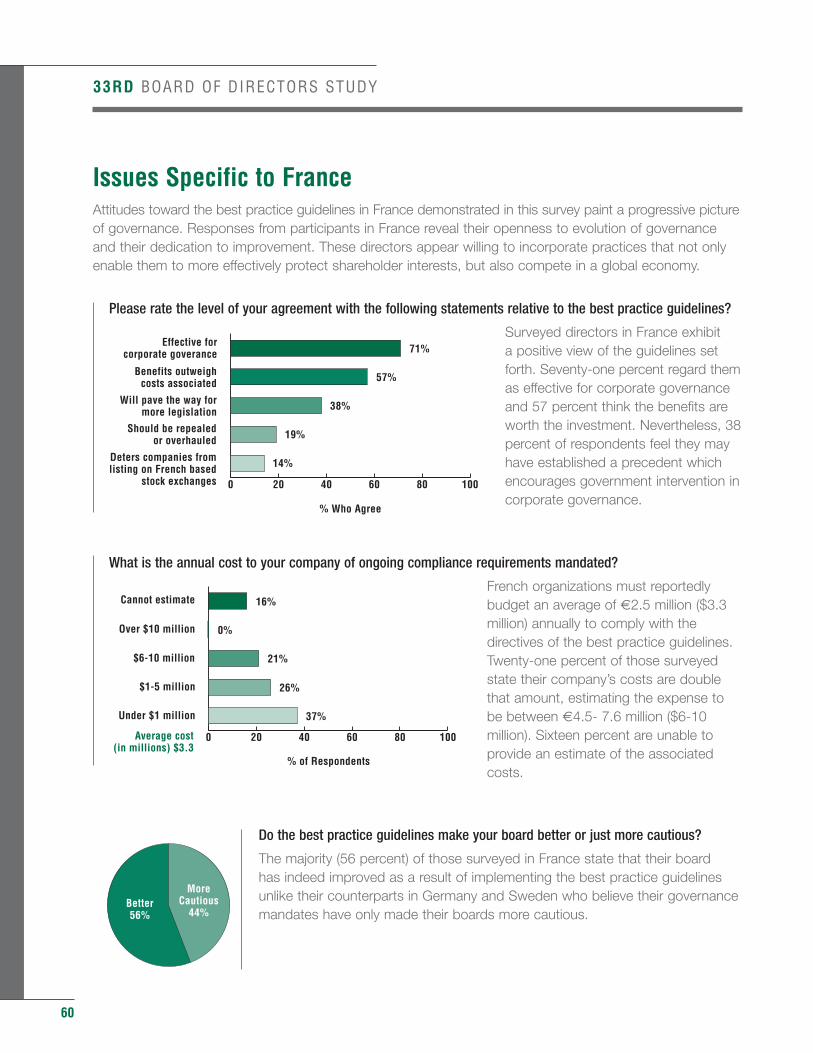
60
Issues Specific to FranceAttitudes toward the best practice guidelines in France demonstrated in this survey paint a progressive pictureof governance. Responses from participants in France reveal their openness to evolution of governanceand their dedication to improvement. These directors appear willing to incorporate practices that not onlyenable them to more effectively protect shareholder interests, but also compete in a global economy.
Please rate the level of your agreement with the following statements relative to the best practice guidelines?
Surveyed directors in France exhibit a positive view of the guidelines setforth. Seventy-one percent regard themas effective for corporate governanceand 57 percent think the benefits areworth the investment. Nevertheless, 38percent of respondents feel they mayhave established a precedent whichencourages government intervention incorporate governance.
What is the annual cost to your company of ongoing compliance requirements mandated?
French organizations must reportedlybudget an average of €2.5 million ($3.3million) annually to comply with thedirectives of the best practice guidelines.Twenty-one percent of those surveyedstate their company’s costs are doublethat amount, estimating the expense tobe between €4.5- 7.6 million ($6-10million). Sixteen percent are unable toprovide an estimate of the associatedcosts.
Do the best practice guidelines make your board better or just more cautious?
The majority (56 percent) of those surveyed in France state that their board has indeed improved as a result of implementing the best practice guidelinesunlike their counterparts in Germany and Sweden who believe their governancemandates have only made their boards more cautious.
33RD BOARD OF DIRECTORS STUDY
0 20 40 60 80 100
Deters companies fromlisting on French based
stock exchanges
Should be repealedor overhauled
Will pave the way formore legislation
Benefits outweigh costs associated
Effective forcorporate goverance
% Who Agree
57%
38%
71%
19%
14%
MoreCautious
44%Better56%
0 20 40 60 80 100
Under $1 million
$1-5 million
$6-10 million
Over $10 million
Cannot estimate
% of Respondents
Average cost(in millions) $3.3
0%
21%
16%
26%
37%
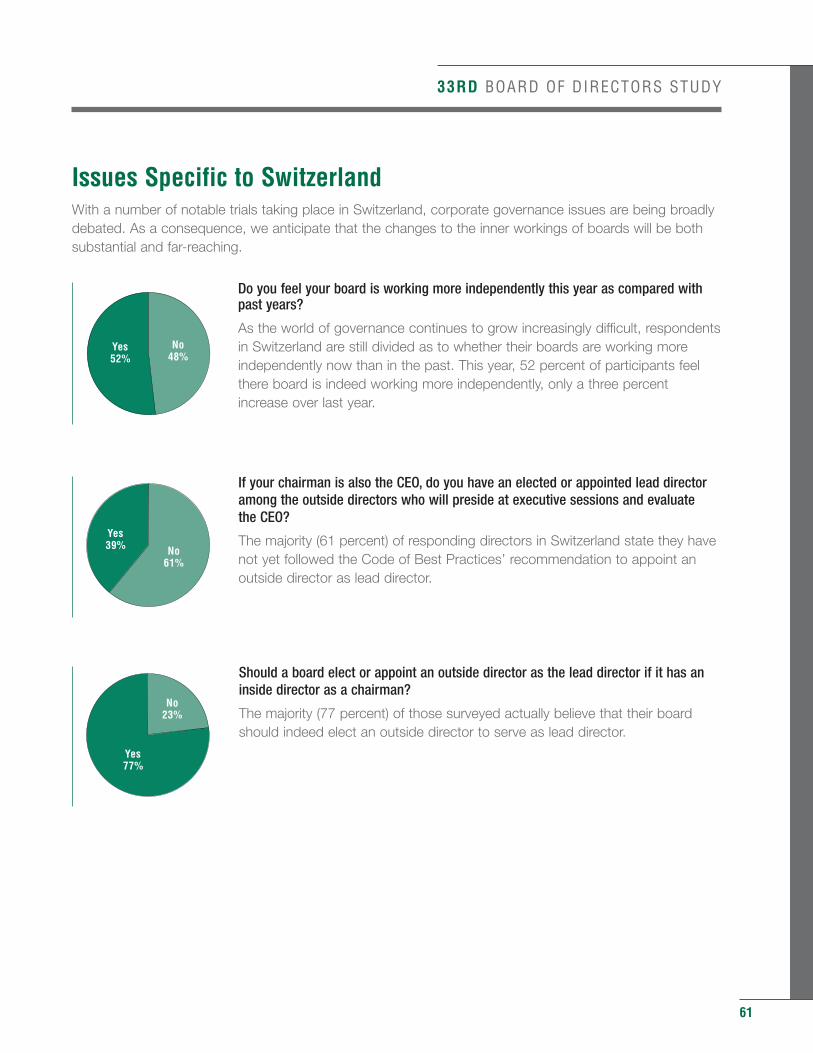
33RD BOARD OF DIRECTORS STUDY
Issues Specific to SwitzerlandWith a number of notable trials taking place in Switzerland, corporate governance issues are being broadlydebated. As a consequence, we anticipate that the changes to the inner workings of boards will be bothsubstantial and far-reaching.
Do you feel your board is working more independently this year as compared withpast years?
As the world of governance continues to grow increasingly difficult, respondentsin Switzerland are still divided as to whether their boards are working moreindependently now than in the past. This year, 52 percent of participants feelthere board is indeed working more independently, only a three percentincrease over last year.
If your chairman is also the CEO, do you have an elected or appointed lead directoramong the outside directors who will preside at executive sessions and evaluate the CEO?
The majority (61 percent) of responding directors in Switzerland state they havenot yet followed the Code of Best Practices’ recommendation to appoint anoutside director as lead director.
Should a board elect or appoint an outside director as the lead director if it has aninside director as a chairman?
The majority (77 percent) of those surveyed actually believe that their boardshould indeed elect an outside director to serve as lead director.
61
No48%
Yes52%
Yes39% No
61%
Yes77%
No23%
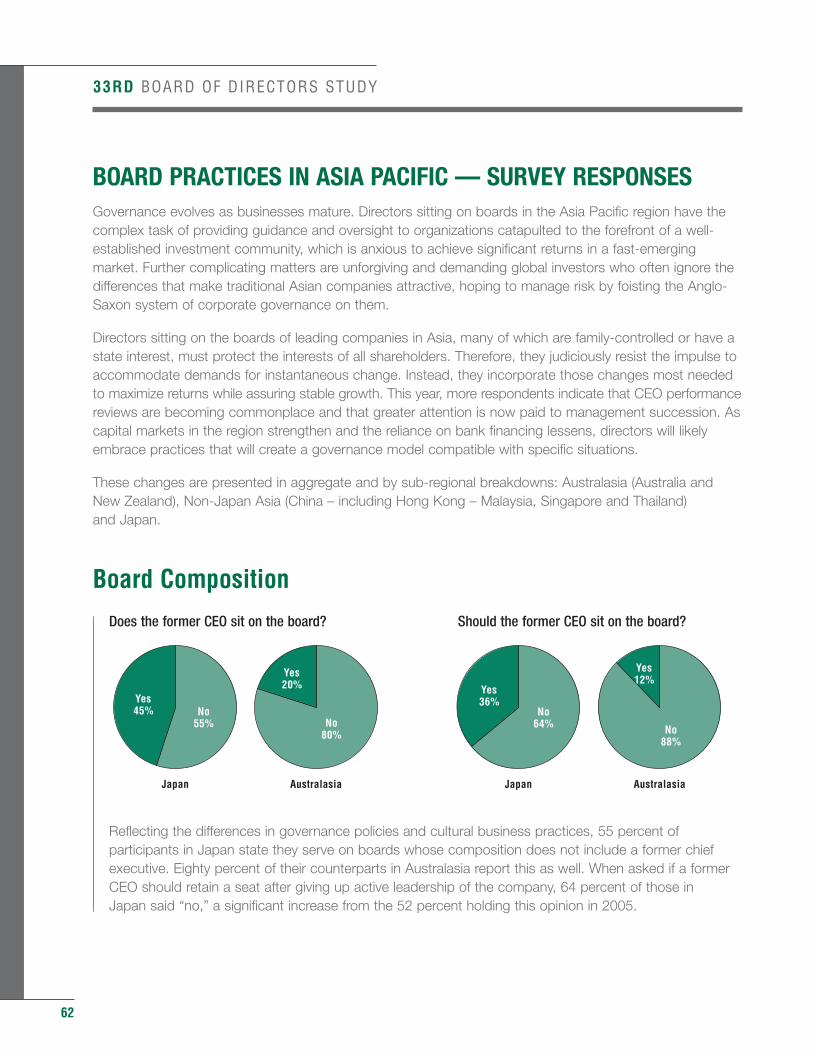
62
BOARD PRACTICES IN ASIA PACIFIC — SURVEY RESPONSESGovernance evolves as businesses mature. Directors sitting on boards in the Asia Pacific region have thecomplex task of providing guidance and oversight to organizations catapulted to the forefront of a well-established investment community, which is anxious to achieve significant returns in a fast-emergingmarket. Further complicating matters are unforgiving and demanding global investors who often ignore thedifferences that make traditional Asian companies attractive, hoping to manage risk by foisting the Anglo-Saxon system of corporate governance on them.
Directors sitting on the boards of leading companies in Asia, many of which are family-controlled or have astate interest, must protect the interests of all shareholders. Therefore, they judiciously resist the impulse toaccommodate demands for instantaneous change. Instead, they incorporate those changes most neededto maximize returns while assuring stable growth. This year, more respondents indicate that CEO performancereviews are becoming commonplace and that greater attention is now paid to management succession. Ascapital markets in the region strengthen and the reliance on bank financing lessens, directors will likelyembrace practices that will create a governance model compatible with specific situations.
These changes are presented in aggregate and by sub-regional breakdowns: Australasia (Australia andNew Zealand), Non-Japan Asia (China – including Hong Kong – Malaysia, Singapore and Thailand)and Japan.
Board Composition
Does the former CEO sit on the board? Should the former CEO sit on the board?
Reflecting the differences in governance policies and cultural business practices, 55 percent of participants in Japan state they serve on boards whose composition does not include a former chief executive. Eighty percent of their counterparts in Australasia report this as well. When asked if a former CEO should retain a seat after giving up active leadership of the company, 64 percent of those in Japan said “no,” a significant increase from the 52 percent holding this opinion in 2005.
33RD BOARD OF DIRECTORS STUDY
No64% No
88%
No55% No
80%
Yes36%
Yes12%
Yes45%
Yes20%
Japan AustralasiaJapan Australasia
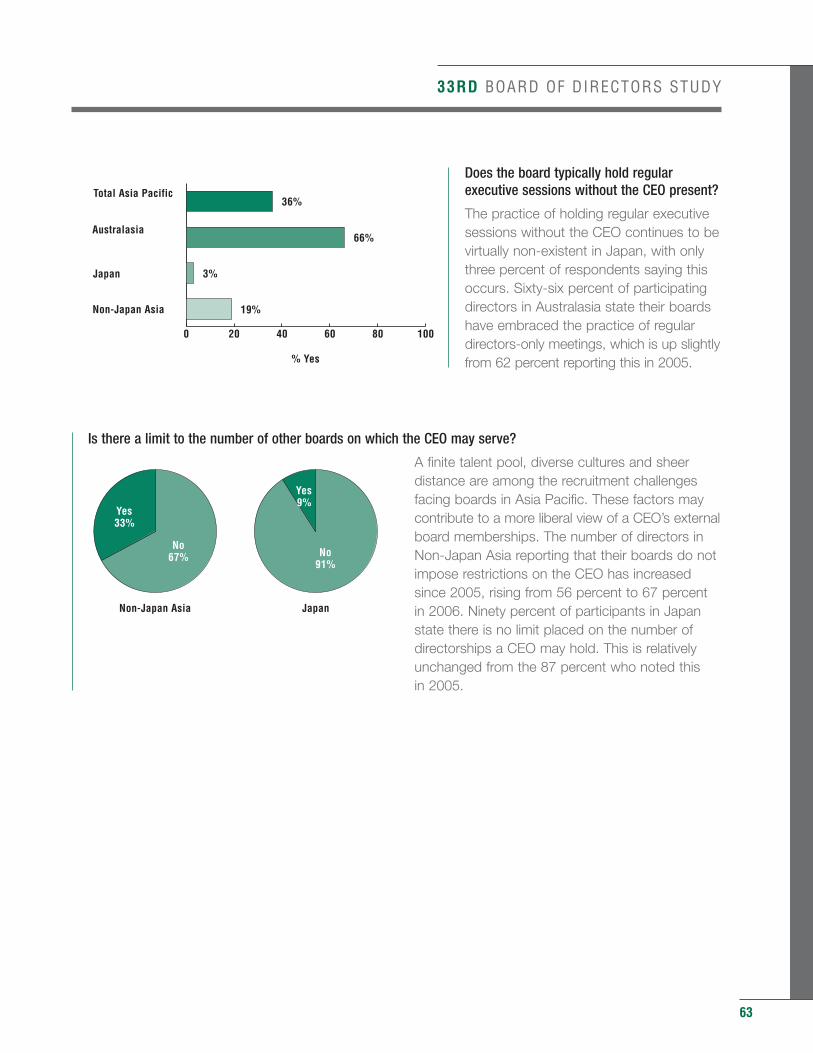
33RD BOARD OF DIRECTORS STUDY
Does the board typically hold regularexecutive sessions without the CEO present?
The practice of holding regular executivesessions without the CEO continues to bevirtually non-existent in Japan, with onlythree percent of respondents saying thisoccurs. Sixty-six percent of participatingdirectors in Australasia state their boardshave embraced the practice of regulardirectors-only meetings, which is up slightlyfrom 62 percent reporting this in 2005.
Is there a limit to the number of other boards on which the CEO may serve?
A finite talent pool, diverse cultures and sheerdistance are among the recruitment challengesfacing boards in Asia Pacific. These factors maycontribute to a more liberal view of a CEO’s externalboard memberships. The number of directors inNon-Japan Asia reporting that their boards do notimpose restrictions on the CEO has increasedsince 2005, rising from 56 percent to 67 percentin 2006. Ninety percent of participants in Japanstate there is no limit placed on the number ofdirectorships a CEO may hold. This is relativelyunchanged from the 87 percent who noted this in 2005.
63
0 20 40 60 80 100
Non-Japan Asia
Japan
Australasia
Total Asia Pacific
66%
3%
36%
19%
% Yes
No67% No
91%
Yes33%
Yes9%
Non-Japan Asia Japan
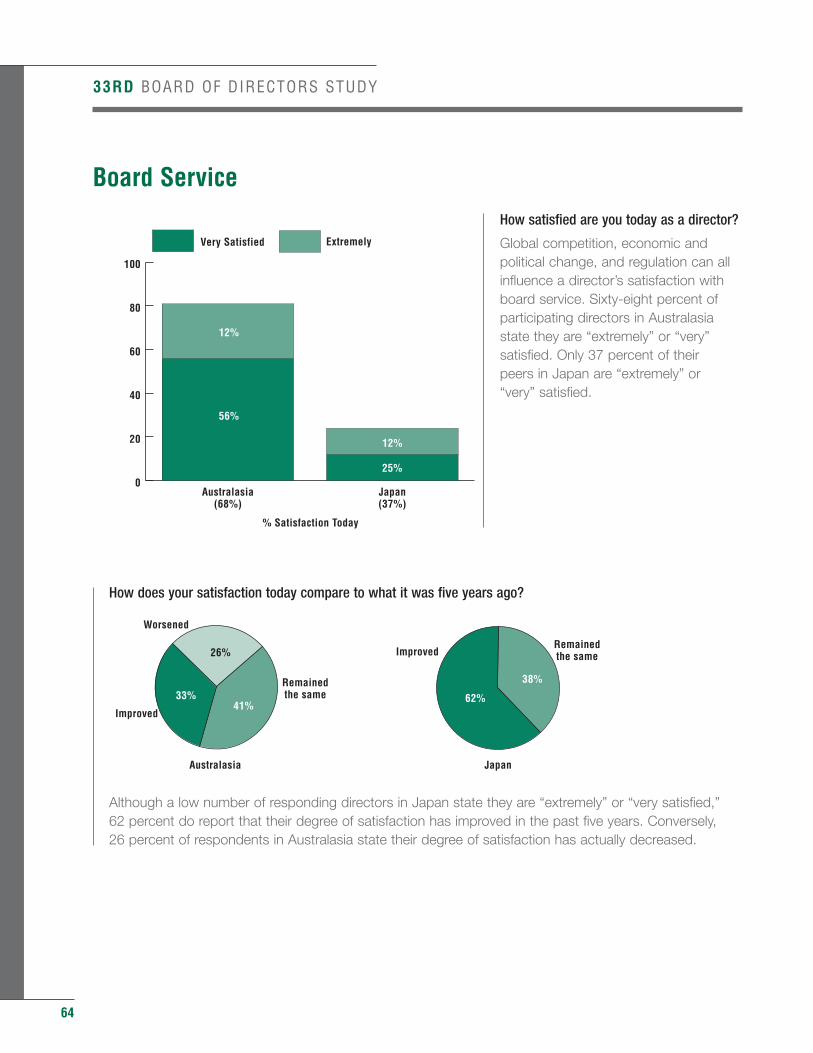
64
Board Service
How satisfied are you today as a director?
Global competition, economic andpolitical change, and regulation can allinfluence a director’s satisfaction withboard service. Sixty-eight percent ofparticipating directors in Australasiastate they are “extremely” or “very”satisfied. Only 37 percent of their peers in Japan are “extremely” or “very” satisfied.
How does your satisfaction today compare to what it was five years ago?
Although a low number of responding directors in Japan state they are “extremely” or “very satisfied,” 62 percent do report that their degree of satisfaction has improved in the past five years. Conversely, 26 percent of respondents in Australasia state their degree of satisfaction has actually decreased.
33RD BOARD OF DIRECTORS STUDY
Worsened
38%
41%62%33%
26%
JapanAustralasia
Remainedthe same
Remainedthe same
Improved
Improved
0
20
40
60
80
100
ExtremelyVery Satisfied
Japan(37%)
Australasia(68%)
% Satisfaction Today
12%
56%
12%
25%
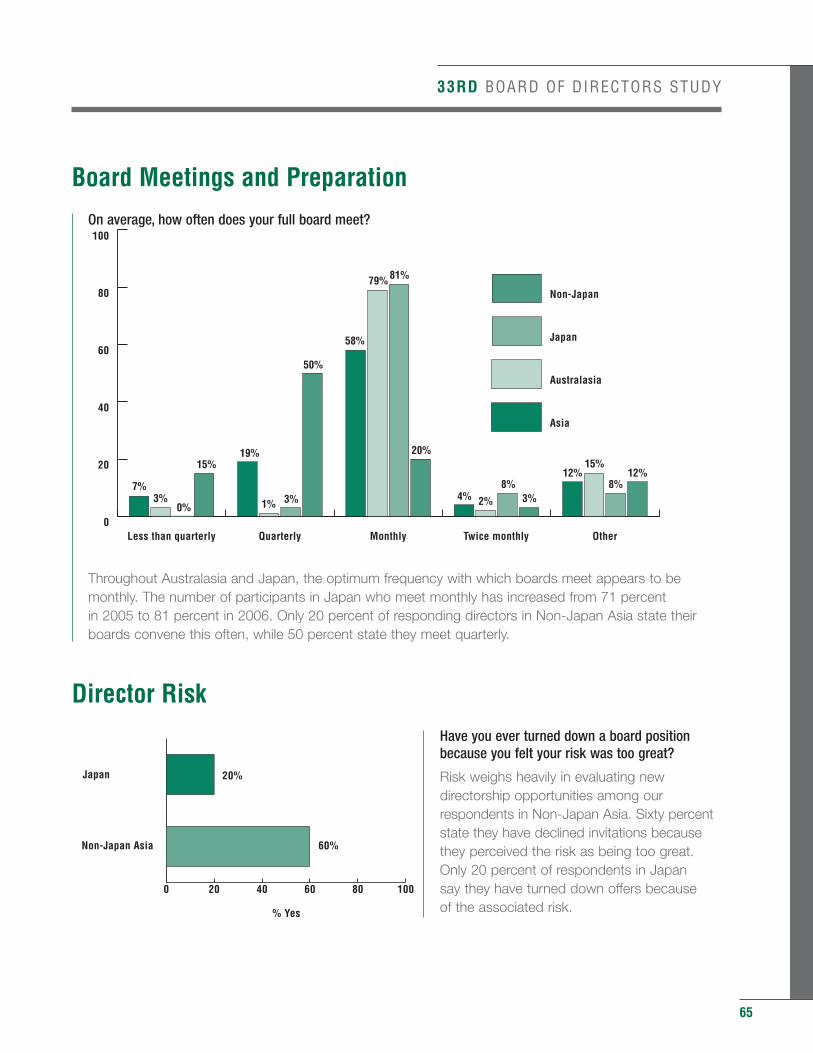
33RD BOARD OF DIRECTORS STUDY
Board Meetings and Preparation
On average, how often does your full board meet?
Throughout Australasia and Japan, the optimum frequency with which boards meet appears to be monthly. The number of participants in Japan who meet monthly has increased from 71 percent in 2005 to 81 percent in 2006. Only 20 percent of responding directors in Non-Japan Asia state their boards convene this often, while 50 percent state they meet quarterly.
Director Risk
Have you ever turned down a board positionbecause you felt your risk was too great?
Risk weighs heavily in evaluating newdirectorship opportunities among ourrespondents in Non-Japan Asia. Sixty percentstate they have declined invitations becausethey perceived the risk as being too great.Only 20 percent of respondents in Japan say they have turned down offers because of the associated risk.
65
0 20 40 60 80 100
Non-Japan Asia
Japan
% Yes
20%
60%
0
20
40
60
80
100
7%3%
0%
15%19%
1% 3%
50%
58%
79% 81%
20%
4% 2%
8%3%
12%15%
8%12%
Non-Japan
Japan
Austral Asia
Asia
OtherTwice monthlyMonthlyQuarterlyLess than quarterly
Non-Japan
Japan
Austral Asia
Asia
Non-Japan
Japan
Australasia
Asia
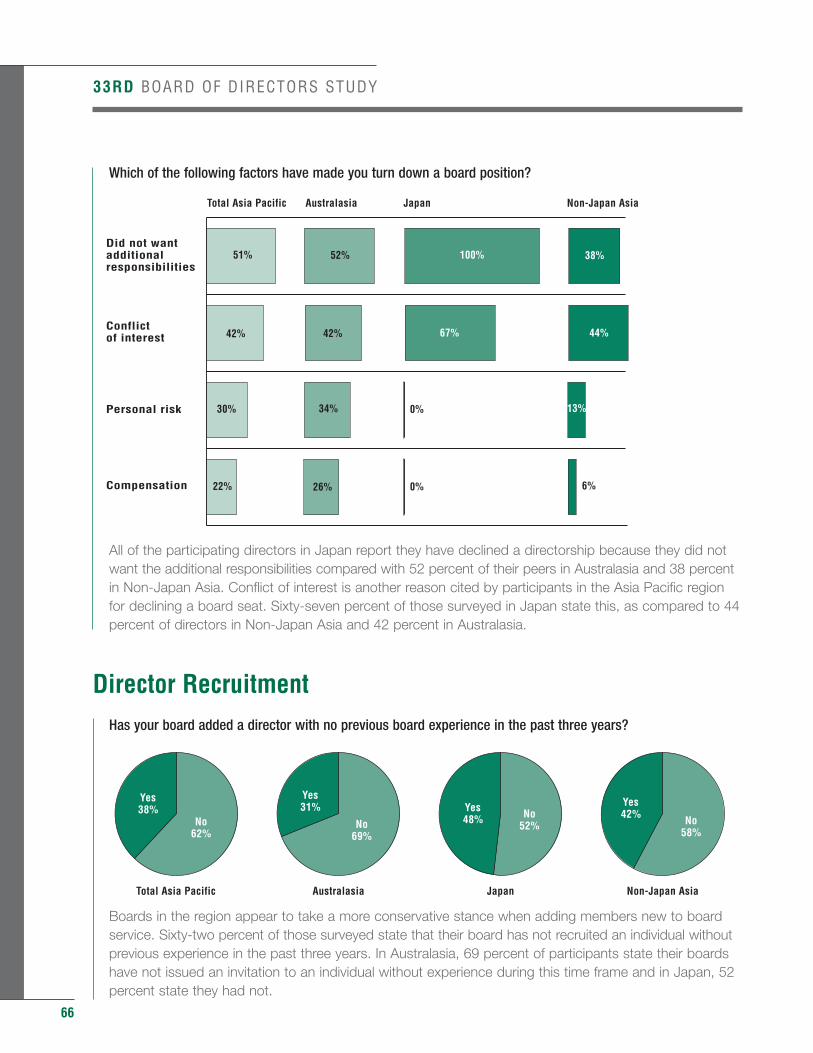
66
Which of the following factors have made you turn down a board position?
All of the participating directors in Japan report they have declined a directorship because they did not want the additional responsibilities compared with 52 percent of their peers in Australasia and 38 percent in Non-Japan Asia. Conflict of interest is another reason cited by participants in the Asia Pacific region for declining a board seat. Sixty-seven percent of those surveyed in Japan state this, as compared to 44 percent of directors in Non-Japan Asia and 42 percent in Australasia.
Director RecruitmentHas your board added a director with no previous board experience in the past three years?
Boards in the region appear to take a more conservative stance when adding members new to board service. Sixty-two percent of those surveyed state that their board has not recruited an individual without previous experience in the past three years. In Australasia, 69 percent of participants state their boards have not issued an invitation to an individual without experience during this time frame and in Japan, 52 percent state they had not.
33RD BOARD OF DIRECTORS STUDY
Compensation
Personal risk
Conflictof interest
Did not wantadditionalresponsibilities
Total Asia Pacific Australasia Japan Non-Japan Asia
51%
42%
30%
22% 26% 0%
0%34% 13%
6%
44%
38%
42% 67%
52% 100%
No58%
No52%No
69%No
62%
Yes42%
Yes48%
Yes31%
Yes38%
Non-Japan AsiaJapanAustralasiaTotal Asia Pacific
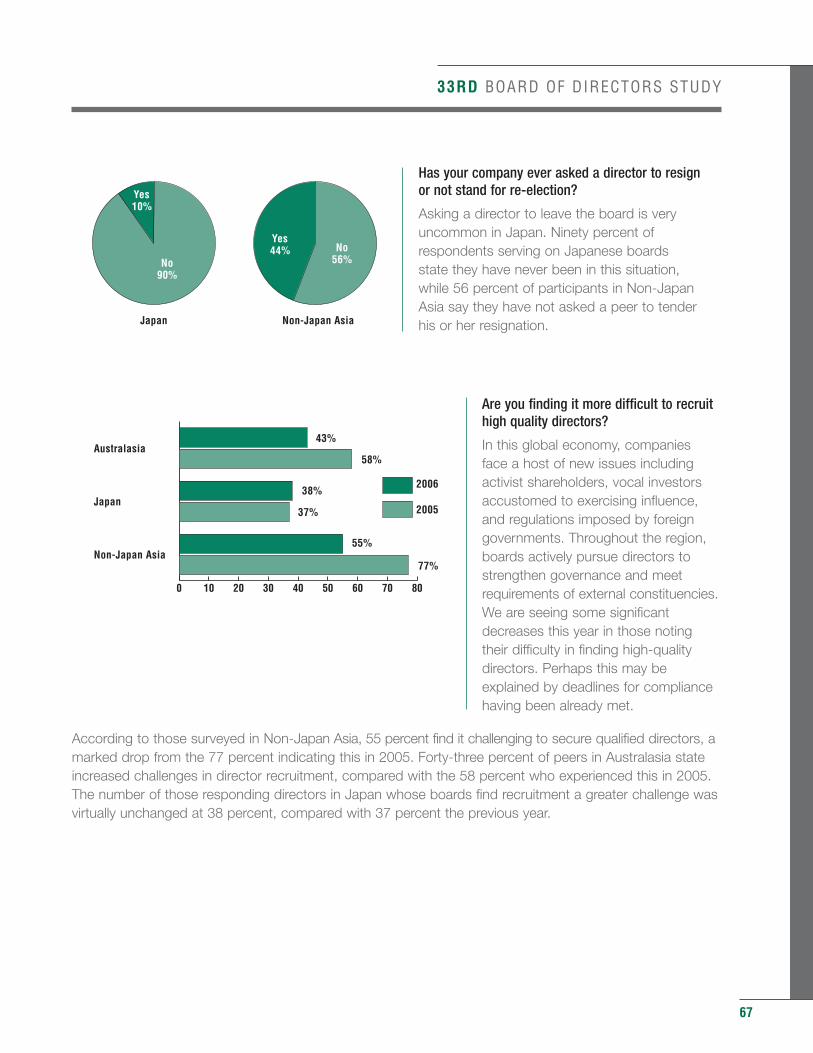
33RD BOARD OF DIRECTORS STUDY
Has your company ever asked a director to resign or not stand for re-election?
Asking a director to leave the board is veryuncommon in Japan. Ninety percent ofrespondents serving on Japanese boards state they have never been in this situation, while 56 percent of participants in Non-JapanAsia say they have not asked a peer to tenderhis or her resignation.
Are you finding it more difficult to recruithigh quality directors?
In this global economy, companies face a host of new issues includingactivist shareholders, vocal investorsaccustomed to exercising influence,and regulations imposed by foreigngovernments. Throughout the region,boards actively pursue directors tostrengthen governance and meetrequirements of external constituencies.We are seeing some significantdecreases this year in those notingtheir difficulty in finding high-qualitydirectors. Perhaps this may beexplained by deadlines for compliancehaving been already met.
According to those surveyed in Non-Japan Asia, 55 percent find it challenging to secure qualified directors, amarked drop from the 77 percent indicating this in 2005. Forty-three percent of peers in Australasia stateincreased challenges in director recruitment, compared with the 58 percent who experienced this in 2005.The number of those responding directors in Japan whose boards find recruitment a greater challenge wasvirtually unchanged at 38 percent, compared with 37 percent the previous year.
67
Yes44%
Yes10%
No56%No
90%
Non-Japan AsiaJapan
0 10 20 30 40 50 60 70 80
2005
2006
Non-Japan Asia
Japan
Australasia 43%
58%
38%
37%
77%
55%
2005
2006
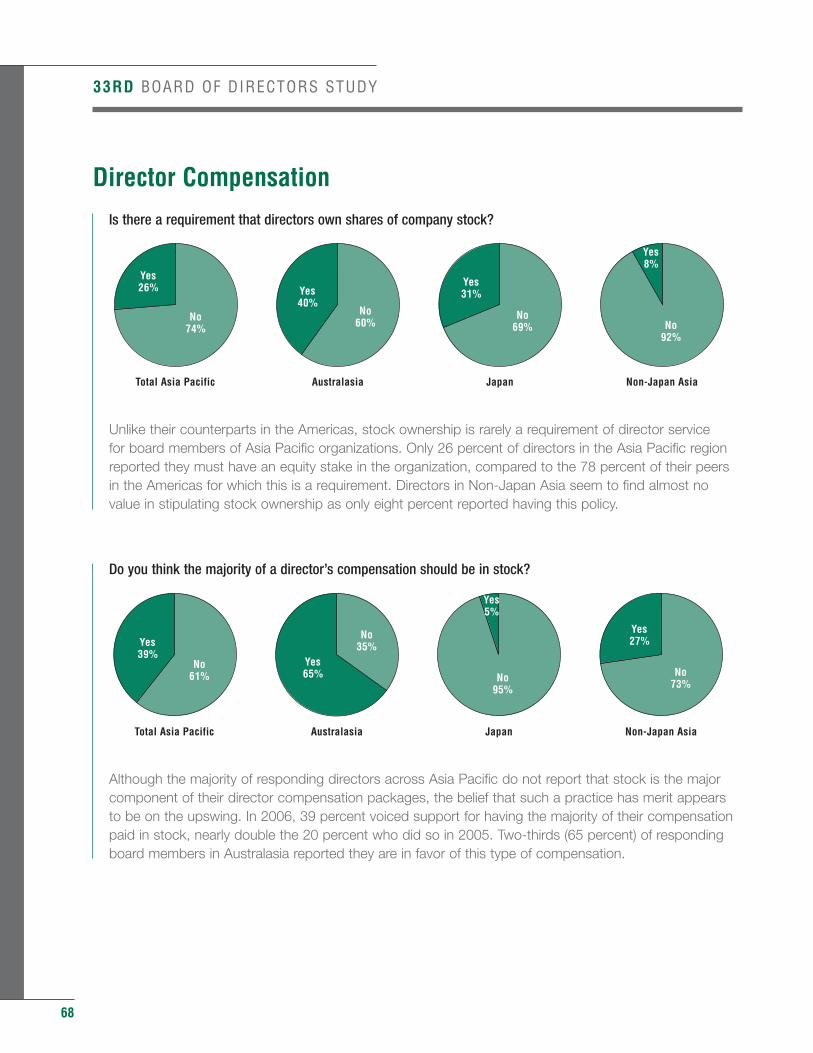
68
Director Compensation
Is there a requirement that directors own shares of company stock?
Unlike their counterparts in the Americas, stock ownership is rarely a requirement of director service for board members of Asia Pacific organizations. Only 26 percent of directors in the Asia Pacific region reported they must have an equity stake in the organization, compared to the 78 percent of their peers in the Americas for which this is a requirement. Directors in Non-Japan Asia seem to find almost no value in stipulating stock ownership as only eight percent reported having this policy.
Do you think the majority of a director’s compensation should be in stock?
Although the majority of responding directors across Asia Pacific do not report that stock is the major component of their director compensation packages, the belief that such a practice has merit appears to be on the upswing. In 2006, 39 percent voiced support for having the majority of their compensation paid in stock, nearly double the 20 percent who did so in 2005. Two-thirds (65 percent) of responding board members in Australasia reported they are in favor of this type of compensation.
33RD BOARD OF DIRECTORS STUDY
No73%No
95%
No35%
No61%
Yes27%
Yes5%
Yes65%
Yes39%
Non-Japan AsiaJapanAustralasiaTotal Asia Pacific
No92%
No69%
No60%No
74%
Yes8%
Yes31%Yes
40%
Yes26%
Non-Japan AsiaJapanAustralasiaTotal Asia Pacific
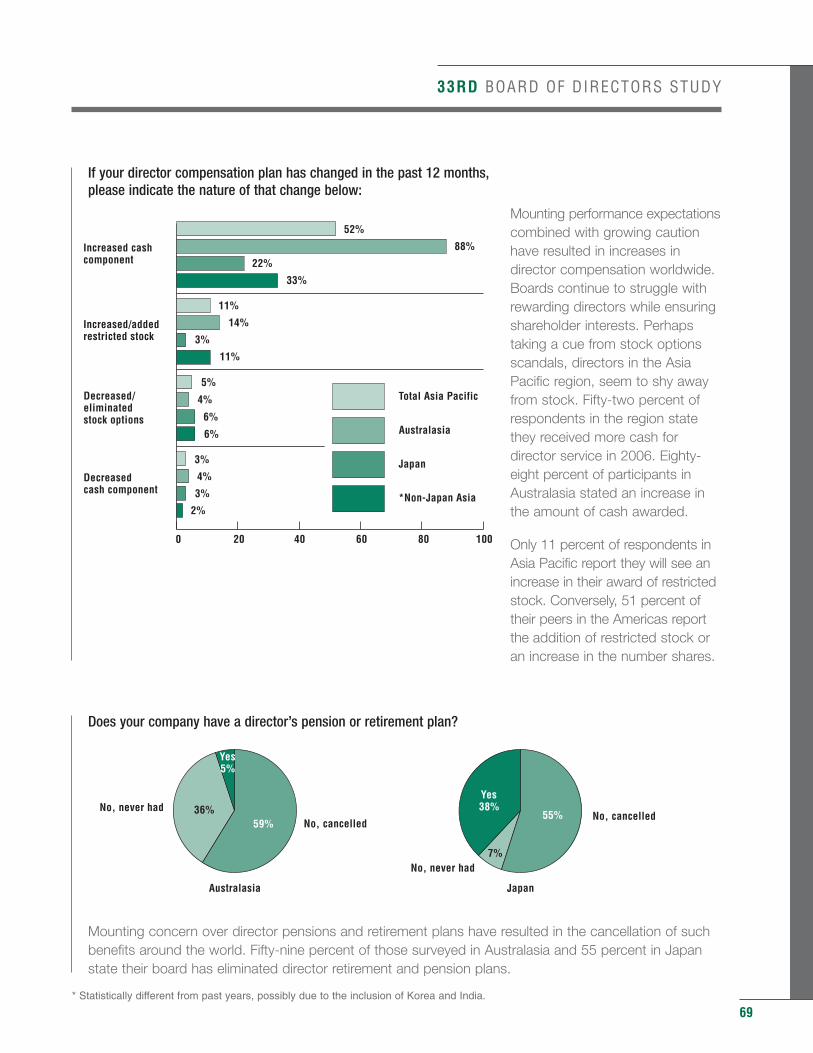
33RD BOARD OF DIRECTORS STUDY
If your director compensation plan has changed in the past 12 months,please indicate the nature of that change below:
Mounting performance expectationscombined with growing cautionhave resulted in increases indirector compensation worldwide.Boards continue to struggle withrewarding directors while ensuringshareholder interests. Perhapstaking a cue from stock optionsscandals, directors in the AsiaPacific region, seem to shy awayfrom stock. Fifty-two percent ofrespondents in the region statethey received more cash fordirector service in 2006. Eighty-eight percent of participants inAustralasia stated an increase inthe amount of cash awarded.
Only 11 percent of respondents inAsia Pacific report they will see an increase in their award of restrictedstock. Conversely, 51 percent oftheir peers in the Americas reportthe addition of restricted stock oran increase in the number shares.
Does your company have a director’s pension or retirement plan?
Mounting concern over director pensions and retirement plans have resulted in the cancellation of such benefits around the world. Fifty-nine percent of those surveyed in Australasia and 55 percent in Japan state their board has eliminated director retirement and pension plans.
69
0 20 40 60 80 100
Non-Japan AsiaJapanAustralasia
Total Asia/Pacific
Decreasedcash component
Decreased/eliminatedstock options
Increased/addedrestricted stock
Increased cashcomponent
*Non-Japan Asia
Japan
Australasia
Total Asia Pacific
3%
3%
4%
2%
5%
6%
4%
6%
11%
3%
14%
11%
52%
22%
88%
33%
No, never had
No, never hadNo, cancelled
No, cancelled
Yes38%
Yes5%
JapanAustralasia
59%55% 36%
7%
* Statistically different from past years, possibly due to the inclusion of Korea and India.
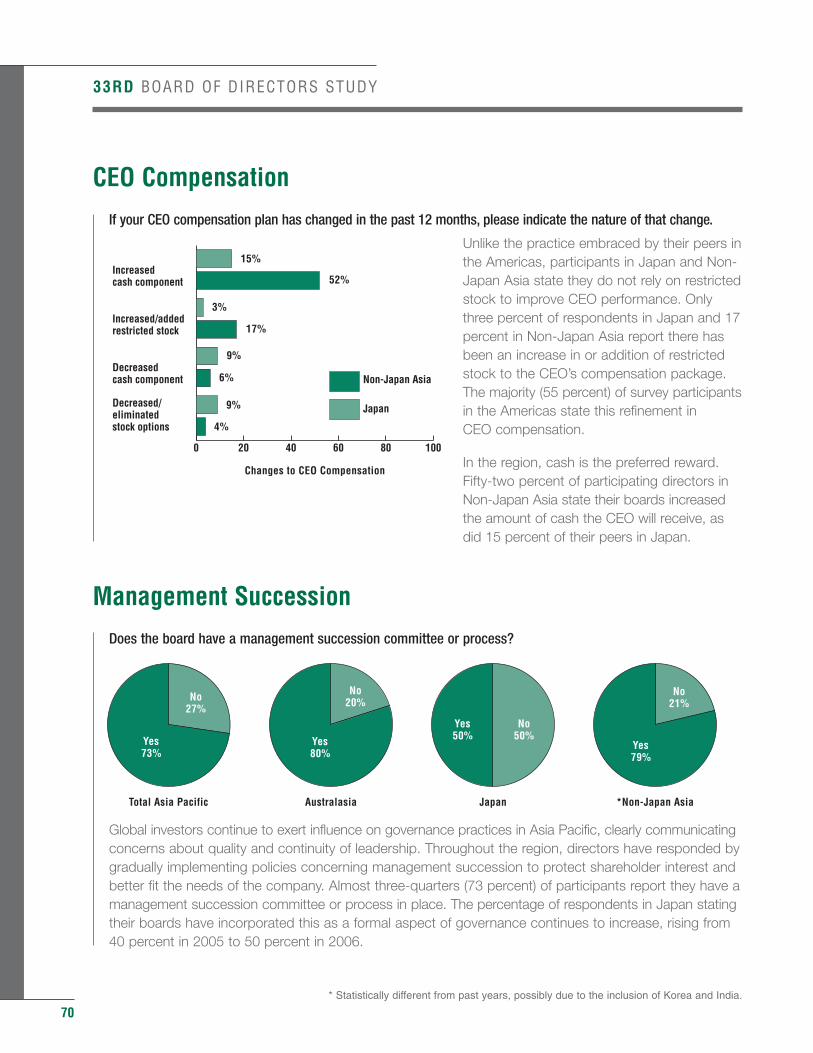
70
CEO Compensation
If your CEO compensation plan has changed in the past 12 months, please indicate the nature of that change.
Unlike the practice embraced by their peers inthe Americas, participants in Japan and Non-Japan Asia state they do not rely on restrictedstock to improve CEO performance. Onlythree percent of respondents in Japan and 17percent in Non-Japan Asia report there hasbeen an increase in or addition of restrictedstock to the CEO’s compensation package.The majority (55 percent) of survey participantsin the Americas state this refinement in CEO compensation.
In the region, cash is the preferred reward.Fifty-two percent of participating directors inNon-Japan Asia state their boards increasedthe amount of cash the CEO will receive, asdid 15 percent of their peers in Japan.
Management Succession
Does the board have a management succession committee or process?
Global investors continue to exert influence on governance practices in Asia Pacific, clearly communicatingconcerns about quality and continuity of leadership. Throughout the region, directors have responded by gradually implementing policies concerning management succession to protect shareholder interest and better fit the needs of the company. Almost three-quarters (73 percent) of participants report they have a management succession committee or process in place. The percentage of respondents in Japan statingtheir boards have incorporated this as a formal aspect of governance continues to increase, rising from 40 percent in 2005 to 50 percent in 2006.
33RD BOARD OF DIRECTORS STUDY
No21%
No50%
No20%No
27%
Yes79%
Yes50%Yes
80%Yes73%
*Non-Japan AsiaJapanAustralasiaTotal Asia Pacific
0 20 40 60 80 100
Non-Japan Asia
JapanDecreased/eliminatedstock options
Decreasedcash component
Increased/addedrestricted stock
Increasedcash component
4%
9%
6%
Changes to CEO Compensation
9%
17%
3%
52%
15%
* Statistically different from past years, possibly due to the inclusion of Korea and India.
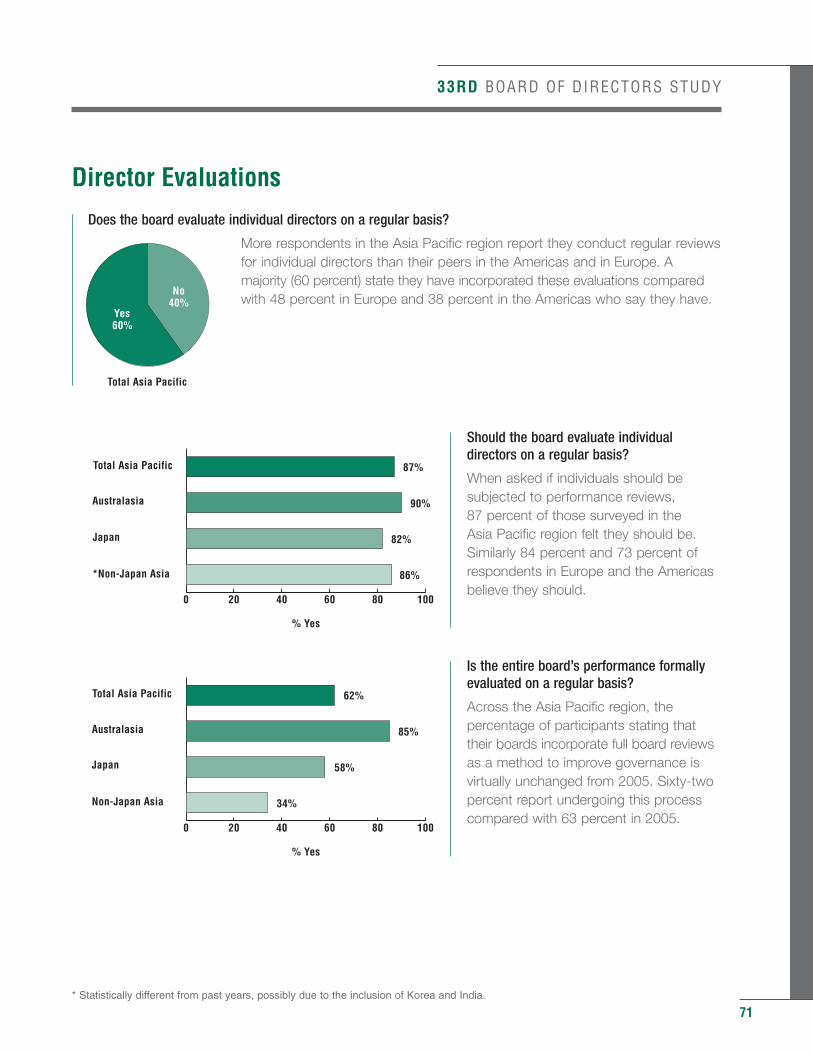
33RD BOARD OF DIRECTORS STUDY
Director Evaluations
Does the board evaluate individual directors on a regular basis?
More respondents in the Asia Pacific region report they conduct regular reviewsfor individual directors than their peers in the Americas and in Europe. Amajority (60 percent) state they have incorporated these evaluations comparedwith 48 percent in Europe and 38 percent in the Americas who say they have.
Should the board evaluate individualdirectors on a regular basis?
When asked if individuals should besubjected to performance reviews, 87 percent of those surveyed in the Asia Pacific region felt they should be. Similarly 84 percent and 73 percent ofrespondents in Europe and the Americasbelieve they should.
Is the entire board’s performance formallyevaluated on a regular basis?
Across the Asia Pacific region, thepercentage of participants stating thattheir boards incorporate full board reviewsas a method to improve governance isvirtually unchanged from 2005. Sixty-twopercent report undergoing this processcompared with 63 percent in 2005.
71
No40%
Yes60%
Total Asia Pacific
0 20 40 60 80 100
Non-Japan Asia
Japan
Australasia
Total Asia Pacific
% Yes
85%
58%
62%
34%
0 20 40 60 80 100
*Non-Japan Asia
Japan
Australasia
Total Asia Pacific
% Yes
90%
82%
87%
86%
* Statistically different from past years, possibly due to the inclusion of Korea and India.
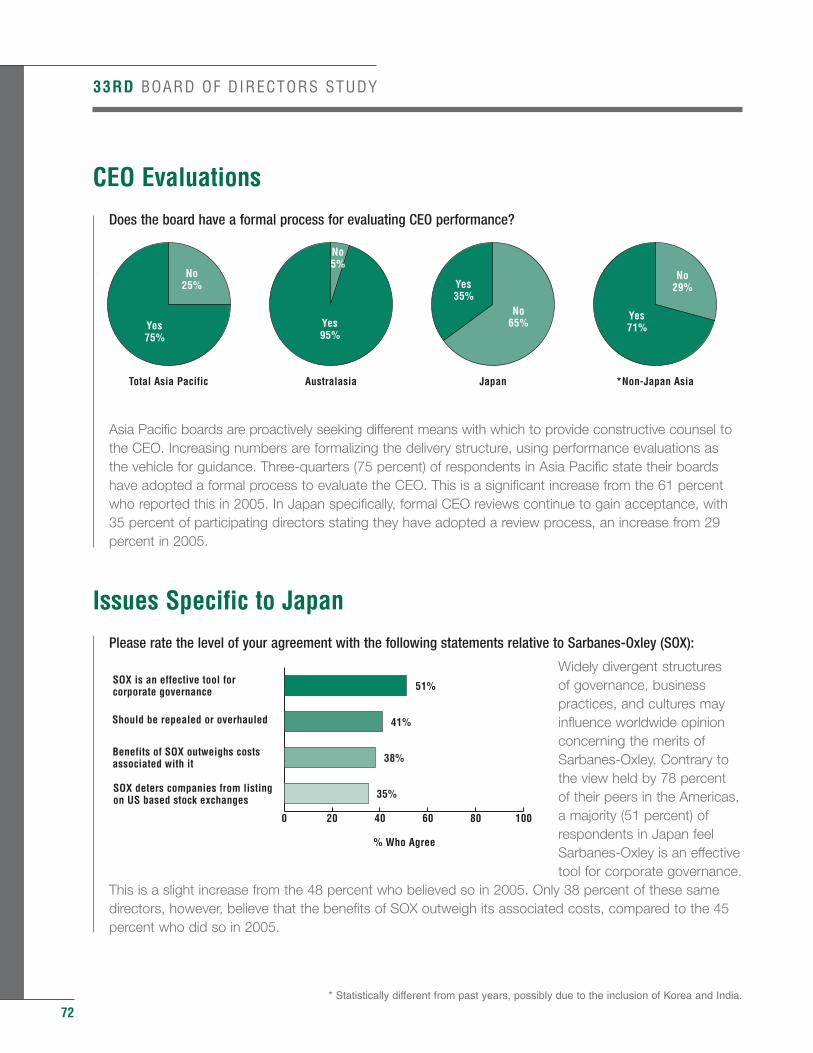
72
CEO Evaluations
Does the board have a formal process for evaluating CEO performance?
Asia Pacific boards are proactively seeking different means with which to provide constructive counsel to the CEO. Increasing numbers are formalizing the delivery structure, using performance evaluations as the vehicle for guidance. Three-quarters (75 percent) of respondents in Asia Pacific state their boards have adopted a formal process to evaluate the CEO. This is a significant increase from the 61 percent who reported this in 2005. In Japan specifically, formal CEO reviews continue to gain acceptance, with 35 percent of participating directors stating they have adopted a review process, an increase from 29 percent in 2005.
Issues Specific to Japan
Please rate the level of your agreement with the following statements relative to Sarbanes-Oxley (SOX):
Widely divergent structures of governance, businesspractices, and cultures mayinfluence worldwide opinionconcerning the merits ofSarbanes-Oxley. Contrary tothe view held by 78 percent of their peers in the Americas,a majority (51 percent) ofrespondents in Japan feelSarbanes-Oxley is an effective tool for corporate governance.
This is a slight increase from the 48 percent who believed so in 2005. Only 38 percent of these same directors, however, believe that the benefits of SOX outweigh its associated costs, compared to the 45 percent who did so in 2005.
33RD BOARD OF DIRECTORS STUDY
No29%
No65%
No5%
No25%
Yes71%
Yes35%
Yes95%
Yes75%
*Non-Japan AsiaJapanAustralasiaTotal Asia Pacific
0 20 40 60 80 100
SOX deters companies from listingon US based stock exchanges
Benefits of SOX outweighs costsassociated with it
Should be repealed or overhauled
SOX is an effective tool forcorporate governance
% Who Agree
41%
38%
51%
35%
* Statistically different from past years, possibly due to the inclusion of Korea and India.
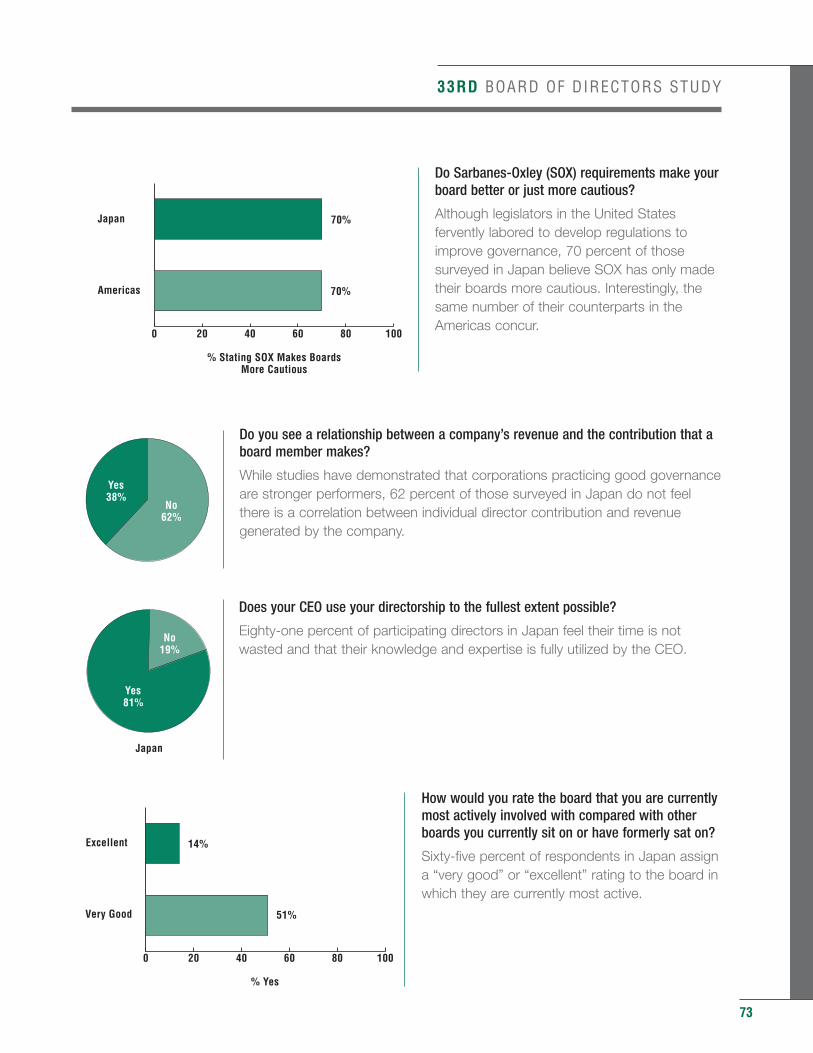
33RD BOARD OF DIRECTORS STUDY
Do Sarbanes-Oxley (SOX) requirements make yourboard better or just more cautious?
Although legislators in the United Statesfervently labored to develop regulations toimprove governance, 70 percent of thosesurveyed in Japan believe SOX has only madetheir boards more cautious. Interestingly, thesame number of their counterparts in theAmericas concur.
Do you see a relationship between a company’s revenue and the contribution that aboard member makes?
While studies have demonstrated that corporations practicing good governanceare stronger performers, 62 percent of those surveyed in Japan do not feelthere is a correlation between individual director contribution and revenuegenerated by the company.
Does your CEO use your directorship to the fullest extent possible?
Eighty-one percent of participating directors in Japan feel their time is notwasted and that their knowledge and expertise is fully utilized by the CEO.
How would you rate the board that you are currentlymost actively involved with compared with otherboards you currently sit on or have formerly sat on?
Sixty-five percent of respondents in Japan assigna “very good” or “excellent” rating to the board inwhich they are currently most active.
73
No62%
Yes38%
0 20 40 60 80 100
Americas
Japan
% Stating SOX Makes BoardsMore Cautious
70%
70%
0 20 40 60 80 100
Very Good
Excellent
% Yes
14%
51%
Yes74%
Yes81%
No26%
No19%
Non-Japan AsiaJapan
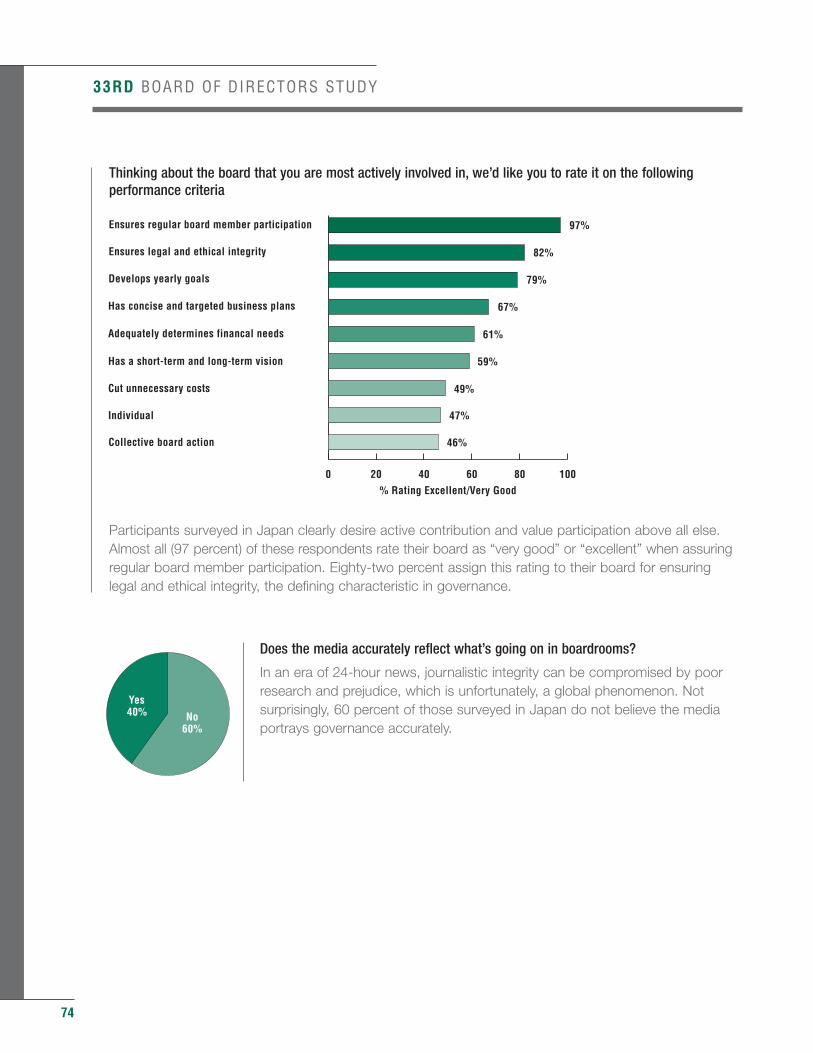
74
Thinking about the board that you are most actively involved in, we’d like you to rate it on the following performance criteria
Participants surveyed in Japan clearly desire active contribution and value participation above all else. Almost all (97 percent) of these respondents rate their board as “very good” or “excellent” when assuring regular board member participation. Eighty-two percent assign this rating to their board for ensuring legal and ethical integrity, the defining characteristic in governance.
Does the media accurately reflect what’s going on in boardrooms?
In an era of 24-hour news, journalistic integrity can be compromised by poorresearch and prejudice, which is unfortunately, a global phenomenon. Notsurprisingly, 60 percent of those surveyed in Japan do not believe the mediaportrays governance accurately.
33RD BOARD OF DIRECTORS STUDY
0 20 40 60 80 100
Collective board action
Individual
Cut unnecessary costs
Has a short-term and long-term vision
Adequately determines financal needs
Has concise and targeted business plans
Develops yearly goals
Ensures legal and ethical integrity
Ensures regular board member participation
% Rating Excellent/Very Good
82%
67%
97%
59%
61%
79%
49%
46%
47%
No60%
Yes40%
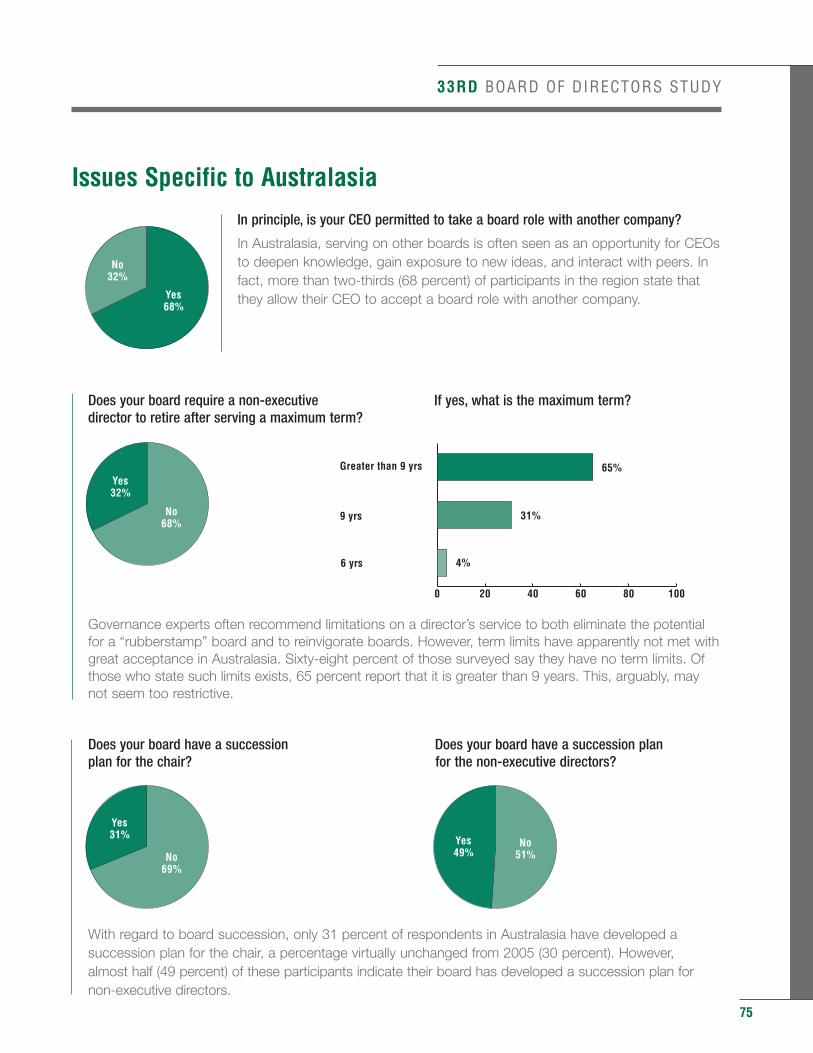
33RD BOARD OF DIRECTORS STUDY
Issues Specific to Australasia
In principle, is your CEO permitted to take a board role with another company?
In Australasia, serving on other boards is often seen as an opportunity for CEOsto deepen knowledge, gain exposure to new ideas, and interact with peers. Infact, more than two-thirds (68 percent) of participants in the region state thatthey allow their CEO to accept a board role with another company.
Does your board require a non-executive If yes, what is the maximum term? director to retire after serving a maximum term?
Governance experts often recommend limitations on a director’s service to both eliminate the potential for a “rubberstamp” board and to reinvigorate boards. However, term limits have apparently not met with great acceptance in Australasia. Sixty-eight percent of those surveyed say they have no term limits. Of those who state such limits exists, 65 percent report that it is greater than 9 years. This, arguably, may not seem too restrictive.
Does your board have a succession Does your board have a succession planplan for the chair? for the non-executive directors?
With regard to board succession, only 31 percent of respondents in Australasia have developed a succession plan for the chair, a percentage virtually unchanged from 2005 (30 percent). However, almost half (49 percent) of these participants indicate their board has developed a succession plan for non-executive directors.
75
No32%
Yes68%
No69%
Yes31%
No51%
Yes49%
No68%
Yes32%
0 20 40 60 80 100
6 yrs
9 yrs
Greater than 9 yrs
31%
65%
4%
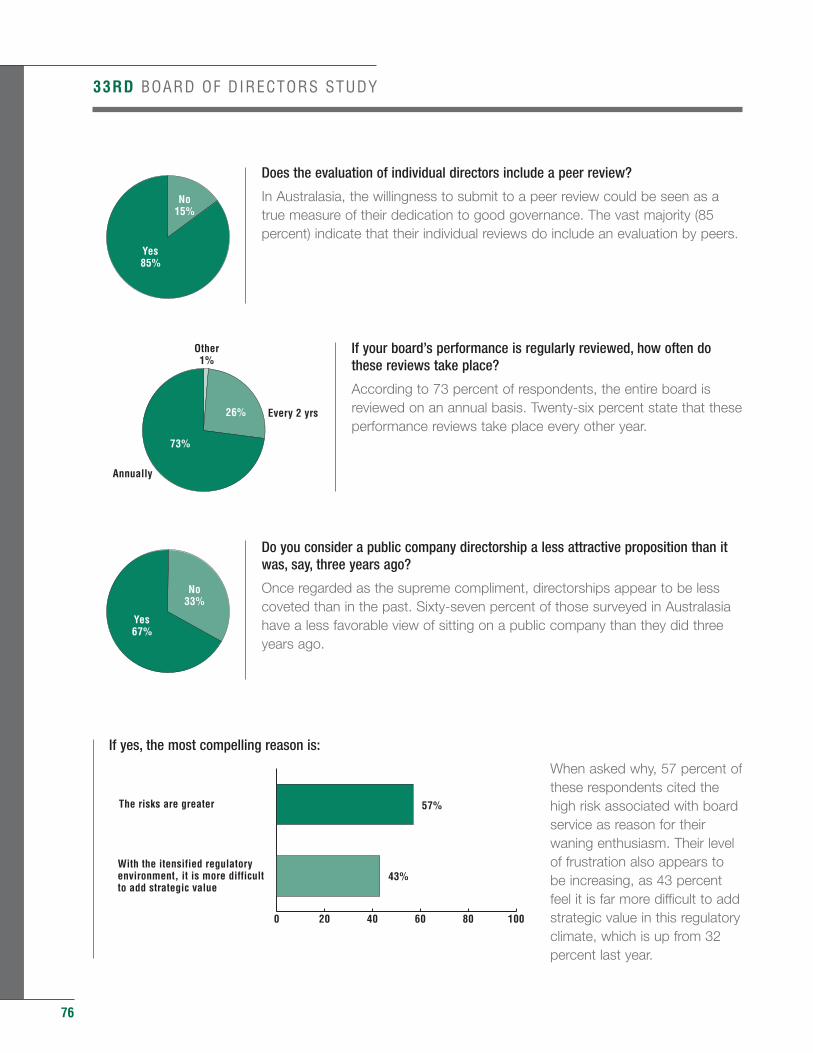
76
Does the evaluation of individual directors include a peer review?
In Australasia, the willingness to submit to a peer review could be seen as atrue measure of their dedication to good governance. The vast majority (85percent) indicate that their individual reviews do include an evaluation by peers.
If your board’s performance is regularly reviewed, how often dothese reviews take place?
According to 73 percent of respondents, the entire board isreviewed on an annual basis. Twenty-six percent state that theseperformance reviews take place every other year.
Do you consider a public company directorship a less attractive proposition than itwas, say, three years ago?
Once regarded as the supreme compliment, directorships appear to be lesscoveted than in the past. Sixty-seven percent of those surveyed in Australasiahave a less favorable view of sitting on a public company than they did threeyears ago.
If yes, the most compelling reason is:
When asked why, 57 percent ofthese respondents cited thehigh risk associated with boardservice as reason for theirwaning enthusiasm. Their levelof frustration also appears tobe increasing, as 43 percentfeel it is far more difficult to addstrategic value in this regulatoryclimate, which is up from 32percent last year.
33RD BOARD OF DIRECTORS STUDY
No15%
Yes85%
26%
73%
Annually
Other1%
Every 2 yrs
No33%
Yes67%
0 20 40 60 80 100
With the itensified regulatoryenvironment, it is more difficultto add strategic value
The risks are greater 57%
43%
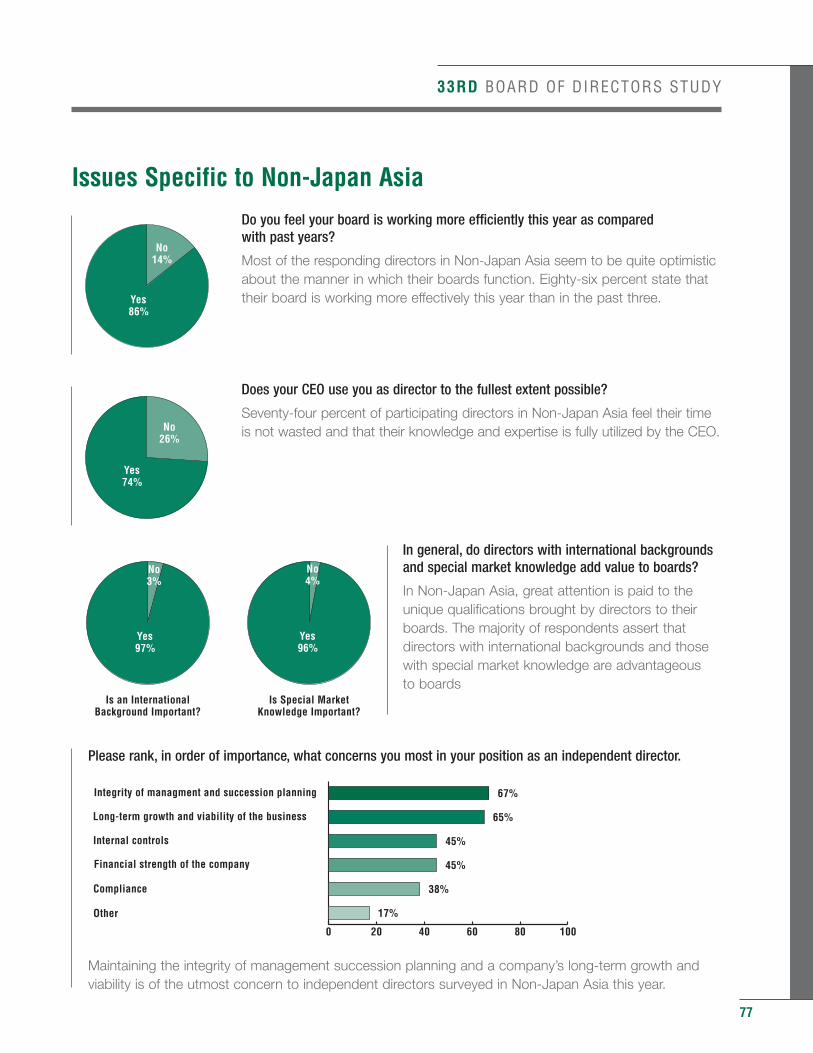
33RD BOARD OF DIRECTORS STUDY
Issues Specific to Non-Japan Asia
Do you feel your board is working more efficiently this year as compared with past years?
Most of the responding directors in Non-Japan Asia seem to be quite optimisticabout the manner in which their boards function. Eighty-six percent state thattheir board is working more effectively this year than in the past three.
Does your CEO use you as director to the fullest extent possible?
Seventy-four percent of participating directors in Non-Japan Asia feel their timeis not wasted and that their knowledge and expertise is fully utilized by the CEO.
In general, do directors with international backgroundsand special market knowledge add value to boards?
In Non-Japan Asia, great attention is paid to theunique qualifications brought by directors to theirboards. The majority of respondents assert thatdirectors with international backgrounds and thosewith special market knowledge are advantageous to boards
Please rank, in order of importance, what concerns you most in your position as an independent director.
Maintaining the integrity of management succession planning and a company’s long-term growth and viability is of the utmost concern to independent directors surveyed in Non-Japan Asia this year.
77
No14%
Yes86%
No26%
Yes74%
No4%
No3%
Yes96%
Yes97%
Is Special MarketKnowledge Important?
Is an InternationalBackground Important?
0 20 40 60 80 100
Other
Compliance
Financial strength of the company
Internal controls
Long-term growth and viability of the business
Integrity of managment and succession planning
65%
45%
67%
45%
38%
17%
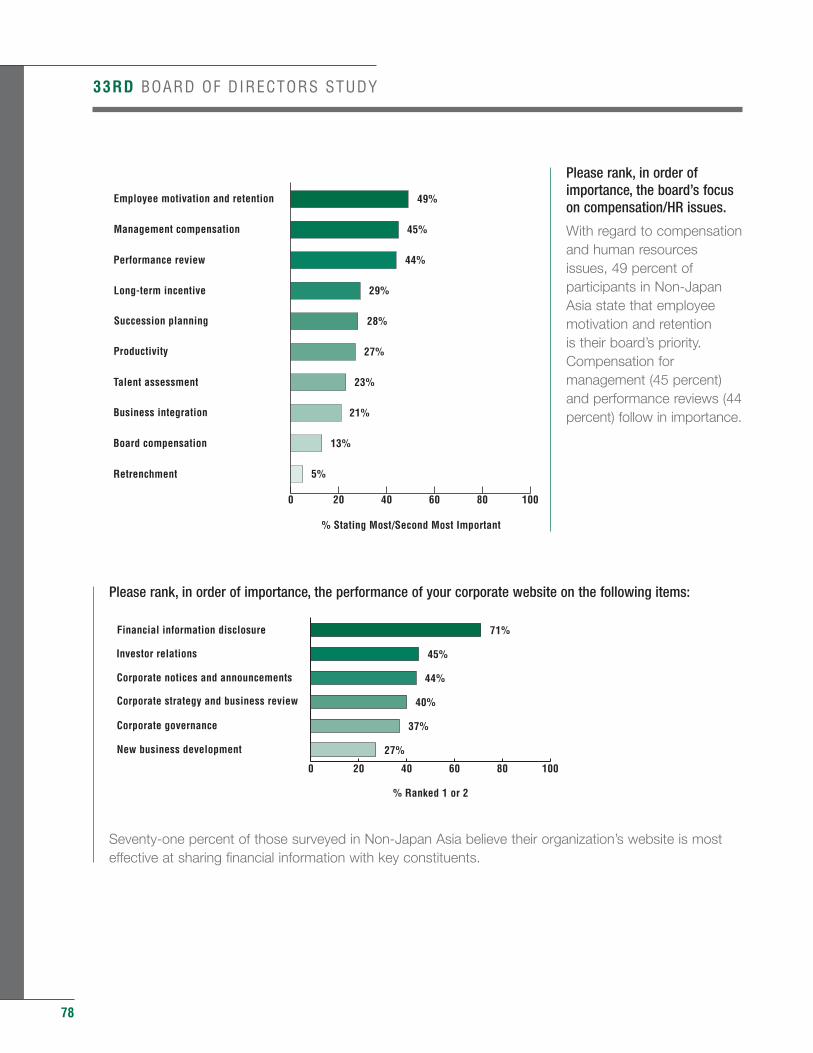
78
Please rank, in order ofimportance, the board’s focuson compensation/HR issues.
With regard to compensationand human resourcesissues, 49 percent ofparticipants in Non-JapanAsia state that employeemotivation and retention is their board’s priority.Compensation formanagement (45 percent)and performance reviews (44percent) follow in importance.
Please rank, in order of importance, the performance of your corporate website on the following items:
Seventy-one percent of those surveyed in Non-Japan Asia believe their organization’s website is most effective at sharing financial information with key constituents.
33RD BOARD OF DIRECTORS STUDY
0 20 40 60 80 100
Retrenchment
Board compensation
Business integration
Talent assessment
Productivity
Succession planning
Long-term incentive
Performance review
Management compensation
Employee motivation and retention
% Stating Most/Second Most Important
45%
29%
49%
27%
28%
44%
23%
13%
21%
5%
0 20 40 60 80 100
New business development
Corporate governance
Corporate strategy and business review
Corporate notices and announcements
Investor relations
Financial information disclosure
% Ranked 1 or 2
45%
44%
71%
40%
37%
27%
33RD BOARD OF DIRECTORS STUDY
79
ConclusionWhen the Hewlett-Packard’s boardroom saga unfolded in September 2006, many dismissed it as anothertale of egos colliding and unchecked paranoia. To identify and stop the source of press leaks, the board’schair employed an outside consultant, who obtained the personal phone records of all company directors.The method used, pretexting, is legally questionable and a prominent director resigned in outrage.
Such a break between the two was inevitable; the invasion of privacy merely the final straw. The two main“characters” in the drama seemed to operate in parallel universes.
In this context, one could easily conclude that differing viewpoints, experience, and background are the realculprits. Yet, such a simplistic pronouncement would veil the real story: the consequences of a boardlacking a culture of shared values and focus.
Dedicated directors are not satisfied with merely building a board. A board is a community, requiring sharedpurpose, guidelines, and direction. To function optimally, members must contribute as much as individualexperiences and talents allow, and consider what best benefits the the board. Only then can the extendedcommunity, the organization and its constituencies, derive the maximum governance benefit.
For directors, the level of participation and satisfaction are inextricably linked. The Cluster findings fromthose surveyed in the Americas show that only seven percent of those serving on “Least DemandingBoards” are extremely satisfied compared with the 25 percent of peers on “More Demanding Boards.”Similarly, those with the least amount of involvement have the greatest worry about their primary charge asfiduciaries, the long-term viability of the company. Almost one-third (32 percent) of “Least DemandingBoard” members cite this as their major concern, compared with 21 percent of their peers serving on“More Demanding Boards.”
Developing yearly goals, having concise and targeted business plans, and possessing a short-and longterm vision are secondary drivers of success for respondents sitting on European boards. Directorsembrace this level of participation, striving to execute duties to the best of their abilities. In evaluating theperformance of their boards, of these three criteria, two-thirds of European respondents give their board an“excellent” or “very good” rating.
Involvement via significant experiences also deepens the awareness of a director’s far-reaching influence.Only 21 percent of the Americas respondents serving on “Least Demanding Boards,” see a relationshipbetween their company’s revenue and the contributions a board member can make. The majority of “MoreDemanding Board” members (51 percent) and “Single-Focused Board” members (52 percent) believe theiractions influence the revenue stream.
Clearly, it is imperative that boards draw the most from their directors by harnessing the power ofpersonality, intellectual capital, and the present individual leadership abilities. Many boards use individualreviews as a means to enhance the quality of contribution and interaction, a practice endorsed by the vastmajority of directors worldwide. This exercise, which can include a peer review, facilitates the swiftassimilation of directors new to board service, a phenomenon becoming more commonplace.
In addition, a degree of compatibility is essential; blind support is not. Exceptional director candidates arerealistic about their abilities to engage fully in governance and compromising their integrity is not an option.
80
A significant number of respondents state they have refused a directorship because they did not agree withcompany policies. Many also state they did not want the additional responsibilities, perhaps because ofexisting leadership commitments.
This year’s responses suggest that governance is entering a new era, one where strategy will be the focusrather than the implementation of oversight mandates. Contributions will continue to improve as directorsrefine their abilities to work together in committees and with the full board. And, stronger leadership and acohesive board will only strengthen corporate performance, resulting in attainment of their primary goal:better protection of shareholders.
Data IntegrityKorn/Ferry International retained Data Development Worldwide, LLC (or DDW), a leading marketing researchfirm based in New York, for survey preparation and data analysis, providing continuity of methodology for this global study. The firm uses state-of-the-art techniques in data collection, statistical analysis, anddata visualization.
DDW assures the integrity and validity of the data in this study. Survey results are presented with a +/- 3.5percent margin of error at a 95 percent confidence level. The firm considers the directors surveyed andtheir responses to be sufficiently representative of the entire population in order to draw conclusions aboutthis group. Korn/Ferry is grateful to DDW for their participation in this important study.
About Korn/Ferry InternationalKorn/Ferry International (NYSE: KFY), with more than 70 offices in 40 countries, is a premier global providerof talent management solutions. Based in Los Angeles, the firm delivers an array of solutions that helpclients to identify, deploy, develop, retain and reward their talent.
For more information on the Korn/Ferry International family of companies, visit www.kornferry.com.
About the Global Board Services PracticeSince 1972, Korn/Ferry International has been a premier provider of director recruiting and corporategovernance consulting. We understand the difficulties of assembling an effective, knowledgeable andcohesive board of directors prepared to meet growing demands for greater accountability and moreeffective board performance. The shortage of experienced directors, the tightening of governance policiesand the desire on the part of corporations to diversify their boards have made the identification andrecruiting of top-flight talent more challenging than ever.
We have a dedicated team of global professionals whose sole focus is recruiting for boards of directors forclients worldwide and whose depth and expertise on matters of corporate governance are unparalleled.
To purchase additional copies of this Study, please e-mail the Global Marketing Department [email protected]
33RD BOARD OF DIRECTORS STUDY
33RD BOARD OF DIRECTORS STUDY
The AmericasCanadaJean-Claude LauzonMontreal514-397-9655
Kevin McBurneyVancouver604-684-1834
Jeffrey RosinToronto416-365-1841
Bob SuttonCalgary403-269-3277
MexicoHoracio McCoyMexico City52-55-5201-5400
South AmericaSergio AverbachSao Paulo5511-3708-2222
United StatesJoe GriesedieckSan Francisco415-956-1834
Charles H. KingNew York212-687-1834
Caroline NahasLos Angeles310-552-1834
Asia PacificAustralasiaGary ReidySydney612-9006-3400
Suzanne WilliamsSydney612-9006-3400
Annika StreeflandWellington64-4-460-490
Non-Japan AsiaAndrew TsuiHong Kong852-2971-2700
JapanSakie FukushimaTokyo81-3-3560-140
EuropeFranceDidier VuchotParis33-1-45-61-8686
GermanyFriedrich-Wilhelm Graf von PfeilFrankfurt/Koenigstein49-69-71670-0
The NetherlandsJan VetAmsterdam31-20-799-9000
ScandinaviaTorbjørn GjelstadOslo47-22-82-39-00
SwitzerlandThierry De PreuxGeneva41-22-310-2071
United KingdomMina GouranLondon44-207-312-3100
GLOBAL BOARD SERVICES PRACTICERepresentatives by Region/Country
GlobalStephen P. MaderBoston617-345-0200