Embed Size (px)
Citation preview
session1Know Your Numbers!Body Composition Testing & Interpretation
“Be Your Best”
Know Your Numbers!Information Regarding Your Upcoming Testing
Bioelectrical Impedance Analysis or BioImpedance Analysis (BIA) is a method of assessing your “body composition” – the measurement of body fat in relation to lean body mass. It is an integral part of a health and nutrition assessment.
Why is Body Composition Important to My Health?
Research has shown that body composition is directly related to health. A normal balance of body fat is associated with good health and longevity. Excess fat in relation to lean body mass, a condition known as altered body composition, can greatly increase your risks to cardiovascular disease, diabetes and more. BIA fosters early detection of an improper balance in your body composition, which allows for earlier intervention and prevention. BIA also provides a measurement of fluid and body mass that can be a critical assessment tool for your current state of health.BIA also serves to measure your progress as you work to improve you health. Improving your BIA measurement, or maintaining a health BIA measurement, can help keep your body functioning properly for healthy aging and reduced risk to illness. With your BIA results, we can recommend a personalized dietary plan, nutritional supplements, and exercise to help you support optimal health and well-being for a lifetime.
How Does a BIA Work?
BIA is much more sophisticated than your bathroom scale, but just as painless – and almost as quick. BIA is a simple procedure that can be performed right in our office in a matter of minutes with the help of a sophisticated, computerized analysis. This analyzer “calculates” your tissue and fluid compartments – using an imperceptible electrical current passed through pads placed on one hand and food as you lie comfortably clothes on an exam table. In just minutes, we’ll have very accurate measurements to help create an effective, personalized program to improve your health status.
“Be Your Best”
William and Mary Lifechange Wellness Program | By n1Health | 2015
Know Your Numbers!Information Regarding Your Upcoming Testing Cont’d...
Preparing for Your BioImpedance Testing?
Bioimpedance analysis (BIA) is a reliable method of measuring body composition, including percentage of body fat and lean body mass. Measurements are taken with a bioimpedance analyzer, which uses electrodes similar to EKG electrodes. The machine passes a harmless, ultra-low level electrical current through the body. Lean tissue, which is over 70% water, is a good conductor of electrical current. Fatty tissue – low in water, in not. Thus the resistance to the flow of electrical current measured by the analyzer can be used to calculate body composition.
Participants will need to remove their right shoe and sock/stocking. The electrodes are placed on the right hand and foot while the individual is lying down on an exam table. This whole procedure takes only a few minutes and a computer prints out the results. Optimal body fat ranges from 12%-25% for women, and 5%-20% for men.
Over 100 independent studies, conducted by researchers over the past 20 years, have demonstrated that BioImpedance analysis can provide an accurate and clinically useful assessment of body composition. However, for the most accurate results, the following guidelines should be followed:
1. Do not eat for 4 hours prior to testing.2. Do not exercise for 12 hours prior to testing.3. Do not consume alcohol for 24 hours prior to testing.4. Drink at least 1 quart of water one hour before your test (you may void as needed).5. Do not drink caffeine the day of your test.6. Do not wear stockings/pantyhose.
“Be Your Best”
William and Mary Lifechange Wellness Program | By n1Health | 2015
Know Your Numbers!Congratulations on completing your BioImpedance Analysis (BIA)!
Be sure to join us on April 10th at 8:30 am - 10:30 am at your scheduled time for a group presentation and discussion with Shilpa P. Saxena, M.D. where you’ll learn to interpret your bioimpedance results. Specifically, you’ll learn about your muscle, bone and fat masses, total fluid and fluid distribution, inflammatory markers, basal metabolic rate, body mass index, hydration status, muscle-to-bone ratio as a health marker, as well as cellular health markers.
In her presentation, Dr. Saxena shares the overview of what these markers signify, offers suggestions for enhancing body composition and provides educational materials for you to take with you to get started or continue your health journey.
Be sure to bring this BIA result with you on April 10th at 8:30 am – 10:30 am for a LifeChanging presentation.
“Be Your Best”
William and Mary Lifechange Wellness Program | By n1Health | 2015
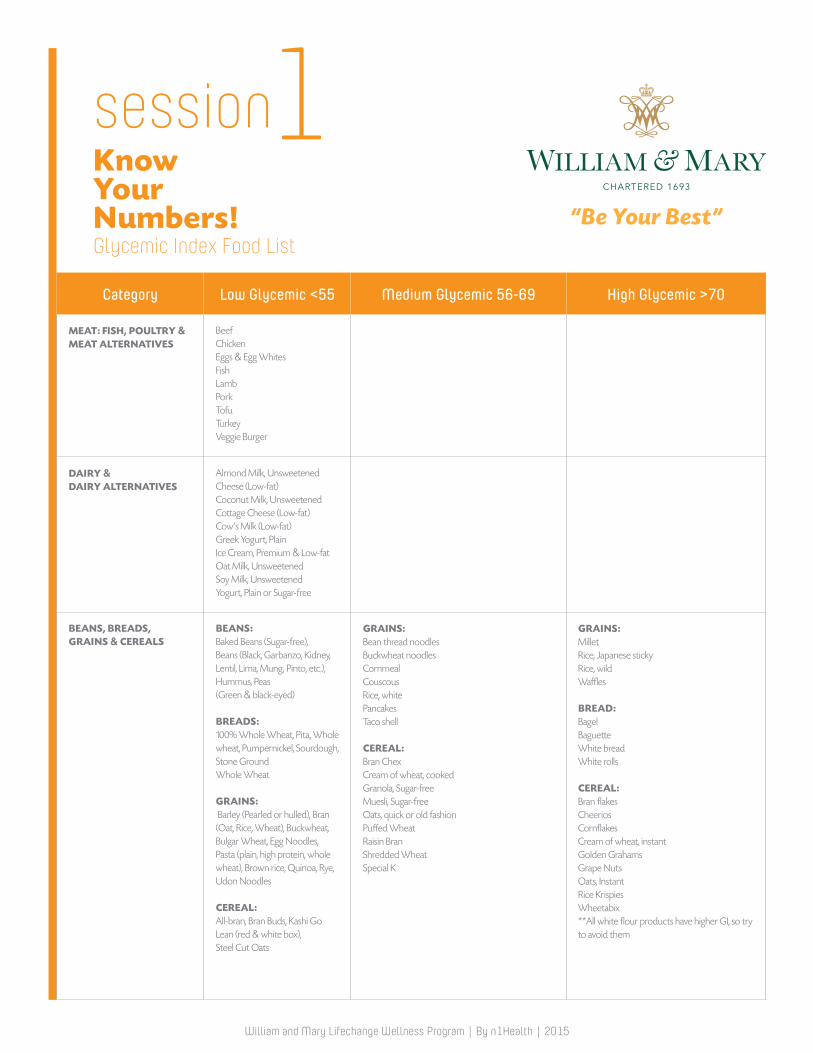
session1Know Your Numbers!Glycemic Index Food List
Category Low Glycemic <55 Medium Glycemic 56-69 High Glycemic >70
MEAT: FISH, POULTRY & MEAT ALTERNATIVES
BeefChickenEggs & Egg WhitesFishLambPorkTofuTurkeyVeggie Burger
DAIRY & DAIRY ALTERNATIVES
Almond Milk, UnsweetenedCheese (Low-fat)Coconut Milk, UnsweetenedCottage Cheese (Low-fat)Cow’s Milk (Low-fat)Greek Yogurt, PlainIce Cream, Premium & Low-fatOat Milk, UnsweetenedSoy Milk, UnsweetenedYogurt, Plain or Sugar-free
BEANS, BREADS, GRAINS & CEREALS
BEANS: Baked Beans (Sugar-free), Beans (Black, Garbanzo, Kidney, Lentil, Lima, Mung, Pinto, etc.), Hummus, Peas (Green & black-eyed)
BREADS: 100% Whole Wheat, Pita, Whole wheat, Pumpernickel, Sourdough, Stone Ground Whole Wheat
GRAINS: Barley (Pearled or hulled), Bran (Oat, Rice, Wheat), Buckwheat, Bulgar Wheat, Egg Noodles, Pasta (plain, high protein, whole wheat), Brown rice, Quinoa, Rye, Udon Noodles
CEREAL: All-bran, Bran Buds, Kashi Go Lean (red & white box), Steel Cut Oats
GRAINS:Bean thread noodlesBuckwheat noodlesCornmealCouscousRice, whitePancakesTaco shell
CEREAL:Bran ChexCream of wheat, cookedGranola, Sugar-freeMuesli, Sugar-freeOats, quick or old fashionPuffed WheatRaisin BranShredded WheatSpecial K
GRAINS:MilletRice, Japanese stickyRice, wildWaffles
BREAD:BagelBaguetteWhite breadWhite rolls
CEREAL:Bran flakesCheeriosCornflakesCream of wheat, instantGolden GrahamsGrape NutsOats, InstantRice KrispiesWheetabix**All white flour products have higher GI, so try to avoid them
William and Mary Lifechange Wellness Program | By n1Health | 2015
“Be Your Best”
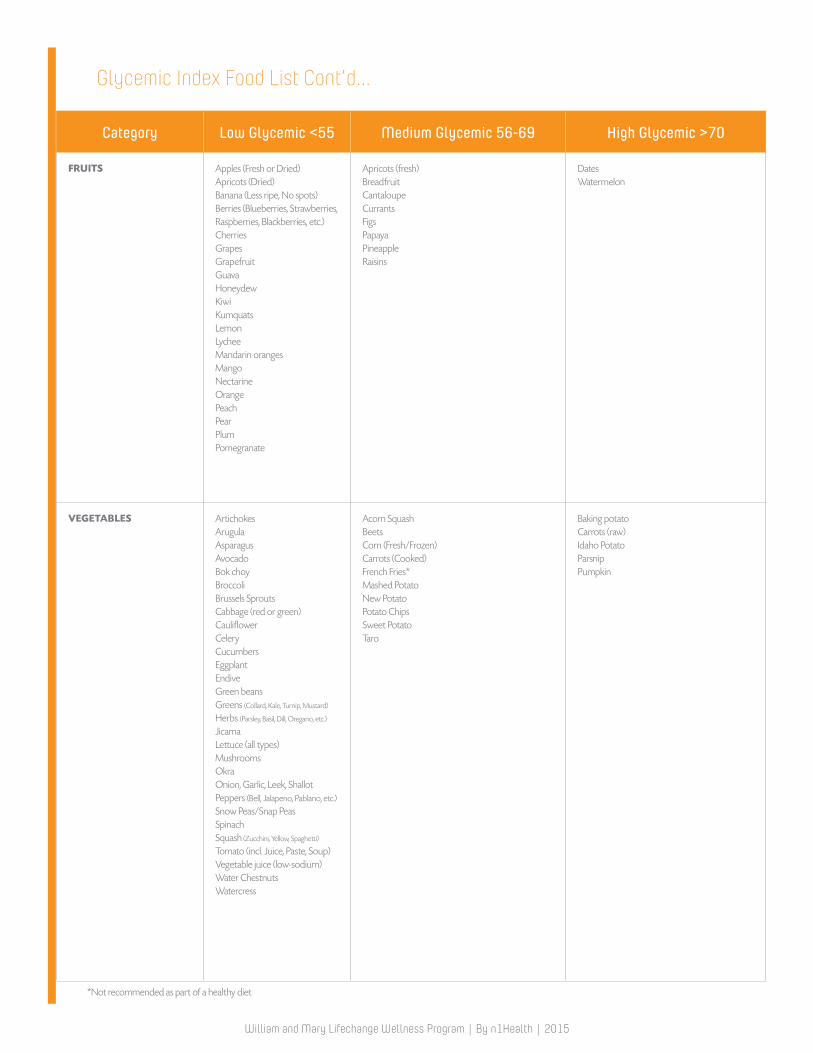
Glycemic Index Food List Cont’d...
Category Low Glycemic <55 Medium Glycemic 56-69 High Glycemic >70
FRUITS Apples (Fresh or Dried)Apricots (Dried)Banana (Less ripe, No spots)Berries (Blueberries, Strawberries, Raspberries, Blackberries, etc.)CherriesGrapesGrapefruitGuavaHoneydewKiwiKumquatsLemonLycheeMandarin orangesMangoNectarineOrangePeachPearPlumPomegranate
Apricots (fresh)BreadfruitCantaloupeCurrantsFigsPapayaPineappleRaisins
DatesWatermelon
VEGETABLES ArtichokesArugulaAsparagusAvocadoBok choyBroccoliBrussels SproutsCabbage (red or green)CauliflowerCeleryCucumbersEggplantEndiveGreen beansGreens (Collard, Kale, Turnip, Mustard)
Herbs (Parsley, Basil, Dill, Oregano, etc.)
JicamaLettuce (all types)MushroomsOkraOnion, Garlic, Leek, ShallotPeppers (Bell, Jalapeno, Pablano, etc.)
Snow Peas/Snap PeasSpinachSquash (Zucchini, Yellow, Spaghetti)
Tomato (incl. Juice, Paste, Soup)Vegetable juice (low-sodium)Water ChestnutsWatercress
Acorn SquashBeetsCorn (Fresh/Frozen)Carrots (Cooked)French Fries*Mashed PotatoNew PotatoPotato ChipsSweet PotatoTaro
Baking potatoCarrots (raw)Idaho PotatoParsnipPumpkin
*Not recommended as part of a healthy diet
William and Mary Lifechange Wellness Program | By n1Health | 2015
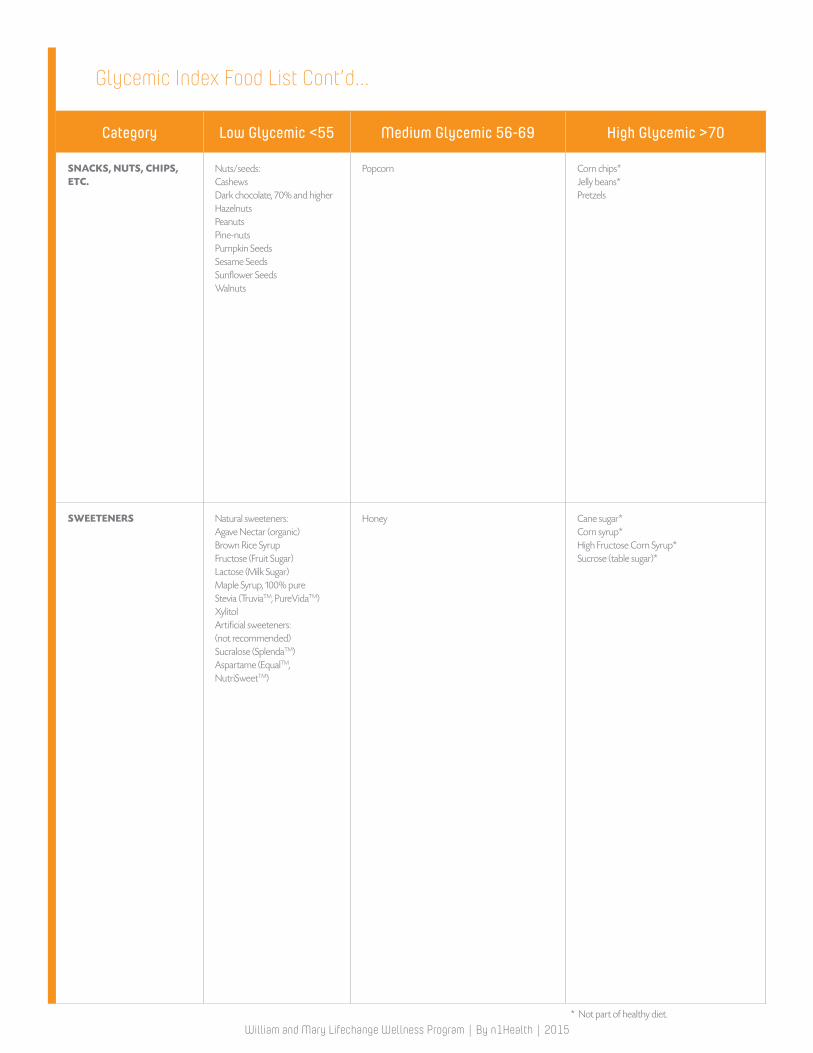
Glycemic Index Food List Cont’d...
Category Low Glycemic <55 Medium Glycemic 56-69 High Glycemic >70
SNACKS, NUTS, CHIPS, ETC.
Nuts/seeds:CashewsDark chocolate, 70% and higherHazelnutsPeanutsPine-nutsPumpkin SeedsSesame SeedsSunflower SeedsWalnuts
Popcorn Corn chips*Jelly beans*Pretzels
SWEETENERS Natural sweeteners:Agave Nectar (organic)Brown Rice SyrupFructose (Fruit Sugar)Lactose (Milk Sugar)Maple Syrup, 100% pureStevia (TruviaTM, PureVidaTM)XylitolArtificial sweeteners:(not recommended)Sucralose (SplendaTM)Aspartame (EqualTM, NutriSweetTM)
Honey Cane sugar*Corn syrup*High Fructose Corn Syrup*Sucrose (table sugar)*
* Not part of healthy diet.
William and Mary Lifechange Wellness Program | By n1Health | 2015
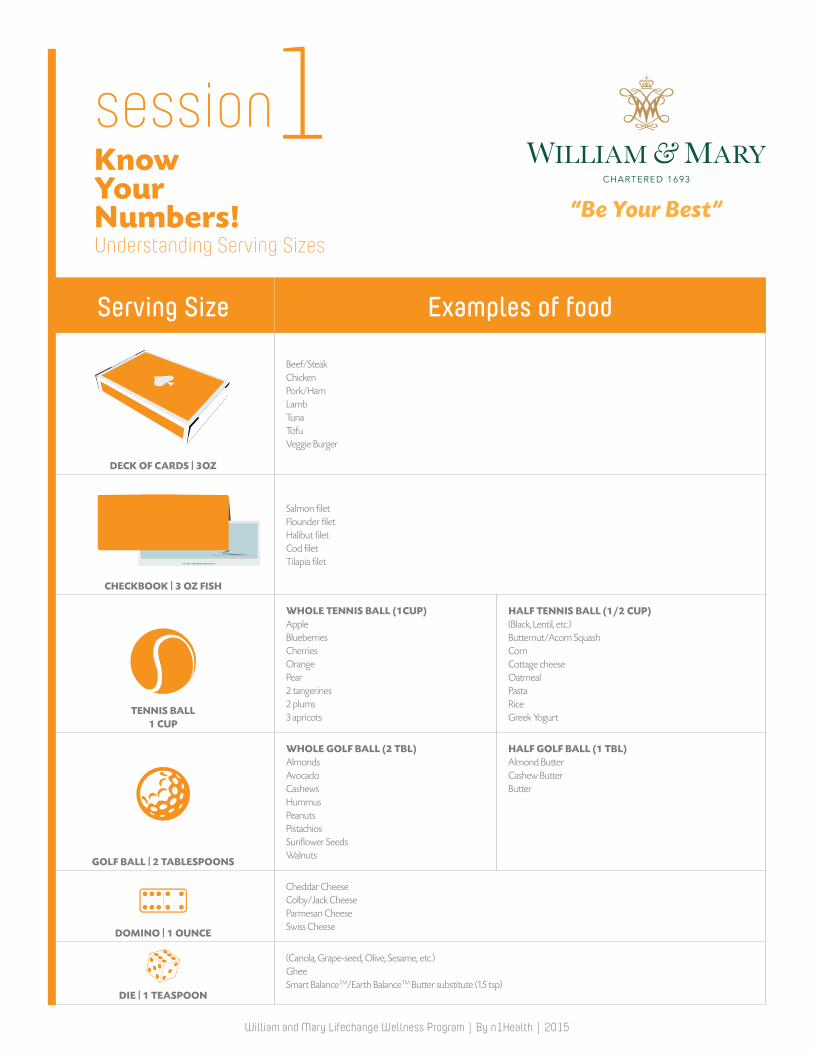
session1Know Your Numbers!Understanding Serving Sizes
Serving Size Examples of food
DECK OF CARDS | 3OZ
Beef/SteakChickenPork/HamLambTunaTofuVeggie Burger
CHECKBOOK | 3 OZ FISH
Salmon filetFlounder filetHalibut filetCod filetTilapia filet
TENNIS BALL1 CUP
WHOLE TENNIS BALL (1CUP)AppleBlueberriesCherriesOrangePear2 tangerines2 plums3 apricots
HALF TENNIS BALL (1/2 CUP)(Black, Lentil, etc.)Butternut/Acorn SquashCornCottage cheeseOatmealPastaRiceGreek Yogurt
GOLF BALL | 2 TABLESPOONS
WHOLE GOLF BALL (2 TBL)AlmondsAvocadoCashewsHummusPeanutsPistachiosSunflower SeedsWalnuts
HALF GOLF BALL (1 TBL)Almond ButterCashew ButterButter
DOMINO | 1 OUNCE
Cheddar CheeseColby/Jack CheeseParmesan CheeseSwiss Cheese
DIE | 1 TEASPOON
(Canola, Grape-seed, Olive, Sesame, etc.) GheeSmart BalanceTM/Earth BalanceTM Butter substitute (1.5 tsp)
012345: 09346463:0000245677
FOR
William and Mary Lifechange Wellness Program | By n1Health | 2015
“Be Your Best”