Embed Size (px)
Citation preview
Portland State University Portland State University
PDXScholar PDXScholar
Physics Faculty Publications and Presentations Physics
2-2014
Bioelectrical Impedance Analysis as a Laboratory Bioelectrical Impedance Analysis as a Laboratory
Activity: At the Interface of Physics and the Body Activity: At the Interface of Physics and the Body
Elliot Mylott Portland State University
Ellynne Marie Kutschera Portland State University
Ralf Widenhorn Portland State University
Follow this and additional works at: https://pdxscholar.library.pdx.edu/phy_fac
Part of the Physics Commons, and the Science and Mathematics Education Commons
Let us know how access to this document benefits you.
Citation Details Citation Details Mylott, E., Kutschera, E., & Widenhorn, R. (2014). Bioelectrical impedance analysis as a laboratory activity: At the interface of physics and the body. American Journal Of Physics, 82(5), 521-528.
This Article is brought to you for free and open access. It has been accepted for inclusion in Physics Faculty Publications and Presentations by an authorized administrator of PDXScholar. Please contact us if we can make this document more accessible: [email protected].
Bioelectrical impedance analysis as a laboratory activity: At theinterface of physics and the body
Elliot Mylott,a) Ellynne Kutschera, and Ralf WidenhornDepartment of Physics, Portland State University, Portland, Oregon 97207
(Received 22 August 2013; accepted 7 February 2014)
We present a novel laboratory activity on RC circuits aimed at introductory physics students in
life-science majors. The activity teaches principles of RC circuits by connecting ac-circuit concepts
to bioelectrical impedance analysis (BIA) using a custom-designed educational BIA device. The
activity shows how a BIA device works and how current, voltage, and impedance measurements
relate to bioelectrical characteristics of the human body. From this, useful observations can be
made including body water, fat-free mass, and body fat percentage. The laboratory is engaging to
pre-health and life-science students, as well as engineering students who are given the opportunity
to observe electrical components and construction of a commonly used biomedical device.
Electrical concepts investigated include alternating current, electrical potential, resistance,
capacitance, impedance, frequency, phase shift, device design, and the use of such topics in
biomedical analysis. VC 2014 American Association of Physics Teachers.
[http://dx.doi.org/10.1119/1.4866276]
I. INTRODUCTION
Drawing from the fields of physics, biology, medicine,physiology, and fitness sciences, we have developed aphysics laboratory activity that introduces RC electric cir-cuits in conjunction with Bioelectric Impedance Analysis(BIA). Designed to demonstrate the electrical properties ofthe human body as relevant to medical science, the activityinvolves students in the dual analysis of both physical and bi-ological systems. The concepts of impedance and frequencydependence are explained using RC circuits and a cellular-level analysis of body tissue. Experiments are performed onboth of these systems using an educational BIA device wecustom designed for this activity.
In the BIA laboratory described here, students acquaintthemselves with the concepts of resistance, capacitance, im-pedance, and phase shifts in ac circuits. Circuits are con-structed to emulate the bioelectrical behavior of the body,and an educational BIA device is used for measurements.Students are invited to make measurements on their ownbodies using the same device. The data are compared withempirical fits for impedance and body composition, whichstudents use to calculate their own body fat percentage andfat-free mass. These estimates are compared with measure-ments taken by a commercially available BIA device.Single- and multiple-frequency analyses are performed,exposing students to different circuit models of the body inan active exploration of ac circuitry. Finally, student atti-tudes were surveyed before and after the laboratory and theresults are discussed in the final section of this paper.
II. BACKGROUND
A. Motivation
Although students in science courses have widely varyinggoals, a foundational knowledge of science and its practicalapplication are necessary for those entering science, technol-ogy, engineering, and mathematics (STEM) disciplines. Forlife-science and pre-health students, traditional physicscourses often do not meet the objectives of an adequate phys-ical sciences background for their intended fields.1,2 We note
that the new guidelines of the Medical College AdmissionTest (MCAT) stress interdisciplinary learning, and goals setforth by the American Association of Medical Colleges forfuture physicians include not only having a solid backgroundin science but also to be prepared to use new advancementsin science for ongoing professional development.3 Suchgoals are enhanced with better foundational understanding ofthe physics behind the wide array of medical technologiescurrently employed. A working knowledge base is neededfor the continuous process of improving and applying tech-nologies in biomedical engineering.
This laboratory exercise enhances undergraduate prepara-tion for medical and all STEM fields by teaching physicsthrough the application of technology, which in this instanceis the use of electric circuit models for medical assessment.Algebra-based introductory physics courses can make use ofthis laboratory, although the subject matter is rich enough tochallenge more advanced undergraduate physics or biomedi-cal engineering majors. There has been an ongoing discus-sion concerning learning styles in students and theirrelevance to teaching methods.4 By giving students the op-portunity to measure their own body’s electrical impedanceusing BIA and participate in an active area of research, awider positive student response to learning is anticipated.One may look to popular models of learning styles to under-stand the importance of multiple types of learning activities.For example, the VARK model of learning differentiates theneeds of visual, aural, read/write, and kinesthetic learningstyles.5 Although the visual and read/write styles should al-ready be stimulated by the laboratory activity, kinestheticlearners will be more engaged with BIA measurements bytheir preference for activities requiring interacting with theenvironment. It has been suggested that fostering personallyrelevant activities in education results in increased learningoverall.6 Scientific “story making” that emphasizes the learn-er’s connection with a personal value system has been articu-lated in a new model for scientific learning.7 By directing astudent’s personal involvement in the laboratory exercises,our BIA laboratory works to create knowledge through con-nection. The BIA laboratory forms an extension from perso-nal experiences of BIA at a gym, as part of a fitness regime,
521 Am. J. Phys. 82 (5), May 2014 http://aapt.org/ajp VC 2014 American Association of Physics Teachers 521
as health analysis, or with the student’s opinions concerningthese issues.
B. Body composition
BIA exists at the interposition of body composition analy-sis and bioelectrical analysis. The study of body compositionis already very interdisciplinary, involving mathematics,physics, chemistry, biology, nutrition science, and other dis-ciplines.8 Bioelectrical analysis surveys the electrical proper-ties of tissue and can be used to analyze body compositionmodels. While there are numerous methods to measure bodycomposition, many either suffer from having low accuracies(caliper tests), being difficult to perform (densitometry), orare potentially harmful (dual-energy x-ray absorptiometryDXA).8 BIA avoids some of these drawbacks by takingadvantage of the conductive properties of the human body.
One of the uses of BIA is to calculate the fat-free mass(FFM), or lean mass, of a person based on measurements ofthe electrical characteristics of the body and empirical data.There are two main electrical properties that characterize bodytissues, resistance and capacitance. Cell membranes conduct-ing an electrical current behave similar to capacitors.9,10 Dueto their ionic nature body fluids are good conductors, while fatcells are not.11 Bone is also considered a non-conductor undertypical BIA conditions.12 The resistive measurement of BIA,therefore, relates only to soft tissue hydration.
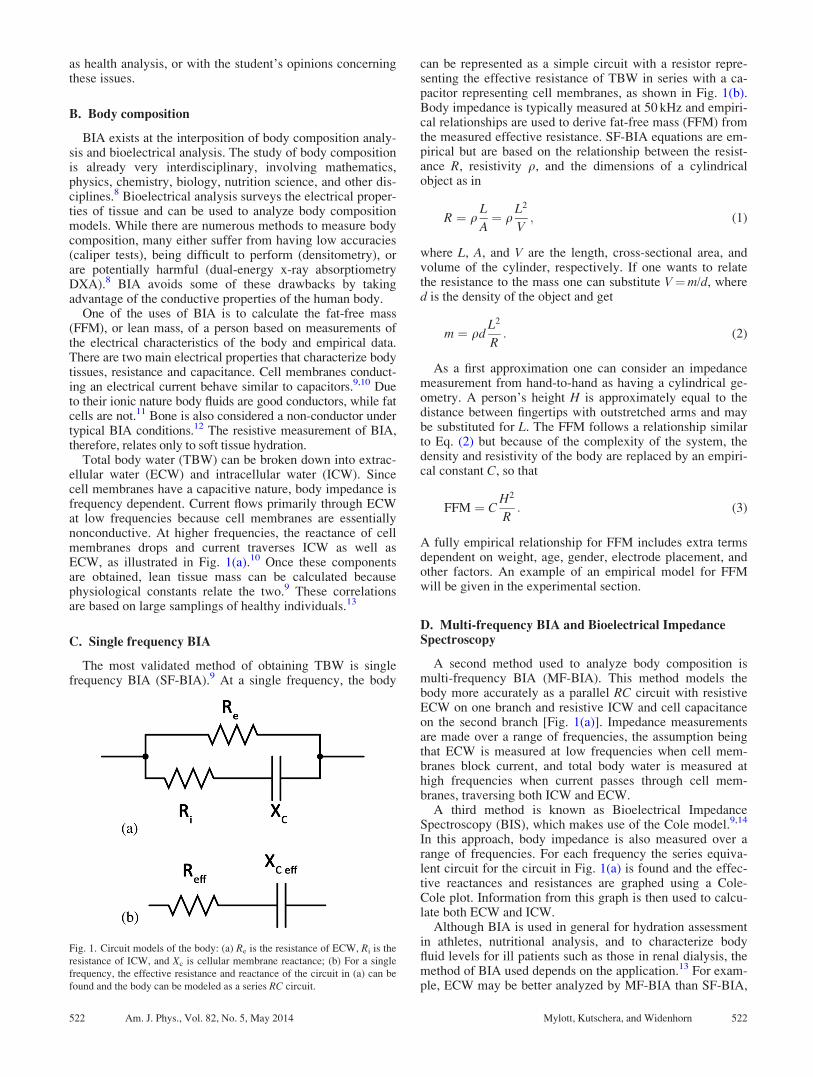
Total body water (TBW) can be broken down into extrac-ellular water (ECW) and intracellular water (ICW). Sincecell membranes have a capacitive nature, body impedance isfrequency dependent. Current flows primarily through ECWat low frequencies because cell membranes are essentiallynonconductive. At higher frequencies, the reactance of cellmembranes drops and current traverses ICW as well asECW, as illustrated in Fig. 1(a).10 Once these componentsare obtained, lean tissue mass can be calculated becausephysiological constants relate the two.9 These correlationsare based on large samplings of healthy individuals.13
C. Single frequency BIA
The most validated method of obtaining TBW is singlefrequency BIA (SF-BIA).9 At a single frequency, the body
can be represented as a simple circuit with a resistor repre-senting the effective resistance of TBW in series with a ca-pacitor representing cell membranes, as shown in Fig. 1(b).Body impedance is typically measured at 50 kHz and empiri-cal relationships are used to derive fat-free mass (FFM) fromthe measured effective resistance. SF-BIA equations are em-pirical but are based on the relationship between the resist-ance R, resistivity q, and the dimensions of a cylindricalobject as in
R ¼ qL
A¼ q
L2
V; (1)
where L, A, and V are the length, cross-sectional area, andvolume of the cylinder, respectively. If one wants to relatethe resistance to the mass one can substitute V¼m/d, whered is the density of the object and get
m ¼ qdL2
R: (2)
As a first approximation one can consider an impedancemeasurement from hand-to-hand as having a cylindrical ge-ometry. A person’s height H is approximately equal to thedistance between fingertips with outstretched arms and maybe substituted for L. The FFM follows a relationship similarto Eq. (2) but because of the complexity of the system, thedensity and resistivity of the body are replaced by an empiri-cal constant C, so that
FFM ¼ CH2
R: (3)
A fully empirical relationship for FFM includes extra termsdependent on weight, age, gender, electrode placement, andother factors. An example of an empirical model for FFMwill be given in the experimental section.
D. Multi-frequency BIA and Bioelectrical ImpedanceSpectroscopy
A second method used to analyze body composition ismulti-frequency BIA (MF-BIA). This method models thebody more accurately as a parallel RC circuit with resistiveECW on one branch and resistive ICW and cell capacitanceon the second branch [Fig. 1(a)]. Impedance measurementsare made over a range of frequencies, the assumption beingthat ECW is measured at low frequencies when cell mem-branes block current, and total body water is measured athigh frequencies when current passes through cell mem-branes, traversing both ICW and ECW.
A third method is known as Bioelectrical ImpedanceSpectroscopy (BIS), which makes use of the Cole model.9,14
In this approach, body impedance is also measured over arange of frequencies. For each frequency the series equiva-lent circuit for the circuit in Fig. 1(a) is found and the effec-tive reactances and resistances are graphed using a Cole-Cole plot. Information from this graph is then used to calcu-late both ECW and ICW.
Although BIA is used in general for hydration assessmentin athletes, nutritional analysis, and to characterize bodyfluid levels for ill patients such as those in renal dialysis, themethod of BIA used depends on the application.13 For exam-ple, ECW may be better analyzed by MF-BIA than SF-BIA,
Fig. 1. Circuit models of the body: (a) Re is the resistance of ECW, Ri is the
resistance of ICW, and Xc is cellular membrane reactance; (b) For a single
frequency, the effective resistance and reactance of the circuit in (a) can be
found and the body can be modeled as a series RC circuit.
522 Am. J. Phys., Vol. 82, No. 5, May 2014 Mylott, Kutschera, and Widenhorn 522
while the estimation of TBW has been shown to be betterwith MF-BIA than BIS for patients with particular illnesses.9
E. Current scientific understanding of BIA
The methods of BIA are not without their shortcomings.The calibration of BIA is accomplished using a standard ref-erence method such as Dual-energy X-ray Absorptiometry(DXA). Any errors associated with this method may bepropagated into empirical BIA fits.8 Although the assump-tion is made that current will pass through ICW only at highfrequencies, this is an idealization and is not entirely true.11
Furthermore, despite strong empirical correlations betweenbody impedance and body composition parameters, it is notthoroughly understood exactly why BIA works as accuratelyas it does.10 Rather than a drawback, however, we see this asan opportunity for laboratory students. When confrontedwith new frontiers in science that test the limits of theory,there is the possibility to engage in open-ended inquiry.While exploring well-understood circuit components, stu-dents can extend these concepts and explore a real worldproblem without clean and simple answers, more closelyresembling the experimental research of biomedical systems.
III. DESIGN OF THE EDUCATIONAL BIA DEVICE
BIA measurements are taken by injecting a small alternat-ing current into the body. By comparing the potential acrossthe body to one across a known reference resistor, it is possi-ble to determine the equivalent electrical components thatmodel the body. BIA devices for consumer use are fre-quently employed in fitness centers and integrated into somebathroom scales. Unlike most medical-grade equipment aconsumer BIA device is inexpensive;15 however, its internalfunctions represent a black box with proprietary algorithmsthat output a person’s body fat percentage (BF%) or FFM.On the other hand, standard voltage probes and data collec-tion systems used in undergraduate laboratories are notdesigned to measure the high frequencies used in BIA. Theuse of an oscilloscope would not only be difficult for manypre-health majors, it also would pose safety concerns whenleads from a wall-powered scope are connected to the body.To eliminate this risk and to explore the mechanism of howac current is used in BIA, we designed our own battery pow-ered educational BIA device, which is shown in Fig. 2.
While a typical consumer device operates at a fixed fre-quency of 50 kHz, the educational device allows for a vari-able frequency (20 Hz to 450 kHz) and the exploration ofboth BIS and MF-BIA. As part of the activity, students usean inexpensive frequency counter16 to measure the frequencysettings of the device. A safety requirement of BIA devicesis that the maximum current produced never exceeds800 lA.13 The educational BIA device outputs a constantcurrent amplitude of 100 lA. The total cost to build thedescribed educational BIA device is less than $75. Reference17 provides full specifications and circuit diagrams of thedevice.
The BIA device is based on the AD8302 Gain and PhaseDetector (Fig. 3), which can be used to find the impedanceand phase of an RC circuit18 and has already been shown towork in a BIA device.19 The Gain and Phase Detector takestwo sinusoidal signals as inputs and outputs two dc poten-tials, Vphase and Vmag. Here Vphase is proportional to the phaseshift Du between the inputs, and Vmag is proportional to the
logarithm of the ratio of the connected impedance Z to thereference resistance Rref. Thus, we have Vphase / Du andVmag / log10ðZ=RrefÞ. (See Ref. 18 for the full conversionformulas.)
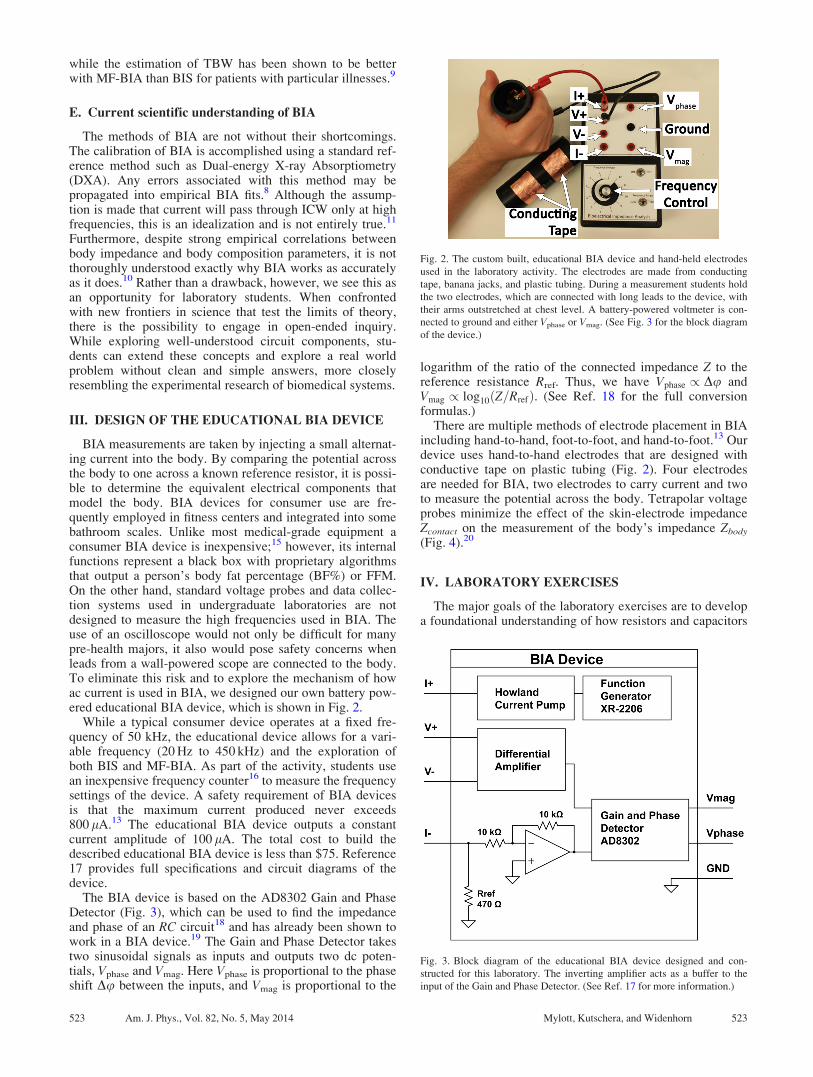
There are multiple methods of electrode placement in BIAincluding hand-to-hand, foot-to-foot, and hand-to-foot.13 Ourdevice uses hand-to-hand electrodes that are designed withconductive tape on plastic tubing (Fig. 2). Four electrodesare needed for BIA, two electrodes to carry current and twoto measure the potential across the body. Tetrapolar voltageprobes minimize the effect of the skin-electrode impedanceZcontact on the measurement of the body’s impedance Zbody
(Fig. 4).20
IV. LABORATORY EXERCISES
The major goals of the laboratory exercises are to developa foundational understanding of how resistors and capacitors
Fig. 2. The custom built, educational BIA device and hand-held electrodes
used in the laboratory activity. The electrodes are made from conducting
tape, banana jacks, and plastic tubing. During a measurement students hold
the two electrodes, which are connected with long leads to the device, with
their arms outstretched at chest level. A battery-powered voltmeter is con-
nected to ground and either Vphase or Vmag. (See Fig. 3 for the block diagram
of the device.)
Fig. 3. Block diagram of the educational BIA device designed and con-
structed for this laboratory. The inverting amplifier acts as a buffer to the
input of the Gain and Phase Detector. (See Ref. 17 for more information.)
523 Am. J. Phys., Vol. 82, No. 5, May 2014 Mylott, Kutschera, and Widenhorn 523
behave in ac circuits, to demonstrate how the body can bemodeled as an RC circuit, and to show how the electricalcharacteristics of the body are used to elicit physiological in-formation. Specifically, students explore the frequency de-pendence of resistance, reactance, impedance, and phaseangle in RC circuits using tools like phasor diagrams or, formore advanced students, complex analysis of impedances.These concepts are introduced and demonstrated with a se-ries RC circuit. The equations expressing impedance andphase angle for a series RC circuit with a resistor and capaci-
tor are given by Z ¼ffiffiffiffiffiffiffiffiffiffiffiffiffiffiffiffiffiR2 þ X2
C
qand tan u ¼ Xc=R, where Z
is impedance, R is resistance, XC is capacitive reactance, andu is phase angle. These equations can be solved for R and
XC, resulting in R ¼ffiffiffiffiffiffiffiffiffiffiffiffiffiffiffiffiffiffiffiffiffiffiffiffiffiffiffiffiffiffiffiZ2=ð1þ tan2uÞ
pand XC ¼ R tan u.
A. BIA for a simple RC circuit
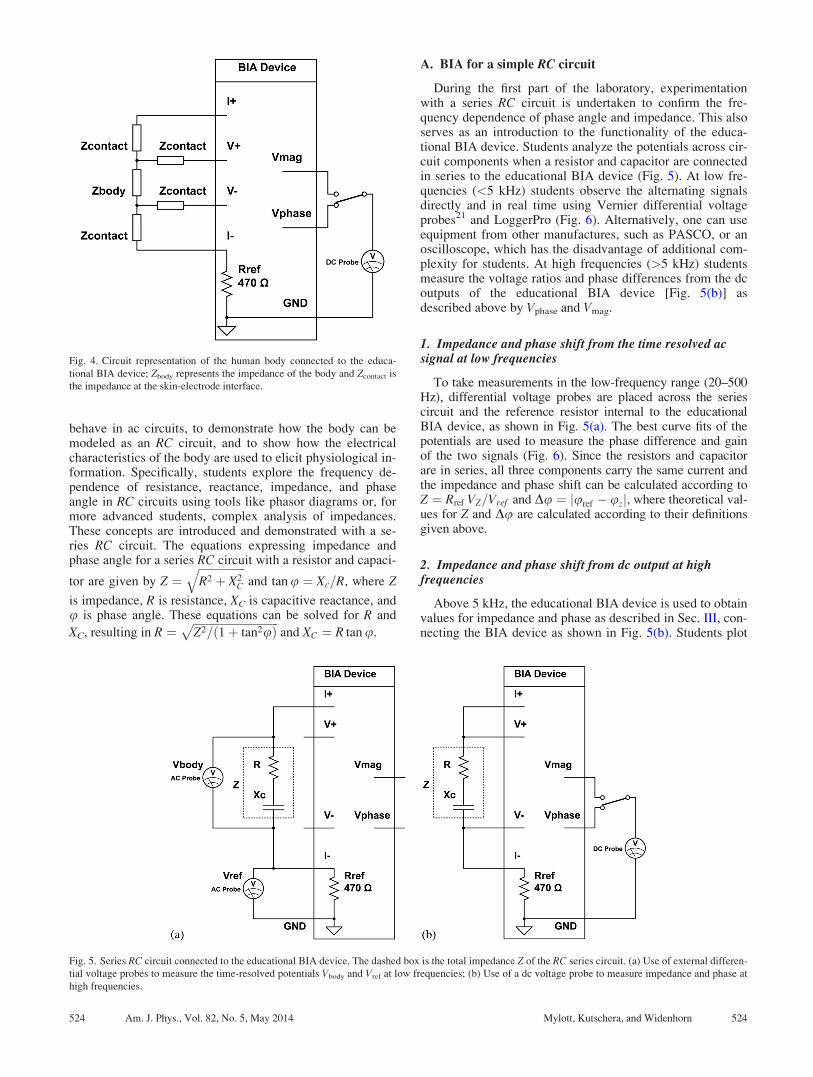
During the first part of the laboratory, experimentationwith a series RC circuit is undertaken to confirm the fre-quency dependence of phase angle and impedance. This alsoserves as an introduction to the functionality of the educa-tional BIA device. Students analyze the potentials across cir-cuit components when a resistor and capacitor are connectedin series to the educational BIA device (Fig. 5). At low fre-quencies (<5 kHz) students observe the alternating signalsdirectly and in real time using Vernier differential voltageprobes21 and LoggerPro (Fig. 6). Alternatively, one can useequipment from other manufactures, such as PASCO, or anoscilloscope, which has the disadvantage of additional com-plexity for students. At high frequencies (>5 kHz) studentsmeasure the voltage ratios and phase differences from the dcoutputs of the educational BIA device [Fig. 5(b)] asdescribed above by Vphase and Vmag.
1. Impedance and phase shift from the time resolved acsignal at low frequencies
To take measurements in the low-frequency range (20–500Hz), differential voltage probes are placed across the seriescircuit and the reference resistor internal to the educationalBIA device, as shown in Fig. 5(a). The best curve fits of thepotentials are used to measure the phase difference and gainof the two signals (Fig. 6). Since the resistors and capacitorare in series, all three components carry the same current andthe impedance and phase shift can be calculated according toZ ¼ Rref VZ=Vref and Du ¼ juref � uzj, where theoretical val-ues for Z and Du are calculated according to their definitionsgiven above.
2. Impedance and phase shift from dc output at highfrequencies
Above 5 kHz, the educational BIA device is used to obtainvalues for impedance and phase as described in Sec. III, con-necting the BIA device as shown in Fig. 5(b). Students plot
Fig. 4. Circuit representation of the human body connected to the educa-
tional BIA device; Zbody represents the impedance of the body and Zcontact is
the impedance at the skin-electrode interface.
Fig. 5. Series RC circuit connected to the educational BIA device. The dashed box is the total impedance Z of the RC series circuit. (a) Use of external differen-
tial voltage probes to measure the time-resolved potentials Vbody and Vref at low frequencies; (b) Use of a dc voltage probe to measure impedance and phase at
high frequencies.
524 Am. J. Phys., Vol. 82, No. 5, May 2014 Mylott, Kutschera, and Widenhorn 524
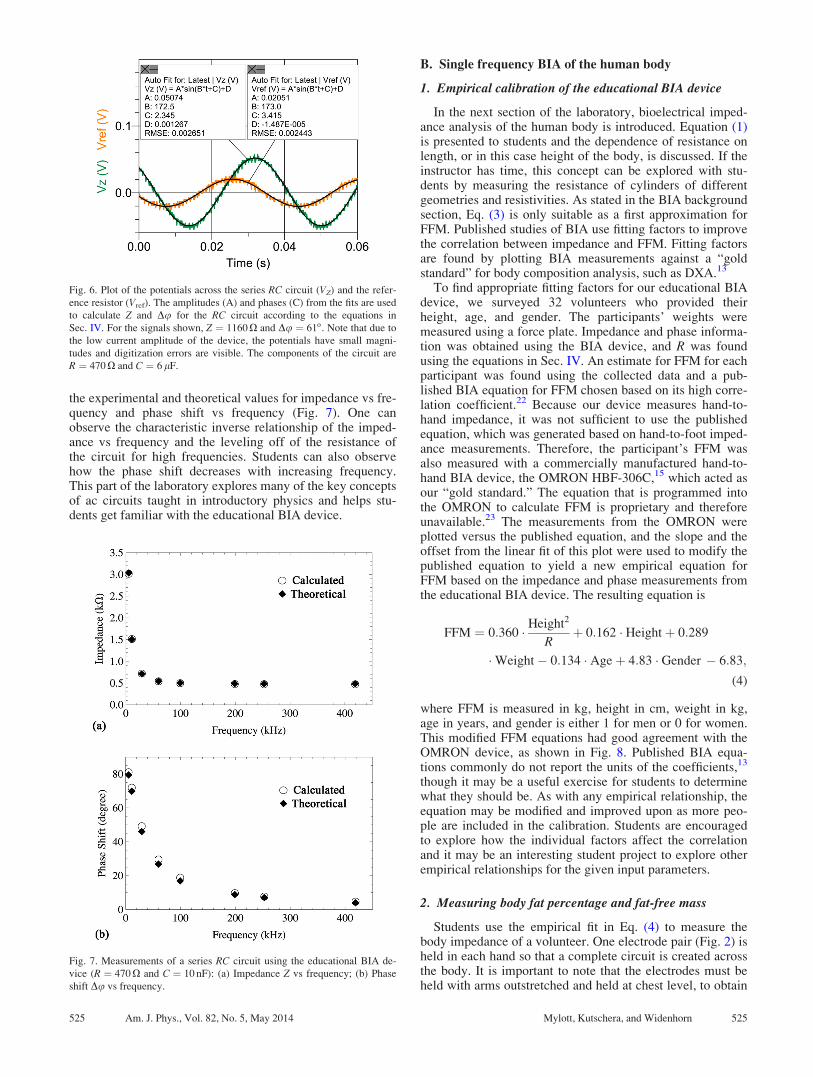
the experimental and theoretical values for impedance vs fre-quency and phase shift vs frequency (Fig. 7). One canobserve the characteristic inverse relationship of the imped-ance vs frequency and the leveling off of the resistance ofthe circuit for high frequencies. Students can also observehow the phase shift decreases with increasing frequency.This part of the laboratory explores many of the key conceptsof ac circuits taught in introductory physics and helps stu-dents get familiar with the educational BIA device.
B. Single frequency BIA of the human body
1. Empirical calibration of the educational BIA device
In the next section of the laboratory, bioelectrical imped-ance analysis of the human body is introduced. Equation (1)is presented to students and the dependence of resistance onlength, or in this case height of the body, is discussed. If theinstructor has time, this concept can be explored with stu-dents by measuring the resistance of cylinders of differentgeometries and resistivities. As stated in the BIA backgroundsection, Eq. (3) is only suitable as a first approximation forFFM. Published studies of BIA use fitting factors to improvethe correlation between impedance and FFM. Fitting factorsare found by plotting BIA measurements against a “goldstandard” for body composition analysis, such as DXA.13
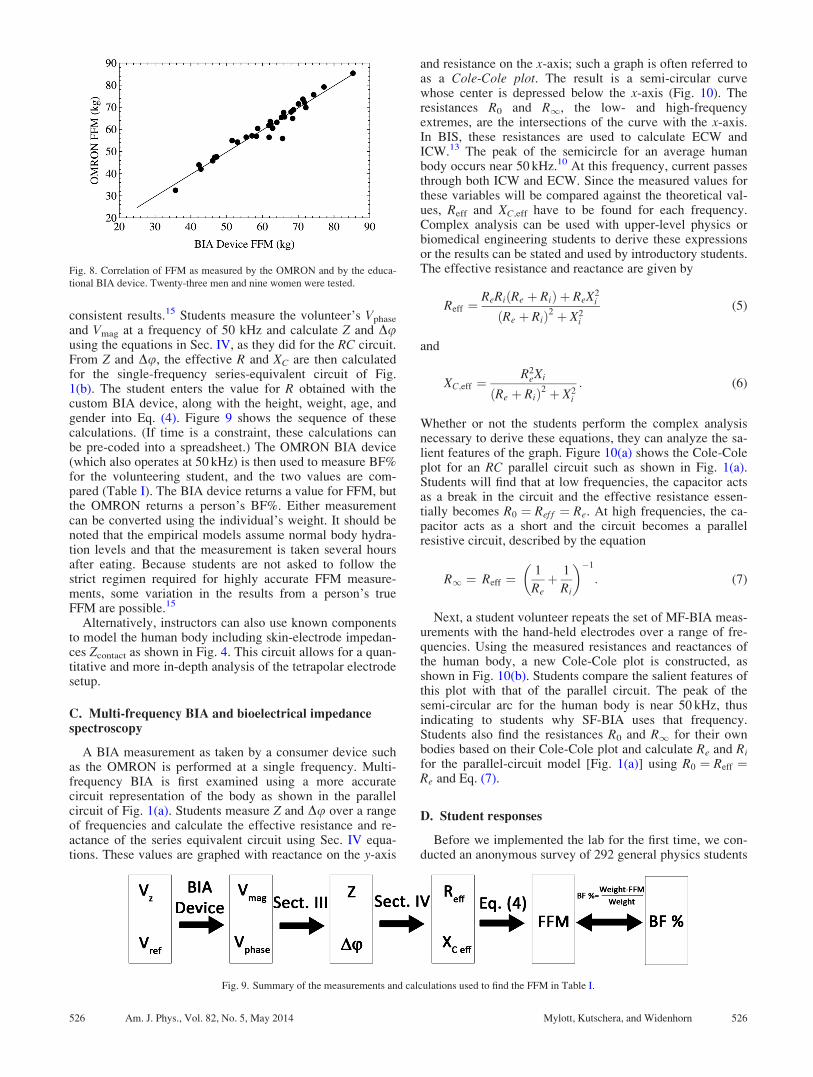
To find appropriate fitting factors for our educational BIAdevice, we surveyed 32 volunteers who provided theirheight, age, and gender. The participants’ weights weremeasured using a force plate. Impedance and phase informa-tion was obtained using the BIA device, and R was foundusing the equations in Sec. IV. An estimate for FFM for eachparticipant was found using the collected data and a pub-lished BIA equation for FFM chosen based on its high corre-lation coefficient.22 Because our device measures hand-to-hand impedance, it was not sufficient to use the publishedequation, which was generated based on hand-to-foot imped-ance measurements. Therefore, the participant’s FFM wasalso measured with a commercially manufactured hand-to-hand BIA device, the OMRON HBF-306C,15 which acted asour “gold standard.” The equation that is programmed intothe OMRON to calculate FFM is proprietary and thereforeunavailable.23 The measurements from the OMRON wereplotted versus the published equation, and the slope and theoffset from the linear fit of this plot were used to modify thepublished equation to yield a new empirical equation forFFM based on the impedance and phase measurements fromthe educational BIA device. The resulting equation is
FFM ¼ 0:360 � Height2
Rþ 0:162 � Heightþ 0:289
�Weight� 0:134 � Ageþ 4:83 � Gender � 6:83;
(4)
where FFM is measured in kg, height in cm, weight in kg,age in years, and gender is either 1 for men or 0 for women.This modified FFM equations had good agreement with theOMRON device, as shown in Fig. 8. Published BIA equa-tions commonly do not report the units of the coefficients,13
though it may be a useful exercise for students to determinewhat they should be. As with any empirical relationship, theequation may be modified and improved upon as more peo-ple are included in the calibration. Students are encouragedto explore how the individual factors affect the correlationand it may be an interesting student project to explore otherempirical relationships for the given input parameters.
2. Measuring body fat percentage and fat-free mass
Students use the empirical fit in Eq. (4) to measure thebody impedance of a volunteer. One electrode pair (Fig. 2) isheld in each hand so that a complete circuit is created acrossthe body. It is important to note that the electrodes must beheld with arms outstretched and held at chest level, to obtain
Fig. 7. Measurements of a series RC circuit using the educational BIA de-
vice (R ¼ 470 X and C ¼ 10 nF): (a) Impedance Z vs frequency; (b) Phase
shift Du vs frequency.
Fig. 6. Plot of the potentials across the series RC circuit (VZ) and the refer-
ence resistor (Vref). The amplitudes (A) and phases (C) from the fits are used
to calculate Z and Du for the RC circuit according to the equations in
Sec. IV. For the signals shown, Z ¼ 1160 X and Du ¼ 61o. Note that due to
the low current amplitude of the device, the potentials have small magni-
tudes and digitization errors are visible. The components of the circuit are
R ¼ 470 X and C ¼ 6 lF.
525 Am. J. Phys., Vol. 82, No. 5, May 2014 Mylott, Kutschera, and Widenhorn 525
consistent results.15 Students measure the volunteer’s Vphase
and Vmag at a frequency of 50 kHz and calculate Z and Duusing the equations in Sec. IV, as they did for the RC circuit.From Z and Du, the effective R and XC are then calculatedfor the single-frequency series-equivalent circuit of Fig.1(b). The student enters the value for R obtained with thecustom BIA device, along with the height, weight, age, andgender into Eq. (4). Figure 9 shows the sequence of thesecalculations. (If time is a constraint, these calculations canbe pre-coded into a spreadsheet.) The OMRON BIA device(which also operates at 50 kHz) is then used to measure BF%for the volunteering student, and the two values are com-pared (Table I). The BIA device returns a value for FFM, butthe OMRON returns a person’s BF%. Either measurementcan be converted using the individual’s weight. It should benoted that the empirical models assume normal body hydra-tion levels and that the measurement is taken several hoursafter eating. Because students are not asked to follow thestrict regimen required for highly accurate FFM measure-ments, some variation in the results from a person’s trueFFM are possible.15
Alternatively, instructors can also use known componentsto model the human body including skin-electrode impedan-ces Zcontact as shown in Fig. 4. This circuit allows for a quan-titative and more in-depth analysis of the tetrapolar electrodesetup.
C. Multi-frequency BIA and bioelectrical impedancespectroscopy
A BIA measurement as taken by a consumer device suchas the OMRON is performed at a single frequency. Multi-frequency BIA is first examined using a more accuratecircuit representation of the body as shown in the parallelcircuit of Fig. 1(a). Students measure Z and Du over a rangeof frequencies and calculate the effective resistance and re-actance of the series equivalent circuit using Sec. IV equa-tions. These values are graphed with reactance on the y-axis
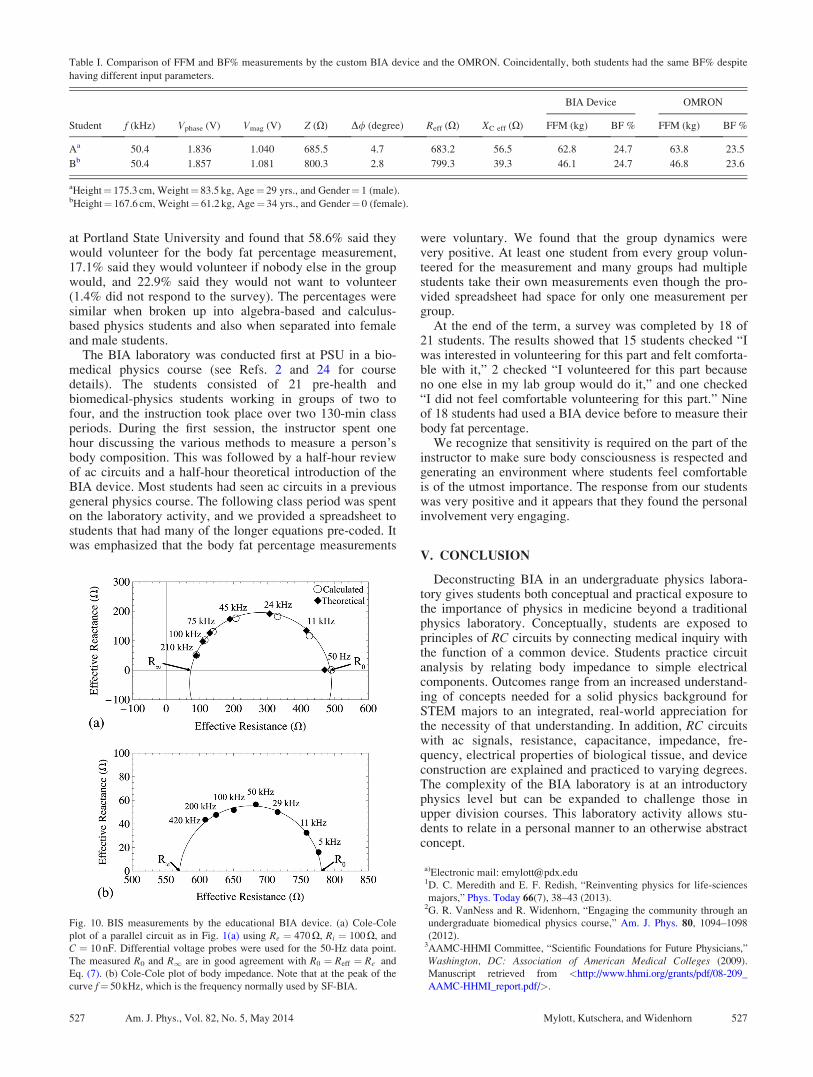
and resistance on the x-axis; such a graph is often referred toas a Cole-Cole plot. The result is a semi-circular curvewhose center is depressed below the x-axis (Fig. 10). Theresistances R0 and R1, the low- and high-frequencyextremes, are the intersections of the curve with the x-axis.In BIS, these resistances are used to calculate ECW andICW.13 The peak of the semicircle for an average humanbody occurs near 50 kHz.10 At this frequency, current passesthrough both ICW and ECW. Since the measured values forthese variables will be compared against the theoretical val-ues, Reff and XC,eff have to be found for each frequency.Complex analysis can be used with upper-level physics orbiomedical engineering students to derive these expressionsor the results can be stated and used by introductory students.The effective resistance and reactance are given by
Reff ¼ReRi Re þ Rið Þ þ ReX2
i
ðRe þ RiÞ2 þ X2i
(5)
and
XC;eff ¼R2
eXi
ðRe þ RiÞ2 þ X2i
: (6)
Whether or not the students perform the complex analysisnecessary to derive these equations, they can analyze the sa-lient features of the graph. Figure 10(a) shows the Cole-Coleplot for an RC parallel circuit such as shown in Fig. 1(a).Students will find that at low frequencies, the capacitor actsas a break in the circuit and the effective resistance essen-tially becomes R0 ¼ Ref f ¼ Re. At high frequencies, the ca-pacitor acts as a short and the circuit becomes a parallelresistive circuit, described by the equation
R1 ¼ Reff ¼1
Reþ 1
Ri
� ��1
: (7)
Next, a student volunteer repeats the set of MF-BIA meas-urements with the hand-held electrodes over a range of fre-quencies. Using the measured resistances and reactances ofthe human body, a new Cole-Cole plot is constructed, asshown in Fig. 10(b). Students compare the salient features ofthis plot with that of the parallel circuit. The peak of thesemi-circular arc for the human body is near 50 kHz, thusindicating to students why SF-BIA uses that frequency.Students also find the resistances R0 and R1 for their ownbodies based on their Cole-Cole plot and calculate Re and Ri
for the parallel-circuit model [Fig. 1(a)] using R0 ¼ Reff ¼Re and Eq. (7).
D. Student responses
Before we implemented the lab for the first time, we con-ducted an anonymous survey of 292 general physics students
Fig. 8. Correlation of FFM as measured by the OMRON and by the educa-
tional BIA device. Twenty-three men and nine women were tested.
Fig. 9. Summary of the measurements and calculations used to find the FFM in Table I.
526 Am. J. Phys., Vol. 82, No. 5, May 2014 Mylott, Kutschera, and Widenhorn 526
at Portland State University and found that 58.6% said theywould volunteer for the body fat percentage measurement,17.1% said they would volunteer if nobody else in the groupwould, and 22.9% said they would not want to volunteer(1.4% did not respond to the survey). The percentages weresimilar when broken up into algebra-based and calculus-based physics students and also when separated into femaleand male students.
The BIA laboratory was conducted first at PSU in a bio-medical physics course (see Refs. 2 and 24 for coursedetails). The students consisted of 21 pre-health andbiomedical-physics students working in groups of two tofour, and the instruction took place over two 130-min classperiods. During the first session, the instructor spent onehour discussing the various methods to measure a person’sbody composition. This was followed by a half-hour reviewof ac circuits and a half-hour theoretical introduction of theBIA device. Most students had seen ac circuits in a previousgeneral physics course. The following class period was spenton the laboratory activity, and we provided a spreadsheet tostudents that had many of the longer equations pre-coded. Itwas emphasized that the body fat percentage measurements
were voluntary. We found that the group dynamics werevery positive. At least one student from every group volun-teered for the measurement and many groups had multiplestudents take their own measurements even though the pro-vided spreadsheet had space for only one measurement pergroup.
At the end of the term, a survey was completed by 18 of21 students. The results showed that 15 students checked “Iwas interested in volunteering for this part and felt comforta-ble with it,” 2 checked “I volunteered for this part becauseno one else in my lab group would do it,” and one checked“I did not feel comfortable volunteering for this part.” Nineof 18 students had used a BIA device before to measure theirbody fat percentage.
We recognize that sensitivity is required on the part of theinstructor to make sure body consciousness is respected andgenerating an environment where students feel comfortableis of the utmost importance. The response from our studentswas very positive and it appears that they found the personalinvolvement very engaging.
V. CONCLUSION
Deconstructing BIA in an undergraduate physics labora-tory gives students both conceptual and practical exposure tothe importance of physics in medicine beyond a traditionalphysics laboratory. Conceptually, students are exposed toprinciples of RC circuits by connecting medical inquiry withthe function of a common device. Students practice circuitanalysis by relating body impedance to simple electricalcomponents. Outcomes range from an increased understand-ing of concepts needed for a solid physics background forSTEM majors to an integrated, real-world appreciation forthe necessity of that understanding. In addition, RC circuitswith ac signals, resistance, capacitance, impedance, fre-quency, electrical properties of biological tissue, and deviceconstruction are explained and practiced to varying degrees.The complexity of the BIA laboratory is at an introductoryphysics level but can be expanded to challenge those inupper division courses. This laboratory activity allows stu-dents to relate in a personal manner to an otherwise abstractconcept.
a)Electronic mail: [email protected]. C. Meredith and E. F. Redish, “Reinventing physics for life-sciences
majors,” Phys. Today 66(7), 38–43 (2013).2G. R. VanNess and R. Widenhorn, “Engaging the community through an
undergraduate biomedical physics course,” Am. J. Phys. 80, 1094–1098
(2012).3AAMC-HHMI Committee, “Scientific Foundations for Future Physicians,”
Washington, DC: Association of American Medical Colleges (2009).
Manuscript retrieved from <http://www.hhmi.org/grants/pdf/08-209_
AAMC-HHMI_report.pdf/>.
Table I. Comparison of FFM and BF% measurements by the custom BIA device and the OMRON. Coincidentally, both students had the same BF% despite
having different input parameters.
BIA Device OMRON
Student f (kHz) Vphase (V) Vmag (V) Z (X) D/ (degree) Reff (X) XC eff (X) FFM (kg) BF % FFM (kg) BF %
Aa 50.4 1.836 1.040 685.5 4.7 683.2 56.5 62.8 24.7 63.8 23.5
Bb 50.4 1.857 1.081 800.3 2.8 799.3 39.3 46.1 24.7 46.8 23.6
aHeight¼ 175.3 cm, Weight¼ 83.5 kg, Age¼ 29 yrs., and Gender¼ 1 (male).bHeight¼ 167.6 cm, Weight¼ 61.2 kg, Age¼ 34 yrs., and Gender¼ 0 (female).
Fig. 10. BIS measurements by the educational BIA device. (a) Cole-Cole
plot of a parallel circuit as in Fig. 1(a) using Re ¼ 470 X, Ri ¼ 100 X, and
C ¼ 10 nF. Differential voltage probes were used for the 50-Hz data point.
The measured R0 and R1 are in good agreement with R0 ¼ Reff ¼ Re and
Eq. (7). (b) Cole-Cole plot of body impedance. Note that at the peak of the
curve f¼ 50 kHz, which is the frequency normally used by SF-BIA.
527 Am. J. Phys., Vol. 82, No. 5, May 2014 Mylott, Kutschera, and Widenhorn 527
4N. Othman and M. H. Amiruddin, “Different perspectives of learning
styles from VARK Model,” Proc. Soc. Behav. Sci. 7, 652–660 (2010).5W. A. Drago and R. J. Wagner, “VARK preferred learning styles and
online education,” Man. Res. News. 27, 1–13 (2004).6K. J. Pugh and M. Girod, “Science, art, and experience: Constructing a sci-
ence pedagogy from Dewey’s aesthetics,” J. Sci. Teach. Ed. 18, 9–27 (2007).7R. Reilly and B. Kort, “The Science Behind the Art of Teaching Science:
Emotional State and Learning,” in Society for Information Technology &Teacher Education International Conference, pp. 3021–3026 (2004).
8M. Siervo and S. A. Jebb, “Body composition assessment: Theory into
practice,” IEEE Eng. Med. Bio. 29, 48–59 (2010).9S. Grimnes and O. G. Martinsen, Bioimpedance and Bioelectricity Basics,
2nd ed. (Oxford, UK: Elsevier Ltd., 2008).10K. R. Foster and H. C. Lukaski, “Whole-body impedance—what does it
measure?,” Am. J. Clin. Nut. 64, 388S–396S (1996).11A. Piccoli, P. Giordano, M. Guizzo, M. Rebeschini, A. Naso, and C.
Cascone, “Equivalence of information from single versus multiple fre-
quency bioimpedance vector analysis in hemodialysis,” Kid. Int. 67,
301–313 (2005).12A. Piccoli, L. Pillon, and F. Dumler, “Impedance Vector Distribution by
Sex, Race, Body Mass Index, and Age in the United States: Standard
Reference Intervals as Bivariate Z Scores,” Nutrition 18, 153–167 (2002).13U. G. Kyle, I. Bosaeus, A. D. De Lorenzo, P. Deurenberg, M. Elia, J. M.
Gomez, B. L. Heitmann, L. Kent-Smith, J. C. Melchior, M. Pirlich, H.
Scharfetter, A. M. W. J. Schols, and C. Pichard, “Bioelectrical impedance
analysis—part I: Review of principles and methods,” Clin. Nut. 23,
1226–1243 (2004).14K. S. Cole and R. H. Cole, “Dispersion and absorption in dielectrics,”
J. Chem. Phys. 9, 341–351 (1941).15OMRON HBF-306C Fat Loss Monitor Manual, OMRON Healthcare, INC.,
1200 Lakeside Drive, Bannockburn, IL 60015, USA. Instruction manual
available online at <http://www.omronhealthcare.com/wp-content/uploads/
hbf-306c-instruction-manual.pdf/>.16VC3165 Intelligence Frequency Counter, Delli Industry (Hong Kong) Co.,
Limited, Shenzhen, China.17See supplementary material at http://dx.doi.org/10.1119/1.4866276 for
complete specifications and circuit diagrams for the Educational BIA
Device.18AD8302 Data Sheet 2002 Analog Devices, One Technology Way, PO Box
9106, Norwood, MA 02062-9106, USA.19Y. Yang, J. Wang, G. Wu, F. Niu, and P. He, “Design and preliminary
evaluation of a portable device for the measurement of bioimpedance
spectroscopy,” Physiol. Meas. 27, 1293–1310 (2006).20G. Medrano, R. Bausch, A. H. Ismail, A. Cordes, R. Pikkemaat, and S.
Leonhardt, “Influence of ambient temperature on whole body and segmen-
tal bioimpedance spectroscopy measurements,” J. Phys.: Conf. Ser. 224,
012128-1–4 (2010).21Differential Voltage Probe, Vernier Software & Technology, 13979 S.W.
Millikan Way, Beaverton, OR 97005, USA. Instruction manual available
online at <http://www.vernier.com/files/manuals/dvp-bta.pdf>.22P. Durenberg, K. van der Kooy, R. Leenan, J. A. Westrate, and J. C.
Seidell, “Sex and age specific prediction formulas for estimating body
composition from bioelectrical impedance: A cross-validation study,” Int.
J. Obesity 15, 17–25 (1991).23A. L. Gibson, V. H. Heyward, and C. M. Mermier, “Predictive
accuracy of OMRON body logic analyzer in estimating relative
body fat of adults,” Intl. J. Sp. Nut. Exer. Met. 10, 216–227
(2000).24W. Christensen, J. K. Johnson, G. R. Van Ness, E. Mylott, J. C. Dunlap, E.
A. Anderson, and R. Widenhorn, “Developing and assessing curriculum
on the physics of medical instruments,” CBE—Life Sci. Ed., 12, 250–261
(2013).
528 Am. J. Phys., Vol. 82, No. 5, May 2014 Mylott, Kutschera, and Widenhorn 528