Embed Size (px)
Citation preview
PROCEEDINGS, Thirty-Sixth Workshop on Geothermal Reservoir Engineering Stanford University, Stanford, California, January 31 - February 2, 2011 SGP-TR-191
KIZILDERE SHORT TERM FLOW TEST: IMPACT OF NEW DEEP WELLS
Aygün Güney*, Füsun S Tut Haklıdır*, Taylan Akın*, Ayşe Alpagut-Bükülmez*
Zorlu Energy Group Zorlu Plaza, Avcılar
İstanbul, 34310, TURKEY e-mail: [email protected]
ABSTRACT
Geothermal well testing is the only way of investigating the physical properties of the reservoir rock as well as the dynamic properties of the fluid flowing both through the wellbore and the reservoir. It is known that Petroleum and Geothermal fluids have similar properties in terms of well testing. In this regard, almost every test or approach used in Petroleum industry can be applied to geothermal well testing. Among these tests, DST (drill stem test) is the most commonly known one in terms of its applicability and reliability. Other well-known tests for geothermal well testing include static and dynamic TPS (temperature, pressure and spinner) surveys and geochemical analysis of the flowing fluid play. The data which can be acquired from these tests include productivity, flowing fluid properties, flow capacity, pressure and temperature. All other necessary results and information regarding the reservoir conditions can be estimated from these basic of data.
INTRODUCTION
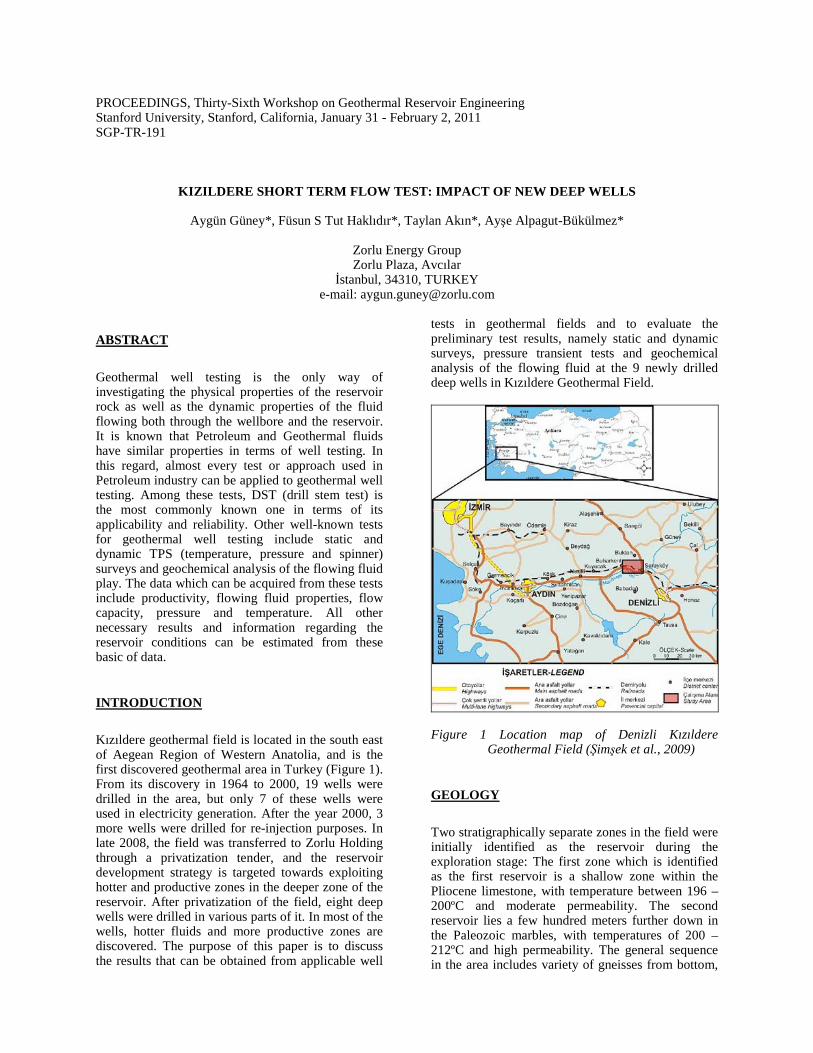
Kızıldere geothermal field is located in the south east of Aegean Region of Western Anatolia, and is the first discovered geothermal area in Turkey (Figure 1). From its discovery in 1964 to 2000, 19 wells were drilled in the area, but only 7 of these wells were used in electricity generation. After the year 2000, 3 more wells were drilled for re-injection purposes. In late 2008, the field was transferred to Zorlu Holding through a privatization tender, and the reservoir development strategy is targeted towards exploiting hotter and productive zones in the deeper zone of the reservoir. After privatization of the field, eight deep wells were drilled in various parts of it. In most of the wells, hotter fluids and more productive zones are discovered. The purpose of this paper is to discuss the results that can be obtained from applicable well
tests in geothermal fields and to evaluate the preliminary test results, namely static and dynamic surveys, pressure transient tests and geochemical analysis of the flowing fluid at the 9 newly drilled deep wells in Kızıldere Geothermal Field.
Figure 1 Location map of Denizli Kızıldere
Geothermal Field (Şimşek et al., 2009)
GEOLOGY
Two stratigraphically separate zones in the field were initially identified as the reservoir during the exploration stage: The first zone which is identified as the first reservoir is a shallow zone within the Pliocene limestone, with temperature between 196 – 200ºC and moderate permeability. The second reservoir lies a few hundred meters further down in the Paleozoic marbles, with temperatures of 200 – 212ºC and high permeability. The general sequence in the area includes variety of gneisses from bottom,
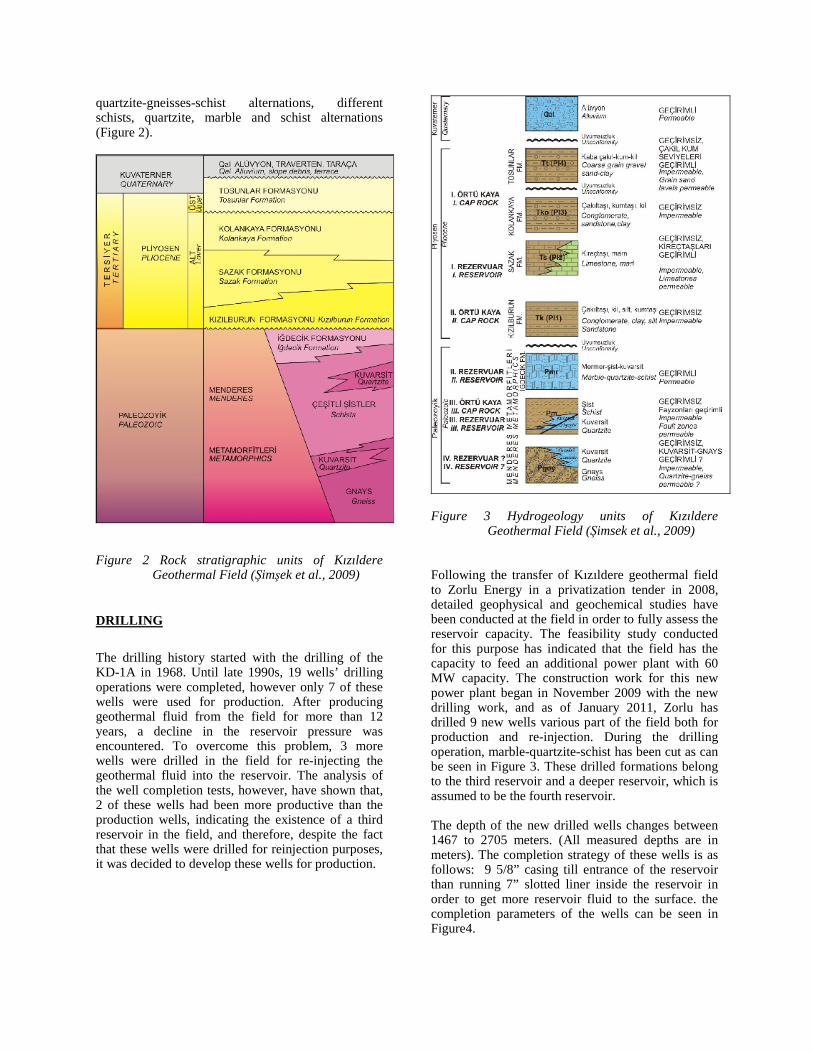
quartzite-gneisses-schist alternations, different schists, quartzite, marble and schist alternations (Figure 2).
Figure 2 Rock stratigraphic units of Kızıldere
Geothermal Field (Şimşek et al., 2009)
DRILLING
The drilling history started with the drilling of the KD-1A in 1968. Until late 1990s, 19 wells’ drilling operations were completed, however only 7 of these wells were used for production. After producing geothermal fluid from the field for more than 12 years, a decline in the reservoir pressure was encountered. To overcome this problem, 3 more wells were drilled in the field for re-injecting the geothermal fluid into the reservoir. The analysis of the well completion tests, however, have shown that, 2 of these wells had been more productive than the production wells, indicating the existence of a third reservoir in the field, and therefore, despite the fact that these wells were drilled for reinjection purposes, it was decided to develop these wells for production.
Figure 3 Hydrogeology units of Kızıldere
Geothermal Field (Şimsek et al., 2009) Following the transfer of Kızıldere geothermal field to Zorlu Energy in a privatization tender in 2008, detailed geophysical and geochemical studies have been conducted at the field in order to fully assess the reservoir capacity. The feasibility study conducted for this purpose has indicated that the field has the capacity to feed an additional power plant with 60 MW capacity. The construction work for this new power plant began in November 2009 with the new drilling work, and as of January 2011, Zorlu has drilled 9 new wells various part of the field both for production and re-injection. During the drilling operation, marble-quartzite-schist has been cut as can be seen in Figure 3. These drilled formations belong to the third reservoir and a deeper reservoir, which is assumed to be the fourth reservoir. The depth of the new drilled wells changes between 1467 to 2705 meters. (All measured depths are in meters). The completion strategy of these wells is as follows: 9 5/8” casing till entrance of the reservoir than running 7” slotted liner inside the reservoir in order to get more reservoir fluid to the surface. the completion parameters of the wells can be seen in Figure4.
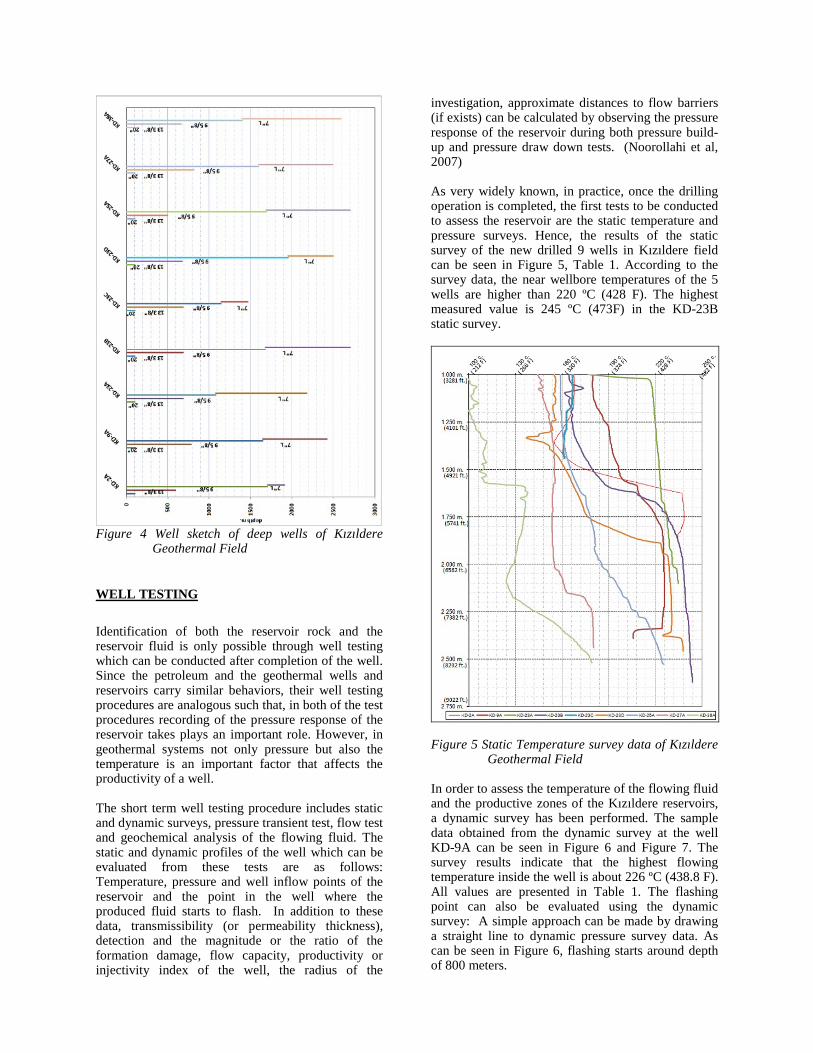
Figure 4 Well sketch of deep wells of Kızıldere
Geothermal Field
WELL TESTING
Identification of both the reservoir rock and the reservoir fluid is only possible through well testing which can be conducted after completion of the well. Since the petroleum and the geothermal wells and reservoirs carry similar behaviors, their well testing procedures are analogous such that, in both of the test procedures recording of the pressure response of the reservoir takes plays an important role. However, in geothermal systems not only pressure but also the temperature is an important factor that affects the productivity of a well. The short term well testing procedure includes static and dynamic surveys, pressure transient test, flow test and geochemical analysis of the flowing fluid. The static and dynamic profiles of the well which can be evaluated from these tests are as follows: Temperature, pressure and well inflow points of the reservoir and the point in the well where the produced fluid starts to flash. In addition to these data, transmissibility (or permeability thickness), detection and the magnitude or the ratio of the formation damage, flow capacity, productivity or injectivity index of the well, the radius of the
investigation, approximate distances to flow barriers (if exists) can be calculated by observing the pressure response of the reservoir during both pressure build-up and pressure draw down tests. (Noorollahi et al, 2007) As very widely known, in practice, once the drilling operation is completed, the first tests to be conducted to assess the reservoir are the static temperature and pressure surveys. Hence, the results of the static survey of the new drilled 9 wells in Kızıldere field can be seen in Figure 5, Table 1. According to the survey data, the near wellbore temperatures of the 5 wells are higher than 220 ºC (428 F). The highest measured value is 245 ºC (473F) in the KD-23B static survey.
Figure 5 Static Temperature survey data of Kızıldere
Geothermal Field In order to assess the temperature of the flowing fluid and the productive zones of the Kızıldere reservoirs, a dynamic survey has been performed. The sample data obtained from the dynamic survey at the well KD-9A can be seen in Figure 6 and Figure 7. The survey results indicate that the highest flowing temperature inside the well is about 226 ºC (438.8 F). All values are presented in Table 1. The flashing point can also be evaluated using the dynamic survey: A simple approach can be made by drawing a straight line to dynamic pressure survey data. As can be seen in Figure 6, flashing starts around depth of 800 meters.
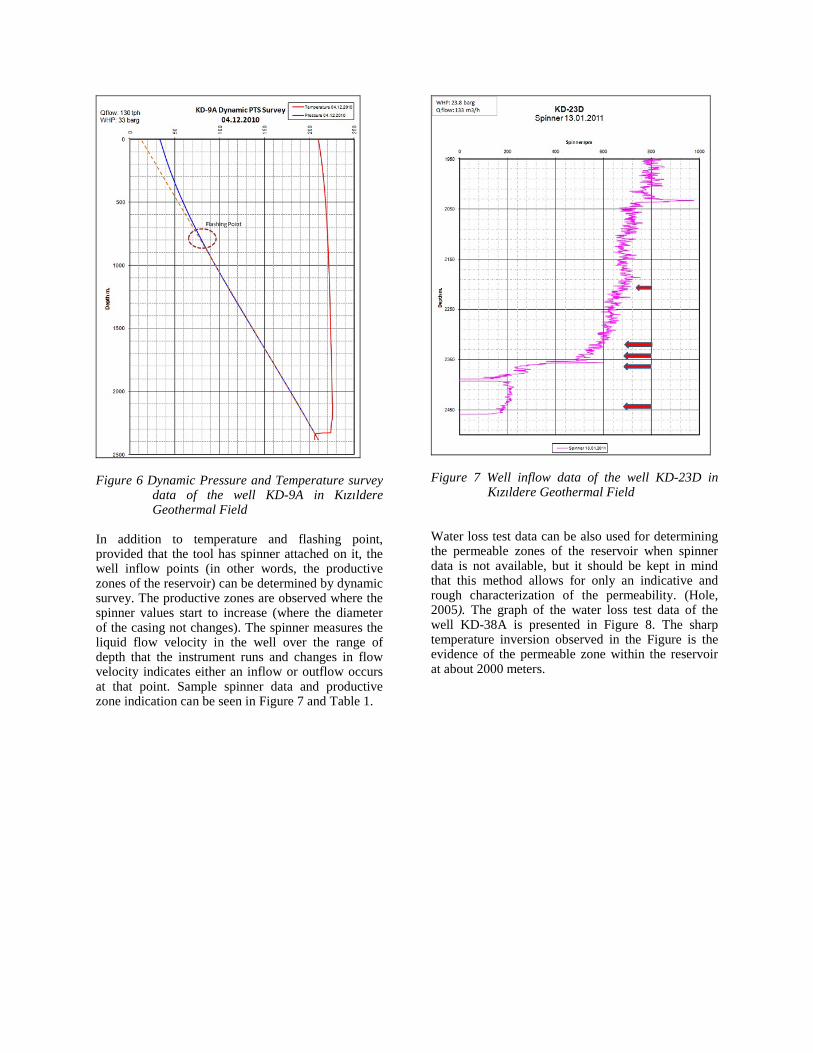
Figure 6 Dynamic Pressure and Temperature survey
data of the well KD-9A in Kızıldere Geothermal Field
In addition to temperature and flashing point, provided that the tool has spinner attached on it, the well inflow points (in other words, the productive zones of the reservoir) can be determined by dynamic survey. The productive zones are observed where the spinner values start to increase (where the diameter of the casing not changes). The spinner measures the liquid flow velocity in the well over the range of depth that the instrument runs and changes in flow velocity indicates either an inflow or outflow occurs at that point. Sample spinner data and productive zone indication can be seen in Figure 7 and Table 1.
Figure 7 Well inflow data of the well KD-23D in
Kızıldere Geothermal Field Water loss test data can be also used for determining the permeable zones of the reservoir when spinner data is not available, but it should be kept in mind that this method allows for only an indicative and rough characterization of the permeability. (Hole, 2005). The graph of the water loss test data of the well KD-38A is presented in Figure 8. The sharp temperature inversion observed in the Figure is the evidence of the permeable zone within the reservoir at about 2000 meters.
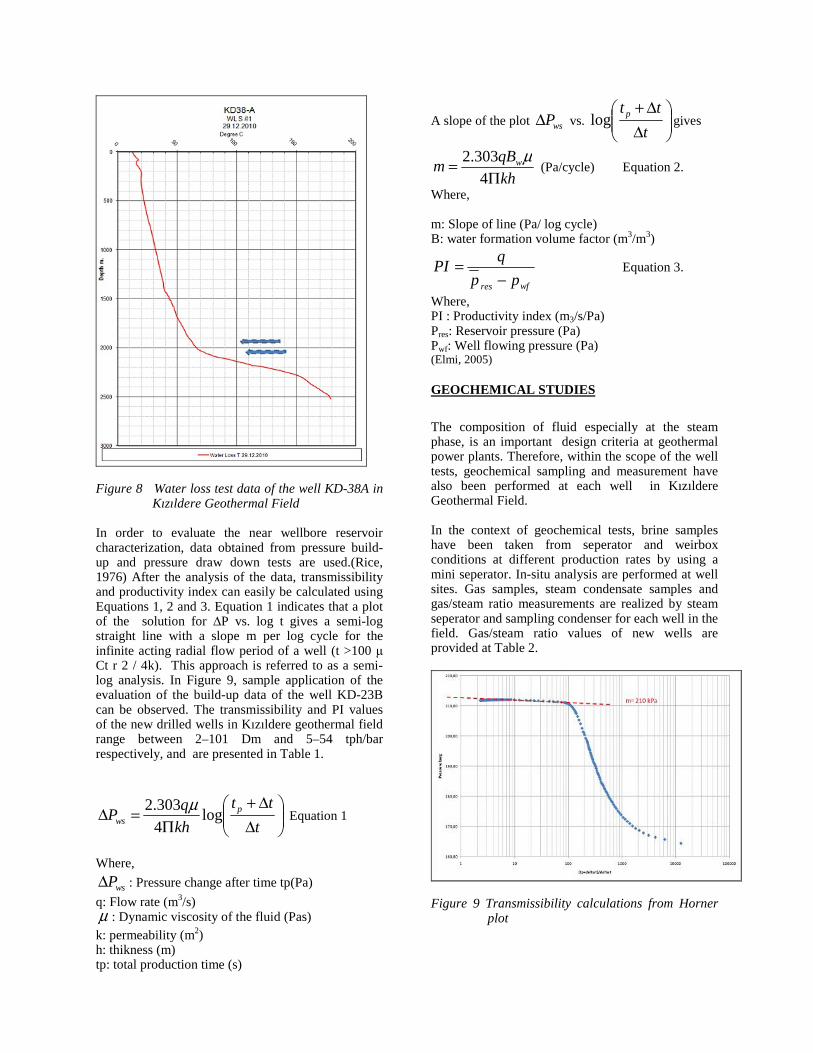
Figure 8 Water loss test data of the well KD-38A in
Kızıldere Geothermal Field In order to evaluate the near wellbore reservoir characterization, data obtained from pressure build-up and pressure draw down tests are used.(Rice, 1976) After the analysis of the data, transmissibility and productivity index can easily be calculated using Equations 1, 2 and 3. Equation 1 indicates that a plot of the solution for ∆P vs. log t gives a semi-log straight line with a slope m per log cycle for the infinite acting radial flow period of a well (t >100 µ Ct r 2 / 4k). This approach is referred to as a semi-log analysis. In Figure 9, sample application of the evaluation of the build-up data of the well KD-23B can be observed. The transmissibility and PI values of the new drilled wells in Kızıldere geothermal field range between 2–101 Dm and 5–54 tph/bar respectively, and are presented in Table 1.
⎟⎟⎠
⎞⎜⎜⎝
⎛∆
∆+Π
=∆t
tt
kh
qP p
ws log4
303.2 µ Equation 1
Where,
wsP∆ : Pressure change after time tp(Pa)
q: Flow rate (m3/s) µ : Dynamic viscosity of the fluid (Pas) k: permeability (m2) h: thikness (m) tp: total production time (s)
A slope of the plot wsP∆ vs. ⎟⎟⎠
⎞⎜⎜⎝
⎛∆
∆+t
tt plog gives
kh
qBm w
Π=
4303.2 µ
(Pa/cycle) Equation 2.
Where, m: Slope of line (Pa/ log cycle) B: water formation volume factor (m3/m3)
wfres pp
qPI
−= Equation 3.
Where, PI : Productivity index (m3/s/Pa) Pres: Reservoir pressure (Pa) Pwf: Well flowing pressure (Pa) (Elmi, 2005)
GEOCHEMICAL STUDIES
The composition of fluid especially at the steam phase, is an important design criteria at geothermal power plants. Therefore, within the scope of the well tests, geochemical sampling and measurement have also been performed at each well in Kızıldere Geothermal Field. In the context of geochemical tests, brine samples have been taken from seperator and weirbox conditions at different production rates by using a mini seperator. In-situ analysis are performed at well sites. Gas samples, steam condensate samples and gas/steam ratio measurements are realized by steam seperator and sampling condenser for each well in the field. Gas/steam ratio values of new wells are provided at Table 2.
Figure 9 Transmissibility calculations from Horner
plot
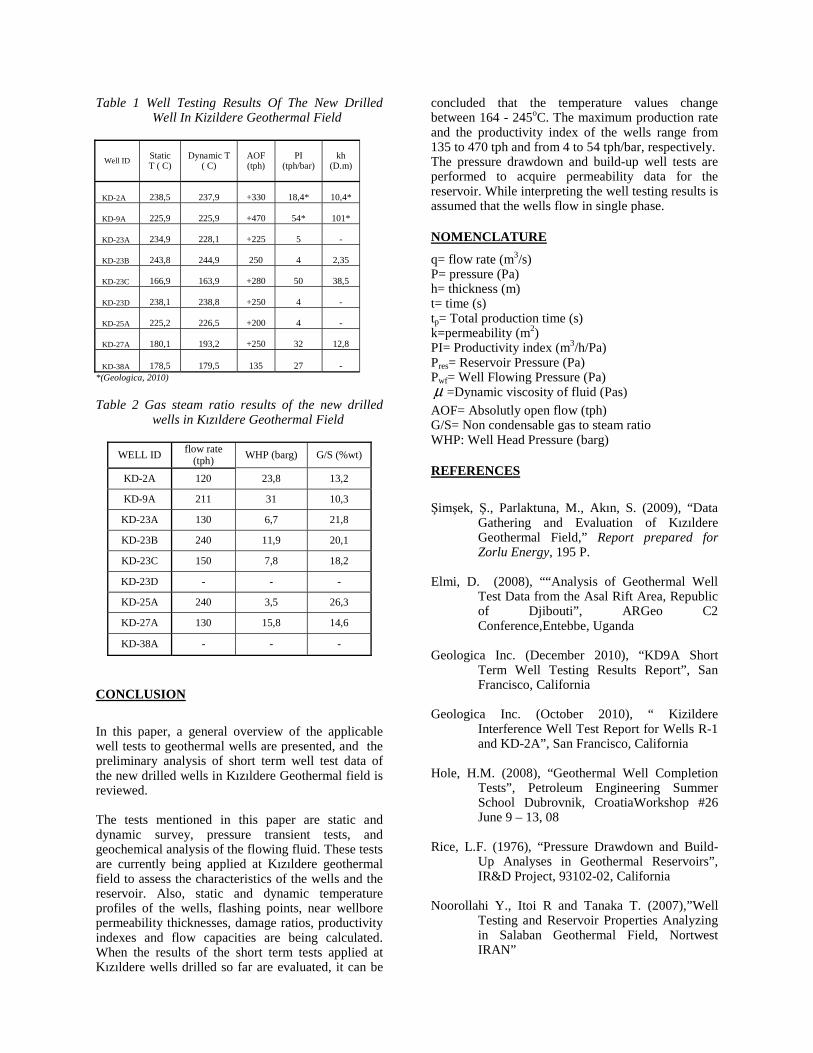
Table 1 Well Testing Results Of The New Drilled Well In Kizildere Geothermal Field
Well ID Static T ( C)
Dynamic T ( C)
AOF (tph)
PI (tph/bar)
kh (D.m)
KD-2A 238,5 237,9 +330 18,4* 10,4*
KD-9A 225,9 225,9 +470 54* 101*
KD-23A 234,9 228,1 +225 5 -
KD-23B 243,8 244,9 250 4 2,35
KD-23C 166,9 163,9 +280 50 38,5
KD-23D 238,1 238,8 +250 4 -
KD-25A 225,2 226,5 +200 4 -
KD-27A 180,1 193,2 +250 32 12,8
KD-38A 178,5 179,5 135 27 - *(Geologica, 2010)
Table 2 Gas steam ratio results of the new drilled
wells in Kızıldere Geothermal Field
WELL ID flow rate (tph) WHP (barg) G/S (%wt)
KD-2A 120 23,8 13,2
KD-9A 211 31 10,3
KD-23A 130 6,7 21,8
KD-23B 240 11,9 20,1
KD-23C 150 7,8 18,2
KD-23D - - -
KD-25A 240 3,5 26,3
KD-27A 130 15,8 14,6
KD-38A - - -
CONCLUSION
In this paper, a general overview of the applicable well tests to geothermal wells are presented, and the preliminary analysis of short term well test data of the new drilled wells in Kızıldere Geothermal field is reviewed. The tests mentioned in this paper are static and dynamic survey, pressure transient tests, and geochemical analysis of the flowing fluid. These tests are currently being applied at Kızıldere geothermal field to assess the characteristics of the wells and the reservoir. Also, static and dynamic temperature profiles of the wells, flashing points, near wellbore permeability thicknesses, damage ratios, productivity indexes and flow capacities are being calculated. When the results of the short term tests applied at Kızıldere wells drilled so far are evaluated, it can be
concluded that the temperature values change between 164 - 245oC. The maximum production rate and the productivity index of the wells range from 135 to 470 tph and from 4 to 54 tph/bar, respectively. The pressure drawdown and build-up well tests are performed to acquire permeability data for the reservoir. While interpreting the well testing results is assumed that the wells flow in single phase.
NOMENCLATURE
q= flow rate (m3/s) P= pressure (Pa) h= thickness (m) t= time (s) tp= Total production time (s) k=permeability (m2) PI= Productivity index (m3/h/Pa) Pres= Reservoir Pressure (Pa) Pwf= Well Flowing Pressure (Pa) µ =Dynamic viscosity of fluid (Pas) AOF= Absolutly open flow (tph) G/S= Non condensable gas to steam ratio WHP: Well Head Pressure (barg)
REFERENCES
Şimşek, Ş., Parlaktuna, M., Akın, S. (2009), “Data
Gathering and Evaluation of Kızıldere Geothermal Field,” Report prepared for Zorlu Energy, 195 P.
Elmi, D. (2008), ““Analysis of Geothermal Well
Test Data from the Asal Rift Area, Republic of Djibouti”, ARGeo C2 Conference,Entebbe, Uganda
Geologica Inc. (December 2010), “KD9A Short
Term Well Testing Results Report”, San Francisco, California
Geologica Inc. (October 2010), “ Kizildere
Interference Well Test Report for Wells R-1 and KD-2A”, San Francisco, California
Hole, H.M. (2008), “Geothermal Well Completion
Tests”, Petroleum Engineering Summer School Dubrovnik, CroatiaWorkshop #26 June 9 – 13, 08
Rice, L.F. (1976), “Pressure Drawdown and Build-
Up Analyses in Geothermal Reservoirs”, IR&D Project, 93102-02, California
Noorollahi Y., Itoi R and Tanaka T. (2007),”Well
Testing and Reservoir Properties Analyzing in Salaban Geothermal Field, Nortwest IRAN”