Embed Size (px)
Citation preview

21/03/2013
1
Keynote address on the evolution of agriculture and fertilization in Brazil
Daniel Vidal PerezPh.D. Soil Science
Head R&D of Embrapa Soils
Outline
» Highlights Brazil and Brazilian Agriculture
» Atual context of fertilizers importance to Brazilian Agriculture
» Historical relationship of Fertilizers, Food and Bioenergy production in Brazil
» Constraints and proposal solutions to advances in Tropical Agriculture

21/03/2013
2
Brazilian Tropical Agriculture
Edition: Revista VEJA, 03/03/2004Source: IBGE e CONAB; Adapted from: MAPA
Land distribution
(Million ha)
Grassland 220
Annual Crops 47
Permanent Crops 15
Sub-total 282
Amazon Forest 345
Conservation Areas 55
Cities, lakes and roads 20
Planted Forests 5
Other uses 38
Areas that are stillavailable for
agriculture106
TOTAL 851
The problem is not the availablearea but the inadequate availability of insumes.
Brazilian Tropical Agriculture
Inpact of Agriculture (agrobusiness) on Brazilian Comercial Trade
(Prepeared by: Contini e Martha, 2010)_
21/03/2013
3
Source: ANDA e SIACESP, CONAB,AMABrasil, Business Sector, 2012 ; 2013
Elaborated by: Guilherme, L.R. and Lopes, A.S., 2012, atualized by J. C. Polidoro, 2013
r = 0.956**
29.5(3.2X)
186.0(2.7X)
53.0(1.5X)
The strategic importance of fertilizersfor the grain production in Brazil
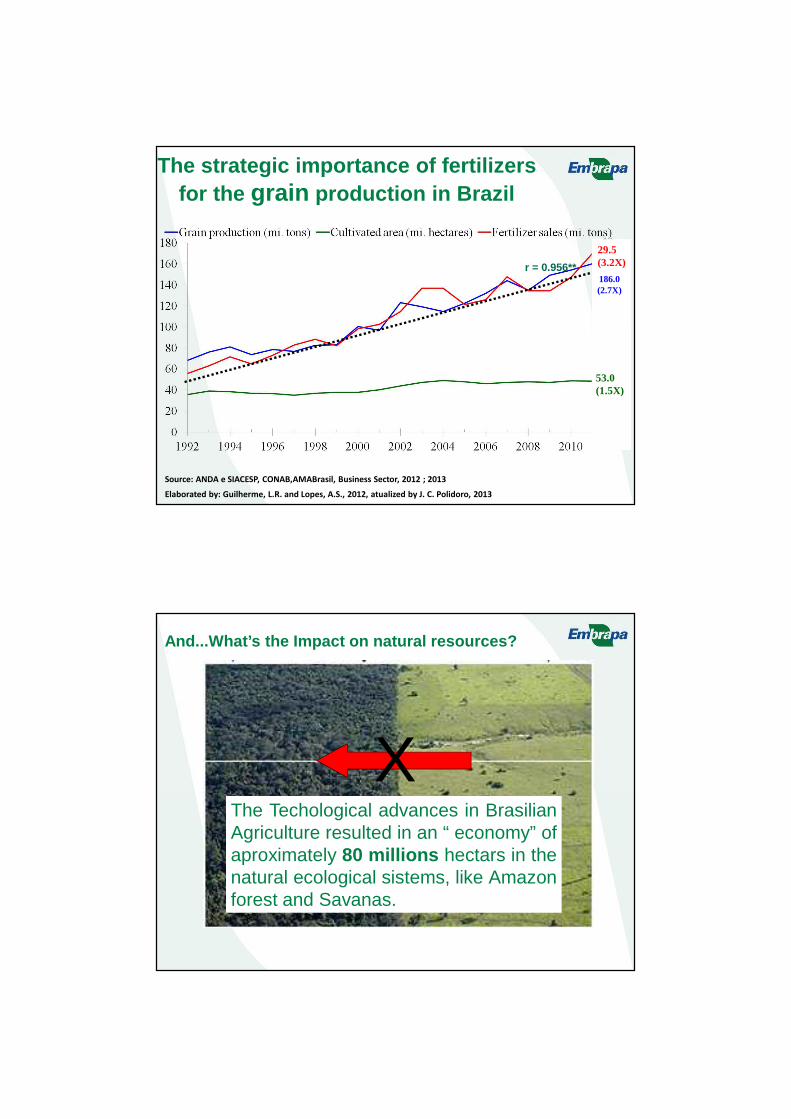
XThe Techological advances in BrasilianAgriculture resulted in an “ economy” ofaproximately 80 millions hectars in thenatural ecological sistems, like Amazonforest and Savanas.
And...What’s the Impact on natural resources?

21/03/2013
4
The Brazilian Natural Soil Fertility Map
The major food producing areas, have naturally, acid soils and poor nutrients.
» Without fertilizers, no productivity.
Sourse: IBGE, 2002
Historical Evolution of Brazilian Agriculture Fertilize r Consumption
Source: Dias, J. C. Raizes da Fertilidade, 2005. ANDA, 1975-2012, Prepeared by Polidoro, J. C. 2013.

21/03/2013
5
Historical Evolution of Brazilian Agriculture Development and Technology Innovation
Embrapa’sFoundation
1973
Brasil’s NO TILLAGE area35 million ha
2010
Source: CONAB, 2012, IPEA, 2012, Prepeared by Polidoro, J. C. 2013.
Embrapa
Our researchers work in47 Decentralized Unitsspread across the country(there being 42 researchunits and 5 service units)

21/03/2013
6
Potassium Level
High
Adequate
Low
During the 80’s
During the 70’s
During the 60’s
Until the 50’s
Since the 90’s until today
Historical Agriculture Expansion in Brasil
11
Brazilian fertilizer market: Share By State
Sourse: ANDA, 2012 Elaborated by: Roquetti Filho, D., 2012

21/03/2013
7
Agriculture and Fertilization in Brazil: Constraints and Solutions
Foto: V. M. Benites, 2012
Constraint 01: The “Myth” of Brazilian ImportFertilizers Dependency
In 2012, imports accounted for 71.9% of supply of fertilizers, with a consumption of 29.5 million tons of products.
75,2%
49,2%
24,8%
50,8%
92,4%
7,6%
Nitrogen Phosphorus Potassium
Source: ANDA e SIACESP, AMABrasil, Business Sector
Extracted from ANDA, 2012, Roquetti Filho, 2012 e atualized by Polidoro, 2012
National production
Imported

21/03/2013
8
Solution: Brazilian companies announce the investiments of US$ 19.0 billions to 2017
INVESTIMENTOS PREVISTOS PARA 2017
Extract from Mesquita, L.A.V, 2012 and FIESP, 2012
National production X demand for fertilizers
2012 (mil tons) 2017 (mil tons)
Nutrient production demand % productiondeman
d %
Nitrogen 880 3,543 24.8 2,001 4,272 46.8
Phosphorus 2,220 4,372 50.8 4,052 5,237 77.4
Potash 325 4,284 7.6 3,300 5,223 63.2
NPK 3,425 12,199 28.1 9,353 14,732 63.5
Constraint 02: Decrease of FUE – Fertilizer Efficiency Use in Agro-vegetal production in Brazil
Source: ANDA; IBGE, CONAB, 2012 e Lopes, A. S., 2007, Elaborado por Polidoro, 2012
(agrovegetal = (grains + sugar cane+ forest plantit ions, vegetables…)

21/03/2013
9
Possibles Causes of Constraint 02: Decrease of FUE
Change in fertilizer technology aplication without scient ificcomprovations or without the principles of Best Practices o fFertilizer Use
Ex.: Superficial phosphate fertilization at Oxisoil in Savanas site
0
10
20
30
40
50
60
70
80Losses of NH
3(%
N applied)
AS AN UR AS AN UR
No-tillage system Conventional system
AS = ammonium sulphate AN = Ammonium nitrate UR = urea
Superficial
Incorporated
Method of N-fertilizer Aplication:
Dosis of N: 100 kg/ha
Source: Lara-Cabezas et al, 1998
Possible s Causes of Constraint 02: Decrease of FUE
Potential of Nitrogen losses by ammonia volatilizationfrom fertilizer on maize cultivation systems in theCerrado

21/03/2013
10
Proposal solution:A Brazilian program of Best Practices for fertilizerUtilization
Cordinator : Dr. L. I. Prochnow
Proposal Solution: Development and Innovation in Slow- and Controlled-Release and Stabilized Fertilizer s
Adapted from Dr. James Robbins, University of Arkansas, 2005 and presented by Terry A. Tindall, 2011 – II WS Tecnol. Fertil. Uberlândia – MG.
Actually, Brazilian agriculture uses Slow-and Controlled-Release and Stabilized Fertilizers on approximately 7.5 million hectares (Polidoro, JC, Rolim, MV and Borsari, F. 2012)

21/03/2013
11
In this scenario… Embrapa created the FertBrasil Network to promote technological solutions for fertilizers in tropical agriculture
http://www.cnps.embrapa.br/redefertbrasil/
FertBrasil Network
» 211 members
» 138 Reseraches from Embrapa
» 22 Research Centers at Embrapa
» CNPS,CPPSE, CNPAF, CNPAB,CPAC, CTAA,CNPMS, CNPSo, CNPA, CPAF-RR, CPAF-RO, AIT, SNT, CPAO, CPATU, CNPAT, CNPTIA, CNPDIA, CNPC, CNPCT, CNPTC, CNPA, SEN
» 73 Researches from Universities and Institutes
» APDC (CATs), CETEM, COMIGO, FESURV, Fundação MT, IAC, IPEN, UFES, UFG, UFLA, UFRJ, UFRPE, UFRRJ, UFV, UNB, USP.
» Strong partnerships with fertilizer industry companies

21/03/2013
12
Strategies of FertBrasil Network
» Best practices for the efficient use of fertilizer (nutrients) in Brazilian agriculture (partnership w ith IPNI)
» Identification of alternative sources of nutrients for Brazilian agriculture
» New technologies in fertilizer suitable for product ion systems in Brazil (tropical conditions)
Thank You!


![Mekong ARCC Interim Results Workshop: Challenges of Climate Change Adaptation and Mitigation in Agriculture [Keynote]](https://img.pdfslide.us/doc/110x75/54cfe4044a7959964d8b45a5/mekong-arcc-interim-results-workshop-challenges-of-climate-change-adaptation-and-mitigation-in-agriculture-keynote.jpg)


![[OpenStack Day in Korea 2015] Keynote 5 - The evolution of OpenStack Networking](https://img.pdfslide.us/doc/110x75/55a7530d1a28abf03c8b4675/openstack-day-in-korea-2015-keynote-5-the-evolution-of-openstack-networking.jpg)