Embed Size (px)
Citation preview
Annual results 2005/06
June 28, 2006
Yves Guillemot, Chief Executive Officer
Alain Martinez, Chief Finance Officer
Agenda
Introduction
Arrival of next-generation platforms: Evolutions and potential
Ubisoft's strategy and strengths
2005/06 financial results
Outlook and conclusions
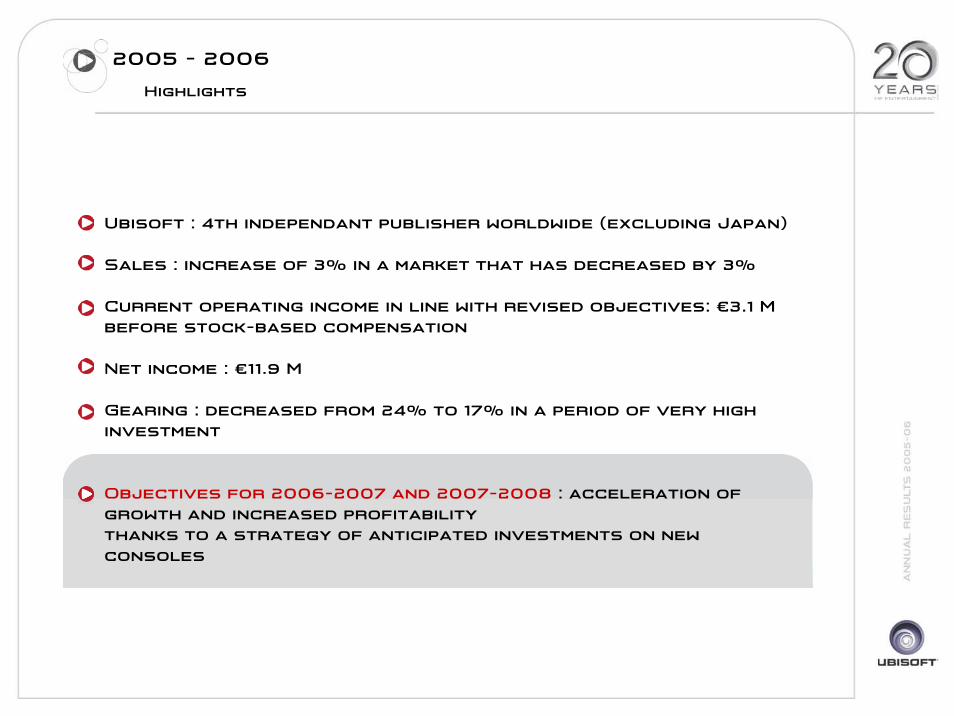
2005 - 2006
Highlights
Ubisoft : 4th independant publisher worldwide (excluding Japan)
Sales : increase of 3% in a market that has decreased by 3%
Current operating income in line with revised objectives: €3.1 M before stock-based compensation
Net income : €11.9 M
Gearing : decreased from 24% to 17% in a period of very high investment
Objectives for 2006-2007 and 2007-2008 : acceleration of growth and increased profitability thanks to a strategy of anticipated investments on new consoles
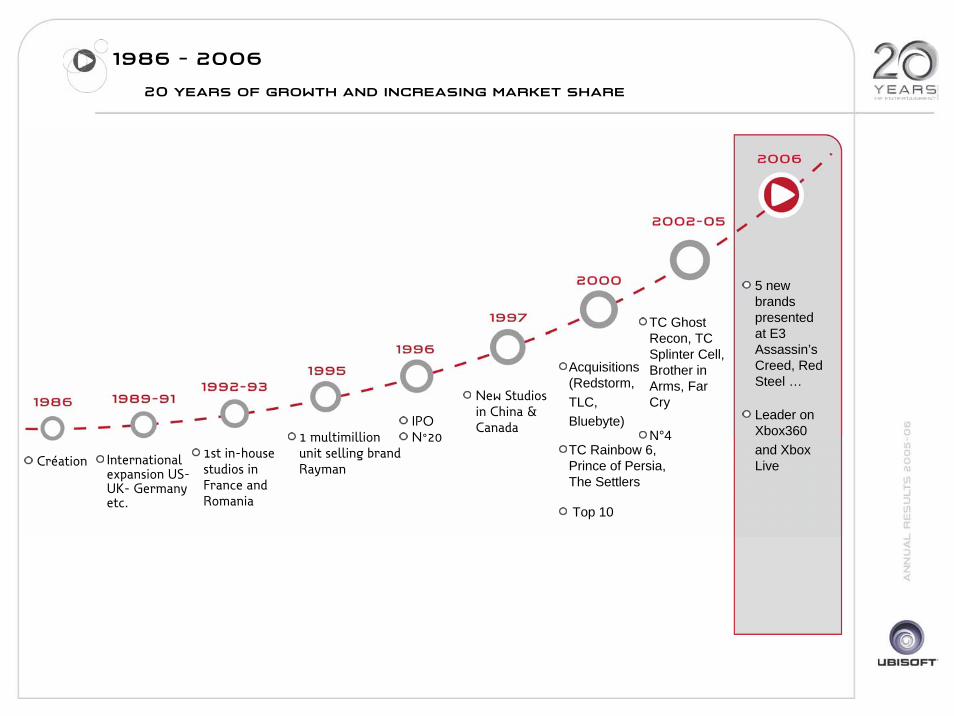
Création International expansion US-UK- Germany etc.
1st in-house studios in France and Romania
1 multimillionunit selling brand Rayman
New Studios in China & Canada
Acquisitions (Redstorm,TLC,Bluebyte)
TC Rainbow 6, Prince of Persia, The Settlers
Top 10
5 new brands presentedat E3 Assassin’s Creed, RedSteel …
Leader on Xbox360and XboxLive
IPON°20
TC GhostRecon, TC Splinter Cell, Brother in Arms, Far Cry
N°4
1986 - 2006
20 years of growth and increasing market share
Agenda
Introduction
Arrival of next-generation platforms: Evolutions and potential
Ubisoft's strategy and strengths
2005/06 financial results
Outlook and conclusions
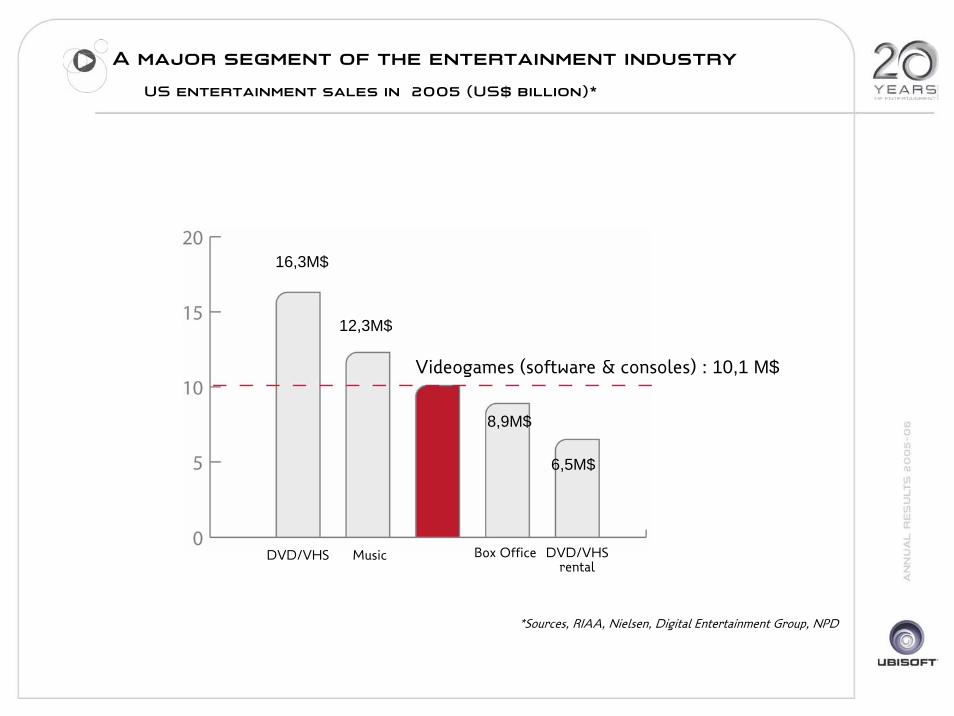
Videogames (software & consoles) : 10,1 M$
DVD/VHS Music Box Office DVD/VHSrental
A major segment of the entertainment industry
US entertainment sales in 2005 (US$ billion)*
16,3M$
12,3M$
8,9M$
6,5M$
*Sources, RIAA, Nielsen, Digital Entertainment Group, NPD
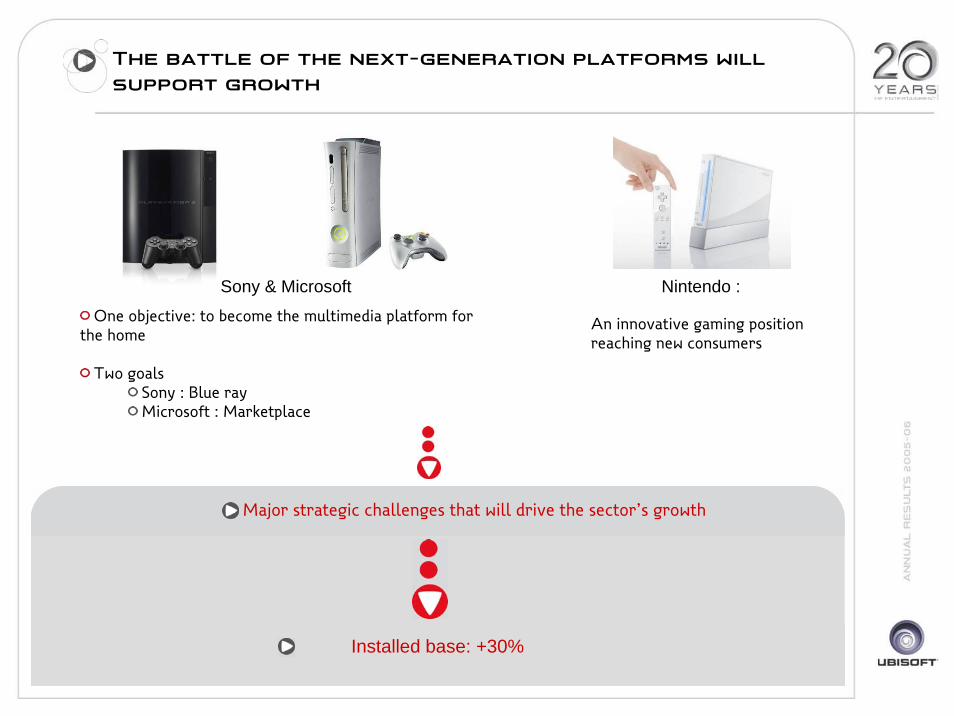
One objective: to become the multimedia platform for the home
Two goalsSony : Blue rayMicrosoft : Marketplace
An innovative gaming position reaching new consumers
Major strategic challenges that will drive the sector’s growth
Installed base: +30%
The battle of the next-generation platforms willsupport growth
Sony & Microsoft Nintendo :
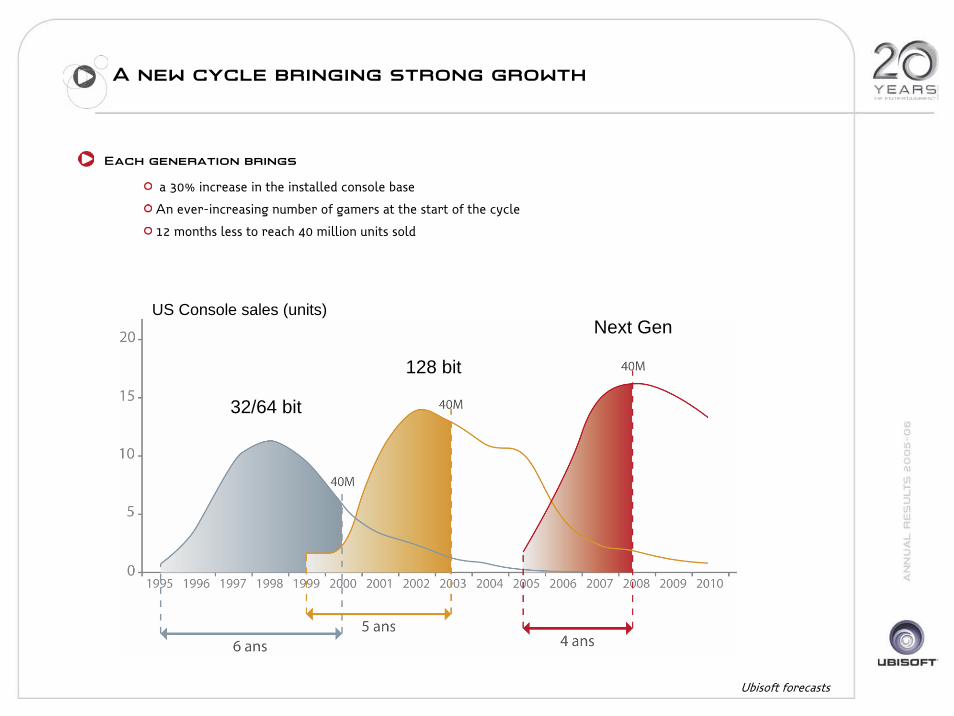
Each generation brings
a 30% increase in the installed console base
An ever-increasing number of gamers at the start of the cycle
12 months less to reach 40 million units sold
32/64 bit
128 bit
Next Gen
A new cycle bringing strong growth
US Console sales (units)
Ubisoft forecasts
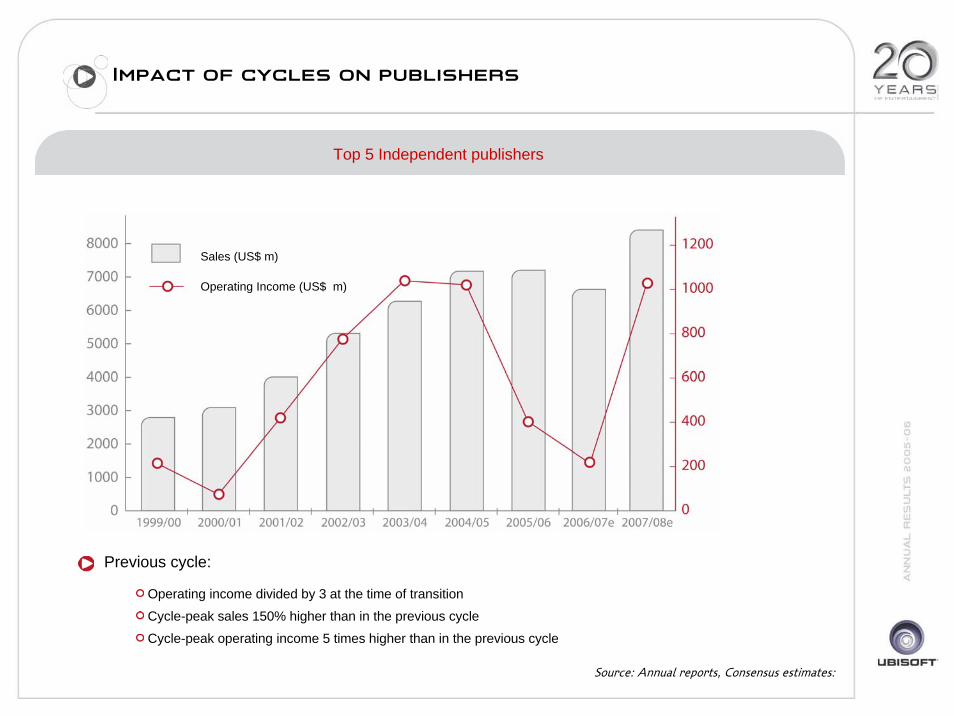
Top 5 Independent publishers
Source: Annual reports, Consensus estimates:
Previous cycle:
Operating income divided by 3 at the time of transition
Cycle-peak sales 150% higher than in the previous cycle
Cycle-peak operating income 5 times higher than in the previous cycle
Impact of cycles on publishers
Operating Income (US$ m)
Sales (US$ m)
Agenda
Introduction
Arrival of next-generation platforms: Evolutions and potential
Ubisoft's strategy and strengths
2005/06 financial results
Outlook and conclusions
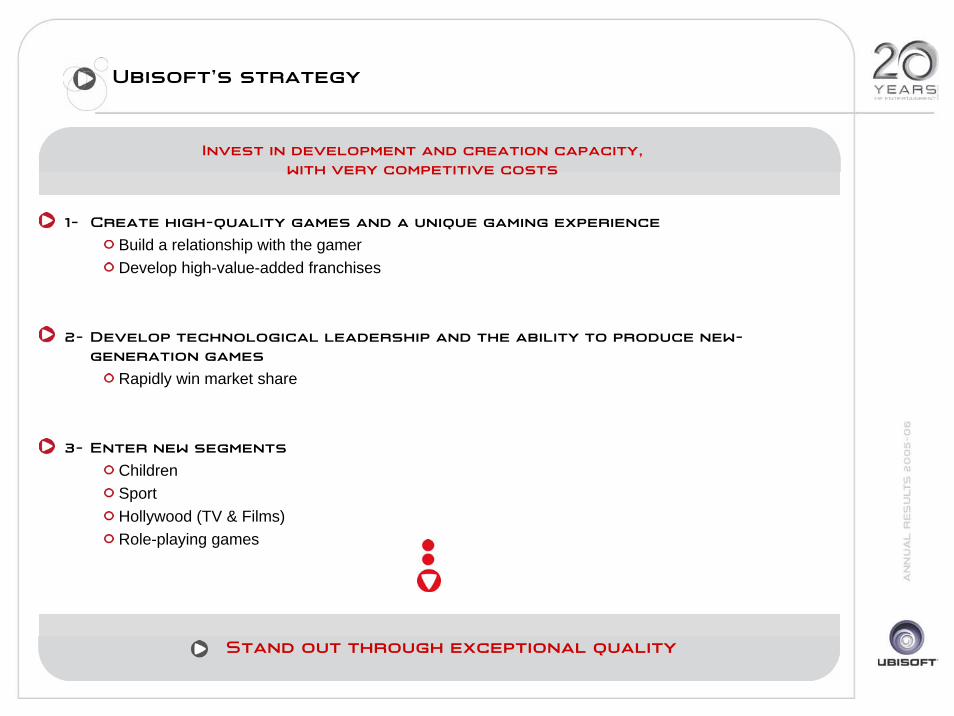
Stand out through exceptional quality
1- Create high-quality games and a unique gaming experience
Build a relationship with the gamerDevelop high-value-added franchises
2- Develop technological leadership and the ability to produce new-generation games
Rapidly win market share
3- Enter new segments
ChildrenSportHollywood (TV & Films)Role-playing games
Invest in development and creation capacity, with very competitive costs
Ubisoft’s strategy
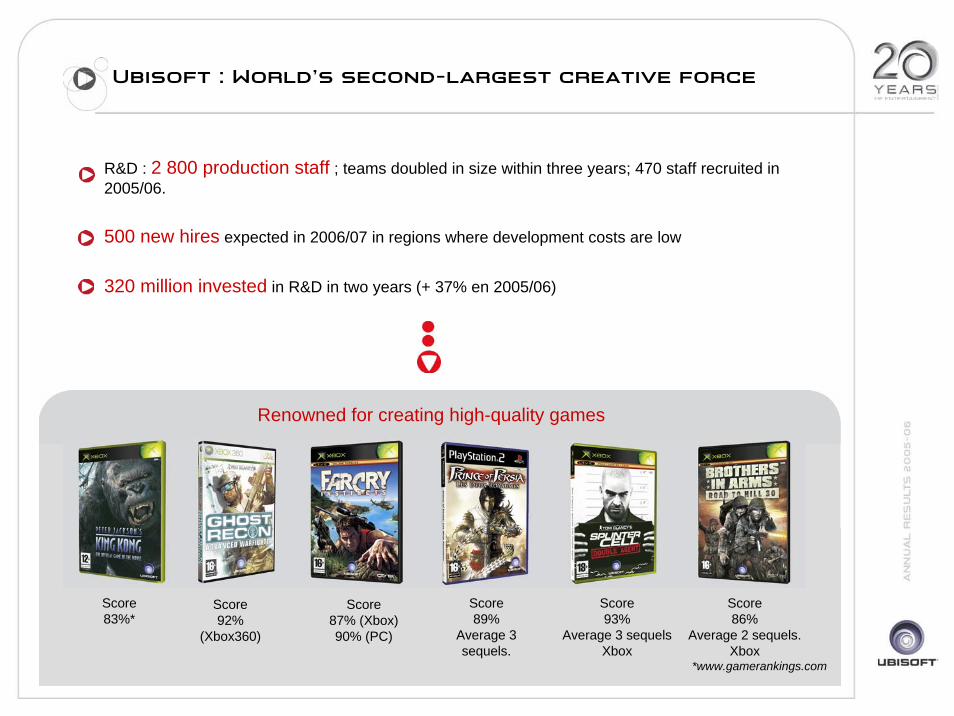
R&D : 2 800 production staff ; teams doubled in size within three years; 470 staff recruited in 2005/06.
500 new hires expected in 2006/07 in regions where development costs are low
320 million invested in R&D in two years (+ 37% en 2005/06)
Renowned for creating high-quality games
Score 83%*
Score92%
(Xbox360)
Score87% (Xbox)90% (PC)
Score 89%
Average 3 sequels.
Score93%
Average 3 sequelsXbox
Score 86%
Average 2 sequels. Xbox
*www.gamerankings.com
Ubisoft : World’s second-largest creative force
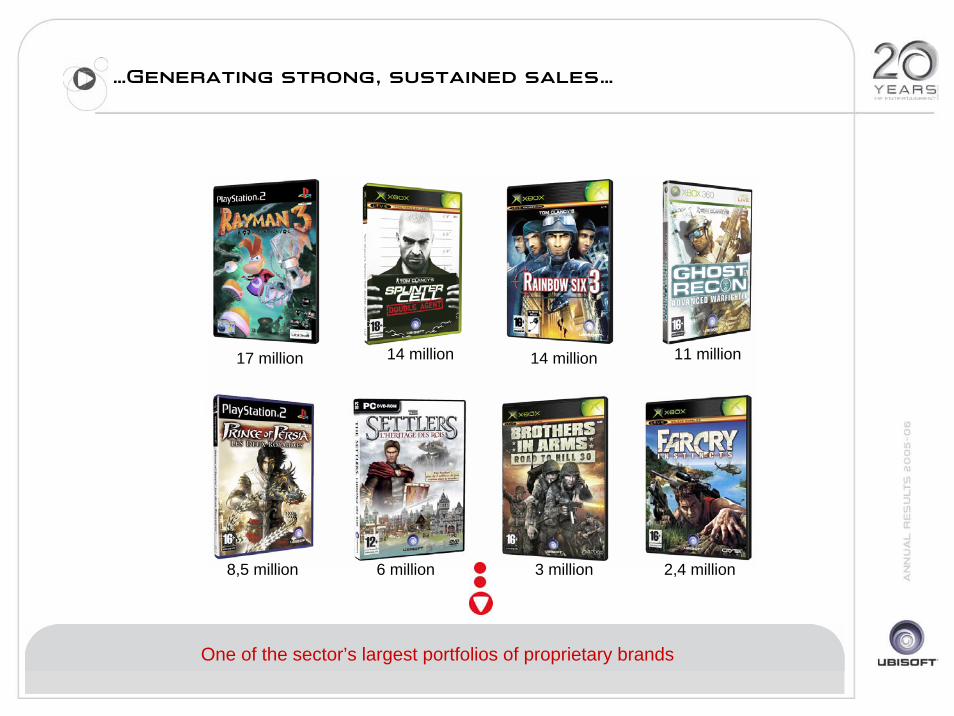
One of the sector’s largest portfolios of proprietary brands
…Generating strong, sustained sales…
17 million 14 million 14 million 11 million
6 million 3 million 2,4 million8,5 million
(*) source: NPD, Chart Track, Media Control, GFK, en valeur, année calendaire 2005, Etats-Unis, UK, France, Allemagne, Italie, Espagne, Australie, CA hors Online
(**) reported figures
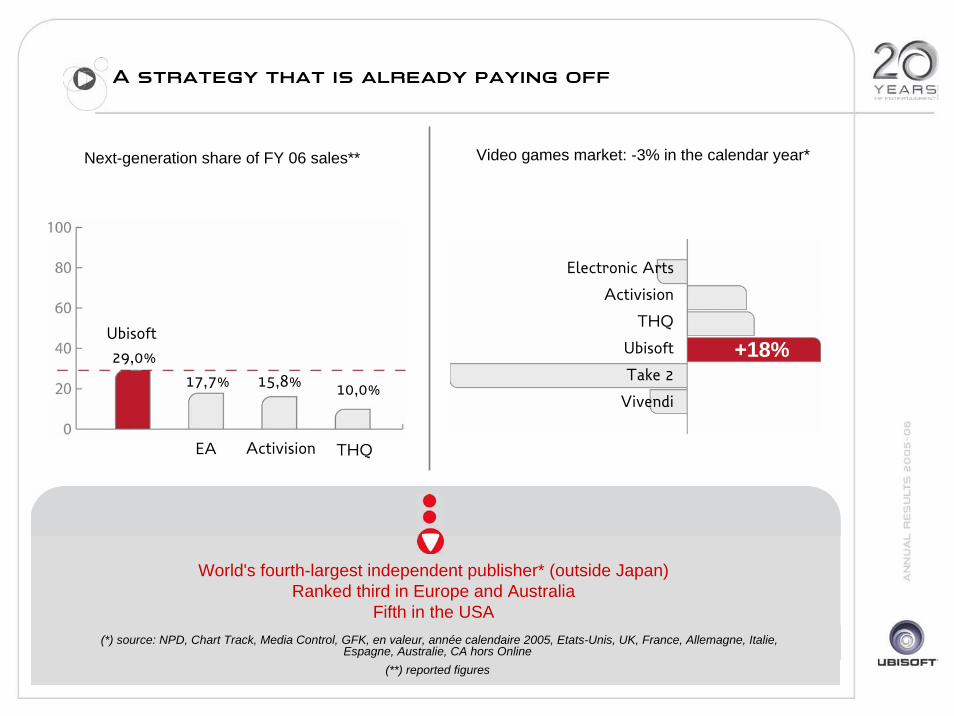
World's fourth-largest independent publisher* (outside Japan)Ranked third in Europe and Australia
Fifth in the USA
Video games market: -3% in the calendar year*Next-generation share of FY 06 sales**
A strategy that is already paying off
Electronic Arts
Activision
THQ
Ubisoft
Take 2
Vivendi
+18%
EA Activision THQ
Ubisoft
29,0%
17,7% 15,8% 10,0%
Agenda
Introduction
Arrival of next-generation platforms: Evolutions and potential
Ubisoft's strategy and strengths
2005/06 financial results
Outlook and conclusions
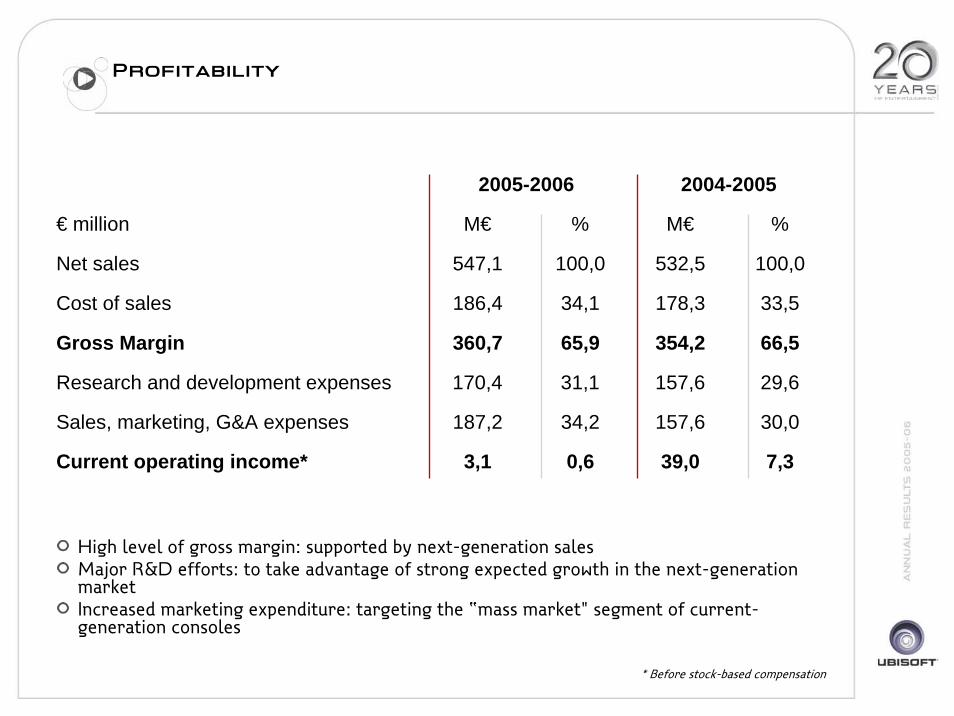
2005-2006 2004-2005
€ million M€ % M€ %
Net sales 547,1 100,0 532,5 100,0
Cost of sales 186,4 34,1 178,3 33,5
Research and development expenses 170,4 31,1 157,6 29,6
Gross Margin 360,7 65,9 354,2 66,5
Sales, marketing, G&A expenses 187,2 34,2 157,6 30,0
Current operating income* 3,1 0,6 39,0 7,3
Profitability
High level of gross margin: supported by next-generation salesMajor R&D efforts: to take advantage of strong expected growth in the next-generation marketIncreased marketing expenditure: targeting the “mass market" segment of current-generation consoles
* Before stock-based compensation
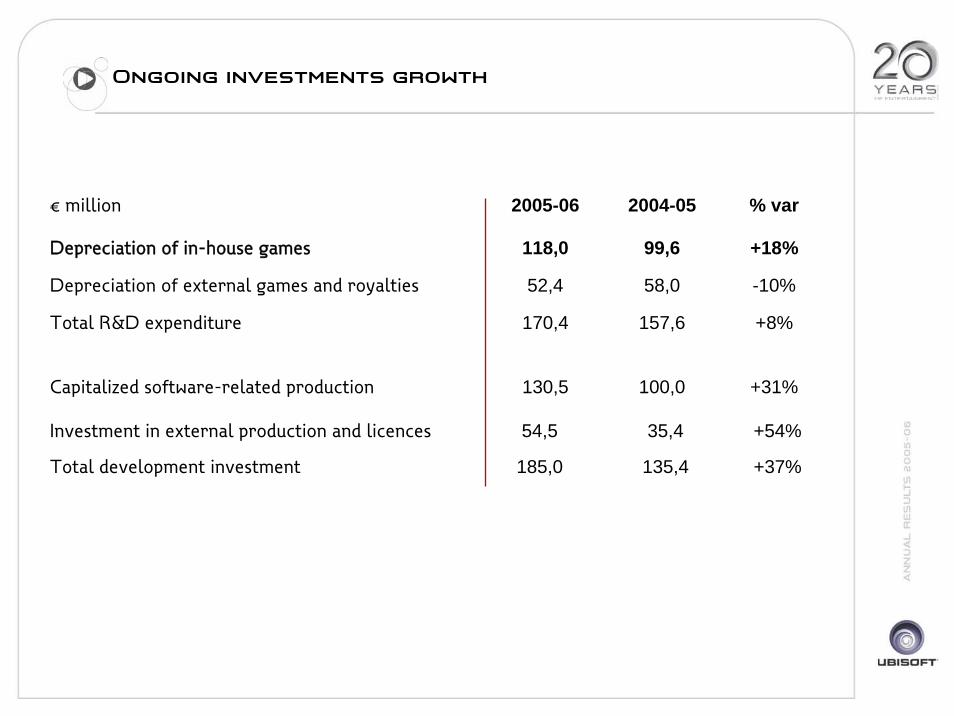
Ongoing investments growth
€ million 2005-06 2004-05 % var
Depreciation of in-house games 118,0
52,4
170,4
130,5
99,6 +18%
Depreciation of external games and royalties 58,0 -10%
Total R&D expenditure 157,6 +8%
Capitalized software-related production 100,0 +31%
Investment in external production and licences 54,5 35,4 +54%
Total development investment 185,0 135,4 +37%
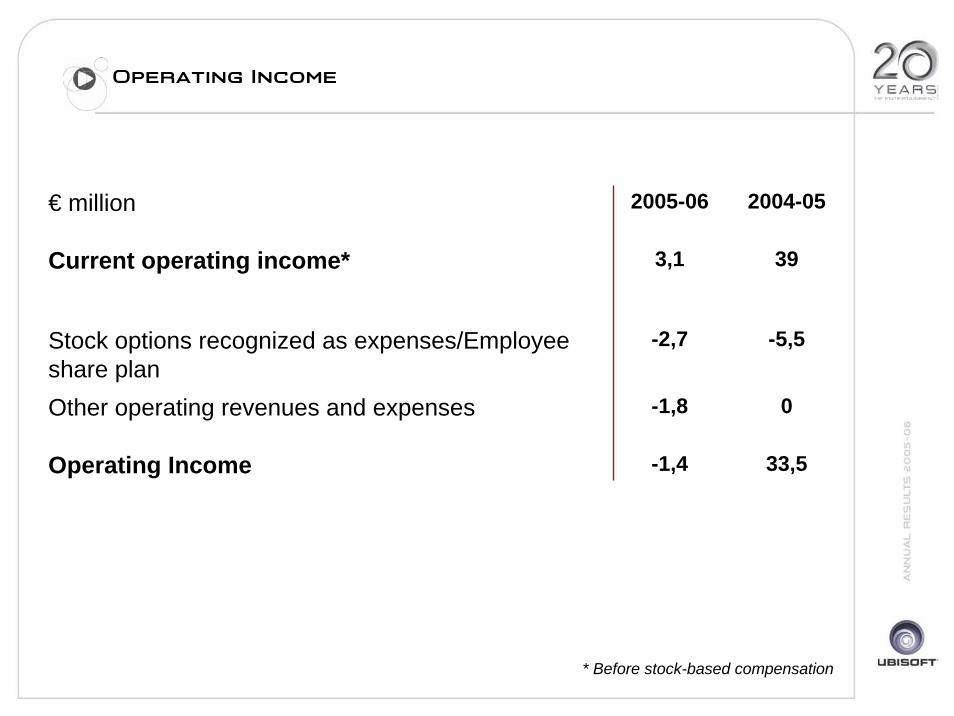
Operating Income
€ million 2005-06 2004-05
Current operating income* 3,1 39
Stock options recognized as expenses/Employeeshare plan
-2,7 -5,5
Other operating revenues and expenses -1,8 0
Operating Income -1,4 33,5
* Before stock-based compensation
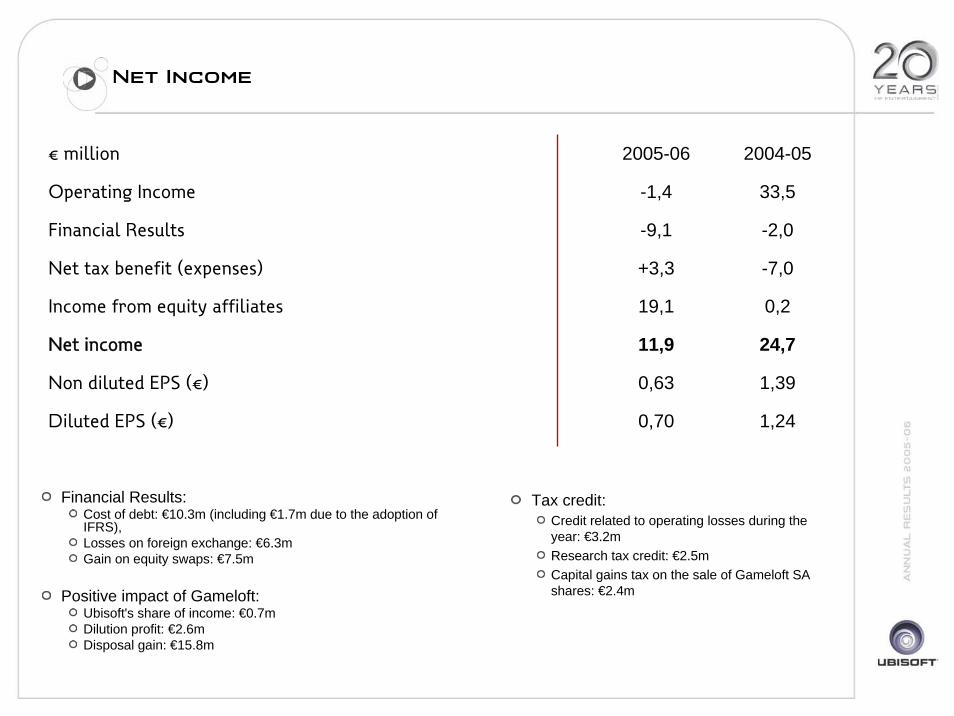
Net Income
Financial Results:Cost of debt: €10.3m (including €1.7m due to the adoption of IFRS),Losses on foreign exchange: €6.3mGain on equity swaps: €7.5m
Positive impact of Gameloft:Ubisoft's share of income: €0.7mDilution profit: €2.6mDisposal gain: €15.8m
€ million 2005-06 2004-05
Operating Income -1,4 33,5
Income from equity affiliates 19,1 0,2
Non diluted EPS (€) 0,63 1,39
Financial Results -9,1 -2,0
Net tax benefit (expenses) +3,3 -7,0
Net income 11,9 24,7
Diluted EPS (€) 0,70 1,24
Tax credit:Credit related to operating losses during the year: €3.2mResearch tax credit: €2.5mCapital gains tax on the sale of Gameloft SA shares: €2.4m
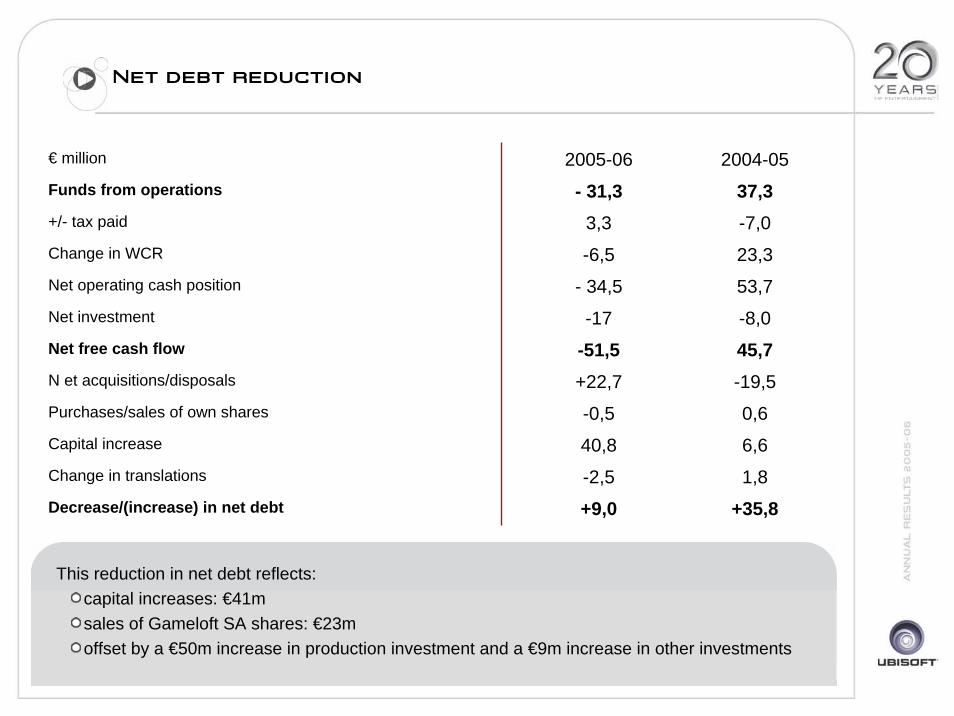
Net debt reduction
This reduction in net debt reflects: capital increases: €41msales of Gameloft SA shares: €23moffset by a €50m increase in production investment and a €9m increase in other investments
€ million 2005-06 2004-05Funds from operations - 31,3 37,3+/- tax paid 3,3 -7,0Change in WCR -6,5 23,3Net operating cash position - 34,5 53,7Net investment -17 -8,0Net free cash flow -51,5 45,7N et acquisitions/disposals +22,7 -19,5Purchases/sales of own shares -0,5 0,6
Change in translations -2,5 1,8
Capital increase 40,8 6,6
Decrease/(increase) in net debt +9,0 +35,8
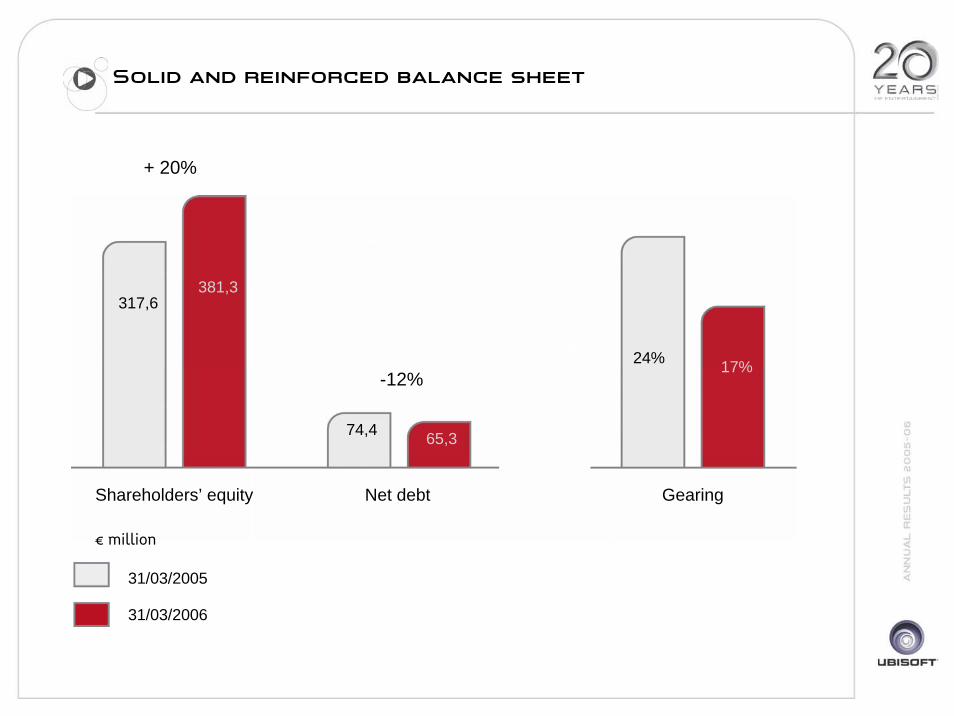
31/03/2005
31/03/2006
Shareholders’ equity Net debt Gearing
317,6381,3
74,4 65,3
24% 17%-12%
+ 20%
Solid and reinforced balance sheet
€ million
Agenda
Introduction
Arrival of next-generation platforms: Evolutions and potential
Ubisoft's strategy and strengths
2005/06 financial results
Outlook and conclusions
Outlook 2006-2007
2006/2007: Installation of new consolesArrival of the Nintendo Wii and Sony PS3
Ongoing transition: market contraction of 7%*
Ubisoft sales growth of 5-10%Next-generation sales: around 60% of total sales
15 next-generation games released during the year, with 5 new brands including Assassin’s Creed, Red Steel and Dark Messiah, 2 Hollywood license games (Open Season and Ninja Turtles) and the return of Splinter Cell and Rayman.
Current operating margin** of 3-4%, due to:Higher prices for next-generation games (positive impact of around 2 percentage points on gross margin)
Expected decline in marketing expenses (positive impact of around 3 percentage points)
Continuing increase of R&D expenditure
(*) Calendar year figures
(**) Before stock-based compensation
Outlook 2007/2008
2007/2008: a year of strong growthInstalled base of next generation consoles: 37 million*17% market growth**
Ubisoft sales growth outpacing the marketRelease of around 25 products on next-generation platforms, including 5 new brands
Strong improvement in current operating income***:Continuation of positive effect of high next-generation prices + Leverage on R&D and fixed costs due to higher nextgen sales
(*) Estimations Ubisoft(**)Données en calendaire
(***) Avant comptabilisation des éléments de rémunération payés en actions
Conclusion
Commitment to investing in game creation over a number of years - a strategy that is paying off
4th independent publisher worldwide
30% of 2005/2006 sales generated on next-platforms; 60% expected in 2006/2007
Strong growth and very high improvement in profitability expected in 2007/2008
Ubisoft's low-cost game creation studios: crucial competitive advantage in winning the next-generation battle
Appendices
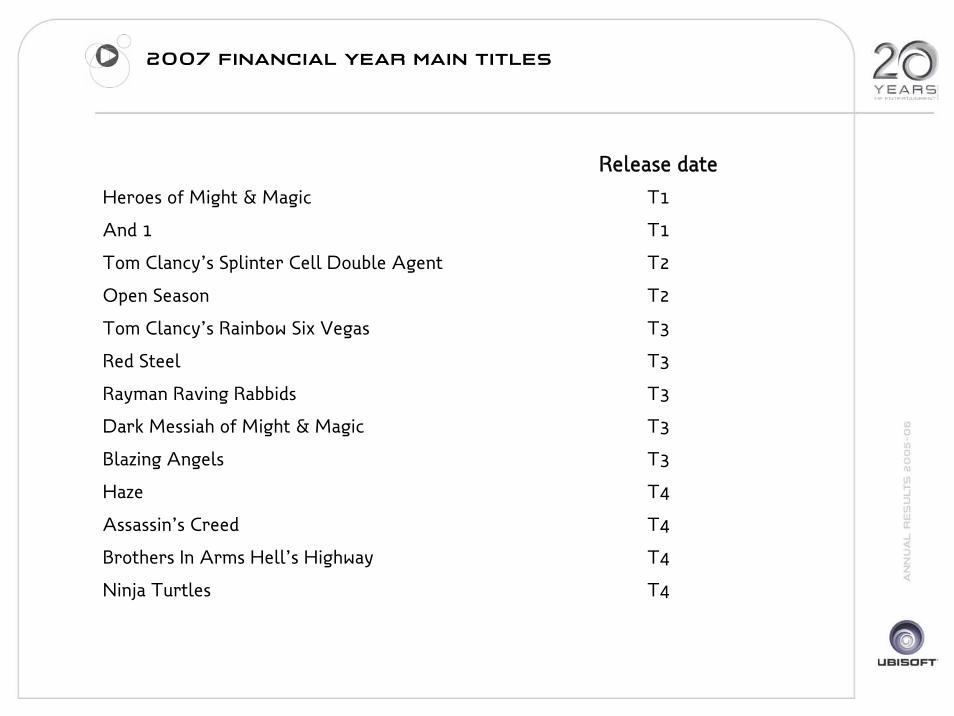
Release date
Heroes of Might & Magic T1
And 1 T1
Tom Clancy’s Splinter Cell Double Agent T2
Open Season T2
Tom Clancy’s Rainbow Six Vegas T3
Red Steel T3
Rayman Raving Rabbids T3
Dark Messiah of Might & Magic T3
Blazing Angels T3
Haze T4
Assassin’s Creed T4
Brothers In Arms Hell’s Highway T4
Ninja Turtles T4
2007 financial year main titles
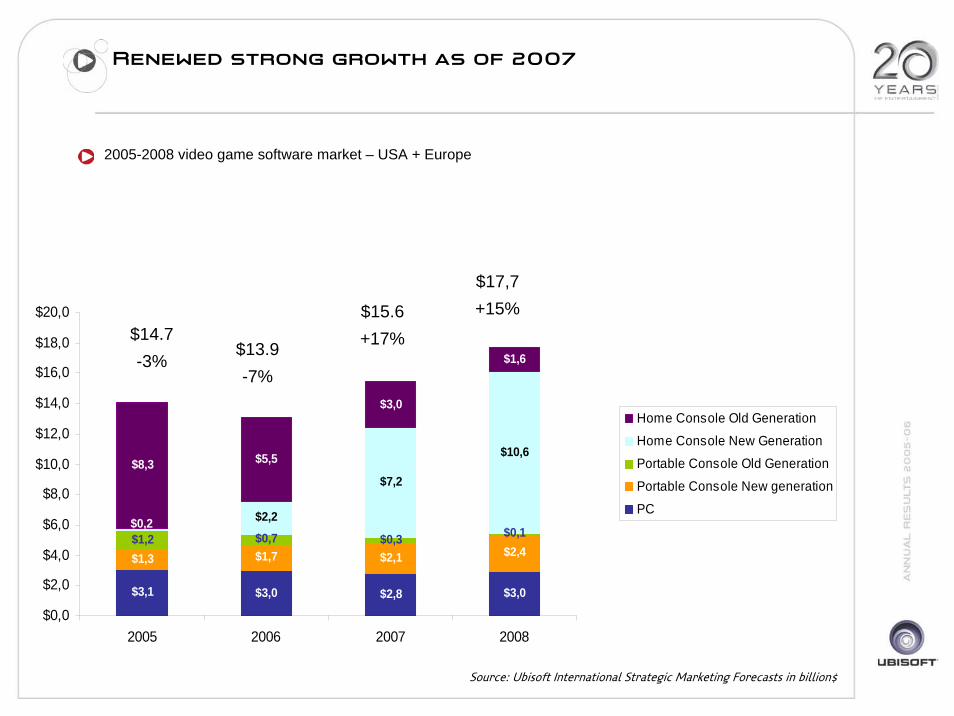
$14.7-3%
$13.9-7%
$15.6+17%
$17,7+15%
2005-2008 video game software market – USA + Europe
Renewed strong growth as of 2007
$3,1 $3,0 $2,8 $3,0
$1,3 $1,7 $2,1 $2,4$1,2 $0,7 $0,3
$2,2
$7,2
$10,6$8,3 $5,5
$3,0
$1,6
$0,1$0,2
$0,0
$2,0
$4,0
$6,0
$8,0
$10,0
$12,0
$14,0
$16,0
$18,0
$20,0
2005 2006 2007 2008
Home Console Old Generation
Home Console New GenerationPortable Console Old Generation
Portable Console New generation
PC
Source: Ubisoft International Strategic Marketing Forecasts in billion$
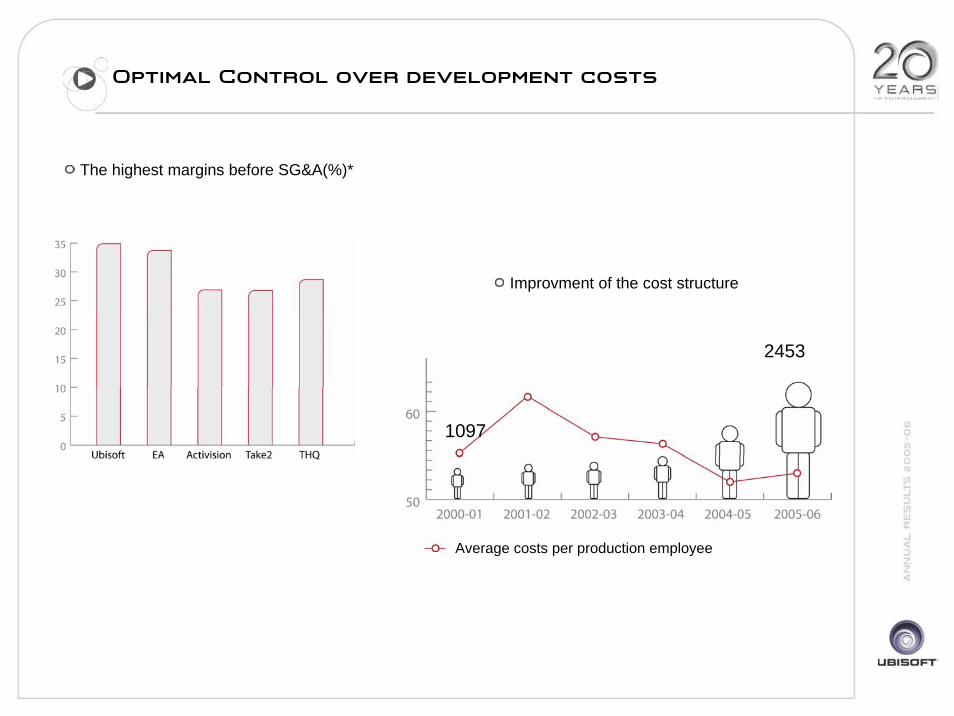
Average costs per production employee
1097
2453
Optimal Control over development costs
The highest margins before SG&A(%)*
Improvment of the cost structure