Embed Size (px)
Citation preview
TRANSFORMING WATER. ENRICHING LIFE.TM
©2018 Evoqua Water Technologies
Gabelli Water ConferenceFebruary 22, 2018
Ron Keating, Chief Executive OfficerBen Stas, Chief Financial Officer
©2018 Evoqua Water Technologies| Page 2
This presentation contains forward-looking statements within the meaning of the Private Securities Litigation Reform Act of 1995. All of these forward-lookingstatements are based on our current expectations, assumptions, estimates and projections. While we believe these expectations, assumptions, estimates andprojections are reasonable, such forward-looking statements are only predictions and involve known and unknown risks and uncertainties, many of which arebeyond our control. These and other important factors may cause our actual results, performance or achievements to differ materially from any future results,performance or achievements expressed or implied by these forward-looking statements, or could affect our share price. Some of the factors that could causeactual results to differ materially from those expressed or implied by the forward-looking statements include among other things, general global economic andbusiness conditions; our ability to compete successfully in our markets; our ability to continue to develop or acquire new products, services and solutions andadapt our business to meet the demands of our customers, comply with changes to government regulations and achieve market acceptance with acceptablemargins; our ability to implement our growth strategy, including acquisitions and our ability to identify suitable acquisition targets; our ability to operate or integrateany acquired businesses, assets or product lines profitably or otherwise successfully implement our growth strategy; delays in enactment or repeals ofenvironmental laws and regulations; the potential for us to become subject to claims relating to handling, storage, release or disposal of hazardous materials;risksassociated with product defects and unanticipated or improper use of our products; the potential for us to incur liabilities to customers as a result of warrantyclaims of failure to meet performance guarantees; our ability to meet our customers’ safety standards or the potential for adverse publicity affecting our reputationas a result of incidents such as workplace accidents, mechanical failures, spills, uncontrolled discharges, damage to customer or third-party property or thetransmission of contaminants or diseases; litigation, regulatory or enforcement actions and reputational risk as a result of the nature of our business or ourparticipation in large-scale projects; seasonality of sales and weather conditions; risks related to government customers, including potential challenges to ourgovernment contracts or our eligibility to serve government customers; the potential for our contracts with federal, state and local governments to be terminated oradversely modified prior to completion; risks related to foreign, federal, state and local environmental, health and safety laws and regulations and the costsassociated therewith; risks associated with international sales and operations, including our operations in China; our ability to adequately protect our intellectualproperty from third-party infringement; our increasing dependence on the continuous and reliable operation of our information technology systems; risks related toour substantial indebtedness; our need for a significant amount of cash, which depends on many factors beyond our control; AEA’s influence over us; and otherfactors to be described in the “Risk Factors” section in our Annual Report on Form 10-K for the fiscal year ended September 30, 2017. All statements other thanstatements of historical fact included in the presentation are forward-looking statements including, but not limited to, expected financial outlook for fiscal 2018.Any forward-looking statement that we make in this presentation speaks only as of February 22, 2018. We undertake no obligation to update or revise, or topublicly announce any update or revision to, any of the forward-looking statements made herein, whether as a result of new information, future events orotherwise.
Use of Non-GAAP Financial Measures - This presentation contains “non-GAAP financial measures,” which are adjusted financial measures that are notcalculatedand presented in accordance with generally accepted accounting principles in the United States, or “GAAP.” These non-GAAP adjusted financial measures areprovided as additional information for investors. We believe these non-GAAP adjusted financial measures, such as Adjusted EBITDA and free cash flow, arehelpful to management and investors in highlighting trends in our operating results, because they exclude, among other things, certain results of decisions that areoutside the control of management, while other measures can differ significantly depending on long-term strategic decisions regarding capital structure, the taxjurisdictions in which we operate and capital investments. The presentation of this additional information is not meant to be considered in isolation or as asubstitute for GAAP measures of net income (loss), or net cash provided by (used in) operating activities prepared in accordance with GAAP. For reconciliationsofthe non-GAAP adjusted financial measures used in this presentation to the nearest respective GAAP measures, see the Appendix to thispresentation.
Forward-Looking Statement Safe Harbor
©2018 Evoqua Water Technologies| Page 3
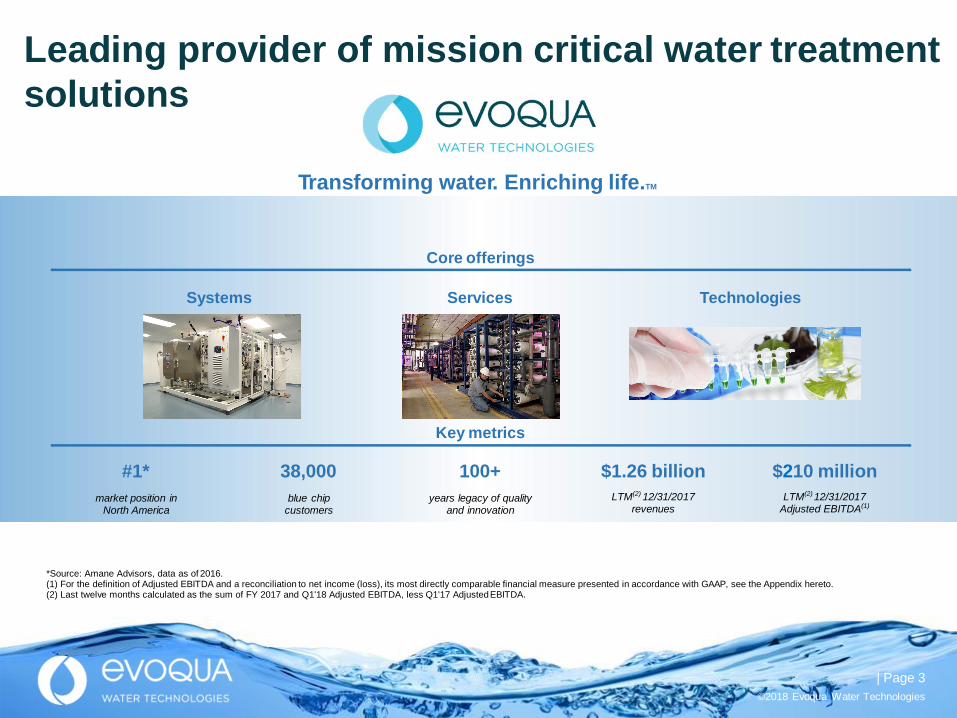
Leading provider of mission critical water treatmentsolutions
#1*market position in
North America
100+years legacy of quality
and innovation
38,000blue chip
customers
Transforming water. Enriching life.TM
$1.26 billionLTM(2) 12/31/2017
revenues
$210 millionLTM(2) 12/31/2017
Adjusted EBITDA(1)
Key metrics
Core offerings
*Source: Amane Advisors, data as of 2016.(1) For the definition of Adjusted EBITDA and a reconciliation to net income (loss), its most directly comparable financial measure presented in accordance with GAAP, see the Appendix hereto.(2) Last twelve months calculated as the sum of FY 2017 and Q1'18 Adjusted EBITDA, less Q1'17 AdjustedEBITDA.
Services TechnologiesSystems
©2018 Evoqua Water Technologies| Page 4
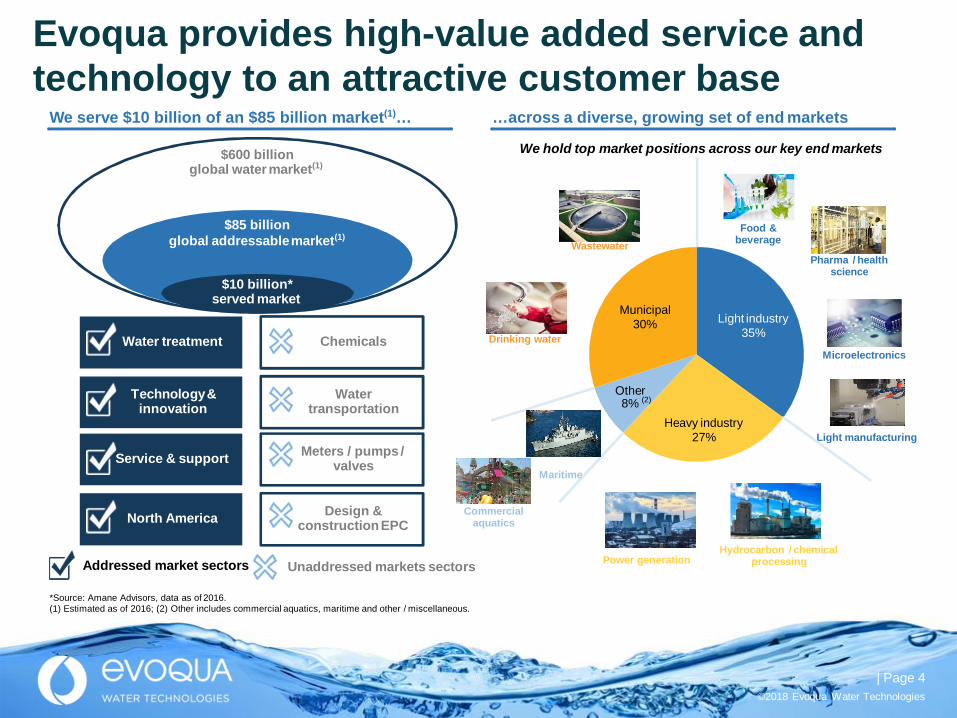
Light industry35%
Heavy industry27%
Municipal30%
Evoqua provides high-value added service andtechnology to an attractive customer base
Service & support
Chemicals
Technology&innovation
North America
Water treatment
Watertransportation
Meters / pumps /valves
Design &constructionEPC
We serve $10 billion of an $85 billion market(1)… …across a diverse, growing set of end markets
$600 billionglobal water market(1)
$85 billionglobal addressablemarket(1)
$10 billion*served market
We hold top market positions across our key end markets
Pharma / healthscience
Power generation
Light manufacturing
Microelectronics
Wastewater
Commercialaquatics
Food &beverage
Drinking water
Hydrocarbon / chemicalprocessingAddressed market sectors Unaddressed markets sectors
*Source: Amane Advisors, data as of 2016.(1) Estimated as of 2016; (2) Other includes commercial aquatics, maritime and other / miscellaneous.
Maritime
Other8% (2)
©2018 Evoqua Water Technologies| Page 5
Rep
rese
ntat
ive cu
stom
ers(1
)
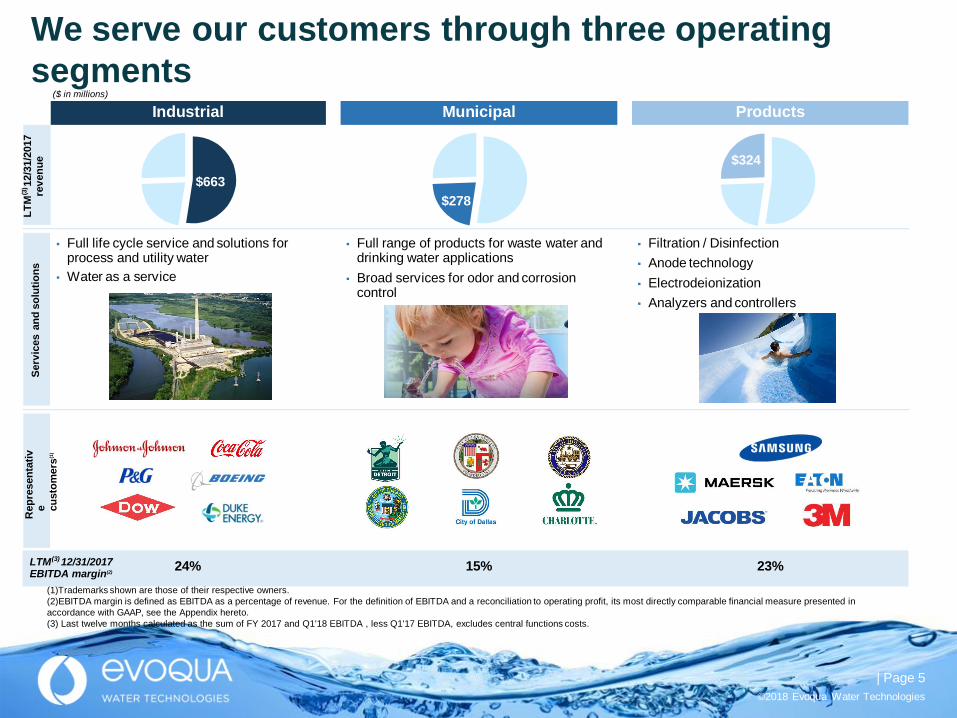
Industrial
▪ Full life cycle service and solutions forprocess and utility water
▪ Water as a service
▪ Filtration / Disinfection▪ Anode technology▪ Electrodeionization▪ Analyzers and controllers
($ in millions)
▪ Full range of products for waste water anddrinking water applications
▪ Broad services for odor and corrosioncontrol
24% 15% 23%
Municipal Products
LTM(3) 12/31/2017EBITDA margin(2)
Serv
ices
and
solu
tions
LTM
(3) 12
/31/
2017
reve
nue
(1)Trademarks shown are those of their respective owners.(2)EBITDA margin is defined as EBITDA as a percentage of revenue. For the definition of EBITDA and a reconciliation to operating profit, its most directly comparable financial measure presented inaccordance with GAAP, see the Appendix hereto.(3) Last twelve months calculated as the sum of FY 2017 and Q1'18 EBITDA , less Q1'17 EBITDA, excludes central functions costs.
$663$278
$324
We serve our customers through three operatingsegments
©2018 Evoqua Water Technologies| Page 6
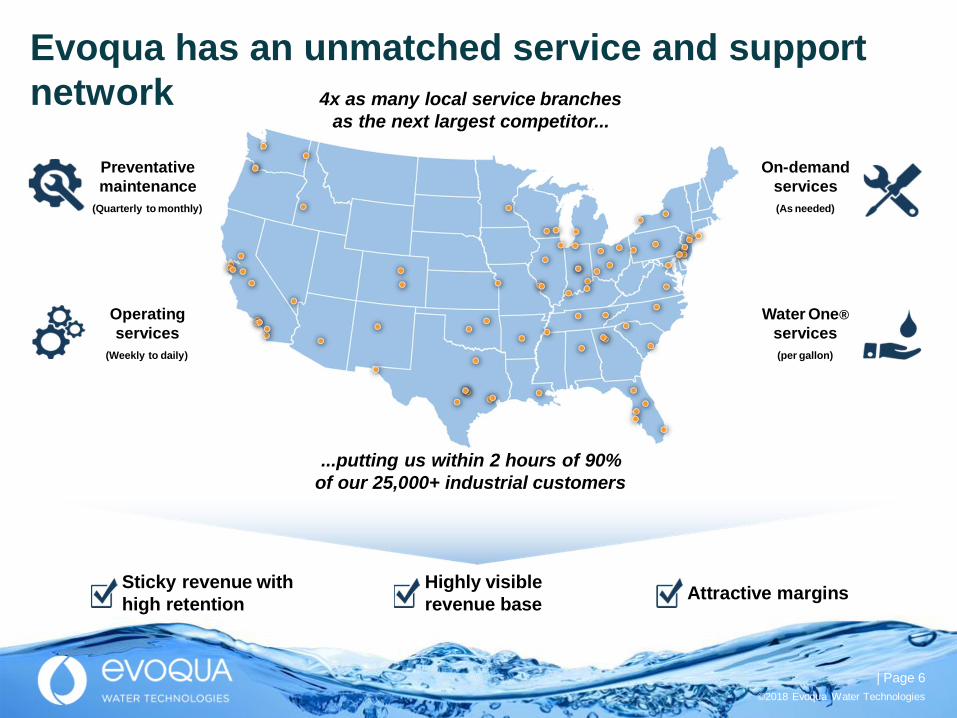
Evoqua has an unmatched service and supportnetwork
Sticky revenue withhigh retention
Highly visiblerevenue base Attractive margins
...putting us within 2 hours of 90%of our 25,000+ industrial customers
4x as many local service branchesas the next largest competitor...
Preventativemaintenance
(Quarterly to monthly)
Operatingservices
(Weekly to daily)
On-demandservices(As needed)
Water One®services(per gallon)
©2018 Evoqua Water Technologies| Page 7
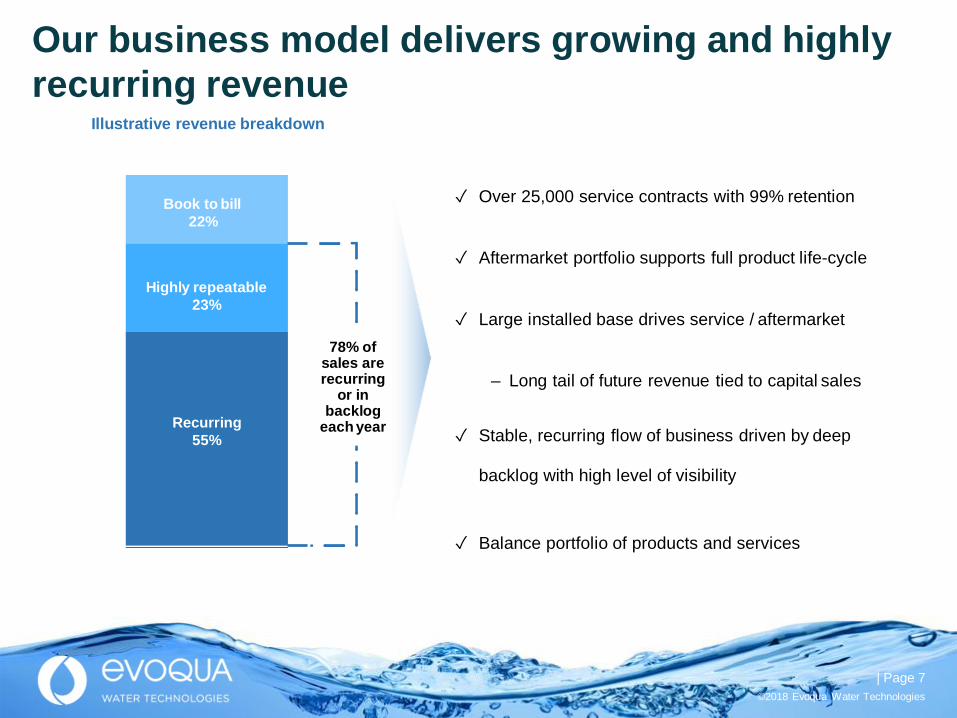
Our business model delivers growing and highlyrecurring revenue
✓ Over 25,000 service contracts with 99% retention
✓ Aftermarket portfolio supports full product life-cycle
✓ Large installed base drives service / aftermarket
– Long tail of future revenue tied to capital sales
✓ Stable, recurring flow of business driven by deep
backlog with high level of visibility
✓ Balance portfolio of products and services
Illustrative revenue breakdown
Book to bill22%
Highly repeatable23%
Recurring55%
78% ofsales arerecurring
or inbacklog
each year
©2018 Evoqua Water Technologies| Page 8
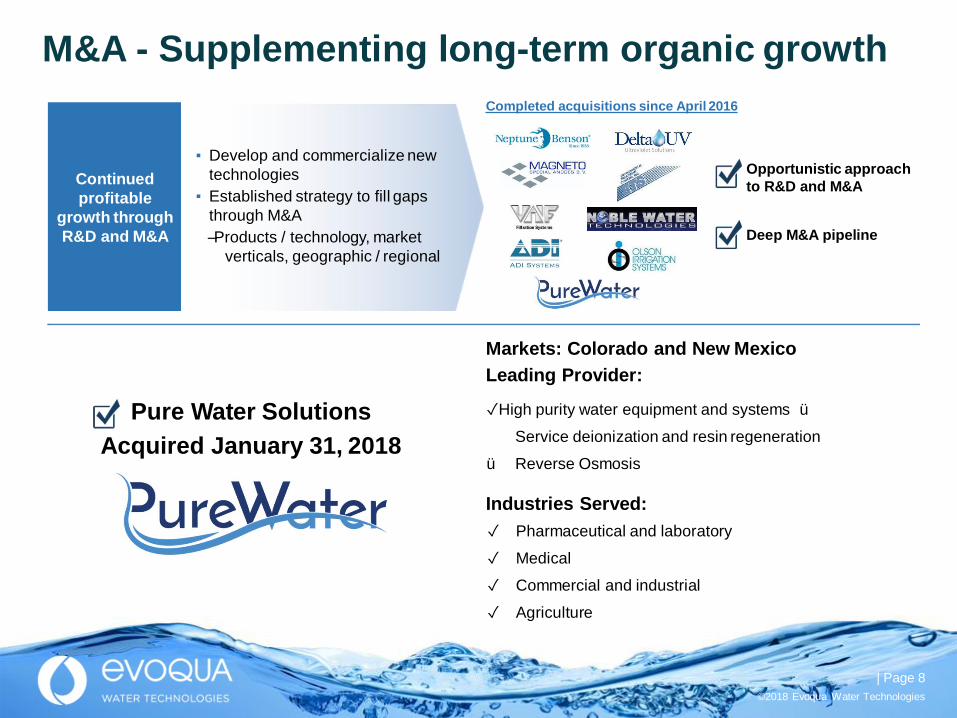
M&A - Supplementing long-term organic growth
▪ Develop and commercialize newtechnologies
▪ Established strategy to fill gapsthrough M&A–Products / technology, market
verticals, geographic / regional
Opportunistic approachto R&D and M&A
Deep M&A pipeline
Completed acquisitions since April 2016
Continuedprofitable
growth throughR&D and M&A
Pure Water SolutionsAcquired January 31, 2018
Markets: Colorado and New MexicoLeading Provider:
✓High purity water equipment and systems üService deionization and resin regeneration
ü Reverse Osmosis
Industries Served:✓ Pharmaceutical and laboratory✓ Medical✓ Commercial and industrial✓ Agriculture
©2018 Evoqua Water Technologies| Page 9
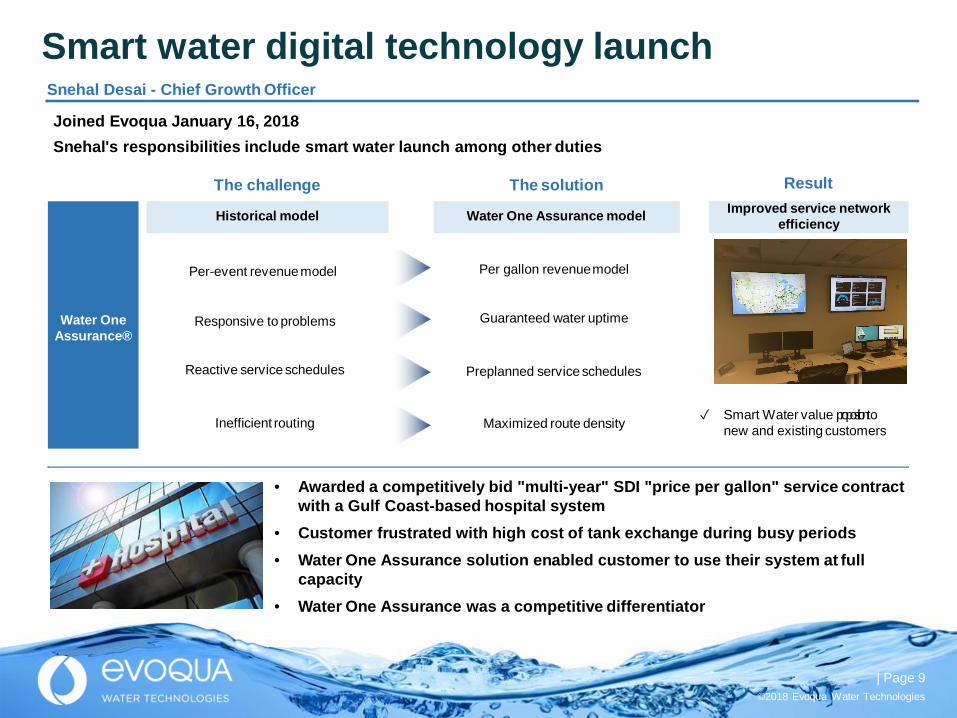
Smart water digital technology launch
Result
Water OneAssurance®
Responsive to problems Guaranteed water uptime
Reactive service schedules Preplanned service schedules
Inefficient routing Maximized route density
Per-event revenuemodel Per gallon revenuemodel
Historical model Water One Assurance model Improved service networkefficiency
✓ Smart Water value proposition tonew and existing customers
• Awarded a competitively bid "multi-year" SDI "price per gallon" service contractwith a Gulf Coast-based hospital system
• Customer frustrated with high cost of tank exchange during busy periods• Water One Assurance solution enabled customer to use their system at full
capacity• Water One Assurance was a competitive differentiator
Snehal Desai - Chief Growth Officer
Joined Evoqua January 16, 2018Snehal's responsibilities include smart water launch among other duties
The challenge The solution
©2018 Evoqua Water Technologies| Page 10
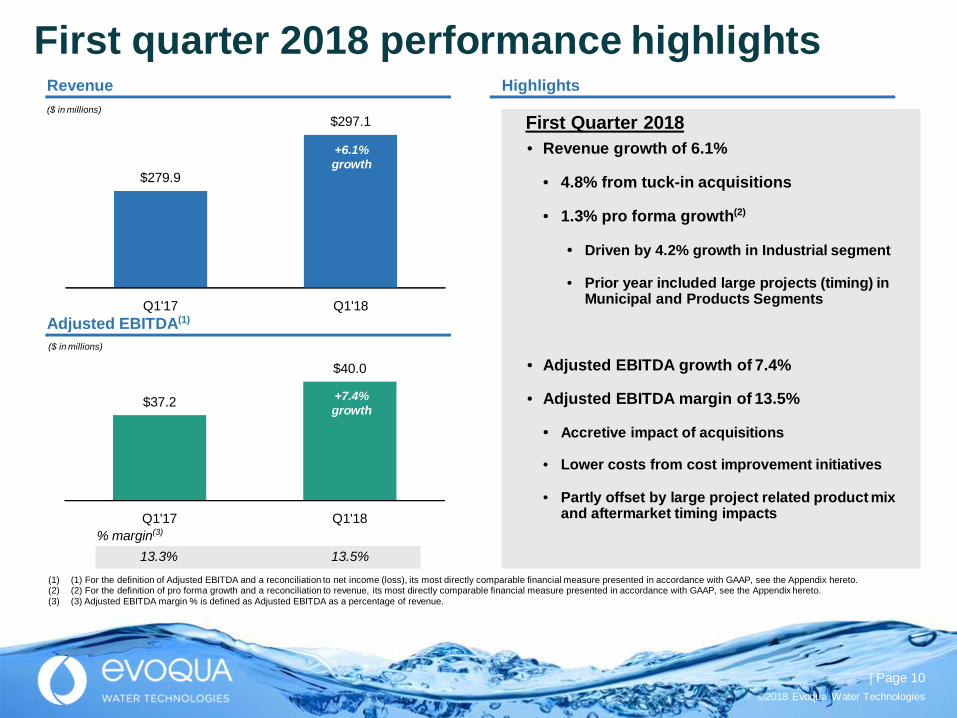
Q1'18
$279.9
$297.1
Q1'18
$37.2
$40.0
Q1'17% margin(3)
($ in millions)
Q1'17Adjusted EBITDA(1)
Revenue Highlights
First Quarter 2018• Revenue growth of 6.1%
• 4.8% from tuck-in acquisitions
• 1.3% pro forma growth(2)
• Driven by 4.2% growth in Industrial segment
• Prior year included large projects (timing) inMunicipal and Products Segments
• Adjusted EBITDA growth of 7.4%
• Adjusted EBITDA margin of 13.5%
• Accretive impact of acquisitions
• Lower costs from cost improvement initiatives
• Partly offset by large project related product mixand aftermarket timing impacts
($ in millions)
13.3% 13.5%(1) (1) For the definition of Adjusted EBITDA and a reconciliation to net income (loss), its most directly comparable financial measure presented in accordance with GAAP, see the Appendix hereto.(2) (2) For the definition of pro forma growth and a reconciliation to revenue, its most directly comparable financial measure presented in accordance with GAAP, see the Appendix hereto.(3) (3) Adjusted EBITDA margin % is defined as Adjusted EBITDA as a percentage of revenue.
+7.4%growth
+6.1%growth
First quarter 2018 performance highlights
©2018 Evoqua Water Technologies| Page 11
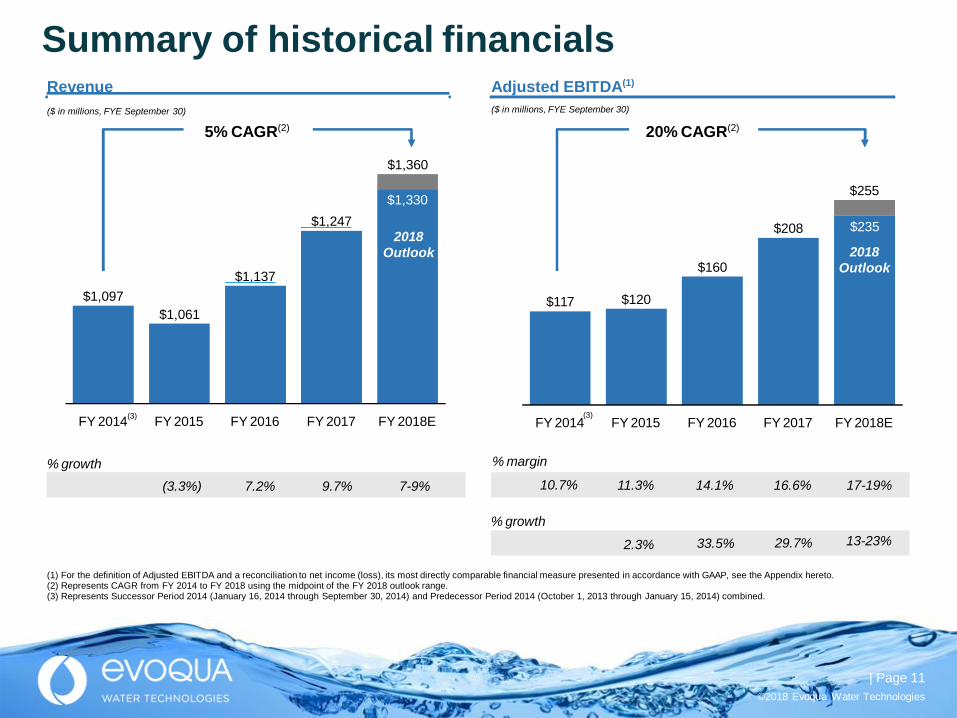
FY 2014 FY 2015 FY 2016 FY 2017 FY 2018E
$117 $120
$160
$208
$255
FY 2015 FY 2016 FY 2017 FY 2018E
$1,097$1,061
$1,137
$1,247
$1,360
% growth % margin
% growth
Revenue Adjusted EBITDA(1)
($ in millions, FYE September 30) ($ in millions, FYE September 30)
5% CAGR(2)
$1,330
2018Outlook
(2)
7-9%9.7%7.2%(3.3%) 17-19%16.6%14.1%11.3%10.7%
13-23%2.3% 33.5% 29.7%
(1) For the definition of Adjusted EBITDA and a reconciliation to net income (loss), its most directly comparable financial measure presented in accordance with GAAP, see the Appendix hereto.(2) Represents CAGR from FY 2014 to FY 2018 using the midpoint of the FY 2018 outlook range.(3) Represents Successor Period 2014 (January 16, 2014 through September 30, 2014) and Predecessor Period 2014 (October 1, 2013 through January 15, 2014) combined.
$235
2018Outlook
20% CAGR(2)
FY 2014(3) (3)
Summary of historical financials
©2018 Evoqua Water Technologies| Page 12
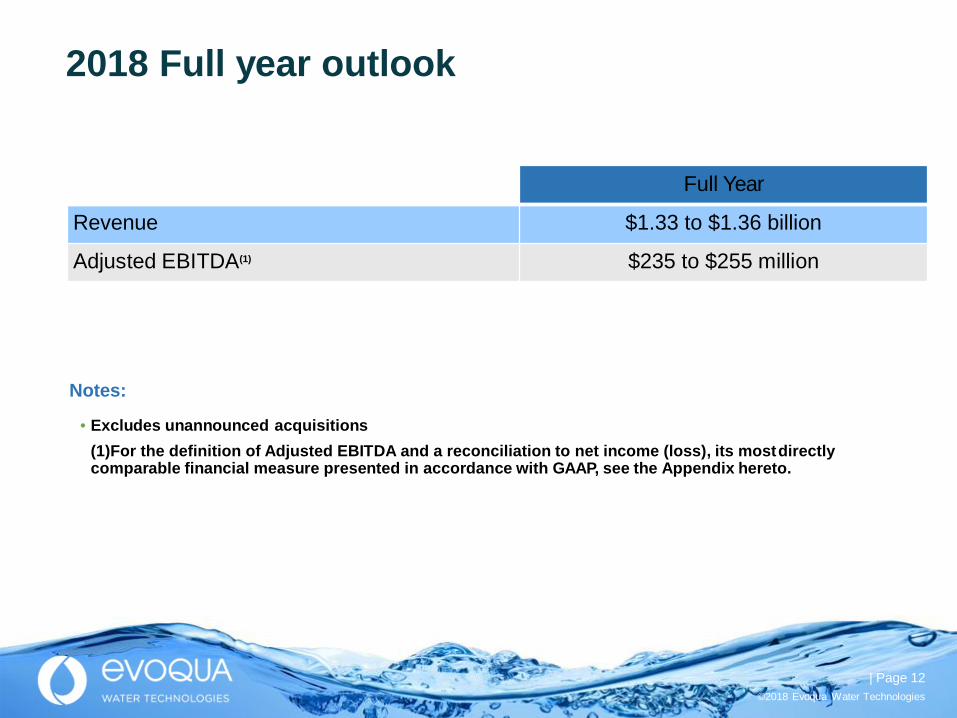
Full Year
Revenue $1.33 to $1.36 billion
Adjusted EBITDA(1) $235 to $255 million
Notes:
• Excludes unannounced acquisitions(1)For the definition of Adjusted EBITDA and a reconciliation to net income (loss), its mostdirectlycomparable financial measure presented in accordance with GAAP, see the Appendix hereto.
2018 Full year outlook
TRANSFORMING WATER. ENRICHING LIFE.TM
©2018 Evoqua Water Technologies