Embed Size (px)
Citation preview
25 / 06 / 2008
APPLICATION OF THE BASEL II REFORM
2APPLICATION OF THE BASEL II REFORM 25 / 06 / 2008
Disclaimer
The following presentation contains a number of forwardThe following presentation contains a number of forward--looking statements relating to looking statements relating to Societe GeneraleSociete Generale’’ss targets and strategy. These targets and strategy. These forecasts are based on a series of assumptions, both general andforecasts are based on a series of assumptions, both general and specific. As a result, there is a risk that these projections wspecific. As a result, there is a risk that these projections will not be met. ill not be met. Readers are therefore advised not to rely on these figures more Readers are therefore advised not to rely on these figures more than is justified as the Groupthan is justified as the Group’’s future results are liable to be affected by a s future results are liable to be affected by a number of factors and may therefore differ from current estimatenumber of factors and may therefore differ from current estimates. Readers should take into account elements of uncertainty and s. Readers should take into account elements of uncertainty and risk when risk when basing their investment decisions on information provided in thibasing their investment decisions on information provided in this presentation. Neither s presentation. Neither Societe GeneraleSociete Generale nor its representatives shall have nor its representatives shall have any liability whatsoever for any loss arising from any use of thany liability whatsoever for any loss arising from any use of this presentation or its contents or otherwise arising in connectiis presentation or its contents or otherwise arising in connection with this on with this presentation or any other information or material discussed.presentation or any other information or material discussed.
The calculation of the quarterly results at March 31st, 2008 by The calculation of the quarterly results at March 31st, 2008 by core business takes into account the application of Basel II stacore business takes into account the application of Basel II standards at ndards at Societe GeneraleSociete Generale Group. Basel II figures mentioned in the following presentationGroup. Basel II figures mentioned in the following presentation have not been audited by the Statutory Auditors.have not been audited by the Statutory Auditors.
The figures provided for the first quarter of 2008 have been preThe figures provided for the first quarter of 2008 have been prepared in accordance with IFRS (International Financial Reportingpared in accordance with IFRS (International Financial Reporting Standards) Standards) adopted by the European Union. They do not constitute a full setadopted by the European Union. They do not constitute a full set of interim financial statements as defined in IAS 34 “Interim Fof interim financial statements as defined in IAS 34 “Interim Financial inancial Reporting”, and have not been audited by the Statutory Auditors.Reporting”, and have not been audited by the Statutory Auditors. Societe GeneraleSociete Generale plans to publish interim financial statements for the sixplans to publish interim financial statements for the six--month period ending June 30th 2008.month period ending June 30th 2008.
Unless otherwise specified, the sources for the business rankingUnless otherwise specified, the sources for the business rankings are internals are internal. .
3APPLICATION OF THE BASEL II REFORM 25 / 06 / 2008
� Basel II key principles
� Application of the reform at Société Générale
� Pillar 1: regulatory capital requirements �New measurement of risk-weighted assets�Basel II Tier One ratio
� Changes in Group financial communication
� Conclusion
� Supplementary data
4APPLICATION OF THE BASEL II REFORM 25 / 06 / 2008
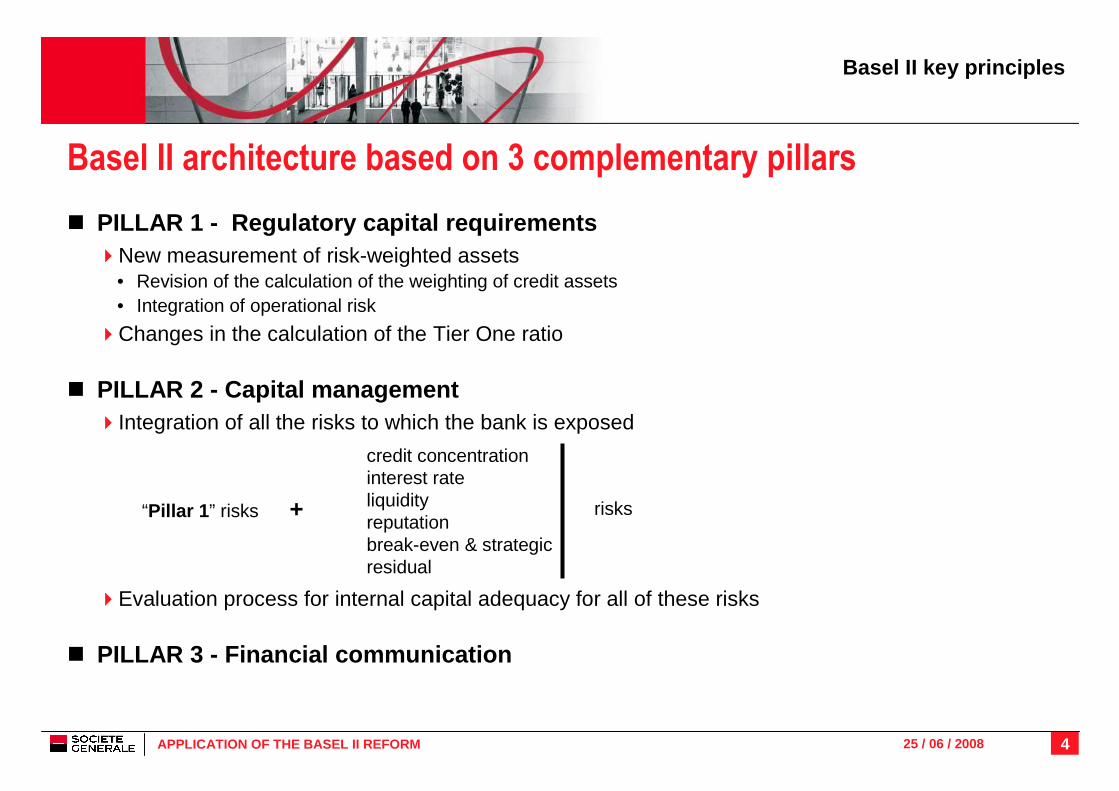
Basel II architecture based on 3 complementary pillars
� PILLAR 1 - Regulatory capital requirements �New measurement of risk-weighted assets
• Revision of the calculation of the weighting of credit assets • Integration of operational risk
�Changes in the calculation of the Tier One ratio
� PILLAR 2 - Capital management�Integration of all the risks to which the bank is exposed
�Evaluation process for internal capital adequacy for all of these risks
� PILLAR 3 - Financial communication
Basel II key principles
“Pillar 1 ” risks +
credit concentrationinterest rateliquidity reputationbreak-even & strategicresidual
risks
5APPLICATION OF THE BASEL II REFORM 25 / 06 / 2008
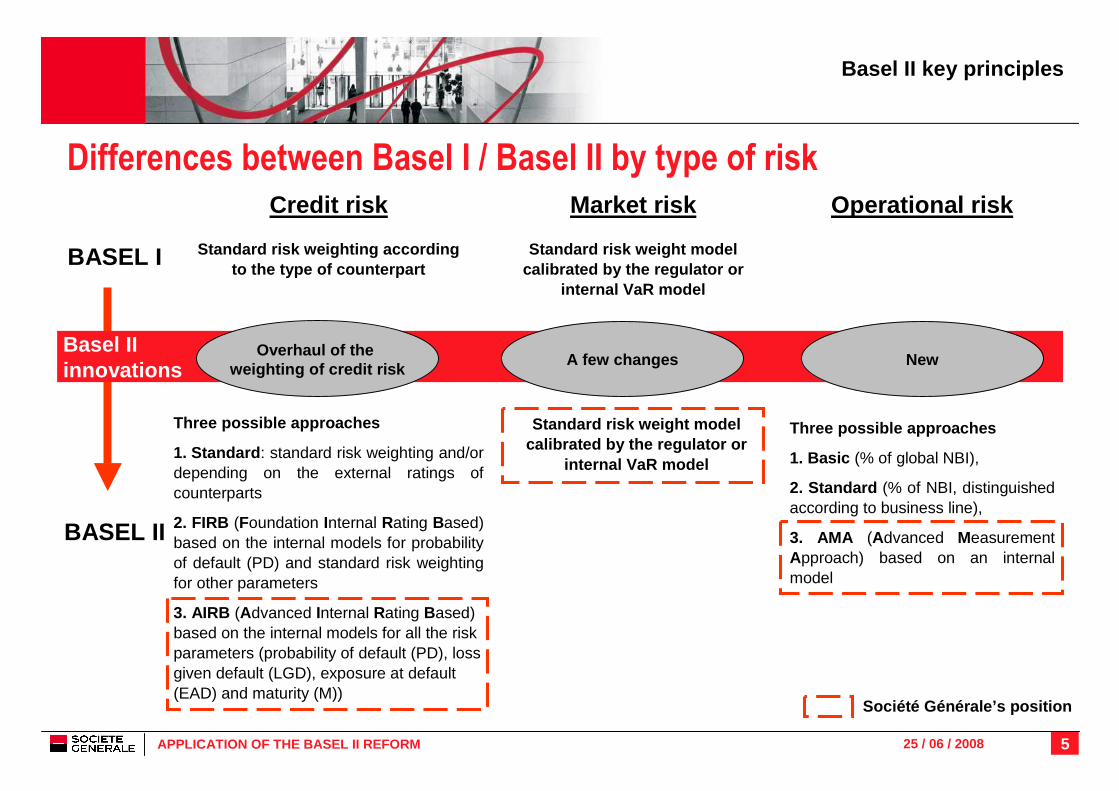
Differences between Basel I / Basel II by type of risk
BASEL I
BASEL II
Standard risk weighting according to the type of counterpart
Three possible approaches
1. Standard : standard risk weighting and/or depending on the external ratings of counterparts
2. FIRB (Foundation Internal Rating Based) based on the internal models for probability of default (PD) and standard risk weighting for other parameters
3. AIRB (Advanced Internal Rating Based)based on the internal models for all the risk parameters (probability of default (PD), loss given default (LGD), exposure at default (EAD) and maturity (M))
Three possible approaches
1. Basic (% of global NBI),
2. Standard (% of NBI, distinguished according to business line),
3. AMA (Advanced MeasurementApproach) based on an internal model
Market riskCredit risk Operational risk
Standard risk weight model calibrated by the regulator or
internal VaR model
Société Générale’s position
Basel IIinnovations
Standard risk weight model calibrated by the regulator or
internal VaR model
Overhaul of the weighting of credit risk
A few changes New
Basel II key principles
6APPLICATION OF THE BASEL II REFORM 25 / 06 / 2008
� Basel II key principles
� Application of the reform at Société Générale
� Pillar 1: regulatory capital requirements �New measurement of risk-weighted assets�Basel II Tier One ratio
� Changes in Group financial communication
� Conclusion
� Supplementary data
7APPLICATION OF THE BASEL II REFORM 25 / 06 / 2008
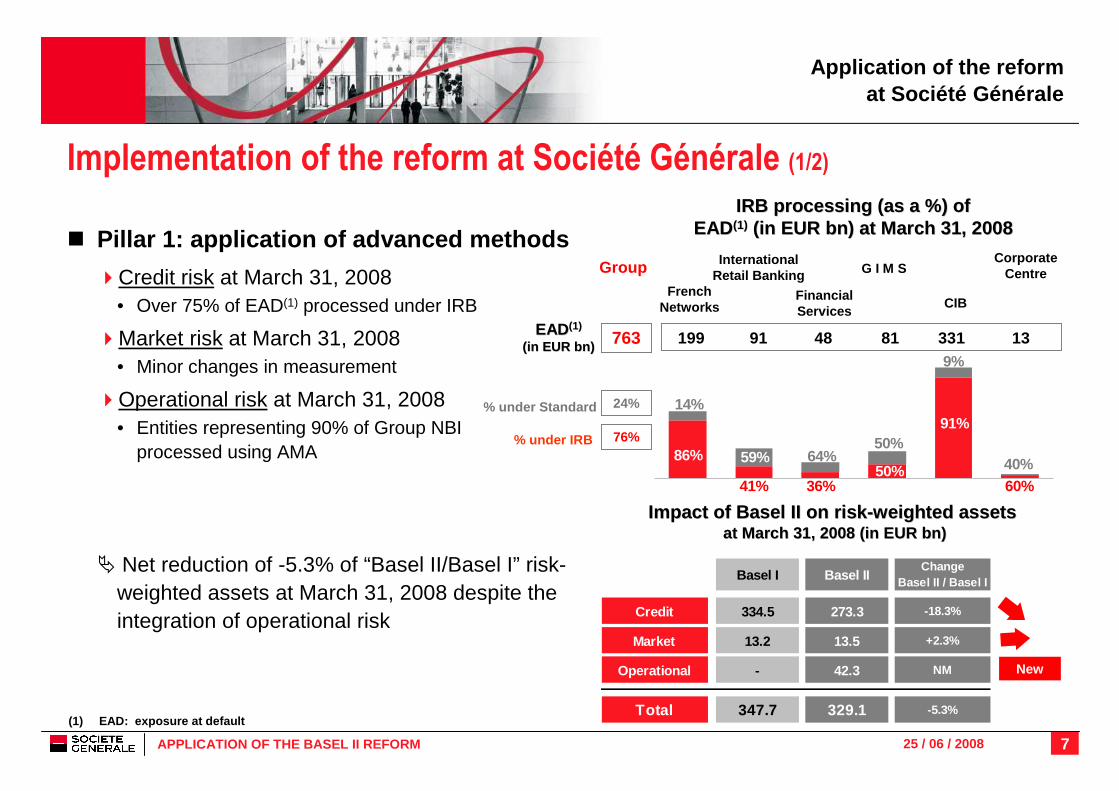
Implementation of the reform at Société Générale (1/2)
� Pillar 1: application of advanced methods
�Credit risk at March 31, 2008• Over 75% of EAD(1) processed under IRB
�Market risk at March 31, 2008• Minor changes in measurement
�Operational risk at March 31, 2008• Entities representing 90% of Group NBI
processed using AMA
� Net reduction of -5.3% of “Basel II/Basel I” risk-weighted assets at March 31, 2008 despite the integration of operational risk
IRB processing IRB processing (as a %)(as a %) ofofEADEAD (1)(1) (in EUR (in EUR bnbn) at March 31, 2008) at March 31, 2008
Application of the reform at Société Générale
CIBFrench
Networks
CorporateCentre
InternationalRetail Banking
FinancialServices
G I M S
(1) EAD: exposure at default
Impact of Basel II on riskImpact of Basel II on risk --weighted assetsweighted assetsat March 31, 2008 (in EUR at March 31, 2008 (in EUR bnbn ))
EADEAD (1)(1)
(in EUR bn)(in EUR bn)
% under Standard
New
% under IRB
Basel I Basel IIChange
Basel II / Basel I
Credit 334.5 273.3 -18.3%
Market 13.2 13.5 +2.3%
Operational - 42.3 NM
Total 347.7 329.1 -5.3%
24%
Group
76%
763
86%
41% 36%50%
91%
60%40%
14%
59% 64%50%
9%
199 91 48 331 1381
8APPLICATION OF THE BASEL II REFORM 25 / 06 / 2008
Implementation of the reform at Société Générale (2/2)
� Pillar 2: a review of the capital management under Basel II is planned by the regulator for the end of 2008
� Pillar 3: the publication of information compliant with Basel II requirements in the 2009 Registration Document
�Financial communication in 2008 of both Basel I and Basel II figures• Quarterly publication in 2008 of the impact of the reform on risk-weighted assets (RWA),
return on equity at the core businesses, and prudential ratios
�Registration Document published in the first quarter of 2009• Publication of comprehensive information in chapter 9 “Risk Management”
Application of the reform at Société Générale
9APPLICATION OF THE BASEL II REFORM 25 / 06 / 2008
� Basel II key principles
� Application of the reform at Société Générale
� Pillar 1: regulatory capital requirements �New measurement of risk-weighted assets�Basel II Tier One ratio
� Changes in Group financial communication
� Conclusion
� Supplementary data
10APPLICATION OF THE BASEL II REFORM 25 / 06 / 2008
New measurement of risk-weighted assetsCredit risk
Parameters used to calculated weighted assets (AIRB)
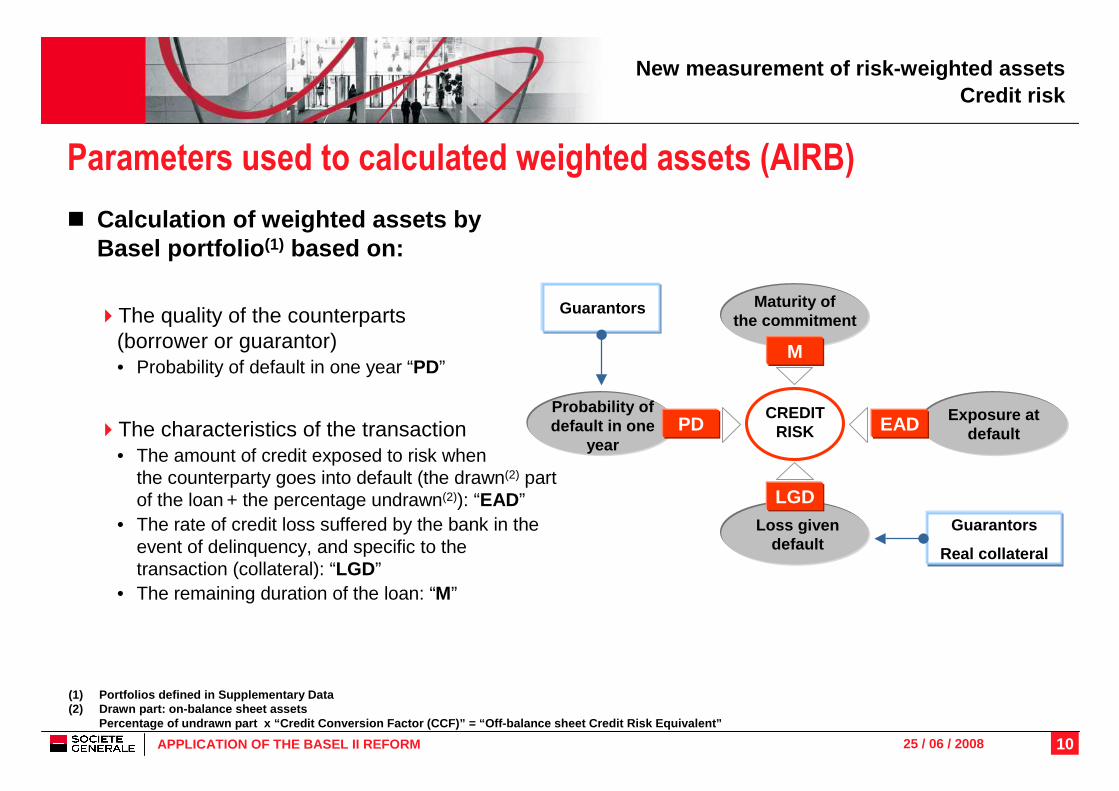
� Calculation of weighted assets by Basel portfolio (1) based on:
�The quality of the counterparts (borrower or guarantor) • Probability of default in one year “PD”
�The characteristics of the transaction• The amount of credit exposed to risk when
the counterparty goes into default (the drawn(2) part of the loan + the percentage undrawn(2)): “EAD”
• The rate of credit loss suffered by the bank in the event of delinquency, and specific to the transaction (collateral): “LGD”
• The remaining duration of the loan: “M”
(1) Portfolios defined in Supplementary Data(2) Drawn part: on-balance sheet assets
Percentage of undrawn part x “Credit Conversion Fa ctor (CCF)” = “Off-balance sheet Credit Risk Equival ent”
M
EAD
LGD
Exposure at default
Maturity of the commitment
Loss given default
Guarantors
Guarantors
Real collateral
CREDITRISK
Probability of default in one
yearPD
11APPLICATION OF THE BASEL II REFORM 25 / 06 / 2008
0%
100%
200%
AAA AA A BBB BB B CCC
New measurement of risk-weighted assetsCredit risk
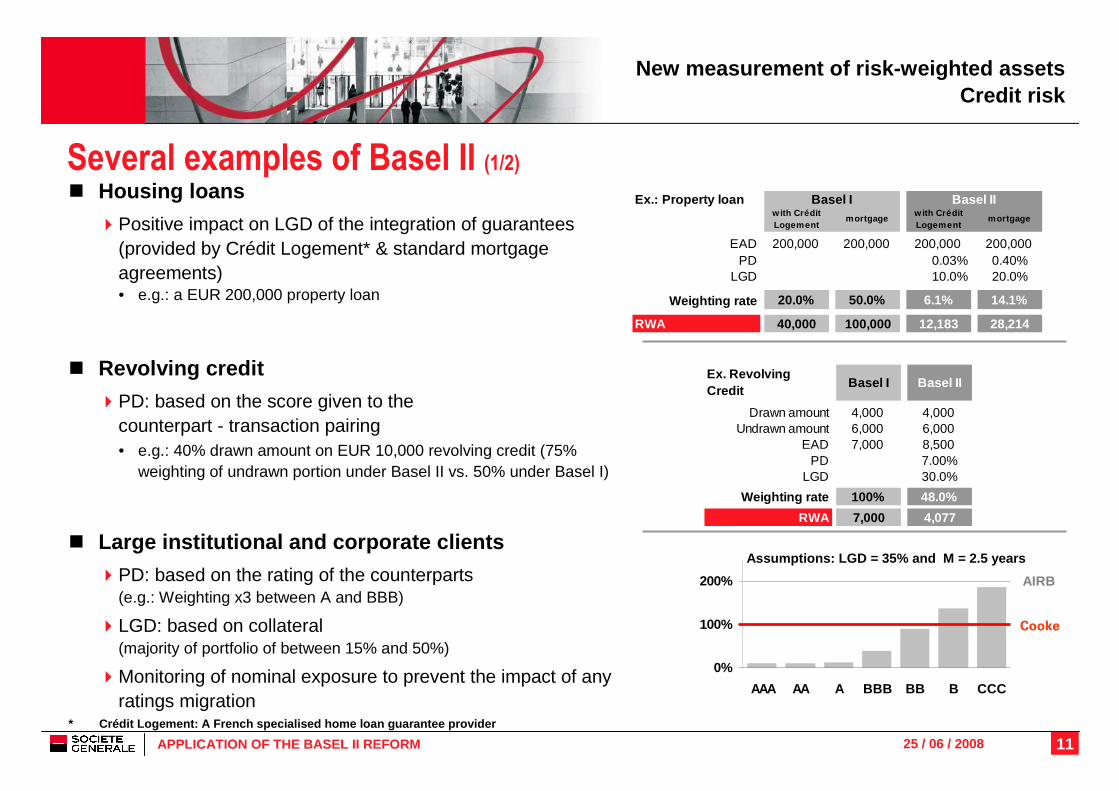
Several examples of Basel II (1/2)� Housing loans
�Positive impact on LGD of the integration of guarantees (provided by Crédit Logement* & standard mortgage agreements)• e.g.: a EUR 200,000 property loan
� Revolving credit
�PD: based on the score given to the counterpart - transaction pairing• e.g.: 40% drawn amount on EUR 10,000 revolving credit (75%
weighting of undrawn portion under Basel II vs. 50% under Basel I)
� Large institutional and corporate clients
�PD: based on the rating of the counterparts (e.g.: Weighting x3 between A and BBB)
�LGD: based on collateral (majority of portfolio of between 15% and 50%)
�Monitoring of nominal exposure to prevent the impact of any ratings migration
Cooke
AIRB
Assumptions: LGD = 35% and M = 2.5 years
* Crédit Logement: A French specialised home loan gua rantee provider
Ex.: Property loanwith Crédit Logement
mortgagew ith Crédit Logement
mortgage
EAD 200,000 200,000 200,000 200,000 PD 0.03% 0.40%
LGD 10.0% 20.0%
Weighting rate 20.0% 50.0% 6.1% 14.1%
RWA 40,000 100,000 12,183 28,214
Basel I Basel II
Ex. Revolving Credit
Basel I Basel II
Drawn amount 4,000 4,000 Undrawn amount 6,000 6,000
EAD 7,000 8,500 PD 7.00%
LGD 30.0%
Weighting rate 100% 48.0%
RWA 7,000 4,077
12APPLICATION OF THE BASEL II REFORM 25 / 06 / 2008
New measurement of risk-weighted assetsCredit risk
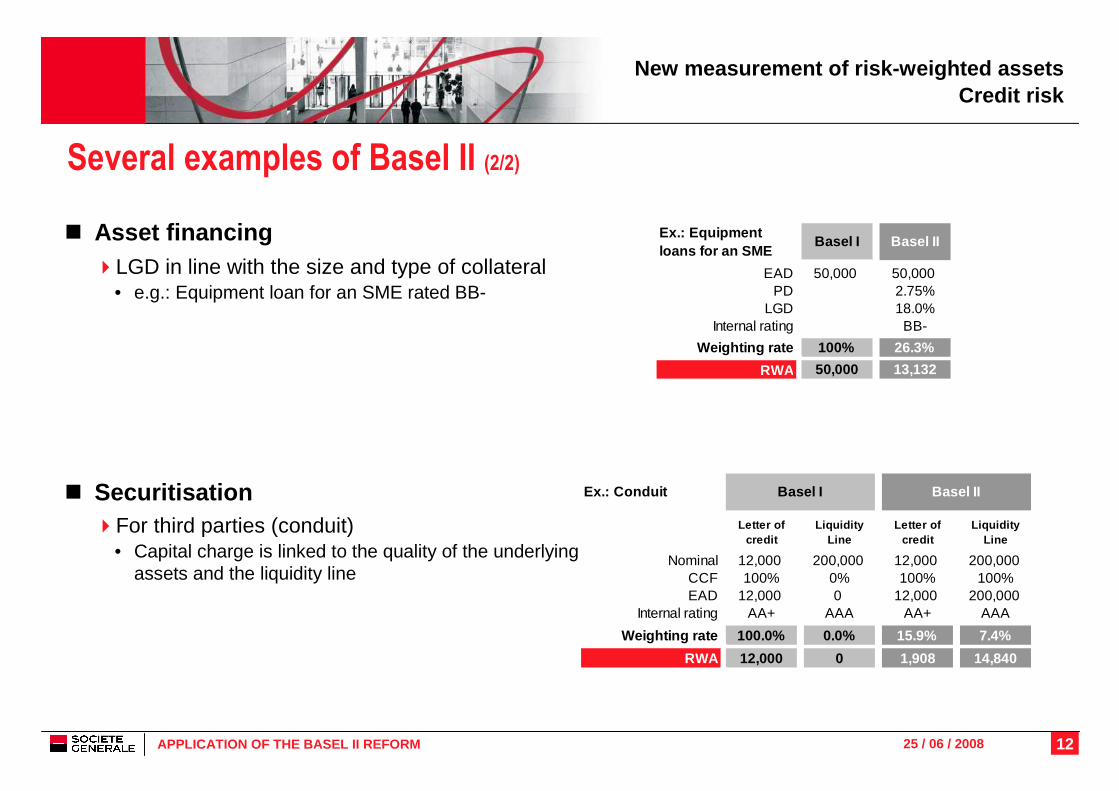
Several examples of Basel II (2/2)
� Asset financing�LGD in line with the size and type of collateral
• e.g.: Equipment loan for an SME rated BB-
� Securitisation�For third parties (conduit)
• Capital charge is linked to the quality of the underlying assets and the liquidity line
Ex.: Equipment loans for an SME
Basel I Basel II
EAD 50,000 50,000 PD 2.75%
LGD 18.0%Internal rating BB-
Weighting rate 100% 26.3%
RWA 50,000 13,132
Ex.: Conduit
Letter of credit
Liquidity Line
Letter of credit
Liquidity Line
Nominal 12,000 200,000 12,000 200,000 CCF 100% 0% 100% 100%EAD 12,000 0 12,000 200,000
Internal rating AA+ AAA AA+ AAA
Weighting rate 100.0% 0.0% 15.9% 7.4%
RWA 12,000 0 1,908 14,840
Basel I Basel II
13APPLICATION OF THE BASEL II REFORM 25 / 06 / 2008
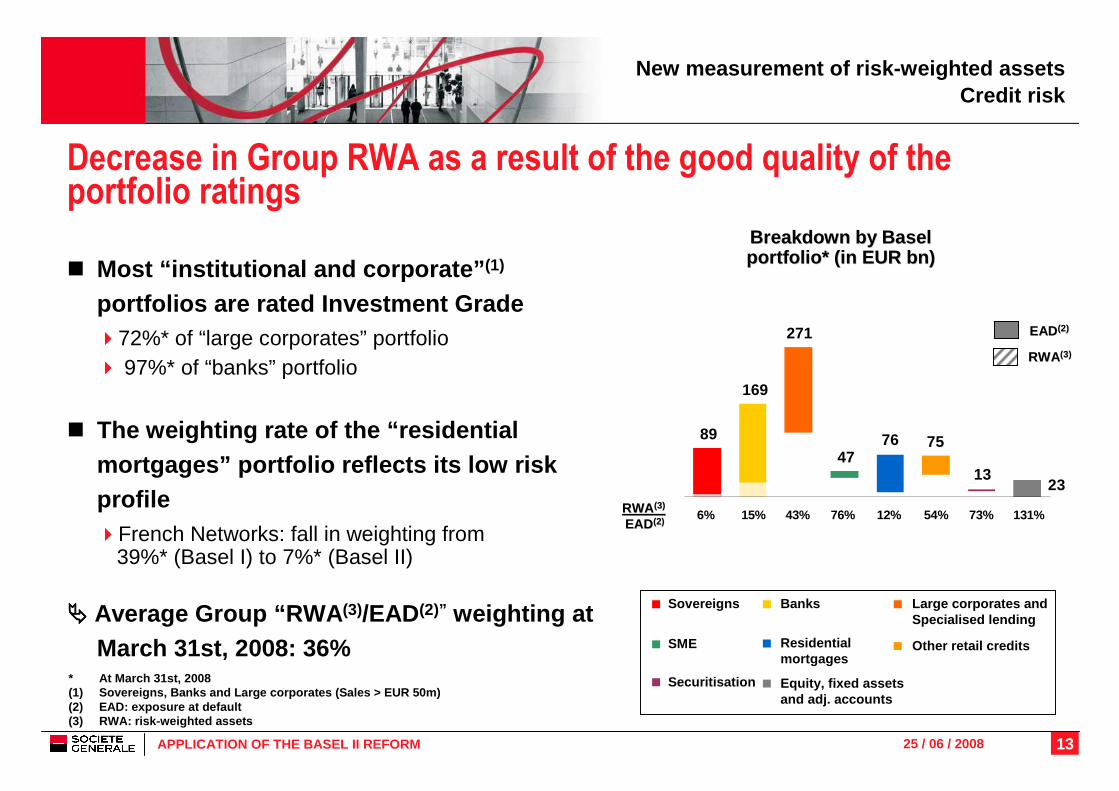
Decrease in Group RWA as a result of the good quality of the portfolio ratings
� Most “institutional and corporate” (1)
portfolios are rated Investment Grade �72%* of “large corporates” portfolio� 97%* of “banks” portfolio
� The weighting rate of the “residential mortgages” portfolio reflects its low risk profile�French Networks: fall in weighting from
39%* (Basel I) to 7%* (Basel II)
���� Average Group “RWA (3)/EAD(2)” weighting at March 31st, 2008: 36%
* At March 31st, 2008(1) Sovereigns, Banks and Large corporates (Sales > E UR 50m)(2) EAD: exposure at default(3) RWA: risk-weighted assets
New measurement of risk-weighted assetsCredit risk
131%73%54%12%76%6% 15% 43%
2313
757647
271
169
89
Breakdown by Basel Breakdown by Basel portfolio* (in EUR bn)portfolio* (in EUR bn)
EADEAD (2)(2)
RWARWA(3) (3)
EADEAD(2)(2)
RWARWA(3) (3)
Equity, fixed assets and adj. accounts
Securitisation
Residentialmortgages
SME
BanksSovereigns Large corporates andSpecialised lending
Other retail credits
14APPLICATION OF THE BASEL II REFORM 25 / 06 / 2008
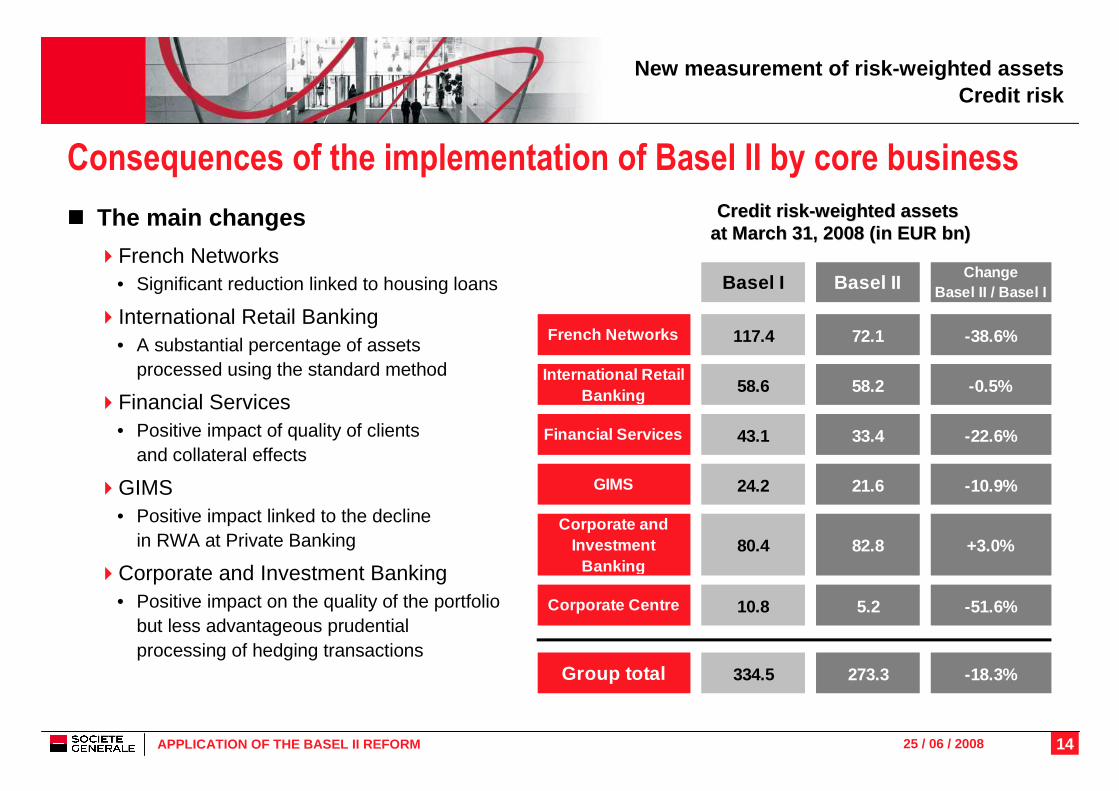
Consequences of the implementation of Basel II by core business
� The main changes
�French Networks• Significant reduction linked to housing loans
�International Retail Banking• A substantial percentage of assets
processed using the standard method
�Financial Services• Positive impact of quality of clients
and collateral effects
�GIMS• Positive impact linked to the decline
in RWA at Private Banking
�Corporate and Investment Banking• Positive impact on the quality of the portfolio
but less advantageous prudential processing of hedging transactions
Credit riskCredit risk --weighted assets weighted assets at March 31, 2008 (in EUR at March 31, 2008 (in EUR bnbn))
New measurement of risk-weighted assetsCredit risk
Basel I Basel IIChange
Basel II / Basel I
French Networks 117.4 72.1 -38.6%
International Retail Banking 58.6 58.2 -0.5%
Financial Services 43.1 33.4 -22.6%
GIMS 24.2 21.6 -10.9%
Corporate and Investment
Banking80.4 82.8 +3.0%
Corporate Centre 10.8 5.2 -51.6%
Group total 334.5 273.3 -18.3%
15APPLICATION OF THE BASEL II REFORM 25 / 06 / 2008
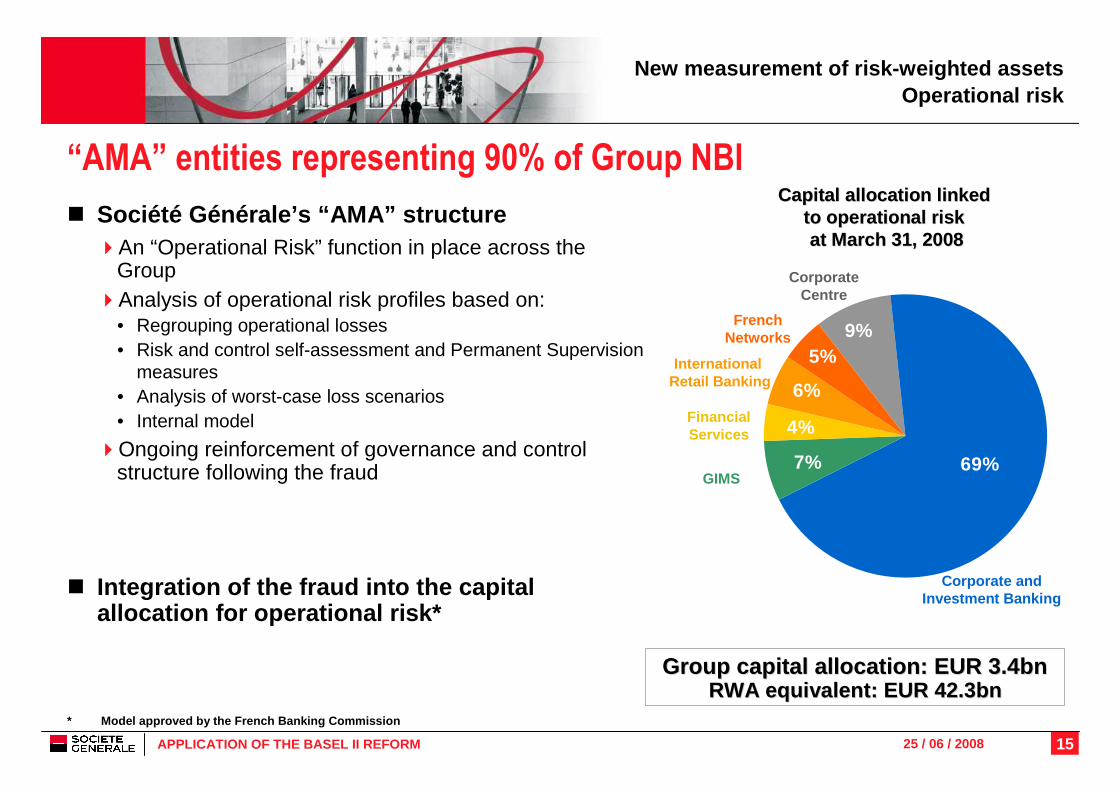
“AMA” entities representing 90% of Group NBI
� Société Générale’s “AMA” structure�An “Operational Risk” function in place across the
Group�Analysis of operational risk profiles based on:
• Regrouping operational losses• Risk and control self-assessment and Permanent Supervision
measures• Analysis of worst-case loss scenarios• Internal model
�Ongoing reinforcement of governance and control structure following the fraud
� Integration of the fraud into the capital allocation for operational risk*
Corporate andInvestment Banking
French Networks
Corporate Centre
InternationalRetail Banking
FinancialServices
GIMS
New measurement of risk-weighted assets Operational risk
Group capital allocationGroup capital allocation : EUR 3.4bn: EUR 3.4bnRWA equivalent: EUR 42.3bnRWA equivalent: EUR 42.3bn
Capital allocation linked Capital allocation linked to operational risk to operational risk at March 31, 2008at March 31, 2008
9%5%
6%
4%
7% 69%
* Model approved by the French Banking Commission
16APPLICATION OF THE BASEL II REFORM 25 / 06 / 2008
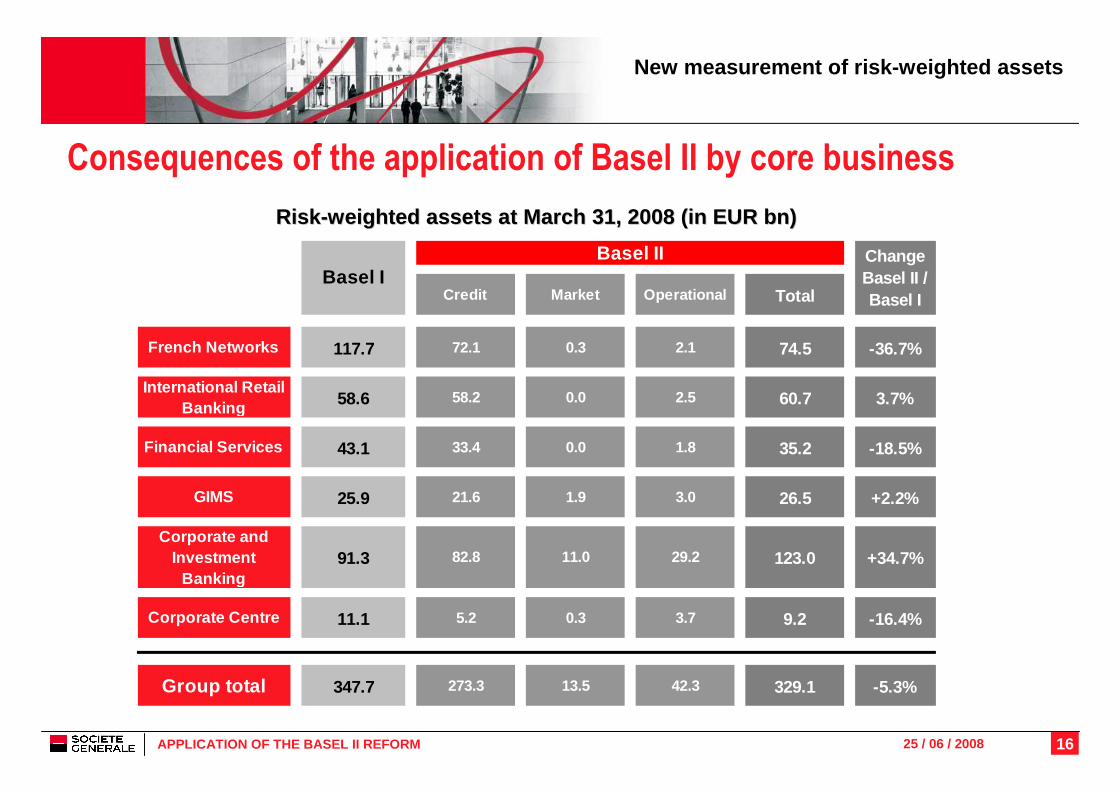
Consequences of the application of Basel II by core business
RiskRisk --weighted assets at March 31, 2008 (in EUR weighted assets at March 31, 2008 (in EUR bnbn ))
New measurement of risk-weighted assets
Credit Market Operational Total
French Networks 117.7 72.1 0.3 2.1 74.5 -36.7%
International Retail Banking 58.6 58.2 0.0 2.5 60.7 3.7%
Financial Services 43.1 33.4 0.0 1.8 35.2 -18.5%
GIMS 25.9 21.6 1.9 3.0 26.5 +2.2%
Corporate and Investment
Banking91.3 82.8 11.0 29.2 123.0 +34.7%
Corporate Centre 11.1 5.2 0.3 3.7 9.2 -16.4%
Group total 347.7 273.3 13.5 42.3 329.1 -5.3%
Basel IBasel II Change
Basel II / Basel I
17APPLICATION OF THE BASEL II REFORM 25 / 06 / 2008
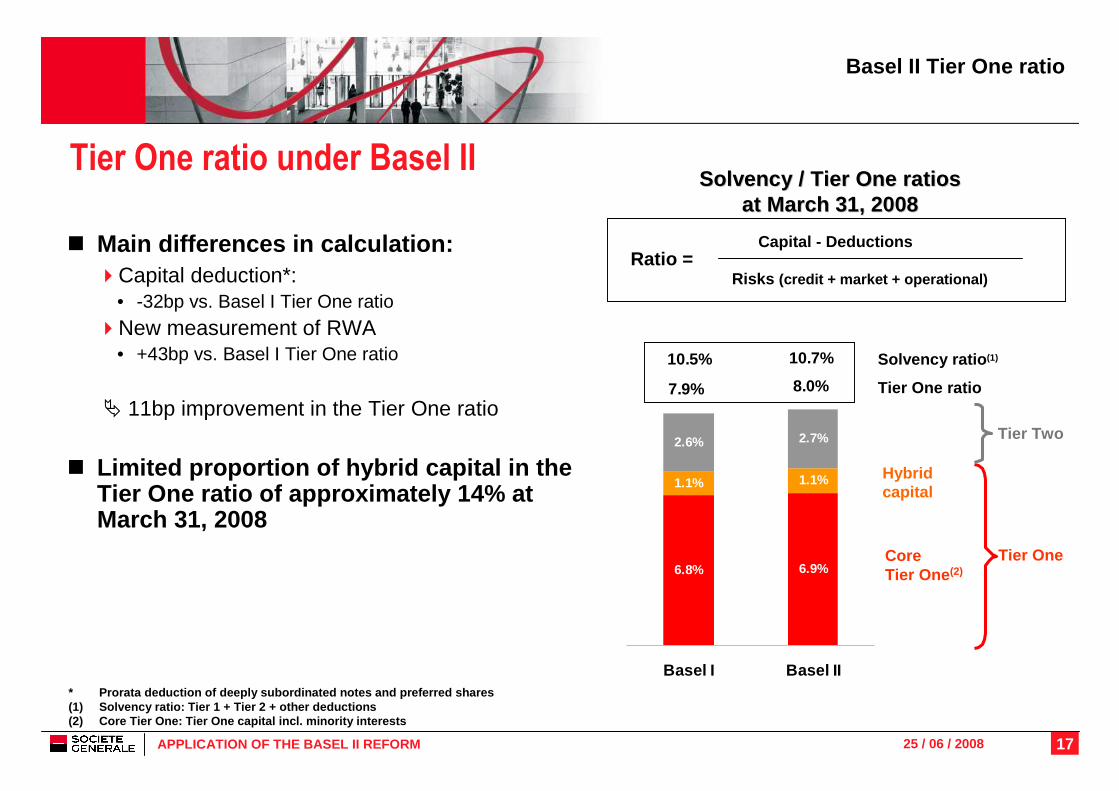
6.8% 6.9%
1.1% 1.1%
2.6% 2.7%
10.7%10.5%
8.0%7.9%
Basel I Basel II
Tier One ratio under Basel II
Basel II Tier One ratio
CoreTier One (2)
Hybridcapital
Tier Two
Tier One
Solvency ratio (1)
Tier One ratio
Solvency / Tier One ratiosSolvency / Tier One ratiosat March 31, 2008 at March 31, 2008
Capital - Deductions
Risks (credit + market + operational)Ratio =
* Prorata deduction of deeply subordinated notes an d preferred shares(1) Solvency ratio: Tier 1 + Tier 2 + other deductio ns(2) Core Tier One: Tier One capital incl. minority i nterests
� Main differences in calculation:�Capital deduction*:
• -32bp vs. Basel I Tier One ratio
�New measurement of RWA• +43bp vs. Basel I Tier One ratio
� 11bp improvement in the Tier One ratio
� Limited proportion of hybrid capital in the Tier One ratio of approximately 14% at March 31, 2008
18APPLICATION OF THE BASEL II REFORM 25 / 06 / 2008
� Basel II key principles
� Application of the reform at Société Générale
� Pillar 1: regulatory capital requirements �New measurement of risk-weighted assets�Basel II Tier One ratio
� Changes in Group financial communication
� Conclusion
� Supplementary data
19APPLICATION OF THE BASEL II REFORM 25 / 06 / 2008
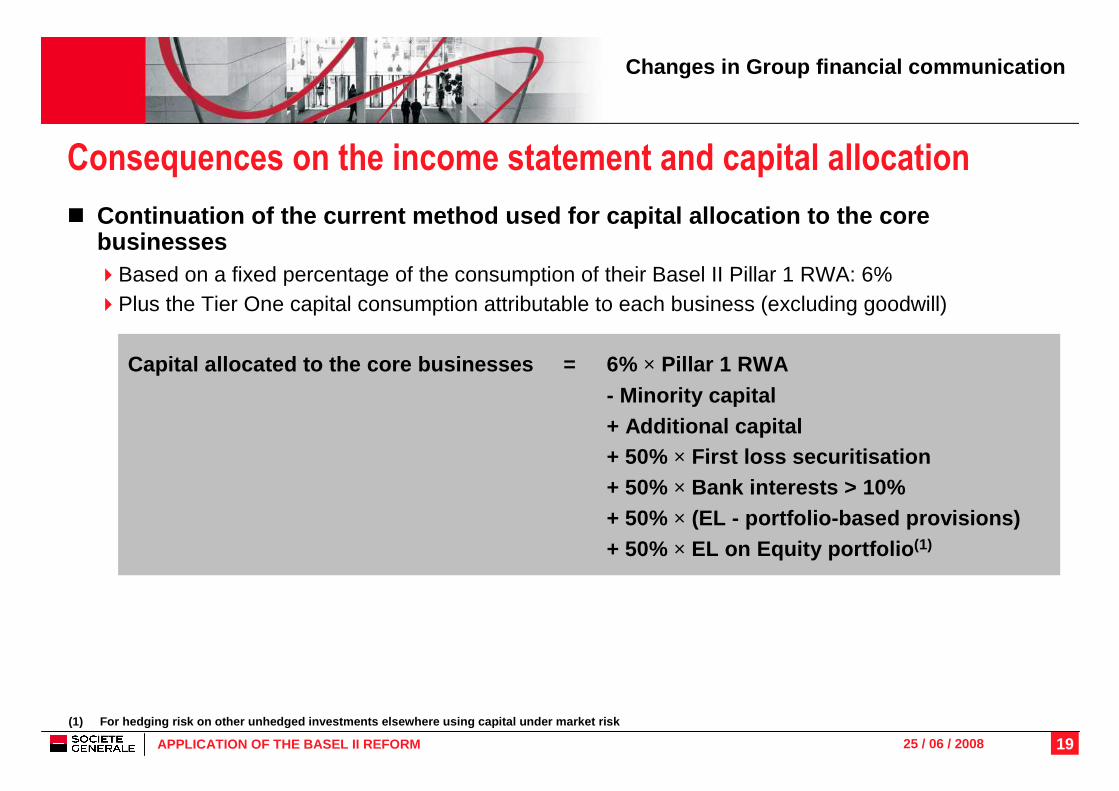
� Continuation of the current method used for capital allocation to the core businesses�Based on a fixed percentage of the consumption of their Basel II Pillar 1 RWA: 6%�Plus the Tier One capital consumption attributable to each business (excluding goodwill)
Capital allocated to the core businesses = 6% × Pillar 1 RWA- Minority capital + Additional capital + 50% × First loss securitisation+ 50% × Bank interests > 10%+ 50% × (EL - portfolio-based provisions)+ 50% × EL on Equity portfolio (1)
Consequences on the income statement and capital allocation
Changes in Group financial communication
(1) For hedging risk on other unhedged investmen ts elsewhere using capital under market risk
20APPLICATION OF THE BASEL II REFORM 25 / 06 / 2008
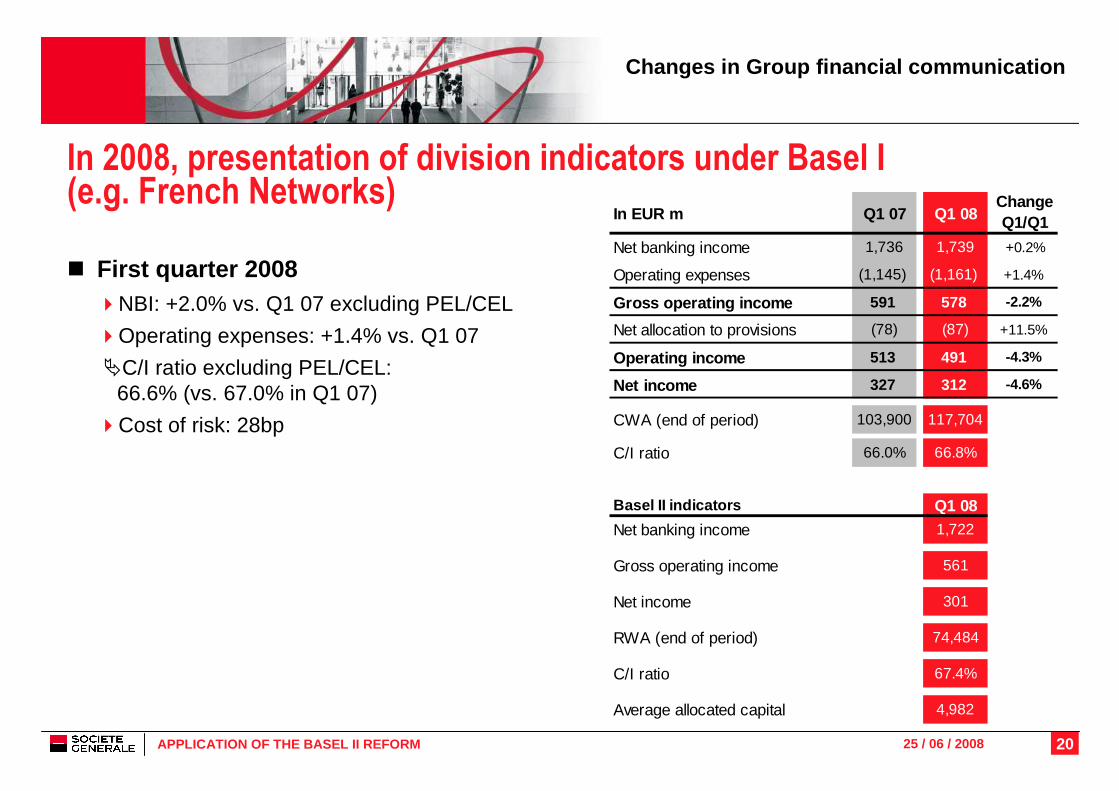
In 2008, presentation of division indicators under Basel I (e.g. French Networks)
� First quarter 2008�NBI: +2.0% vs. Q1 07 excluding PEL/CEL
�Operating expenses: +1.4% vs. Q1 07
�C/I ratio excluding PEL/CEL: 66.6% (vs. 67.0% in Q1 07)
�Cost of risk: 28bp
In EUR m Q1 07 Q1 08ChangeQ1/Q1
Net banking income 1,736 1,739 +0.2%
Operating expenses (1,145) (1,161) +1.4%
Gross operating income 591 578 -2.2%
Net allocation to provisions (78) (87) +11.5%
Operating income 513 491 -4.3%
Net income 327 312 -4.6%
CWA (end of period) 103,900 117,704
C/I ratio 66.0% 66.8%
Basel II indicators Q1 08
Net banking income 1,722
Gross operating income 561
Net income 301
RWA (end of period) 74,484
C/I ratio 67.4%
Average allocated capital 4,982
Changes in Group financial communication
21APPLICATION OF THE BASEL II REFORM 25 / 06 / 2008
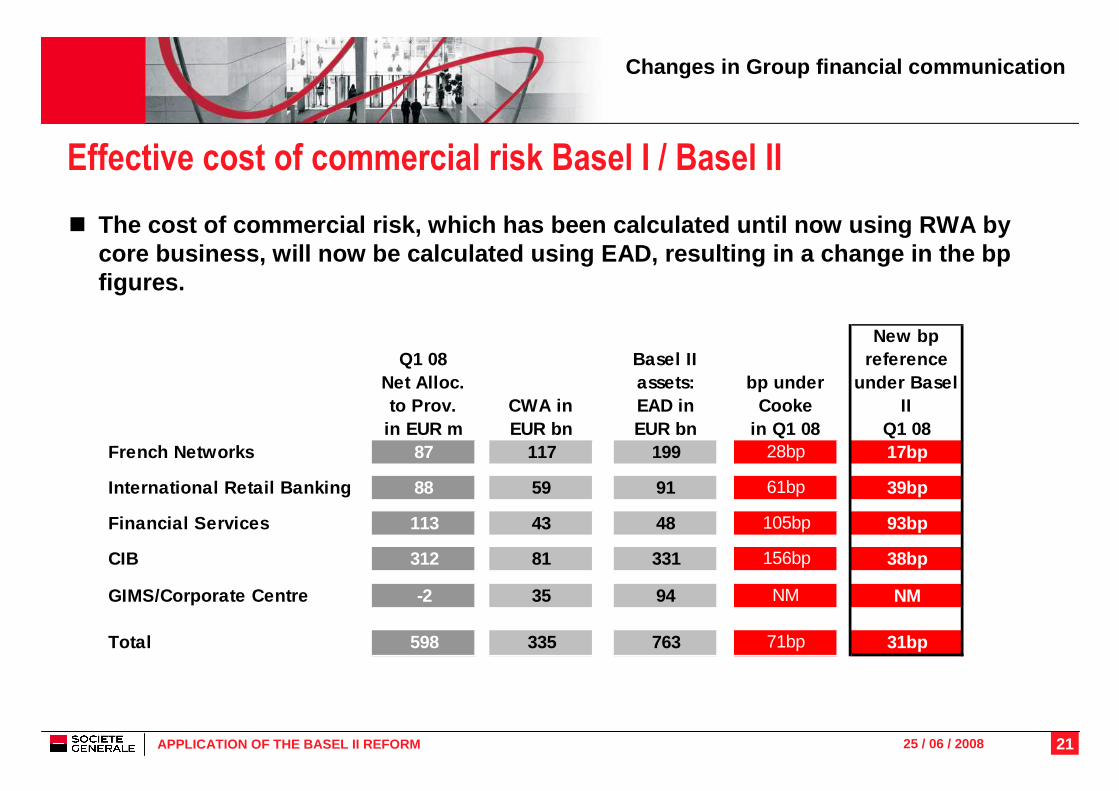
Effective cost of commercial risk Basel I / Basel II
Q1 08 Net Alloc.to Prov.
in EUR mCWA inEUR bn
Basel IIassets: EAD in EUR bn
bp under Cooke
in Q1 08French Networks 87 117 199 28bp 17bp
International Retail Banking 88 59 91 61bp 39bp
Financial Services 113 43 48 105bp 93bp
CIB 312 81 331 156bp 38bp
GIMS/Corporate Centre -2 35 94 NM NM
Total 598 335 763 71bp 31bp
New bp reference
under Basel II
Q1 08
Changes in Group financial communication
� The cost of commercial risk, which has been calcula ted until now using RWA by core business, will now be calculated using EAD, re sulting in a change in the bpfigures.
22APPLICATION OF THE BASEL II REFORM 25 / 06 / 2008
Gro
up b
ook
capi
tal
(afte
r dis
tribu
tion)
OCIDeeply
Sub.Notes Undated Sub.
Notes
RO
E c
apita
l (*)
Goodwill,Fixed Assets
& Others
Minority Interests
Pref shares
DeeplySub.Notes
Bas
el I
Tie
r One
cap
ital
Basel IIdeductions
Bas
el II
Tie
r One
cap
ital
32.4
28.627.4
26.3
-0.5
-2.5
-8.1
+3.0
+1.4
+2.5-0.8
-1.1
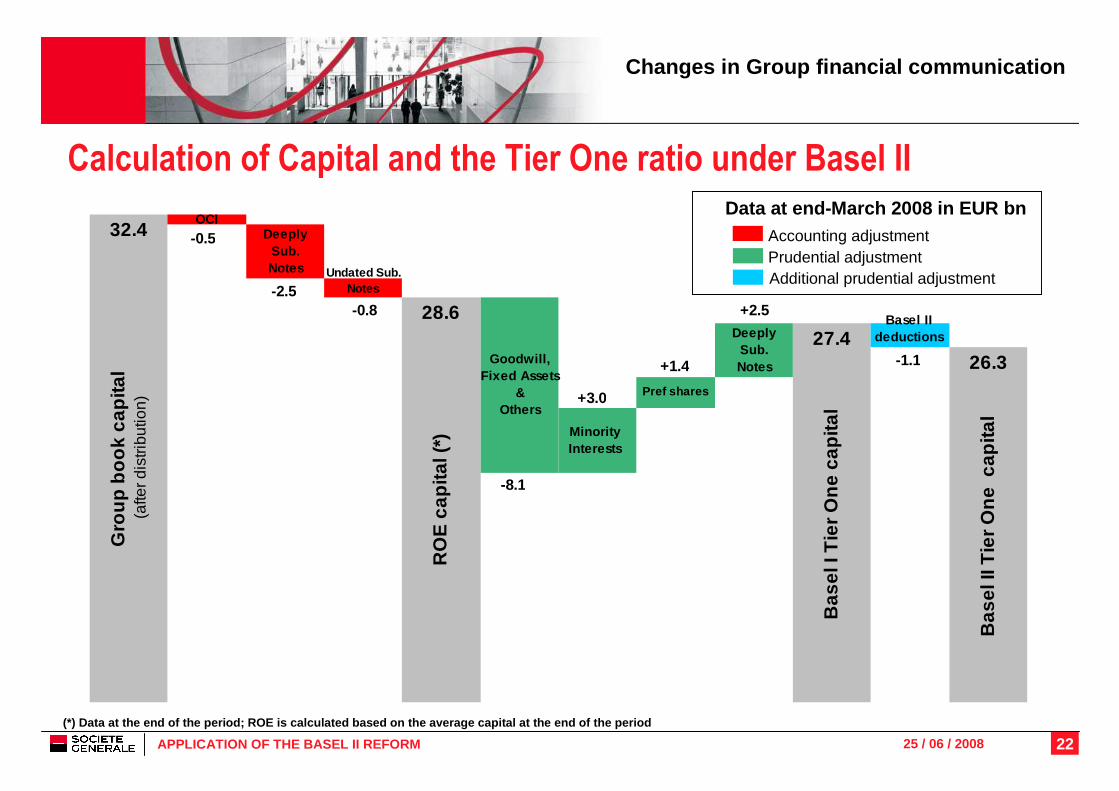
Calculation of Capital and the Tier One ratio under Basel II
Data at end-March 2008 in EUR bnAccounting adjustmentPrudential adjustmentAdditional prudential adjustment
(*) Data at the end of the period; ROE is calculate d based on the average capital at the end of the pe riod
Changes in Group financial communication
23APPLICATION OF THE BASEL II REFORM 25 / 06 / 2008
� Basel II key principles
� Application of the reform at Société Générale
� Pillar 1: minimum capital requirements �New measurement of risk-weighted assets�Basel II Tier One ratio
� Changes in Group financial communication
� Conclusion
� Supplementary data
24APPLICATION OF THE BASEL II REFORM 25 / 06 / 2008
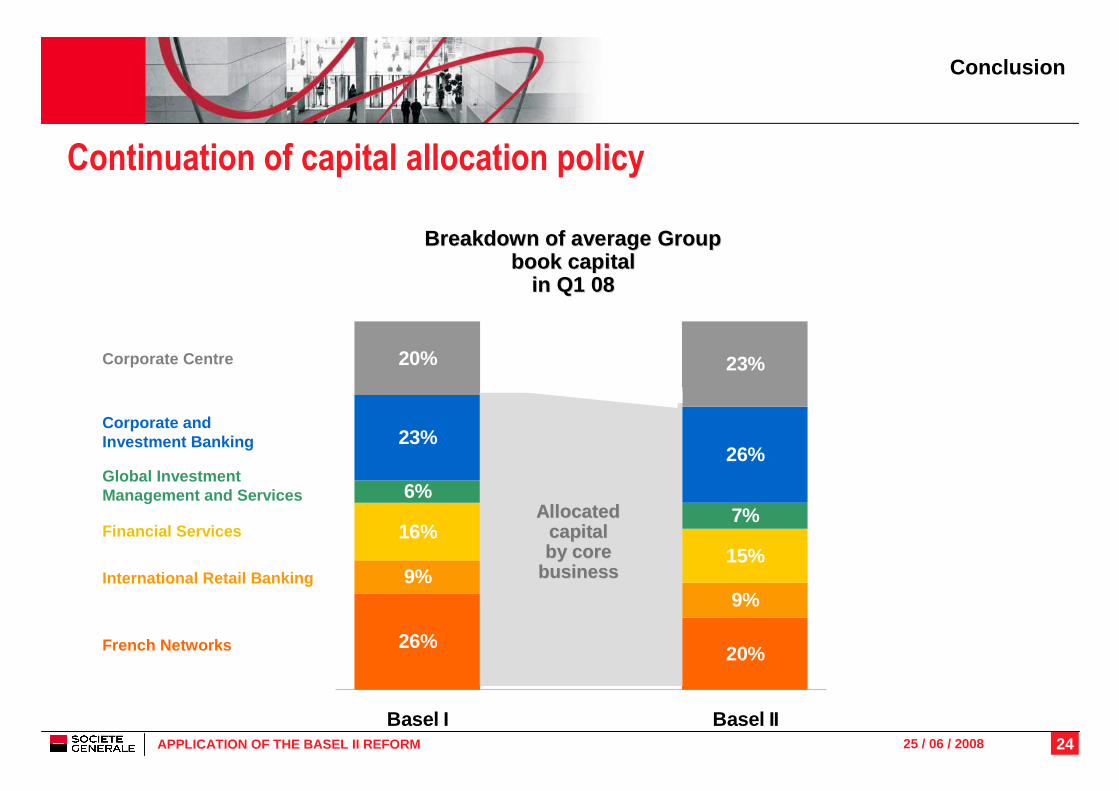
26%20%
9%9%
16%15%
6%7%
23%26%
20% 23%
Basel I Basel II
Continuation of capital allocation policy
Financial Services
French Networks
Corporate Centre
International Retail Banking
Global Investment Management and Services
Breakdown of average Group Breakdown of average Group book capital book capital
in Q1 08in Q1 08
Conclusion
Corporate and Investment Banking
Allocated Allocated capital capital by core by core
businessbusiness
25APPLICATION OF THE BASEL II REFORM 25 / 06 / 2008
� Basel II key principles
� Application of the reform at Société Générale
� Pillar 1: regulatory capital requirements �New measurement of risk-weighted assets�Basel II Tier One ratio
� Changes in Group financial communication
� Conclusion
� Supplementary data
26APPLICATION OF THE BASEL II REFORM 25 / 06 / 2008
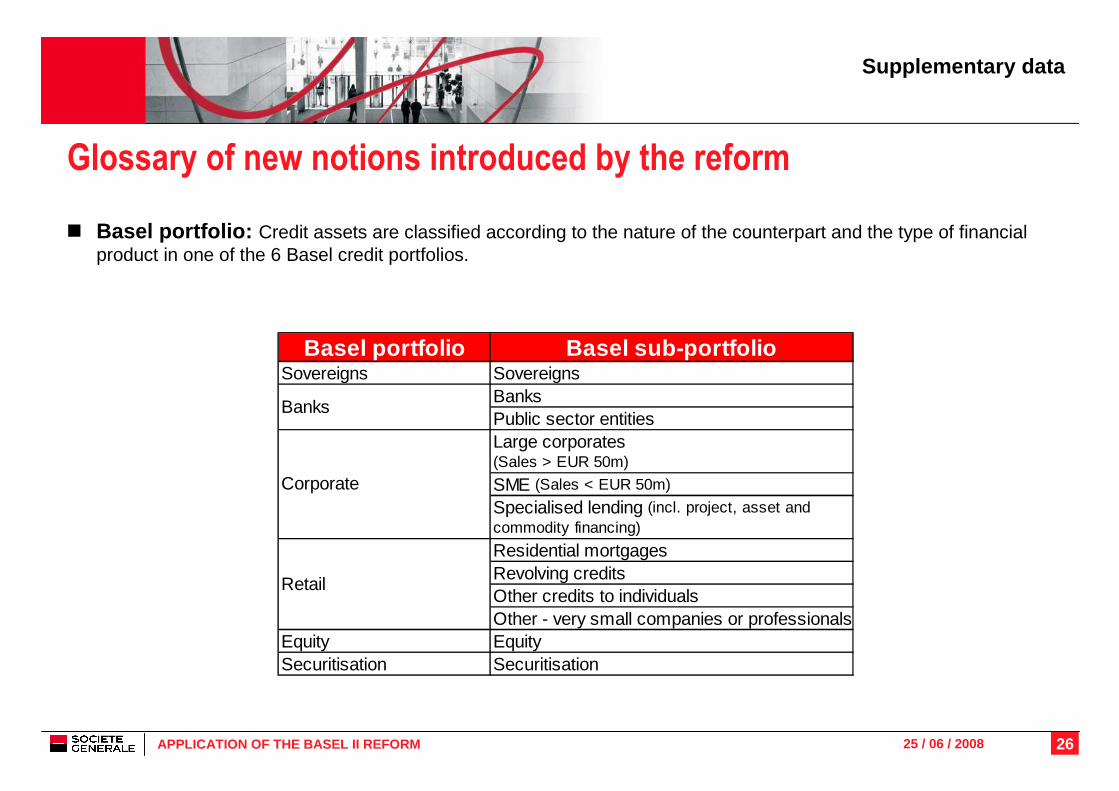
Glossary of new notions introduced by the reform
� Basel portfolio: Credit assets are classified according to the nature of the counterpart and the type of financial product in one of the 6 Basel credit portfolios.
Supplementary data
Basel portfolio Basel sub-portfolioSovereigns Sovereigns
BanksPublic sector entitiesLarge corporates (Sales > EUR 50m)
SME (Sales < EUR 50m)
Specialised lending (incl. project, asset and commodity financing)
Residential mortgagesRevolving creditsOther credits to individualsOther - very small companies or professionals
Equity EquitySecuritisation Securitisation
Corporate
Retail
Banks
27APPLICATION OF THE BASEL II REFORM 25 / 06 / 2008
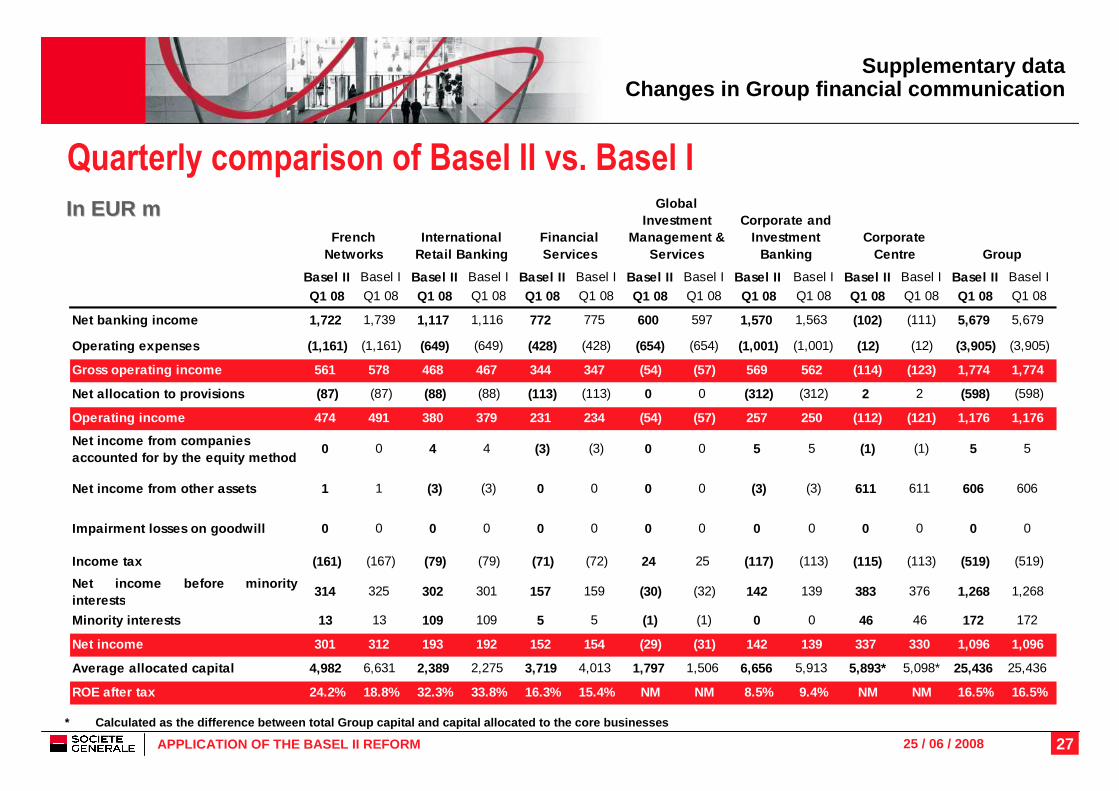
Quarterly comparison of Basel II vs. Basel I
In EUR mIn EUR m
Basel II Basel I Basel II Basel I Basel II Basel I Basel II Basel I Basel II Basel I Basel II Basel I Basel II Basel I
Q1 08 Q1 08 Q1 08 Q1 08 Q1 08 Q1 08 Q1 08 Q1 08 Q1 08 Q1 08 Q1 08 Q1 08 Q1 08 Q1 08
Net banking income 1,722 1,739 1,117 1,116 772 775 600 597 1,570 1,563 (102) (111) 5,679 5,679
Operating expenses (1,161) (1,161) (649) (649) (428) (428) (654) (654) (1,001) (1,001) (12) (12) (3,905) (3,905)
Gross operating income 561 578 468 467 344 347 (54) ( 57) 569 562 (114) (123) 1,774 1,774
Net allocation to provisions (87) (87) (88) (88) (113) (113) 0 0 (312) (312) 2 2 (598) (598)
Operating income 474 491 380 379 231 234 (54) (57) 257 250 (112) (121) 1,176 1,176
Net income from companies accounted for by the equity method
0 0 4 4 (3) (3) 0 0 5 5 (1) (1) 5 5
Net income from other assets 1 1 (3) (3) 0 0 0 0 (3) (3) 611 611 606 606
Impairment losses on goodwill 0 0 0 0 0 0 0 0 0 0 0 0 0 0
Income tax (161) (167) (79) (79) (71) (72) 24 25 (117) (113) (115) (113) (519) (519)
Net income before minorityinterests
314 325 302 301 157 159 (30) (32) 142 139 383 376 1,268 1,268
Minority interests 13 13 109 109 5 5 (1) (1) 0 0 46 46 172 172
Net income 301 312 193 192 152 154 (29) (31) 142 139 3 37 330 1,096 1,096
Average allocated capital 4,982 6,631 2,389 2,275 3,719 4,013 1,797 1,506 6,656 5,913 5,893* 5,098* 25,436 25,436
ROE after tax 24.2% 18.8% 32.3% 33.8% 16.3% 15.4% NM NM 8.5% 9.4% NM NM 16.5% 16.5%
Corporate Centre Group
Corporate and Investment
BankingFrench
NetworksInternational
Retail BankingFinancial Services
Global Investment
Management & Services
* Calculated as the difference between total Group capital and capital allocated to the core businesse s
Supplementary dataChanges in Group financial communication

25 / 06 / 2008
Investor RelationsPatrick SOMMELET, Louise DE L’ESTANG, Stéphane MARTY, Nathalie SAND
Tel.: +33 (0) 1 42 14 47 72
E-mail: [email protected] - Internet: www.investor.socgen.com