Embed Size (px)
Citation preview
1
Press release Paris, February 10th 2021
Q4 20: CONFIRMATION OF THE IMPROVEMENT OF THE COMMERCIAL AND FINANCIAL PERFORMANCES
Resilience of revenues in an environment still marked by the crisis (+1.6%* vs. Q3 20, -2.3%* vs. Q4 19) Continued discipline in cost management (-3.0%(1)* vs. Q4 19) with a positive jaws effect
Cost of risk at 54 basis points resulting from the very good performance of the loan portfolio while
including prudent provisioning Underlying Group net income of EUR 631m (EUR 470m on a reported basis)
2020: RESPONSIBLE MANAGEMENT OF THE CRISIS, RESILIENCE OF THE BUSINESSES AND SOLIDITY OF THE BALANCE SHEET
Ongoing support for customers, exceptional mobilisation of employees
Underlying Group net income of EUR 1.4bn (reported result EUR -258m) Underlying operating expenses of EUR 16.5bn(1) (-5.2%(1) vs. 2019)
Cost of risk contained at 64 basis points (including EUR 1.4bn of provisioning on performing loans, i.e. 41%
of the total)
Disciplined capital management: CET1 ratio at 13.4%(2), around 440 basis points above the regulatory requirement) Payment of a cash dividend calculated in accordance with the maximum authorised by the European
Central Bank (ECB) recommendation: EUR 0.55 per share Share buy-back programme, in Q4 21, for an amount equivalent to the amount assigned to the dividend
payment (around EUR 470m, i.e. an impact of around 13 basis points on the Group’s CET1 ratio), subject to
the non-renewal of the ECB’s recommendation and the authorisation for its implementation
2021 PRIORITY: DISCIPLINED EXECUTION OF THE STRATEGIC ROADMAP
First year of preparation of the merger of the Societe Generale and Crédit du Nord networks Finalisation of the repositioning of Global Markets
Ramping up of growth drivers
Further development of Corporate Social Responsibility dynamics Increased operational efficiency efforts mainly through the digitalisation of processes
Frédéric Oudéa, the Group’s Chief Executive Officer, commented: “The Q4 results provide further confirmation of the rebound in our businesses observed in Q3 after a beginning of the year marked by the impacts of the COVID crisis. Confident in the quality of our franchises and our balance sheet, drawing on the exceptional commitment of our teams, in H2 we defined ambitious and value-creating strategic trajectories for our businesses, demonstrating our ability to adapt and transform in a durably more uncertain environment. We are therefore entering 2021 with confidence and determination with, as a priority, the execution of our strategic roadmap. Consistent with our raison d’être, we will continue to support our customers in all the transformations accelerated by this crisis, whether they concern the growing use of digital technologies or increased attention to corporate social responsibility issues.”
(1) Underlying data (see methodology note No. 5 for the transition from accounting data to underlying data)
(2) Phased-in ratio ; fully-loaded ratio of 13.2%
The footnote * in this document corresponds to data adjusted for changes in Group Structure and at constant exchange rates
RESULTS AT DECEMBER 31ST 2020
2
1. GROUP CONSOLIDATED RESULTS
In EURm Q4 20 Q4 19 Change 2020 2019 Change
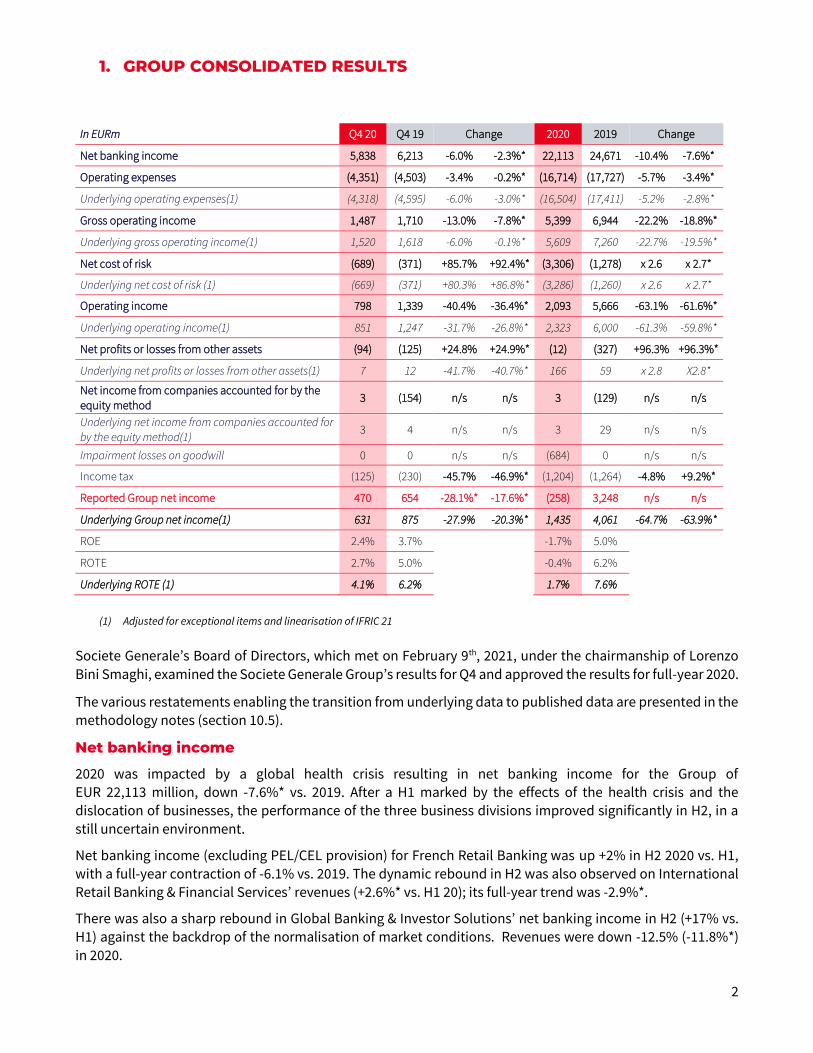
Net banking income 5,838 6,213 -6.0% -2.3%* 22,113 24,671 -10.4% -7.6%*
Operating expenses (4,351) (4,503) -3.4% -0.2%* (16,714) (17,727) -5.7% -3.4%*
Underlying operating expenses(1) (4,318) (4,595) -6.0% -3.0%* (16,504) (17,411) -5.2% -2.8%*
Gross operating income 1,487 1,710 -13.0% -7.8%* 5,399 6,944 -22.2% -18.8%*
Underlying gross operating income(1) 1,520 1,618 -6.0% -0.1%* 5,609 7,260 -22.7% -19.5%*
Net cost of risk (689) (371) +85.7% +92.4%* (3,306) (1,278) x 2.6 x 2.7*
Underlying net cost of risk (1) (669) (371) +80.3% +86.8%* (3,286) (1,260) x 2.6 x 2.7*
Operating income 798 1,339 -40.4% -36.4%* 2,093 5,666 -63.1% -61.6%*
Underlying operating income(1) 851 1,247 -31.7% -26.8%* 2,323 6,000 -61.3% -59.8%*
Net profits or losses from other assets (94) (125) +24.8% +24.9%* (12) (327) +96.3% +96.3%*
Underlying net profits or losses from other assets(1) 7 12 -41.7% -40.7%* 166 59 x 2.8 X2.8*
Net income from companies accounted for by the
equity method 3 (154) n/s n/s 3 (129) n/s n/s
Underlying net income from companies accounted for
by the equity method(1) 3 4 n/s n/s 3 29 n/s n/s
Impairment losses on goodwill 0 0 n/s n/s (684) 0 n/s n/s
Income tax (125) (230) -45.7% -46.9%* (1,204) (1,264) -4.8% +9.2%*
Reported Group net income 470 654 -28.1%* -17.6%* (258) 3,248 n/s n/s
Underlying Group net income(1) 631 875 -27.9% -20.3%* 1,435 4,061 -64.7% -63.9%*
ROE 2.4% 3.7% -1.7% 5.0% ROTE 2.7% 5.0% -0.4% 6.2% Underlying ROTE (1) 4.1% 6.2% 1.7% 7.6%
(1) Adjusted for exceptional items and linearisation of IFRIC 21
Societe Generale’s Board of Directors, which met on February 9th, 2021, under the chairmanship of Lorenzo
Bini Smaghi, examined the Societe Generale Group’s results for Q4 and approved the results for full-year 2020.
The various restatements enabling the transition from underlying data to published data are presented in the methodology notes (section 10.5).
Net banking income
2020 was impacted by a global health crisis resulting in net banking income for the Group of EUR 22,113 million, down -7.6%* vs. 2019. After a H1 marked by the effects of the health crisis and the
dislocation of businesses, the performance of the three business divisions improved significantly in H2, in a
still uncertain environment.
Net banking income (excluding PEL/CEL provision) for French Retail Banking was up +2% in H2 2020 vs. H1, with a full-year contraction of -6.1% vs. 2019. The dynamic rebound in H2 was also observed on International Retail Banking & Financial Services’ revenues (+2.6%* vs. H1 20); its full-year trend was -2.9%*.
There was also a sharp rebound in Global Banking & Investor Solutions’ net banking income in H2 (+17% vs. H1) against the backdrop of the normalisation of market conditions. Revenues were down -12.5% (-11.8%*)
in 2020.
3
Q4 confirmed the improvement in revenues observed in Q3, despite the worsening health crisis in several regions. The three business divisions contributed to the growth in the Group’s net banking income which came to EUR 5,838 million, up +1.6%* when adjusted for changes in Group structure and at constant exchange rates
vs. Q3 20.
Operating expenses
Underlying operating expenses were substantially lower in 2020 at EUR 16,504 million (-5.2% vs. 2019, -2.8%*), in line with the full-year target.
Operating expenses included a EUR 210 million restructuring charge recognised in Q4 and as a result came to EUR 16,714 million, down -5.7% vs. 2019 (-3.4%*). They included a EUR 316 million restructuring provision in
2019.
All the Group’s businesses contributed to this decline: French Retail Banking’s costs were down -4.9% vs. 2019, those of International Retail Banking & Financial Services fell by -9.6% in 2020 and those of Global Banking & Investor Solutions by -8.7%.
The Group is committed to a decline in its underlying operating expenses as from 2023 (vs. 2020). Several
initiatives, already launched, will contribute to this process with benefits already expected in 2022 (a decline
in underlying costs of around EUR 450 million in Global Markets between now and 2022/2023 and around EUR 450 million in French Retail Banking by 2025 - with around 80% already expected to be achieved in 2024 - as
well as additional reductions expected in particular following the finalisation of remediation efforts and the industrialisation of processes).
In 2021, the Group intends to continue to strictly manage its costs and is aiming for a positive jaws effect with costs slightly higher.
Underlying operating expenses totalled EUR 4,318 million in Q4 20, down -6.0% vs. Q4 19, after restatement of
a restructuring charge of EUR 210 million and an IFRIC 21 adjustment charge of EUR -177 million. Underlying
operating expenses were down -3% when adjusted for changes in Group structure and at constant exchange
rates, enabling a positive jaws effect.
Cost of risk
The commercial cost of risk amounted to 64 basis points in 2020, representing a net cost of risk of EUR 3,306 million (vs. EUR 1,278 million in 2019). This rise can be attributed primarily to an increase in provisions in
respect of performing loans (classified in Stage 1 and Stage 2) for a total amount of EUR 1,367 million, including an impact of EUR 1,010 million related to the review of macro-economic scenarios.
The gross doubtful outstandings ratio remained at low levels throughout the year and amounted to 3.3%(1) at December 31st 2020 (3.1% at December 31st 2019). The Group’s gross coverage ratio for doubtful outstandings stood at 52%(2) at December 31st 2020 (56% at December 31st 2019).
In Q4, the commercial cost of risk stood at 54 basis points (40 basis points in Q3 20 and 29 basis points in Q4 19). The net cost of risk of EUR 689 million includes provisions related to loans classified in performing (Stage 1 and Stage 2) for a total amount of EUR 367 million.
The total amount of repayment moratoriums, within the meaning of the EBA definition, granted at end-
September 2020 was around EUR 35 billion, with around EUR 5 billion still in force at December 31st 2020. Of the total repayment moratoriums granted at 31 December 2020, 2.2% were classified in Stage 3 (credit-impaired loans).
(1) NPL ratio calculated according to the new EBA methodology
(2) Ratio between the amount of provisions on doubtful outstandings and the amount of these same outstandings.
4
The Group also granted EUR 19 billion of State-guaranteed loans in all geographies o/w EUR 18 billion in France. Net exposure of the Group on State-guaranteed loans in France (“PGE”) is around EUR 2 billion. At 31 December 2020, 2.3% of State-guaranteed loans are classified in Stage 3 (non-performing loans).
The Group expects a lower commercial cost of risk in 2021 than in 2020.
Net profits or losses from other assets
Net profits or losses from other assets totalled EUR -12 million in 2020 and EUR -94 million in Q4 20.
Group net income
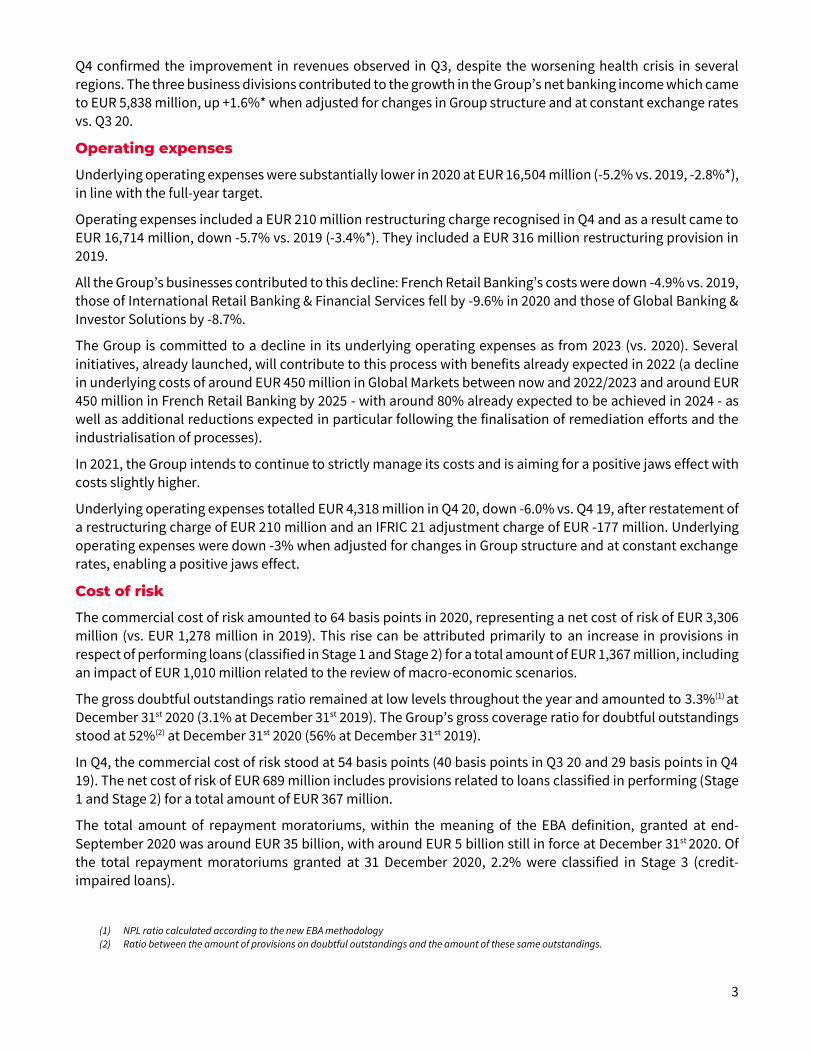
In EURm Q4 20 Q4 19 2020 2019
Reported Group net income 470 654 (258) 3,248
Underlying Group net income(1) 631 875 1,435 4,061
In % Q4 20 Q4 19 2020 2019
ROTE (reported) 2.7% 5.0% -0.4% 6.2%
Underlying ROTE(1) 4.1% 6.2% 1.7% 7.6%
Distribution to shareholders
The Board of Directors has decided to propose the payment of a dividend of EUR 0.55 per share in cash to the Ordinary General Meeting of Shareholders on May 18th, 2021, in accordance with the methodology
recommended by the European Central Bank (ECB). The dividend will be detached on May 25th, 2021 and paid on May 27th, 2021.
The Group intends to launch a share buy-back programme, in Q4 2021, for an amount equivalent to the
amount assigned to the dividend payment (around EUR 470m, i.e. an impact of around 13 basis points on the Group’s CET1 ratio), subject to the non-renewal of the ECB’s recommendation and the authorisation for its
implementation. The fully loaded pro forma ratio would be 13% at end-December 2020 (phased-in pro-forma
ratio of 13.3%).
Additional information
Societe Generale’s Board of Directors, which met on January 14th, 2021, decided to submit to the May 2024 General Meeting of Shareholders that will approve the financial statements for the 2023 financial year, the
appointment of the firms KPMG and PwC as from January 1st, 2024 as statutory auditors for a 6-year term to replace the firms Deloitte and EY, whose terms of office will expire and can no longer be renewed in accordance with legal provisions. This decision follows a tender process managed under the supervision of the audit and internal control committee. The committee interviewed all the candidates and made its choice independently
of the management. It presented the possible different choices to the Board of Directors before formulating
its proposal.
(1) Underlying data. See methodology note No. 5 for the transition from accounting data to underlying data
5
2. THE GROUP’S FINANCIAL STRUCTURE
Group shareholders’ equity totalled EUR 61.7 billion at December 31st, 2020. Net asset value per share was EUR 62.3 and tangible net asset value per share was EUR 54.8.
The consolidated balance sheet totalled EUR 1,462 billion at December 31st, 2020. The net amount of
customer loan outstandings at December 31st, 2020, including lease financing, was EUR 440 billion (EUR 430 billion at December 31st, 2019) – excluding assets and securities purchased under resale agreements. At the same time, customer deposits amounted to EUR 451 billion, vs. EUR 410 billion at December 31st, 2019 (excluding assets and securities sold under repurchase agreements). At end-December 2020, the parent company had issued EUR 34.3 billion of medium/long-term debt (including
EUR 3.9 billion of pre-financing for the 2021 programme), having an average maturity of 5.4 years and an average spread of 59 basis points (vs. the 6-month midswap, excluding subordinated debt). The subsidiaries had issued EUR 2.9 billion. At December 31st, 2020, the Group had issued a total of EUR 37.2 billion of medium/long-term debt. The LCR (Liquidity Coverage Ratio) was well above regulatory requirements at 149%
at end-December 2020 (153% on average for the quarter), vs. 119% at end-December 2019. At the same time, the NSFR (Net Stable Funding Ratio) was over 100% at end December 2020.
The Group’s risk-weighted assets (RWA) amounted to EUR 352.4 billion at December 31st, 2020 (vs. EUR 345.0
billion at end-December 2019) according to CRR/CRD4 rules. Risk-weighted assets in respect of credit risk represent 81.7% of the total, at EUR 287.9 billion, up 1.9% vs. December 31st, 2019.
At December 31st, 2020, the Group’s Common Equity Tier 1 ratio stood at 13.4% (or around 440 basis points above the regulatory requirement). The CET1 ratio at December 31st, 2020 includes an effect of +28 basis points
for phasing of the IFRS 9 impact. Excluding this effect, the fully-loaded ratio amounts to 13.2%. The Tier 1 ratio stood at 15.7%(1) at end-December 2020 (15.1% at end-December 2019) and the total capital ratio amounted
to 18.9%(1) (18.3% at end-December 2019).
The Group aims to operate with a CET1 ratio more than 200 basis points above the regulatory requirement, including after the entry into force of the regulation finalising the Basel III reform whose impact is expected to
be around EUR 39 billion(2) as from 2023, or around 115 basis points(3)
In 2021, the CET1 ratio is expected to be at a level significantly higher than 200 basis points above the
regulatory requirement. The leverage ratio stood at 4.7%(1) at December 31st, 2020 (4.3% at end-December 2019). With a level of 30.6%(1) of RWA and 9.2%(1) of leveraged exposure at end-December 2020, the Group’s TLAC ratio is above the FSB’s requirements for 2020. At December 31st, 2020, the Group was also above its MREL
requirements of 8.51% of the TLOF(4) (which, in December 2017, represented a level of 24.4% of RWA), which
were used as a reference for the SRB calibration. The Group is rated by four rating agencies: (i) Fitch Ratings - long-term rating “A-”, stable outlook, senior
preferred debt rating “A”, short-term rating “F1”; (ii) Moody’s – long-term rating (senior preferred debt) “A1”,
stable outlook, short-term rating “P-1”; (iii) R&I - long-term rating (senior preferred debt) “A”, stable outlook;
and (iv) S&P Global Ratings - long-term rating (senior preferred debt) “A”, negative outlook, short-term rating
“A-1”.
(1) Excluding IFRS 9 phasing (2) Including the credit risk, FRTB, operational risk and taking into account the main EU-specific assumptions communicated by the EBA in response to the
European Commission’s consultation paper (published in December 2020) and excluding the output floor which would not be binding before 2027/2028
(3) On a prospective basis in 2023
(4) Total Liabilities and Own Funds
6
3. FRENCH RETAIL BANKING
In EURm Q4 20 Q4 19 Change 2020 2019 Change
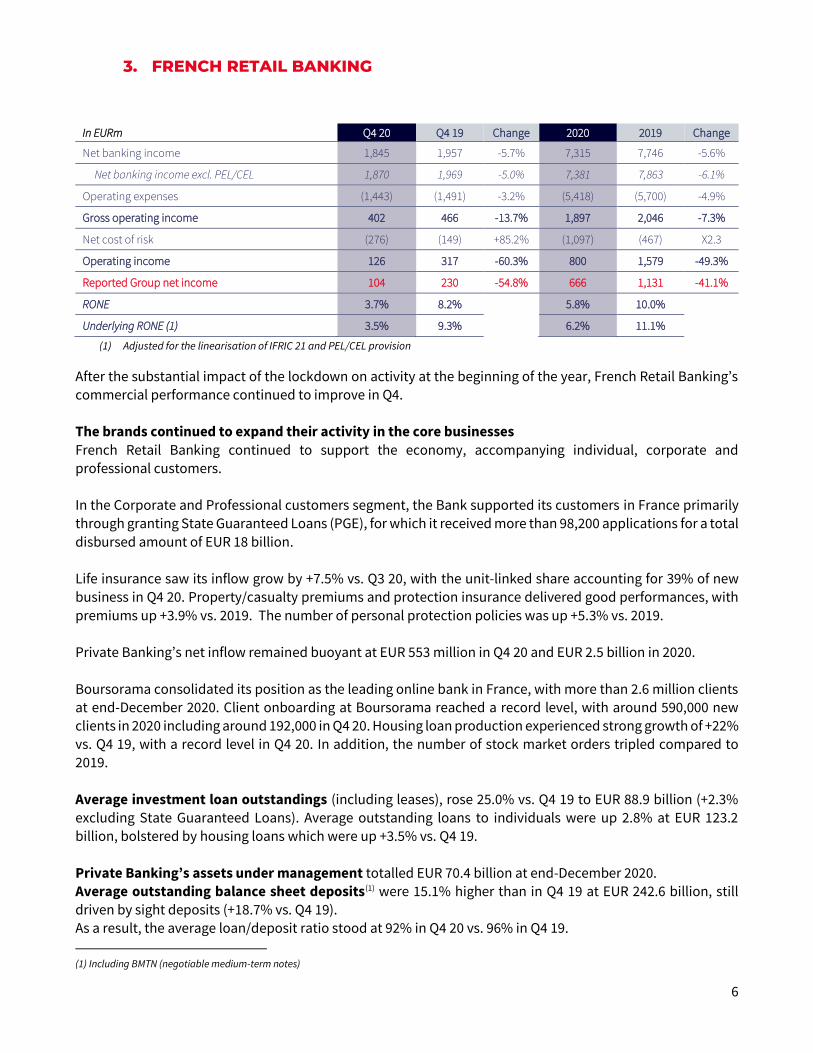
Net banking income 1,845 1,957 -5.7% 7,315 7,746 -5.6%
Net banking income excl. PEL/CEL 1,870 1,969 -5.0% 7,381 7,863 -6.1%
Operating expenses (1,443) (1,491) -3.2% (5,418) (5,700) -4.9%
Gross operating income 402 466 -13.7% 1,897 2,046 -7.3%
Net cost of risk (276) (149) +85.2% (1,097) (467) X2.3
Operating income 126 317 -60.3% 800 1,579 -49.3%
Reported Group net income 104 230 -54.8% 666 1,131 -41.1%
RONE 3.7% 8.2% 5.8% 10.0% Underlying RONE (1) 3.5% 9.3% 6.2% 11.1%
(1) Adjusted for the linearisation of IFRIC 21 and PEL/CEL provision
After the substantial impact of the lockdown on activity at the beginning of the year, French Retail Banking’s commercial performance continued to improve in Q4.
The brands continued to expand their activity in the core businesses
French Retail Banking continued to support the economy, accompanying individual, corporate and professional customers.
In the Corporate and Professional customers segment, the Bank supported its customers in France primarily through granting State Guaranteed Loans (PGE), for which it received more than 98,200 applications for a total
disbursed amount of EUR 18 billion.
Life insurance saw its inflow grow by +7.5% vs. Q3 20, with the unit-linked share accounting for 39% of new
business in Q4 20. Property/casualty premiums and protection insurance delivered good performances, with
premiums up +3.9% vs. 2019. The number of personal protection policies was up +5.3% vs. 2019.
Private Banking’s net inflow remained buoyant at EUR 553 million in Q4 20 and EUR 2.5 billion in 2020.
Boursorama consolidated its position as the leading online bank in France, with more than 2.6 million clients at end-December 2020. Client onboarding at Boursorama reached a record level, with around 590,000 new clients in 2020 including around 192,000 in Q4 20. Housing loan production experienced strong growth of +22% vs. Q4 19, with a record level in Q4 20. In addition, the number of stock market orders tripled compared to
2019.
Average investment loan outstandings (including leases), rose 25.0% vs. Q4 19 to EUR 88.9 billion (+2.3% excluding State Guaranteed Loans). Average outstanding loans to individuals were up 2.8% at EUR 123.2
billion, bolstered by housing loans which were up +3.5% vs. Q4 19.
Private Banking’s assets under management totalled EUR 70.4 billion at end-December 2020.
Average outstanding balance sheet deposits(1) were 15.1% higher than in Q4 19 at EUR 242.6 billion, still driven by sight deposits (+18.7% vs. Q4 19). As a result, the average loan/deposit ratio stood at 92% in Q4 20 vs. 96% in Q4 19.
(1) Including BMTN (negotiable medium-term notes)
7
Net banking income excluding PEL/CEL
2020: revenues (excluding PEL/CEL) totalled EUR 7,381 million, down -6.1% vs. 2019, reflecting the effects of Covid-19 and the low interest rate environment. Net interest income (excluding PEL/CEL) was 3.6%(1) lower and commissions declined by -5.7%(1).
Q4 20: revenues (excluding PEL/CEL) totalled EUR 1,870 million, up +0.7% vs. Q3 20 and down -5.0% vs. Q4 19. Net interest income (excluding PEL/CEL) was 4.2%(1) lower than in Q4 19 against a backdrop of low interest rates and a sharp rise in deposits. However, it picked up compared to Q3 20 (+0.4%(1)). Commissions were 3.3%(1) lower than in Q4 19 but picked up compared to Q3 20 (+2.5%(1)), with a gradual
recovery in financial and service commissions.
Operating expenses 2020: operating expenses were lower at EUR 5,418 million (-4.9% vs. 2019 and -5.5% excluding Boursorama).
The cost to income ratio (restated for the PEL/CEL provision) stood at 73.4%.
Q4 20: operating expenses were lower at EUR 1,443 million (-3.2% vs. Q4 19), illustrating the Group’s work on
costs. The cost to income ratio (after linearisation of the IFRIC 21 charge and restated for the PEL/CEL provision) stood at 78.9%.
Cost of risk 2020: the commercial cost of risk amounted to EUR 1,097 million or 52 basis points, higher than in 2019 (year in which it amounted to EUR 467 million or 24bp), divided between EUR 646 million of S1/S2 provisioning and
EUR 451 million of S3 (non-performing loans) provisioning.
Q4 20: the commercial cost of risk amounted to EUR 276 million or 50 basis points. It corresponds to EUR 236 million of S1/S2 (performing/underperforming loans) provisioning and EUR 41 million of S3 (non-performing
loans) provisioning. Contribution to Group net income 2020: the contribution to Group net income totalled EUR 666 million (-41.1% vs. 2019). RONE (restated for the PEL/CEL provision) stood at 6.2% in 2020.
Q4 20: the contribution to Group net income totalled EUR 104 million. RONE (after linearisation of the IFRIC 21 charge and restated for the PEL/CEL provision) stood at 3.5% and excluding Boursorama, French Retail Banking’s adjusted RONE stood at 5.0%.
(1) Reallocation of pro forma revenues following a change in accounting treatment in Q4 20
8
4. INTERNATIONAL RETAIL BANKING & FINANCIAL SERVICES
In EURm Q4 20 Q4 19 Change 2020 2019 Change
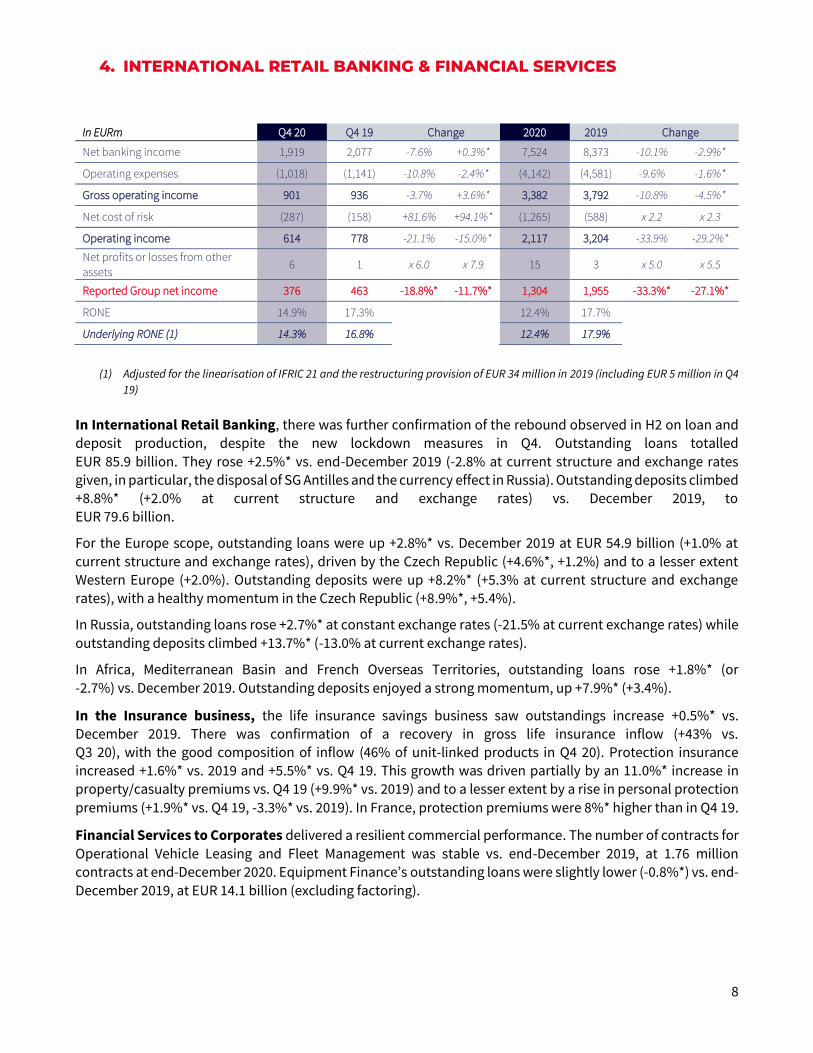
Net banking income 1,919 2,077 -7.6% +0.3%* 7,524 8,373 -10.1% -2.9%*
Operating expenses (1,018) (1,141) -10.8% -2.4%* (4,142) (4,581) -9.6% -1.6%*
Gross operating income 901 936 -3.7% +3.6%* 3,382 3,792 -10.8% -4.5%*
Net cost of risk (287) (158) +81.6% +94.1%* (1,265) (588) x 2.2 x 2.3
Operating income 614 778 -21.1% -15.0%* 2,117 3,204 -33.9% -29.2%*
Net profits or losses from other
assets 6 1 x 6.0 x 7.9 15 3 x 5.0 x 5.5
Reported Group net income 376 463 -18.8%* -11.7%* 1,304 1,955 -33.3%* -27.1%*
RONE 14.9% 17.3% 12.4% 17.7% Underlying RONE (1) 14.3% 16.8% 12.4% 17.9%
(1) Adjusted for the linearisation of IFRIC 21 and the restructuring provision of EUR 34 million in 2019 (including EUR 5 million in Q4
19) In International Retail Banking, there was further confirmation of the rebound observed in H2 on loan and
deposit production, despite the new lockdown measures in Q4. Outstanding loans totalled
EUR 85.9 billion. They rose +2.5%* vs. end-December 2019 (-2.8% at current structure and exchange rates
given, in particular, the disposal of SG Antilles and the currency effect in Russia). Outstanding deposits climbed +8.8%* (+2.0% at current structure and exchange rates) vs. December 2019, to EUR 79.6 billion.
For the Europe scope, outstanding loans were up +2.8%* vs. December 2019 at EUR 54.9 billion (+1.0% at
current structure and exchange rates), driven by the Czech Republic (+4.6%*, +1.2%) and to a lesser extent
Western Europe (+2.0%). Outstanding deposits were up +8.2%* (+5.3% at current structure and exchange
rates), with a healthy momentum in the Czech Republic (+8.9%*, +5.4%).
In Russia, outstanding loans rose +2.7%* at constant exchange rates (-21.5% at current exchange rates) while
outstanding deposits climbed +13.7%* (-13.0% at current exchange rates).
In Africa, Mediterranean Basin and French Overseas Territories, outstanding loans rose +1.8%* (or
-2.7%) vs. December 2019. Outstanding deposits enjoyed a strong momentum, up +7.9%* (+3.4%).
In the Insurance business, the life insurance savings business saw outstandings increase +0.5%* vs. December 2019. There was confirmation of a recovery in gross life insurance inflow (+43% vs. Q3 20), with the good composition of inflow (46% of unit-linked products in Q4 20). Protection insurance
increased +1.6%* vs. 2019 and +5.5%* vs. Q4 19. This growth was driven partially by an 11.0%* increase in property/casualty premiums vs. Q4 19 (+9.9%* vs. 2019) and to a lesser extent by a rise in personal protection
premiums (+1.9%* vs. Q4 19, -3.3%* vs. 2019). In France, protection premiums were 8%* higher than in Q4 19.
Financial Services to Corporates delivered a resilient commercial performance. The number of contracts for
Operational Vehicle Leasing and Fleet Management was stable vs. end-December 2019, at 1.76 million contracts at end-December 2020. Equipment Finance’s outstanding loans were slightly lower (-0.8%*) vs. end-
December 2019, at EUR 14.1 billion (excluding factoring).
9
Net banking income
Revenues amounted to EUR 7,524 million in 2020, down -2.9%* (-10.1%) vs. 2019. Net banking income
amounted to EUR 1,919 million in Q4 20, up +0.3%* (-7.6%) vs. Q4 19. The increase of +4.1%* vs. Q3 20
illustrates the recovery in activity.
In International Retail Banking, net banking income totalled EUR 4,902 million in 2020, down -3.4%* (-12.3%) vs. 2019, marked in particular by reduced activity due to the lockdowns and a fall in net interest income in the Czech Republic and Romania, in conjunction with the decline in rates.
Net banking income amounted to EUR 1,236 million in Q4 20, down -3.5%* vs. Q4 19, excluding the structure effect and the currency effect (-11.2%). In Europe, revenues were down -5.9%* (-11.7%) impacted primarily by the rates in the Czech Republic and Romania in H1. However, activity remained dynamic in consumer credit, with stable revenues vs. Q4 19. Revenues (-2.5%*, -24.3%) held up well for SG Russia(1) despite the lockdown
measures and a decline in rates, with particularly dynamic activity in housing loans (production up +18%* vs.
Q4 19). Revenues were up +0.9%* (-3.0%) in Africa, Mediterranean Basin and French Overseas Territories vs. Q4 19, with a confirmed recovery in commissions. Revenues were higher in Sub-Saharan Africa in 2020 (+3%* vs. 2019).
The Insurance business saw net banking income decline by -2.1%*vs.2019, to EUR 887 million. When adjusted
for the contribution to the solidarity fund in France, net banking income was down -0.9%* vs. 2019, illustrating a resilient financial performance. Gross inflow was of good quality in 2020, with the unit-linked share
accounting for 44%. Net banking income was up +1.1%* (+0.9%) in Q4 20 vs. Q4 19, at EUR 224 million. The second half of 2020 was marked primarily by a rebound in gross life insurance inflow. Moreover, gross inflow
continued to be of good quality, with the unit-linked contracts share accounting for 46% in Q4 20.
Financial Services to Corporates’ net banking income was down -2.1%* (-7.3%) in 2020, at
EUR 1,735 million. However, in 2020, ALD posted a used car sale result (EUR 201 per unit) above the guidance, while margins were higher in Equipment Finance. Financial Services to Corporates’ net banking income came to EUR 459 million in Q4 20, up +11.8%* (-0.9%) vs. Q4 19.
Operating expenses
Operating expenses were down -1.6%* (-9.6%) vs. 2019. When restated for restructuring costs related to the
simplification of the head office (EUR 34 million in 2019), the tax on financial assets in Romania (EUR 16 million in 2019) and the contribution to COVID guarantee funds in the Mediterranean Basin (EUR 15 million in 2020), operating expenses were 0.8%* lower than in 2019.
Operating expenses were down -2.4%* (-10.8%) in Q4 20 vs. Q4 19. When restated for the tax in Romania,
operating expenses were 0.9%* lower, reflecting control of costs.
The cost to income ratio stood at 55.1% in 2020 and 53.0% in Q4 20.
In International Retail Banking, operating expenses were down -1.4%* (-10.8%) vs. 2019 and down -4.3%* (-12.8% at current structure and exchange rates) vs. Q4 19 which included the tax in Romania. For the SG Russia(1) scope, the rationalisation of the network and pooling initiatives helped optimise costs (-8.6%* in
Q4 20 vs. Q4 19) and gross operating income (+10.9%* vs. Q4 19). For the Africa, Mediterranean Basin and
French Overseas Territories scope, costs were lower (-1.8%* vs. Q4 19).
In the Insurance business, operating expenses rose +2.5%* (+2.0%) vs. 2019 to EUR 356 million and were slightly higher +0.5%*, (0.0%) than in Q4 19, in conjunction with efforts to control costs.
In Financial Services to Corporates, operating expenses were down -0.3%* (-6.5%) vs. 2019 and were 4.4%* higher than in Q4 19 (-5.7%).
(1) SG Russia encompasses the entities Rosbank, Rusfinance Bank, Societe Generale Insurance, ALD Automotive and their consolidated subsidiaries.
10
Cost of risk
2020: the cost of risk amounted to 96 basis points (or EUR 1,265 million). It was 43 basis points in 2019. The
estimate of expected credit losses in Stage 1 and Stage 2 amounts to EUR 389 million.
Q4 20: the commercial cost of risk amounted to 89 basis points in Q4 20 (or EUR 287 million), vs. 102 basis points in Q3 20, and 46 basis points in Q4 19. The Q4 cost of risk includes EUR 79 million for the estimate of expected credit losses in Stage 1 and Stage 2. Contribution to Group net income
The contribution to Group net income totalled EUR 1,304 million in 2020 (-27.1%*, -33.3% vs. 2019) and EUR 376 million in Q4 20 (-11.7%*, -18.8% vs. Q4 19).
Underlying RONE stood at the high level of 12.4% in 2020, vs. 17.9% in 2019 and 14.3% in Q4 20 vs. 16.8% in Q4
19 (with RONE of 10.0% in International Retail Banking and 20.0% in financial services and insurance).
11
5. GLOBAL BANKING & INVESTOR SOLUTIONS
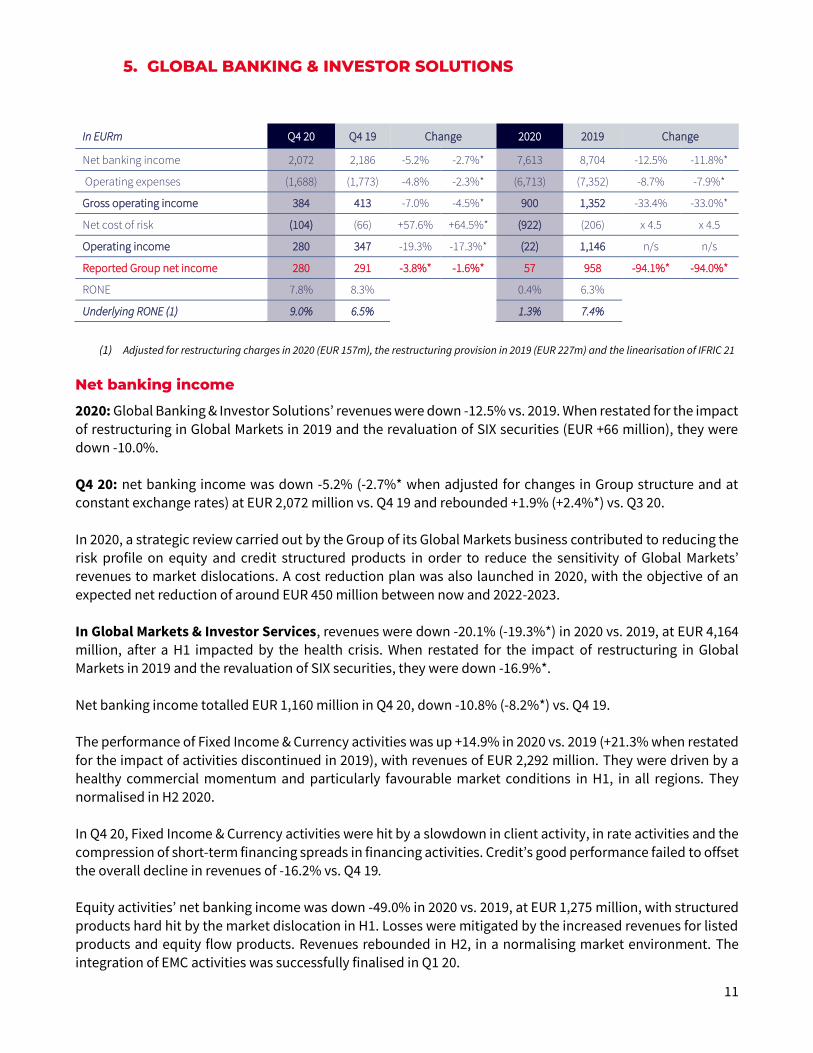
In EURm Q4 20 Q4 19 Change 2020 2019 Change
Net banking income 2,072 2,186 -5.2% -2.7%* 7,613 8,704 -12.5% -11.8%*
Operating expenses (1,688) (1,773) -4.8% -2.3%* (6,713) (7,352) -8.7% -7.9%*
Gross operating income 384 413 -7.0% -4.5%* 900 1,352 -33.4% -33.0%*
Net cost of risk (104) (66) +57.6% +64.5%* (922) (206) x 4.5 x 4.5
Operating income 280 347 -19.3% -17.3%* (22) 1,146 n/s n/s
Reported Group net income 280 291 -3.8%* -1.6%* 57 958 -94.1%* -94.0%*
RONE 7.8% 8.3% 0.4% 6.3% Underlying RONE (1) 9.0% 6.5% 1.3% 7.4%
(1) Adjusted for restructuring charges in 2020 (EUR 157m), the restructuring provision in 2019 (EUR 227m) and the linearisation of IFRIC 21
Net banking income
2020: Global Banking & Investor Solutions’ revenues were down -12.5% vs. 2019. When restated for the impact
of restructuring in Global Markets in 2019 and the revaluation of SIX securities (EUR +66 million), they were down -10.0%.
Q4 20: net banking income was down -5.2% (-2.7%* when adjusted for changes in Group structure and at constant exchange rates) at EUR 2,072 million vs. Q4 19 and rebounded +1.9% (+2.4%*) vs. Q3 20.
In 2020, a strategic review carried out by the Group of its Global Markets business contributed to reducing the
risk profile on equity and credit structured products in order to reduce the sensitivity of Global Markets’ revenues to market dislocations. A cost reduction plan was also launched in 2020, with the objective of an
expected net reduction of around EUR 450 million between now and 2022-2023.
In Global Markets & Investor Services, revenues were down -20.1% (-19.3%*) in 2020 vs. 2019, at EUR 4,164 million, after a H1 impacted by the health crisis. When restated for the impact of restructuring in Global
Markets in 2019 and the revaluation of SIX securities, they were down -16.9%*.
Net banking income totalled EUR 1,160 million in Q4 20, down -10.8% (-8.2%*) vs. Q4 19. The performance of Fixed Income & Currency activities was up +14.9% in 2020 vs. 2019 (+21.3% when restated
for the impact of activities discontinued in 2019), with revenues of EUR 2,292 million. They were driven by a
healthy commercial momentum and particularly favourable market conditions in H1, in all regions. They normalised in H2 2020.
In Q4 20, Fixed Income & Currency activities were hit by a slowdown in client activity, in rate activities and the
compression of short-term financing spreads in financing activities. Credit’s good performance failed to offset the overall decline in revenues of -16.2% vs. Q4 19.
Equity activities’ net banking income was down -49.0% in 2020 vs. 2019, at EUR 1,275 million, with structured
products hard hit by the market dislocation in H1. Losses were mitigated by the increased revenues for listed
products and equity flow products. Revenues rebounded in H2, in a normalising market environment. The integration of EMC activities was successfully finalised in Q1 20.
12
Q4 20 provided further confirmation of the improvement in revenues observed in Q3 20, with net banking income up +11.5% (-6.9% vs. Q4 19) and in particular a gradual recovery in structured products. Flow & hedging
activities enjoyed strong volumes over the quarter and the Asia region performed well in all products.
Securities Services’ assets under custody amounted to EUR 4,315 billion at end-December 2020, slightly lower
(-0.3%) than at end-September 2020. Over the same period, assets under administration were up +4.1% at EUR 638 billion.
Securities Services’ revenues totalled EUR 597 million in 2020, down -12.2% (when restated for the revaluation of SIX securities) vs. 2019 (-16.4% on a reported basis). They were down -9.5% in Q4 20 vs. Q4 19, at EUR 153
million. Financing & Advisory revenues totalled EUR 2,546 million in 2020, up +0.6%* vs. 2019 (stable at current
structure and exchange rates), with the strengthening of the franchises and ongoing support for clients during
this challenging year. Investment Banking performed particularly well, benefiting from a high level of issues in
the debt and equity capital markets and buoyant acquisition financing activity.
Financing & Advisory enjoyed solid net banking income of EUR 681 million in Q4 20, increasing by +9.0%* vs.
Q4 19 (+5.9% at current structure and exchange rates) and rebounding by +18.3%* vs. Q3 20. This increase reflects the good performance of asset financing activities, the Asset Backed Products
platform and the recovery in Global Transaction and Payment Services. Investment Banking revenues
continued to grow in Q4 20.
Asset and Wealth Management’s net banking income totalled EUR 903 million in 2020, down -4.6% vs. 2019 (-1.3% when restated for the revaluation of SIX securities). It was 4.9% lower in Q4 20 than in Q4 19.
Lyxor’s net banking income amounted to EUR 207 million in 2020, up +3.5% vs. 2019, driven by a high level of
performance fees. It rebounded by +20.8% in Q4 20 vs. Q3 20 (+12.3% vs. Q4 19), with growth in the Active
Management segment. Lyxor confirmed its leadership position in the Green Bond segment in 2020 and enhanced its ESG ETF offering. Lyxor’s assets under management totalled EUR 140 billion at end-December
2020, up +5.9% vs. Q4 19.
Private Banking’s performance was lower in 2020 (-2.4%, when restated for the revaluation of SIX securities)
vs. 2019, with net banking income of EUR 678 million. Revenues were hit by pressures on interest margins despite stable commercial revenues. Net banking income was 10.5% lower in Q4 20 than in Q4 19.
Assets under management were up +2.0% in Q4 20, at EUR 116 billion. Net inflow totalled EUR 1.7 billion in 2020, driven by France. Operating expenses
2020: underlying operating expenses (restated for the restructuring provision recognised in Q2 19 for EUR 227
million and the restructuring charge recognised in Q4 20 for EUR 157 million, related to the new EUR 450 million cost savings plan between now and 2022/2023), were substantially lower (-7.2%*) than in 2019. This decline reflects the successful cost savings plan (EUR 500 million) implemented in Global Banking & Investor Solutions in 2018. They were down -7.9%* on a reported basis. Q4 20: underlying operating expenses were down -9.7%* (-2.3%* on a reported basis) vs. Q4 19, with a positive
jaws effect in Q4 20.
13
Net cost of risk
2020: the cost of risk amounted to 57 basis points (or EUR 922 million) vs. 13 basis points in 2019. It includes
EUR 310 million of S1/S2 provisioning and EUR 612 million of S3 (non-performing loans) provisioning. Q4 20: the commercial cost of risk amounted to 28 basis points (or EUR 104 million), vs. 14 basis points in Q3 20 and 17 basis points in Q4 19. It includes EUR 26 million of S1/S2 (performing/underperforming loans) provisioning and EUR 77 million of S3 (credit-impaired loans) provisioning.
Contribution to Group net income
2020: the underlying contribution to Group net income (after linearisation of IFRIC 21 and adjusted for restructuring charges in 2020 and the restructuring provision in 2019) came to EUR 183 million. Q4 20: the underlying contribution to Group net income amounted to EUR 320 million, up +46%* vs. Q4 19.
Underlying RONE stood at 1.3% in 2020 vs. 7.4% in 2019 and 9.0% in Q4 20 vs. 6.5% in Q4 19.
14
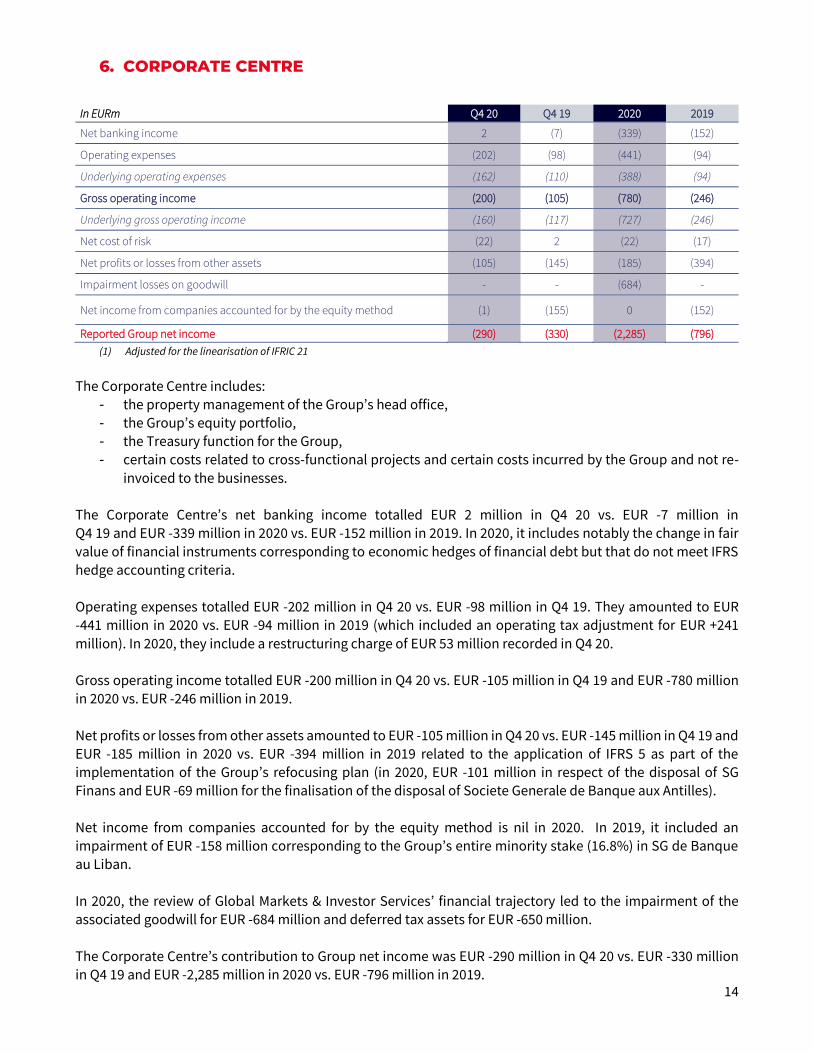
6. CORPORATE CENTRE
In EURm Q4 20 Q4 19 2020 2019
Net banking income 2 (7) (339) (152)
Operating expenses (202) (98) (441) (94)
Underlying operating expenses (162) (110) (388) (94)
Gross operating income (200) (105) (780) (246)
Underlying gross operating income (160) (117) (727) (246)
Net cost of risk (22) 2 (22) (17)
Net profits or losses from other assets (105) (145) (185) (394)
Impairment losses on goodwill - - (684) -
Net income from companies accounted for by the equity method (1) (155) 0 (152)
Reported Group net income (290) (330) (2,285) (796)
(1) Adjusted for the linearisation of IFRIC 21
The Corporate Centre includes: - the property management of the Group’s head office, - the Group’s equity portfolio,
- the Treasury function for the Group, - certain costs related to cross-functional projects and certain costs incurred by the Group and not re-
invoiced to the businesses.
The Corporate Centre’s net banking income totalled EUR 2 million in Q4 20 vs. EUR -7 million in Q4 19 and EUR -339 million in 2020 vs. EUR -152 million in 2019. In 2020, it includes notably the change in fair
value of financial instruments corresponding to economic hedges of financial debt but that do not meet IFRS
hedge accounting criteria.
Operating expenses totalled EUR -202 million in Q4 20 vs. EUR -98 million in Q4 19. They amounted to EUR -441 million in 2020 vs. EUR -94 million in 2019 (which included an operating tax adjustment for EUR +241
million). In 2020, they include a restructuring charge of EUR 53 million recorded in Q4 20. Gross operating income totalled EUR -200 million in Q4 20 vs. EUR -105 million in Q4 19 and EUR -780 million
in 2020 vs. EUR -246 million in 2019.
Net profits or losses from other assets amounted to EUR -105 million in Q4 20 vs. EUR -145 million in Q4 19 and EUR -185 million in 2020 vs. EUR -394 million in 2019 related to the application of IFRS 5 as part of the implementation of the Group’s refocusing plan (in 2020, EUR -101 million in respect of the disposal of SG
Finans and EUR -69 million for the finalisation of the disposal of Societe Generale de Banque aux Antilles).
Net income from companies accounted for by the equity method is nil in 2020. In 2019, it included an impairment of EUR -158 million corresponding to the Group’s entire minority stake (16.8%) in SG de Banque au Liban.
In 2020, the review of Global Markets & Investor Services’ financial trajectory led to the impairment of the associated goodwill for EUR -684 million and deferred tax assets for EUR -650 million.
The Corporate Centre’s contribution to Group net income was EUR -290 million in Q4 20 vs. EUR -330 million in Q4 19 and EUR -2,285 million in 2020 vs. EUR -796 million in 2019.
15
7. OUTLOOK
The Group is aiming for a decline in underlying operating expenses in relation to 2020, as from 2023. In 2021, it will maintain strict discipline and target a positive jaws effect against the backdrop of an improvement in
the economic outlook with a slight increase in its costs.
The 2021 cost of risk is expected to be lower than in 2020.
The Group aims to operate with a CET1 ratio more than 200 basis points above the regulatory requirement, including after the entry into force of the regulation finalising the Basel III reform whose impact is expected to be around EUR 39 billion(1) as from 2023, or around 115 basis points(2)
In 2021, the CET1 ratio is expected to be at a level significantly higher than 200 basis points above the
regulatory requirement.
Regarding its distribution policy for the 2021 financial year, the Board of Directors has confirmed the objective defined before the outbreak of the COVID crisis, i.e. a payout ratio of 50% of underlying Group net income(3) , which may include a share buy-back component (up to 10%)(4) ; the dividend component being paid in cash.
Finally, the Group will present its Global Banking & Investor Solutions’ strategy to the market on May 10th, 2021 and its focus on CSR in H2.
8. CONCLUSION
The year 2020 will have been marked by a global health crisis, the economic and social (confinements and
curfews) consequences have affected the Group's business, particularly in the first half of the year. With a
significant improvement in H2 (+11% in H2 20 vs. H1 20), the Group’s full-year revenues totalled EUR 22,113 million, down -7.6%* (vs. 2019), confirming the relevance of its diversified business model, the resilience of its franchises and its ability to generate capital.
In this challenging environment, the Group achieved all its financial targets in terms of costs (underlying operating expenses of EUR 16.5 billion), cost of risk (64 basis points, below the target of 70 basis points) and
capital (CET1 ratio of 13.4%, i.e. above 12%).
More generally, the Group demonstrated its ability to manage this crisis responsibly throughout the year, by playing its role with its employees, customers and communities.
Moreover, this crisis has proved to be an accelerator of societal trends that the Group had already identified as a priority: Corporate Social Responsibility and digital technology. In 2020, the Group achieved a new milestone in terms of the energy transition by becoming the No. 2 globally in renewable energy financing and No. 1 on the advisory component. Moreover, the Board of Directors has validated a binding objective: the
Group’s governing bodies will have to include at least 30% women by 2023, ensuring compliance with this objective both in the businesses and the functions. More generally, the Group’s extra-financial ratings are among the leaders in the banking sector: highest rating (A1+) assigned by the extra-financial rating agency Vigeo Eiris, position in the first decile of the ISS ESG ranking (C+ Prime), top 14% in the bank MSCI
ranking (AA) and first decile of the RobecoSAM ranking with a place of 25th worldwide, after being ranked 1st
worldwide on environmental issues in 2019.
In 2021, the Group shall remain fully committed to its priorities (i) its customers (ii) maintaining strict cost discipline, managing the cost of risk and the allocation of capital, (iii) creating value for its shareholders.
(1) Including the credit risk, FRTB, operational risk and taking into account the main EU-specific assumptions communicated by the EBA in response to the European Commission’s consultation paper (published in December 2020) and excluding the output floor which would not be binding before 2027/2028
(2)On a prospective basis in 2023
(3)After deducting interest on deeply subordinated notes and undated subordinated notes
(4)Subject to the approval of the General Meeting of Shareholders and regulatory bodies
16
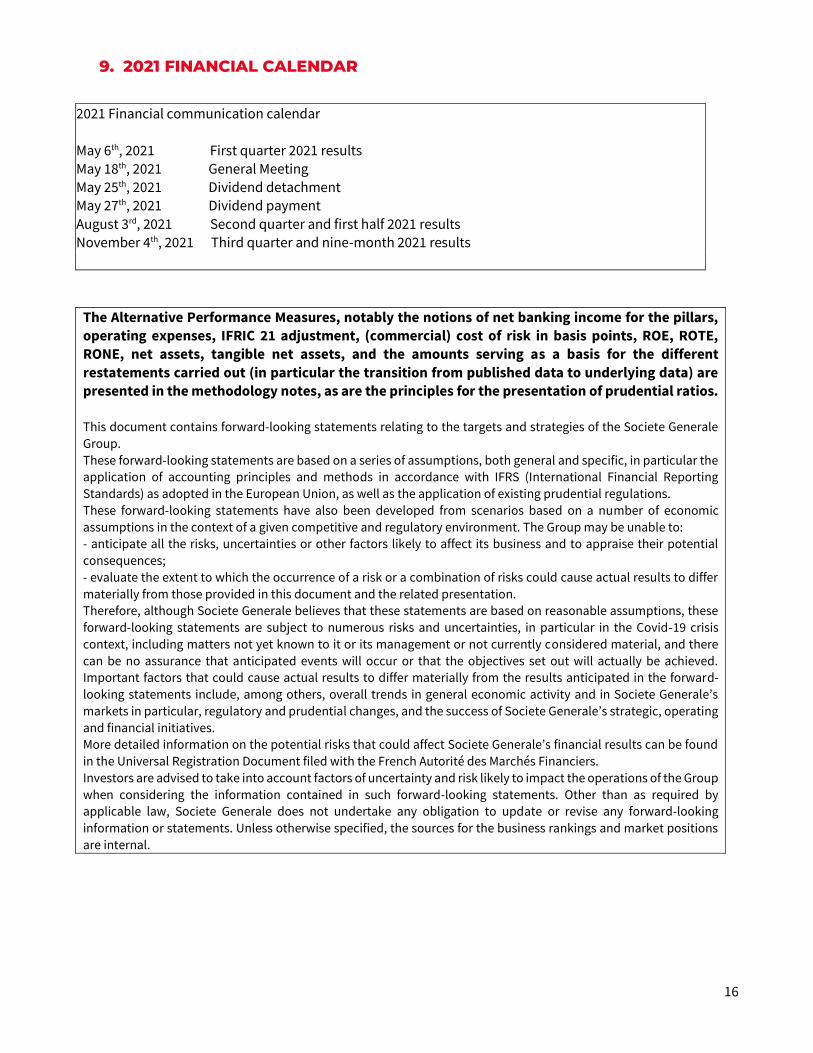
9. 2021 FINANCIAL CALENDAR
2021 Financial communication calendar
May 6th, 2021 First quarter 2021 results May 18th, 2021 General Meeting May 25th, 2021 Dividend detachment May 27th, 2021 Dividend payment
August 3rd, 2021 Second quarter and first half 2021 results November 4th, 2021 Third quarter and nine-month 2021 results
The Alternative Performance Measures, notably the notions of net banking income for the pillars, operating expenses, IFRIC 21 adjustment, (commercial) cost of risk in basis points, ROE, ROTE,
RONE, net assets, tangible net assets, and the amounts serving as a basis for the different
restatements carried out (in particular the transition from published data to underlying data) are presented in the methodology notes, as are the principles for the presentation of prudential ratios.
This document contains forward-looking statements relating to the targets and strategies of the Societe Generale
Group.
These forward-looking statements are based on a series of assumptions, both general and specific, in particular the
application of accounting principles and methods in accordance with IFRS (International Financial Reporting
Standards) as adopted in the European Union, as well as the application of existing prudential regulations.
These forward-looking statements have also been developed from scenarios based on a number of economic
assumptions in the context of a given competitive and regulatory environment. The Group may be unable to:
- anticipate all the risks, uncertainties or other factors likely to affect its business and to appraise their potential
consequences;
- evaluate the extent to which the occurrence of a risk or a combination of risks could cause actual results to differ
materially from those provided in this document and the related presentation.
Therefore, although Societe Generale believes that these statements are based on reasonable assumptions, these
forward-looking statements are subject to numerous risks and uncertainties, in particular in the Covid-19 crisis
context, including matters not yet known to it or its management or not currently considered material, and there
can be no assurance that anticipated events will occur or that the objectives set out will actually be achieved.
Important factors that could cause actual results to differ materially from the results anticipated in the forward-
looking statements include, among others, overall trends in general economic activity and in Societe Generale’s
markets in particular, regulatory and prudential changes, and the success of Societe Generale’s strategic, operating
and financial initiatives.
More detailed information on the potential risks that could affect Societe Generale’s financial results can be found
in the Universal Registration Document filed with the French Autorité des Marchés Financiers.
Investors are advised to take into account factors of uncertainty and risk likely to impact the operations of the Group
when considering the information contained in such forward-looking statements. Other than as required by
applicable law, Societe Generale does not undertake any obligation to update or revise any forward-looking
information or statements. Unless otherwise specified, the sources for the business rankings and market positions
are internal.
17
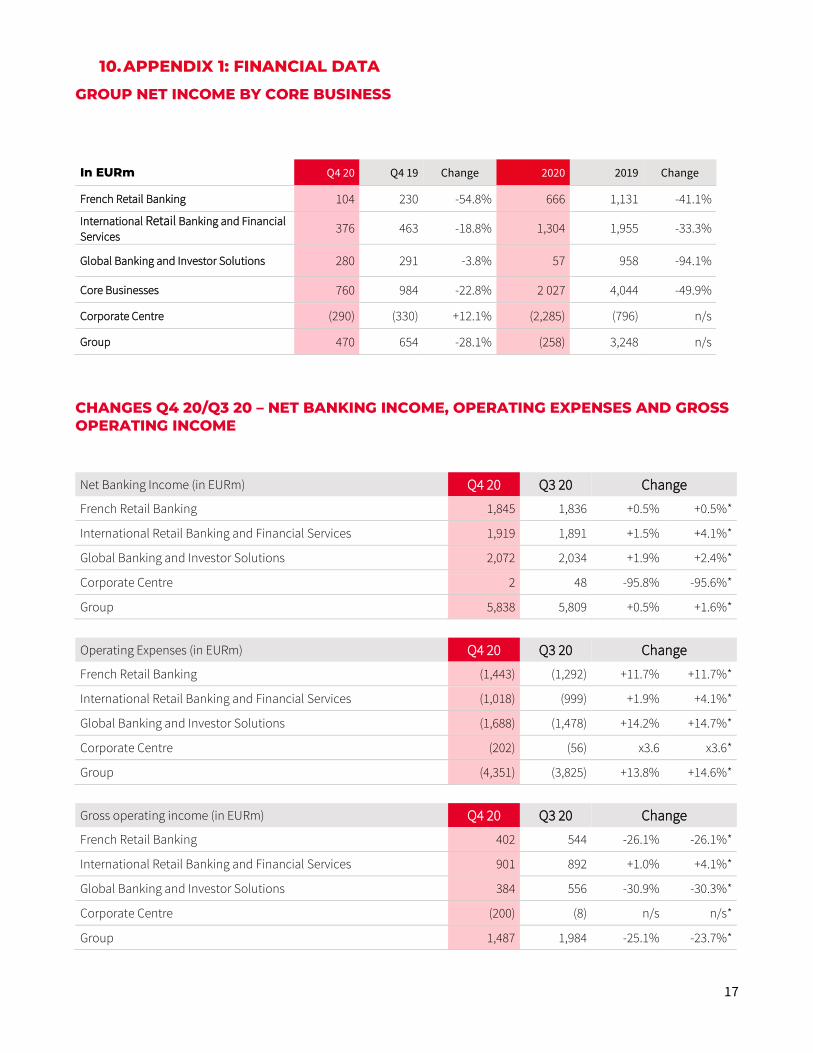
10. APPENDIX 1: FINANCIAL DATA
GROUP NET INCOME BY CORE BUSINESS
In EURm Q4 20 Q4 19 Change 2020 2019 Change
French Retail Banking 104 230 -54.8% 666 1,131 -41.1%
International Retail Banking and Financial
Services 376 463 -18.8% 1,304 1,955 -33.3%
Global Banking and Investor Solutions 280 291 -3.8% 57 958 -94.1%
Core Businesses 760 984 -22.8% 2 027 4,044 -49.9%
Corporate Centre (290) (330) +12.1% (2,285) (796) n/s
Group 470 654 -28.1% (258) 3,248 n/s
CHANGES Q4 20/Q3 20 – NET BANKING INCOME, OPERATING EXPENSES AND GROSS OPERATING INCOME
Net Banking Income (in EURm) Q4 20 Q3 20 Change
French Retail Banking 1,845 1,836 +0.5% +0.5%*
International Retail Banking and Financial Services 1,919 1,891 +1.5% +4.1%*
Global Banking and Investor Solutions 2,072 2,034 +1.9% +2.4%*
Corporate Centre 2 48 -95.8% -95.6%*
Group 5,838 5,809 +0.5% +1.6%*
Operating Expenses (in EURm) Q4 20 Q3 20 Change
French Retail Banking (1,443) (1,292) +11.7% +11.7%*
International Retail Banking and Financial Services (1,018) (999) +1.9% +4.1%*
Global Banking and Investor Solutions (1,688) (1,478) +14.2% +14.7%*
Corporate Centre (202) (56) x3.6 x3.6*
Group (4,351) (3,825) +13.8% +14.6%*
Gross operating income (in EURm) Q4 20 Q3 20 Change
French Retail Banking 402 544 -26.1% -26.1%*
International Retail Banking and Financial Services 901 892 +1.0% +4.1%*
Global Banking and Investor Solutions 384 556 -30.9% -30.3%*
Corporate Centre (200) (8) n/s n/s*
Group 1,487 1,984 -25.1% -23.7%*
18
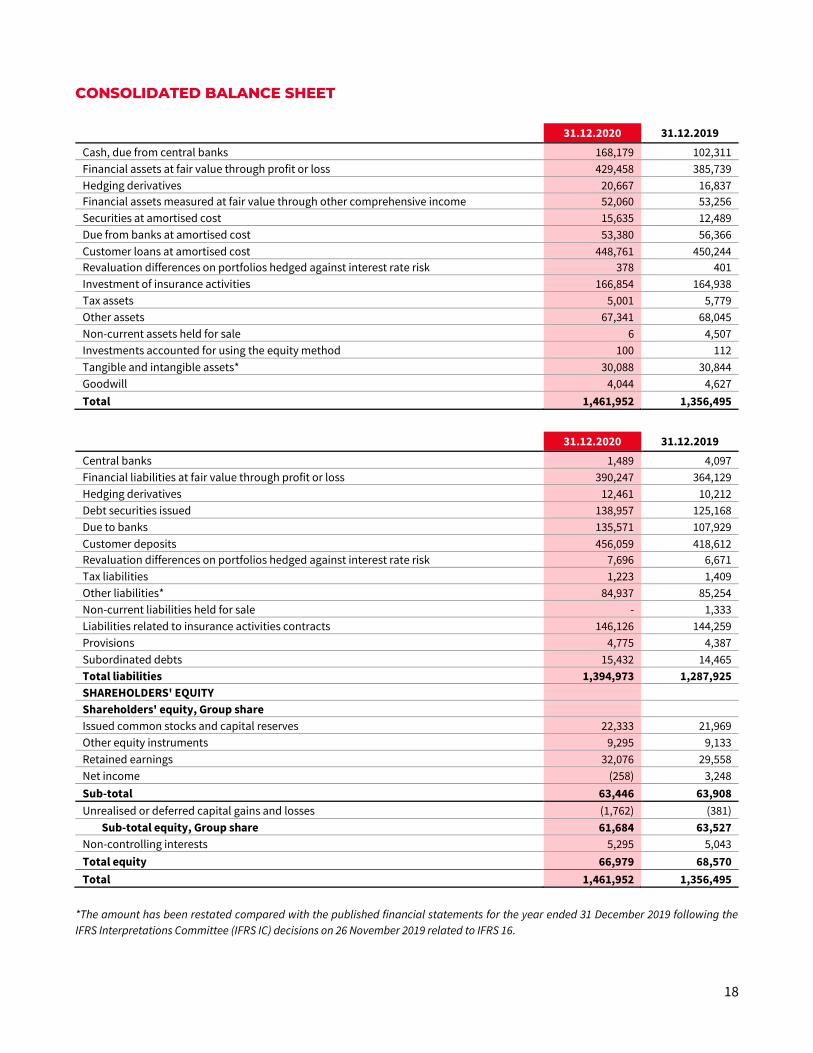
CONSOLIDATED BALANCE SHEET
31.12.2020 31.12.2019
Cash, due from central banks 168,179 102,311
Financial assets at fair value through profit or loss 429,458 385,739
Hedging derivatives 20,667 16,837
Financial assets measured at fair value through other comprehensive income 52,060 53,256
Securities at amortised cost 15,635 12,489
Due from banks at amortised cost 53,380 56,366
Customer loans at amortised cost 448,761 450,244
Revaluation differences on portfolios hedged against interest rate risk 378 401
Investment of insurance activities 166,854 164,938
Tax assets 5,001 5,779
Other assets 67,341 68,045
Non-current assets held for sale 6 4,507
Investments accounted for using the equity method 100 112
Tangible and intangible assets* 30,088 30,844
Goodwill 4,044 4,627
Total 1,461,952 1,356,495
31.12.2020 31.12.2019
Central banks 1,489 4,097
Financial liabilities at fair value through profit or loss 390,247 364,129
Hedging derivatives 12,461 10,212
Debt securities issued 138,957 125,168
Due to banks 135,571 107,929
Customer deposits 456,059 418,612
Revaluation differences on portfolios hedged against interest rate risk 7,696 6,671
Tax liabilities 1,223 1,409
Other liabilities* 84,937 85,254
Non-current liabilities held for sale - 1,333
Liabilities related to insurance activities contracts 146,126 144,259
Provisions 4,775 4,387
Subordinated debts 15,432 14,465
Total liabilities 1,394,973 1,287,925
SHAREHOLDERS' EQUITY Shareholders' equity, Group share Issued common stocks and capital reserves 22,333 21,969
Other equity instruments 9,295 9,133
Retained earnings 32,076 29,558
Net income (258) 3,248
Sub-total 63,446 63,908
Unrealised or deferred capital gains and losses (1,762) (381)
Sub-total equity, Group share 61,684 63,527
Non-controlling interests 5,295 5,043
Total equity 66,979 68,570
Total 1,461,952 1,356,495
*The amount has been restated compared with the published financial statements for the year ended 31 December 2019 following the
IFRS Interpretations Committee (IFRS IC) decisions on 26 November 2019 related to IFRS 16.
19
11. APPENDIX 2: METHODOLOGY
1 – The financial information presented in respect of the fourth quarter and 2020 was examined by the
Board of Directors on February 9th, 2021 and has been prepared in accordance with IFRS as adopted in the European Union and applicable at that date. This information has not been audited.
2 – Net banking income
The pillars’ net banking income is defined on page 43 of Societe Generale’s 2020 Universal Registration Document. The terms “Revenues” or “Net Banking Income” are used interchangeably. They provide a
normalised measure of each pillar’s net banking income taking into account the normative capital mobilised for its activity.
3 – Operating expenses
Operating expenses correspond to the “Operating Expenses” as presented in note 8.1 to the Group’s consolidated financial statements as at December 31st, 2019 (pages 423 et seq. of Societe Generale’s 2020
Universal Registration Document). The term “costs” is also used to refer to Operating
Expenses.
The Cost/Income Ratio is defined on page 43 of Societe Generale’s 2020 Universal Registration Document.
4 - IFRIC 21 adjustment
The IFRIC 21 adjustment corrects the result of the charges recognised in the accounts in their entirety when
they are due (generating event) so as to recognise only the portion relating to the current quarter, i.e. a quarter of the total. It consists in smoothing the charge recognised accordingly over the financial year in order to
provide a more economic idea of the costs actually attributable to the activity over the period analysed.
20
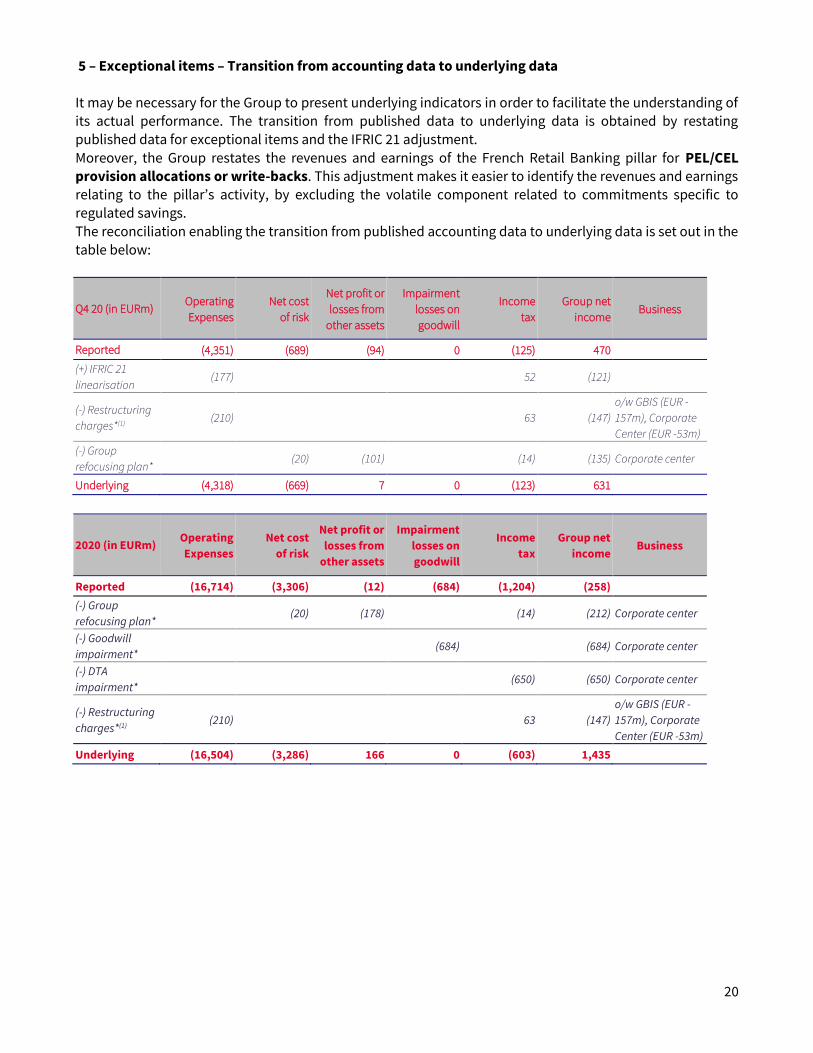
5 – Exceptional items – Transition from accounting data to underlying data It may be necessary for the Group to present underlying indicators in order to facilitate the understanding of
its actual performance. The transition from published data to underlying data is obtained by restating published data for exceptional items and the IFRIC 21 adjustment.
Moreover, the Group restates the revenues and earnings of the French Retail Banking pillar for PEL/CEL
provision allocations or write-backs. This adjustment makes it easier to identify the revenues and earnings relating to the pillar’s activity, by excluding the volatile component related to commitments specific to regulated savings.
The reconciliation enabling the transition from published accounting data to underlying data is set out in the table below:
Q4 20 (in EURm) Operating
Expenses
Net cost
of risk
Net profit or
losses from
other assets
Impairment
losses on
goodwill
Income
tax
Group net
income Business
Reported (4,351) (689) (94) 0 (125) 470
(+) IFRIC 21
linearisation (177) 52 (121)
(-) Restructuring
charges*(1) (210) 63 (147)
o/w GBIS (EUR -
157m), Corporate
Center (EUR -53m)
(-) Group
refocusing plan* (20) (101) (14) (135) Corporate center
Underlying (4,318) (669) 7 0 (123) 631
2020 (in EURm) Operating
Expenses
Net cost
of risk
Net profit or
losses from
other assets
Impairment
losses on
goodwill
Income
tax
Group net
income Business
Reported (16,714) (3,306) (12) (684) (1,204) (258)
(-) Group
refocusing plan* (20) (178) (14) (212) Corporate center
(-) Goodwill
impairment* (684) (684) Corporate center
(-) DTA
impairment* (650) (650) Corporate center
(-) Restructuring
charges*(1) (210) 63 (147)
o/w GBIS (EUR -
157m), Corporate
Center (EUR -53m)
Underlying (16,504) (3,286) 166 0 (603) 1,435
21
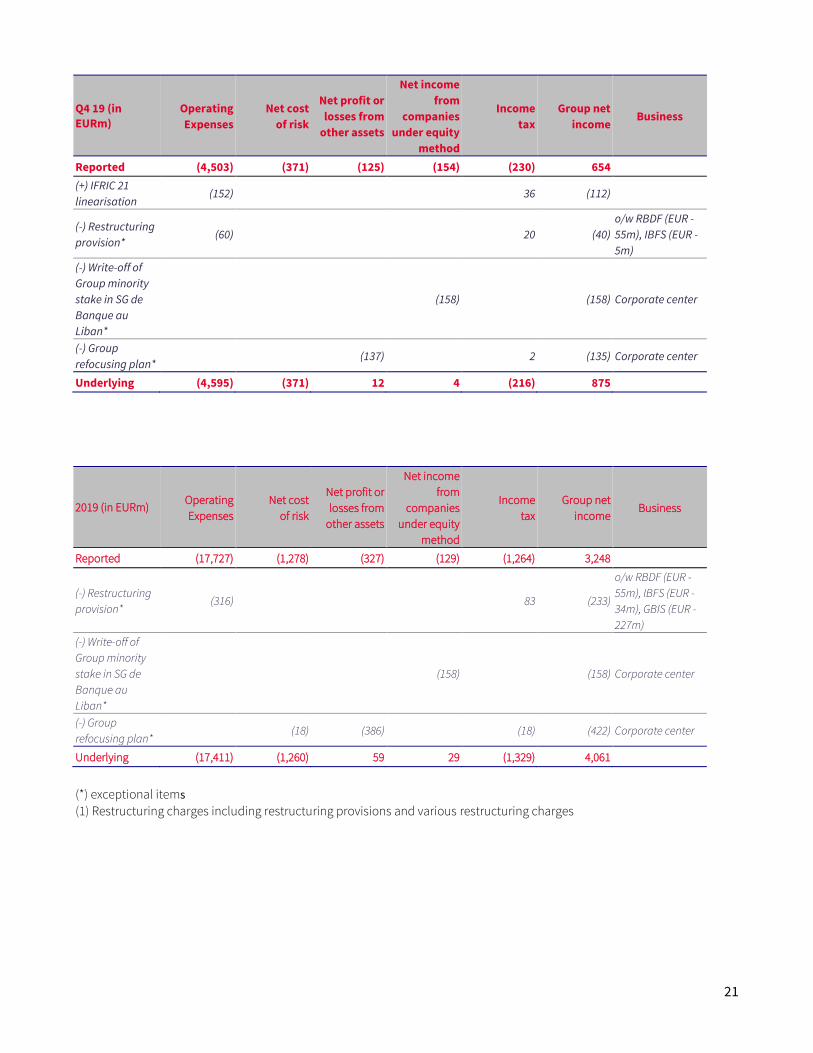
Q4 19 (in
EURm)
Operating
Expenses
Net cost
of risk
Net profit or
losses from
other assets
Net income
from
companies
under equity
method
Income
tax
Group net
income Business
Reported (4,503) (371) (125) (154) (230) 654
(+) IFRIC 21
linearisation (152) 36 (112)
(-) Restructuring
provision* (60) 20 (40)
o/w RBDF (EUR -
55m), IBFS (EUR -
5m)
(-) Write-off of
Group minority
stake in SG de
Banque au
Liban*
(158) (158) Corporate center
(-) Group
refocusing plan* (137) 2 (135) Corporate center
Underlying (4,595) (371) 12 4 (216) 875
2019 (in EURm) Operating
Expenses
Net cost
of risk
Net profit or
losses from
other assets
Net income
from
companies
under equity
method
Income
tax
Group net
income Business
Reported (17,727) (1,278) (327) (129) (1,264) 3,248
(-) Restructuring
provision* (316) 83 (233)
o/w RBDF (EUR -
55m), IBFS (EUR -
34m), GBIS (EUR -
227m)
(-) Write-off of
Group minority
stake in SG de
Banque au
Liban*
(158) (158) Corporate center
(-) Group
refocusing plan* (18) (386) (18) (422) Corporate center
Underlying (17,411) (1,260) 59 29 (1,329) 4,061
(*) exceptional items
(1) Restructuring charges including restructuring provisions and various restructuring charges
22
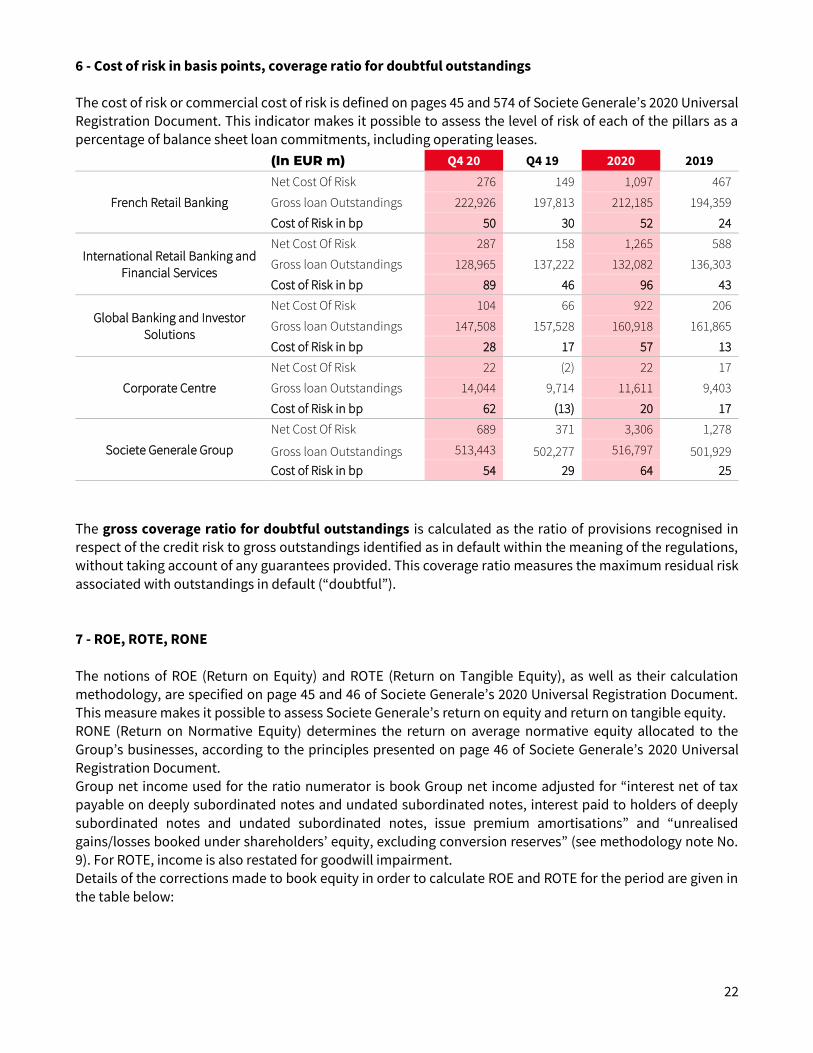
6 - Cost of risk in basis points, coverage ratio for doubtful outstandings The cost of risk or commercial cost of risk is defined on pages 45 and 574 of Societe Generale’s 2020 Universal
Registration Document. This indicator makes it possible to assess the level of risk of each of the pillars as a percentage of balance sheet loan commitments, including operating leases.
(In EUR m) Q4 20 Q4 19 2020 2019
French Retail Banking
Net Cost Of Risk 276 149 1,097 467
Gross loan Outstandings 222,926 197,813 212,185 194,359
Cost of Risk in bp 50 30 52 24
International Retail Banking and
Financial Services
Net Cost Of Risk 287 158 1,265 588
Gross loan Outstandings 128,965 137,222 132,082 136,303
Cost of Risk in bp 89 46 96 43
Global Banking and Investor
Solutions
Net Cost Of Risk 104 66 922 206
Gross loan Outstandings 147,508 157,528 160,918 161,865
Cost of Risk in bp 28 17 57 13
Corporate Centre
Net Cost Of Risk 22 (2) 22 17
Gross loan Outstandings 14,044 9,714 11,611 9,403
Cost of Risk in bp 62 (13) 20 17
Societe Generale Group
Net Cost Of Risk 689 371 3,306 1,278
Gross loan Outstandings 513,443 502,277 516,797 501,929
Cost of Risk in bp 54 29 64 25
The gross coverage ratio for doubtful outstandings is calculated as the ratio of provisions recognised in respect of the credit risk to gross outstandings identified as in default within the meaning of the regulations, without taking account of any guarantees provided. This coverage ratio measures the maximum residual risk
associated with outstandings in default (“doubtful”).
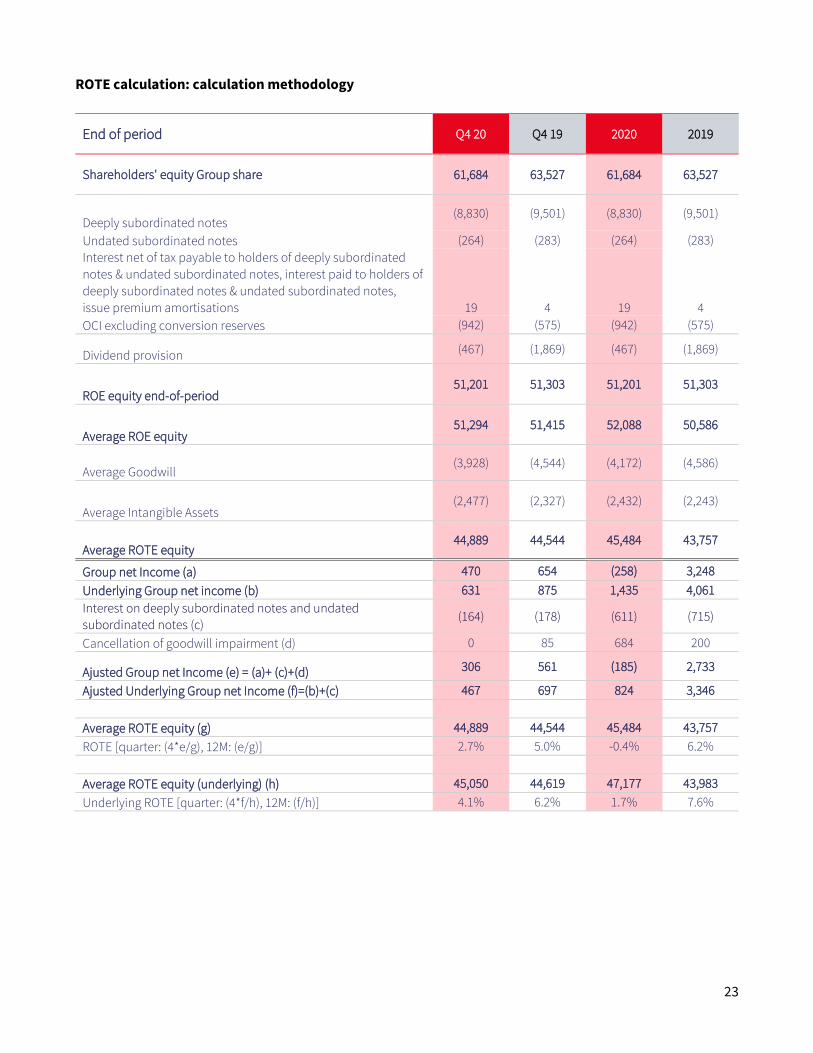
7 - ROE, ROTE, RONE
The notions of ROE (Return on Equity) and ROTE (Return on Tangible Equity), as well as their calculation
methodology, are specified on page 45 and 46 of Societe Generale’s 2020 Universal Registration Document. This measure makes it possible to assess Societe Generale’s return on equity and return on tangible equity. RONE (Return on Normative Equity) determines the return on average normative equity allocated to the
Group’s businesses, according to the principles presented on page 46 of Societe Generale’s 2020 Universal Registration Document.
Group net income used for the ratio numerator is book Group net income adjusted for “interest net of tax payable on deeply subordinated notes and undated subordinated notes, interest paid to holders of deeply
subordinated notes and undated subordinated notes, issue premium amortisations” and “unrealised
gains/losses booked under shareholders’ equity, excluding conversion reserves” (see methodology note No. 9). For ROTE, income is also restated for goodwill impairment. Details of the corrections made to book equity in order to calculate ROE and ROTE for the period are given in
the table below:
23
ROTE calculation: calculation methodology
End of period Q4 20 Q4 19 2020 2019
Shareholders' equity Group share 61,684 63,527 61,684 63,527
Deeply subordinated notes (8,830) (9,501) (8,830) (9,501)
Undated subordinated notes (264) (283) (264) (283)
Interest net of tax payable to holders of deeply subordinated
notes & undated subordinated notes, interest paid to holders of
deeply subordinated notes & undated subordinated notes,
issue premium amortisations 19 4 19 4
OCI excluding conversion reserves (942) (575) (942) (575)
Dividend provision (467) (1,869) (467) (1,869)
ROE equity end-of-period 51,201 51,303 51,201 51,303
Average ROE equity 51,294 51,415 52,088 50,586
Average Goodwill (3,928) (4,544) (4,172) (4,586)
Average Intangible Assets (2,477) (2,327) (2,432) (2,243)
Average ROTE equity 44,889 44,544 45,484 43,757
Group net Income (a) 470 654 (258) 3,248
Underlying Group net income (b) 631 875 1,435 4,061
Interest on deeply subordinated notes and undated
subordinated notes (c) (164) (178) (611) (715)
Cancellation of goodwill impairment (d) 0 85 684 200
Ajusted Group net Income (e) = (a)+ (c)+(d) 306 561 (185) 2,733
Ajusted Underlying Group net Income (f)=(b)+(c) 467 697 824 3,346
Average ROTE equity (g) 44,889 44,544 45,484 43,757
ROTE [quarter: (4*e/g), 12M: (e/g)] 2.7% 5.0% -0.4% 6.2%
Average ROTE equity (underlying) (h) 45,050 44,619 47,177 43,983
Underlying ROTE [quarter: (4*f/h), 12M: (f/h)] 4.1% 6.2% 1.7% 7.6%
24
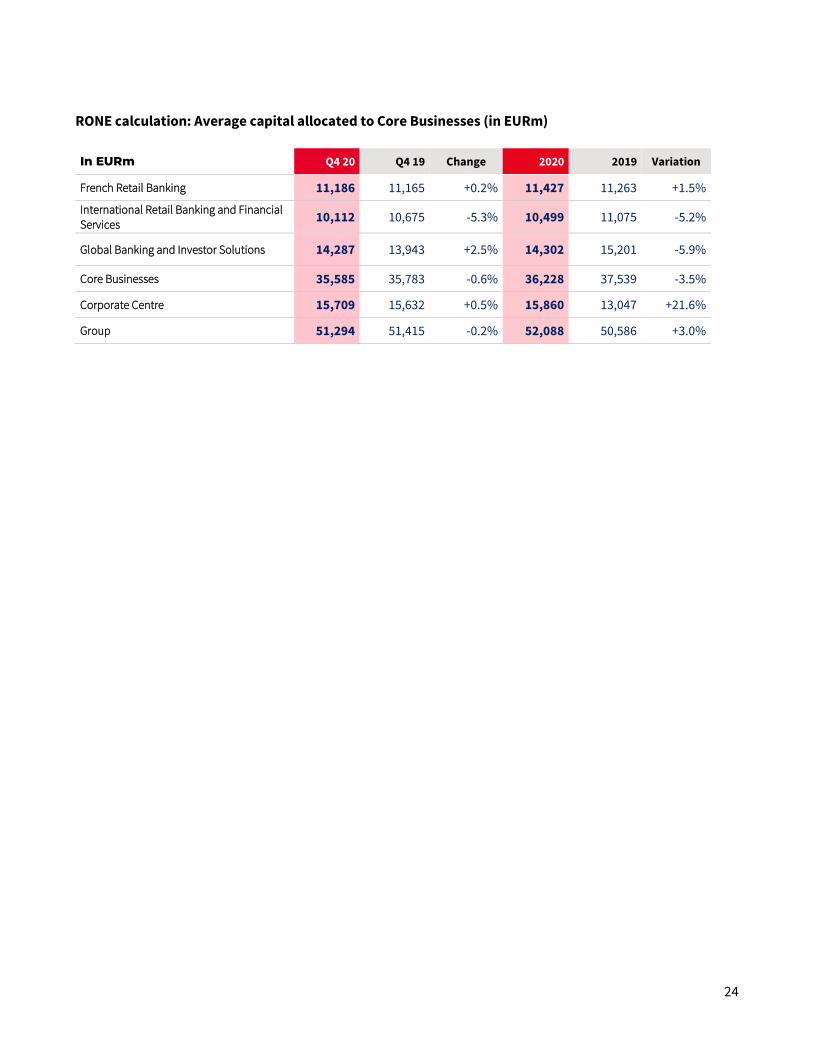
RONE calculation: Average capital allocated to Core Businesses (in EURm)
In EURm Q4 20 Q4 19 Change 2020 2019 Variation
French Retail Banking 11,186 11,165 +0.2% 11,427 11,263 +1.5%
International Retail Banking and Financial
Services 10,112 10,675 -5.3% 10,499 11,075 -5.2%
Global Banking and Investor Solutions 14,287 13,943 +2.5% 14,302 15,201 -5.9%
Core Businesses 35,585 35,783 -0.6% 36,228 37,539 -3.5%
Corporate Centre 15,709 15,632 +0.5% 15,860 13,047 +21.6%
Group 51,294 51,415 -0.2% 52,088 50,586 +3.0%
25
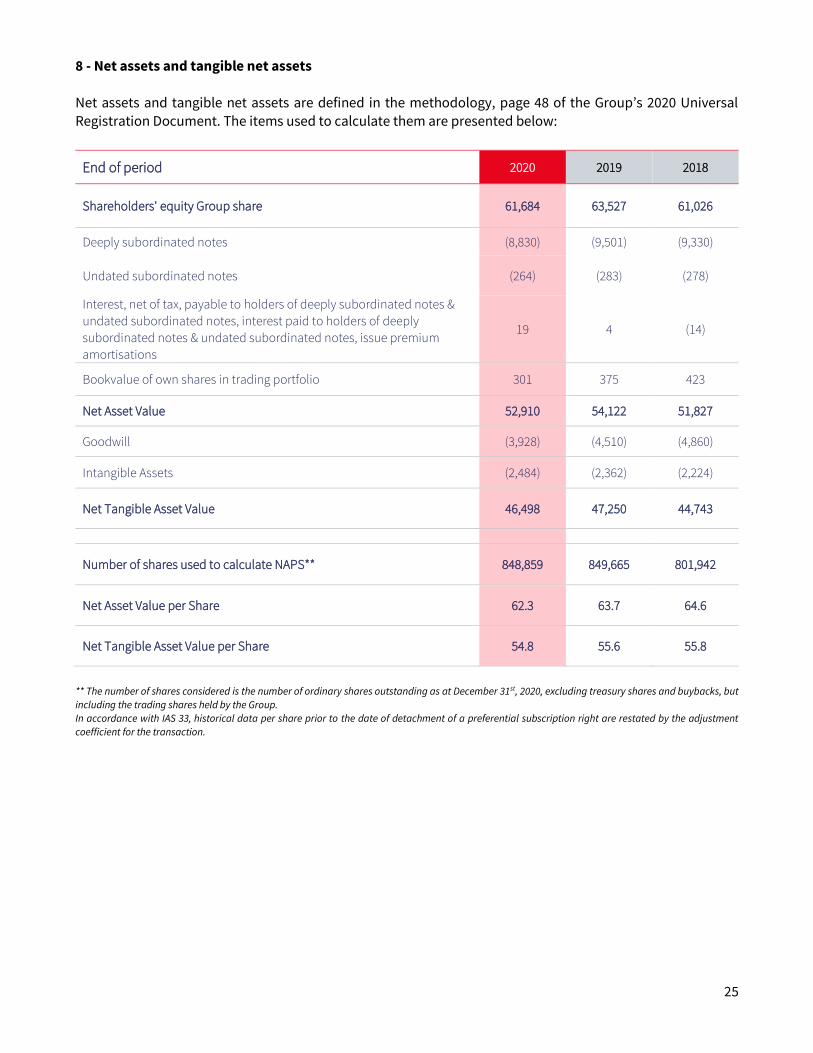
8 - Net assets and tangible net assets Net assets and tangible net assets are defined in the methodology, page 48 of the Group’s 2020 Universal
Registration Document. The items used to calculate them are presented below:
End of period 2020 2019 2018
Shareholders' equity Group share 61,684 63,527 61,026
Deeply subordinated notes (8,830) (9,501) (9,330)
Undated subordinated notes (264) (283) (278)
Interest, net of tax, payable to holders of deeply subordinated notes &
undated subordinated notes, interest paid to holders of deeply
subordinated notes & undated subordinated notes, issue premium
amortisations
19 4 (14)
Bookvalue of own shares in trading portfolio 301 375 423
Net Asset Value 52,910 54,122 51,827
Goodwill (3,928) (4,510) (4,860)
Intangible Assets (2,484) (2,362) (2,224)
Net Tangible Asset Value 46,498 47,250 44,743
Number of shares used to calculate NAPS** 848,859 849,665 801,942
Net Asset Value per Share 62.3 63.7 64.6
Net Tangible Asset Value per Share 54.8 55.6 55.8
** The number of shares considered is the number of ordinary shares outstanding as at December 31st, 2020, excluding treasury shares and buybacks, but
including the trading shares held by the Group.
In accordance with IAS 33, historical data per share prior to the date of detachment of a preferential subscription right are restated by the adjustment
coefficient for the transaction.
26
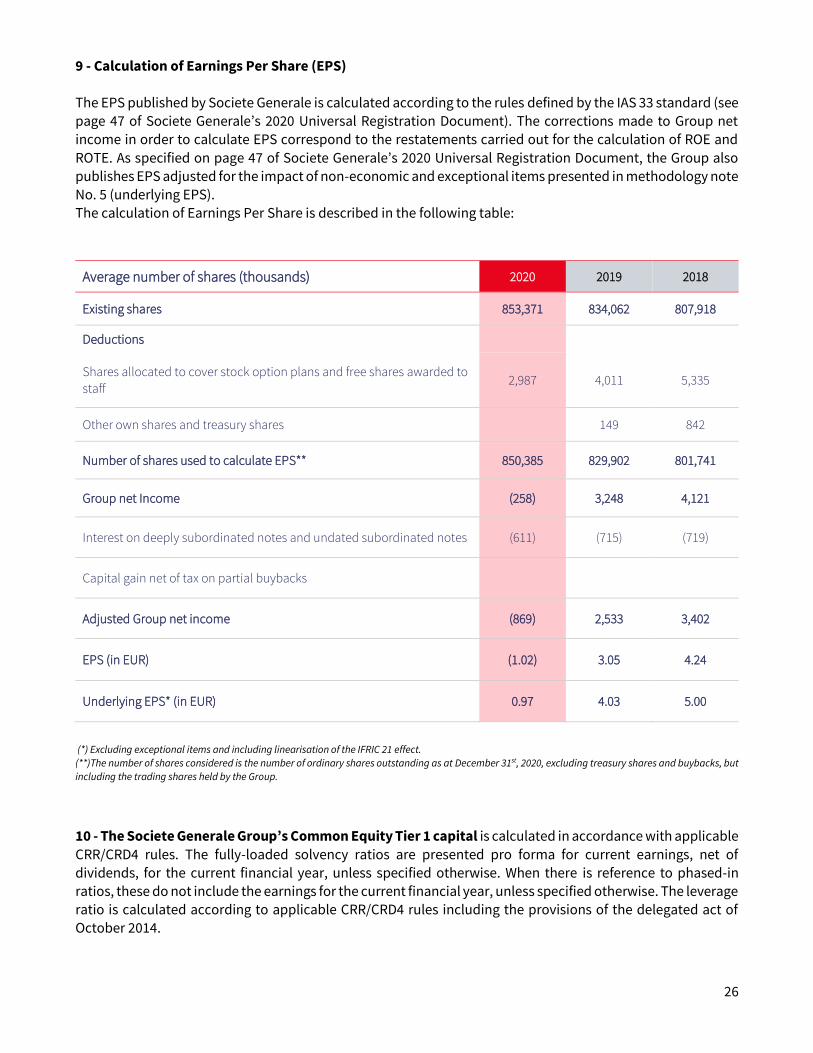
9 - Calculation of Earnings Per Share (EPS) The EPS published by Societe Generale is calculated according to the rules defined by the IAS 33 standard (see
page 47 of Societe Generale’s 2020 Universal Registration Document). The corrections made to Group net income in order to calculate EPS correspond to the restatements carried out for the calculation of ROE and
ROTE. As specified on page 47 of Societe Generale’s 2020 Universal Registration Document, the Group also
publishes EPS adjusted for the impact of non-economic and exceptional items presented in methodology note No. 5 (underlying EPS). The calculation of Earnings Per Share is described in the following table:
Average number of shares (thousands) 2020 2019 2018
Existing shares 853,371 834,062 807,918
Deductions
Shares allocated to cover stock option plans and free shares awarded to
staff 2,987 4,011 5,335
Other own shares and treasury shares 149 842
Number of shares used to calculate EPS** 850,385 829,902 801,741
Group net Income (258) 3,248 4,121
Interest on deeply subordinated notes and undated subordinated notes (611) (715) (719)
Capital gain net of tax on partial buybacks
Adjusted Group net income (869) 2,533 3,402
EPS (in EUR) (1.02) 3.05 4.24
Underlying EPS* (in EUR) 0.97 4.03 5.00
(*) Excluding exceptional items and including linearisation of the IFRIC 21 effect.
(**)The number of shares considered is the number of ordinary shares outstanding as at December 31st, 2020, excluding treasury shares and buybacks, but
including the trading shares held by the Group.
10 - The Societe Generale Group’s Common Equity Tier 1 capital is calculated in accordance with applicable
CRR/CRD4 rules. The fully-loaded solvency ratios are presented pro forma for current earnings, net of dividends, for the current financial year, unless specified otherwise. When there is reference to phased-in
ratios, these do not include the earnings for the current financial year, unless specified otherwise. The leverage ratio is calculated according to applicable CRR/CRD4 rules including the provisions of the delegated act of October 2014.
27
NB (1) The sum of values contained in the tables and analyses may differ slightly from the total reported due to rounding rules.
(2) All the information on the results for the period (notably: press release, downloadable data, presentation slides and supplement) is available on Societe Generale’s website www.societegenerale.com in the “Investor”
section.
Societe Generale
Societe Generale is one of the leading European financial services groups. Based on a diversified and integrated banking model, the
Group combines financial strength and proven expertise in innovation with a strategy of sustainable and responsible growth.
Committed to the positive transformations of the world’s societies and economies, Societe Generale and its teams seek to build, day
after day, together with its clients, a better and sustainable future through responsible and innovative financial solutions.
Active in the real economy for over 150 years, with a solid position in Europe and connected to the rest of the world, Societe Generale
has over 138,000 members of staff in 62 countries and supports on a daily basis 29 million individual clients, businesses and
institutional investors around the world by offering a wide range of advisory services and tailored financial solutions. The Group is built
on three complementary core businesses: ▪ French Retail Banking which encompasses the Societe Generale, Crédit du Nord and Boursorama brands. Each
offers a full range of financial services with omnichannel products at the cutting edge of digital innovation; ▪ International Retail Banking, Insurance and Financial Services to Corporates, with networks in Africa, Russia,
Central and Eastern Europe, and specialised businesses that are leaders in their markets; ▪ Global Banking and Investor Solutions, which offers recognised expertise, key international locations and integrated
solutions.
Societe Generale is included in the principal socially responsible investment indices: DJSI (World and Europe), FTSE4Good (Global and
Europe), Euronext Vigeo (World, Europe and Eurozone), four of the STOXX ESG Leaders indices, and the MSCI Low Carbon Leaders
Index.
For more information, you can follow us on Twitter @societegenerale or visit our website www.societegenerale.com