Embed Size (px)
Citation preview
1

Forward Looking StatementForward Looking Statement
This presentation includes forward-looking statements or statements about events or circumstances
which have not occurred. We have based these forward-looking statements largely on our current
expectations and projections about future events and financial trends affecting our business and our
future financial performance. These forward-looking statements are subject to risks, uncertainties and
assumptions, including, among other things: general economic, political and business conditions,
both in Brazil and in our market. The words “believes,” “may,” “will,” “estimates,” “continues,”
“anticipates,” “intends,” “expects” and similar words are intended to identify forward-looking
statements. We undertake no obligations to update publicly or revise any forward-looking statements
because of new information, future events or other factors. In light of these risks and uncertainties,
the forward-looking events and circumstances discussed in this presentation might not occur. Our
actual results could differ substantially from those anticipated in our forward-looking statements.
3
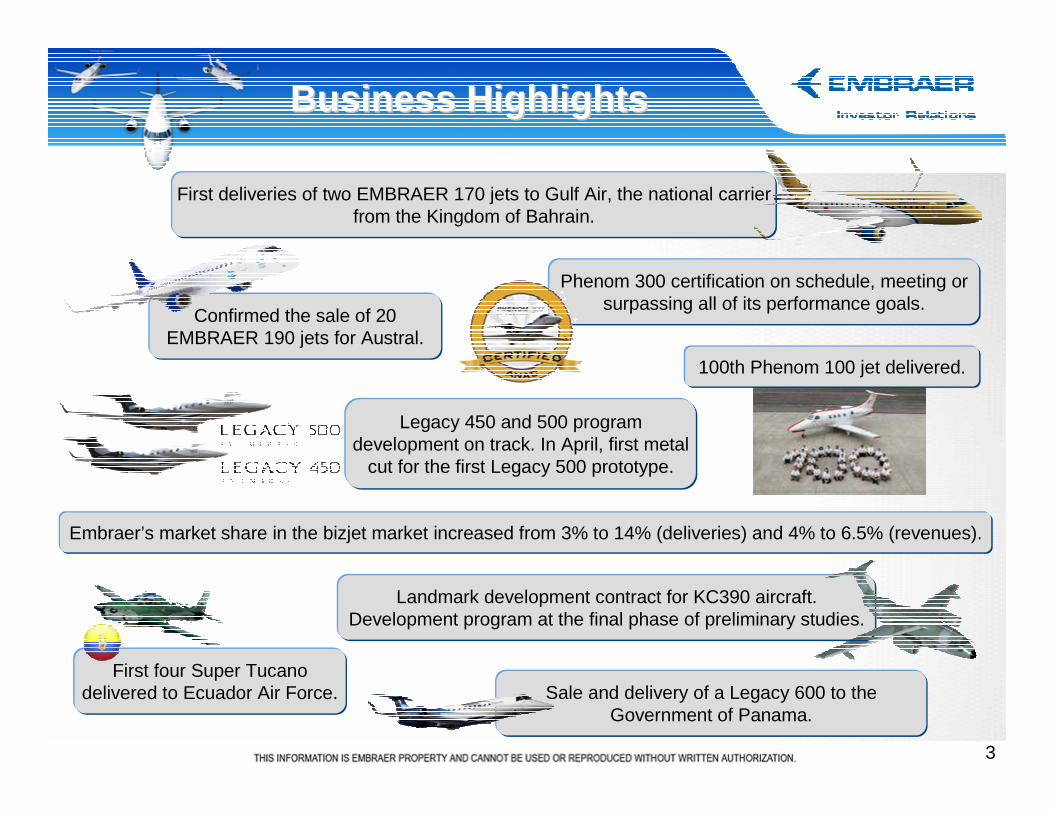
100th Phenom 100 jet delivered.
Business Highlights Business Highlights
Legacy 450 and 500 program development on track. In April, first metal
cut for the first Legacy 500 prototype.
Confirmed the sale of 20 EMBRAER 190 jets for Austral.
First deliveries of two EMBRAER 170 jets to Gulf Air, the national carrier from the Kingdom of Bahrain.
Sale and delivery of a Legacy 600 to the Government of Panama.
First four Super Tucano delivered to Ecuador Air Force.
Landmark development contract for KC390 aircraft. Development program at the final phase of preliminary studies.
Phenom 300 certification on schedule, meeting or surpassing all of its performance goals.
Embraer’s market share in the bizjet market increased from 3% to 14% (deliveries) and 4% to 6.5% (revenues).
4
Financial HighlightsFinancial Highlights
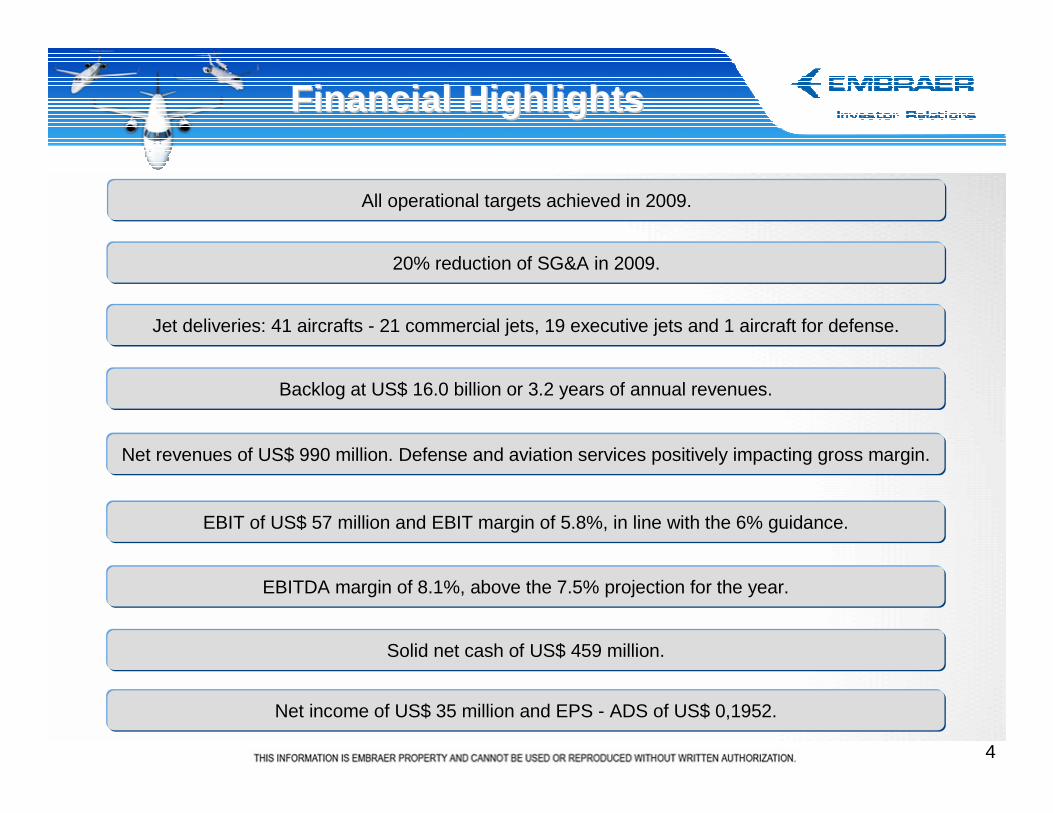
Jet deliveries: 41 aircrafts - 21 commercial jets, 19 executive jets and 1 aircraft for defense.
Net revenues of US$ 990 million. Defense and aviation services positively impacting gross margin.
EBIT of US$ 57 million and EBIT margin of 5.8%, in line with the 6% guidance.
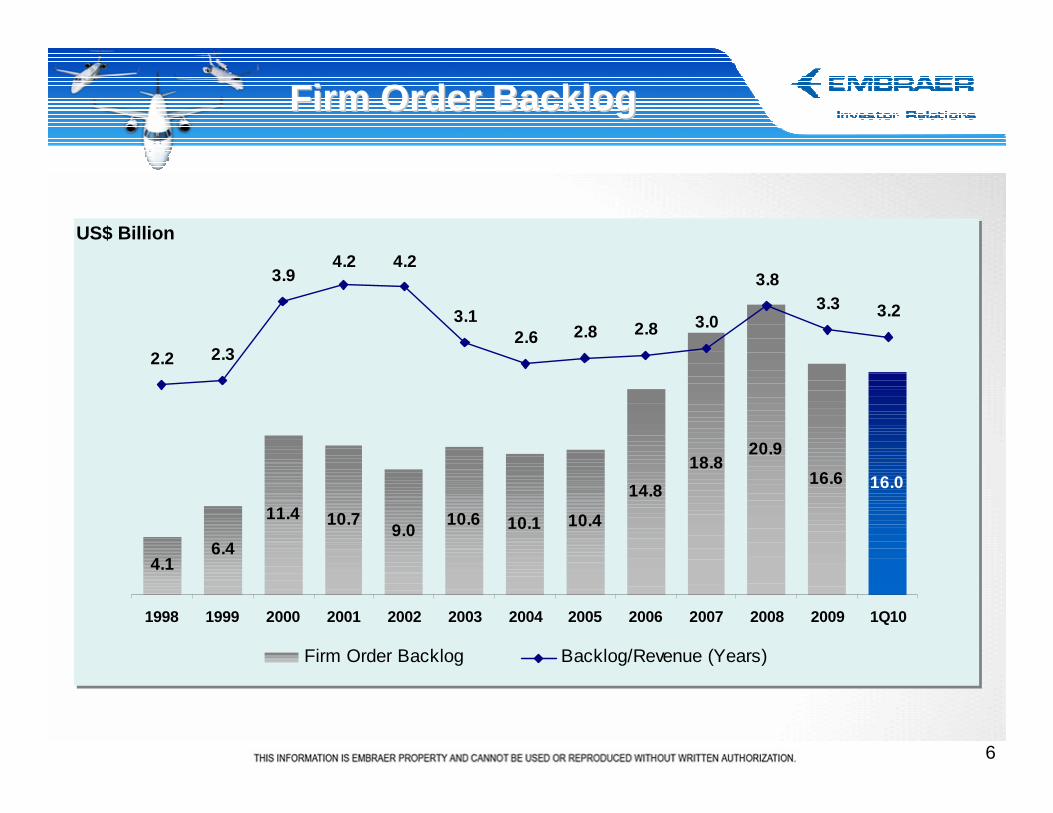
Backlog at US$ 16.0 billion or 3.2 years of annual revenues.
EBITDA margin of 8.1%, above the 7.5% projection for the year.
Solid net cash of US$ 459 million.
Net income of US$ 35 million and EPS - ADS of US$ 0,1952.
All operational targets achieved in 2009.
20% reduction of SG&A in 2009.
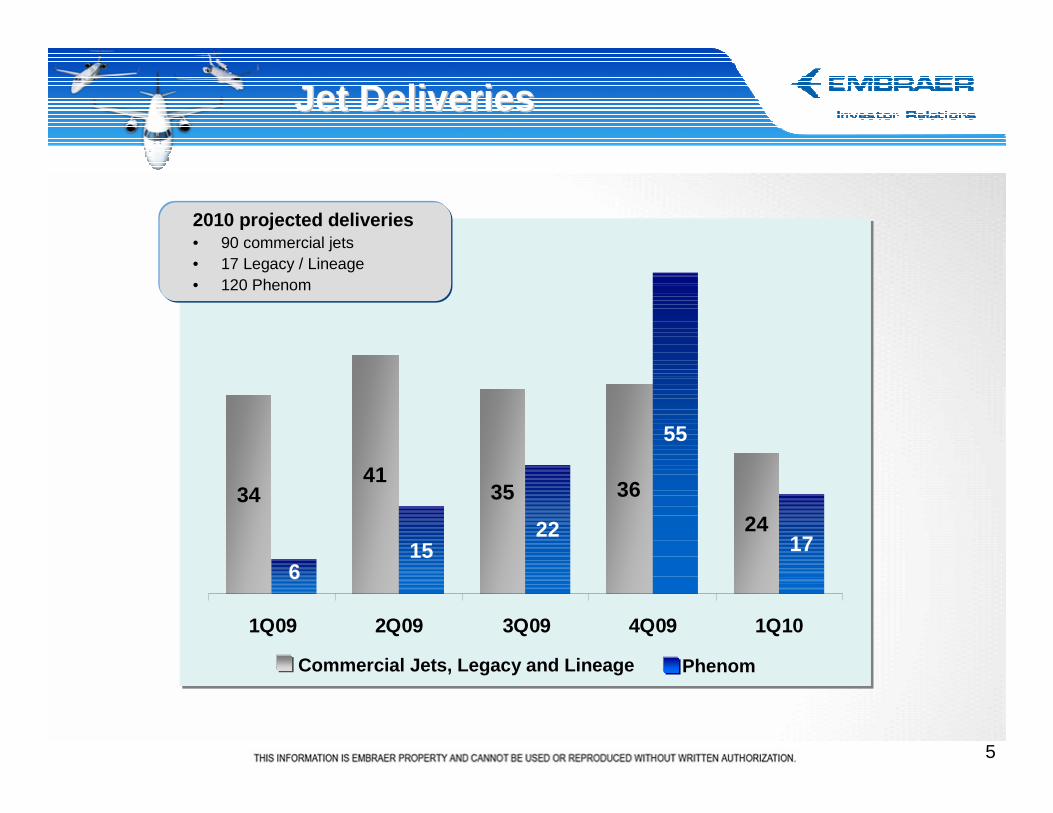
Jet DeliveriesJet Deliveries
2010 projected deliveries • 90 commercial jets• 17 Legacy / Lineage• 120 Phenom
5
3441
35 36
615
22
55
1724
1Q09 2Q09 3Q09 4Q09 1Q10
PhenomCommercial Jets, Legacy and Lineage
6
Firm Order BacklogFirm Order Backlog
US$ Billion
4.16.4
11.4 10.79.0
10.6 10.1 10.4
14.8
18.816.6 16.0
20.9
2.2 2.3
3.94.2 4.2
3.12.6 2.8 2.8 3.0
3.83.3 3.2
1998 1999 2000 2001 2002 2003 2004 2005 2006 2007 2008 2009 1Q10
Firm Order Backlog Backlog/Revenue (Years)
7
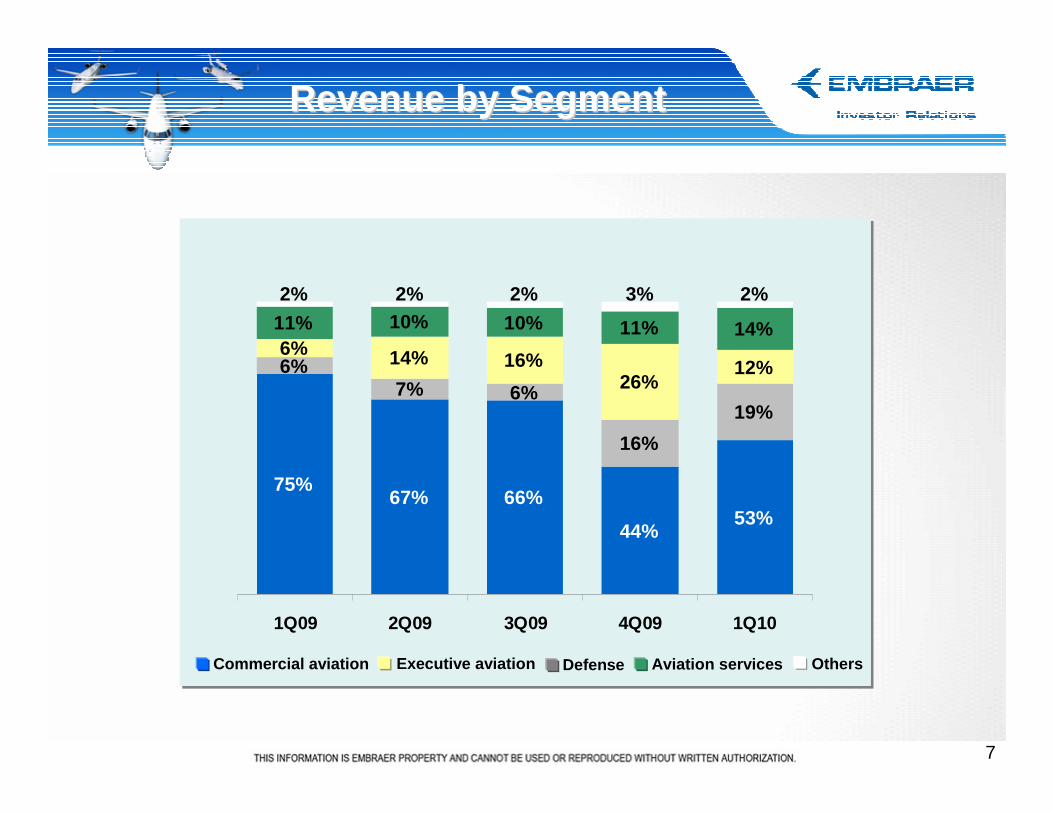
Revenue by SegmentRevenue by Segment
Commercial aviation Executive aviation OthersAviation servicesDefense
75%67% 66%
44%53%
6%7% 6%
16%
19%
6% 14% 16%26%
12%
11% 10% 10% 11% 14%
3% 2%2% 2%2%
1Q09 2Q09 3Q09 4Q09 1Q10
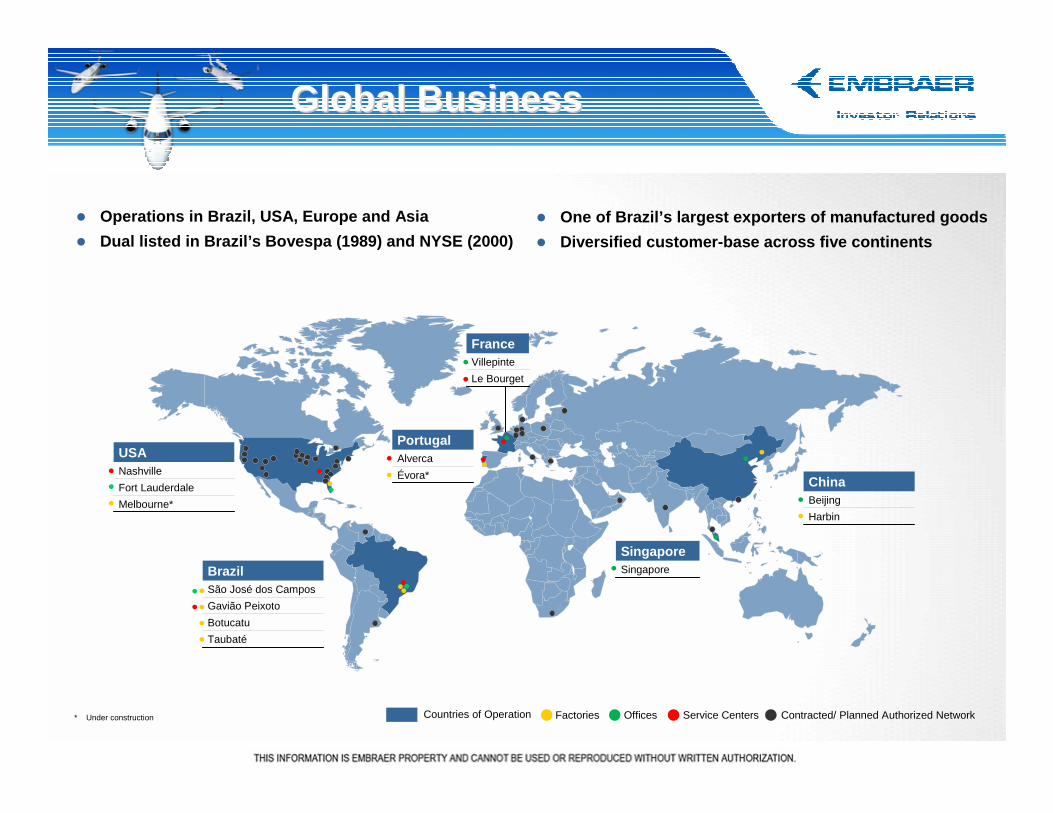
Global BusinessGlobal Business
� Operations in Brazil, USA, Europe and Asia
� Dual listed in Brazil’s Bovespa (1989) and NYSE (20 00)
Melbourne*
Fort Lauderdale
Nashville
USA
Taubaté
Botucatu
Gavião Peixoto
São José dos Campos
Brazil
Évora*
Alverca
Portugal
Le Bourget
Villepinte
France
Harbin
Beijing
China
Singapore
Singapore
Countries of Operation Factories Offices Service Centers Contracted/ Planned Authorized Network* Under construction
� One of Brazil’s largest exporters of manufactured g oods
� Diversified customer-base across five continents
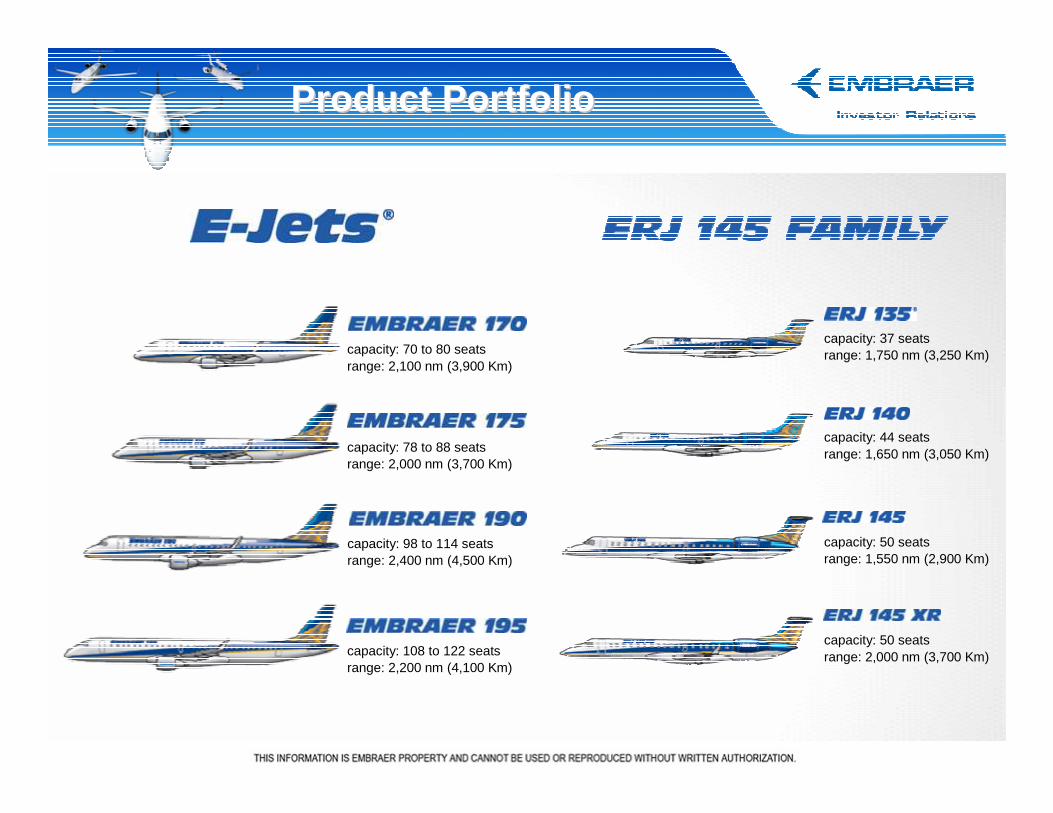
Product PortfolioProduct Portfolio
capacity: 70 to 80 seatsrange: 2,100 nm (3,900 Km)
capacity: 78 to 88 seatsrange: 2,000 nm (3,700 Km)
capacity: 98 to 114 seatsrange: 2,400 nm (4,500 Km)
capacity: 108 to 122 seatsrange: 2,200 nm (4,100 Km)
capacity: 37 seatsrange: 1,750 nm (3,250 Km)
capacity: 50 seatsrange: 1,550 nm (2,900 Km)
capacity: 50 seatsrange: 2,000 nm (3,700 Km)
capacity: 44 seatsrange: 1,650 nm (3,050 Km)
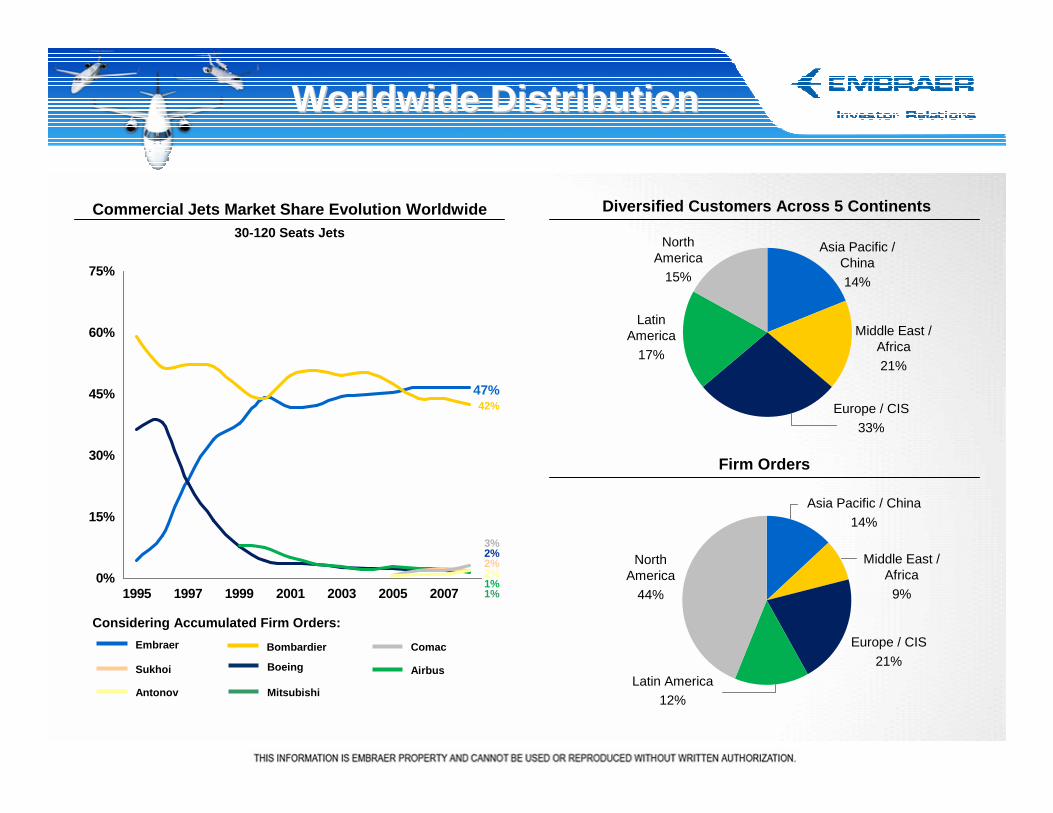
Worldwide DistributionWorldwide Distribution
Diversified Customers Across 5 Continents
Asia Pacific /China
14%
Middle East /Africa
21%
Europe / CIS
33%
LatinAmerica
17%
NorthAmerica
15%
Firm Orders
Asia Pacific / China
14%
Middle East / Africa
9%
Europe / CIS
21%
NorthAmerica
44%
Latin America12%
Embraer Bombardier
Sukhoi Boeing Airbus
Antonov
Comac
Mitsubishi
Commercial Jets Market Share Evolution Worldwide
0%
15%
30%
45%
60%
75%
1995 1997 1999 2001 2003 2005 2007
Considering Accumulated Firm Orders:
30-120 Seats Jets
47%42%
3%2%2%2%1%1%
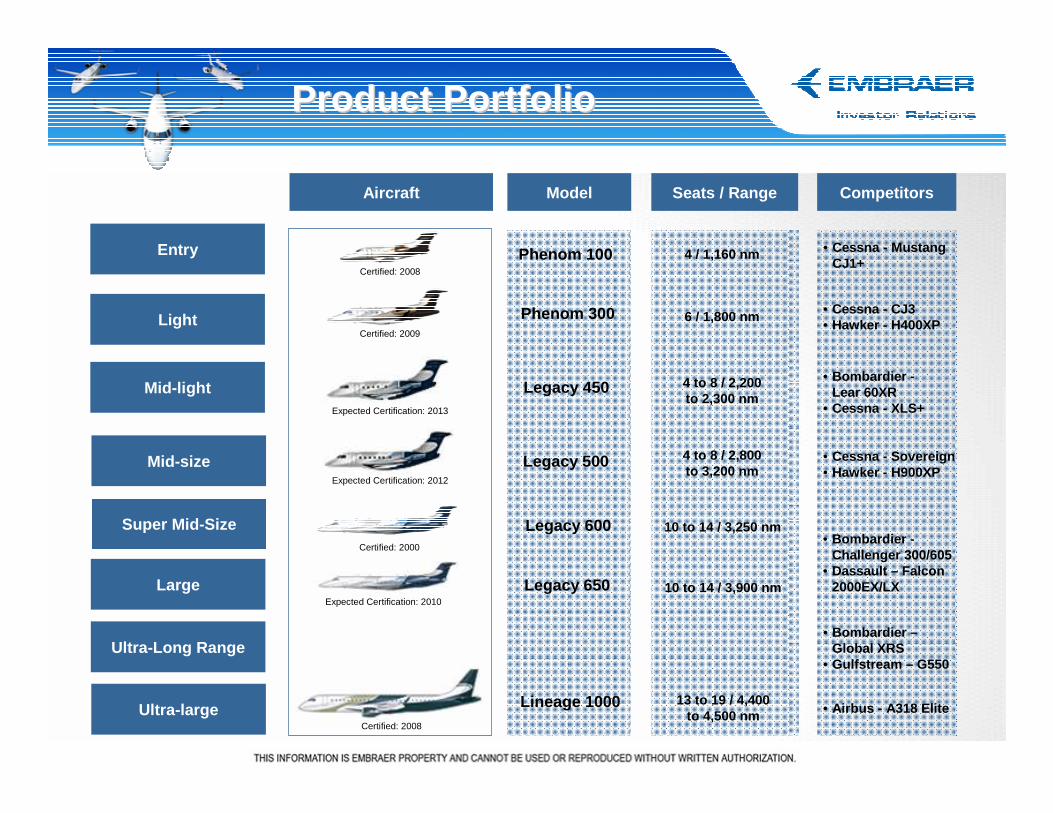
Product PortfolioProduct Portfolio
Large
Aircraft Model
Phenom 100
Phenom 300
Legacy 450
Legacy 500
Legacy 600
Lineage 1000
Seats / Range
4 / 1,160 nm
6 / 1,800 nm
4 to 8 / 2,200 to 2,300 nm
4 to 8 / 2,800 to 3,200 nm
10 to 14 / 3,250 nm
13 to 19 / 4,400 to 4,500 nm
Entry
Light
Mid-light
Mid-size
Ultra-large
Super Mid-Size
Certified: 2008
Certified: 2009
Expected Certification: 2013
Certified: 2000
Certified: 2008
Expected Certification: 2012
Ultra-Long Range
Competitors
• Cessna - MustangCJ1+
• Cessna - CJ3• Hawker - H400XP
• Bombardier -Lear 60XR
• Cessna - XLS+
• Cessna - Sovereign• Hawker - H900XP
• Bombardier -Challenger 300/605
• Dassault – Falcon2000EX/LX
• Airbus - A318 Elite
Legacy 650 10 to 14 / 3,900 nmExpected Certification: 2010
• Bombardier –Global XRS
• Gulfstream – G550
2009 Performance 2009 Performance Market ShareMarket Share
22% 25% 24% 22% 21% 20%
31%33% 35% 37% 40%
33%
11% 7% 7% 7% 6%
9%
13% 12% 13% 13% 14%
11%
2,2% 2,7% 3,1% 3,5% 3,3%14,0%
20% 19% 16% 16% 14% 11%
2%2%3%2%1% 1%
2004 2005 2006 2007 2008 2009%
OEM
Sh
are
– T
ota
l u
nit
s
Deliveries share (units)
1,040885749 1,154582 870
27% 29% 29% 28% 28% 28%
15%18% 18% 19% 19%
13%
17% 11% 11% 12% 12%18%
26% 23% 22% 23% 24% 21%
2,7%3,4% 3,8% 4,6% 4,1% 6,4%
10%10% 8% 8% 8%
6%8%
6%8% 5%5%2%
2004 2005 2006 2007 2008 2009
% O
EM
Sh
are
– T
ota
l R
eve
nu
es
US$
$13.2bi$10.2bi $17.2 bi$16.6bi $19.3bi $22.2bi
Revenue share (US$ - based on B&CA list prices)
Others
Hawker-Beech
Embraer
Gulfstream
Dassault
Cessna
Bombardier
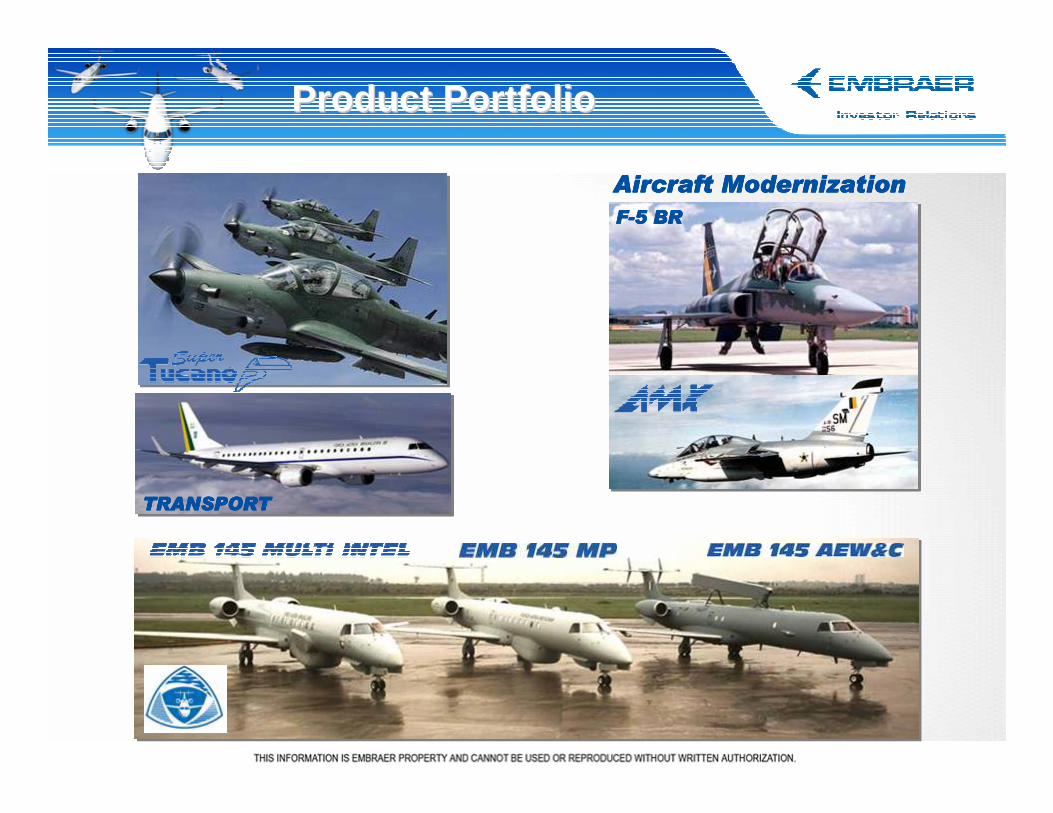
TRANSPORTTRANSPORTTRANSPORTTRANSPORT
Product PortfolioProduct Portfolio
FFFF----5 BR5 BR5 BR5 BR
Aircraft ModernizationAircraft ModernizationAircraft ModernizationAircraft Modernization
• Currently in “Preliminary Design Phase”
• Market Forecast 2025: 700 aircraft / US$ 50+ bi
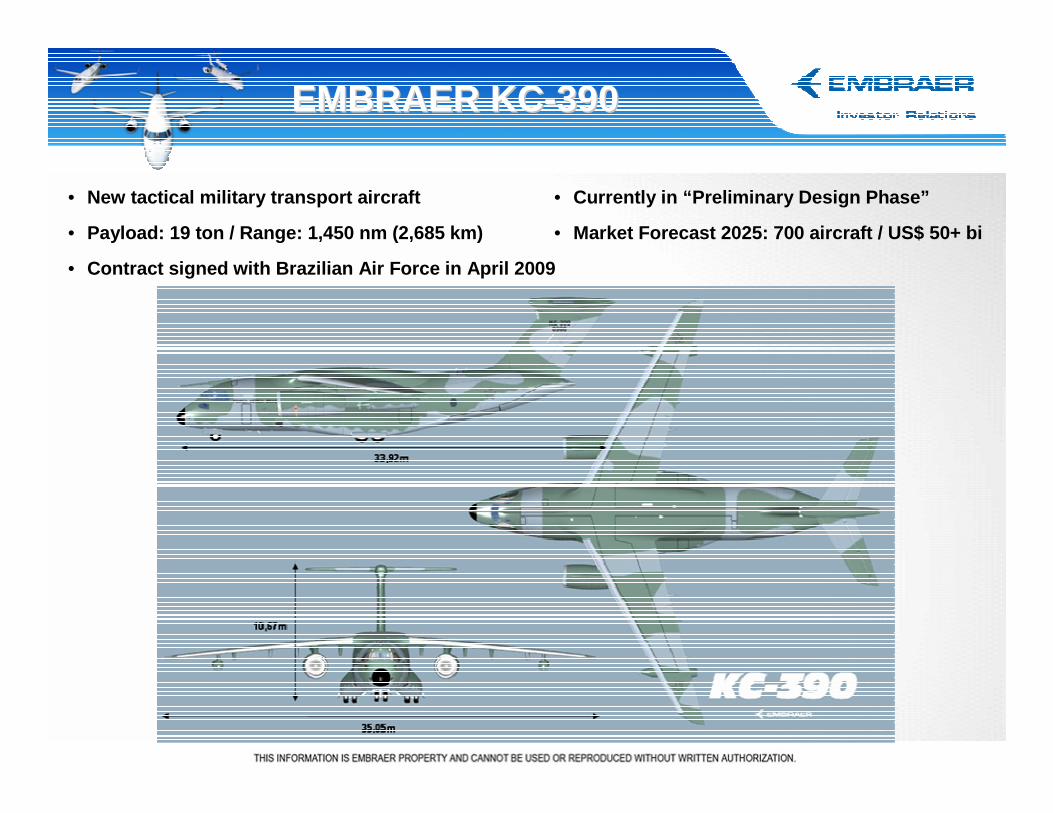
EMBRAER KCEMBRAER KC --390390
• New tactical military transport aircraft
• Payload: 19 ton / Range: 1,450 nm (2,685 km)
• Contract signed with Brazilian Air Force in April 2 009
15
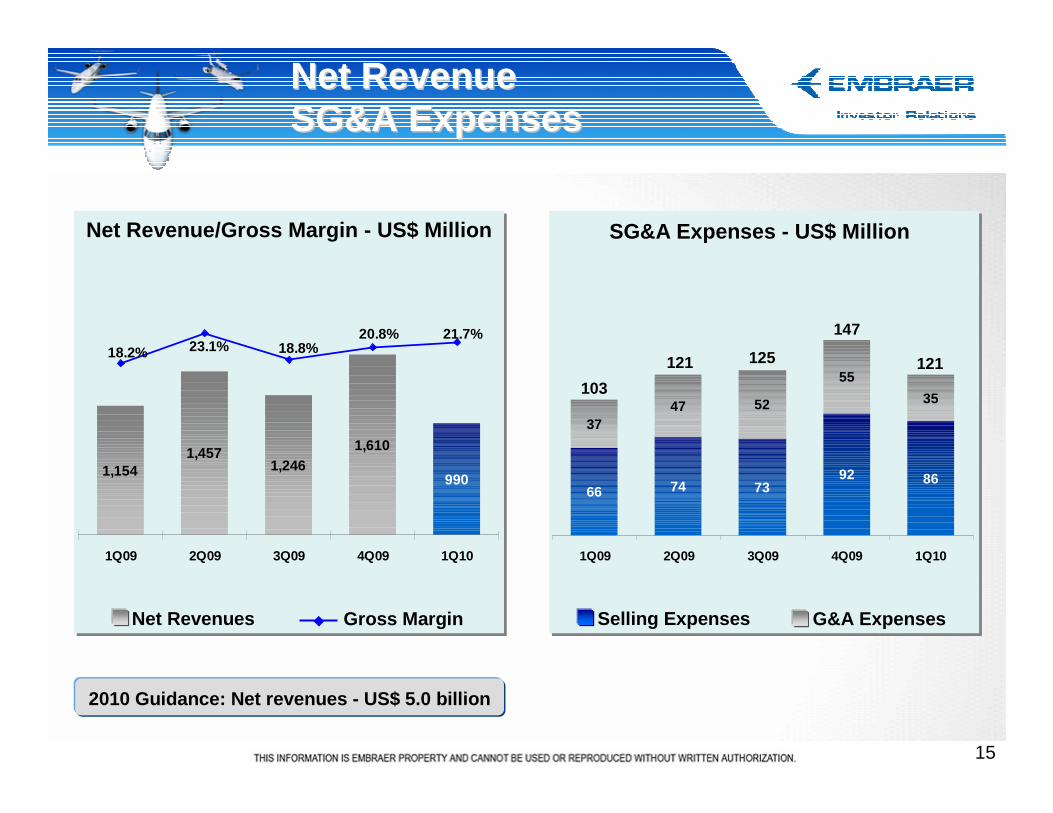
Net Revenue Net Revenue SG&A ExpensesSG&A Expenses
Net Revenue/Gross Margin - US$ Million
Net Revenues Gross Margin
SG&A Expenses - US$ Million
Selling Expenses G&A Expenses
1,1541,457
1,2461,610
990
18.2% 23.1% 18.8%20.8% 21.7%
1Q09 2Q09 3Q09 4Q09 1Q10
2010 Guidance: Net revenues - US$ 5.0 billion
121
66 74 7392
3747 52
55
35
86
1Q09 2Q09 3Q09 4Q09 1Q10
103
121 125
147
16
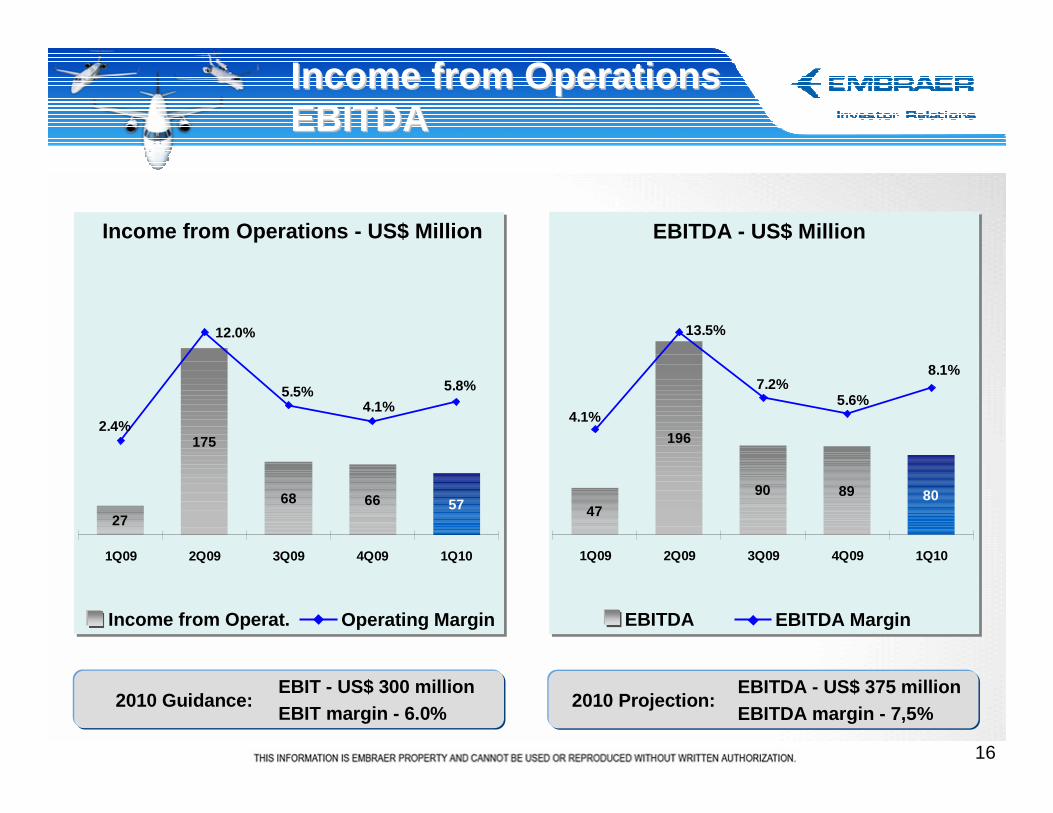
Income from OperationsIncome from OperationsEBITDAEBITDA
Income from Operations - US$ Million
Income from Operat. Operating Margin
EBITDA - US$ Million
EBITDA EBITDA Margin
2010 Guidance:EBIT - US$ 300 millionEBIT margin - 6.0%
27
175
68 66 57
5.8%
4.1%5.5%
12.0%
2.4%
1Q09 2Q09 3Q09 4Q09 1Q10
2010 Projection:EBITDA - US$ 375 million EBITDA margin - 7,5%
47
196
90 89 80
13.5%
7.2%5.6%
8.1%
4.1%
1Q09 2Q09 3Q09 4Q09 1Q10
17
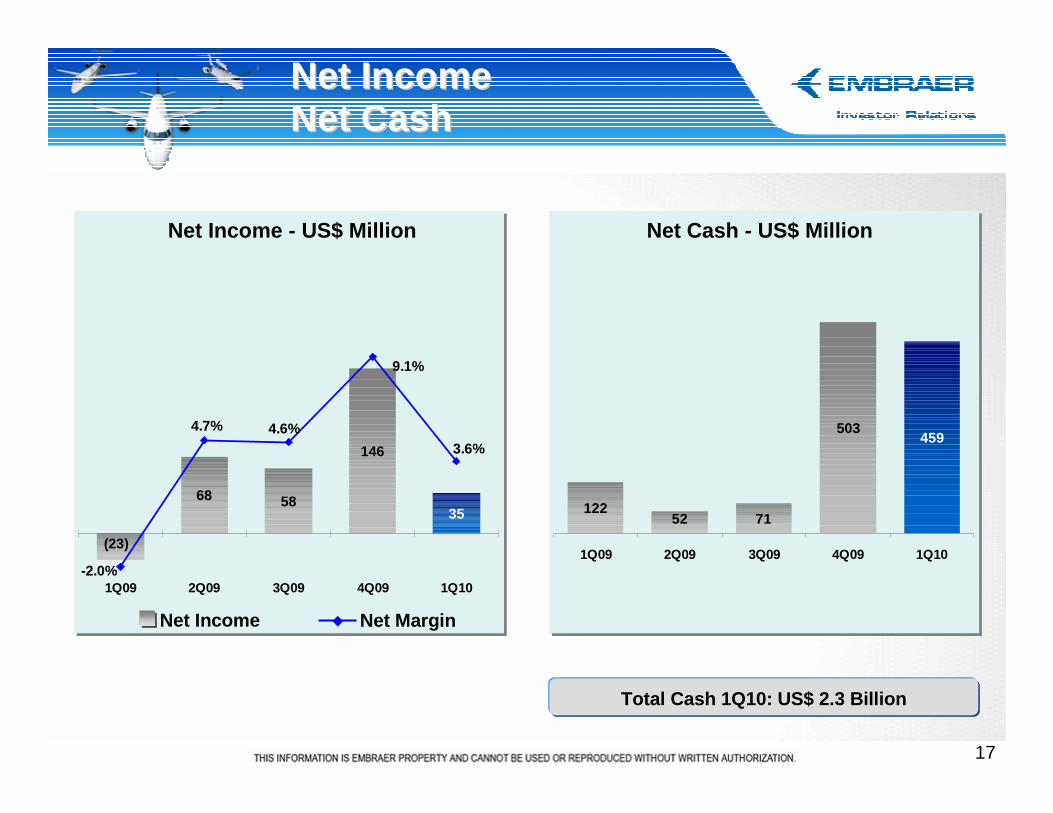
Net IncomeNet IncomeNet CashNet Cash
Net Cash - US$ Million
12252 71
503459
1Q09 2Q09 3Q09 4Q09 1Q10
Net Income - US$ Million
Net Income Net Margin
35
146
5868
(23)
3.6%
9.1%
4.6%4.7%
-2.0%1Q09 2Q09 3Q09 4Q09 1Q10
Total Cash 1Q10: US$ 2.3 Billion

18