Embed Size (px)
Citation preview

energies
Article
Critical Analysis of Process Integration Options forJoule-Cycle and Conventional Heat Pumps
Limei Gai 1,*, Petar Sabev Varbanov 1 , Timothy Gordon Walmsley 2 and Jirí Jaromír Klemeš 1
1 Sustainable Process Integration Laboratory-SPIL, NETME Centre, Faculty of Mechanical Engineering, BrnoUniversity of Technology-VUT Brno, Technická 2896/2, 61600 Brno, Czech Republic;[email protected] (P.S.V.); [email protected] (J.J.K.)
2 Sustainable Energy and Water Systems Group, School of Engineering, The University of Waikato,Hamilton 3216, New Zealand; [email protected]
* Correspondence: [email protected]
Received: 27 December 2019; Accepted: 26 January 2020; Published: 3 February 2020�����������������
Abstract: To date, research on heat pumps (HP) has mainly focused on vapour compression heatpumps (VCHP), transcritical heat pumps (TCHP), absorption heat pumps, and their heat integrationwith processes. Few studies have considered the Joule cycle heat pump (JCHP), which raises severalquestions. What are the characteristics and specifics of these different heat pumps? How are theydifferent when they integrate with the processes? For different processes, which heat pump is moreappropriate? To address these questions, the performance and integration of different types of heatpumps with various processes have been studied through Pinch Methodology. The results showthat different heat pumps have their own optimal application range. The new JCHP is suitable forprocesses in which the temperature changes of source and sink are both massive. The VCHP ismore suitable for the source and sink temperatures, which are near-constant. The TCHP is moresuitable for sources with small temperature changes and sinks with large temperature changes. Thisstudy develops an approach that provides guidance for the selection of heat pumps by applyingProcess Integration to various combinations of heat pump types and processes. It is shown that thecorrect choice of heat pump type for each application is of utmost importance, as the Coefficient ofPerformance can be improved by up to an order of magnitude. By recovering and upgrading processwaste heat, heat pumps can save 15–78% of the hot utility depending on the specific process.
Keywords: Process Integration; heat pumps; Joule cycle heat pump; Pinch Analysis
1. Introduction
1.1. Background
In the 21st century, energy crises, global warming and environmental pollution are becoming moreand more serious. It is urgent to improve energy efficiency, save energy and reduce emissions. One ofthe critical issues is to valorise low potential waste heat instead of rejecting it. Appropriate integrationof heat pumps has the characteristics of efficient recovery of low-temperature heat energy, hot utilityenergy-saving and potentially environmental protection. Heat pumps (HP) continue to receiveconsiderable attention and development and are becoming a critical sustainable energy technology.
Sadi Carnot [1], a French scientist in the early 19th century, first proposed the “Carnot Cycle”theory in his paper in 1824, which became the origin of HP technology. In 1912, the world’s firstset of HP equipment was successfully installed in Zurich, Switzerland with river water as the lowheat source for heating. HPs entered the early stage of development from the 1940s to the early1950s. HPs used in household, and industrial buildings began to enter the market. Since the 1970s,
Energies 2020, 13, 635; doi:10.3390/en13030635 www.mdpi.com/journal/energies

Energies 2020, 13, 635 2 of 25
the HP industry has advanced rapidly, and all countries have attached great importance to HPresearch. Large HP development plans have been instituted by countries and organisations such as theEuropean Community and the International Energy Agency. At present, Europe, America and Japanare competing to develop new types of HPs.
1.2. State of the Art Review
Traditional HP technologies include the vapour compression heat pump (VCHP) [2], absorptionheat pump [3], and transcritical heat pump [4]. Pavlas et al. [5] developed a Process Integrationmethodology for an HP integrated with a biomass gasification process of a wood processing plant. Liewand Walmsley [6] adopted a Total Site targeting method to integrate open cycle VCHP for enhancingoverall site energy efficiency. Walmsley [7] presented a Total Site Heat Integration (TSHI) method forintegrated evaporation systems using a HP (vapour recompression) effectively with application tomilk concentrating. Walmsley et al. [8] performed a Pinch Analysis of hybrid compression–absorptionHP process for convective dryers by employing to simulation and optimisation tools. Stampfli et al. [9]adapted Pinch Analysis to integrating VCHP for HPs in batch processes. A hybrid method [10]that unifies the insight-based and mathematical programming approaches has been proposed forindustrial HP integration in batch processes to avoid long computation times. Another criterion EPC(i.e., the coefficient of performance in exergy per total annual cost) was proposed [11] for selectingHPs, modelling diverse types of HPs for operating conditions. This criterion can both evaluate thethermodynamic and economic performances of HPs.
Urbanucci et al. [12] proposed a two-level optimisation algorithm for the high-temperatureHP integration in a trigeneration system. The proposed model allowed them to analyse the HPperformance for various working fluids and operating conditions. Schlosser et al. [13] developed amodel for evaluation of the efficiency gains of combining HP storage and intelligent system control forintegrating multiple heat sources and sinks, reporting a significant reduction in energy demand. Tointegrate heat-upgrading technologies in process sites, Oluleye et al. [14] developed a systems-orientedcriterion for conceptual screening and selection of HPs. A Mixed Integer Linear Programming (MILP)framework has been developed [15]. The screening criterion measured the exergy degradation oftechnology options. However, the techniques presented in that work are only applicable to conceptualsystem design. Goumba et al. [16] considered the different waste heat sources and proposed the“Recov’Heat” tool, for minimising the utility demands, which makes the heat pumping task easier.
The above studies only use known models to consider the integration of VCHP and processes.Some of the older HP types used Freon as a working fluid. However, Freon is no longer used becauseof its negative impact on the Earth’s atmospheric ozone [17]. In addition to the improvement theCoefficient of Performance (COP) of HPs and effective utilisation of the energy input, to furtherimprove the environmental protection, engineers are committed to the development of new workingfluids and HP technologies. HP applications are also in continuous development, is widely used inair conditioning and industrial fields and playing a significant role in terms of energy-saving andenvironmental protection.
Another type of HP with a commercial application is the TCHP, which uses CO2 as a working fluid.CO2 is a natural refrigerant, commonly known under the label “R744”. It has a relatively low globalwarming potential (GWP) value of only 1 and does not cause damage to the ozone layer. It is non-toxic,non-flammable, low-cost and easy to obtain. At present, hot water systems with CO2 HPs usuallyadopt a transcritical cycle. In the early 1990s, Lorentzen [4] proposed a transcritical CO2 cycle based onthe specific physical properties of CO2, which significantly promoted the development of CO2 systemsin the field of refrigeration. Over the past twenty years, research institutions and enterprises in manycountries around the world have done a lot of research on TCHP, which has become a research hotspotin the field of refrigeration. The exothermic process of significant temperature change (~80–100 ◦C) onthe high-pressure side of the transcritical CO2 system is very suitable for hot water heating. As a result,research on transcritical CO2 HPs (TCHP) started as a hot water heater. Nekså et al. [18] built a test

Energies 2020, 13, 635 3 of 25
device for a hot water HP system. The first demonstration TCHP water heater [19] was establishedfor industrial use. Kim et al. [20] used a combined scroll expander–compressor unit in a two-stagecompression CO2 transcritical cycle to improve the cycle COP. Van de Bor et al. [21] compared severalheat recovery technologies based on HPs and heat engines. Integration schemes with processes arenot considered.
In VCHP and TCHP, the working fluid undergoes a phase change in at least one of the constituentprocesses, during which it absorbs or releases heat from the heat source to the heat exchanger (HX). Thisdependence on latent heat transfer may be a problem in some applications where average temperaturevariation is significant, exergy transfer efficiency is low, and COP is low. Fu and Gundersen [22]developed a HP for industrial applications based on the Joule cycle (which they called a reversedBrayton cycle). The operating parameters are investigated by thermodynamic and mathematicalmodels, applying Pinch Analysis and Appropriate Placement rules. The provided case studies alsoillustrate the Hest Exchanger Network (HEN) synthesis conforming to the Heat Integration targets.
ECOP (Ecop Technologies GmbH) [23] applied a HP process based on a reverse Joule cycle (alsoknown as Joule–Brayton or Brayton cycle) with the rotation HP implementation. Compared withthe traditional HP, the Joule cycle heat pump (JCHP) features sensible heat exchange between theworking fluid and process heat source/sink, which is an advantage when the process streams do notcondense or evaporate or have smaller Specific Heat Capacity (CP). This provides more flexibility inaccommodating process streams and achieving a higher temperature lift.
A recent work [24] has presented a system synthesis method for HP integration in the industry.The method uses a superstructure-based mathematical model, resulting in a Mixed Integer NonlinearProgramming (MINLP) formulation, achieving performance improvements over similar previousmethods of up to 30%. The model considers phase-change based HPs (mainly VCHP). As is shown inthis paper, the correct choice of HP type bears the significance of an order of magnitude higher thansuch improvements.
Many processes need heat transfer in industrial processing and power generation. Some needheating, and some need cooling or condensation. If the heat exchange network can be appropriatelydesigned, the utility can be minimised, and the capital investment can be reduced to achieve energysaving. Pinch Analysis, pioneered by Linnhoff and Hindmarsh [25], has become a widely usedmethod for the comprehensive design of heat exchange networks. The heat exchange network withminimum energy consumption can be obtained by optimising the heat recovery system, energysupply and process operation. Energy targeting is a powerful aid to process design and integration.Stampfli et al. [9] suggested the COP equation/curve for Process Integration with VCHP. According tothe COP equation, when the condensation duty provided by the process sink is known, the evaporativeduty of the HP can be obtained, and the COP curve can be drawn in Grand Composite Curve (GCC).The condensation duty can also be obtained when the process is used as a source. Gai et al. [26]extended the COP curve when the process was integrated with the JCHP. However, the COP curve forthe Process Integration with a HP is derived under some assumptions or ideal conditions. Also, in theTCHP, the working fluid CO2 is a transcritical cycle and the physical property changes substantially, soit is difficult to express the COP curve with an equation accurately.
1.3. Contributions and Novelty of This Study
A JCHP is more likely to obtain higher COP than a traditional HP under certain circumstances.However, there have been so far just a few studies on the use of JCHP and industrial processes. Thereis also a gap in the literature for a comparative analysis of different HP types, including the emergingJCHP. The COP equations of HP have some ideal assumptions. These results are in some deviationfrom the actual performance of the HP, which cannot well represent the real performance of the HP.
This study simulates and optimises the operation of the main classes of HPs in a process simulationsoftware—Petro-SIM [27]—to get the performance of the HP, as much close to the reality as possible.These classes include the VCHP, TCHP and the JCHP.

Energies 2020, 13, 635 4 of 25
The setting of various parameters considers possible process configurations. All COP curves andheat duties in the GCC for process and HP integration will be plotted against the actual data calculatedin Petro-SIM. The choice of HP type should be performed based on the temperature–enthalpy profileof the considered industrial process for obtaining optimal performance. In this paper, the performanceand application scope of three different HP systems—JCHP, VCHP, and TCHP—are discussed andcompared to understand the energy-saving potential of applying the HP.
Section 2 introduces the simulation and optimisation of the considered HP types and the methodof integration with the process for achieving heat recover. In Section 3, the suitability of the HP typesto different temperature–enthalpy (T–H) profiles is evaluated, aiming at the minimisation of powerconsumption. The optimal COP of each integration case was obtained by optimising the operatingparameters of the HP when given source and sink at different temperatures. In Section 4, the model isfurther applied to the integration of HP and different industrial process cases using Pinch Analysis,and the energy-saving potential of different types of HP is evaluated using the GCC [28].
2. Method
The main goal of heat pumping is to serve, simultaneously, part (or all) of the process heatingand cooling demands, via heat upgrading from lower to higher temperatures. In Process Integrationterms [28], this means taking heat from below the Pinch and returning it to the process above the Pinch.The current method has to assist engineers in the selection of the best HP type for a given processconfiguration. COP is the criterion indicating the quality of the solution because higher COP meansserving the process at the expense of lower external energy input. The method follows the algorithmshown in Figure 1.
Energies 2019, 12, x FOR PEER REVIEW 4 of 25
calculated in Petro-SIM. The choice of HP type should be performed based on the temperature–enthalpy profile of the considered industrial process for obtaining optimal performance. In this paper, the performance and application scope of three different HP systems— JCHP, VCHP, and TCHP—are discussed and compared to understand the energy-saving potential of applying the HP.
Section 2 introduces the simulation and optimisation of the considered HP types and the method of integration with the process for achieving heat recover. In Section 3, the suitability of the HP types to different temperature–enthalpy (T–H) profiles is evaluated, aiming at the minimisation of power consumption. The optimal COP of each integration case was obtained by optimising the operating parameters of the HP when given source and sink at different temperatures. In Section 4, the model is further applied to the integration of HP and different industrial process cases using Pinch Analysis, and the energy-saving potential of different types of HP is evaluated using the GCC [28].
2. Method
The main goal of heat pumping is to serve, simultaneously, part (or all) of the process heating and cooling demands, via heat upgrading from lower to higher temperatures. In Process Integration terms [28], this means taking heat from below the Pinch and returning it to the process above the Pinch. The current method has to assist engineers in the selection of the best HP type for a given process configuration. COP is the criterion indicating the quality of the solution because higher COP means serving the process at the expense of lower external energy input. The method follows the algorithm shown in Figure 1.
Figure 1. The method procedure.
2.1. Step 1: Process Integration with Pinch Analysis
Pinch Methodology [29] is a method to calculate thermodynamically feasible energy targets based on thermodynamic principles and analysis. The GCC [25] illustrates the difference between the heat available from hot streams and the heat required by cold streams at every temperature level, identifying the residual heating and cooling demands of the process, to be covered by external utilities. A key property of these targets is that both loads and temperatures of the utility targets are identified. In this study, the process is firstly analysed by Pinch Analysis. The target duties of cold
1. Process Integration with Pinch Analysis following the GCC, determine the duties of cold and hot utilities required by the process, and the inlet and outlet temperatures of the source and sink.
2. Build and simulate various heat pumps in Petro-SIM. The heat pumps are simulated according to the data of Step 1.
3. Optimise the heat pumps. By establishing the optimisation objective function of the heat pump, setting the range of independent variables and adding constraints based on Step 2.
4. Use Pinch Analysis to integrate the heat pump with the process. The GCC of heat pump and process integration is obtained according to the optimisation results of Step 3.
5. A series of different Processes Integration with heat pumps through repeated Steps 1-4.
6. Discuss and analyse the results. Select suitable heat pumps for different processes.
Figure 1. The method procedure.
2.1. Step 1: Process Integration with Pinch Analysis
Pinch Methodology [29] is a method to calculate thermodynamically feasible energy targets basedon thermodynamic principles and analysis. The GCC [25] illustrates the difference between the heatavailable from hot streams and the heat required by cold streams at every temperature level, identifying

Energies 2020, 13, 635 5 of 25
the residual heating and cooling demands of the process, to be covered by external utilities. A keyproperty of these targets is that both loads and temperatures of the utility targets are identified. Inthis study, the process is firstly analysed by Pinch Analysis. The target duties of cold and hot utilitiesrequired by the process are determined, and the inlet and outlet temperatures of the heat source andheat sink for heat pumping are selected, using the GCC.
2.2. Step 2: Build and Simulate Different Heat Pumps
The HPs are simulated according to the data of the heat source and heat sink of Step 1. It takesthe temperatures and the required heating or cooling duty of the process. In this work, JCHP, VCHP,and TCHP have been simulated by Petro-SIM [27], as shown in Figure 2. The use of Petro-SIM issimilar to Aspen Hysys, as both are fork projects of the Hyprotech Hysys versions in the past. Themain advantage of using Petro-SIM is that KBC has added dedicated modelling components forenergy-related process units, such as boilers, turbines, compressors and HPs.
Fluid packages are based on the Peng-Robinson model [30] in combination with the Lee–KeslerEquation of State as a standard package in Petro-SIM.
Referring to the cases in Figure 2 the similarities between the three different HP cycles areas follows.
• The working fluid enters the Compressor to increase the pressure and temperature.• The working fluid then heats the Process Heat Sink (the sink) in a heat exchanger (HX unit named
“Hot-side-HX”) and is cooled down.• Then the pressure and temperature of the working fluid are reduced through the Expander or
let-down valve (VLV).• At the next step, the working fluid absorbs heat from the Process Heat Source (the source) in a
Cold-side-HX or Evaporator unit.• The working fluid finally returns to the Compressor to complete the cycle.
A critical difference is that the working fluid of a JCHP always maintains the working fluid in agaseous state. After being cooled by the Sink, the working fluid, generates work through the Expanderin the JCHP, as shown in Figure 2a, instead of using a let-down valve as in the other two cycles. Ina VCHP, the working fluid has a phase change in both heat exchangers. In the Hot-side-HX, it iscondensed from a gas to a liquid phase. In the Cold-side-HX, it is heated from the liquid phase to thegas phase, as shown in Figure 2b. In a TCHP, an intermediate heat exchanger is often added, and theworking fluid follows a transcritical cycle, as shown in Figure 2c.
To make the simulated HP reflecting the performance of the real HP very closely, it is necessaryto specify reasonable values of the device parameters in the simulation case, matching as close aspossible the HP cycle and its measured indicators—mainly temperatures, pressures of the workingfluid, the minimum approach temperature (∆Tmin) of the heat exchangers and the isentropic efficiencyof the compressor and expander. ECOP [23] has developed a special rotation HP with embeddedcompressor/expander that achieves high entropy efficiency for a JCHP. In this study, the JCHPmodel adopts the performance characteristics of that specific compressor/expander [23]. A commonturbocompressor unit is used as the compressor of VCHP and TCHP, which is the most used typefor industrial-scale HPs [31]. A formula for the relationship between the isentropic efficiency andcompression ratio of compressors was proposed by Wang et al. [32]. It is assumed that the recoverablewaste heat duty of process streams is known to recover waste heat of process in this study. This can beachieved by a “Adjust” unit (ADJ; Figure 2) to regulate the flow of the working fluid or source to fixthe heat duty of the Cold-side-HX when the process stream as the source for a HP. When the processstream as the sink of a HP, this can be achieved by adjusting the flow of the working fluid or sink to fixthe heat duty of the Hot-side-HX.

Energies 2020, 13, 635 6 of 25
Energies 2019, 12, x FOR PEER REVIEW 6 of 25
(a) JCHP
(b) VCHP
(c) TCHP
Figure 2. Simulation flowsheet of the heat pump as output from Petro-SIM: (a) JCHP, (b) VCHP and (c) TCHP.
Figure 2. Simulation flowsheet of the heat pump as output from Petro-SIM: (a) JCHP, (b) VCHP and(c) TCHP.

Energies 2020, 13, 635 7 of 25
2.3. Step 3: Optimise the Heat Pumps
Based on Step 2, the HP operating variables are optimised, and the optimal performance result isobtained by establishing the optimisation objective function of the HP, setting the range of independentvariables and adding constraint conditions of the equation in Petro-SIM. It is necessary to optimise theHP based on the simulation to obtain its best performance. Petro-SIM has a multivariable optimiser.The optimiser can be used to optimise selected independent variables within defined ranges when asimulation converges, to minimise or maximise the objective function. The optimisation functionalityof Petro-SIM can manipulate multiple process variables. It can be used for constrained optimisationexpression with some flexibility, such as solving the objective function to maximise profit or minimiseutility consumption. The iterative calculation method of the Optimiser in Petro-SIM is based on theIPOPT solver [27]. In this study, the HP system is optimised by adding an Optimiser unit in thePetro-SIM simulation. In the Optimiser, the independent variables, objective and constraints aredefined to perform the optimisation. In this study, the optimisation independent variables were set asthe outlet pressure (or temperature) of the Compressor and the outlet pressure (or temperature) of theExpander/VLV. The constraints are set as the ∆Tmin of the HXs. The optimisation objective functionis COP of the HP. The performance of a HP is generally evaluated by the COP. The COP of a HP isdefined in Equation (1) [33].
COP =QhW
(1)
andW = Qh −Qc (2)
where: Qh—Heat output of the heat pump, kW; W—Electrical or power consumption of the HP, kW.The identification of the HP behaviour and best performance is performed by maximising the
COP value of the HP under consideration, using the model set up in Petro-SIM [27]. The specificationsof the temperatures and duties are varied within ranges expected from the considered process type,and the behaviour of the system is investigated. The procedure then provides the best HP—processconfiguration with the optimal values of the pressures after the compressor and the expander of theselected HP.
2.4. Step 4: Integrate the Heat Pump with the Process
At the next step, Pinch Analysis is used to integrate the HP with the process. The placement ofthe HP is configured following the outcomes from the previous step. When a HP is integrated with aprocess, the choice of a HP system depends on the operating temperature and the heat loads belowand above the Pinch. In this part, the calculation results of the HPs are plotted against the GCC ofthe considered process, and the optimal results are linked to the GCC profiles, including the requiredduties and temperatures. In this way, engineers applying the method can get a better understanding ofthe optimal results.
The GCC of a HP and an illustrative process is shown in Figure 3. The appropriate placement of aHP means that the heat must be recovered from below the Pinch and released above the Pinch [34].Improper placement on either side of the Pinch will result in lower energy efficiency. The figure hastwo lines representing each heat exchange between the HP and the process. The thick dashed linesrepresent the heat transfer taking place inside the HP block—absorbing and releasing heat. The thindashed lines represent the heat exchange directly with the process. These form extra heat circuits forminimising the probability of contamination of the internal HP fluids. All other GCC figures in thispaper follow the same convention.

Energies 2020, 13, 635 8 of 25
Energies 2019, 12, x FOR PEER REVIEW 8 of 25
are both oblique straight lines, as shown in Figure 3a. The working fluid slope of a JCHP is relatively large in GCC.
The example GCC of the VCHP is presented in Figure 3b. The working fluid of a VCHP is evaporated during heat exchange with the source and is condensed during heat exchange with the sink, so the phase transition occurs. The temperature of the working fluid of VCHP almost unchanged in exchange heat with the source or sink. The evaporation curve (blue dashed line) and condensation curve (red dashed line) are horizontal straight lines (i.e., minimal temperature change).
The GCC of the TCHP is shown in Figure 3c. The working fluid of TCHP is evaporated when the heat is absorbed from the process source. The heat release to the process sink takes place at supercritical conditions of the working fluid. This is why the working fluid temperature of TCHP remains constant during heat absorption from the source but changes significantly during the heat release to the sink. The evaporation curve (blue dashed line) is a horizontal straight line, whereas the heat release curve (red dashed line) is an oblique curve, as shown in Figure 3.c.
(a) (b) (c)
Figure 3. Grand Composite Curve (GCC) construction of a process with an integrated heat pump: (a) JCHP, (b) VCHP and (c) TCHP.
2.5. Step 5: Evaluation of The Heat Pump Suitability to Different Process GCC Profiles
The heat duties, inlet and outlet temperatures of the heat source and sink vary among different processes. Pinch Analysis with HP placement is used, performing Steps 1–4 for a set of GCC profiles representing processes with different thermal properties. The T–H diagrams of different processes are shown in Figure 4. The configurations shown represent pairs of process heat sinks and sources of a gradual, steep and medium slope. Combinations of these are possible, but the three configurations in Figure 4. are the basic ones, which help to understand the major trends.
(a) (b) (c)
Figure 4. The T–H diagrams of different source and sink configurations for heat pump application. (a). Gradual slope; (b). Steep slope; (c). Medium slope.
Each of these types of profiles implies a different degree of compatibility with the HP types considered in this work. The compatibility can be qualitatively assessed on the temperature–entropy (T–S) diagrams combining the process heat source/sink profiles with the HP profiles. Such plots are
Figure 3. Grand Composite Curve (GCC) construction of a process with an integrated heat pump:(a) JCHP, (b) VCHP and (c) TCHP.
The example GCC of the JCHP is shown in Figure 3a. In the JCHP cycle, the working fluidremains in a gaseous state during the whole cycle of heat exchange with the process source and sink aswell as the compression and expansion. This results in certain variations of the JCHP working fluidtemperature. The heat absorption curve (blue dashed line) and heat release curve (red dashed line) areboth oblique straight lines, as shown in Figure 3a. The working fluid slope of a JCHP is relatively largein GCC.
The example GCC of the VCHP is presented in Figure 3b. The working fluid of a VCHP isevaporated during heat exchange with the source and is condensed during heat exchange with thesink, so the phase transition occurs. The temperature of the working fluid of VCHP almost unchangedin exchange heat with the source or sink. The evaporation curve (blue dashed line) and condensationcurve (red dashed line) are horizontal straight lines (i.e., minimal temperature change).
The GCC of the TCHP is shown in Figure 3c. The working fluid of TCHP is evaporated when theheat is absorbed from the process source. The heat release to the process sink takes place at supercriticalconditions of the working fluid. This is why the working fluid temperature of TCHP remains constantduring heat absorption from the source but changes significantly during the heat release to the sink.The evaporation curve (blue dashed line) is a horizontal straight line, whereas the heat release curve(red dashed line) is an oblique curve, as shown in Figure 3c.
2.5. Step 5: Evaluation of the Heat Pump Suitability to Different Process GCC Profiles
The heat duties, inlet and outlet temperatures of the heat source and sink vary among differentprocesses. Pinch Analysis with HP placement is used, performing Steps 1–4 for a set of GCC profilesrepresenting processes with different thermal properties. The T–H diagrams of different processes areshown in Figure 4. The configurations shown represent pairs of process heat sinks and sources of agradual, steep and medium slope. Combinations of these are possible, but the three configurations inFigure 4 are the basic ones, which help to understand the major trends.
Each of these types of profiles implies a different degree of compatibility with the HP typesconsidered in this work. The compatibility can be qualitatively assessed on the temperature–entropy(T–S) diagrams combining the process heat source/sink profiles with the HP profiles. Such plots areshown in Figure 5. The solid red lines represent the heat release or condensation of the workingfluid in the HP, and the solid blue lines are the heat absorption or evaporation of the working fluid.The red dashed lines represent the heat release of the source, and the blue dashed lines representthe heat absorption of the sink. The performance of these three types of HPs (JCHP/VCHP/TCHP)is calculated by varying the inlet and the outlet temperatures of the process heat source and sink,and relating the results to the possible representations of temperature lifts ∆Tin, ∆Tout, or ∆T1, ∆T2
(e.g., Equations (3)–(6)).∆Tin = Tsink−in − Tsource−in (3)

Energies 2020, 13, 635 9 of 25
∆Tout = Tsink−out − Tsource−out (4)
∆T1 = Tsink−in − Tsource−out (5)
∆T2 = Tsink−out − Tsource−in (6)
where: ∆Tin—The inlet temperature difference of the source and sink, ◦C; ∆Tout—The outlet temperaturedifference of the source and sink, ◦C; ∆T1—The difference between the inlet temperature of the sinkand the outlet temperature of the source, ◦C; ∆T2—The difference between the outlet temperature ofthe sink and the inlet temperature of the source, ◦C.
Energies 2019, 12, x FOR PEER REVIEW 8 of 25
are both oblique straight lines, as shown in Figure 3a. The working fluid slope of a JCHP is relatively large in GCC.
The example GCC of the VCHP is presented in Figure 3b. The working fluid of a VCHP is evaporated during heat exchange with the source and is condensed during heat exchange with the sink, so the phase transition occurs. The temperature of the working fluid of VCHP almost unchanged in exchange heat with the source or sink. The evaporation curve (blue dashed line) and condensation curve (red dashed line) are horizontal straight lines (i.e., minimal temperature change).
The GCC of the TCHP is shown in Figure 3c. The working fluid of TCHP is evaporated when the heat is absorbed from the process source. The heat release to the process sink takes place at supercritical conditions of the working fluid. This is why the working fluid temperature of TCHP remains constant during heat absorption from the source but changes significantly during the heat release to the sink. The evaporation curve (blue dashed line) is a horizontal straight line, whereas the heat release curve (red dashed line) is an oblique curve, as shown in Figure 3.c.
(a) (b) (c)
Figure 3. Grand Composite Curve (GCC) construction of a process with an integrated heat pump: (a) JCHP, (b) VCHP and (c) TCHP.
2.5. Step 5: Evaluation of The Heat Pump Suitability to Different Process GCC Profiles
The heat duties, inlet and outlet temperatures of the heat source and sink vary among different processes. Pinch Analysis with HP placement is used, performing Steps 1–4 for a set of GCC profiles representing processes with different thermal properties. The T–H diagrams of different processes are shown in Figure 4. The configurations shown represent pairs of process heat sinks and sources of a gradual, steep and medium slope. Combinations of these are possible, but the three configurations in Figure 4. are the basic ones, which help to understand the major trends.
(a) (b) (c)
Figure 4. The T–H diagrams of different source and sink configurations for heat pump application. (a). Gradual slope; (b). Steep slope; (c). Medium slope.
Each of these types of profiles implies a different degree of compatibility with the HP types considered in this work. The compatibility can be qualitatively assessed on the temperature–entropy (T–S) diagrams combining the process heat source/sink profiles with the HP profiles. Such plots are
Figure 4. The T–H diagrams of different source and sink configurations for heat pump application.(a) Gradual slope; (b) Steep slope; (c) Medium slope.
Energies 2019, 12, x FOR PEER REVIEW 9 of 25
shown in Figure 5. The solid red lines represent the heat release or condensation of the working fluid in the HP, and the solid blue lines are the heat absorption or evaporation of the working fluid. The red dashed lines represent the heat release of the source, and the blue dashed lines represent the heat absorption of the sink. The performance of these three types of HPs (JCHP/VCHP/TCHP) is calculated by varying the inlet and the outlet temperatures of the process heat source and sink, and relating the results to the possible representations of temperature lifts ∆Tin, ∆Tout, or ∆T1, ∆T2 (e.g., Equations (3)–(6)).
(a) (b) (c)
Figure 5. The ideal T–S diagram of the heat pumps (a) JCHP, (b) VCHP and (c) TCHP.
∆𝑇 = 𝑇 − 𝑇 (3)∆𝑇 = 𝑇 − 𝑇 (4)∆𝑇 = 𝑇 − 𝑇 (5)∆𝑇 = 𝑇 − 𝑇 (6)
where: ∆𝑇 —The inlet temperature difference of the source and sink, °C; ∆𝑇 —The outlet temperature difference of the source and sink, °C; ∆𝑇 —The difference between the inlet temperature of the sink and the outlet temperature of the source, °C; ∆𝑇 —The difference between the outlet temperature of the sink and the inlet temperature of the source, °C.
2.6. Step 6: Discuss and Analyse the Results
To select the HP suitable for each of the possible processes, the solutions obtained during Steps 1–5, provide engineers with sufficient information and understanding of why the proposed measures are appropriate and efficient. The evaluation is performed by the combined use of Pinch Analysis and Petro-SIM to simulate and optimise the HPs. The actions include constructing the GCC of the process and combining it with the plots of the considered HPs. The combined plots are then used for explaining the solutions and relating them to the process specifications—i.e., the temperatures and heating/cooling duties of the main process, plus the HP properties—i.e., working fluid and operating pressures.
3. Simulation and Optimisation of Heat Pumps
A series of simulations and optimisations were performed by changing the inlet and outlet temperatures of the source and sink to study the performance of these different HP cycles in different scenarios. The settings of parameters and variables of the HP are shown in Table 1. ∆Tmin denotes the specifications of the minimum allowed temperature differences of the heat exchangers. The pressure differences (∆P) between the stream inlets and outlets of the heat exchangers in the HP are all 50 kPa. In the “Adjust” unit, the heat transfer duty of the heat exchanger Cold-side-HX is set to 10 MW by adjusting the flowrate of stream Source-in, which is the optimisation variable. The optimisation
Figure 5. The ideal T–S diagram of the heat pumps (a) JCHP, (b) VCHP and (c) TCHP.
2.6. Step 6: Discuss and Analyse the Results
To select the HP suitable for each of the possible processes, the solutions obtained during Steps 1–5,provide engineers with sufficient information and understanding of why the proposed measures areappropriate and efficient. The evaluation is performed by the combined use of Pinch Analysis andPetro-SIM to simulate and optimise the HPs. The actions include constructing the GCC of the processand combining it with the plots of the considered HPs. The combined plots are then used for explainingthe solutions and relating them to the process specifications—i.e., the temperatures and heating/coolingduties of the main process, plus the HP properties—i.e., working fluid and operating pressures.
3. Simulation and Optimisation of Heat Pumps
A series of simulations and optimisations were performed by changing the inlet and outlettemperatures of the source and sink to study the performance of these different HP cycles in differentscenarios. The settings of parameters and variables of the HP are shown in Table 1. ∆Tmin denotes thespecifications of the minimum allowed temperature differences of the heat exchangers. The pressure

Energies 2020, 13, 635 10 of 25
differences (∆P) between the stream inlets and outlets of the heat exchangers in the HP are all 50 kPa.In the “Adjust” unit, the heat transfer duty of the heat exchanger Cold-side-HX is set to 10 MWby adjusting the flowrate of stream Source-in, which is the optimisation variable. The optimisationobjective is to maximise the COP. Based on the simulation results, the application range of these threetypes of HPs is classified and can be predicted, mapping their suitability for the various process heatsource and sink scenarios.
Table 1. Settings of parameters and variables.
Settings JCHP-Ar JCHP-CO2 VCHP TCHP
Working Fluid Argon (Ar) CO2 NH3 CO2
Compressor/Expander efficiency 96% 96% 65% 65%
Variable Range1 P2, MPa 3–8 2.5–7 1–7.5 7.5–202 P5, MPa 0.5–5 1–4 0.2–1 2–5
constraints∆Tmin of Hot-side-HX 5–30 5–30 5–30 5–30∆Tmin of Cold-side-HX 5–30 5–30 5–30 5–30
1 P2—The outlet pressure of the compressor in the HP cycle, MPa. 2 P5—The outlet pressure of the expander orexpansion valve in the HP cycle, MPa.
The simulation results of the considered scenarios are shown in Figures 6 and 7. In Figure 6,the performance as a function of the temperature lifts expressed as the inlet and outlet temperaturedifferences is evaluated. Figure 7 provides an evaluation of the COP as a function of the temperaturelift expressed as ∆T1 and ∆T2.
Energies 2019, 12, x FOR PEER REVIEW 10 of 25
objective is to maximise the COP. Based on the simulation results, the application range of these three types of HPs is classified and can be predicted, mapping their suitability for the various process heat source and sink scenarios.
Table 1. Settings of parameters and variables.
Settings JCHP-Ar JCHP-CO2 VCHP TCHP Working Fluid Argon (Ar) CO2 NH3 CO2
Compressor/Expander efficiency 96% 96% 65% 65%
Variable Range 1 P2, MPa 3–8 2.5–7 1–7.5 7.5–20 2 P5, MPa 0.5–5 1–4 0.2–1 2–5
constraints ∆Tmin of Hot-side-HX 5–30 5–30 5–30 5–30 ∆Tmin of Cold-side-HX 5–30 5–30 5–30 5–30
1 P2—The outlet pressure of the compressor in the HP cycle, MPa. 2 P5—The outlet pressure of the expander or expansion valve in the HP cycle, MPa.
The simulation results of the considered scenarios are shown in Figure 6 and Figure 7. In Figure 6, the performance as a function of the temperature lifts expressed as the inlet and outlet temperature differences is evaluated. Figure 7 provides an evaluation of the COP as a function of the temperature lift expressed as ∆T1 and ∆T2.
Case 1. COP modelled as a function of the temperature lift represented by ∆Tin and ∆Tout
The variation of COP of different HPs with ∆Tin and ∆Tout is shown in Figure 6. As can be seen from Figure 6a, when 0 °C < ∆Tin < 30 °C and 30 °C < ∆Tout < 80 °C, the COP of JCHP-Ar decreased with the increase of ∆Tin, but did not change much with ∆Tout. The COP of JCHP-CO2 decreased with the increase of ∆Tin but did not change much with ∆Tout, as Figure 6b illustrates. This indicates that, when the inlet temperature difference (∆Tin) between the heat source and sink is not significant, even if the outlet temperature difference (∆Tout) between the two is very large (such as ∆Tout increasing to 80 °C), the COP of the actual JCHP is still very high. It can be seen that the JCHP is very suitable for processes where the ∆Tout is massive, and ∆Tin is small. The smaller ∆Tin, the higher is the COP of JCHP.
When 0 °C < ∆Tin < 30 °C and 30 °C < ∆Tout < 80 °C, the COP of the evaluated VCHP decreased with the increase of ∆Tout, but did not change much with ∆Tin, as can be detected from Figure 6c. Therefore, when ∆Tout between the source and sink is small, even if the ∆Tin between the two is significant (the maximum ∆Tin can only be equal to the ∆Tout), the COP of the actual VCHP is higher. The observations imply that VCHP is very suitable for processes where the temperature difference (∆T) between the heat source and sink is not large. The smaller ∆Tout, the higher is the COP of VCHP.
The COP of the evaluated TCHP decreased with the increase of ∆Tout and ∆Tin when 0 °C < ∆Tin < 30 °C and 30 °C < ∆Tout < 80 °C, as can be detected from Figure 6d. The observations imply that the application scope of TCHP is relatively narrow. TCHP is very suitable for processes where the ∆Tin is small and ∆Tout < 40 °C.
(a)
(b)
> 3.8 < 3.8 < 3.6 < 3.4 < 3.2 < 3 < 2.8
0 5 10 15 20 25 30ΔTin
30
40
50
60
70
80
ΔTou
t
> 4.8 < 4.7 < 4.5 < 4.3 < 4.1 < 3.9 < 3.7 < 3.5 < 3.3
0 5 10 15 20 25 30ΔTin
30
40
50
60
70
80
ΔTou
t
Energies 2019, 12, x FOR PEER REVIEW 11 of 25
(c)
(d)
Figure 6. COP of different heat pumps varies with ∆Tin and ∆Tout: (a) JCHP-Ar, (b) JCHP-CO2, (c) VCHP and (d) TCHP.
The variation trend of TCHP is not very regular, and the performance contours are less noticeable. This is because TCHP is a transcritical cycle, and the thermophysical properties of CO2 in the supercritical state are nonlinear, as the substance does not behave like a gas or a liquid. This makes it necessary to model the HP behaviour also as a function of the other two temperature lift representations: ∆T1 and ∆T2, by analogy with heat exchanger temperature differences and the T–S diagrams of the HP cycles.
(a)
(b)
(c)
(d)
Figure 7. COP of different heat pumps varies with ∆T1 and ∆T2 (a) JCHP-Ar, (b) JCHP-CO2, (c) VCHP and (d) TCHP.
Case 2. COP modelled as a function of the temperature lift represented as ∆T1 and ∆T2
> 4.8 < 4.8 < 4.4 < 4 < 3.6 < 3.2 < 2.8 < 2.4
0 5 10 15 20 25 30ΔTin
30
40
50
60
70
80
ΔTou
t
> 3 < 2.9 < 2.7 < 2.5 < 2.3 < 2.1 < 1.9 < 1.7
0 5 10 15 20 25 30ΔTin
30
40
50
60
70
80
ΔTou
t
> 5.4 < 5.1 < 4.7 < 4.3 < 3.9 < 3.5 < 3.1
8 12 16 20 24 28 32ΔT1
8
12
16
20
24
28
32
ΔT2
> 4.8 < 4.8 < 4.6 < 4.4 < 4.2 < 4 < 3.8
8 12 16 20 24 28 32ΔT1
8
12
16
20
24
28
32
ΔT2
> 4.4 < 4.4 < 4.3 < 4.2 < 4.1 < 4
8 12 16 20 24 28 32ΔT1
8
12
16
20
24
28
32
ΔT2
> 4.2 < 4 < 3.6 < 3.2 < 2.8 < 2.4
8 12 16 20 24 28 32ΔT1
8
12
16
20
24
28
32
ΔT2
Figure 6. COP of different heat pumps varies with ∆Tin and ∆Tout: (a) JCHP-Ar, (b) JCHP-CO2,(c) VCHP and (d) TCHP.
Energies 2020, 13, 635 11 of 25
Energies 2019, 12, x FOR PEER REVIEW 11 of 25
(c)
(d)
Figure 6. COP of different heat pumps varies with ∆Tin and ∆Tout: (a) JCHP-Ar, (b) JCHP-CO2, (c) VCHP and (d) TCHP.
The variation trend of TCHP is not very regular, and the performance contours are less noticeable. This is because TCHP is a transcritical cycle, and the thermophysical properties of CO2 in the supercritical state are nonlinear, as the substance does not behave like a gas or a liquid. This makes it necessary to model the HP behaviour also as a function of the other two temperature lift representations: ∆T1 and ∆T2, by analogy with heat exchanger temperature differences and the T–S diagrams of the HP cycles.
(a)
(b)
(c)
(d)
Figure 7. COP of different heat pumps varies with ∆T1 and ∆T2 (a) JCHP-Ar, (b) JCHP-CO2, (c) VCHP and (d) TCHP.
Case 2. COP modelled as a function of the temperature lift represented as ∆T1 and ∆T2
> 4.8 < 4.8 < 4.4 < 4 < 3.6 < 3.2 < 2.8 < 2.4
0 5 10 15 20 25 30ΔTin
30
40
50
60
70
80
ΔTou
t
> 3 < 2.9 < 2.7 < 2.5 < 2.3 < 2.1 < 1.9 < 1.7
0 5 10 15 20 25 30ΔTin
30
40
50
60
70
80
ΔTou
t
> 5.4 < 5.1 < 4.7 < 4.3 < 3.9 < 3.5 < 3.1
8 12 16 20 24 28 32ΔT1
8
12
16
20
24
28
32ΔT
2
> 4.8 < 4.8 < 4.6 < 4.4 < 4.2 < 4 < 3.8
8 12 16 20 24 28 32ΔT1
8
12
16
20
24
28
32
ΔT2
> 4.4 < 4.4 < 4.3 < 4.2 < 4.1 < 4
8 12 16 20 24 28 32ΔT1
8
12
16
20
24
28
32
ΔT2
> 4.2 < 4 < 3.6 < 3.2 < 2.8 < 2.4
8 12 16 20 24 28 32ΔT1
8
12
16
20
24
28
32
ΔT2
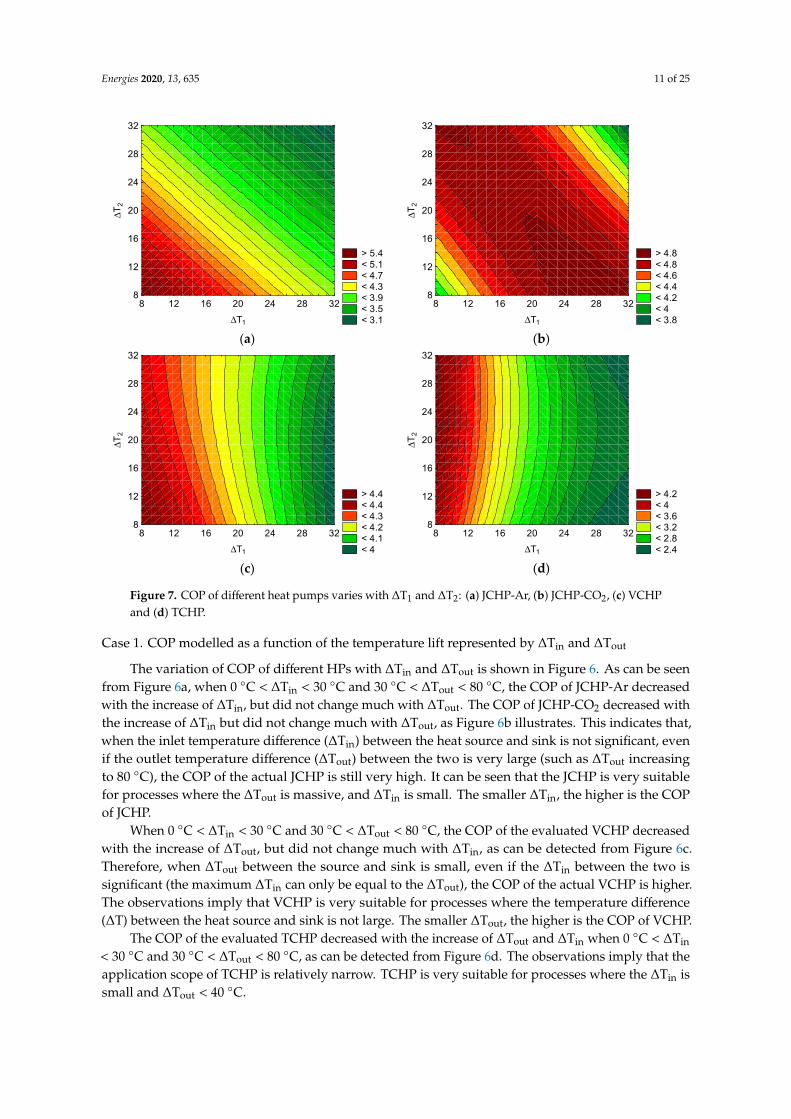
Figure 7. COP of different heat pumps varies with ∆T1 and ∆T2: (a) JCHP-Ar, (b) JCHP-CO2, (c) VCHPand (d) TCHP.
Case 1. COP modelled as a function of the temperature lift represented by ∆Tin and ∆Tout
The variation of COP of different HPs with ∆Tin and ∆Tout is shown in Figure 6. As can be seenfrom Figure 6a, when 0 ◦C < ∆Tin < 30 ◦C and 30 ◦C < ∆Tout < 80 ◦C, the COP of JCHP-Ar decreasedwith the increase of ∆Tin, but did not change much with ∆Tout. The COP of JCHP-CO2 decreased withthe increase of ∆Tin but did not change much with ∆Tout, as Figure 6b illustrates. This indicates that,when the inlet temperature difference (∆Tin) between the heat source and sink is not significant, evenif the outlet temperature difference (∆Tout) between the two is very large (such as ∆Tout increasingto 80 ◦C), the COP of the actual JCHP is still very high. It can be seen that the JCHP is very suitablefor processes where the ∆Tout is massive, and ∆Tin is small. The smaller ∆Tin, the higher is the COPof JCHP.
When 0 ◦C < ∆Tin < 30 ◦C and 30 ◦C < ∆Tout < 80 ◦C, the COP of the evaluated VCHP decreasedwith the increase of ∆Tout, but did not change much with ∆Tin, as can be detected from Figure 6c.Therefore, when ∆Tout between the source and sink is small, even if the ∆Tin between the two issignificant (the maximum ∆Tin can only be equal to the ∆Tout), the COP of the actual VCHP is higher.The observations imply that VCHP is very suitable for processes where the temperature difference(∆T) between the heat source and sink is not large. The smaller ∆Tout, the higher is the COP of VCHP.
The COP of the evaluated TCHP decreased with the increase of ∆Tout and ∆Tin when 0 ◦C < ∆Tin
< 30 ◦C and 30 ◦C < ∆Tout < 80 ◦C, as can be detected from Figure 6d. The observations imply that theapplication scope of TCHP is relatively narrow. TCHP is very suitable for processes where the ∆Tin issmall and ∆Tout < 40 ◦C.

Energies 2020, 13, 635 12 of 25
The variation trend of TCHP is not very regular, and the performance contours are less noticeable.This is because TCHP is a transcritical cycle, and the thermophysical properties of CO2 in thesupercritical state are nonlinear, as the substance does not behave like a gas or a liquid. This makes itnecessary to model the HP behaviour also as a function of the other two temperature lift representations:∆T1 and ∆T2, by analogy with heat exchanger temperature differences and the T–S diagrams of theHP cycles.
Case 2. COP modelled as a function of the temperature lift represented as ∆T1 and ∆T2
The change of COP of different HPs with ∆Tin and ∆Tout is studied by fixing the outlet temperatureof sink Tsink-out to a certain level. In this study the Tsink-out is set as 50 ◦C. When Tsink-out is 50 ◦C, thechange of COP of the different HPs with ∆T1 and ∆T2 is shown in Figure 7. It can be seen that the COPof JCHP-Ar decreased with the increase of ∆T1 and ∆T2. The COP of JCHP-CO2 first increased andthen decreased with the increase of ∆T1 and ∆T2, featuring a maximum. The COP of VCHP and TCHPdecreased with the increase of ∆T1, but did not change much with ∆T2.
It can be seen from Figure 7d that when the temperature difference ∆T1 is small, even if thetemperature difference ∆T2 is large, the COP of the TCHP is higher. The TCHP is then very suitable fora small temperature rise ∆T1 (preferably ∆T1 ≤ 10 ◦C) combined with a large ∆T2 process.
In conclusion, the observations imply from Figures 6 and 7 that JCHP is very suitable for theprocess of steep T–H lines of the source and sink in GCC. VCHP suitable for selection when the slopesof the T–H lines of the source and sink have a relatively low gradient (closer to flat). TCHP suitable forselection when the slope of the T–H line of the source have a relatively low gradient (closer to flat) andsteep T–H line of the sink in GCC.
4. Case Studies
This section analyses the integration of the different types of HPs using industrial examples toassess the practicability of the conclusion of Section 3. The optimisation objective function is the COPof the HP.
4.1. Formulation and Development: Process Integration Using JCHP, VCHP and TCHP
Four different industrial processes have been studied. The first process is a spray drying processof milk powder in a dairy factory [35], and its GCC is shown in Figure 8. The second process is alsofrom dairy product processing [36], which uses raw milk to produce concentrated milk, pasteurisedmilk, cream, yoghurt and dessert. The GCC for that is shown in Figure 9. The third example is fromcandy processing and packaging in a candy factory [37]. The GCC is shown in Figure 10. The fourthprocess is a 4-column double-effect methanol distillation in a chemical plant [38]. The GCC is shownin Figure 11. The ∆Tmin between the heat source/sink and the working fluid in the HP cycle is 5 ◦C.The compressors and expanders of the JCHP adopt centrifugal force rotating system structure, andtheir isentropic efficiency can be as high as 96%. The compressors of VCHP and TCHP are ordinaryturbocompressors. In this study, isentropic efficiency is assumed to be 65%.
4.1.1. Case 1: Milk Spray Drying Process
The spray drying process of the milk powder was integrated with the HP. The stream data wereonly adopted the spray drying process from Atkins et al. [35], as shown in Table 2. The ∆Tmin of theprocess is 20 ◦C.

Energies 2020, 13, 635 13 of 25
Table 2. The stream data from a spray drying process.
Steam Name Type Ts, ◦C Tt, ◦C CP, kW/◦C
Milk Concentrate Cold 54 65 37.6Dryer Inlet Air Cold 25 200 119.2
Fluid Bed A Inlet Air Cold 25 50 10.2Fluid Bed B Inlet Air Cold 25 45 14.9Fluid Bed C Inlet Air Cold 25 32 11.2
Air Exhaust Hot 75 20 174.7
As can be seen from the GCC in Figure 8, the Pinch Temperature of this process is 65 ◦C. Thehot utility required is 17.66 MW and the cold utility required is 5.36 MW. It is assumed that all thesource energy is used to heat the sink when the process is integrated with a HP. The heat duty of theheat exchanger at the source side for the HP is fixed 5.36 MW. The allowed range of the independentvariables and the optimisation results of a spray dryer with an integrated HP (maximising the COP)are shown in Table 3.
Table 3. Variation settings and optimisation results of a spray drying with an integrated heat pump.
HeatPump
Variation Ranges Optimisation Results1 P2,MPa
2 P5,MPa
COP, - Qsink,MW
W,MW
P2,MPa
P5,MPa
3 R, -
JCHP-Ar 5–9 2–5 2.83 8.29 2.93 8.99 4.35 2.09JCHP-CO2 4–7 1–3 2.93 8.04 2.74 6.47 1.70 3.92
VCHP 2.5–9 0.2–1 1.85 11.66 6.30 8.01 0.51 17.40TCHP 12–20 2–5 1.77 12.11 6.83 18.65 3.03 6.27
1 P2: The outlet pressure of the compressor in the HP cycle, MPa. 2 P5: The outlet pressure of the expander orexpansion valve in the HP cycle, MPa. 3 R: The compression ratio of the compressor, -.
For evaluation and interpretation, the GCC of the process integrated with different types of HPs isgiven, as shown in Figure 8. As can be seen from Table 3, the four HPs (JCHP-Ar, JCHP-CO2, VCHPand TCHP) can save 47%, 46%, 66% and 69% of the hot utility by improving the waste heat quality ofthe process. The ranking of best COP of the HPs is JCHP-CO2 > JCHP-Ar > VCHP > TCHP whenintegrating with this process. The reason can be seen in Figure 8, showing that the inlet temperaturedifference ∆Tin between source and sink is too small, while the outlet temperature difference ∆Tout istoo large. That is, the slopes of source and sink are both steep in the GCC.
In the HP cycle, the working fluid of the JCHP does not undergo a phase change and remains inthe gas phase. As a result, the ∆T between the inlet and the outlet of the working fluid in the JCHPchanges significantly in the heat exchange with source or sink. The slope of the working fluid isrelatively large in GCC, as shown in Figure 8a,b.
The working fluid of VCHP is evaporated during heat exchange with the source and is condensedduring heat exchange with the sink, so the phase transition occurs. Therefore, in the heat exchangewith the source or sink, the ∆T between the inlet and the outlet of the working fluid in the VCHPchanges a little. The slope of the working fluid is small in GCC, as shown in Figure 8c. The reasonfor the temperature difference in the red dashed line in Figure 8c is that the working fluid becomes asuperheated gas after increasing the pressure by the compressor. In the heat exchanger hot-side-HX,the working fluid is cooled to a saturated gas and then condensed to a liquid. Therefore, the reddashed line is tilted first and then becomes horizontal. However, when the working fluid is a gas thatcools down from the superheated state to the saturated state, the CP is small, and the heat exchangeefficiency is low. At the same time, the sink is a gas that the CP is small and the sink slope is largeduring the heat exchange, so the oblique part of the red dashed line is longer.

Energies 2020, 13, 635 14 of 25Energies 2019, 12, x FOR PEER REVIEW 14 of 25
(a) (b)
(c) (d)
Figure 8. GCC of Case 1 and Process Integration using (a) JCHP-Ar, (b) JCHP-CO2, (c) VCHP and (d) TCHP.
-50
0
50
100
150
200
250
300
350
0 5 10 15 20
Shift
ed t
empe
ratu
re, °
C
Net heat flow, MW
SourceSinkHP-hotHP-coldAux
-50
0
50
100
150
200
250
300
350
0 5 10 15 20
Shift
ed t
empe
ratu
re, °
C
Net heat flow, MW
SourceSinkHP-hotHP-coldAux
-50
0
50
100
150
200
250
300
350
0 5 10 15 20
Shift
ed t
empe
ratu
re, °
C
Net heat flow, MW
SourceSinkHP-hotHP-coldAux
-50
0
50
100
150
200
250
300
350
0 5 10 15 20
Shift
ed t
empe
ratu
re, °
C
Net heat flow, MW
SourceSinkHP-hotHP-coldAux
Figure 8. GCC of Case 1 and Process Integration using (a) JCHP-Ar, (b) JCHP-CO2, (c) VCHP and(d) TCHP.
The working fluid of TCHP is evaporated during exchanging heat with the source, while issupercritical fluid during heat transfer with the sink. As the slope of the working fluid is small duringthe heat transfer with the source in the GCC, whereas the slope of the working fluid is significant inthe heat exchange with sink in the GCC, as shown in Figure 8d. In this case, the average temperaturebetween working fluid and source/sink in JCHP is small, so the energy loss of the heat exchangers islower, the heat exchange efficiency is higher, and affects the COP positively. The average temperaturebetween the working fluid and the source/sink in VCHP and TCHP is large, so the energy loss is higher,the heat exchange efficiency is smaller and affects the COP negatively. The performance of VCHP andTCHP are both weak. In addition, the compression ratio of the compressor in VCHP is 17.40 too highfor a single stage. This means that multiple stages of compression would be required, resulting in asubstantial increase in the cost of the compressor and a higher cost for VCHP. The outlet pressure of thecompressor in TCHP is very high (18.65 MPa). This means high-pressure requirements for equipmentof TCHP, with very high equipment investment costs. The economy of the VCHP and TCHP are bothweak, and this process is more suitable for Heat Integration with JCHP, which is consistent with theconclusion of Section 3. It can be seen that the method proposed in this study is feasible and effective.

Energies 2020, 13, 635 15 of 25
4.1.2. Case 2: Raw Milk Processing into Dairy Products
The stream data are taken from Wallerand et al. [36], as shown in the Appendix A (Table A1). The∆Tmin of the process is 4 ◦C. As can be seen from the GCC in Figure 9, the Pinch Temperature of thisprocess is 66.9 ◦C. The hot utility required is 2.34 MW and the cold utility required is 0.94 MW. It isassumed that the heat duty of the heat exchanger at the source side is fixed 0.71 MW. Both the processheat source and the sink undergo a phase transition. The source needs to be condensed, and the sinkneeds to be heated and evaporated. The pressure differences of the heat exchangers on the source sideand sink sides are both set 0 kPa. The setting range of independent variables and optimisation resultsof HP integration into a dairy product process are shown in Table 4.
Table 4. Variable settings and optimisation results of a dairy product with an integrated heat pump.
HeatPump
Variable Ranges Optimisation Results1 P2,MPa
2 P5,MPa
COP, - Qsink,MW
W,MW
P2,MPa
P5,MPa
3 R, -
JCHP-Ar 5–9 3–5 3.89 1.00 0.26 6.97 4.87 1.45JCHP-CO2 4–8 1–4 4.52 0.92 0.20 4.37 2.56 1.74
VCHP 3.5–7 0.5–3 13.07 0.77 0.05 3.62 2.73 1.35TCHP 14–20 2–5 1.68 1.81 1.08 17.54 3.03 5.89
1 P2: The outlet pressure of the compressor in the HP cycle, MPa. 2 P5: The outlet pressure of the expander orexpansion valve in the HP cycle, MPa. 3 R: The compression ratio of the compressor.
The GCC of the dairy products process integrated with different types of HPs is shown in Figure 9.As can be seen from Table 4, the four HPs (JCHP-Ar, JCHP-CO2, VCHP, and TCHP) can save 43%, 39%,33%, and 78% of the hot utility by improving the waste heat quality of the process. The ranking of theHP COPs is VCHP > JCHP-CO2 > JCHP-Ar > TCHP when integrating with the dairy products process.
The reason can be seen in Figure 9. The ∆Tin and the ∆Tout between the source and the sink areboth too small (1.5 ◦C). The slopes of both the source and sink in the GCC plot are too small (flat). Asthe working fluid of the JCHP remains a gas across the whole HP cycle, the ∆T between the inlet andthe outlet of the working fluid in the JCHP varies significantly in the heat exchange with source or sink.The slope of the working fluid is relatively large in the GCC, as shown in Figure 9a,b. As the workingfluid of the VCHP is evaporated during heat exchange with the source and is condensed during heatexchange with the sink, the ∆T between inlet and outlet of the working fluid in the VCHP does notchange in the heat exchange with the source or sink. The slope of the working fluid is small in theGCC, as shown in Figure 9c. The working fluid of TCHP is evaporated during exchanging heat withthe source, whereas it is a supercritical fluid during the heat transfer to the sink. Therefore, the slopeof the working fluid is small in the heat exchange with the source in the GCC, while the slope of theworking fluid is steep in the heat exchange with sink in GCC, as shown in Figure 9d. In this case, theaverage temperature between the working fluid and the source/sink in VCHP is small, so the energyloss of the heat exchangers is lower, the heat exchange efficiency is higher and affects COP positively.Although the average temperature between working fluid and source/sink in JCHP and TCHP is large,so the energy loss is higher, the heat exchange efficiency is smaller, and affects negatively to the COP.The performance of JCHP and TCHP are both weak. In addition, the outlet pressure of the compressorin TCHP is too high (17.54 MPa). This means high-pressure requirements for equipment of TCHP, withvery high equipment investment costs. The TCHP economy is weak. This process is more suitable forHeat Integration with VCHP, which is consistent with the conclusion of Section 3. It can be seen thatthe method proposed in this study is feasible and effective.

Energies 2020, 13, 635 16 of 25
Energies 2019, 12, x FOR PEER REVIEW 15 of 25
4.1.2. Case 2: Raw Milk Processing into Dairy Products
The stream data are taken from Wallerand et al. [36], as shown in the Appendix A (Table A1). The ∆Tmin of the process is 4 °C. As can be seen from the GCC in Figure 9, the Pinch Temperature of this process is 66.9 °C. The hot utility required is 2.34 MW and the cold utility required is 0.94 MW. It is assumed that the heat duty of the heat exchanger at the source side is fixed 0.71 MW. Both the process heat source and the sink undergo a phase transition. The source needs to be condensed, and the sink needs to be heated and evaporated. The pressure differences of the heat exchangers on the source side and sink sides are both set 0 kPa. The setting range of independent variables and optimisation results of HP integration into a dairy product process are shown in Table 4.
Table 4. Variable settings and optimisation results of a dairy product with an integrated heat pump.
Heat Pump Variable Ranges Optimisation Results
1 P2, MPa 2 P5, MPa COP, - Qsink, MW W, MW P2, MPa P5, MPa 3 R, - JCHP-Ar 5-9 3-5 3.89 1.00 0.26 6.97 4.87 1.45
JCHP-CO2 4-8 1-4 4.52 0.92 0.20 4.37 2.56 1.74 VCHP 3.5-7 0.5-3 13.07 0.77 0.05 3.62 2.73 1.35 TCHP 14-20 2-5 1.68 1.81 1.08 17.54 3.03 5.89
1 P2: The outlet pressure of the compressor in the HP cycle, MPa. 2 P5: The outlet pressure of the expander or expansion valve in the HP cycle, MPa. 3 R: The compression ratio of the compressor.
The GCC of the dairy products process integrated with different types of HPs is shown in Figure 9. As can be seen from Table 4, the four HPs (JCHP-Ar, JCHP-CO2, VCHP, and TCHP) can save 43%, 39%, 33%, and 78% of the hot utility by improving the waste heat quality of the process. The ranking of the HP COPs is VCHP > JCHP-CO2 > JCHP-Ar > TCHP when integrating with the dairy products process.
(a) (b)
-20
20
60
100
140
180
220
0 0.5 1 1.5 2 2.5
Shift
ed t
empe
ratu
re, °
C
Net heat flow, MW
SourceSinkHP-hotHP-coldAux
-20
20
60
100
140
180
220
0 0.5 1 1.5 2 2.5
Shift
ed t
empe
ratu
re, °
C
Net heat flow, MW
SourceSinkHP-hotHP-coldAux
Energies 2019, 12, x FOR PEER REVIEW 16 of 25
(c) (d)
Figure 9. GCC of case 2 with integration options using (a) JCHP-Ar, (b) JCHP-CO2, (c) VCHP and (d) TCHP.
The reason can be seen in Figure 9. The ∆Tin and the ∆Tout between the source and the sink are both too small (1.5 °C). The slopes of both the source and sink in the GCC plot are too small (flat). As the working fluid of the JCHP remains a gas across the whole HP cycle, the ∆T between the inlet and the outlet of the working fluid in the JCHP varies significantly in the heat exchange with source or sink. The slope of the working fluid is relatively large in the GCC, as shown in Figure 9a,b. As the working fluid of the VCHP is evaporated during heat exchange with the source and is condensed during heat exchange with the sink, the ∆T between inlet and outlet of the working fluid in the VCHP does not change in the heat exchange with the source or sink. The slope of the working fluid is small in the GCC, as shown in Figure 9c. The working fluid of TCHP is evaporated during exchanging heat with the source, whereas it is a supercritical fluid during the heat transfer to the sink. Therefore, the slope of the working fluid is small in the heat exchange with the source in the GCC, while the slope of the working fluid is steep in the heat exchange with sink in GCC, as shown in Figure 9d. In this case, the average temperature between the working fluid and the source/sink in VCHP is small, so the energy loss of the heat exchangers is lower, the heat exchange efficiency is higher and affects COP positively. Although the average temperature between working fluid and source/sink in JCHP and TCHP is large, so the energy loss is higher, the heat exchange efficiency is smaller, and affects negatively to the COP. The performance of JCHP and TCHP are both weak. In addition, the outlet pressure of the compressor in TCHP is too high (17.54 MPa). This means high-pressure requirements for equipment of TCHP, with very high equipment investment costs. The TCHP economy is weak. This process is more suitable for Heat Integration with VCHP, which is consistent with the conclusion of Section 3. It can be seen that the method proposed in this study is feasible and effective.
4.1.3. Case 3: Candy Processing and Packaging
The process of candy processing and packaging was evaluated for HP integration. The stream data were taken from Miah et al. [37] and are listed in the Appendix A (Table A2). The ∆Tmin of the process is 5 °C. As can be seen from the GCC in Figure 10, the Pinch temperature of this process is 19.5 °C. The hot utility required is 1.82 MW and the cold utility required is 0.33 MW. It is assumed that all the source energy is used to heat the sink when the process is integrated with a HP, fixing the source duty to 0.33 MW. The pressure differences of the heat exchangers on the source side and sink sides are both 50 kPa. The setting ranges of the independent optimisation variables and optimisation results of a process of candy processing and packaging integration HP are shown in Table 5.
-20
20
60
100
140
180
220
0 0.5 1 1.5 2 2.5
Shift
ed t
empe
ratu
re, °
C
Net heat flow, MW
SourceSinkHP-hotHP-coldAux
-20
20
60
100
140
180
220
0 0.5 1 1.5 2 2.5
Shift
ed t
empe
ratu
re, °
C
Net heat flow, MW
SourceSinkHP-hotHP-coldAux
Figure 9. GCC of case 2 with integration options using (a) JCHP-Ar, (b) JCHP-CO2, (c) VCHP and(d) TCHP.
4.1.3. Case 3: Candy Processing and Packaging
The process of candy processing and packaging was evaluated for HP integration. The streamdata were taken from Miah et al. [37] and are listed in the Appendix A (Table A2). The ∆Tmin of theprocess is 5 ◦C. As can be seen from the GCC in Figure 10, the Pinch temperature of this process is19.5 ◦C. The hot utility required is 1.82 MW and the cold utility required is 0.33 MW. It is assumed thatall the source energy is used to heat the sink when the process is integrated with a HP, fixing the sourceduty to 0.33 MW. The pressure differences of the heat exchangers on the source side and sink sides areboth 50 kPa. The setting ranges of the independent optimisation variables and optimisation results of aprocess of candy processing and packaging integration HP are shown in Table 5.
Energies 2020, 13, 635 17 of 25
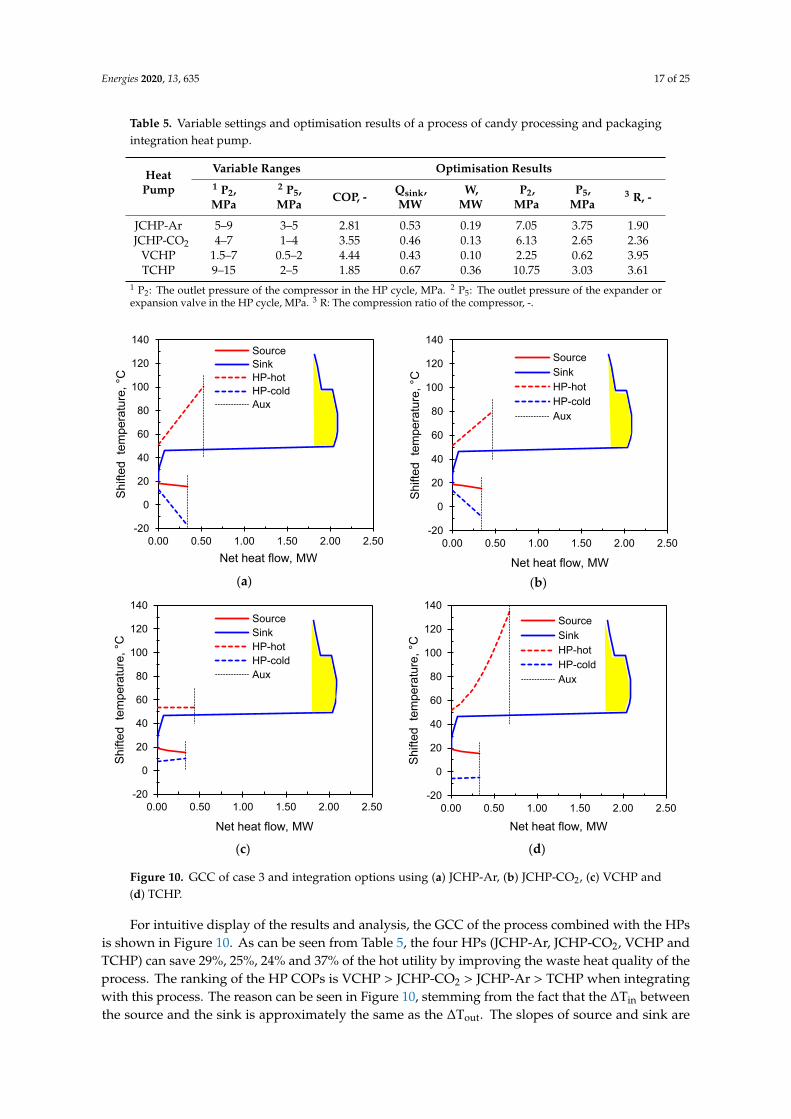
Table 5. Variable settings and optimisation results of a process of candy processing and packagingintegration heat pump.
HeatPump
Variable Ranges Optimisation Results1 P2,MPa
2 P5,MPa
COP, - Qsink,MW
W,MW
P2,MPa
P5,MPa
3 R, -
JCHP-Ar 5–9 3–5 2.81 0.53 0.19 7.05 3.75 1.90JCHP-CO2 4–7 1–4 3.55 0.46 0.13 6.13 2.65 2.36
VCHP 1.5–7 0.5–2 4.44 0.43 0.10 2.25 0.62 3.95TCHP 9–15 2–5 1.85 0.67 0.36 10.75 3.03 3.61
1 P2: The outlet pressure of the compressor in the HP cycle, MPa. 2 P5: The outlet pressure of the expander orexpansion valve in the HP cycle, MPa. 3 R: The compression ratio of the compressor, -.
Energies 2019, 12, x FOR PEER REVIEW 17 of 25
Table 5. Variable settings and optimisation results of a process of candy processing and packaging integration heat pump.
Heat Pump Variable Ranges Optimisation Results
1 P2, MPa 2 P5, MPa COP, - Qsink, MW W, MW P2, MPa P5, MPa 3 R, - JCHP-Ar 5-9 3-5 2.81 0.53 0.19 7.05 3.75 1.90
JCHP-CO2 4-7 1-4 3.55 0.46 0.13 6.13 2.65 2.36 VCHP 1.5-7 0.5-2 4.44 0.43 0.10 2.25 0.62 3.95 TCHP 9-15 2-5 1.85 0.67 0.36 10.75 3.03 3.61
1 P2—The outlet pressure of the compressor in the HP cycle, MPa. 2 P5—The outlet pressure of the expander or expansion valve in the HP cycle, MPa. 3 R—The compression ratio of the compressor, -.
For intuitive display of the results and analysis, the GCC of the process combined with the HPs is shown in Figure 10. As can be seen from Table 5, the four HPs (JCHP-Ar, JCHP-CO2, VCHP and TCHP) can save 29 %, 25 %, 24 % and 37 % of the hot utility by improving the waste heat quality of the process. The ranking of the HP COPs is VCHP > JCHP-CO2 > JCHP-Ar > TCHP when integrating with this process. The reason can be seen in Figure 10, stemming from the fact that the ∆Tin between the source and the sink is approximately the same as the ∆Tout. The slopes of source and sink are both small in the GCC. As the working fluid of the JCHP does not undergo a phase change remaining gas, the ∆T between inlet and outlet of the working fluid in JCHP changes significantly in the heat exchange with both the source and the sink. The slope of the working fluid is relatively large in the GCC (Figure 10a,b). Due to the phase changes of the working fluid of the VCHP, the ∆T between the inlet and outlet of the working fluid in the VCHP change very little. The slope of the working fluid is small in the GCC, see Figure 10c. For the TCHP, the slope of the working fluid is small in the heat exchange with source in the GCC, whereas the slope of the working fluid is large in the heat exchange with sink in the GCC, see Figure 10d.
In this case, the average temperature between working fluid and source/sink in VCHP is small, so the energy loss of the heat exchangers is lower, the heat exchange efficiency is higher and affects the COP positively. Although the average temperature between working fluid and source/sink in JCHP and TCHP is large, and therefore the energy loss is higher, the heat exchange efficiency is smaller and affects negatively the COP. The performance of JCHP and TCHP are both weak. This process is more suitable for heat integration with a VCHP, which is consistent with the conclusion of Section 3.
(a) (b)
-20
0
20
40
60
80
100
120
140
0.00 0.50 1.00 1.50 2.00 2.50
Shift
ed t
empe
ratu
re, °
C
Net heat flow, MW
SourceSinkHP-hotHP-coldAux
-20
0
20
40
60
80
100
120
140
0.00 0.50 1.00 1.50 2.00 2.50
Shift
ed t
empe
ratu
re, °
C
Net heat flow, MW
SourceSinkHP-hotHP-coldAux
Energies 2019, 12, x FOR PEER REVIEW 18 of 25
(c) (d)
Figure 10. GCC of case 3 and integration options using (a) JCHP-Ar, (b) JCHP-CO2, (c) VCHP and (d) TCHP.
4.1.4. Case 4: Methanol Distillation Process
The methanol distillation process was evaluated for HP integration based on the stream data from a 4-column double-effect methanol distillation process of a chemical plant [38]. The data are given in the Appendix A (Table A3). The ∆Tmin of the process is 15 °C. As can be seen from the GCC in Figure 11, the Pinch Temperature of this process is 74.26 °C. The hot utility required is 138.48 MW and the cold utility required is 139.90 MW. It is assumed that the heat duty of the heat exchanger at the sink side is fixed 20.86 MW. The pressure differences of the heat exchangers at source side are set 50 kPa, and at the sink, the side is set 0 kPa. The setting range of independent variables and optimisation results of a 4-column double-effect methanol distillation with an integrated HP are shown in Table 6. Finally, for more intuitive display the results, the GCC of a 4-column double-effect methanol distillation process integrated with different types of HPs is given, as shown in Figure 11. As can be seen from Table 6, the HPs can save 15 % of the hot utility by improving the waste heat quality of the process. The ranking of the HP COPs is VCHP > JCHP-CO2 > JCHP-Ar > TCHP when integrating with this process. The reason can be seen in Figure 11 and is related to the observation that the ∆Tin between source and sink is small, while the ∆Tout is too significant. The slopes of source and sink are both steep in the GCC.
The ∆T between the inlet and outlet of the working fluid in JCHP changes significantly in the heat exchange with both the source and the sink. The slope of the working fluid is relatively large in the GCC, as shown in Figure 11a,b. For the VCHP, in the heat exchange with the source and the sink, the ∆T between the inlet and outlet of the working fluid in VCHP change very little. The slope of the working fluid is small in the GCC - see Figure 11c. The TCHP shows a different behaviour due to the transcritical nature of the heat release part. The slope of the working fluid is small in the heat exchange with source in the GCC, while the slope of the working fluid is steep in the heat exchange with sink in the GCC, as shown in Figure 11d.
Table 6. Variable settings and optimisation results of a methanol distillation with an integrated heat pump.
Variable Ranges Optimisation Results
1 P2, MPa
2 P5, MPa
3 T5, °C COP, - Qsource, MW
W, MW
P2, MPa P5, MPa 4 R, -
JCHP-Ar 4-8 1-5 -- 3.23 14.40 6.46 5.49 3.50 1.59 JCHP-CO2 4-9 1-4 -- 4.02 15.03 5.19 4.92 2.55 1.97
VCHP 2.5-8 0.2-3 -- 5.67 17.18 3.64 5.28 2.40 2.24 TCHP 20-30 -- -10-25 1.50 7.09 13.92 25.71 6.07 4.27
-20
0
20
40
60
80
100
120
140
0.00 0.50 1.00 1.50 2.00 2.50
Shift
ed t
empe
ratu
re, °
C
Net heat flow, MW
SourceSinkHP-hotHP-coldAux
-20
0
20
40
60
80
100
120
140
0.00 0.50 1.00 1.50 2.00 2.50
Shift
ed t
empe
ratu
re, °
C
Net heat flow, MW
SourceSinkHP-hotHP-coldAux
Figure 10. GCC of case 3 and integration options using (a) JCHP-Ar, (b) JCHP-CO2, (c) VCHP and(d) TCHP.
For intuitive display of the results and analysis, the GCC of the process combined with the HPsis shown in Figure 10. As can be seen from Table 5, the four HPs (JCHP-Ar, JCHP-CO2, VCHP andTCHP) can save 29%, 25%, 24% and 37% of the hot utility by improving the waste heat quality of theprocess. The ranking of the HP COPs is VCHP > JCHP-CO2 > JCHP-Ar > TCHP when integratingwith this process. The reason can be seen in Figure 10, stemming from the fact that the ∆Tin betweenthe source and the sink is approximately the same as the ∆Tout. The slopes of source and sink are

Energies 2020, 13, 635 18 of 25
both small in the GCC. As the working fluid of the JCHP does not undergo a phase change remaininggas, the ∆T between inlet and outlet of the working fluid in JCHP changes significantly in the heatexchange with both the source and the sink. The slope of the working fluid is relatively large in theGCC (Figure 10a,b). Due to the phase changes of the working fluid of the VCHP, the ∆T between theinlet and outlet of the working fluid in the VCHP change very little. The slope of the working fluid issmall in the GCC, see Figure 10c. For the TCHP, the slope of the working fluid is small in the heatexchange with source in the GCC, whereas the slope of the working fluid is large in the heat exchangewith sink in the GCC, see Figure 10d.
In this case, the average temperature between working fluid and source/sink in VCHP is small, sothe energy loss of the heat exchangers is lower, the heat exchange efficiency is higher and affects theCOP positively. Although the average temperature between working fluid and source/sink in JCHPand TCHP is large, and therefore the energy loss is higher, the heat exchange efficiency is smaller andaffects negatively the COP. The performance of JCHP and TCHP are both weak. This process is moresuitable for heat integration with a VCHP, which is consistent with the conclusion of Section 3.
4.1.4. Case 4: Methanol Distillation Process
The methanol distillation process was evaluated for HP integration based on the stream data froma 4-column double-effect methanol distillation process of a chemical plant [38]. The data are givenin the Appendix A (Table A3). The ∆Tmin of the process is 15 ◦C. As can be seen from the GCC inFigure 11, the Pinch Temperature of this process is 74.26 ◦C. The hot utility required is 138.48 MW andthe cold utility required is 139.90 MW. It is assumed that the heat duty of the heat exchanger at the sinkside is fixed 20.86 MW. The pressure differences of the heat exchangers at source side are set 50 kPa, andat the sink, the side is set 0 kPa. The setting range of independent variables and optimisation results ofa 4-column double-effect methanol distillation with an integrated HP are shown in Table 6. Finally, formore intuitive display the results, the GCC of a 4-column double-effect methanol distillation processintegrated with different types of HPs is given, as shown in Figure 11. As can be seen from Table 6, theHPs can save 15% of the hot utility by improving the waste heat quality of the process. The rankingof the HP COPs is VCHP > JCHP-CO2 > JCHP-Ar > TCHP when integrating with this process. Thereason can be seen in Figure 11 and is related to the observation that the ∆Tin between source and sinkis small, while the ∆Tout is too significant. The slopes of source and sink are both steep in the GCC.
Table 6. Variable settings and optimisation results of a methanol distillation with an integratedheat pump.
Variable Ranges Optimisation Results1 P2,MPa
2 P5,MPa
3 T5,◦C
COP,-
Qsource,MW
W,MW
P2,MPa
P5,MPa
4 R, -
JCHP-Ar 4–8 1–5 – 3.23 14.40 6.46 5.49 3.50 1.59JCHP-CO2 4–9 1–4 – 4.02 15.03 5.19 4.92 2.55 1.97
VCHP 2.5–8 0.2–3 – 5.67 17.18 3.64 5.28 2.40 2.24TCHP 20–30 – −10–25 1.50 7.09 13.92 25.71 6.07 4.27
1 P2: The outlet pressure of the compressor in the HP cycle, MPa. 2 P5: The outlet pressure of the expander orexpansion valve in the HP cycle, MPa. 3 T5: The outlet temperature of the expansion valve in the HP cycle, MPa.4 R: The compression ratio of the compressor.
The ∆T between the inlet and outlet of the working fluid in JCHP changes significantly in theheat exchange with both the source and the sink. The slope of the working fluid is relatively large inthe GCC, as shown in Figure 11a,b. For the VCHP, in the heat exchange with the source and the sink,the ∆T between the inlet and outlet of the working fluid in VCHP change very little. The slope of theworking fluid is small in the GCC—see Figure 11c. The TCHP shows a different behaviour due to thetranscritical nature of the heat release part. The slope of the working fluid is small in the heat exchange

Energies 2020, 13, 635 19 of 25
with source in the GCC, while the slope of the working fluid is steep in the heat exchange with sink inthe GCC, as shown in Figure 11d.
Energies 2019, 12, x FOR PEER REVIEW 19 of 25
1 P2: The outlet pressure of the compressor in the HP cycle, MPa. 2 P5: The outlet pressure of the expander or expansion valve in the HP cycle, MPa. 3 T5: The outlet temperature of the expansion valve in the HP cycle, MPa. 4 R: The compression ratio of the compressor.
(a) (b)
(c) (d)
Figure 11. GCC of case 4 and integration options using (a) JCHP-Ar, (b) JCHP-CO2, (c) VCHP and (d) TCHP.
In this case, the average ∆T between working fluid and source/sink in VCHP is small, so the energy loss of the heat exchangers is lower, the heat exchange efficiency is higher, and COP is affected positively. Although the average ∆T between working fluid and source/sink in JCHP and TCHP is massive, and thus the energy loss is higher, the heat exchange efficiency is smaller, and this affects the COP negatively. The performance of the JCHP and the TCHP are both weak. In addition, the outlet pressure of the compressor in TCHP is too high (25.71 MPa). This means high-pressure requirements for equipment of TCHP, with high equipment investment cost. The TCHP economy is likely to be poor. This process is more suitable for heat integration with VCHP, which is consistent with the conclusion of Section 3.
For the optimal COP of JCHP, the reason for the large ∆T between the working fluid and the source/sink after heat exchange can be seen in Figure 12. The figure shows the relationship between power consumption and COP of JCHP with compression ratio. In the JCHP, the heat load of the sink-side heat exchanger Qh and the outlet pressure of the expander are fixed. By changing the outlet pressure of the compressor, a series of work required by the compressor, work produced by the expander and COP are obtained. It can be seen from Equation (1) that the COP is inversely proportional to the power consumption of the HP when Qh is constant.
10
30
50
70
90
110
130
150
170
0 20 40 60 80 100 120 140 160
Shift
ed t
empe
ratu
re, °
C
Net heat flow, MW
SourceSinkHP-hotHP-coldAux
10
30
50
70
90
110
130
150
170
0 20 40 60 80 100 120 140 160
Shift
ed t
empe
ratu
re, °
C
Net heat flow, MW
SourceSinkHP-hotHP-coldAux
10
30
50
70
90
110
130
150
170
0 20 40 60 80 100 120 140 160
Shift
ed t
empe
ratu
re, °
C
Net heat flow, MW
SourceSinkHP-hotHP-coldAux
10
30
50
70
90
110
130
150
170
0 20 40 60 80 100 120 140 160
Shift
ed t
empe
ratu
re, °
C
Net heat flow, MW
SourceSinkHP-hotHP-coldAux
Figure 11. GCC of case 4 and integration options using (a) JCHP-Ar, (b) JCHP-CO2, (c) VCHP and(d) TCHP.
In this case, the average ∆T between working fluid and source/sink in VCHP is small, so theenergy loss of the heat exchangers is lower, the heat exchange efficiency is higher, and COP is affectedpositively. Although the average ∆T between working fluid and source/sink in JCHP and TCHP ismassive, and thus the energy loss is higher, the heat exchange efficiency is smaller, and this affects theCOP negatively. The performance of the JCHP and the TCHP are both weak. In addition, the outletpressure of the compressor in TCHP is too high (25.71 MPa). This means high-pressure requirementsfor equipment of TCHP, with high equipment investment cost. The TCHP economy is likely to be poor.This process is more suitable for heat integration with VCHP, which is consistent with the conclusionof Section 3.
For the optimal COP of JCHP, the reason for the large ∆T between the working fluid and thesource/sink after heat exchange can be seen in Figure 12. The figure shows the relationship betweenpower consumption and COP of JCHP with compression ratio. In the JCHP, the heat load of thesink-side heat exchanger Qh and the outlet pressure of the expander are fixed. By changing theoutlet pressure of the compressor, a series of work required by the compressor, work produced by theexpander and COP are obtained. It can be seen from Equation (1) that the COP is inversely proportionalto the power consumption of the HP when Qh is constant.

Energies 2020, 13, 635 20 of 25
Energies 2019, 12, x FOR PEER REVIEW 20 of 25
As can be seen from Figure 12, with the increase of the compression ratio of the compressor (that is, the increase of the outlet pressure of the compressor compared to inlet pressure), the power consumption of the JCHP first decreases and then increases. The COP of JCHP increases first and then decreases with the increase of compressor compression ratio. That is, there is an optimal pressure for the optimal COP of the JCHP. When the outlet pressure of the compressor is lower than the optimal pressure, although the outlet temperature of the compressor decreases (that is, the inlet temperature of the working fluid exchanging heat with the source decreases and the temperature difference decreases), the COP of JCHP is not optimal. The same is true for the sink side.
Figure 12. The relationship between power consumption and COP of JCHP with compression ratio.
4.2. Evaluation
The results of the Heat Integration of the four industrial processes with HPs are compared. They are summarised in Table 7.
Table 7. The results of different industrial Processes Integration with heat pumps.
Name Unit Case 1: Milk Spray Drying
Process
Case 2: Dairy Product Process
Case 3: Candy Processing
and Packaging
Case 4: Methanol
Distillation
GCC
Tmin °C 10 2 15.5 32.5 TPinch °C 65 66.9 19.5 74.26 Tmax °C 210 100 127.5 143.68
Utility-cold MW 5.36 0.94 0.33 138.48 Utility-hot MW 17.66 2.34 1.82 139.90
Source Tsource-in °C 40.7 66.9 19.5 74.26 Tsource-out °C 10 66.9 15.5 67
Sink Tsink-in °C 65 68.4 46.5 86.1 Tsink-out °C -- 68.4 49.5 86.1
Duty Qsource MW 5.36 0.71 0.33 -- Qsink MW -- -- -- 20.86
COP
JCHP-Ar - 2.83 3.89 2.81 3.23 JCHP-CO2 - 2.93 4.52 3.55 4.02
VCHP - 1.85 13.07 4.44 5.67 TCHP - 1.77 1.68 1.85 1.50
For the processes with steep source and sink slopes, such as the spray drying process of the milk powder in a dairy factory in Case Study 1, the average ΔT of working fluid and source/sink in JCHP
1
1.5
2
2.5
3
3.5
4
0
10
20
30
40
50
1.2 1.4 1.6 1.8 2 2.2 2.4 2.6
CO
P, -
Wor
k, M
W
Pressure Ratio, -
WcomWexpW
Figure 12. The relationship between power consumption and COP of JCHP with compression ratio.
As can be seen from Figure 12, with the increase of the compression ratio of the compressor(that is, the increase of the outlet pressure of the compressor compared to inlet pressure), the powerconsumption of the JCHP first decreases and then increases. The COP of JCHP increases first and thendecreases with the increase of compressor compression ratio. That is, there is an optimal pressure forthe optimal COP of the JCHP. When the outlet pressure of the compressor is lower than the optimalpressure, although the outlet temperature of the compressor decreases (that is, the inlet temperature ofthe working fluid exchanging heat with the source decreases and the temperature difference decreases),the COP of JCHP is not optimal. The same is true for the sink side.
4.2. Evaluation
The results of the Heat Integration of the four industrial processes with HPs are compared. Theyare summarised in Table 7.
Table 7. The results of different industrial Processes Integration with heat pumps.
Name UnitCase 1: MilkSpray Drying
Process
Case 2: DairyProduct Process
Case 3: CandyProcessing and
Packaging
Case 4:Methanol
Distillation
GCC
Tmin◦C 10 2 15.5 32.5
TPinch◦C 65 66.9 19.5 74.26
Tmax◦C 210 100 127.5 143.68
Utility-cold MW 5.36 0.94 0.33 138.48Utility-hot MW 17.66 2.34 1.82 139.90
SourceTsource-in
◦C 40.7 66.9 19.5 74.26Tsource-out
◦C 10 66.9 15.5 67
SinkTsink-in
◦C 65 68.4 46.5 86.1Tsink-out
◦C – 68.4 49.5 86.1
Duty Qsource MW 5.36 0.71 0.33 –Qsink MW – – – 20.86
COP
JCHP-Ar - 2.83 3.89 2.81 3.23JCHP-CO2 - 2.93 4.52 3.55 4.02
VCHP - 1.85 13.07 4.44 5.67TCHP - 1.77 1.68 1.85 1.50
For the processes with steep source and sink slopes, such as the spray drying process of the milkpowder in a dairy factory in Case Study 1, the average ∆T of working fluid and source/sink in JCHP issmall, resulting in a small energy loss and high heat exchange efficiency. The COP of JCHP is large, soit is appropriate to choose the JCHP.

Energies 2020, 13, 635 21 of 25
When the source and sink slope of process is gentle or (nearly) flat, for example, as in the dairyproduct processing of Case Study 2 and the candy processing and packaging in Case Study 3, theVCHP is most suitable because the average ∆T of the working fluid and source/sink are small, theenergy loss is small resulting in high thermal efficiency and high COP values. In Case Study 2, the∆Tin is as low as 1.5 ◦C, and the COP of VCHP is as high as 13.07.
From Case Study 2 to Case Study 3, the ∆Tin increased from 1.5 ◦C to 11.84 ◦C, and the COP ofthe VCHP decreased from 13.07 to 4.44. Therefore, the smaller the ∆Tin between source and sink is,the larger is the COP of the VCHP. The COP of the VCHP decreased rapidly with the increase of ∆Tin
between source and sink. However, the COP of JCHP decreased less with the increase of ∆Tin betweensource and sink.
The application scope of the TCHP is limited. The TCHP is more appropriate for a process with arelatively gentle source slope and a relatively steep sink slope. The best process is one which the inlettemperature of the source is less than or equal to 20 ◦C, and the ∆Tin between the source and sink isless than 10 ◦C.
5. Conclusions
Several main types of HPs have been critically analysed for obtaining rules and criteria onappropriate HP selection for various process configurations. In addition to the relatively recentJCHP, other HP types are in use and have been industrialised, including the VCHP and TCHP types.This paper performs a comparative evaluation of the performance of the Heat Integration scenariosof different HP types (VCHP, TCHP and JCHP) and processes, by applying the Petro-SIM processsimulator and Pinch Analysis.
An answer is provided to the question of which type of HP is most suitable for a specific process.The results show that for processes with larger source and sink slopes on the T–H plot, the COP ofJCHP is higher, and JCHP is more suitable. For processes with a relatively smaller and medium slopeof the source and sink T–H profiles, the COP of VCHP is relatively large, and VCHP is more suitable.The scope of application of TCHP is small.
For processes with a relatively low source T-H slope and a relatively large sink T-H slope, theCOP of TCHP is more substantial, and it is appropriate to select it. Because the critical temperature ofCO2 is 31.26 ◦C, the added constraint in this context is a process for which the source inlet temperatureis lower than 20 ◦C, the sink temperature requires more than 40 ◦C, and the ∆Tin between the sourceand the sink is less than 10 ◦C.
By improving the waste heat quality of the process, the HPs can save 15 to 78% of the hot utility.The smaller the ∆Tin between source and sink is, the larger is the COP of the VCHP. The ∆Tin increasedfrom 1.5 ◦C to 11.84 ◦C, and the COP of the VCHP decreased from 13.07 to 4.44. The COP of the VCHPdecreased rapidly with the increase of ∆Tin between source and sink. However, the COP of JCHPdecreased less with the increase of ∆Tin between source and sink.
It is shown that if an inappropriate HP is selected to integrate with the process, the COP of the HPwould decline, which may lead to an increase in investment and a decrease in the economy of the HP.In the extreme cases, the differences between the most and the least suitable integration mappings canbe of the order of 100% and up to tenfold. This shows the importance of performing such an analysisand making the correct choice of a HP.
For the different scenarios of Heat Integration with HPs, this study can provide guidance andsuggestions for the selection of HPs, enabling a quick selection of the appropriate HPs. A simplifyingassumption for the current work is the use of the COP of the HP—process combinations as theperformance criterion, land considering the investment cost of HPs only qualitatively. The full analysis,relaxing this assumption and considering the investment and analysis of the economy is plannedfor future work. The future research will be targeted to find the balance between the COP and theeconomy of the HP application.

Energies 2020, 13, 635 22 of 25
Author Contributions: L.G. has written the draft performing the complete study at the previously publishedidea of T.G.W. to extend the comparison of heat pump suitability to several applications. P.S.V. has consultedL.G. on the steps of the investigation and the formulation of the concepts and the procedure. P.S.V. has made athorough refinement of the whole manuscript. J.J.K. has supervised and managed the research actions and themanuscript preparation and finalising, provided consultation to L.G. and P.S.V. on the presentation of the keyconcepts. T.G.W. has also provided proofreading feedback. All authors have read and agreed to the publishedversion of the manuscript.
Funding: This research was funded by the EU project “Sustainable Process Integration Laboratory—SPIL”, projectNo. CZ.02.1.01/0.0/0.0/15_003/0000456 funded by EU “CZ Operational Programme Research, Development andEducation”, Priority 1: Strengthening capacity for quality research under the collaboration agreement with TheUniversity of Waikato, New Zealand.
Conflicts of Interest: The authors declare no conflicts of interest. The funders had no role in the design of thestudy; in the collection, analyses, or interpretation of data; in the writing of the manuscript; or in the decision topublish the results.
Abbreviations
COP Coefficient of PerformanceCP Specific Heat CapacityGCC Grand Composite CurveGWP global warming potentialHEN Heat Exchanger NetworkHP heat pumpHX heat exchangerJCHP Joule cycle heat pumpMILP Mixed Integer Linear ProgrammingMINLP Mixed Integer Nonlinear ProgrammingTCHP transcritical heat pumpT–H temperature–enthalpyT-S temperature–entropyTSHI Total Site Heat IntegrationVCHP vapour compression heat pumpVLV let-down valve
Nomenclature
P2 The outlet pressure of the compressor in the HP cycle, MPaP5 The outlet pressure of the expander or expansion valve in the HP cycle, MPaQh Heat output of the heat pump, kWR The compression ratio of the compressorT5 The outlet temperature of the expansion valve in the HP cycle, ◦CTs supply temperatureTsink-out The outlet temperature of the sink, ◦CTt Target temperatureW Electrical or power consumption of the heat pump, kW∆P The pressure difference, MPa∆T temperature difference, ◦C
∆T1The difference between the inlet temperature of the sink and the outlettemperature of the source, ◦C
∆T2The difference between the outlet temperature of the sink and the inlettemperature of the source, ◦C
∆Tin The inlet temperature difference of the source and sink, ◦C∆Tmin minimum approach temperature∆Tout The outlet temperature difference of the source and sink, ◦C

Energies 2020, 13, 635 23 of 25
Appendix A
Table A1. The stream data of a dairy process. Data from Wallerand et al. [36].
Stream Name Ts, ◦C Tt, ◦C ∆H, kW
Refrigeration 6.0 4.0 76.0Pasteurisation 1a 4.0 66.0 2356.0Pasteurisation 2a 66.0 86.0 676.4Pasteurisation 1a 86.0 4.0 2773.2Pasteurisation 1a 66.0 98.0 119.7Pasteurisation 1a 98.0 4.0 351.6Concentration 1 4.0 70.3 504.0Concentration 2 70.3 70.3 904.2Concentration 3 66.4 66.4 864.1Concentration 4 60.8 60.8 849.8Concentration 5 60.8 4.0 151.5Concentration 6 68.9 68.9 904.2Concentration 7 65.9 65.9 864.1Concentration 9 68.9 15.0 87.8Concentration 10 65.9 15.0 80.8
Condensates cooling 8 60.1 60.1 849.8Condensates cooling 11 60.1 15.0 69.7Yoghurt production 1 4.0 94.0 1026.0Yoghurt production 2 94.0 10.0 957.6Desert production 1 4.0 90.0 817.0Desert production 2 90.0 70.0 190.0
Hot water 15.0 55.0 167.2Cleaning in place 1a 58.7 70.0 188.6Cleaning in place 1b 65.0 15.0 104.5Cleaning in place 2a 67.5 80.0 209.5Cleaning in place 2b 75.0 15.0 125.4
Fridge 5.0 5.0 300.0
Table A2. The stream data of a process of candy processing and packaging. Data from Miah et al. [37].
Stream Name Ts, ◦C Tt, ◦C ∆H, kW
Production AFP-02 15.0 70.0 13.66FP-03 15.0 70.0 16.72FP-04 25.0 60.0 29.12FP-05 25.0 60.0 29.12FP-06 30.0 55.0 29.10FP-07 30.0 55.0 29.10FP-08 130.0 80.0 60.80
1 FP-V 120.0 25.0 76.71FP-08 130.0 80.0 60.80
1 FP-V 120.0 25.0 76.71Production B
15 x S-S 21.0 18.0 279.0011 x N-S 44.0 47.0 550.0028 x S-S 44.0 47.0 1400.00
PackagingAHU CFP 22 18 55.52
1 FP-V: Water, includes latent heat.

Energies 2020, 13, 635 24 of 25
Table A3. The stream data of a 4-column double-effect methanol distillation process. Data fromCui et al. [38].
Stream Name Ts, ◦C Tt, ◦C ∆H, MW
Crude feed preheated 40.00 85.00 8.160PC feed preheated 78.94 135.97 13.864
LEC reboiler 78.60 78.62 27.750PC reboiler 136.10 136.18 114.064AC reboiler 102.90 102.92 96.267WC reboiler 102.20 102.22 3.544
First stage condenser 81.76 70.00 26.858Second stage condenser 70.00 40.00 1.744
PC condenser 130.50 125.19 115.115AC condenser 66.60 40.00 107.510WC condenser 66.60 40.00 3.584
PC top stream to tanks 125.19 40.00 7.425
References
1. Carnot, S. Reflexions on the Motive Power of Fire: A Critical Edition with the Surviving Scientific Manuscripts;Manchester University Press: Manchester, UK, 1986; ISBN 978-0-936508-16-0.
2. Radermacher, R.; Hwang, Y. Vapor Compression Heat Pumps with Refrigerant Mixes; Taylor & Francis: Boca Raton,FL, USA, 2005; ISBN 978-0-8493-3489-4.
3. Herold, K.E.; Radermacher, R.; Klein, S.A. Absorption Chillers and Heat Pumps, 2nd ed.; CRC Press, Taylor &Francis Group: Boca Raton, FL, USA, 2016; ISBN 978-1-4987-1434-1.
4. Lorentzen, G. Trans-Critical Vapour Compression Cycle Device. Patent Application No. WO1990007683A1,12 July 1990.
5. Pavlas, M.; Stehlík, P.; Oral, J.; Klemeš, J.; Kim, J.-K.; Firth, B. Heat integrated heat pumping for biomassgasification processing. Appl. Therm. Eng. 2010, 30, 30–35. [CrossRef]
6. Liew, P.Y.; Walmsley, T.G. Heat pump integration for total site waste heat recovery. Chem. Eng. Trans. 2016,52, 817–822.
7. Walmsley, T.G. A Total Site Heat Integration design method for integrated evaporation systems includingvapour recompression. J. Clean. Prod. 2016, 136, 111–118. [CrossRef]
8. Walmsley, T.G.; Klemeš, J.J.; Walmsley, M.R.W.; Atkins, M.J.; Varbanov, P.S. Innovative hybrid heat pump fordryer process integration. Chem. Eng. Trans. 2017, 57, 1039–1044.
9. Stampfli, J.A.; Atkins, M.J.; Olsen, D.G.; Wellig, B.; Walmsley, M.R.W.; Neale, J.R. Industrial heat pumpintegration in non-continuous processes using thermal energy storages as utility a graphical approach.Chem. Eng. Trans. 2018, 70, 901–906.
10. Stampfli, J.A.; Atkins, M.J.; Olsen, D.G.; Walmsley, M.R.W.; Wellig, B. Practical heat pump and storageintegration into non-continuous processes: A hybrid approach utilizing insight based and nonlinearprogramming techniques. Energy 2019, 182, 236–253. [CrossRef]
11. Wang, M.; Deng, C.; Wang, Y.; Feng, X.; Lan, X. Process integration and selection of heat pumps in industrialprocesses. Chem. Eng. Trans. 2018, 70, 1105–1110.
12. Urbanucci, L.; Bruno, J.C.; Testi, D. Thermodynamic and economic analysis of the integration ofhigh-temperature heat pumps in trigeneration systems. Appl. Energy 2019, 238, 516–533. [CrossRef]
13. Schlosser, F.; Seevers, J.-P.; Peesel, R.-H.; Walmsley, T.G. System efficient integration of standby control andheat pump storage systems in manufacturing processes. Energy 2019, 181, 395–406. [CrossRef]
14. Oluleye, G.; Smith, R.; Jobson, M. Modelling and screening heat pump options for the exploitation of lowgrade waste heat in process sites. Appl. Energy 2016, 169, 267–286. [CrossRef]
15. Oluleye, G.; Jiang, N.; Smith, R.; Jobson, M. A novel screening framework for waste heat utilizationtechnologies. Energy 2017, 125, 367–381. [CrossRef]
16. Goumba, A.; Chiche, S.; Guo, X.; Colombert, M.; Bonneau, P. Recov’Heat: An estimation tool of urban wasteheat recovery potential in sustainable cities. AIP Conf. Proc. 2017, 1814, 020038. [CrossRef]

Energies 2020, 13, 635 25 of 25
17. Sarbu, I. A review on substitution strategy of non-ecological refrigerants from vapour compression-basedrefrigeration, air-conditioning and heat pump systems. Int. J. Refrig. 2014, 46, 123–141. [CrossRef]
18. Nekså, P.; Rekstad, H.; Zakeri, G.R.; Schiefloe, P.A. CO2-heat pump water heater: Characteristics, systemdesign and experimental results. Int. J. Refrig. 1998, 21, 172–179. [CrossRef]
19. Nekså, P. CO2 heat pump systems. Int. J. Refrig. 2002, 25, 421–427. [CrossRef]20. Kim, H.J.; Ahn, J.M.; Cho, S.O.; Cho, K.R. Numerical simulation on scroll expander–compressor unit for CO2
trans-critical cycles. Appl. Therm. Eng. 2008, 28, 1654–1661. [CrossRef]21. Van de Bor, D.M.; Infante Ferreira, C.A.; Kiss, A.A. Low grade waste heat recovery using heat pumps and
power cycles. Energy 2015, 89, 864–873. [CrossRef]22. Fu, C.; Gundersen, T. A Novel Sensible Heat Pump Scheme for Industrial Heat Recovery. Ind. Eng. Chem. Res.
2016, 55, 967–977. [CrossRef]23. Adler, B.; Mauthner, R. Rotation Heat Pump (RHP). In Proceedings of the 12th IEA Heat Pump Conference,
Rotterdam, The Netherlands, 15–18 May 2017.24. Wallerand, A.S.; Kermani, M.; Kantor, I.; Maréchal, F. Optimal heat pump integration in industrial processes.
Appl. Energy 2018, 219, 68–92. [CrossRef]25. Linnhoff, B.; Hindmarsh, E. The pinch design method for heat exchanger networks. Chem. Eng. Sci. 1983, 38,
745–763. [CrossRef]26. Gai, L.; Varbanov, P.S.; Walmsley, T.G.; Klemeš, J.J. Process Integration Using a Joule Cycle Heat Pump.
Chem. Eng. Trans. 2019, 76, 415–420.27. KBC. Petro-SIM; KBC Advanced Technologies: London, UK, 2016.28. Klemeš, J.J.; Varbanov, P.S.; Alwi, S.R.W.; Manan, Z.A. Sustainable Process Integration and Intensification: Saving
Energy, Water and Resources, 2nd ed.; Walter de Gruyter GmbH: Berlin, Germany, 2018; ISBN 978-3-11-053536-5.29. Klemeš, J.J.; Varbanov, P.S.; Walmsley, T.G.; Jia, X. New directions in the implementation of Pinch Methodology
(PM). Renew. Sustain. Energy Rev. 2018, 98, 439–468. [CrossRef]30. Lopez-Echeverry, J.S.; Reif-Acherman, S.; Araujo-Lopez, E. Peng-Robinson equation of state: 40 years through
cubics. Fluid Phase Equilibria 2017, 447, 39–71. [CrossRef]31. Guzda, A.; Szmolke, N. Compressors in Heat Pumps. Mach. Dyn. Res. 2015, 39, 71–83.32. Wang, J.F.; Brown, C.; Cleland, D.J. Heat pump heat recovery options for food industry dryers. Int. J. Refrig.
2018, 86, 48–55. [CrossRef]33. Cube, H.L.V.; Steimle, F. Heat Pump Technology; Elsevier: Amsterdam, The Netherlands, 2013;
ISBN 978-1-4831-0247-4.34. Klemeš, J.J. Handbook of Process Integration (PI): Minimisation of Energy and Water Use, Waste and Emissions;
Woodhead Publishing/Elsevier: Cambridge, UK, 2013; ISBN 978-0-85709-725-5.35. Atkins, M.J.; Walmsley, M.R.W.; Neale, J.R. Integrating heat recovery from milk powder spray dryer exhausts
in the dairy industry. Appl. Therm. Eng. 2011, 31, 2101–2106. [CrossRef]36. Wallerand, A.S.; Kermani, M.; Voillat, R.; Kantor, I.; Maréchal, F. Optimal design of solar-assisted industrial
processes considering heat pumping: Case study of a dairy. Renew. Energy 2018, 128, 565–585. [CrossRef]37. Miah, J.H.; Griffiths, A.; McNeill, R.; Poonaji, I.; Martin, R.; Leiser, A.; Morse, S.; Yang, A.; Sadhukhan, J.
Maximising the recovery of low grade heat: An integrated heat integration framework incorporating heatpump intervention for simple and complex factories. Appl. Energy 2015, 160, 172–184. [CrossRef]
38. Cui, C.; Sun, J.; Li, X. A hybrid design combining double-effect thermal integration and heat pump to themethanol distillation process for improving energy efficiency. Chem. Eng. Process. Process Intensif. 2017, 119,81–92. [CrossRef]
© 2020 by the authors. Licensee MDPI, Basel, Switzerland. This article is an open accessarticle distributed under the terms and conditions of the Creative Commons Attribution(CC BY) license (http://creativecommons.org/licenses/by/4.0/).