Embed Size (px)
Citation preview
Joel Koepke, P.E.ERCOTOperations Support Engineer
ERCOT Experiences During Summer 2011
2
Objectives
• Identify weather and nature challenges • Identify variables leading to EEAs• Identify mitigating actions of August 4th EEA• Identify outlook and changes for Summer
2012
3
Weather Extremes
4
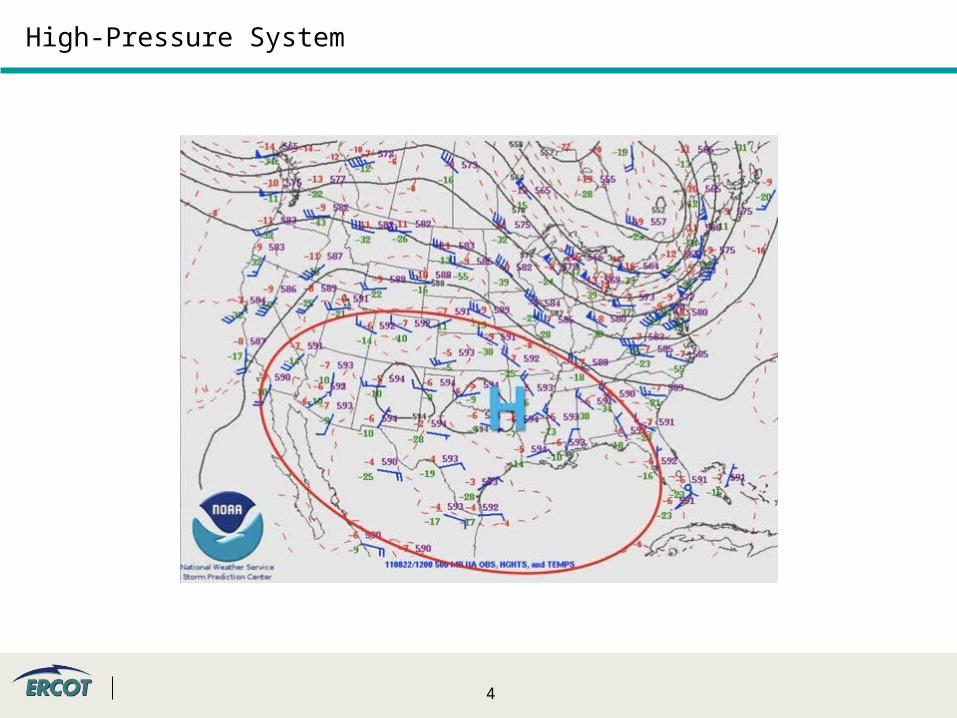
High-Pressure System

5
Record Drought
6
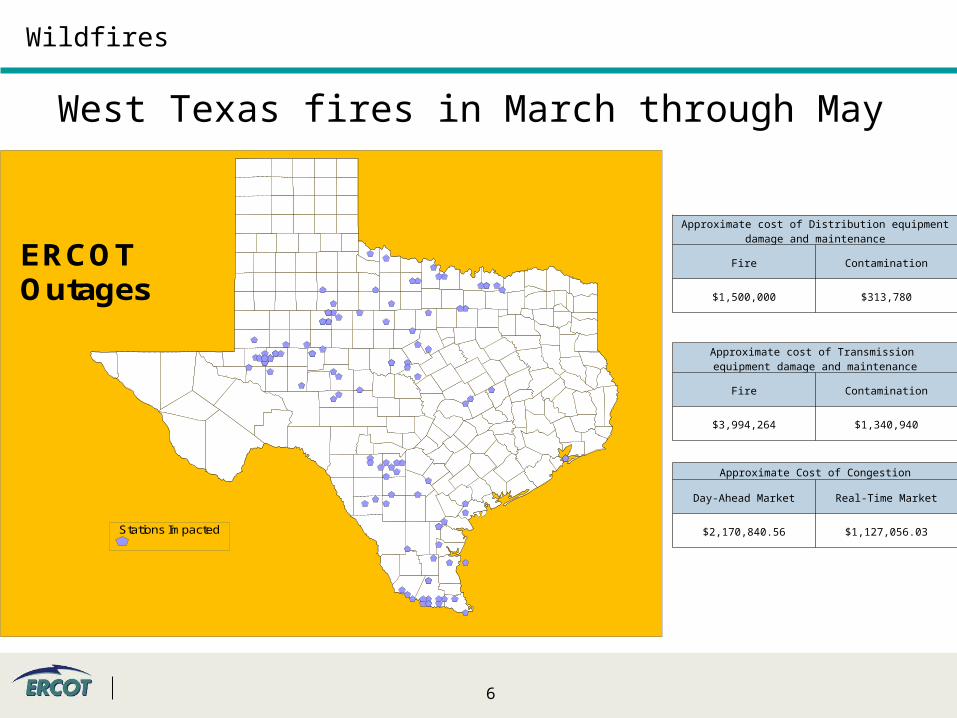
West Texas fires in March through May
ERCOT Outages
Stations Impacted
Approximate cost of Transmission equipment damage and maintenance
Fire Contamination
$3,994,264 $1,340,940
Approximate cost of Distribution equipment damage and maintenance
Fire Contamination
$1,500,000 $313,780
Approximate Cost of Congestion
Day-Ahead Market Real-Time Market
$2,170,840.56 $1,127,056.03
Wildfires
7
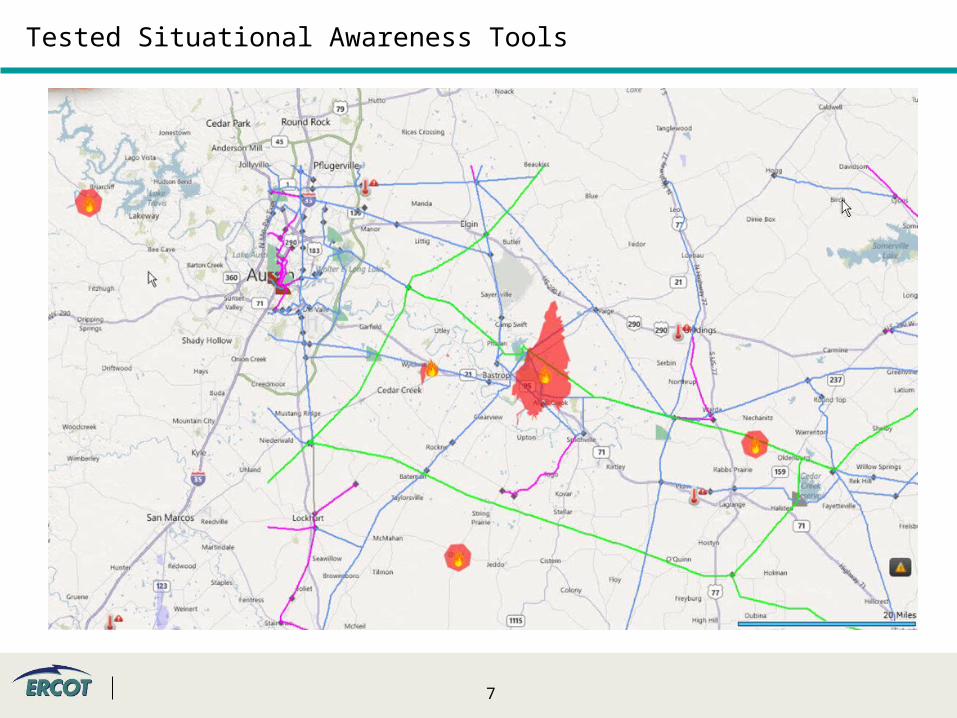
Tested Situational Awareness Tools
8
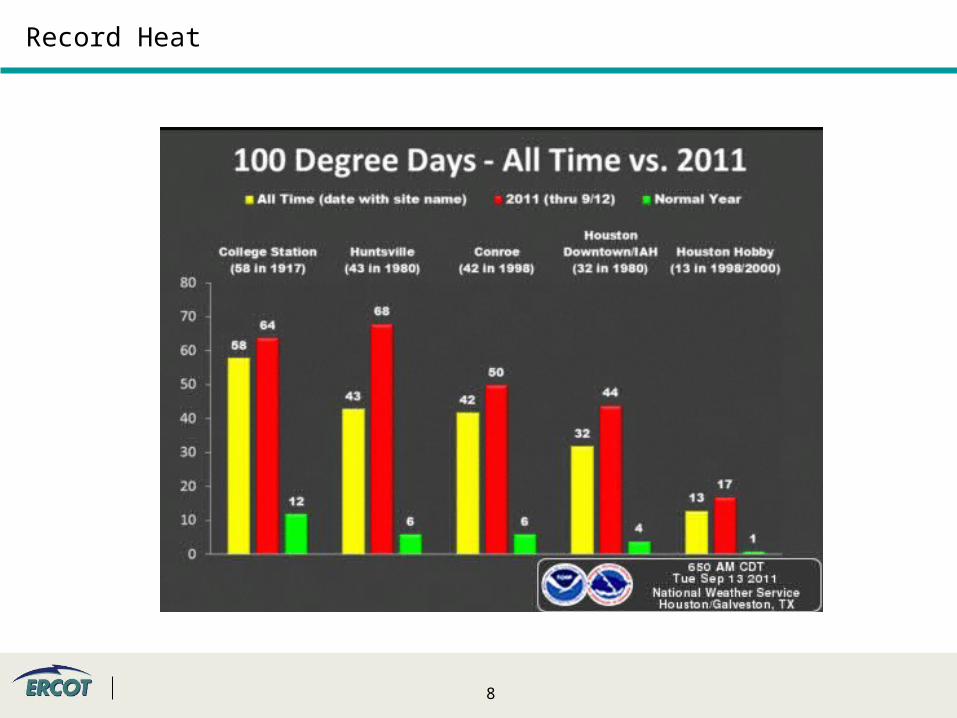
Record Heat
9
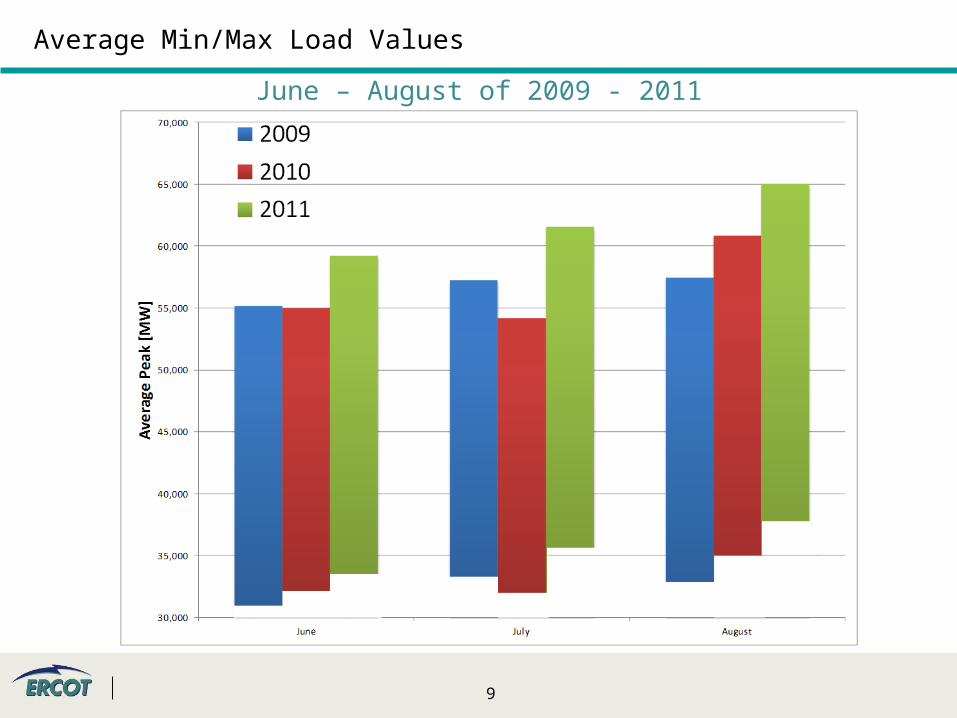
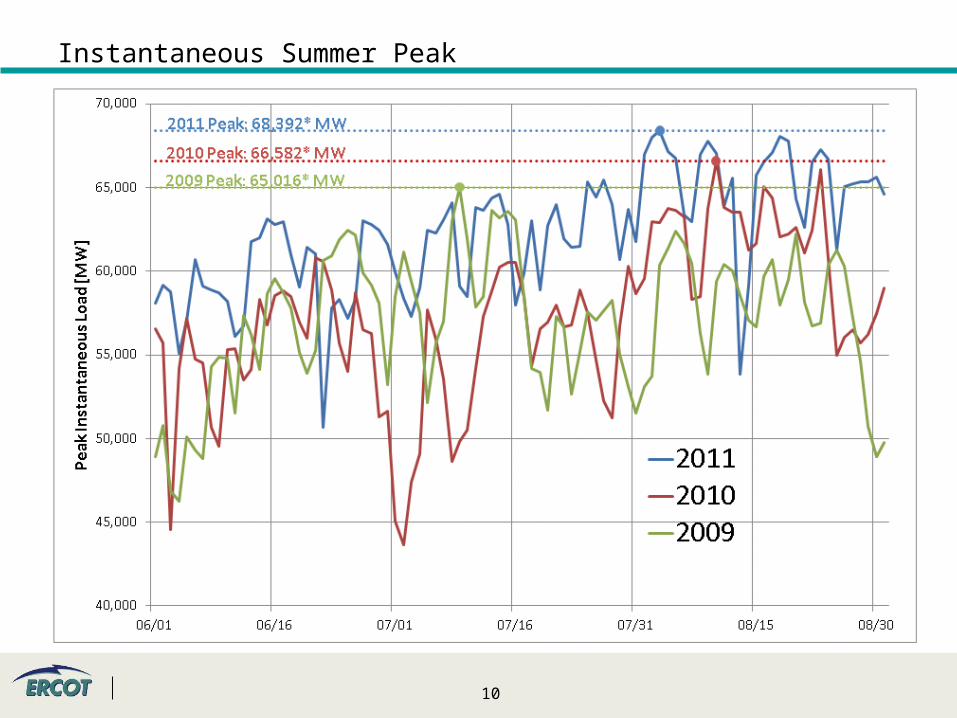
Average Min/Max Load Values
June – August of 2009 - 2011
10
Instantaneous Summer Peak

Summer Energy Emergency Alerts
12
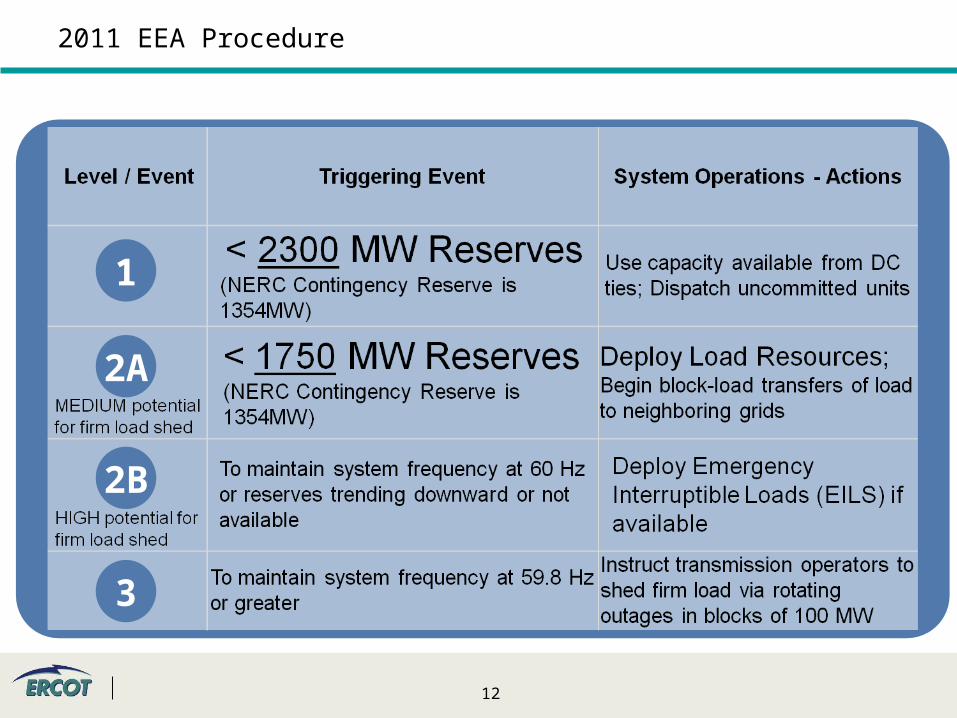
1
2A
2B
3
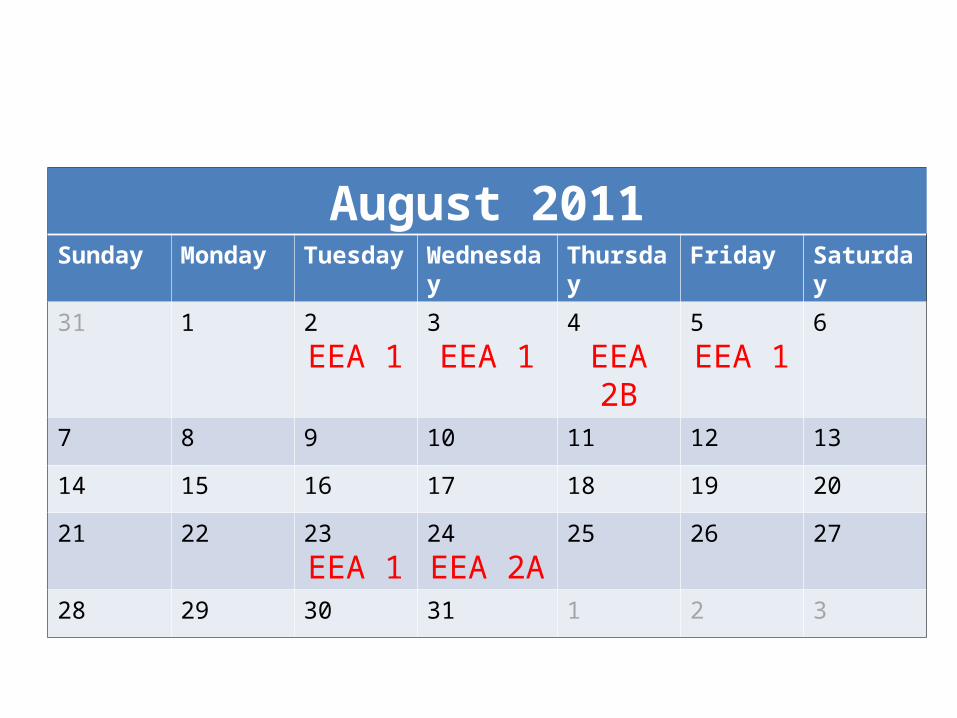
2011 EEA Procedure
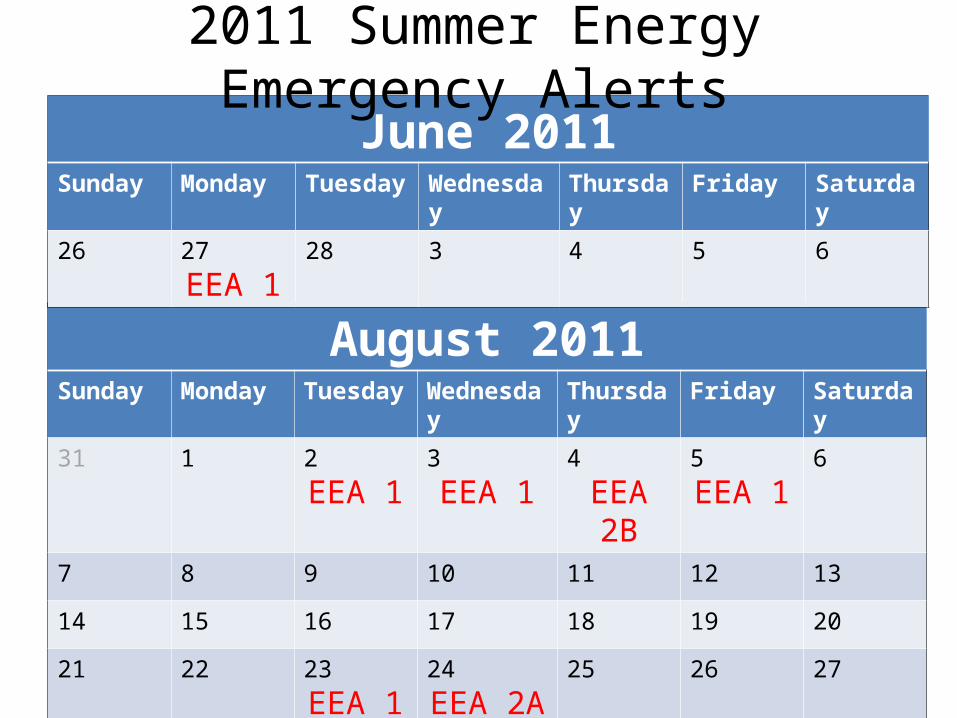
August 2011Sunday Monday Tuesday Wednesday Thursday Friday Saturday
31 1 2
EEA 13
EEA 14
EEA 2B5
EEA 16
7 8 9 10 11 12 13
14 15 16 17 18 19 20
21 22 23
EEA 124
EEA 2A25 26 27
28 29 30 31 1 2 3
June 2011Sunday Monday Tuesday Wednesday Thursday Friday Saturday
26 27
EEA 128 3 4 5 6
2011 Summer Energy Emergency Alerts
14
PRC
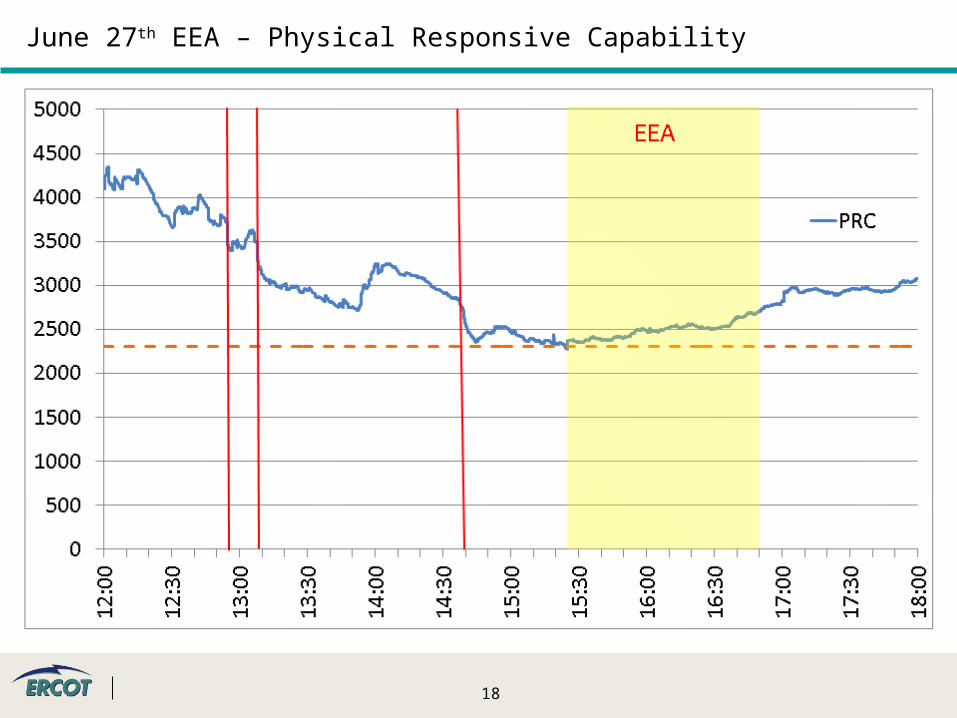
• Physical Responsive Capability (PRC)– A representation of the total amount of system wide On-Line
capability that has a high probability of being able to quickly respond to system disturbances
15
June 27th EEA Highlights
• 3 unit trips in less than 2 hours– Total of 1,800 MW
• Large wind decline– Drop of 4,200 MW in 4 hours
• Large load increase– Increase of 4,000 MW in 2 hours
• Below 2,300 MW of Reserves for 1 minute• EEA lasted for 1 hour and 25 minutes
16
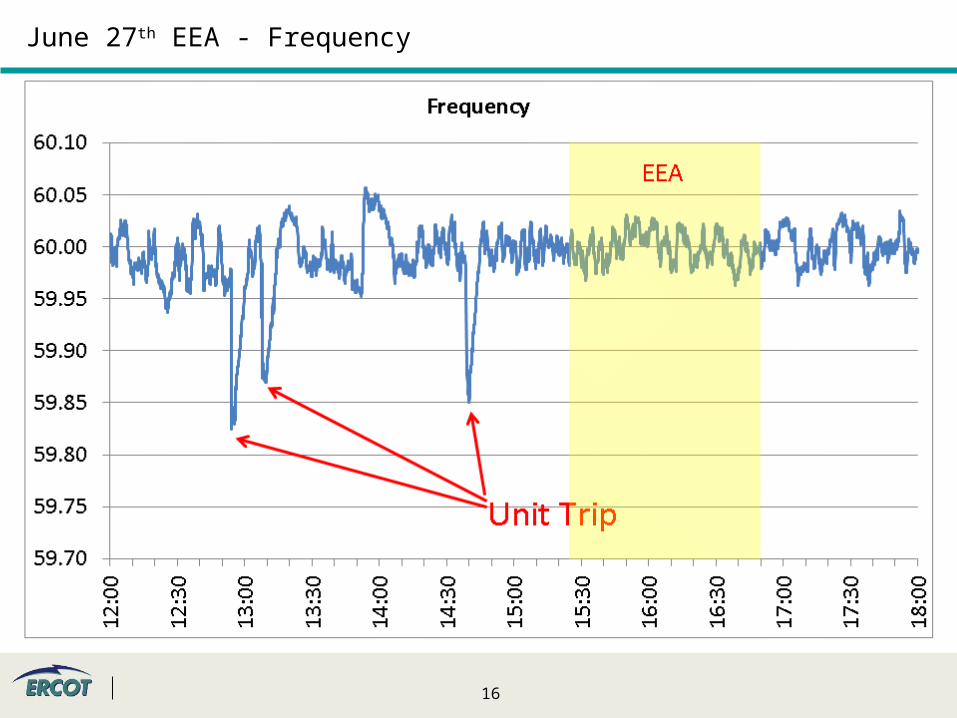
June 27th EEA - Frequency
17
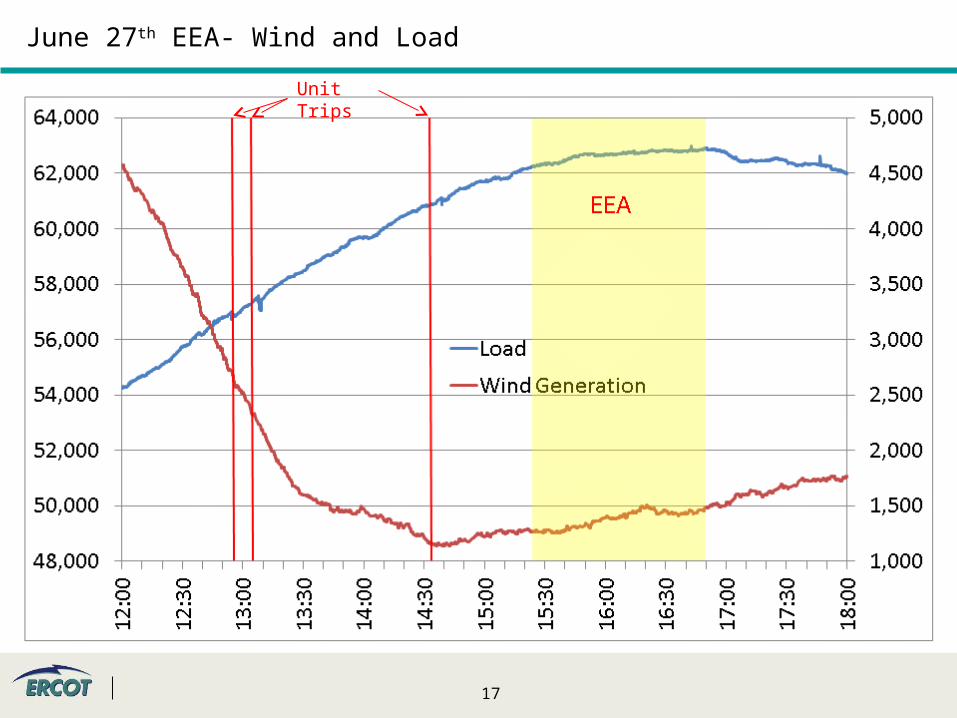
June 27th EEA- Wind and Load
Unit Trips
18
June 27th EEA – Physical Responsive Capability
August 2011Sunday Monday Tuesday Wednesday Thursday Friday Saturday
31 1 2
EEA 13
EEA 14
EEA 2B5
EEA 16
7 8 9 10 11 12 13
14 15 16 17 18 19 20
21 22 23
EEA 124
EEA 2A25 26 27
28 29 30 31 1 2 3
20
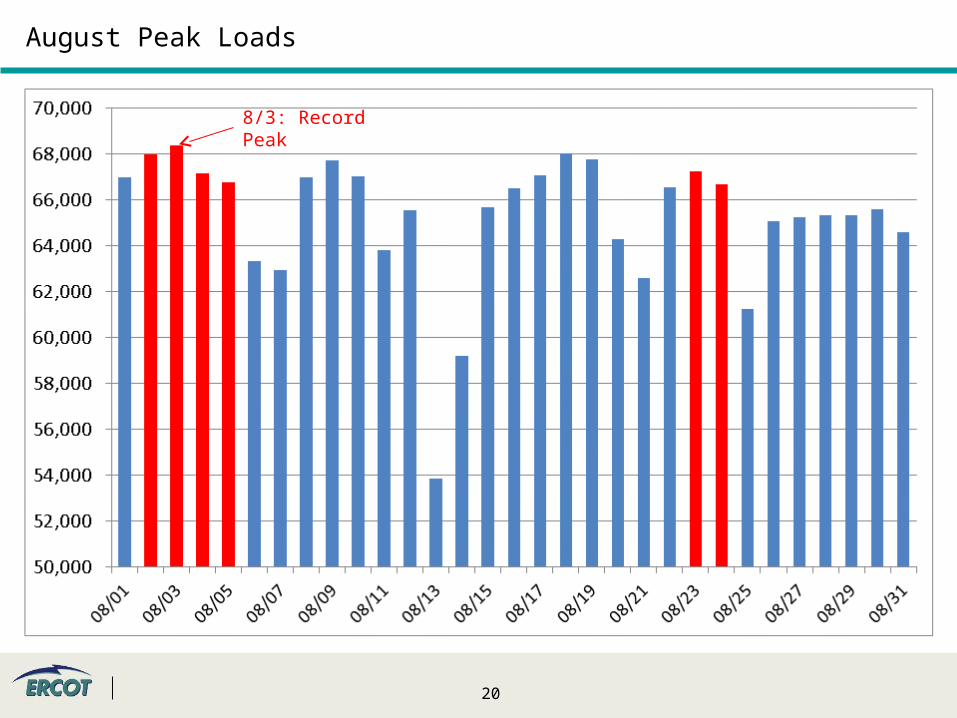
August Peak Loads
8/3: Record Peak
21
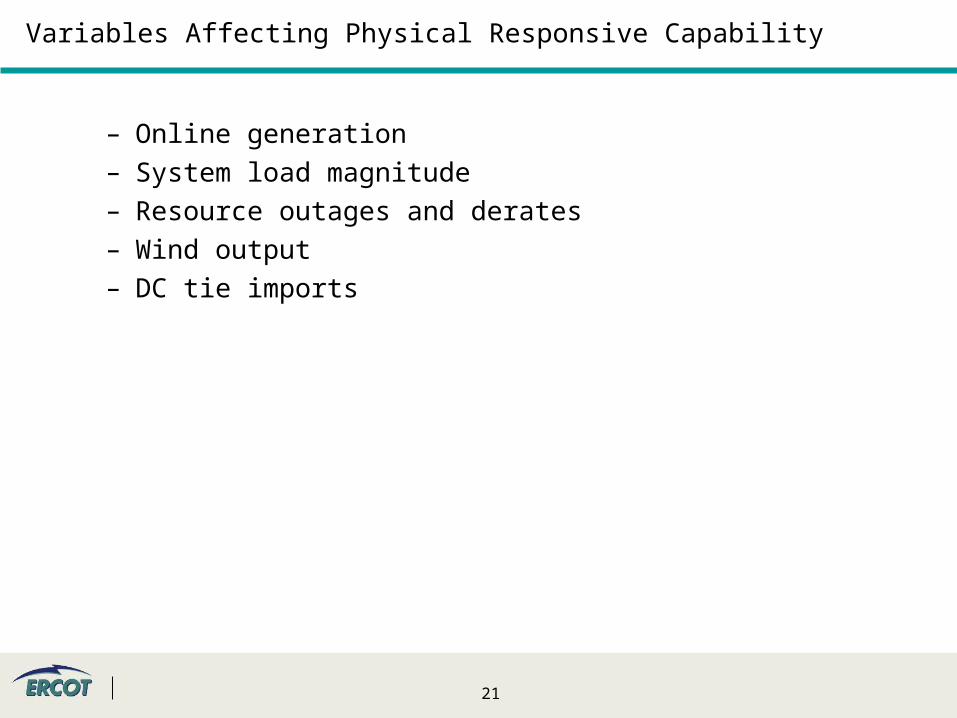
Variables Affecting Physical Responsive Capability
– Online generation– System load magnitude– Resource outages and derates– Wind output– DC tie imports
22
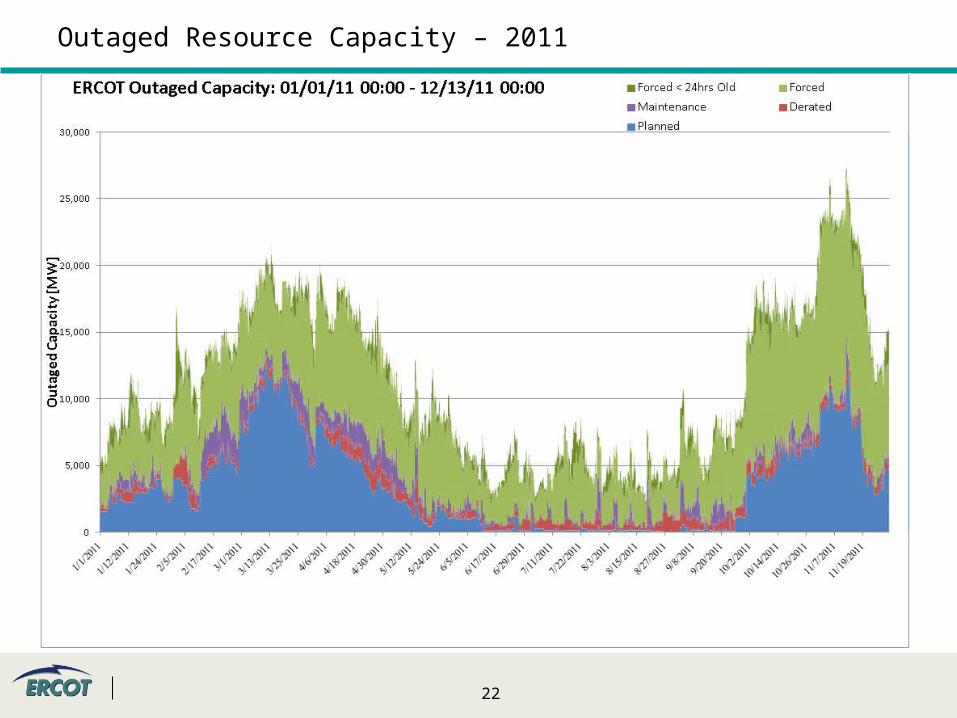
Outaged Resource Capacity – 2011
23
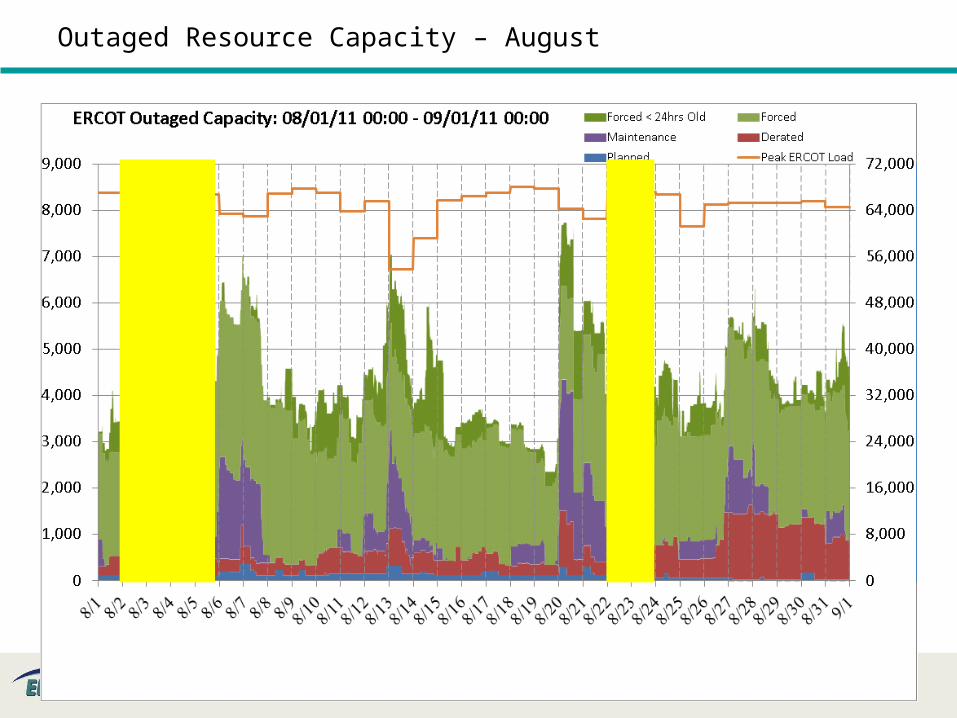
Outaged Resource Capacity – August
24
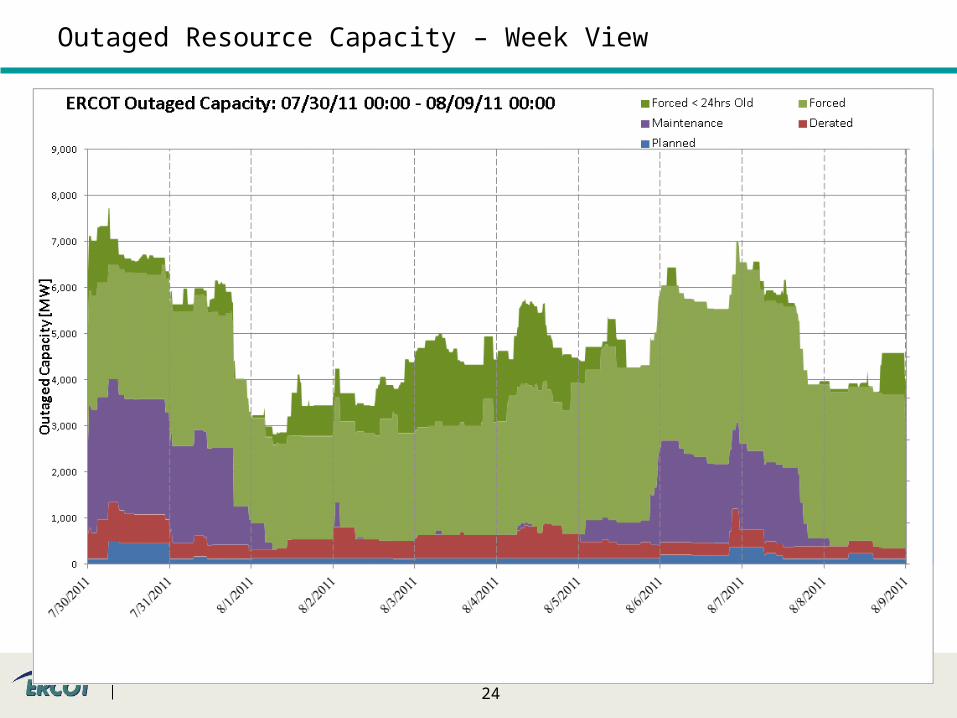
Outaged Resource Capacity – Week View
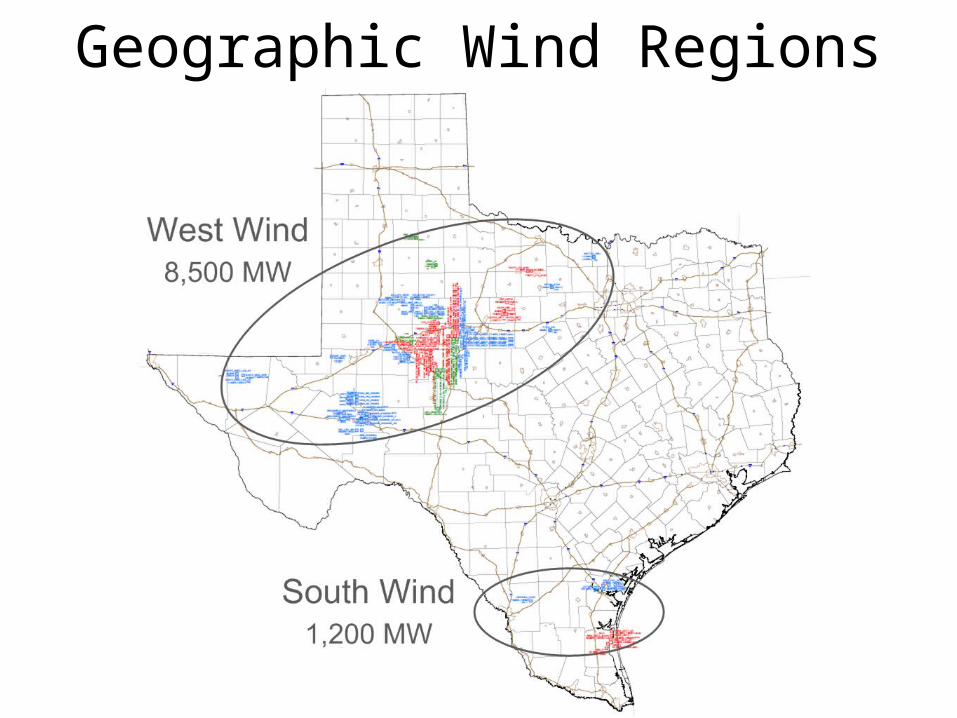
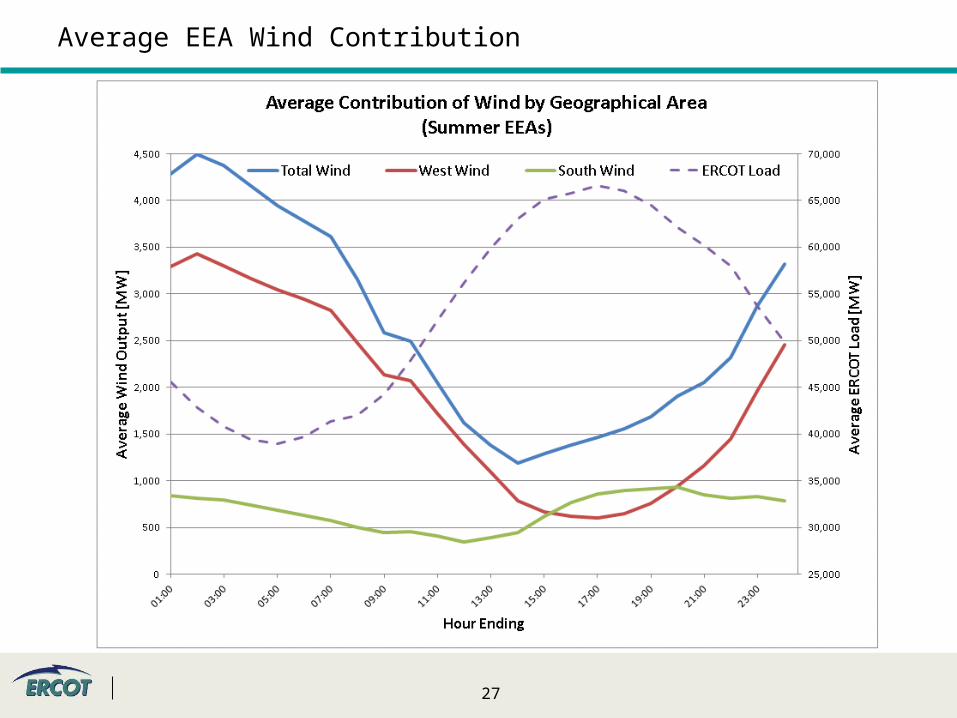
Geographic Wind Regions
26
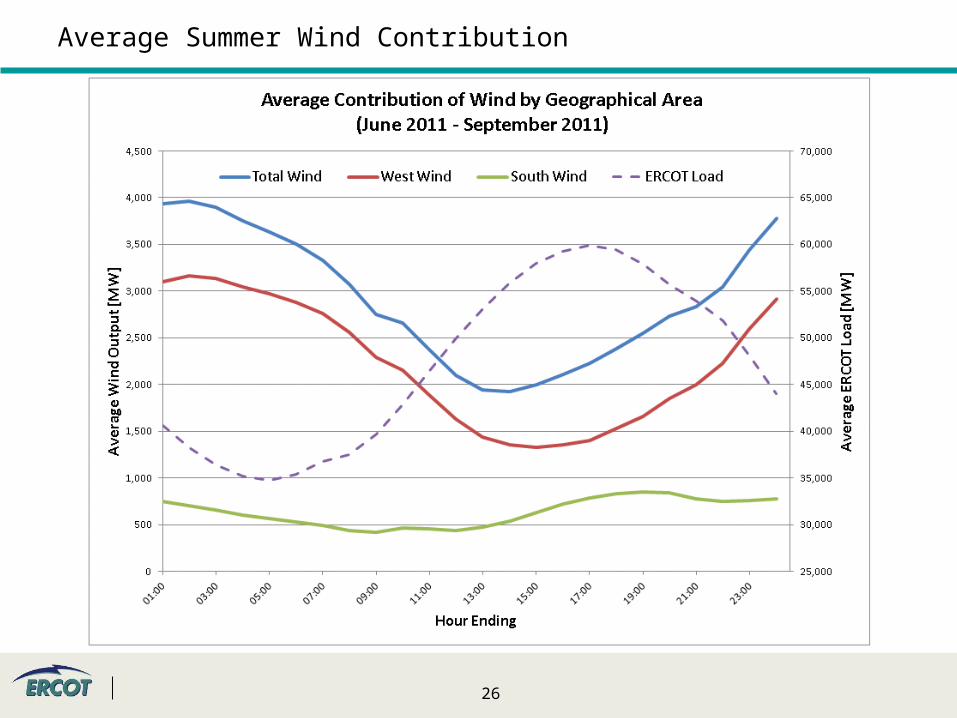
Average Summer Wind Contribution
27
Average EEA Wind Contribution
28
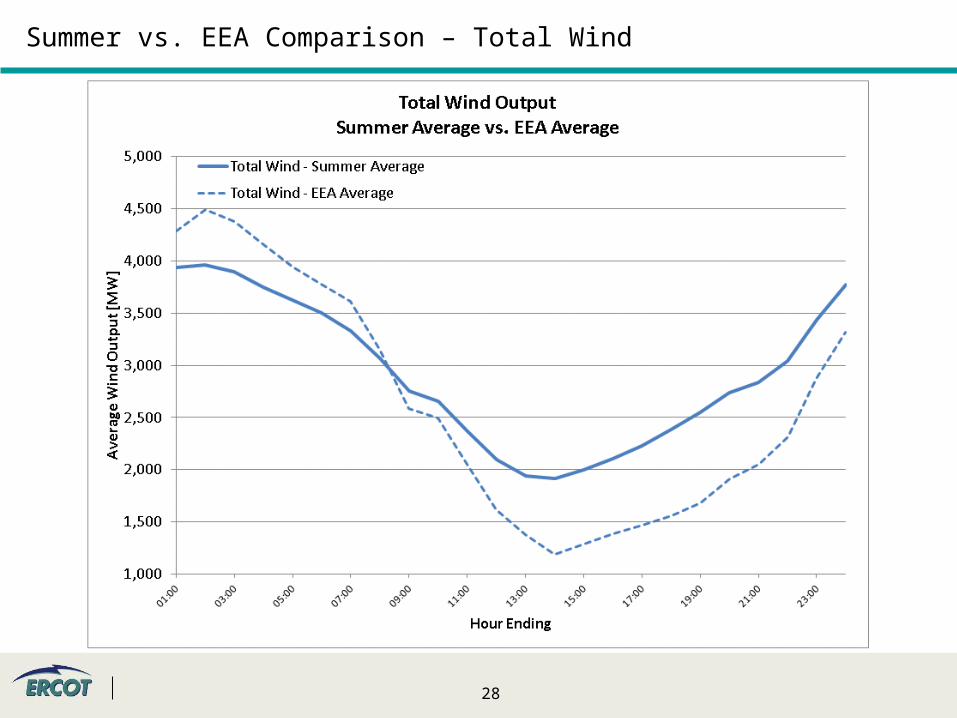
Summer vs. EEA Comparison – Total Wind
29
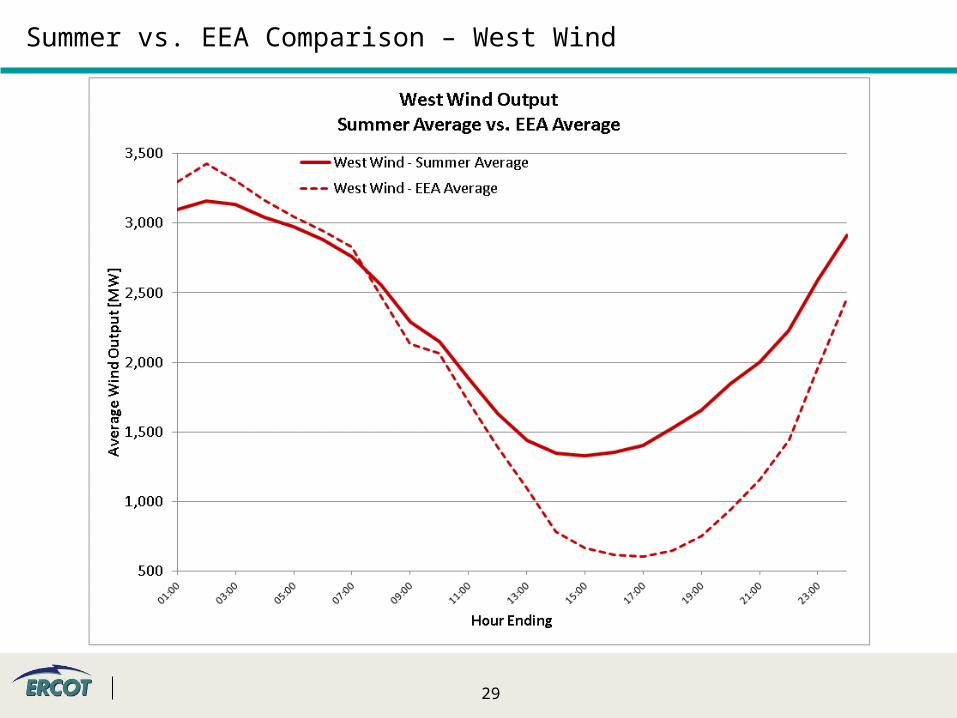
Summer vs. EEA Comparison – West Wind
30
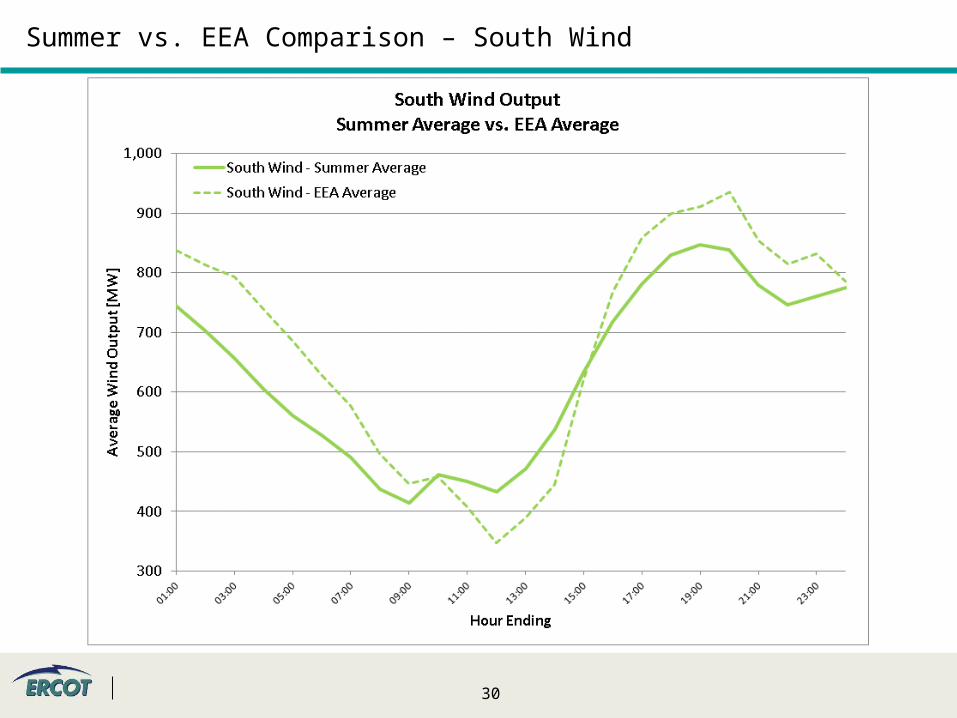
Summer vs. EEA Comparison – South Wind
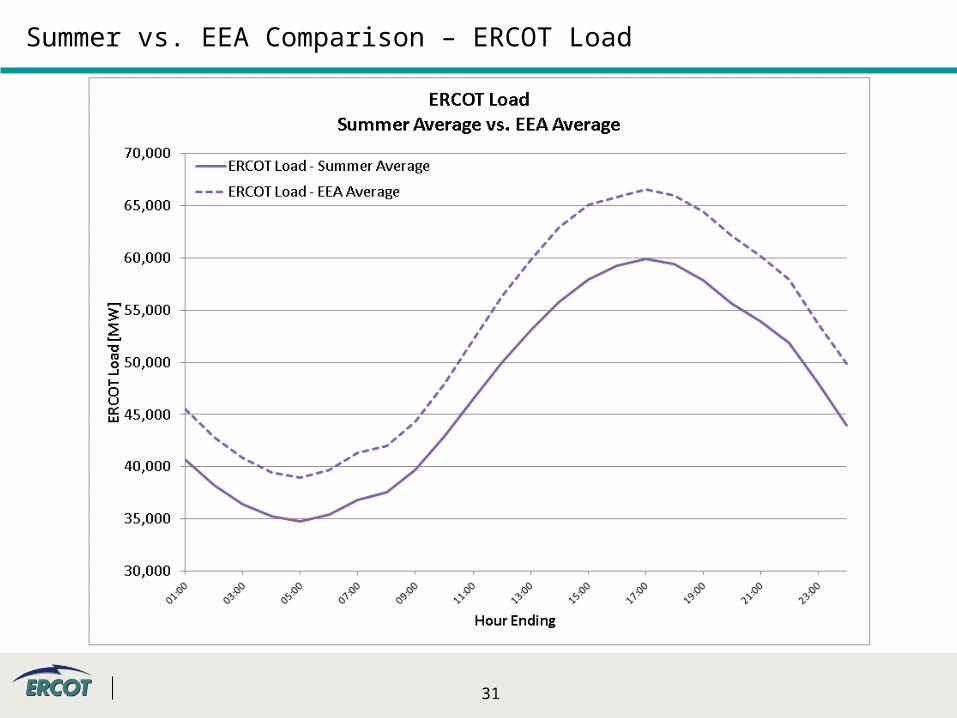
31
Summer vs. EEA Comparison – ERCOT Load
32
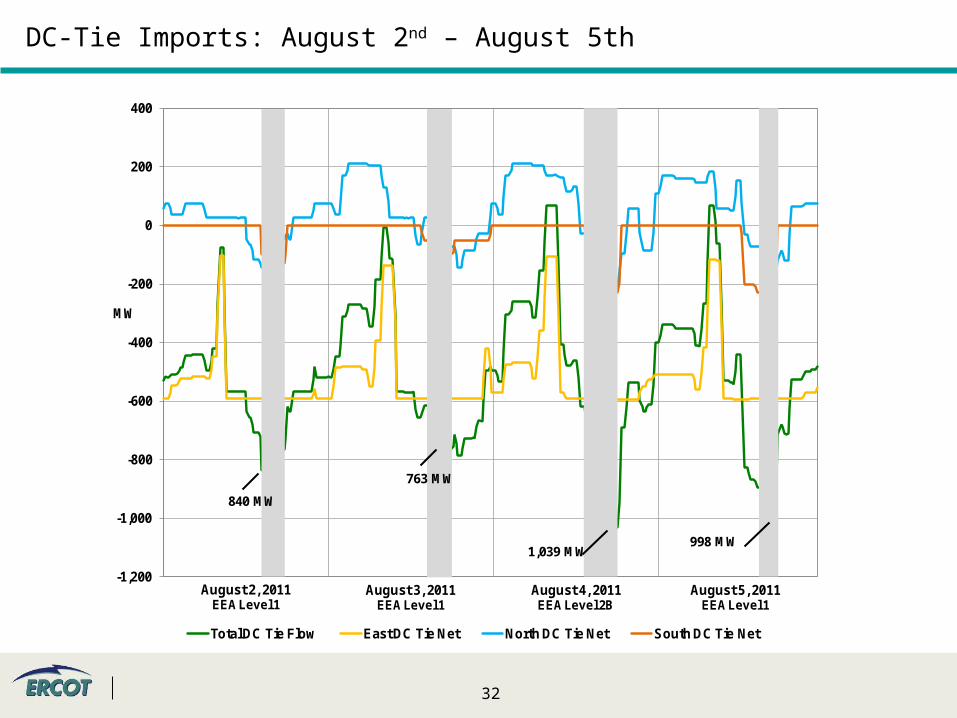
DC-Tie Imports: August 2nd – August 5th
-1,200
-1,000
-800
-600
-400
-200
0
200
400
MW
Total DC Tie Flow East DC Tie Net North DC Tie Net South DC Tie Net
August 2, 2011EEA Level 1
August 3, 2011EEA Level 1
August 4, 2011EEA Level 2B
August 5, 2011EEA Level 1
840 MW
763 MW
1,039 MW998 MW
Load Resources and EILS deployed
August 4th EEA Level 2B
34
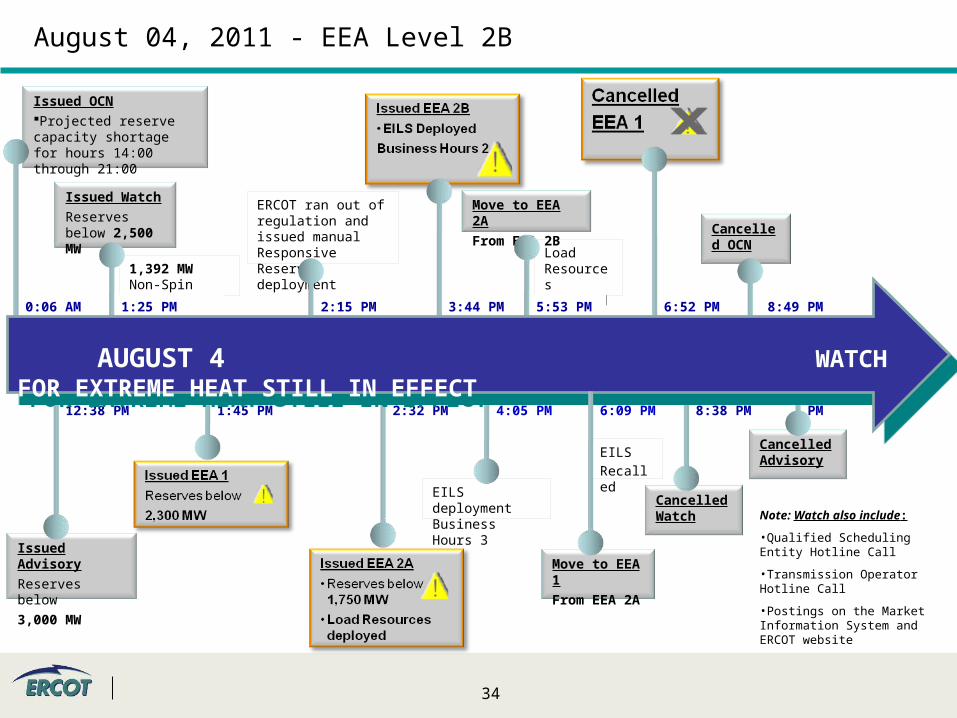
1,392 MW Non-Spin deployed
August 04, 2011 - EEA Level 2B
Issued Watch
Reserves below 2,500 MW
1:25 PM
Cancelled Advisory
10:17 PM
Note: Watch also include:
•Qualified Scheduling Entity Hotline Call
•Transmission Operator Hotline Call
•Postings on the Market Information System and ERCOT website
Cancelled Watch
Issued OCNProjected reserve capacity shortage for hours 14:00 through 21:00
0:06 AM
12:38 PM
Issued Advisory
Reserves below
3,000 MW
2:32 PM 6:09 PM
Cancelled OCN
ERCOT ran out of regulation and issued manual Responsive Reserve deployment
2:15 PM
8:38 PM
3:44 PM
Load Resources Recalled
Move to EEA 2A
From EEA 2B
Move to EEA 1
From EEA 2A
5:53 PM 6:52 PM 8:49 PM
1:45 PM
EILS
Recalled
4:05 PM
EILS deployment Business Hours 3
AUGUST 4 WATCH FOR EXTREME HEAT STILL IN EFFECT
AUGUST 4 WATCH FOR EXTREME HEAT STILL IN EFFECT
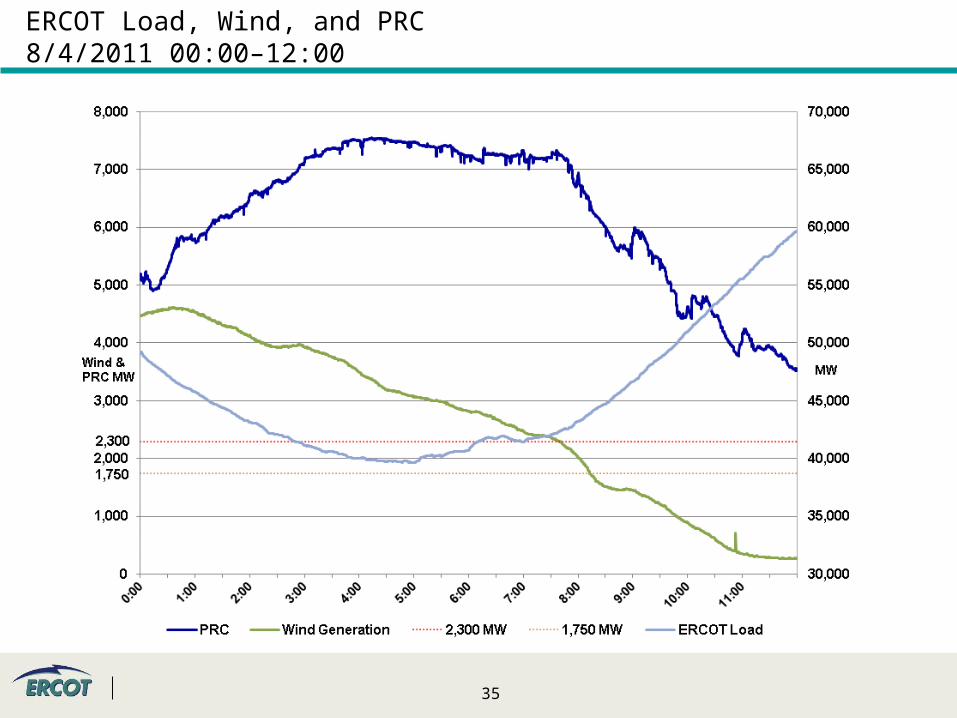
35
ERCOT Load, Wind, and PRC8/4/2011 00:00–12:00
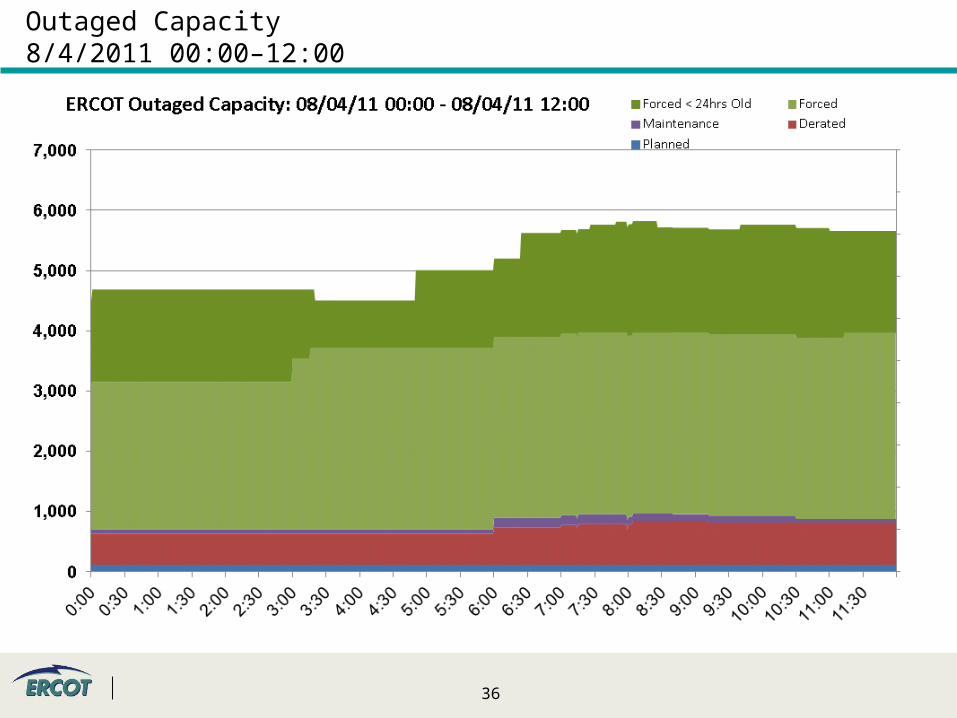
36
Outaged Capacity8/4/2011 00:00–12:00
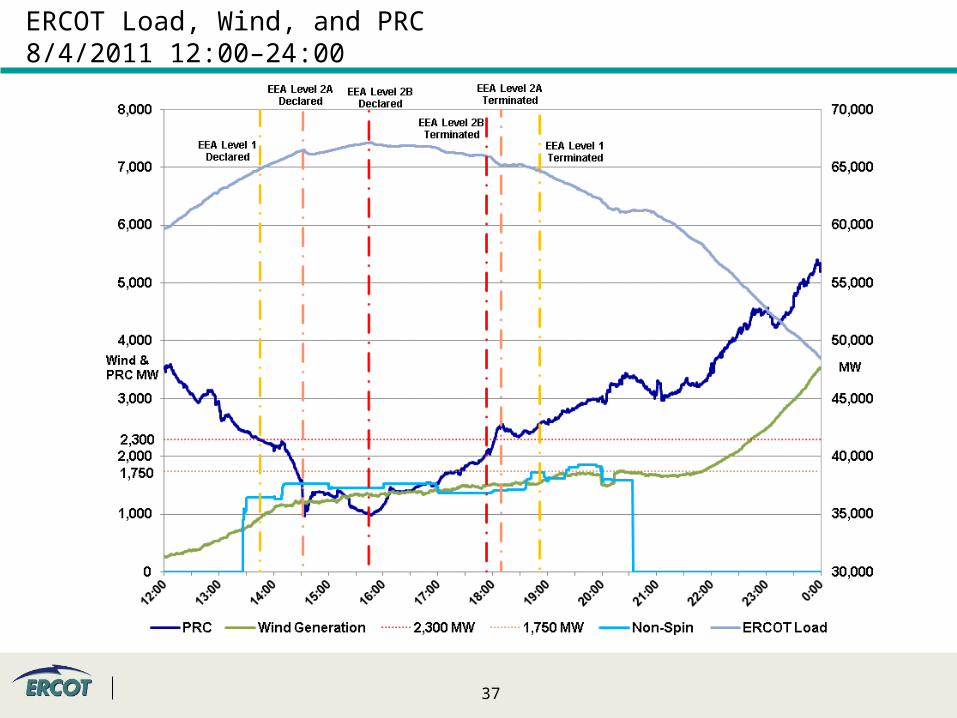
37
ERCOT Load, Wind, and PRC8/4/2011 12:00–24:00
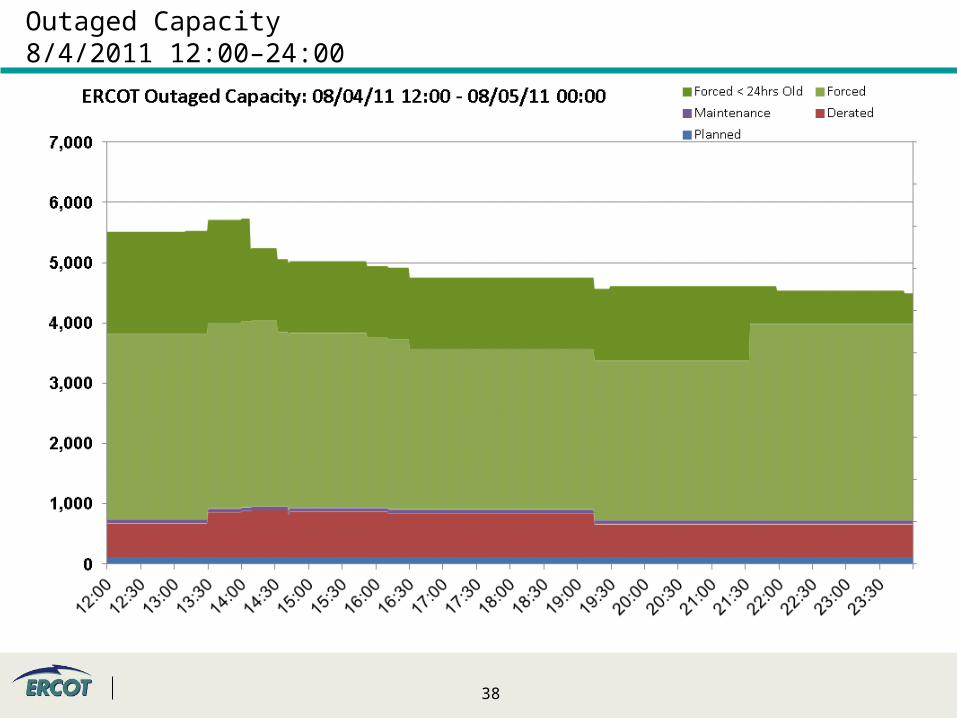
38
Outaged Capacity8/4/2011 12:00–24:00
39
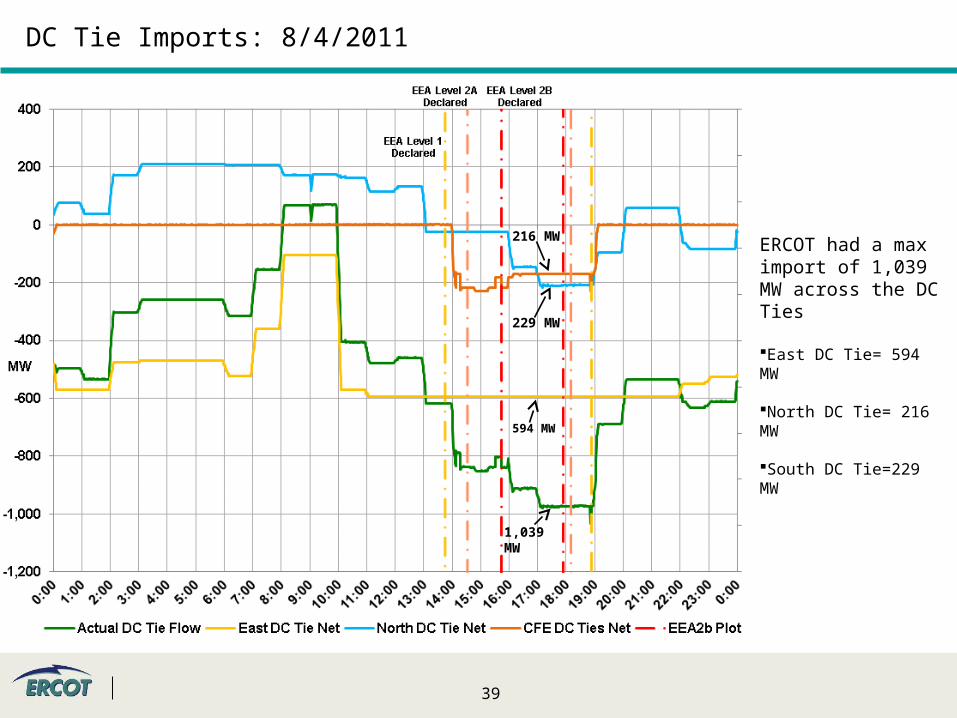
1,039 MW
594 MW
229 MW
216 MW ERCOT had a max import of 1,039 MW across the DC Ties
East DC Tie= 594 MW
North DC Tie= 216 MW South DC Tie=229 MW
DC Tie Imports: 8/4/2011
40
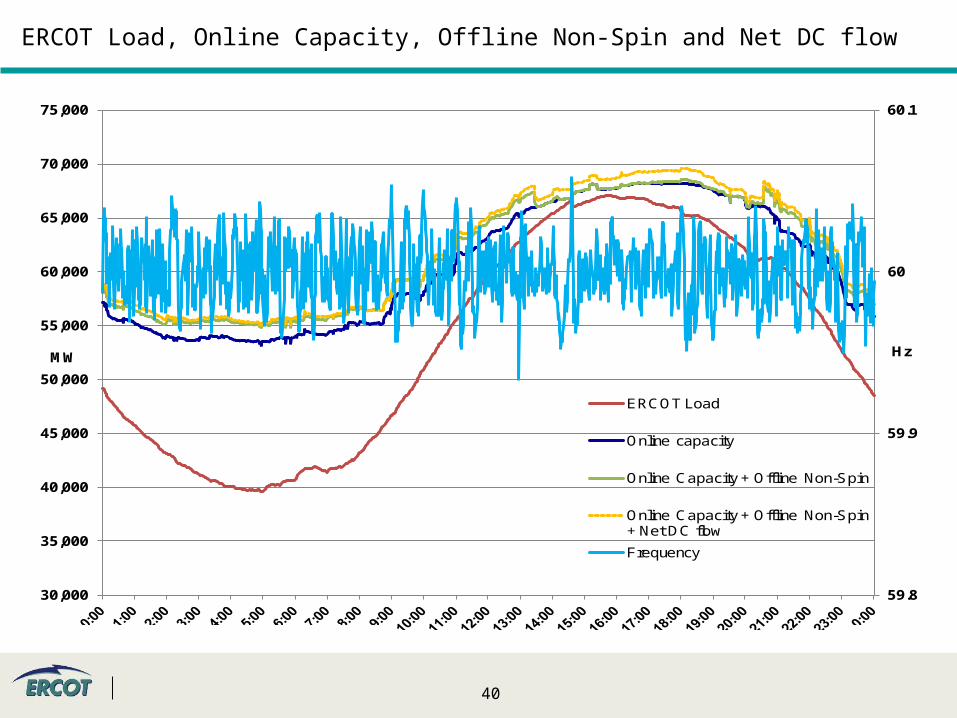
ERCOT Load, Online Capacity, Offline Non-Spin and Net DC flow
59.8
59.9
60
60.1
30,000
35,000
40,000
45,000
50,000
55,000
60,000
65,000
70,000
75,000
HzMW
ERCOT Load
Online capacity
Online Capacity + Offline Non-Spin
Online Capacity + Offline Non-Spin + Net DC flow
Frequency

41
Summer 2012 Outlook
42
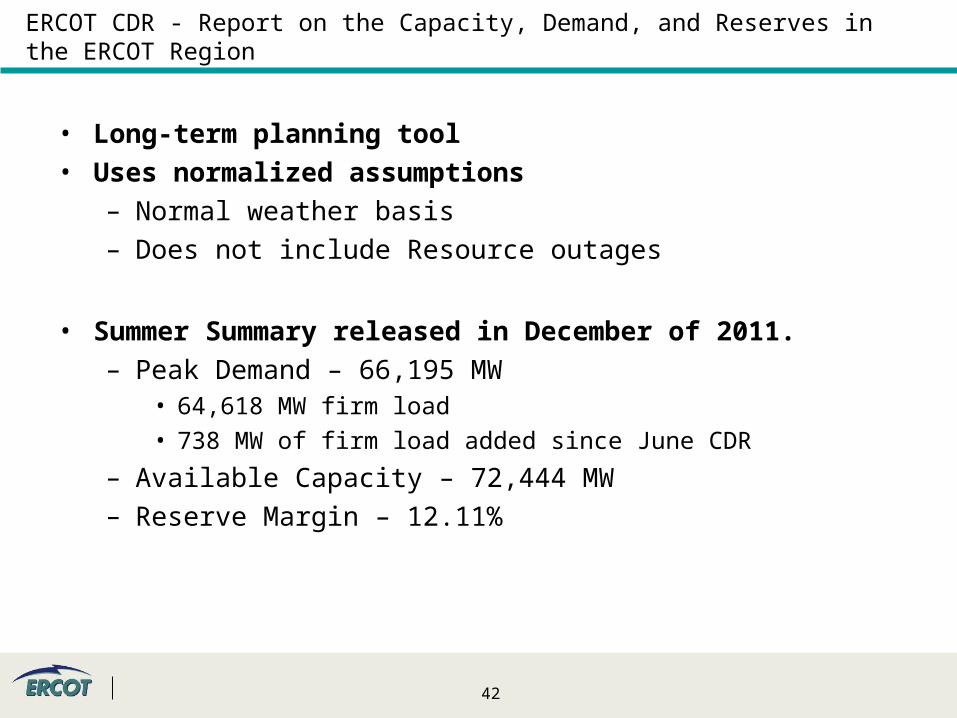
ERCOT CDR - Report on the Capacity, Demand, and Reserves in the ERCOT Region
• Long-term planning tool• Uses normalized assumptions
– Normal weather basis– Does not include Resource outages
• Summer Summary released in December of 2011.– Peak Demand – 66,195 MW
• 64,618 MW firm load
• 738 MW of firm load added since June CDR
– Available Capacity – 72,444 MW– Reserve Margin – 12.11%
43
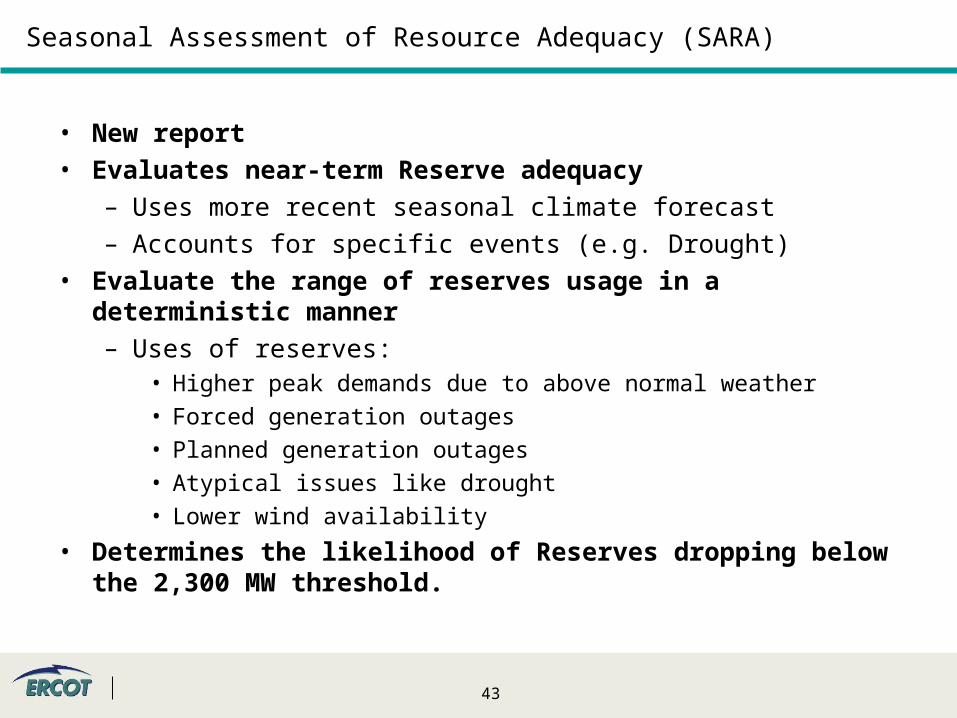
Seasonal Assessment of Resource Adequacy (SARA)
• New report• Evaluates near-term Reserve adequacy
– Uses more recent seasonal climate forecast– Accounts for specific events (e.g. Drought)
• Evaluate the range of reserves usage in a deterministic manner– Uses of reserves:
• Higher peak demands due to above normal weather
• Forced generation outages
• Planned generation outages
• Atypical issues like drought
• Lower wind availability
• Determines the likelihood of Reserves dropping below the 2,300 MW threshold.
44
Emergency Interruptible Load Service (EILS)
• Proposed Changes– Allow Distributed Generation and unregistered generation to
participate• New capacity
– Remove the 1 MW minimum offer• Improve QSE flexibility
• Increase participation
– Explore the possibility of a 30-min product• Increase participation

Questions?