Embed Size (px)
Citation preview

ERCOT Monthly Operational Overview (January 2016) ERCOT Public February 15, 2016

Grid Planning & Operations

PUBLIC
Summary – January 2016
Operations • The peak demand of 49,279 MW on January 11th was less than the day-ahead mid-
term forecast peak of 49,764 MW of the same operating period. In addition, it was less than the January 2015 actual peak demand of 56,764 MW. The instantaneous peak load on January 11th was 49,801 MW.
• Day-ahead load forecast error for January was 3.22% • ERCOT issued two notifications
– Two advisories due to Physically Responsive Capability being less than 3,000 MW.
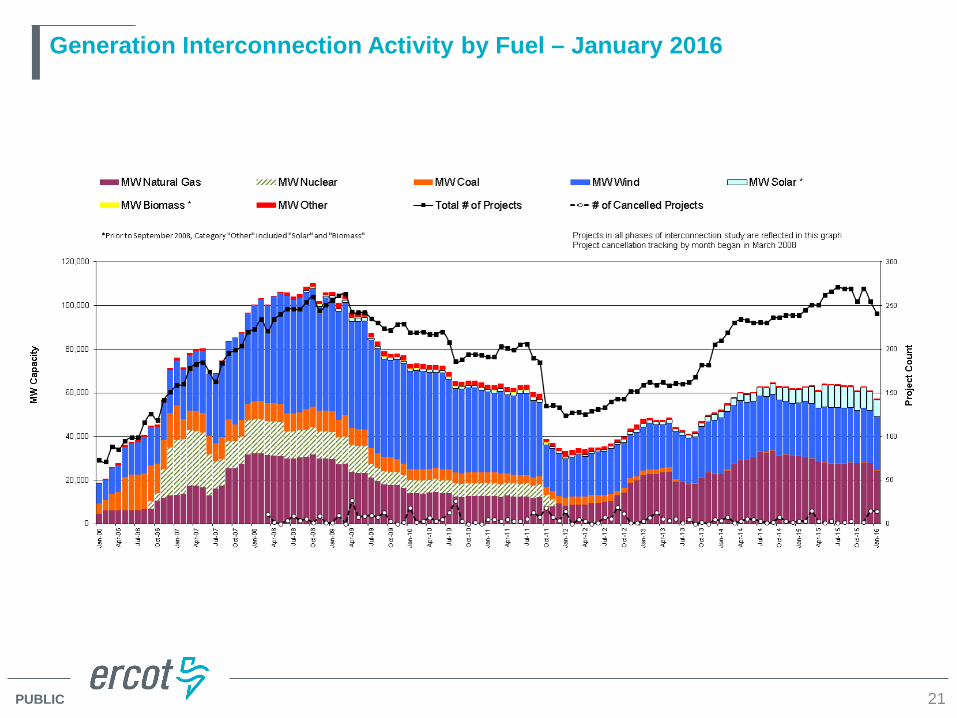
Planning Activities • 241 active generation interconnection requests totaling 57,422 MW, including 24,472
MW of wind generation, as of January 31, 2016. Fourteen fewer requests and a decrease of 3,722 MW from December 31, 2015.
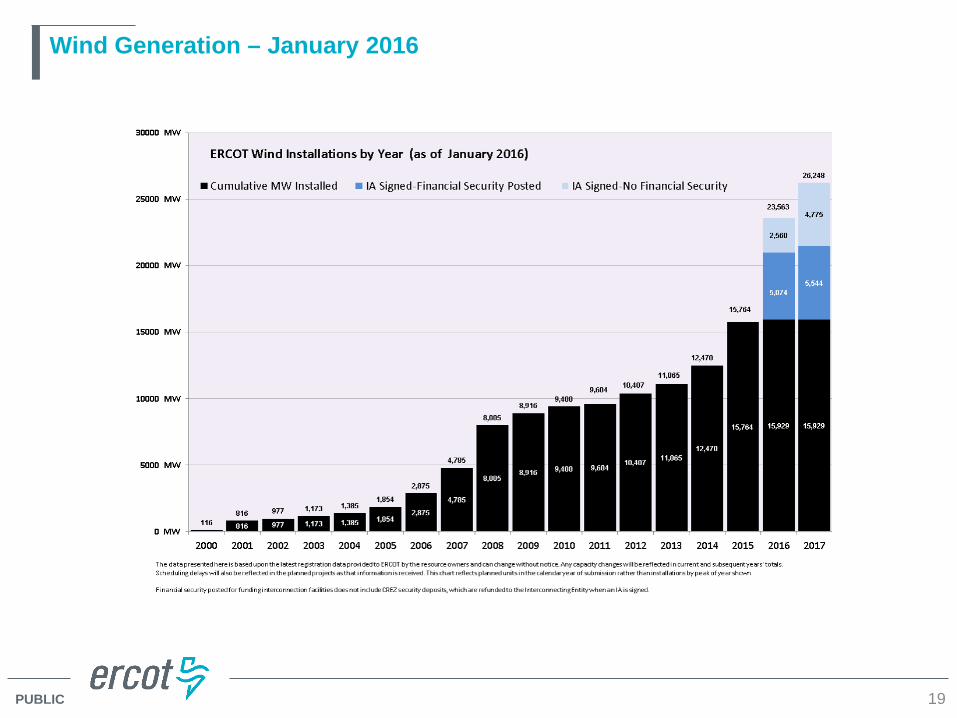
• 15,929 MW wind capacity in commercial operations on January 31, 2016.
3
PUBLIC
Daily Peak Demand: Hourly Average Actual vs. Forecast, Wind Day-Ahead COPs, & On-Line Capacity at Peak – January 2016
4
PUBLIC
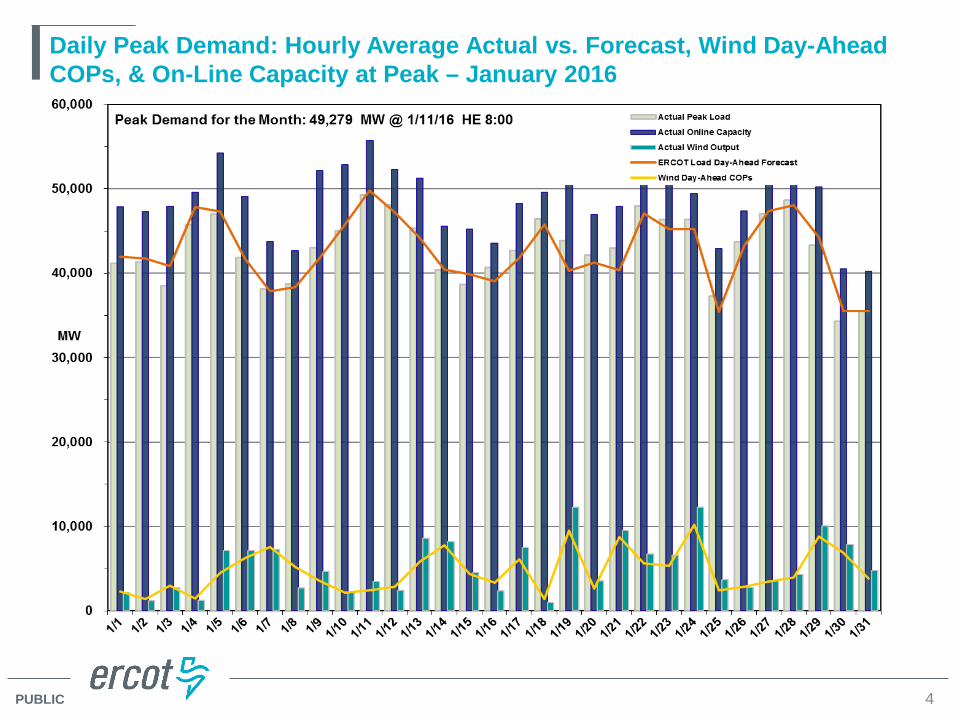
Actual Wind Output plus Curtailments vs. Wind Day-Ahead COPs for All Hours – January 2016
5
% of Hours when Estimated Uncurtailed Wind Output >= COP HSLs (Target = 50%)
62%
PUBLIC
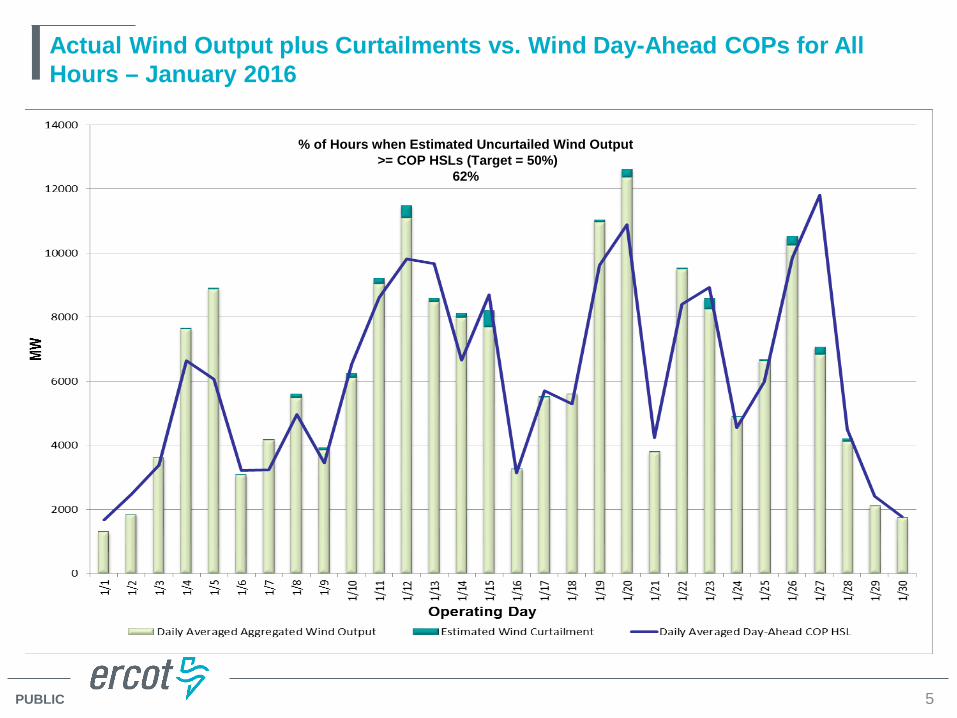
ERCOT’s CPS1 Monthly Performance – January 2016
6
CPS1 12 Month Rolling Average = 174.84%

PUBLIC
Monthly Peak Actual Demand – January 2016
7

PUBLIC
Monthly Minimum Actual Demand – January 2016
8
PUBLIC
Day-Ahead Load Forecast Performance – January 2016
9
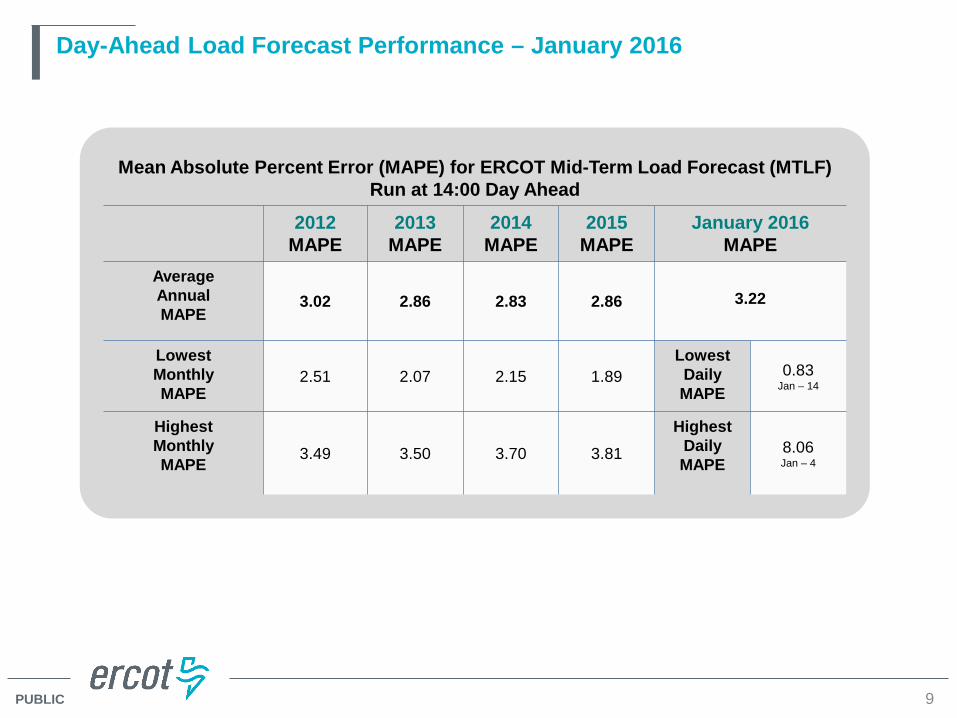
Mean Absolute Percent Error (MAPE) for ERCOT Mid-Term Load Forecast (MTLF) Run at 14:00 Day Ahead
2012 MAPE
2013 MAPE
2014 MAPE
2015 MAPE
January 2016 MAPE
Average Annual MAPE
3.02 2.86 2.83 2.86
3.22
Lowest Monthly MAPE
2.51 2.07 2.15 1.89 Lowest Daily MAPE
0.83 Jan – 14
Highest Monthly MAPE
3.49 3.50 3.70 3.81
Highest Daily MAPE
8.06 Jan – 4
PUBLIC
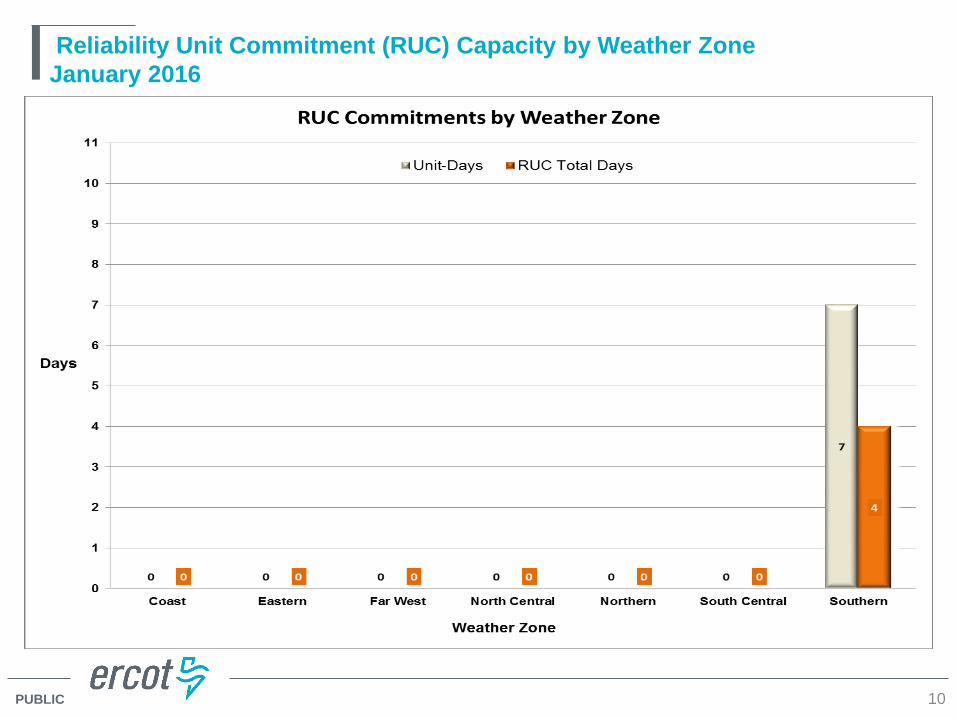
Reliability Unit Commitment (RUC) Capacity by Weather Zone January 2016
10
PUBLIC
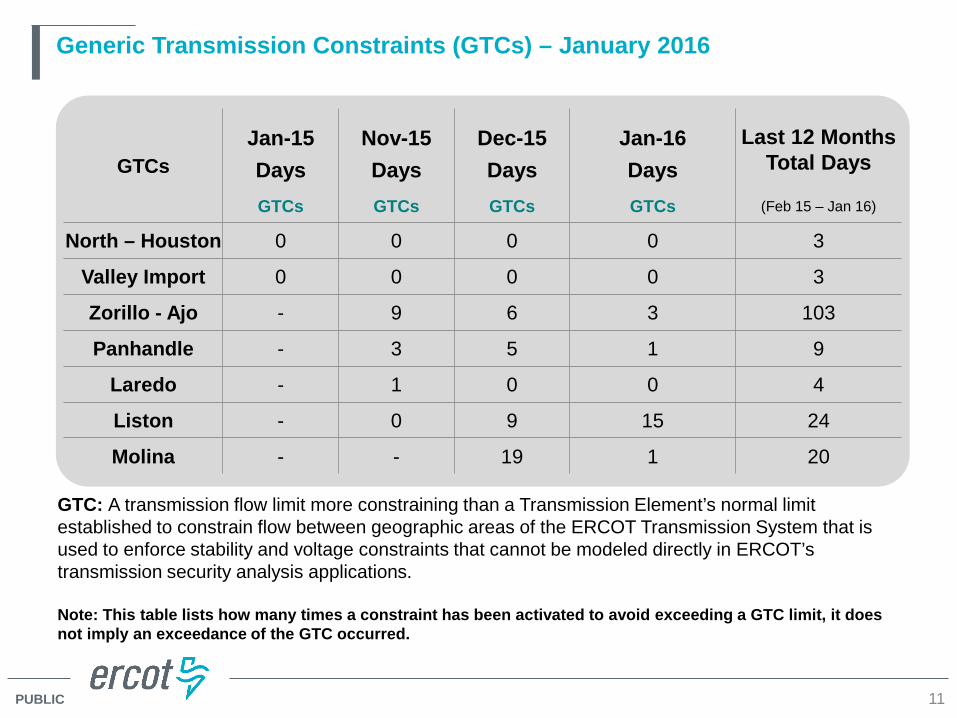
Generic Transmission Constraints (GTCs) – January 2016
11
GTC: A transmission flow limit more constraining than a Transmission Element’s normal limit established to constrain flow between geographic areas of the ERCOT Transmission System that is used to enforce stability and voltage constraints that cannot be modeled directly in ERCOT’s transmission security analysis applications. Note: This table lists how many times a constraint has been activated to avoid exceeding a GTC limit, it does not imply an exceedance of the GTC occurred.
GTCs Jan-15 Nov-15 Dec-15 Jan-16 Last 12 Months
Total Days Days Days Days Days GTCs GTCs GTCs GTCs (Feb 15 – Jan 16)
North – Houston 0 0 0 0 3
Valley Import 0 0 0 0 3
Zorillo - Ajo - 9 6 3 103
Panhandle - 3 5 1 9
Laredo - 1 0 0 4
Liston - 0 9 15 24
Molina - - 19 1 20

PUBLIC
Advisories and Watches – January 2016
12
• Two advisories issued due to Physically Responsive Capability being less than 3,000 MW.
– Issued on 1/18/16 – Issued on 1/21/16
PUBLIC
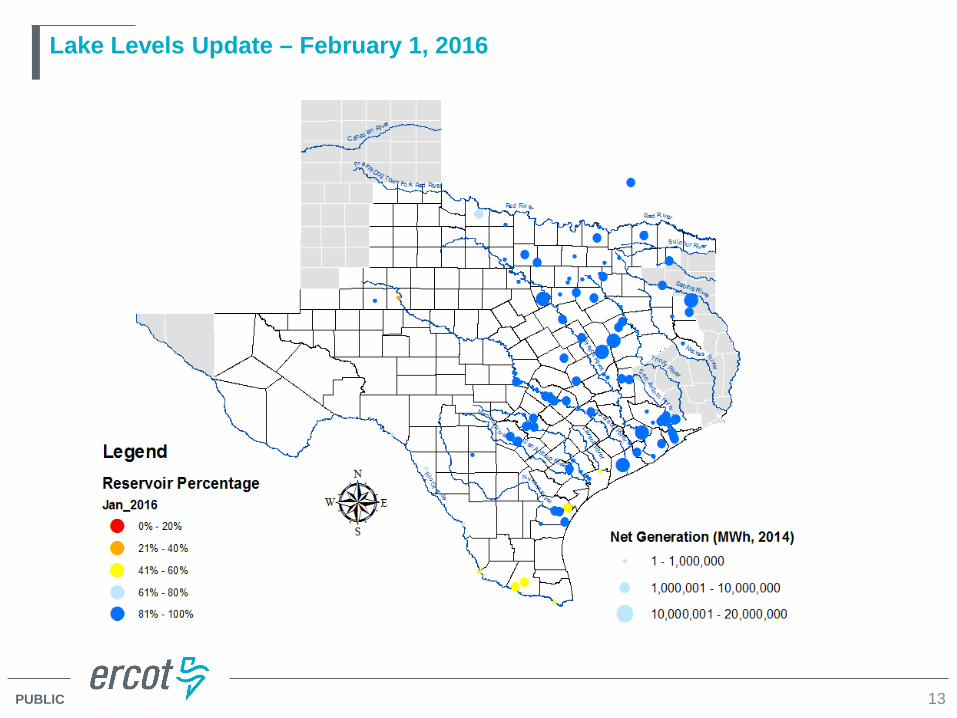
Lake Levels Update – February 1, 2016
13
PUBLIC
Planning Summary – January 2016
14
• ERCOT is currently tracking 241 active generation interconnection requests totaling 57,422 MW. This includes 24,472 MW of wind generation.
• ERCOT is currently reviewing proposed transmission improvements with a total
cost of more than $1.1 Billion.
• Transmission Projects endorsed in 2016 total $18 Million.
• All projects (in engineering, routing, licensing, and construction) total approximately $6.74 Billion.
• Transmission Projects energized in 2015 total about $652.9 Million.
PUBLIC
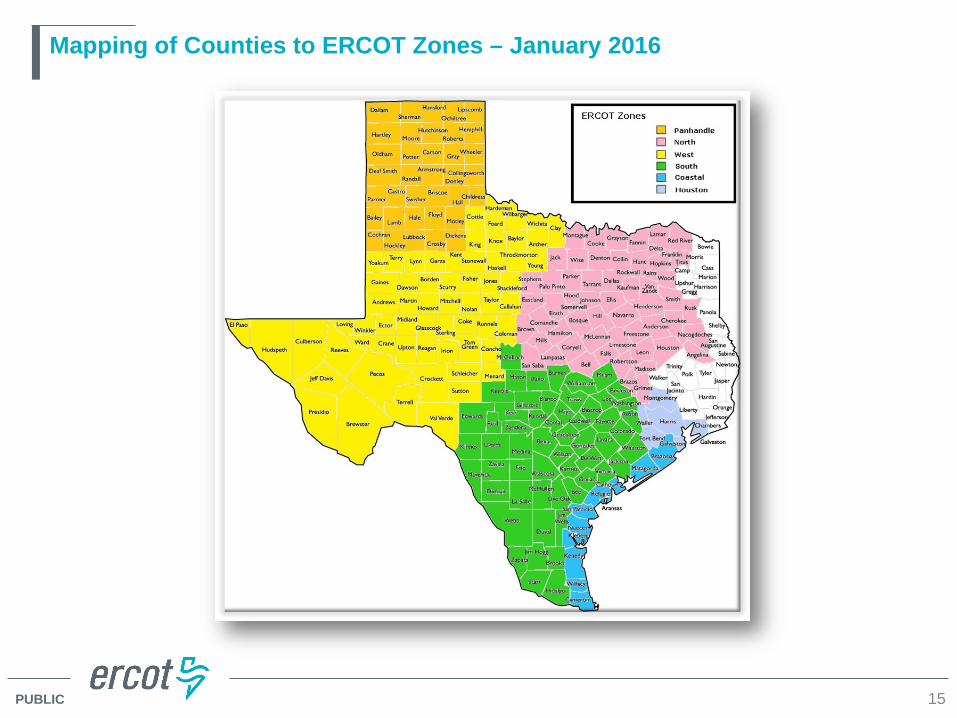
Mapping of Counties to ERCOT Zones – January 2016
15
PUBLIC
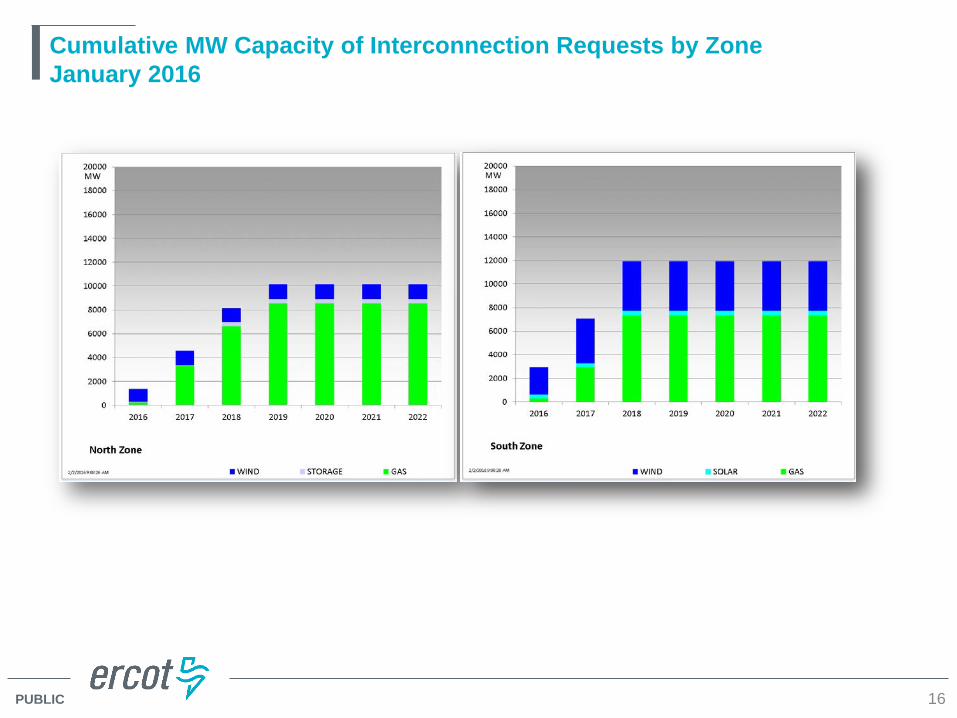
Cumulative MW Capacity of Interconnection Requests by Zone January 2016
16
PUBLIC
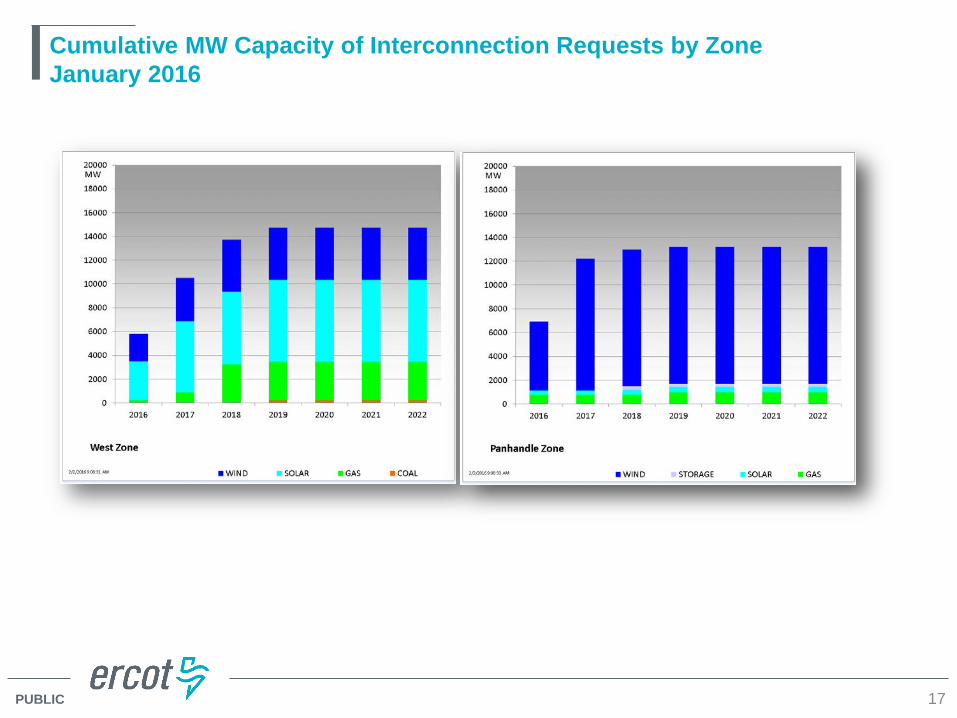
Cumulative MW Capacity of Interconnection Requests by Zone January 2016
17

PUBLIC
Cumulative MW Capacity of Interconnection Requests by Zone January 2016
18
PUBLIC
Wind Generation – January 2016
19

PUBLIC
Solar Generation – January 2016
20
PUBLIC
Generation Interconnection Activity by Fuel – January 2016
21

PUBLIC
Generation Interconnection Activity by Project Phase – January 2016
22

Market Operations
PUBLIC
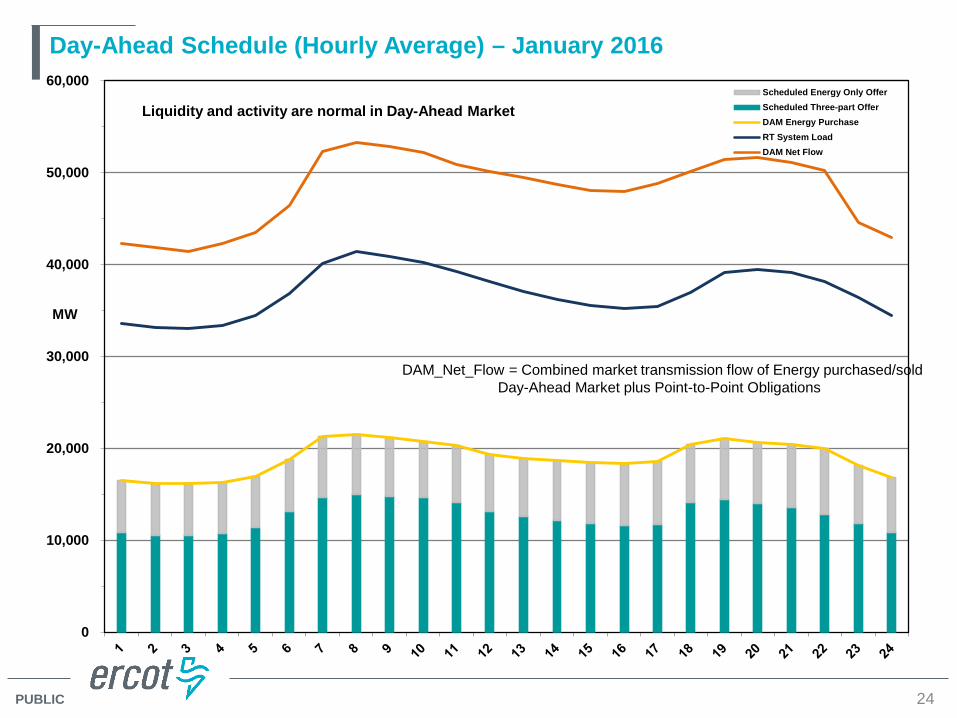
Day-Ahead Schedule (Hourly Average) – January 2016
0
10,000
20,000
30,000
40,000
50,000
60,000
MW
Scheduled Energy Only OfferScheduled Three-part OfferDAM Energy PurchaseRT System LoadDAM Net Flow
Liquidity and activity are normal in Day-Ahead Market
DAM_Net_Flow = Combined market transmission flow of Energy purchased/sold Day-Ahead Market plus Point-to-Point Obligations
24
PUBLIC
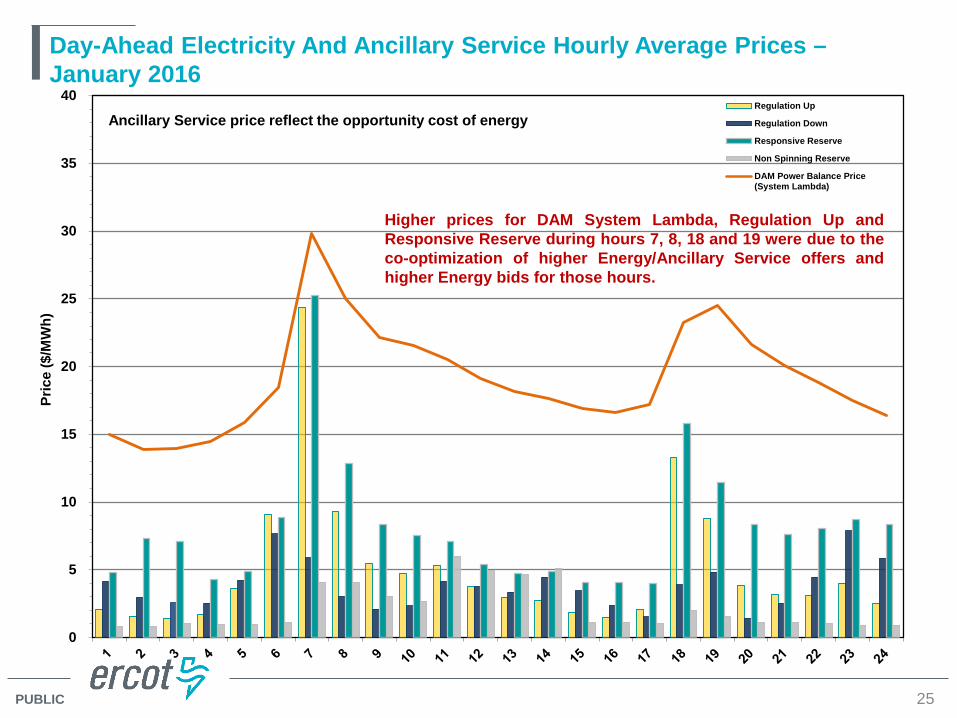
Day-Ahead Electricity And Ancillary Service Hourly Average Prices – January 2016
0
5
10
15
20
25
30
35
40
Pric
e ($
/MW
h)
Regulation Up
Regulation Down
Responsive Reserve
Non Spinning Reserve
DAM Power Balance Price(System Lambda)
Ancillary Service price reflect the opportunity cost of energy
Higher prices for DAM System Lambda, Regulation Up and Responsive Reserve during hours 7, 8, 18 and 19 were due to the co-optimization of higher Energy/Ancillary Service offers and higher Energy bids for those hours.
25

PUBLIC
Day-Ahead Vs Real-Time Load Zone SPP (Hourly Average) – January 2016
0
5
10
15
20
25
30
35
40
45
Pric
e ($
/MW
h)
RTSPP - LZ West
RTSPP - LZ North
RTSPP - LZ South
RTSPP - LZ Houston
DASPP - LZ West
DASPP - LZ North
DASPP - LZ South
DASPP - LZ Houston
Prices reflect relative transmission congestion and system scarcity • Higher Real-Time prices in Load Zone prices in hours 7 and 18 were mainly
due to quick load increase and/or low dispatchable capacity. • Higher Day-Ahead prices in hours 7, 8, 18 and 19 reflect hedging activities
against exposure to Real-Time prices. • Higher Real-Time prices in LZ_South during the afternoon/evening were
mainly due to high load and/or transmission outages in this load zone.
26

PUBLIC
Day-Ahead Vs Real-Time Hub Average SPP (Hourly Average) – January 2016
0
10
20
30
40
Pric
e ($
/MW
h)
RTSPP - Hub Average
DASPP - Hub AverageEnergy prices reflect the risk premium between Day-Ahead & Real-Time
Higher average Real-Time price for hour 18 was mainly due to quick load increase and/or low dispatchable capacity.
27

PUBLIC
DRUC Monthly Summary (Hourly Average) – January 2016
0
10,000
20,000
30,000
40,000
50,000
60,000
MW
h
Self Scheduled Capacity
Self Scheduled Ancillary Service Limit
Load Forecast
DRUC Recommended Capacity
31 executions (0 missed) 0 published after 1600 6 minutes average execution time 0 Resource Committed
28

PUBLIC
HRUC Monthly Summary and Real Time On-Line Reliability Deployment Price Adder (RTORDPA) (Hourly Average) – January 2016
0.00
0.01
0.01
0.02
0.02
0.03
0.03
0.04
0.04
0
200
400
600
800
1,000
RTO
RPA
($/M
Wh)
MW
h
744 executions (0 missed) 5 minute average execution time 3 Resources committed
Colors Indicate Individual Resources
29

PUBLIC
Non–Spinning Reserve Service Deployment – January 2016
Deployment Start Time Deployment End Time
Deployment Duration (Hours)
Max Deployment (MW) Reason
None
30

PUBLIC
CRR Price Convergence – January 2016
0
5
10
15
20
25
30
35
40
45
50
Mill
ions
$
Cost
Value
Congestion Revenue Right cost in auction convergence with payment in Day-Ahead Market and Real Time Market Note: Last month’s values are estimates and previous month’s values are based on settlement data
31
PUBLIC
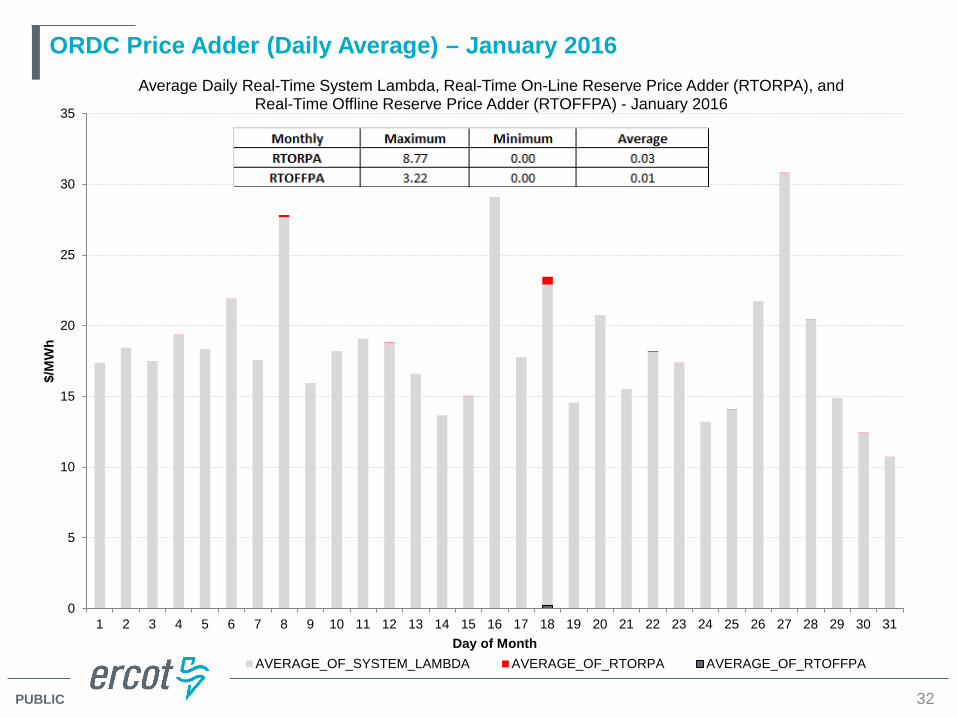
ORDC Price Adder (Daily Average) – January 2016
0
5
10
15
20
25
30
35
1 2 3 4 5 6 7 8 9 10 11 12 13 14 15 16 17 18 19 20 21 22 23 24 25 26 27 28 29 30 31
$/M
Wh
Day of Month
Average Daily Real-Time System Lambda, Real-Time On-Line Reserve Price Adder (RTORPA), and Real-Time Offline Reserve Price Adder (RTOFFPA) - January 2016
AVERAGE_OF_SYSTEM_LAMBDA AVERAGE_OF_RTORPA AVERAGE_OF_RTOFFPA
32
PUBLIC
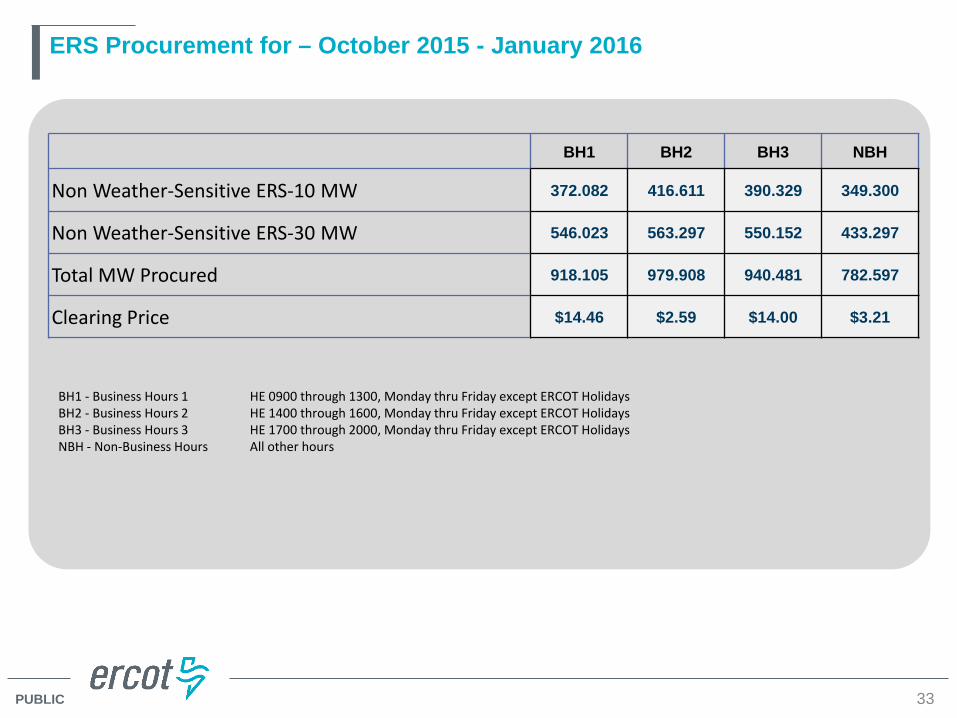
ERS Procurement for – October 2015 - January 2016
BH1 BH2 BH3 NBH
Non Weather-Sensitive ERS-10 MW 372.082 416.611 390.329 349.300
Non Weather-Sensitive ERS-30 MW 546.023 563.297 550.152 433.297
Total MW Procured 918.105 979.908 940.481 782.597
Clearing Price $14.46 $2.59 $14.00 $3.21
BH1 - Business Hours 1 HE 0900 through 1300, Monday thru Friday except ERCOT Holidays BH2 - Business Hours 2 HE 1400 through 1600, Monday thru Friday except ERCOT Holidays BH3 - Business Hours 3 HE 1700 through 2000, Monday thru Friday except ERCOT Holidays NBH - Non-Business Hours All other hours
33
PUBLIC
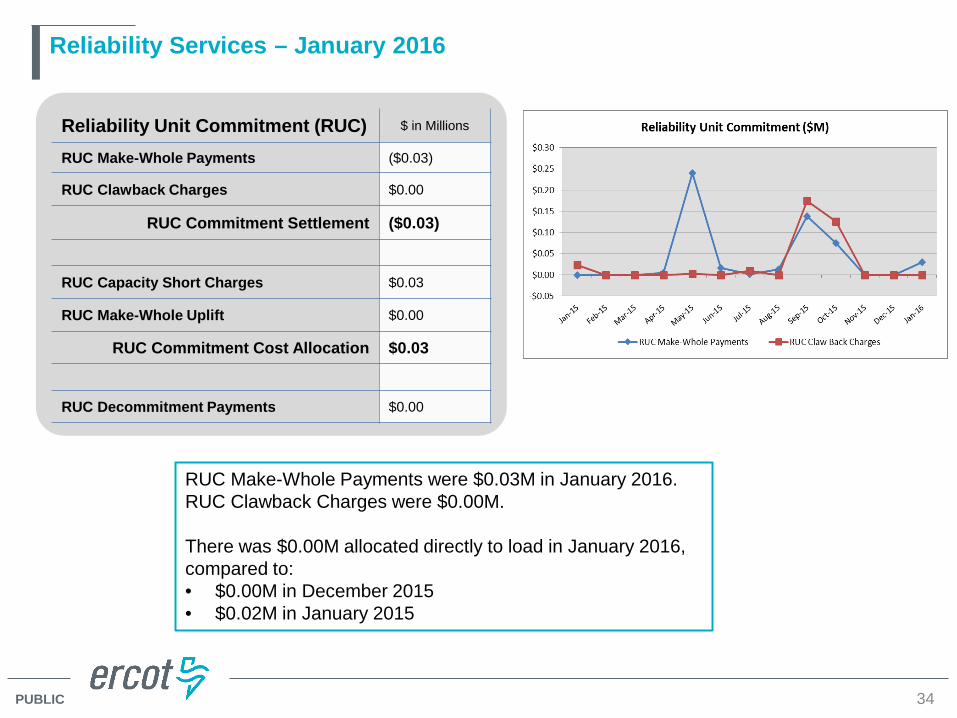
Reliability Services – January 2016
Reliability Unit Commitment (RUC) $ in Millions
RUC Make-Whole Payments ($0.03)
RUC Clawback Charges $0.00
RUC Commitment Settlement ($0.03)
RUC Capacity Short Charges $0.03
RUC Make-Whole Uplift $0.00
RUC Commitment Cost Allocation $0.03
RUC Decommitment Payments $0.00
RUC Make-Whole Payments were $0.03M in January 2016. RUC Clawback Charges were $0.00M. There was $0.00M allocated directly to load in January 2016, compared to: • $0.00M in December 2015 • $0.02M in January 2015
34
PUBLIC
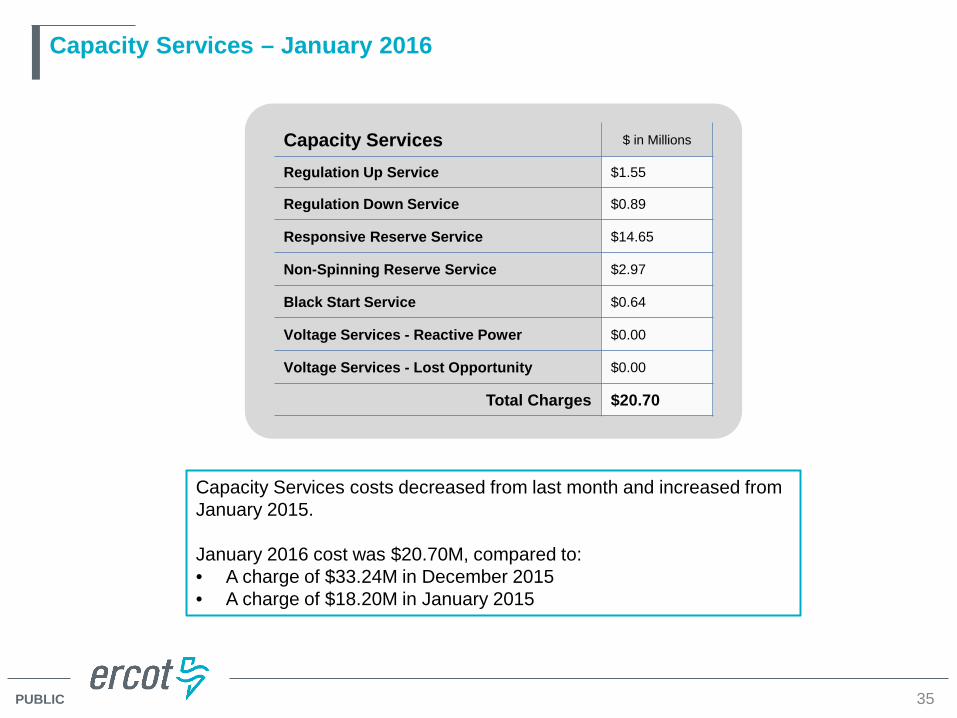
Capacity Services – January 2016
Capacity Services $ in Millions
Regulation Up Service $1.55
Regulation Down Service $0.89
Responsive Reserve Service $14.65
Non-Spinning Reserve Service $2.97
Black Start Service $0.64
Voltage Services - Reactive Power $0.00
Voltage Services - Lost Opportunity $0.00
Total Charges $20.70
Capacity Services costs decreased from last month and increased from January 2015. January 2016 cost was $20.70M, compared to: • A charge of $33.24M in December 2015 • A charge of $18.20M in January 2015
35

PUBLIC
Energy Settlement – January 2016
36
Day-Ahead Market Energy Settlement $ in Millions
Energy Purchases $281.99
Point to Point Obligation Purchases $7.37
RMR Day-Ahead Revenue $0.00
Energy Sales ($279.93)
Day-Ahead Congestion Rent $9.43
Day-Ahead Market Make-Whole Payments ($0.04)
Real-Time Market Energy Settlement $ in Millions
Energy Imbalance at a Resource Node ($287.66)
Energy Imbalance at a Load Zone $416.32
Energy Imbalance at a Hub ($117.70)
Real Time Congestion from Self Schedules $1.34
Block Load Transfers and DC Ties ($0.56)
Impact to Revenue Neutrality $11.74
Emergency Energy Payments ($0.08)
Base Point Deviation Charges $0.14
Real-Time Metered Generation (MWh in millions) 27.45
Day-Ahead Market and Real-Time Market energy settlement activity increased from last month and decreased from January 2015.

PUBLIC
Congestion Revenue Rights (CRR) – January 2016
$ in Millions
Annual Auction ($17.00)
Monthly Auction ($3.34)
Total Auction Revenue ($20.34)
Day-Ahead CRR Settlement ($8.60)
Day-Ahead CRR Short-Charges $0.48
Day-Ahead CRR Short-Charges Refunded ($0.48)
Real-Time CRR Settlement $0.00
Real-Time CRR Short-Charges $0.00
Real-Time CRR Short-Charges Refunded $0.00
Total CRR Funding ($8.60)
Day-Ahead Point to Point Obligations Settlement $7.37
Real-Time Point to Point Obligation Settlement ($15.59)
Net Point to Point Obligation Settlement ($8.22)
Congestion Revenue Rights settlement payments were fully funded and excess funds were deposited into the CRR Balancing Account Fund.
Point to Point Obligations settled with a net credit of $8.22M compared to a net credit of $9.05M last month.
37
PUBLIC
CRR Balancing Account Fund – January 2016
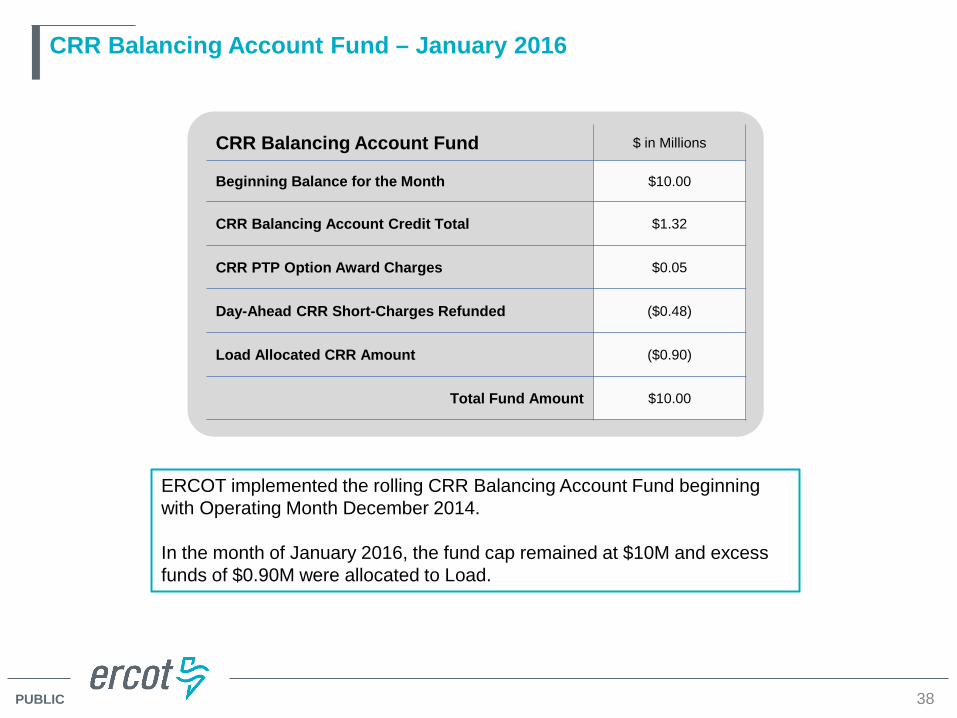
CRR Balancing Account Fund $ in Millions
Beginning Balance for the Month $10.00
CRR Balancing Account Credit Total $1.32
CRR PTP Option Award Charges $0.05
Day-Ahead CRR Short-Charges Refunded ($0.48)
Load Allocated CRR Amount ($0.90)
Total Fund Amount $10.00
ERCOT implemented the rolling CRR Balancing Account Fund beginning with Operating Month December 2014. In the month of January 2016, the fund cap remained at $10M and excess funds of $0.90M were allocated to Load.
38
PUBLIC
Revenue Neutrality – January 2016
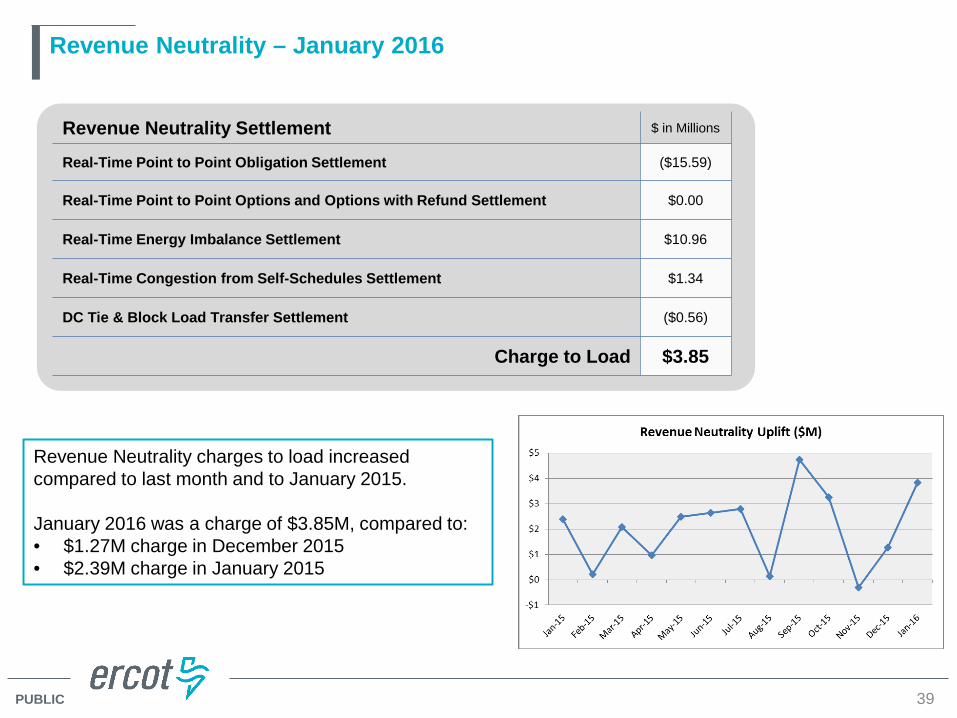
Revenue Neutrality Settlement $ in Millions
Real-Time Point to Point Obligation Settlement ($15.59)
Real-Time Point to Point Options and Options with Refund Settlement $0.00
Real-Time Energy Imbalance Settlement $10.96
Real-Time Congestion from Self-Schedules Settlement $1.34
DC Tie & Block Load Transfer Settlement ($0.56)
Charge to Load $3.85
Revenue Neutrality charges to load increased compared to last month and to January 2015. January 2016 was a charge of $3.85M, compared to: • $1.27M charge in December 2015 • $2.39M charge in January 2015
39
PUBLIC
Real-Time Ancillary Service Imbalance (ORDC) – January 2016
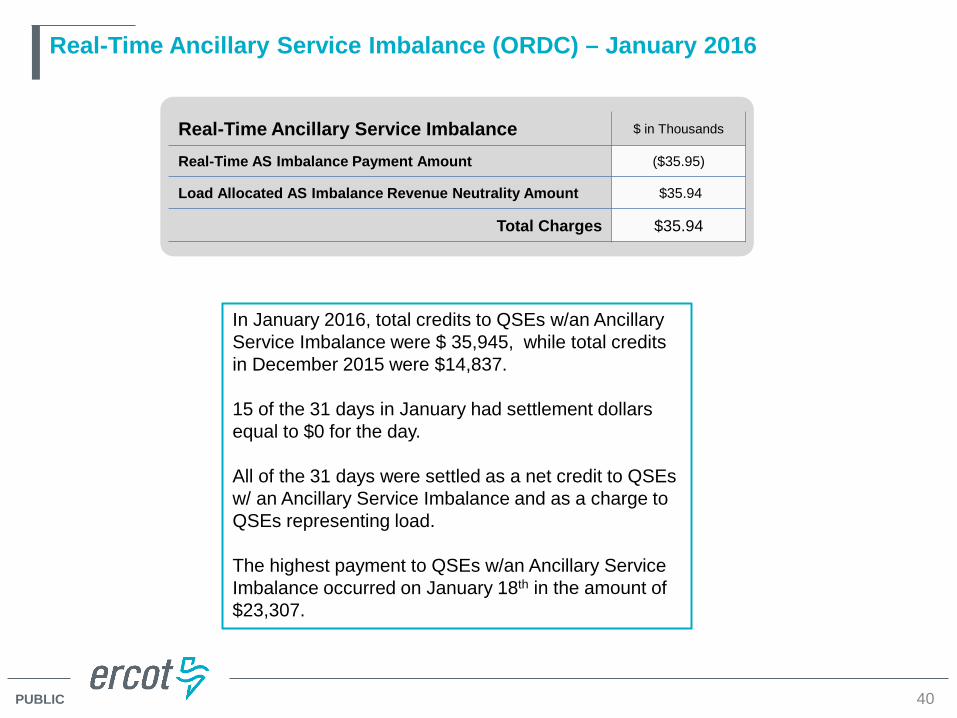
Real-Time Ancillary Service Imbalance $ in Thousands
Real-Time AS Imbalance Payment Amount ($35.95)
Load Allocated AS Imbalance Revenue Neutrality Amount $35.94
Total Charges $35.94
In January 2016, total credits to QSEs w/an Ancillary Service Imbalance were $ 35,945, while total credits in December 2015 were $14,837. 15 of the 31 days in January had settlement dollars equal to $0 for the day. All of the 31 days were settled as a net credit to QSEs w/ an Ancillary Service Imbalance and as a charge to QSEs representing load. The highest payment to QSEs w/an Ancillary Service Imbalance occurred on January 18th in the amount of $23,307.
40

PUBLIC
Net Allocation to Load – January 2016
Market-Based Allocation $ in Millions
CRR Auction Revenue Disbursement Settlement ($20.34)
Balancing Account Proceeds Settlement ($0.90)
Net Reliability Unit Commitment Settlement $0.00
Ancillary Services Settlement $20.70
Reliability Must Run Settlement (incl. RMR for Capacity) $0.00
Real-Time Revenue Neutrality Settlement $3.85
Emergency Energy Settlement $0.08
Base Point Deviation Settlement ($0.14)
ORDC Settlement $0.04
Total $3.29 Fee Allocation ERCOT Administrative Fee Settlement $15.29
Net Allocated to Load $18.58
The charge for the net allocation to Load decreased from last month and increased from January 2015. January 2016 was a charge of $18.58M, compared to: • A charge of $25.20M in December 2015 • A charge of $11.19M in January 2015
41

PUBLIC
Advanced Meter Settlement Impacts – January 2016
42
January 2016: At month end, settling 6.8M ESIIDs using Advanced Meter data.
January 2016: 98.7% of the load in ERCOT is settled with 15-min interval data (AMS, Competitive IDR, and NOIE IDR).

PUBLIC
ERCOT Wide Load Volumes by Meter Type – INITIAL Settlement – January 2016
43

PUBLIC
Retail Transaction Volumes – Summary – January 2016
Year-To-Date Transactions Received
Transaction Type January 2016 January 2015 January 2016 January 2015
Switches 63,954 72,885 63,954 72,885
Acquisition 0 0 0 0
Move - Ins 197,716 198,025 197,716 198,025
Move - Outs 96,628 98,233 96,628 98,233
Continuous Service Agreements (CSA) 42,179 40,420 42,179 40,420
Mass Transitions 0 0 0 0
Total 396,477 409,563 396,477 409,563
44

PUBLIC
Retail Transaction Volumes – Summary – January 2016
Switches/Acquisitions Move-Ins
Move-Outs Mass Transition
45

PUBLIC
Retail Performance Measures – Switch – January 2016
1st Quarter 2nd Quarter
3rd Quarter 4th Quarter
46

PUBLIC
Retail Performance Measures – Same Day Move-In – January 2016
1st Quarter 2nd Quarter
3rd Quarter 4th Quarter
47

PUBLIC
Retail Performance Measures – Standard Move-In – January 2016
1st Quarter 2nd Quarter
3rd Quarter 4th Quarter
48

Projects Report

PUBLIC
ERCOT Portfolio Stoplight Report – January 2016
50
22,500,000$ 2016 Portfolio Spending Estimate
Projects In Flight/On Hold (Count = 57) 21,179,573$
Projects Not Yet Started (Count = 21) 2,830,563$
Projects Completed (Count = 5) 46,715$
Carryover of Excess 2015 Project Spending 1,743,545$
(3,300,396)$
Project Number Projects in Initiation Phase (Count = 2) TOTAL 22,500,000$
RMGRR126Additional ERCOT Validations for Customer Billing Contact Information File
188-01 Mass Transition/Acquisition Enhancements (MTAQ)
Project Number Projects in Planning Phase (Count = 24) Baseline Phase
StartBaseline Phase
FinishScheduled
Go-Live DateScheduled Phase
Finish
DC4 DC4 Program Control 9/9/2015 3/30/2016 TBD 3/30/2016 0% 0%DC4 DC4 - Compute DB Inf Install and Migration 12/2/2015 3/16/2016 TBD 3/16/2016 0% 0%
DC4 DC4 - Compute DB Inf Install and Migration Stage 1 12/2/2015 3/16/2016 TBD 3/16/2016 0% NA See DC4 Compute DB
ECAPECAP - Enterprise Content Management System (Proof of Concept)
1/13/2016 5/17/2016 TBD 5/17/2016 0% 7%
ECAP ECAP - ERCOT Information Governance and Taxonomy 1/13/2016 6/6/2016 TBD 6/8/2016 -1% 11%ECAP ECAP - ERCOT Identity Alignment 2/3/2016 2/24/2016 TBD 2/16/2016 38% 0%158-01 Load Forecast Enhancements 1/14/2015 6/19/2015 TBD 6/15/2016 2 -232% 2 -160%172-01 Physical Security Project #2 8/27/2015 6/8/2016 TBD 6/8/2016 0% 3%173-01 ERCOT Flight Certification Website 7/23/2015 3/30/2016 TBD 3/21/2016 3% 0%177-01 Cyber Security Project #19 10/19/2015 3/9/2016 TBD 3/9/2016 0% 2%180-01 Mobile Device Management (MDM) – GEMS 11/25/2015 3/30/2016 TBD 3/30/2016 0% 11%181-01 CRR Framework Upgrade 12/16/2015 5/4/2016 TBD 5/4/2016 0% 4%
183-01 CMM Tech Refresh 12/16/2015 8/17/2016 TBD 8/17/2016 0% NA See 2015 CMM NPRRs
185-01 Records Management and eDiscovery 1/28/2016 8/31/2016 TBD 8/31/2016 0% 1%TBD Enterprise Resource Planning 12/16/2015 2/10/2016 TBD 2/10/2016 0% 0%
Various 2015 CMM NPRRs 12/16/2015 8/17/2016 TBD 8/17/2016 0% 42%SCR777 Bilateral CRR Interface Enhancement 1/28/2016 8/31/2016 TBD 8/31/2016 0% 46%
NPRR439Updating a Counter-Party's Available Credit Limit for Current Day DAM
12/16/2015 8/17/2016 TBD 8/17/2016 0% NA See 2015 CMM NPRRs
NPRR484Revisions to Congestion Revenue Rights Credit Calculations and Payments - Phase 1b / 2
12/16/2015 8/17/2016 TBD 8/17/2016 0% NA See 2015 CMM NPRRs
NPRR519Exemption of ERS-Only QSEs from Collateral and Capitalization Requirements
12/16/2015 8/17/2016 TBD 8/17/2016 0% NA See 2015 CMM NPRRs
NPRR620Collateral Requirements for Counter-Parties with No Load or Generation
12/16/2015 8/17/2016 TBD 8/17/2016 0% NA See 2015 CMM NPRRs
NPRR662 Proxy Energy Offer Curves 1/13/2016 2/29/2016 TBD 2/29/2016 0% 0%
NPRR683 Revision to Available Credit Limit Calculation 12/16/2015 8/17/2016 TBD 8/17/2016 0% NA See 2015 CMM NPRRs
NPRR702Flexible Accounts, Payment of Invoices, and Disposition of Interest on Cash Collateral
12/16/2015 8/17/2016 TBD 8/17/2016 0% NA See 2015 CMM NPRRs
Budget Impact
Impact Metric Tolerances
Schedule Impact
Spending Reductions Required to Maintain Capital Budget
2016 Project Funding
Note: Approximately $1.75M in PPL spending was accelerated from 2016 to 2015.This spending is being offset by equivalent reductions in 2016.
Unfavorable variances are represented as negative numbers within the report. - Green = No more than 4.9% unfavorable variance - Yellow = Unfavorable variance between 4.9% and 9.9% - Red = Unfavorable variance more than 9.9%

PUBLIC
ERCOT Portfolio Stoplight Report – January 2016
51
Project Number Projects in Execution Phase (Count = 22) Baseline Phase
StartBaseline Go-Live Target
ScheduledGo-Live Date
Scheduled Phase Finish
052-01 EMS Upgrade 9/24/2014 5/25/2016 5/26/2016 11/1/2016 0% 7%065-01 NMMS Upgrade 12/17/2014 9/22/2016 9/22/2016 10/31/2016 0% 3%116-01 Collage Replacement 2/6/2014 9/22/2014 2/11/2016 4/7/2016 2 -222% 2 -114%120-01 IT Production Hardening 5/21/2015 4/1/2016 4/8/2016 4/26/2016 -2% 27%161-01 NPRRs 588 and 615 9/16/2015 2/19/2016 2/9/2016 3/30/2016 6% 1%169-01 Short Circuit Ratio Functionality 1/20/2016 9/19/2016 9/19/2016 9/30/2016 0% 1%170-01 Enterprise Content Alignment Program 8/26/2015 1/5/2016 1/5/2016 11/15/2017 0% 0%171-01 CIP v5 Readiness Project 7/22/2015 4/29/2016 3/31/2016 3/31/2016 10% -2%174-01 2015 Outage Scheduler Enhancements 12/2/2015 9/14/2016 9/22/2016 10/21/2016 -2% 0%179-01 Infoblox Hardware Refresh 2/4/2016 8/12/2016 8/12/2016 8/12/2016 0% 0%187-00 Capital Efficiencies and Enhancements - 2016 1/1/2015 12/31/2016 12/31/2016 12/31/2016 0% 0%Various NPRR617 and 700 Implementation 1/27/2016 6/16/2016 6/16/2016 8/10/2016 0% 0%
NPRR219
Resolution of Alignment Items A33, A92, A106, and A150 - TSPs Must Submit Outages for Resource Owned Equipment and Clarification of Changes in Status of Transmission Element Postings
12/2/2015 9/14/2016 9/22/2016 10/21/2016 -2% NA See #174-01
NPRR419 Revise Real Time Energy Imbalance and RMR Adjustment Charge 1/13/2016 4/5/2016 4/7/2016 6/6/2016 -2% -2%
NPRR515 Day-Ahead Market Self-Commitment of Generation Resources 10/5/2015 3/31/2016 3/8/2016 3/8/2016 12% 0%NPRR553 Monthly BLT Payment and Charge for Presidio Exception 4/9/2015 2/19/2016 2/19/2016 2/19/2016 0% NA See #165-00NPRR588 Clarifications for PV Generation Resources 9/16/2015 2/19/2016 2/9/2016 3/30/2016 6% NA See #161-01NPRR615 PVGR Forecasting 9/16/2015 2/19/2016 2/9/2016 3/30/2016 6% NA See #161-01
NPRR617 Energy Offer Flexibility 1/27/2016 6/16/2016 6/16/2016 8/10/2016 0% NA See NPRR617 / NPRR700
NPRR686 Changing the IRR Forecast from Next 48 Hours to Next 168 Hours 9/16/2015 2/19/2016 2/19/2016 3/30/2016 0% NA 0%
NPRR700 Utilizing Actual Fuel Costs in Startup Offer Caps 1/27/2016 6/16/2016 6/16/2016 8/10/2016 0% NA See NPRR617 / NPRR700
SCR783Outage Scheduler Enhancements – Group 2, Usability and Filtering Enhancements
12/2/2015 9/14/2016 9/22/2016 10/21/2016 -2% NA See #174-01
Budget ImpactSchedule Impact
PUBLIC
ERCOT Portfolio Stoplight Report – January 2016
52
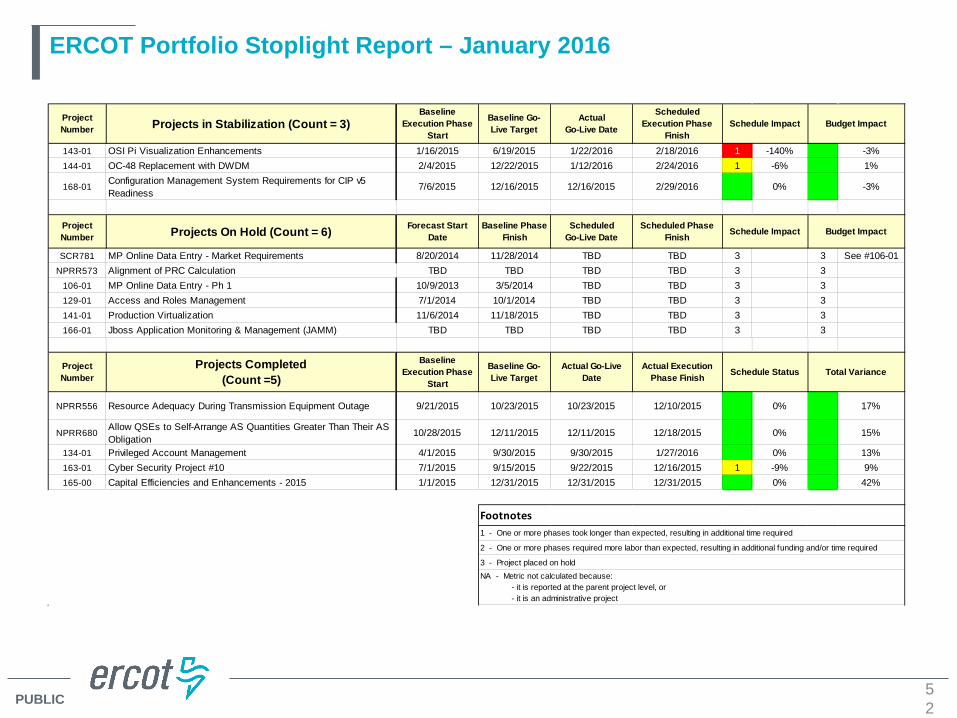
Project Number Projects in Stabilization (Count = 3)
Baseline Execution Phase
Start
Baseline Go-Live Target
ActualGo-Live Date
Scheduled Execution Phase
Finish
143-01 OSI Pi Visualization Enhancements 1/16/2015 6/19/2015 1/22/2016 2/18/2016 1 -140% -3%144-01 OC-48 Replacement with DWDM 2/4/2015 12/22/2015 1/12/2016 2/24/2016 1 -6% 1%
168-01Configuration Management System Requirements for CIP v5 Readiness
7/6/2015 12/16/2015 12/16/2015 2/29/2016 0% -3%
Project Number Projects On Hold (Count = 6) Forecast Start
DateBaseline Phase
FinishScheduled
Go-Live DateScheduled Phase
Finish
SCR781 MP Online Data Entry - Market Requirements 8/20/2014 11/28/2014 TBD TBD 3 3 See #106-01NPRR573 Alignment of PRC Calculation TBD TBD TBD TBD 3 3
106-01 MP Online Data Entry - Ph 1 10/9/2013 3/5/2014 TBD TBD 3 3129-01 Access and Roles Management 7/1/2014 10/1/2014 TBD TBD 3 3141-01 Production Virtualization 11/6/2014 11/18/2015 TBD TBD 3 3166-01 Jboss Application Monitoring & Management (JAMM) TBD TBD TBD TBD 3 3
Project Number
Projects Completed(Count =5)
Baseline Execution Phase
Start
Baseline Go-Live Target
Actual Go-Live Date
Actual Execution Phase Finish
NPRR556 Resource Adequacy During Transmission Equipment Outage 9/21/2015 10/23/2015 10/23/2015 12/10/2015 0% 17%
NPRR680Allow QSEs to Self-Arrange AS Quantities Greater Than Their AS Obligation
10/28/2015 12/11/2015 12/11/2015 12/18/2015 0% 15%
134-01 Privileged Account Management 4/1/2015 9/30/2015 9/30/2015 1/27/2016 0% 13%163-01 Cyber Security Project #10 7/1/2015 9/15/2015 9/22/2015 12/16/2015 1 -9% 9%165-00 Capital Efficiencies and Enhancements - 2015 1/1/2015 12/31/2015 12/31/2015 12/31/2015 0% 42%
Footnotes
Budget ImpactSchedule Impact
Schedule Status Total Variance
1 - One or more phases took longer than expected, resulting in additional time required
2 - One or more phases required more labor than expected, resulting in additional funding and/or time required
3 - Project placed on holdNA - Metric not calculated because: - it is reported at the parent project level, or - it is an administrative project
Schedule Impact Budget Impact

PUBLIC
ERCOT Portfolio Stoplight Report – January 2016
53
Project Number 2016 Projects Not Yet Started (Count = 21) Forecast Start
Date
TBD GINR Project Status Application Replacement Feb-2016
NPRR272 Definition and Participation of Quick Start Generation Resources Mar-2016
NPRR495 Changes to Ancillary Services Capacity Monitor Mar-2016NPRR714 Real-Time Make-Whole Payment for Exceptional Fuel Cost Mar-2016NPRR736 Updates to the Ancillary Service Capacity Monitor Display Mar-2016
TBD Appworx Replaces TIBCO Code in CSI Framework Mar-2016TBD CREZ Voltage Control and Coordination - Phase 2 Mar-2016TBD EIF Database Utilization Mar-2016TBD SharePoint Governance Project Mar-2016
RRGRR003 Modifications to Improve Wind Forecasting Apr-2016
RRGRR006Clarification of Descriptions and Alignment with Resource Asset Registration Forms
Apr-2016
RRGRR007 Adding Solar Resource Registration Inputs Apr-2016TBD Replace Paperfree Apr-2016TBD UC4 Automation Upgrade v9 Apr-2016TBD REC Rewrite & Refresh May-2016
NPRR210 Wind Forecasting Change to P50, Sync with PRR841 Jun-2016NOGRR084 Daily Grid Operations Summary Report Jul-2016
TBD Automation of NPRR487 - QSGR Dispatch Adjustment Jul-2016TBD Emergency Energy Settlements Inputs Automation Jul-2016TBD Replace Sun DSEE Jul-2016DC4 DC4 - Compute DB Inf Install and Migration Stage 2 Jul-2016