Embed Size (px)
Citation preview


Joana Catarina Amaral Pinto
Development and validation of an analytical method for
quantification of psychotropic drugs in biological
samples by LC-MS/MS
Dissertação apresentada para provas de Mestrado em Química Forense
Professor Doutor Jorge Luís Gabriel F. S. Costa Pereira
Doutor Bruno José Fernandes Oliveira Manadas
Setembro 2013
Universidade de Coimbra


AGRADECIMENTOS
Gostaria de começar por agradecer ao Doutor Bruno Manadas pela oportunidade que me deu de
desenvolver este projecto. Obrigada pelos conhecimentos científicos transmitidos, toda a sua
disponibilidade. Todas as valiosas sugestões e críticas que proporcionaram o meu
desenvolvimento, tanto pessoal como profissional.
Agradeço também ao Doutor Jorge Costa Pereira por ter aceitado co-orientar este projecto e por
todas as suas sugestões dadas.
À Vera Mendes, por toda a orientação que me deu, por todas as horas que passou a ensinar-me
e a acompanhar o meu trabalho. Obrigada pelo seu incansável apoio e dedicação.
A todas as minhas colegas de laboratório (cada uma de uma maneira especial), pela integração,
pelo apoio, prontidão de ajuda e momentos de boa disposição. Sem dúvida um apoio
fundamental para encarar cada dia com uma maior motivação. Em especial à Margarida Coelho,
pela partilha de bons momentos e incentivo mútuo em alturas de desânimo.
Agradeço à Alexandra Gonçalves pelas orientações que me deu sobre a validação de métodos.
Obrigada por ter acreditado em mim e por me ter incentivado. Uma pessoa extraordinária que
tive o privilégio de conhecer, sempre com uma palavra de apoio e carinho nas horas certas.
Quero agradecer a todos os meus amigos, mesmo não estando aqui mencionados, que directa
ou indirectamente, me deram uma palavra de incentivo e me proporcionaram momentos de
descontração, fazendo-me esquecer todas as preocupações. Em especial à Jaqueline Marques,
pelas conversas que tivemos ao longo do ano, que por mais em baixo eu estivesse, me faziam
sempre sorrir. Obrigada pela amizade e preocupação constante.
À minha família, mas em especial aos meus Pais, que sempre me proporcionaram um ambiente
familiar tranquilo e feliz. Obrigada pela força, paciência, confiança que sempre depositaram em
mim. Pelo apoio incondicional, optimismo e pelos elogios que só vêm de quem ama. Sem dúvida
as pessoas mais importantes na minha vida.
Ao Miguel pela compreensão, ajuda, pelo carinho e por me acalmar em momentos de pânico.
Obrigada por ouvires os meus desabafos e por respeitares os meus momentos de silêncio e de
ausência. Por tudo, mas principalmente pela amizade que tao importante é para mim.
Aos pais do Miguel que foram um grande apoio para mim nesta fase da minha vida.

RESUMO | i
RESUMO
De acordo com a organização mundial de saúde, muitas pessoas em todo mundo sofrem de
doenças mentais e psicológicas, incluindo depressão e esquizofrenia. O tratamento destas
doenças muitas vezes é auxiliado pelo uso de antidepressivos e antipsicóticos. Em 2009, houve
um aumento de 52% no uso deste tipo de fármacos psicotrópicos. Devido ao aumento do seu
uso e o seu envolvimento em situações de intoxicações e suicídio, a sua detecção em amostras
biológicas torna-se cada vez mais uma necessidade. Assim o desenvolvimento de uma
metodologia analítica para a identificação e quantificação de fármacos psicotrópicos
(citalopram, clozapina e haloperidol) em plasma e pêlo foi o principal objectivo deste trabalho.
As amostras de plasma foram processadas com metanol por precipitação de proteínas e as
amostras de pêlo foram incubadas com metanol a 45 °C, seguindo-se um passo de limpeza com
extração fase sólida. Todas as amostras foram analisadas por cromatografia líquida acoplada a
espectrometria de massa sequencial (LC-MS/MS) em modo MRM1 com um tempo analitico de 9
minutos.
Para garantir a fiabilidade dos resultados analíticos foram definidos parâmetros de validação
para este método: selectividade, limites de detecção e quantificação, linearidade,
arrastamento2, precisão intermédia, repetibilidade, exactidão, recuperação e efeito matriz.
O método provou ser selectivo para todos os compostos, com um limite de quantificação de
0,012; 0,014 e 0,015 pmol/μL para o citalopram, clozapine e haloperidol, respectivamente.
Também a linearidade do método foi demonstrada para os intervalos: 0,05 a 5 pmol/μl para o
haloperidol; 0,05 a 3 pmol/μl para o citalopram e 0,05 a 2 pmol/μl para a clozapina, com
coeficientes determinação (R2) maiores do que 0,998 para todos os compostos. Os limites de
quantificação foram: 0,037; 0,044 e 0,045 pmol/μL para o citalopram, clozapina e haloperidol,
respectivamente.
A precisão intermédia do método apresentou alguns valores altos, 13,7-31,3 %. Contudo na
exactidão e repetibilidade, os resultados obtidos encontram-se dentro dos critérios
estabelecidos.
1 Do inglês, Multiple Reaction Monitoring
2 Do inglês, carry-over
ii |RESUMO
Na recuperação do método, a diferentes níveis de concentração, os valores obtidos para o
plasma foram de 68,9 a 115,5% e para o pêlo de 8,9 a 45,5%.
Em relação ao efeito de matriz foram obtidos valores negativos para o plasma, indicando
supressão iónica. E para o pêlo foram obtidos valores positivos, indicando um aumento do sinal
da substância analisada.
O método desenvolvido foi aplicado em amostras de plasma e pêlo que foram recolhidas de
ratinhos (5 réplicas independentes por dia) que foram submetidos a um tratamento com
fármacos psicotrópicos (citalopram, clozapina e haloperidol) por diferentes períodos de tempo:
1, 2, 4, 8, 15 e 30 dias. A análise da evolução temporal da quantificação dos três compostos no
pêlo revela um aumento na concentração ao longo dos dias com um aumento acentuado no dia
15. A evolução temporal da quantificação do citalopram, clozapina e haloperidol para o plasma
foi diferente para cada composto, com um pico máximo no dia 8, dias 1 e 2 e dias 4 e 8 para o
citalopram, clozapina e haloperidol, respectivamente.
Palavras-chave: fármacos psicotrópicos; plasma; pêlo; LC-MS/MS; quantificação; validação.
ABSTRACT | iii
ABSTRACT
According to World Health Organization, many people worldwide have mental and psychosocial
disabilities, including depression and schizophrenia. The treatment of these diseases is
performed with the use of antidepressants and antipsychotics. In 2009 there was a 52% increase
in the use of these types of psychotropic drugs. Due to their increased use and their involvement
in intoxications and suicide, the ability to reliably detect this class of drugs in biological
specimens is a necessity. Thus, the development of an analytical methodology for the
identification and quantification of psychotropic drugs (citalopram, clozapine and haloperidol) in
biological fluids (plasma and hair) was the main goal of this project.
The plasma samples were processed with methanol, by protein precipitation and the hair
samples were incubated overnight with methanol at 45 °C followed by solid phase extraction. All
samples were analyzed by liquid chromatography-tandem mass spectrometry (LC-MS/MS) in
MRM mode and with a running time of 9min.
To guarantee reliability in the analytical results validation different parameters were defined for
this method: were define for this method: selectivity, limits of detection and quantification,
linearity, carry-over, intermediate precision, repeatability, accuracy, recovery and matrix effects.
The method proved to be selective for all compounds with limit of detection of 0.012, 0.014 and
0.015 pmol/μL for citalopram, clozapine and haloperidol, respectively.
Linearity was demonstrated for the intervals: 0.05 to 5 pmol/μl for haloperidol, 0.05 to 3
pmol/μl for citalopram and 0.05 to 2 pmol/μl for clozapine, with determination coefficients (R2)
higher than 0.998 for all compounds. The limits of quantification were: 0.037, 0.044 and 0.045
pmol/μL for citalopram, clozapine and haloperidol, respectively.
The intermediate precision of the method presented some high values (13.7 to 31.3 %).
However, for the accuracy and repeatability the results obtained are within the established
criteria.
In the recovery of the method, at different concentration levels, the values obtained for plasma
were 68.9 to 115.5% and for hair were 8.9 to 45.5%.
In the matrix effects were obtained negatives values for plasma, indicating ion suppression. And
for hair were obtained positive values, indicating enhancement of the analyte.
iv |ABSTRACT
The developed method was applied in plasma and hair samples that were collected from mice (5
independent replicates per day) that were submitted to a treatment with psychotropic drugs
(citalopram, clozapine and haloperidol) for different periods of time: 1, 2, 4, 8, 15 and 30 days.
The analysis of the time evolution of the quantification for the three compounds in hair reveals
an increase in the concentration over the days with a marked increase on day 15. In the time
evolution of the quantification in plasma for the citalopram, clozapine and haloperidol, it was
different for each compound, with a maximum peak on days 8, 1-2 and 4-8, for citalopram,
clozapine and haloperidol, respectively.
Keywords: psychotropic drugs; plasma; hair; LC-MS/MS; quantification; validation.
CONTENTS| v
CONTENTS
RESUMO ................................................................................................................................. I
ABSTRACT ............................................................................................................................. III
ABBREVIATIONS .................................................................................................................. IX
1. JUSTIFICATION OF THE THEME ...................................................................................... 1
2. INTRODUCTION ............................................................................................................. 5
2.1. PSYCHOTROPIC DRUG .................................................................................................................. 5
2.1.1. ANTIDEPRESSANTS ........................................................................................................... 7
2.1.1.1. SELECTIVE SEROTONIN REUPTAKE INHIBITORS .................................................................... 7
2.1.2. ANTIPSYCHOTICS ............................................................................................................. 9
2.1.2.1. FIRST-GENERATION ANTIPSYCHOTICS ................................................................................ 9
2.1.2.2. SECOND-GENERATION ANTIPSYCHOTICS .......................................................................... 10
2.2. DRUGS INTOXICATION ............................................................................................................... 12
2.2.1. MANNER OF DEATH BY THE USE OF DRUGS ......................................................................... 14
2.2.1.1. INTOXICATIONS BY PSYCHOTROPIC DRUGS ....................................................................... 15
2.3. BIOLOGICAL MATRICES ............................................................................................................... 18
2.3.1. PLASMA ...................................................................................................................... 19
2.3.2. HAIR .......................................................................................................................... 20
3. ANALYTICAL METHODOLOGIES FOR PSYCHOTROPIC DRUG ANALYSIS ........................ 25
3.1. ANALYTICAL METHODOLOGIES FOR SAMPLE PREPARATION ................................................................ 25
3.1.1. SAMPLE PREPARATION OF PLASMA .................................................................................... 26
3.1.1.1. PROTEIN PRECIPITATION ............................................................................................. 26
3.1.2. SAMPLE PREPARATION OF HAIR ........................................................................................ 26
3.2. LIQUID CHROMATOGRAPHY COUPLED TO MASS SPECTROMETRY (LC-MS) .............................................. 28
3.2.1. LIQUID CHROMATOGRAPHY .............................................................................................. 29
3.2.2. MASS SPECTROMETRY .................................................................................................... 32
3.2.2.1. MODES OF IONIZATION ............................................................................................... 33
3.2.2.2. QUADRUPOLE ANALYZER ............................................................................................. 35
3.2.2.3. MULTIPLE REACTION MONITORING (MRM) .................................................................... 38
3.2.2.4. ISOTOPIC ABUNDANCES .............................................................................................. 39
3.3. ANALYTICAL METHOD VALIDATION ................................................................................................ 40
vi |CONTENTS
4. MATERIALS AND METHODS ......................................................................................... 43
4.1. EQUIPMENTS ........................................................................................................................... 43
4.2. MATERIAL ............................................................................................................................... 43
4.3. STANDARDS AND REAGENTS ........................................................................................................ 44
4.4. ANIMAL PROTOCOL ................................................................................................................... 44
4.4.1. ANIMALS AND DRUG ADMINISTRATION ............................................................................... 44
4.4.2. PLASMA AND HAIR COLLECTION ........................................................................................ 45
4.5. METHOD DEVELOPMENT ............................................................................................................ 45
4.6. INSTRUMENTAL CONDITIONS ....................................................................................................... 46
4.6.1. LIQUID CHROMATOGRAPHY .............................................................................................. 46
4.6.2. MASS SPECTROMETRY ..................................................................................................... 47
4.7. EXTRACTION PROCEDURE FOR PLASMA SAMPLES ............................................................................. 48
4.7.1. PROTEIN PRECIPITATION .................................................................................................. 48
4.8. EXTRACTION PROCEDURE FOR HAIR SAMPLES ................................................................................. 48
4.8.1. DECONTAMINATION AND SEPARATION OF DRUGS FROM THE HAIR MATRIX ................................... 48
4.8.1.1. OMIX TIP C18 CLEAN UP ........................................................................................... 48
4.9. ANALYTICAL METHOD VALIDATION ............................................................................................... 49
4.9.1. SELECTIVITY .................................................................................................................. 50
4.9.2. LINEARITY .................................................................................................................... 51
4.9.2.1. MANDEL TEST ........................................................................................................... 52
4.9.3. WORKING RANGE ........................................................................................................... 54
4.9.3.1. WEIGHTED LEAST SQUARES LINEAR REGRESSION ............................................................... 55
4.9.4. LIMITS: LIMIT OF DETECTION AND LIMIT OF QUANTIFICATION .................................................. 57
4.9.5. PRECISION .................................................................................................................... 58
4.9.6. ACCURACY.................................................................................................................... 60
4.9.7. CARRY-OVER ................................................................................................................ 60
4.9.8. RECOVERY .................................................................................................................... 61
4.9.9. MATRIX EFFECTS ............................................................................................................ 62
4.10. APPLICATION OF THE ANALYTICAL METHOD DEVELOPED IN REAL SAMPLES ............................................... 64
5. RESULTS AND DISCUSSION .......................................................................................... 69
5.1. METHOD DEVELOPMENT ............................................................................................................. 69
5.1.1. ISOTOPIC IDENTIFICATION ................................................................................................ 75
5.2. COMPOUND IDENTIFICATION ....................................................................................................... 77
5.3. ANALYTICAL METHOD VALIDATION ............................................................................................... 78
5.3.1. SELECTIVITY .................................................................................................................. 78
5.3.2. LINEARITY .................................................................................................................... 84
CONTENTS| vii
5.3.2.1. MANDEL TEST .......................................................................................................... 86
5.3.3. WORKING RANGE .......................................................................................................... 87
5.3.3.1. WEIGHTED LEAST SQUARES LINEAR REGRESSION ............................................................... 88
5.3.4. LIMITS: LIMIT OF DETECTION AND LIMIT OF QUANTIFICATION .................................................. 91
5.3.5. PRECISION AND ACCURACY .............................................................................................. 92
5.3.6. CARRY-OVER ................................................................................................................ 93
5.3.7. RECOVERY ................................................................................................................... 94
5.3.8. MATRIX EFFECTS ........................................................................................................... 96
5.4. APPLICATION OF THE DEVELOPED ANALYTICAL METHOD IN REAL SAMPLES .............................................. 98
6. CONCLUSION AND FUTURE PERSPECTIVES ................................................................ 111
7. REFERENCES .............................................................................................................. 115
8. APPENDIX .................................................................................................................. 125

ABBREVIATIONS| ix
ABBREVIATIONS
ACN Acetonitrile
ANOVA Analysis of variance
CE Collision Energy
Estimated concentration in the sample
CID Collision Induced Dissociation
CNS Central Nervous System
CUR Curtain Gas
CV Coefficient of Variation
CXP Collision Cell Exit Potential
DC Direct Current
DP Declustering Potential
EMA European Medicines Agency
EP Entrance Potential
ESI Electrospray Ionization
eV Electronvolt
FA Formic Acid
Fcrit tabulated F value
Fcal calculated F value
FDA Food and Drug Administration
FGAs First-generation antipsychotics
HPLC High-performance liquid chromatography
IS Internal standard
ISO International Organization for Standardization
IUPAC International Union of Pure and Applied Chemistry
LC Liquid Chromatography
LC-MS Liquid Chromatography - Mass Spectrometry
LC-MS/MS Liquid Chromatography - Tandem Mass Spectrometry
LLE Liquid–liquid extraction
LOD Limit Of Detection
LOQ Limit Of Quantification
m/z Mass-to-Charge ratio
x |ABBREVIATIONS
MAOIs Monoamine oxidase inhibitors
MeOH Methanol
ME Matrix Effects
MRM Multiple Reaction Monitoring
MS Mass Spectrometry
MS/MS Tandem Mass Spectrometry
PD Psychotropic drugs
PP Protein precipitation
Q1 First Quadrupole
q2 Second Quadrupole (Collision Cell)
Q3 Third Quadrupole
QCs Quality Controls
R Coefficient of correlation
R2 Coefficient of determination
RF Radiofrequency
∆RTratio Retention time ratio
RT Retention Time
SGAs Second-generation antipsychotics
S/N Signal to noise
SPE Solid-phase extraction
SSRIs Selective serotonin reuptake inhibitors
S2 Variance
Sy/x Standard error of the linear regression
Sb Standard deviation the y-intercept
TCAs Tricyclic antidepressants
Weighting Factor
WADA World Anti-Doping Agency
Sum of the relative errors


JUSTIFICATION OF THE THEME| 1
1. JUSTIFICATION OF THE THEME
According to World Health Organization, many people worldwide have mental and psychosocial
disabilities, including depression and schizophrenia [1]. Mental disorders are on the rise in the
European Union. It is estimated that, about 11% of the population has experienced mental
disorders [2]. Portugal is the European country with the highest prevalence of mental illness in
population, according to the first National Epidemiological Study of Mental Health [3]. Last year,
one in five Portuguese suffered from a psychiatric illness (23%) and almost half (43%) already
had one of these disorders during life [3].
Depression is already the most prevalent health problem in many European Union-Member
States [2] and suicide is very associated with mental illness. Almost one million people die due to
suicide every year [1]. Also Schizophrenia is placed among the top causes of disability due to
health‐related conditions in all countries [1,2].
The treatment of these diseases is performed with the use of antidepressants and
antipsychotics. In 2009 there was a 52% increase in the use of psychotropic drugs (PD),
especially antidepressants and antipsychotics. An analysis of the total market for medicines,
made by the National Epidemiological Study of Mental Health, revealed that drugs belonging to
the therapeutic group central nervous system (CNS) therapeutic constitute the second group
with more weight on spending, with particularly weight of PD, including antipsychotics and
antidepressants [3].
The increased use of antidepressants and antipsychotics may be due to many reasons, such as
prevalence of psychotic disorders, increased duration of treatment, drug accessibility, expansion
of approved indications for second-generation antipsychotics [3]. The relation between
substance abuse and psychiatric disorders is a matter of great concern, both conditions are
reportedly linked to increased suicide risk [4].
The pharmacological and toxicological information obtained from the drug distribution in tissues
and cells is important for understanding and predicting both drug reaction and toxicity [5].
Analysis of these drugs could be also necessary in forensic cases such as driving under the
influence of drugs, cases of violent crimes, cases of drug-facilitated sexual assault and cases of
unknown cause of death [6].
2 |JUSTIFICATION OF THE THEME
Determining the presence of various drugs in samples is an important facet of forensic science
[7]. Liquid Chromatography - Mass Spectrometry (LC–MS) has established itself as the clear
leader in the quantification of psychotropic drugs in biological samples, such as plasma and hair
[5]. The pharmacologic effects of most drugs have a direct correlation with their concentrations
in plasma, fact that serves as a basis for therapeutic drug monitoring [8,9]. Therefore the plasma
is preferred for quantitative analysis when interpretation of concentrations and effects are
required [8]. However, hair has become an important matrix for drug analysis, complementing
other specimens like blood [10], since it provides evidence of longer term exposure of drugs and
can provide important information as to the time course of drug use [8,11]. Also, it can be used
in cases of extreme putrefaction of the body and when there is no longer any matrix available
[11].
Whereby stated above, intervention is necessary in terms of therapeutic drug monitoring. Only
this way unnecessary consumption associated with therapy can be reduced. Moreover,
detection of these drugs in these biological samples is necessary to establish their use and
possible contribution to the cause of death. So its detection may be relevant in different
situations, presenting indisputable forensic interest.


INTRODUCTION| 5
2. INTRODUCTION
2.1. PSYCHOTROPIC DRUG
Many prescription drugs are widely available today, more developed and marketed every year.
Each has the potential for adverse effects and many of them may cause death by overdose [12].
A drug must act on a site of action that is physiologically relevant to the effect. The activation or
inhibition of that specific site is termed the drug’s mechanism of action. A given drug may affect
one or more sites over its clinically relevant dosing range and may produce multiple and
different clinical effects [13].
The PD are compounds that affect the functioning of the mind through pharmacological action
on the CNS, by other words they have effects on psychological function [7,12]. This category of
drugs is widespread in today’s society and include both prescribed psychiatric medications and
illegal narcotics [7]. It can be divided in four main psychotropic drug categories: antidepressants,
antipsychotics, anxiolytics, antiepileptics [7,14].
Due to their abuse potential and their involvement in intoxications and suicides [15], the PD
have rapidly gained importance in both clinical and forensic setting [16,17], which makes the
ability to reliably detect this class in human biological specimens a necessity [16]. In a clinical
environment, the analysis of PD in blood (and/or plasma) is necessary in order to monitor
patient compliance and to maintain drug concentrations within the recommended therapeutic
range of the respective drug [16]. On the other hand, in a forensic setting, the detection of PD is
crucial in determining whether these drugs played a role in the cause of death [16].
The pharmacological treatment of schizophrenia is often performed with the simultaneous use
of two or more psychotropic agents to achieve the desired control of psychotic symptoms [5,17].
They are also prescribed to use in the treatment of depression [17].
Most PD are similar in chemical properties such as high lipophilicity, relative molecular weight
between 200 and 500 and basicity [18]. In the following pages the main physicochemical
characteristics of the compounds that will be studied in this project will be presented (Table 2.1)
along with some aspects associated to the mechanism of action, adverse effects and
pharmacokinetics properties.
6 |INTRODUCTION
Tab
le 2
.1 -
Ph
ysic
o-c
he
mic
al c
har
acte
rist
ics
of
psy
cho
tro
pic
dru
gs.
H
alo
pe
rid
ol
4
-[4
-(4
-Ch
loro
ph
enyl
)-4
-hyd
roxy
-1-
pip
erid
inyl
]-1
-(4
-flu
oro
ph
enyl
)-1
-bu
tan
on
e
52
-86
-8
C21
H23
CIF
NO
2
37
5.8
6
Wh
ite
Cry
stal
line
Po
wd
er
Clo
zap
ine
8-C
hlo
ro-1
1-(
4-m
eth
yl-1
-
pip
eraz
inyl
)-5
H-
dib
enze
no
[b,e
][1
,4]d
iaze
pin
e
57
86
-21
-0
C18
H19
CIN
4
32
6.8
2
Yello
w C
ryst
allin
e P
ow
der
Cit
alo
pra
m
1-[
3-(
Dim
eth
ylam
ino
)pro
pyl
]-1
-(4
-
flu
oro
ph
enyl
)-1
,3-d
ihyd
ro-5
-iss
o-
ben
zofu
ran
car
bo
nit
rile
hyd
rob
rom
ide
59
72
9-3
2-7
C20
H21
FN2O
40
5.3
0
Wh
ite
Solid
Ch
em
ical
stru
ctu
re
Ch
em
ical
nam
e
CA
S
Mo
lecu
lar
form
ula
Mo
lecu
lar
We
igh
t
(g/m
ol)
Ph
ysic
al
Ap
pe
aran
ce
INTRODUCTION | 7
2.1.1. ANTIDEPRESSANTS
The antidepressants are currently among the most frequently prescribed therapeutic agents in
medicine [12-14], mainly because of their efficacy and good profile of side effects [14]. This type
of drug is a therapeutic indicator for the treatment of depression, anxiety disorders, including
obsessive-compulsive disorder, bulimia nervosa and psychosomatic disorders [14].
Despite advances in research there is no full explanation of the proper functioning of
antidepressants [19]. But it is known that these drugs act on depressive illness through the
action on various neurotransmitter systems: serotonine, noradrenaline and dopamine. They
produce an increase in the concentration of neurotransmitters in the synaptic gap by inhibiting
the metabolism, blocking reuptake of neuronal activity or in the action on presynaptic receptors
[19].
The newer antidepressants are much less toxic, safer and more tolerable than the tricyclic
antidepressants (TCAs) and monoamine oxidase inhibitors (MAOIs) [12,20], but may still be
involved in overdose deaths, particularly when combined with other drugs [12].
Antidepressants can be classified according to the chemical structure or pharmacological action.
Because the new-generation antidepressants do not share common structures, the
pharmacological action is currently more used [19]. In past years, TCAs and MAOIs were the
most commonly used antidepressants [12,14], however the selective serotonin reuptake
inhibitors (SSRIs) have emerged as a major therapeutic advance in psychopharmacology [13].
2.1.1.1. SELECTIVE SEROTONIN REUPTAKE INHIBITORS
The SSRIs were all developed to have a similar mechanism of action: block the serotonin
reuptake. The inhibition of the serotonin reuptake carrier raises the level of this
neurotransmitter in the synapse [13,14,21,22], enhancing serotonin neurotransmission, which
results in their antidepressant effects [21].
Serotonin binds to serotonin receptors located in the central and peripheral nervous system and
affects various functions such as: sleep, pain perception, blood vessel regulation, anxiety, mood,
and depression. The SSRIs have lower binding affinities for other neurotransmitter receptors (for
example dopaminergic receptors), providing another reason to be considered better tolerated
than TCAs and MAOIs [22].
8 |INTRODUCTION
Although they have a common mechanism of action in this class, each SSRI has a slightly
different pharmacologic profile that leads to its distinct clinical activity, side effects and drug
interactions [19-21].
After oral administration, SSRIs are well-absorbed, suffer less effect of first-pass metabolism and
bind strongly to plasma proteins. SSRIs are metabolized primarily by the liver and their
metabolites are mainly eliminated in the urine [19,22].
Overall, the most frequently reported side effects are gastrointestinal (nausea, vomiting,
abdominal pain, diarrhea), psychiatric (agitation, anxiety, insomnia, mania, nervousness), sleep
disturbances, fatigue, loss or weight gain, sexual dysfunction and skin reactions [19,21,22]. In
general, SSRIs have milder adverse effects than older antidepressants, and their adverse effects
are often dose related [22].
CITALOPRAM
Citalopram (consult Table 2.1) is a selective and potent serotonin reuptake inhibitor that is used
for the treatment of depression [23] and offers an efficient alternative treatment of depression
to the TCAs [24].
The main metabolite of citalopram, measurable in plasma, is N-desmethylcitalopram, which is
also an SSRI [13,25]. However, the pharmacological activity of the metabolite is weaker when
compared to the parent drug [13,25].
As for other lipophilic drugs, the absorption of citalopram from the gastrointestinal tract is
almost complete [13,24,25]. The first pass effect of citalopram seems to be of minor importance,
since it has an absolute bioavailability of about 80%. [13,25]. As only 50% of the dose is excreted
in urine, a significant fecal elimination is suggested [25], with the peak plasma concentrations
being reached after 2–4 hours [24].
A linear relationship between citalopram dosage and plasma concentration has been reported,
but the interindividual variability increases with dose, which might be due to saturation of an
elimination pathway [13].
Citalopram, has been associated with low rates of insomnia, anxiety, and other activating side
effects. Nausea is the most common early side effect [21] and it was also associated with weight
gain [19].
INTRODUCTION | 9
2.1.2. ANTIPSYCHOTICS
Since their introduction, antipsychotic drugs are medications that have been extensively
prescribed and are the primary intervention for the stabilization of acute psychotic episodes,
including schizophrenia, bipolar disorder, mania and depression [14,26-28]. Some of these drugs
are also used for the palliative treatment of some movement disorders [14].
Dopamine has a central role in excitement, motivation, attention, the extrapyramidal motor
system and other pathways. Although the exact etiology is uncertain, dopamine dysregulation
plays a role in a number of symptoms. In psychosis, its overactivity leads to excessive
information throughput, resulting in hallucinations and delusions [29]. Since the antipsychotic
block dopamine D2 receptors [30], they help to correct this overactivity and improve the
symptoms [29].
Two primary classes referred in the literature are the typical and atypical antipsychotics. The
term atypical originated from the idea that these medications reduce the risk of extrapyramidal
side effects. Most recently the classification of these medications has been changed based on
pharmacology. The terms first-generation antipsychotics (FGAs) and second-generation
antipsychotics (SGAs) have replaced the terms “typical” and “atypical” [18].
The different groups of antipsychotic drugs have slightly different pharmacological profiles,
however all of them block the dopamine D2 receptor with different degrees [18,31].
2.1.2.1. FIRST-GENERATION ANTIPSYCHOTICS
The first-generation antipsychotics, include the commonly used butyrophenones (such as
droperidol and haloperidol) and phenothiazines (such as chlorpromazine, promethazine and
thioridazine) [30].
Their clinical efficacy is strongly correlated with their binding affinities for the receptor subtype
[32]. These FGAs were categorized based on their affinity for the dopamine D2 receptor as low
potency, such as chlorpromazine, or high potency, such as haloperidol [30]. So, the blocking of
dopamine is responsible for the therapeutic effect, with reduction of delusions and
hallucinations [14,32-35].
10 |INTRODUCTION
The FGAs are well absorbed orally, have great solubility, easily cross the blood-brain barrier and
also the placental barrier. They show a great affinity for plasma proteins (85-90%), which
involves risk of toxicity when other drugs that also bind to proteins are available in the plasma
simultaneously [14]. Due to their lipophilic properties, antipsychotic are stored in the peripheral
fat. FGAs drugs are metabolized in the liver, being removed primarily by urine and feces, through
bile, but also by the saliva, tears, sweat, and breast milk. The elimination half-life varies between
18-40 hours [14].
HALOPERIDOL
Haloperidol is a butyrophenone (consult Table 2.1)and is the most used drug for the
symptomatic management of psychotic disorders [36].
After oral administration, haloperidol has significant first-pass metabolism in the liver,
decreasing oral bioavailability. There is wide inter individual variation in plasma concentrations,
so no strong correlation between plasma concentration and therapeutic effect has been found.
It was reported to have half-lives between 12 and 38 hours after oral administration. Also 92% of
this drug is bound to plasma proteins and is widely distributed throughout the body, including
breast milk [37].
2.1.2.2. SECOND-GENERATION ANTIPSYCHOTICS
The SGAs drugs introduced in recent years, besides being dopamine receptor antagonists
[27,32], comprise a more heterogeneous pharmacological profile involving actions on multiple
neurotransmitter systems [32,33]. The difference between these and the FGA medications is the
specificity of the dopamine antagonism at recommended dosages and also the serotonin activity
[35]. These agents functionally antagonize dopamine (D2) receptors and antagonize serotonin
(5-HT2A) receptors [35]. When compared to phenothiazines and butyrophenones, SGAs have a
greater binding affinity for the 5-HT2 receptors than for D2 receptors [38].
They are defined clinically as having minimal or no extrapyramidal symptoms at clinically
appropriate doses [30]. Moreover, over the past decade, they have become the treatment of
choice for schizophrenia in many countries, due to the perception of a more favourable
INTRODUCTION | 11
tolerability profile, thus raising major hopes of superior effects in a number of areas such as
compliance, cognitive functioning, movement disorders, and quality of life [27].
In the case of an overdose, these drugs produce a range of manifestations that affect multiple
organ systems. The most serious toxicity involves the cardiovascular system and the CNS, with
the most common cardiovascular effects being tachycardia and mild hypotension. [30].
CLOZAPINE
Clozapine is a dibenzodiazepine derivative (consult Table 2.1) that was the first of the atypical
antipsychotics to be developed [24,30].
Properties of clozapine are due to the combination of a low affinity for the D2 receptors along
with strong affinity to serotonergic, adrenergic and cholinergic receptors. This property is
present in many SGAs, so these drugs cause fewer movement disorders as side effects [14].
This drug is efficient in treating the delusions, hallucinations, and disorganization of
schizophrenic patients. It has also been demonstrated that clozapine can improve the negative
symptoms of schizophrenia, such as lack of emotion [30,39]. It has been shown to have other
clinical advantages over FGAs drugs, most notably the ability to improve some aspects of the
cognitive dysfunction of schizophrenia, such as attention, verbal fluency (semantic memory) and
recall [39].
Clozapine is rapidly and completely absorbed with the peak serum concentration occurring
1h30–2h30 after a single dose [38] and its main metabolite is desmethylclozapine [40].
The most common adverse effects include orthostatic hypotension, gastrointestinal symptoms,
and sedation. Seizures may be observed in higher therapeutic doses and in overdose [30].
12 |INTRODUCTION
2.2. DRUGS INTOXICATION
In many countries, intoxication with therapeutic substances exceeds deaths from other types of
toxic agents, especially in suicidal and accidental intoxications. Overprescribing or the supply of
large a quantities of drugs at one time allows excessive stocks of drugs to be easily available to
the public [41].
Deliberate and accidental cases of self-poisoning with psychiatric drugs have become a major
medical problem because of their widespread use and the severity of their toxic actions. This
fact has led to the development of reliable analytical methods for their analysis [17]. The
analysis of these drugs could be also necessary in forensic cases such as driving under the
influence of drugs, cases of violent crime, cases of drug-facilitated sexual assault and cases of
unknown cause of death [6].
Since forensic science is often concerned with determining the basis of death, investigations are
frequently concerned with the influence and effects of toxins. Results of the laboratory
procedures must be interpreted and are often used as evidence in legal cases [7]. Thus, the
detection of drugs in biological samples is very important and useful in ante-mortem and post-
mortem toxicology. Ante-mortem forensic toxicology implies an understanding of drug before
the death and the interpretation of result [42]. While, post-mortem forensic toxicology involves
analyzing body fluids and organs from death cases and interpreting that information [43].
These toxicological studies are now recognized as an integral part of the proper investigation
and evaluation of most medical examiner cases [44]. In sudden unexpected and/or unexplained
deaths toxicology studies are useful and necessary for the final decision regarding the cause and
manner of death [43]. For example, in many cases, the drug or toxic agent is the direct cause of
death, such as by overdose, or may explain the actions of the deceased leading to his death [44].
Also, it is important to investigate a crime scene in order to provide to the toxicology laboratory
an idea of what substances might be present in the body, guiding the research and adapting the
methodology used for their detection[12].
Intoxication can be understood as the set of disorders that derive from the presence of a
substance in the body. There are two forms of intoxication according to the early-onset, severity
and symptomatology, which is usually related to the absorption speed of compounds [45]. Acute
intoxication is due to short-term exposures, with rapid absorption of compound. Concerns a
single dose or multiple doses, but for a brief period, which may be at approximately 24 hours
INTRODUCTION | 13
and the clinical manifestations of poisoning are fast [45]. On the other hand, chronic intoxication
is due to a repeated exposure to the compound, during a long period of time. The mechanism
may occur due to the following causes: first, the compound accumulates in the body as the
elimination rate is less than the absorption. Secondly, effects generated by exposures are added
[45].
It is important to clarify that there is a difference between drug, poison and toxic substance. A
drug is a substance or composition, characterized by having properties, that is used to treat or
prevent a disease or to treat symptoms of a disease or injury [45,46]. Poison is a substance that
has an inherent ability to produce adverse effects on the body, whether it is an illness, injury, or
death [45,46]. While toxic is any chemical agent that after entering the body, change
biochemical elements essential to life [45]. However, it is important to keep in mind that any
substance can be harmful and produce balance disorders in the biological cell. Only the amount
and time over which the substance is administered will allow to determine how harmful it will be
[7,45,46].
Thus, the main issue of the toxicity of a compound is its dose [7,45], which makes it necessary to
introduce some concepts related to levels of drug ingested. Therapeutic levels are the steady
state concentrations that need to be reached for the drug to exert a significant clinical benefit
without causing unacceptable side effects [47]. So the use of the word therapeutic implies a
concentration at which a useful response is obtained free from any toxicity [48]. And toxic levels
are concentrations above which unacceptable (concentration dependent) side or toxic effects
might appear. [47]. However, if a concentration is in the fatal range then it is capable of causing
death [48].
In the Table 2.2 are the Therapeutic, Toxic and Lethal Concentrations for each drug that is
subject of the study in this project. The drugs that are used for the treatment of psychiatric
illness can be misused (for suicide attempts, as an example), so it is important that the physician
balances the benefit of pharmacotherapy against the risk of drug overdose.
So, it can be said that another common applications of post-mortem toxicology data is its use to
define therapeutic, toxic and fatal doses for drugs. This is useful when establishing a possible
role of a drug in a case [48].
14 |INTRODUCTION
Table 2.2- Toxic concentrations, Lethal concentrations and recommended therapeutic range for
psychotropic drugs [47].
Psychotropic drug Therapeutic Concentration
(mg/L)
Toxic Concentration
(mg/L)
Lethal Concentration
(mg/L)
Citalopram 1 0.02-0.2 _ 0.5
Clozapine 2 0.1-0.6 0.8-1.3 3
Haloperidol 2 0.005- 0.015 0.05-0.1 0.5
1 Matrice: plasma
2 Matrice: serum
Control of dosage is the basis of almost all safety assessment in the use of chemicals [49]. There
are drugs that are difficult to define safe and toxic concentrations in the post-mortem setting
[48]. Because, although dosage and time are the main factors determining whether or not a
particular substance will produce a given effect, there are other factors that influence response,
including route of exposure, species and individual differences, sex, age, nutrition, and disease
[49].
2.2.1. MANNER OF DEATH BY THE USE OF DRUGS
The manner of death is the category that describes the circumstances that led to infliction of the
cause of death [7]. Cases related to therapeutic drugs can involve a variety of special
considerations [12]. It can be divided in natural or violent, where the first one involves disease or
can be due to the effects of a drug, considered also natural deaths [7,12]. The second one is
subdivided in accidental, homicidal, or suicidal. In other words involve some form of physical
trauma [7].
Accidental intoxications is the most common type of intoxications and can result from several
circumstances [45]. It can occur in a casual way despite the right indication, dose and route of
administration. In other situations, it results from self-medication, lack of knowledge about side
effects of drugs and possible actions resulting from simultaneous administration with other
drugs [45]. It can also be caused by mistakes in the administration of the drug, like medication
error or dosing error [12,45]. On the other hand, it may result from an automated action, which
occurs in chronic treatments. For example, when an individual, by negligence, takes an amount
INTRODUCTION | 15
of the drug prescribed higher than the normal, leading to overdosing [45]. Drug intoxication
occurring in children, are mostly accidental, depending on circumstances such as the attractive
appearance and accessibility of drug [12,45]. Another example is the recreational use of drugs,
where in most cases a death intoxication due to acute toxic effects of the drug is considered as
an accident [12].
The voluntary drug intoxication is the most common method of attempted suicide in developed
countries [45]. In fact, according to several studies, suicide by drug intoxication is more common
in women than in men [45]. To be considered that a death by intoxication is a suicide, it requires
evidence which indicates that the individual purposefully ended his/her life [12]. In these cases
elevated levels of drugs (that are not typically used for recreational abuse purpose), or the
presence of massive amounts of drugs are found within the stomach [12].
Homicidal poisonings are relatively rare, mainly due to the difficulties in their administration
without the victim's knowledge [12,45]. However, in cases where the main goal is to diminish
the strength of the victim in order to commit the crime itself, like sexual assault on liberty or
property crimes, this usage turns to be very common [45].
2.2.1.1. INTOXICATIONS BY PSYCHOTROPIC DRUGS
One of the most commonly used methods of self-injury worldwide is drug overdose [50]. A
study was made to compare the Suicidal overdoses of PD between younger and adults in New
York City, whose suicide was determined by the Office of the Medical Examiner to be the result
of intentional poisoning or overdose from 1990 through 2006. It was demonstrated that victims
of suicidal overdose aged 18–59 had significantly higher rates of death contributed by
antidepressants, where female overdose victims had significantly higher rates. Here it can be
concluded that antidepressants do not always prevent suicide and that some classes of
antidepressants can cause or contribute to overdose death [51].
Fatalities have also been reported at therapeutic concentrations of the second-generation
antipsychotic drugs, and as they are increasingly prescribed even among adolescents, they may
play a significant role in many intoxications even though they are considered relatively safe [15].
According to the Annual Report of the American Association of Poison Control Centers, the
antidepressants and antipsychotics are referred as the substances most frequently involved in
16 |INTRODUCTION
human exposures. The AP are the second and the antidepressants are the third Categories with
largest numbers of deaths [52].
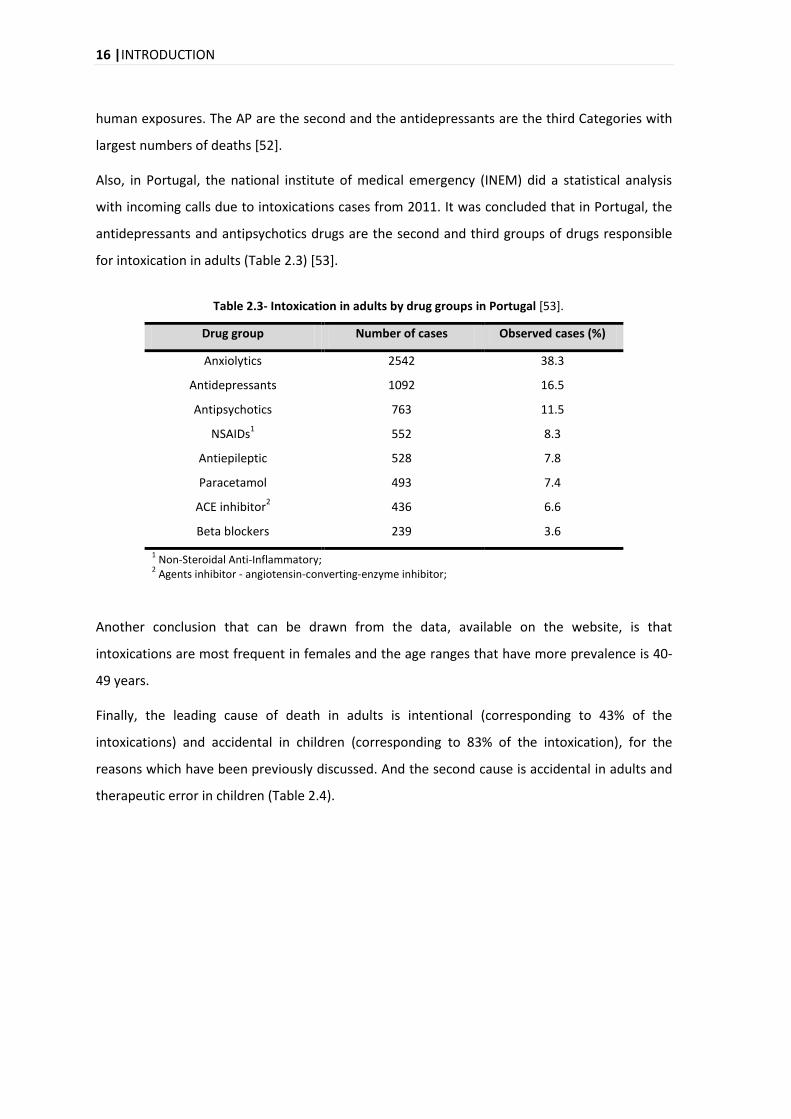
Also, in Portugal, the national institute of medical emergency (INEM) did a statistical analysis
with incoming calls due to intoxications cases from 2011. It was concluded that in Portugal, the
antidepressants and antipsychotics drugs are the second and third groups of drugs responsible
for intoxication in adults (Table 2.3) [53].
Table 2.3- Intoxication in adults by drug groups in Portugal [53].
Drug group Number of cases Observed cases (%)
Anxiolytics 2542 38.3
Antidepressants 1092 16.5
Antipsychotics 763 11.5
NSAIDs1 552 8.3
Antiepileptic 528 7.8
Paracetamol 493 7.4
ACE inhibitor2 436 6.6
Beta blockers 239 3.6
1 Non-Steroidal Anti-Inflammatory;
2 Agents inhibitor - angiotensin-converting-enzyme inhibitor;
Another conclusion that can be drawn from the data, available on the website, is that
intoxications are most frequent in females and the age ranges that have more prevalence is 40-
49 years.
Finally, the leading cause of death in adults is intentional (corresponding to 43% of the
intoxications) and accidental in children (corresponding to 83% of the intoxication), for the
reasons which have been previously discussed. And the second cause is accidental in adults and
therapeutic error in children (Table 2.4).
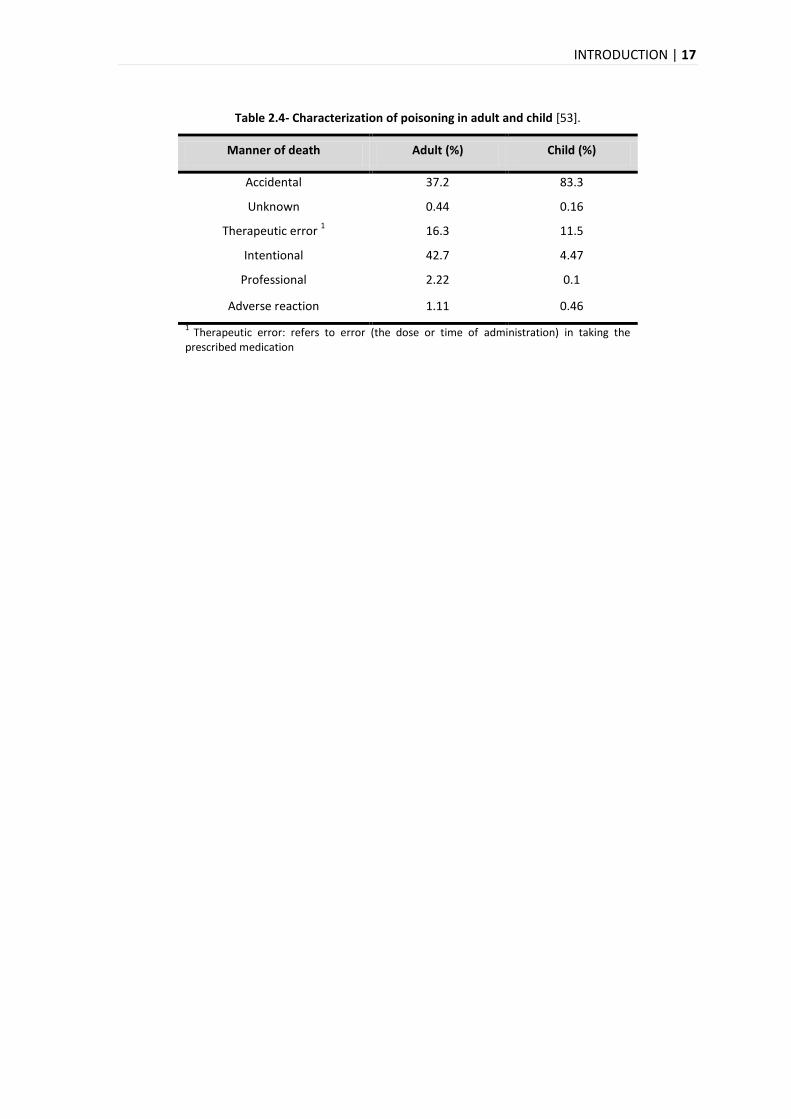
INTRODUCTION | 17
Table 2.4- Characterization of poisoning in adult and child [53].
Manner of death Adult (%) Child (%)
Accidental 37.2 83.3
Unknown 0.44 0.16
Therapeutic error 1 16.3 11.5
Intentional 42.7 4.47
Professional 2.22 0.1
Adverse reaction 1.11 0.46
1 Therapeutic error: refers to error (the dose or time of administration) in taking the
prescribed medication
18 | INTRODUCTION
2.3. BIOLOGICAL MATRICES
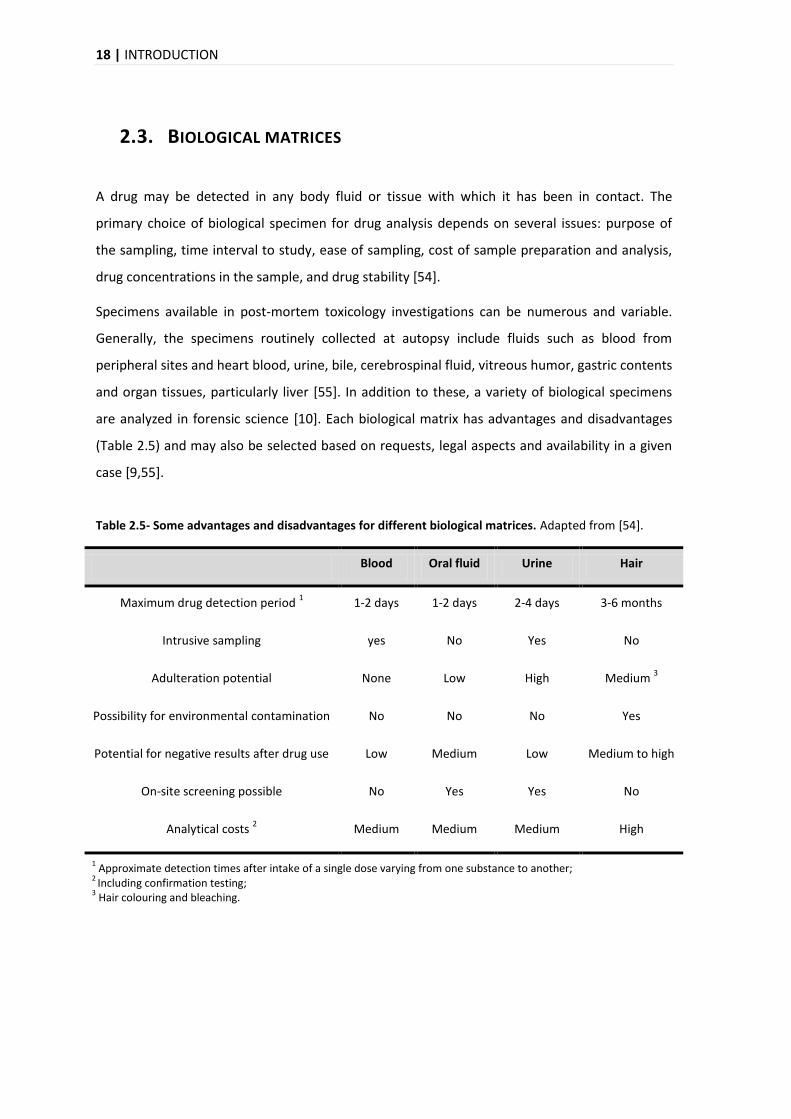
A drug may be detected in any body fluid or tissue with which it has been in contact. The
primary choice of biological specimen for drug analysis depends on several issues: purpose of
the sampling, time interval to study, ease of sampling, cost of sample preparation and analysis,
drug concentrations in the sample, and drug stability [54].
Specimens available in post-mortem toxicology investigations can be numerous and variable.
Generally, the specimens routinely collected at autopsy include fluids such as blood from
peripheral sites and heart blood, urine, bile, cerebrospinal fluid, vitreous humor, gastric contents
and organ tissues, particularly liver [55]. In addition to these, a variety of biological specimens
are analyzed in forensic science [10]. Each biological matrix has advantages and disadvantages
(Table 2.5) and may also be selected based on requests, legal aspects and availability in a given
case [9,55].
Table 2.5- Some advantages and disadvantages for different biological matrices. Adapted from [54].
Blood Oral fluid Urine Hair
Maximum drug detection period 1 1-2 days 1-2 days 2-4 days 3-6 months
Intrusive sampling yes No Yes No
Adulteration potential None Low High Medium 3
Possibility for environmental contamination No No No Yes
Potential for negative results after drug use Low Medium Low Medium to high
On-site screening possible No Yes Yes No
Analytical costs 2 Medium Medium Medium High
1 Approximate detection times after intake of a single dose varying from one substance to another;
2 Including confirmation testing;
3 Hair colouring and bleaching.
INTRODUCTION | 19
Of course one of the most important points to choose the biological matrix is the knowledge
about the stability of analytes in biological material. This is crucial to ensure the reliability of
analytical results, since there are gaps between sample collection, transport to the laboratory
and the time of analysis [9].
Blood and urine are the most common specimens used for the analysis of drugs of abuse in post-
mortem cases [10,11]. But if a probable death by overdose or intoxication is identified,
additional questions may arise such as the route of administration, a long-term or an exclusively
recent use/exposure to a drug or poison. In these cases, additional and alternative specimens
such as hair, nails or skin samples may be needed [55].
2.3.1. PLASMA
Urine is the sample of choice for non-target comprehensive screening and for identification of
unknown drugs. However, blood, plasma, or serum sometimes must be used for at least a
limited screening especially for target analytes within multi-analyte procedures [56].
When plasma samples are used, care must be taken, for example, with anticoagulants because it
can cause interference with some drugs and assay systems. However, in the absence of such
effects, there are no clinically significant differences between serum and plasma, and either may
be used [57]. Pharmacokinetic factors such as dose, volumes of distribution, and elimination
half-life are also important when laboratory aspects of clinical toxicology are being considered.
For example, if the volume of distribution is lower, the amount of drug available in the
peripheral plasma for testing purposes is larger [57].
Plasma is traditionally used in clinical settings because blood affords advanced handling in the
laboratory procedures [55]. In vivo, the physiological effects of most drugs are directly
correlated with their concentrations in blood, plasma and serum, a fact that serves as the basis
for therapeutic drug monitoring [8,9].
Drug concentrations provided in literature are usually determined from these fluids. And this is
important since analytical results obtained from post-mortem blood are compared valuably with
levels previously reported in therapeutic and toxic conditions [55]. Therefore, these matrices are
preferred for quantitative analysis when interpretation of concentrations and effects are
required [8,9].
20 | INTRODUCTION
Multi-analyte procedures for screening and quantification of drugs in blood, plasma, or serum
are relevant tools in these fields because they allow the analysis of several important
compounds with a single sample extract injection, thus saving time and resources [56].
2.3.2. HAIR
In the last decade, alternative or unconventional matrices have becoming more important in the
field of toxicology, mainly because the advantages when compared with ‘conventional’ samples
used in laboratorial routine analysis [58]. Urine and saliva sampling is non-invasive and has been
widely used because of ease of collection, however the main disadvantage of these specimens is
the short window of detection [10].
In recent years, remarkable advances in sensitive analytical techniques have enabled the analysis
of drugs in unconventional samples such as hair [59]. This alternative matrix offers more several
advantages like non-invasive collection, and good stability during storage at room temperature
and transport conditions [54,58,60]. However, the most important advantage of hair analysis
compared with other human matrices is the much larger detection window [58,61] (weeks to
months, depending on the length of the hair shaft, against 2–4 days for most matrices), which
allows the retrospective detection of chronic exposure to drugs up to years back [58,60,61].
In fact, hair grows at approximately 1 cm per month, and it is possible to associate the drug
distribution pattern in the analyzed segments with a period in the past [58,62]. Segments of
single hair may be downsized to 1 mm length if hair concentration and detection limits provide
so [62].
The precise mechanisms involved in the incorporation of drugs into hair remain unclear
requiring further investigation [63]. However, there are various incorporation models that are
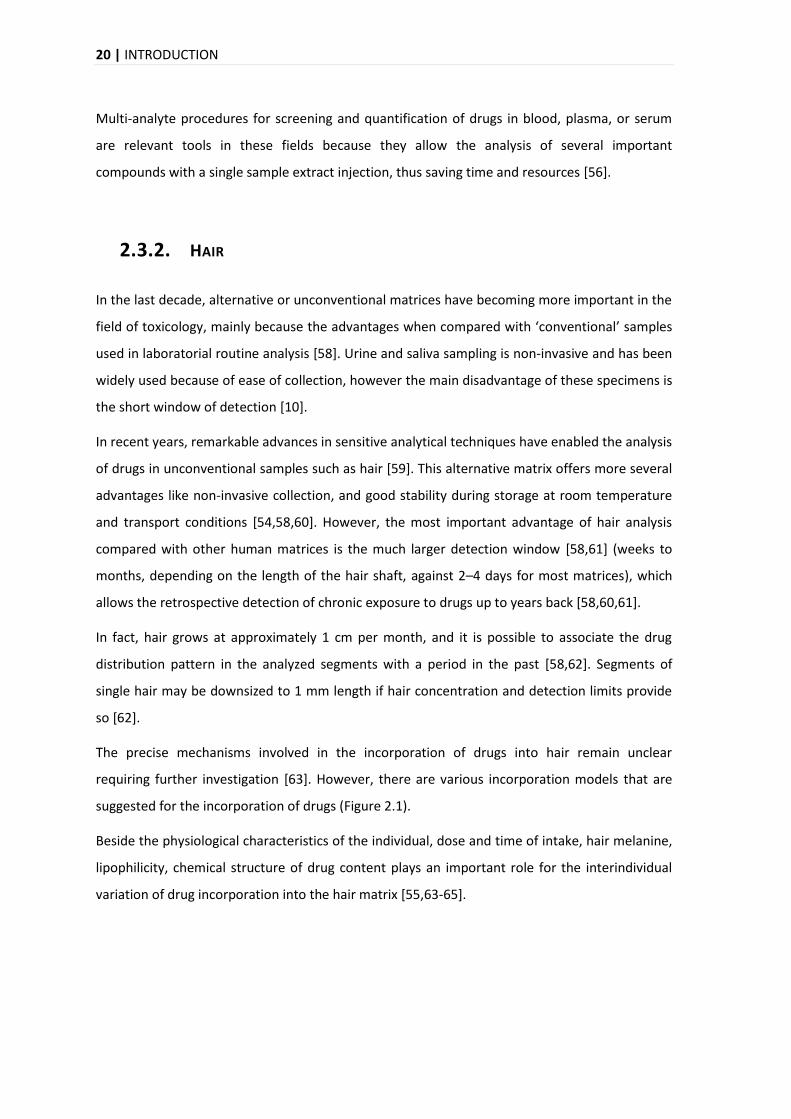
suggested for the incorporation of drugs (Figure 2.1).
Beside the physiological characteristics of the individual, dose and time of intake, hair melanine,
lipophilicity, chemical structure of drug content plays an important role for the interindividual
variation of drug incorporation into the hair matrix [55,63-65].
INTRODUCTION | 21
Figure 2.1- Incorporation and elimination mechanisms of drugs in hair. The main mechanism that is typically assumed is the one where the drug enters in the hair by passive diffusion from blood capillaries. Besides incorporation from blood, drugs can be incorporated, with some time delay, from deep skin compartments during hair shaft formation. The other mechanism that is suggested and widely accepted is deposition by diffusion from sweat or sebum secretions into the completed hair shaft. The substances can also be deposited from the external environment, like pollution, smoke and dirty hands. However some losses may occur due to the use of hair cosmetics and ultraviolet radiation. Adapted from [63].
However, the hair analysis has some disadvantages, like low concentrations of some compounds
and metabolites, and limited amount of sample supplied for testing [58]. And the most
important disadvantage is the fact that substances can be deposited from the external
contamination (Figure 2.1) [58,63]. So, if adequate measures are not taken, the risk of reporting
false positive results increases, which is unacceptable, especially when there are legal
implications of drug consumption. Therefore, to minimize this effect it is strongly recommended
that hair analysis procedures include a washing step [58].
Hair analysis is becoming a routine practice in forensic toxicology laboratories [58,61]. Until
now, most applications of hair testing have focused on forensic considerations [66], mainly for
the detection of illicit drugs owing back to long-term drug consumption [61,64]. However,
another exciting application of hair analysis is in the clinical cases, because hair analysis
22 | INTRODUCTION
complements blood and urine analyses by providing long-term information on an individual’s
drug use [61,64-66].
In addition to the above applications, the hair drug analysis is employed in a wide range of
situations, such as workplace drug testing, driving ability probation, doping control, chronic drug
abuse intoxication, clarify cause of death, or discover drug use (violence, rape, prison cases, and
social cases)[60,67]. In these cases, rapid and secure screening methods are therefore very
important [67]. A drug screening in hair can also contribute to the identification of unknown
corpses. In such cases, a systematic toxicological analysis, that means the general search for
toxic substances in the hair sample, should be performed [61].


ANALYTICAL METHODOLOGIES FOR PSYCHOTROPIC DRUG ANALYSIS | 25
3. ANALYTICAL METHODOLOGIES FOR PSYCHOTROPIC DRUG
ANALYSIS
3.1. ANALYTICAL METHODOLOGIES FOR SAMPLE PREPARATION
The presence of interfering compounds in complex matrices is a challenge to accomplish reliable
results [42,68]. Therefore, the main objective of sample preparation is to convert a real
biological matrix into a form suitable for analysis by the desired analytical technique [69].
The pre-treatment of samples to separate drugs and metabolites from the matrices prior the
analysis aims to reduce matrix effects via removal of potential interferences [70,71]. This is a
fundamental part of the quantitative bioanalysis and is usually the most critical and time-
consuming step when using chromatography or affinity techniques for drug analysis in biological
matrices [42,68,72].
The first aim of sample preparation is the removal of potential interferences such as proteins
and lipids [69,71,72]. In chromatography, proteins increase the baseline, cause noise, and may
even ruin chromatographic columns [69,71,72]. The presence of interferences can also influence
the ionization efficiency in the mass spectrometers, may block the ion source and contribute to
ion suppression for mass spectrometry (MS) assays [69,71-73].
The second aim of sample preparation is to increase the concentration of analytes to achieve
adequate signal intensities. The simplest form of enrichment is drying the sample and
reconstituting it in a smaller solvent volume [69]. The enrichment is usually performed by
extraction methods, protein precipitation (PP), liquid–liquid extraction (LLE), and solid-phase
extraction (SPE) [68-70]. Each of these methods has advantages as well as disadvantages [68].
The optimum choice of one is specific for the respective analyte but also for the individual
MS/MS system [71].
26 | ANALYTICAL METHODOLOGIES FOR PSYCHOTROPIC DRUG ANALYSIS
3.1.1. SAMPLE PREPARATION OF PLASMA
3.1.1.1. PROTEIN PRECIPITATION
A simple work-up method for blood, plasma or serum samples is PP [80]. Probably this is the
simplest way to separate proteins from small molecules in biological fluids [69] and it is clearly
an attractive sample preparation technique because it’s fast and has a good recovery of polar
analytes compared with some SPE and LLE procedures [70]. This technique may be used for
‘cleaner’ matrices such as serum or plasma [16]. However, the precipitated proteins may bind
various small molecules and remove them from the solution. This may influence quantification,
which has to be taken into account [69].
The theoretical basis of PP is the interaction between the reagent and the protein (directly or
indirectly) [73]. Either an organic solvent (typically acetonitrile, methanol or ethanol) or an acid
(typically trichloroacetic acid or perchloric acid) is added to a sample to denature the proteins
[68,69,71]. However, precipitation with miscible organic solvents is the most commonly used for
plasma sample preparation method because of its low cost and minimal method development
requirements [74].
The procedure generally begins with the addition of an internal standard (IS). Then a volume of
protein precipitation reagent equal to three or four times the sample volume is added to each
biological sample [68,73]. The mixture is agitated to increase the aggregation speed of the
proteins. The supernatant, which contains the analyte, is then separated from the protein
aggregate after centrifugation [69,71,73]. Protein precipitation may be performed alone or in
conjunction with another extraction technique [68]. However, this technique does not allow
concentration of the analytes; instead, typically a dilution of at least 1:2 is obtained [71].
This method is applicable to a range of LC-MS methods relevant to toxicology [70,73] because it
provides sufficient clean-up for most LC–MS analyses [74].
3.1.2. SAMPLE PREPARATION OF HAIR
There is always the possibility that a drug in hair does not originate from consumption but has
been incorporated from external sources [66]. And of course, contaminants of hair would be a
problem if they were drugs of abuse and if they interfered with the analysis and interpretation
of the test results [75].
ANALYTICAL METHODOLOGIES FOR PSYCHOTROPIC DRUG ANALYSIS | 27
Thus basically, cleaning the hair sample of external contamination is necessary for two reasons.
First, residues of hair products (wax, shampoo, hair sprays) as well as sweat, sebum and dust
typically present on hair lead to increased analytical noise/background. Second, drugs could
adhere from the environment of the individual and potentially contribute to incorrect test
results [63]. To minimize this effect it is strongly recommended that hair analysis procedures
include a washing step [54,58]. This can, however, affect the extraction efficiencies of
incorporated drugs and must be considered when interpreting quantitative results [54].
Although, basic and lipophilic drugs are well incorporated into hair and less susceptible to wash-
out effects [62].
One of the prerequisites of solvents used for hair decontamination is that this should remove
external impurities as completely as possible, but not extract drugs from the hair matrix
[63].There is no general consensus with respect to the hair washing procedure. For example, one
washing sequence for post-mortem hair samples is composed of 0.1% sodium dodecylsulfate in
water, distilled water and acetone. Another procedure that is very used includes one or two
washes with dichloromethane [63,75]. Non-protic solvents such as dichloromethane or acetone
are advantageous because they do not swell the hair thereby extracting materials from the hair
[63].
Another step prior to extraction is the cut of the hair typically between 1–3 mm lengths.
Alternatively, hair may be processed by grinding. However, this latter approach generally results
in loss of sample material and does not improve the extraction process [63].
There are currently no direct methods for the detection of drugs in the hair matrix. Extractions
with methanol, extraction by aqueous acids or buffer solutions, digestion of the hair with
aqueous Sodium hydroxide are examples of extraction procedures that are more used
[54,63,75].
The extraction yield depends on the drug’s structure, the state of the hair matrix, polarity of the
solvent, duration and manner of extraction [66]. More precisely, in order to make the
appropriate choice, the chemical structure of the drug and its sensitivity to agents used for
sample preparation must be considered [63].
Clean-up methods used for this purpose are similar to those used in drug isolation from plasma
or urine. Although procedures for liquid–liquid as well as solid phase extraction have been
described, the latter method is normally used [63]. In this project the clean up of the hair
samples was performed using OMIX Tip C18. This pipette tip contains a small bed of
28 | ANALYTICAL METHODOLOGIES FOR PSYCHOTROPIC DRUG ANALYSIS
functionalized monolithic sorbent (C18) and it can work as a miniaturized solid phase extraction
bed for hydrophobic compounds clean up prior to MS.
3.2. LIQUID CHROMATOGRAPHY COUPLED TO MASS SPECTROMETRY
(LC-MS)
Medical examiners determine the cause and manner of death, frequently requiring analysis of
fluids and tissues for the presence of drugs and metabolites. In current practice, most medical
examiner laboratories screen fluids using immunoassays. Despite being sensitive and capable of
high specimen throughput, the matrix effects and substances similar in structure to analytes of
interest often cause false positive results [76]. For this reason it is important that specimens with
positive immunoassay results are confirmed by chromatographic methods [7,76].
Over the last twenty years there has been a growing interest in the development of
methodologies for qualitative and quantitative analysis of several drugs in post-mortem matrices
[42]. Liquid chromatography coupled to mass spectrometry is increasingly being used in clinical
and forensic toxicology for the identification and quantification of a wide range of compounds in
biological samples [60,67] and is often the method of choice because the sensitivity, selectivity
and the relatively high throughput that can be achieved [77]. With this technique, the
determination of multiple groups of compounds can be performed in a single method [60].
Usually it is used for compounds that are not volatile and are not suitable for gas
chromatography [78]. Some of the advantages of this technique include easier sample
preparation, derivatization procedures are avoided, and short analysis time [60,67].
Because, the chromatography separation is not sufficient to allow unequivocal identification,
further information is usually required from an auxiliary technique [79]. This can be achieve with
the combination of high performance liquid chromatography (HPLC) with mass spectrometry
that allows more definitive identification and the quantitative determination of compounds, that
have similar retention characteristics but a different mass spectra [79]. Mass spectrometer
provides not only structural information from the molecule under investigation but it may also
provide the molecular weight of the analyte [79].
Tandem mass spectrometry (MS/MS) in combination with Liquid chromatography (LC) now
dominates the analytical field, providing a particularly convenient tool in the analysis of PD [16].
ANALYTICAL METHODOLOGIES FOR PSYCHOTROPIC DRUG ANALYSIS | 29
Recent advances in this technology enabled the detection and quantification of these drugs
present in biological matrices in exceptionally low concentrations [16,72]. The basic information
of the procedures normally used for quantification of PD drugs by LC-MS in plasma and hair is
summarized in Table 3.1 and Table 3.2, respectively.
3.2.1. LIQUID CHROMATOGRAPHY
In liquid chromatography, the substances are separated based on differential solubilities in the
mobile liquid and stationary solid phases, with identification based on retention times within a
column [76]. The time required for an analyte to elute from a chromatographic column with a
particular mobile phase is termed its retention time (RT) [79]. This interaction may be due to
different physical properties and one that is considered is the relative polarities of the species
involved [79-81].
High-performance liquid chromatography (HPLC) is the term used to describe LC in which the
liquid mobile phase is mechanically pumped through a column that contains the stationary
phase [82]. Thus, in an HPLC system, a liquid sample (or a solid sample dissolved in a suitable
solvent) is introduced into a column which contains two immiscible phases: the stationary phase
(contained in a column) and the liquid mobile phase (which flows through the column)
[80,81,83].
The interaction of the analyte with the stationary phase may be adsorption, partition, size
exclusion, affinity, and ion exchange [82]. In adsorption chromatography the solute molecules
are in contact with both the stationary phase and the mobile phase, simultaneously [79-81,84].
When the analytes interact with the stationary phase, the polar solutes will be retained longest
by polar stationary phases, and nonpolar solutes will be retained best by nonpolar stationary
phases [82,84].
30 | ANALYTICAL METHODOLOGIES FOR PSYCHOTROPIC DRUG ANALYSIS
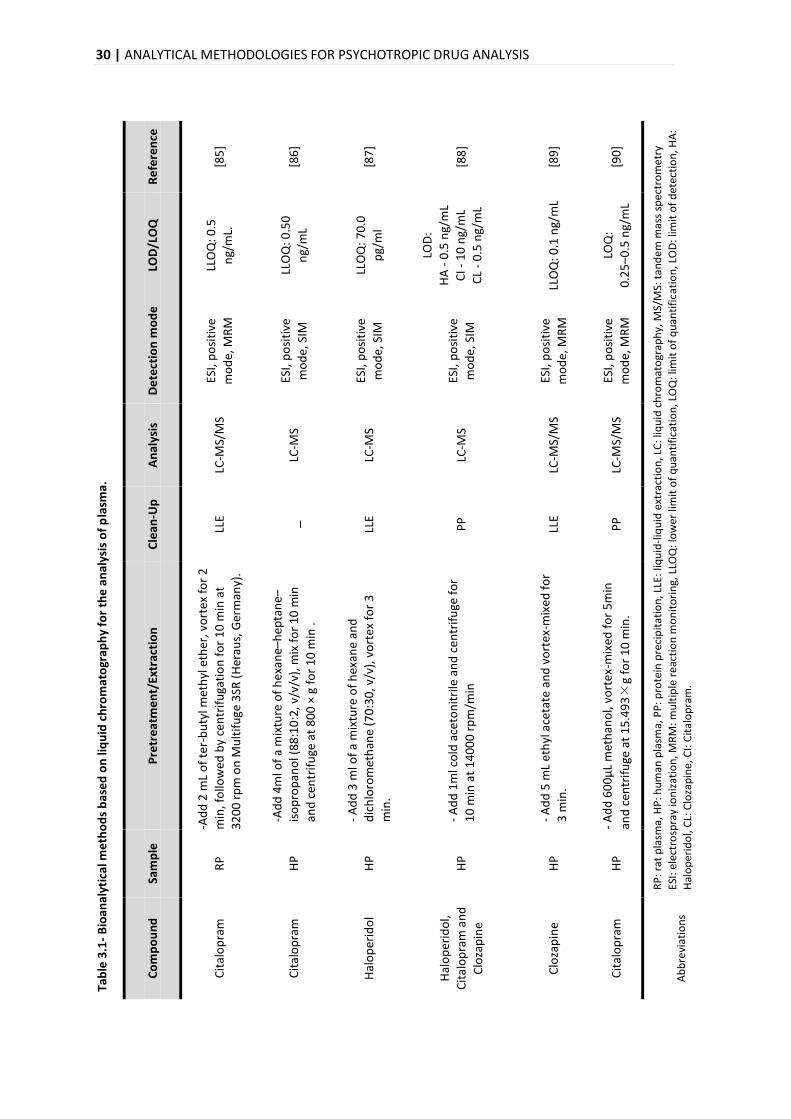
Tab
le 3
.1-
Bio
anal
ytic
al m
eth
od
s b
ase
d o
n li
qu
id c
hro
mat
ogr
aph
y fo
r th
e a
nal
ysis
of
pla
sma.
Re
fere
nce
[85
]
[86
]
[87
]
[88
]
[89
]
[90
]
RP
: rat
pla
sma,
HP
: hu
man
pla
sma,
PP
: pro
tein
pre
cip
itat
ion
, LLE
: liq
uid
-liq
uid
ext
ract
ion
, LC
: liq
uid
ch
rom
ato
grap
hy,
MS/
MS:
tan
de
m m
ass
spec
tro
met
ry
ESI:
ele
ctro
spra
y io
niz
atio
n, M
RM
: mu
ltip
le r
eact
ion
mo
nit
ori
ng,
LLO
Q: l
ow
er li
mit
of
qu
anti
fica
tio
n, L
OQ
: lim
it o
f q
uan
tifi
cati
on
, LO
D: l
imit
of
det
ecti
on
, HA
:
Hal
op
erid
ol,
CL:
Clo
zap
ine,
CI:
Cit
alo
pra
m.
LOD
/LO
Q
LLO
Q: 0
.5
ng/
mL.
LLO
Q: 0
.50
ng/
mL
LLO
Q: 7
0.0
pg/
ml
LOD
:
HA
- 0
.5 n
g/m
L
CI -
10
ng/
mL
CL
- 0
.5 n
g/m
L
LLO
Q: 0
.1 n
g/m
L
LOQ
:
0.2
5–
0.5
ng/
mL
De
tect
ion
mo
de
ESI,
po
siti
ve
mo
de,
MR
M
ESI,
po
siti
ve
mo
de,
SIM
ESI,
po
siti
ve
mo
de,
SIM
ESI,
po
siti
ve
mo
de,
SIM
ESI,
po
siti
ve
mo
de,
MR
M
ESI,
po
siti
ve
mo
de,
MR
M
An
alys
is
LC-M
S/M
S
LC-M
S
LC-M
S
LC-M
S
LC-M
S/M
S
LC-M
S/M
S
Cle
an-U
p
LLE _
LLE
PP
LLE
PP
Pre
tre
atm
en
t/Ex
trac
tio
n
-Ad
d 2
mL
of
ter-
bu
tyl m
eth
yl e
ther
, vo
rtex
fo
r 2
min
, fo
llow
ed b
y ce
ntr
ifu
gati
on
fo
r 1
0 m
in a
t
32
00
rp
m o
n M
ult
ifu
ge 3
SR (
Her
aus,
Ger
man
y).
-Ad
d 4
ml o
f a
mix
ture
of
hex
ane
–hep
tan
e–
iso
pro
pan
ol (
88
:10
:2, v
/v/v
), m
ix f
or
10
min
and
cen
trif
uge
at
80
0 ×
g f
or
10
min
.
- A
dd
3 m
l of
a m
ixtu
re o
f h
exan
e an
d
dic
hlo
rom
eth
ane
(70
:30
, v/v
), v
ort
ex f
or
3
min
.
- A
dd
1m
l co
ld a
ceto
nit
rile
an
d c
entr
ifu
ge f
or
10
min
at
14
00
0 r
pm
/min
- A
dd
5 m
L et
hyl
ace
tate
an
d v
ort
ex-m
ixed
fo
r
3 m
in.
- A
dd
60
0μ
L m
eth
ano
l, vo
rtex
-mix
ed f
or
5m
in
and
cen
trif
uge
at
15
.49
3×
g fo
r 1
0 m
in.
Sam
ple
RP
HP
HP
HP
HP
HP
Co
mp
ou
nd
Cit
alo
pra
m
Cit
alo
pra
m
Hal
op
erid
ol
Hal
op
erid
ol,
Cit
alo
pra
m a
nd
Clo
zap
ine
Clo
zap
ine
Cit
alo
pra
m
Ab
bre
viat
ion
s
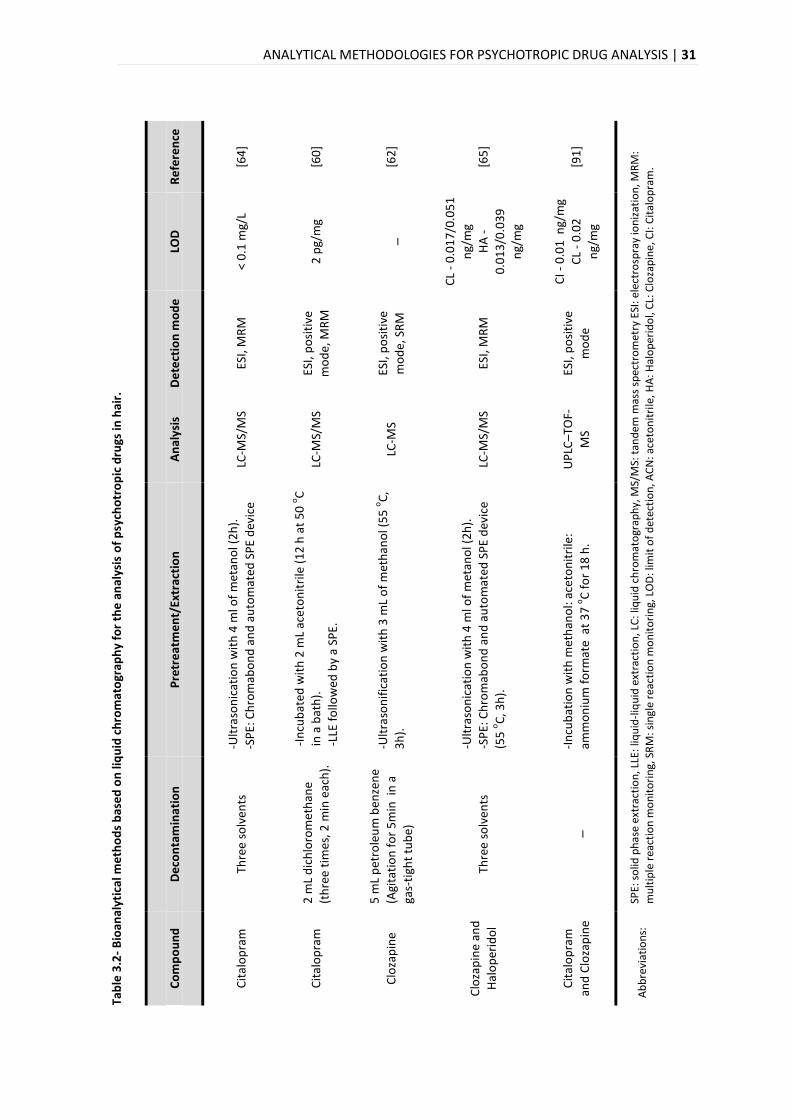
ANALYTICAL METHODOLOGIES FOR PSYCHOTROPIC DRUG ANALYSIS | 31
Tab
le 3
.2-
Bio
anal
ytic
al m
eth
od
s b
ase
d o
n li
qu
id c
hro
mat
ogr
aph
y fo
r th
e a
nal
ysis
of
psy
cho
tro
pic
dru
gs in
hai
r.
Re
fere
nce
[64
]
[60
]
[62
]
[65
]
[91
]
SPE:
so
lid p
has
e ex
trac
tio
n, L
LE:
liqu
id-l
iqu
id e
xtra
ctio
n, L
C: l
iqu
id c
hro
mat
ogr
aph
y, M
S/M
S: t
and
em m
ass
spec
tro
met
ry E
SI: e
lect
rosp
ray
ion
izat
ion
, MR
M:
mu
ltip
le r
eact
ion
mo
nit
ori
ng,
SR
M: s
ingl
e re
acti
on
mo
nit
ori
ng,
LO
D: l
imit
of
det
ecti
on
, AC
N: a
ceto
nit
rile
, HA
: Hal
op
erid
ol,
CL:
Clo
zap
ine,
CI:
Cit
alo
pra
m.
LOD
< 0
.1 m
g/L
2 p
g/m
g
_
CL
- 0
.01
7/0
.05
1
ng/
mg
HA
-
0.0
13
/0.0
39
ng/
mg
CI -
0.0
1 n
g/m
g
CL
- 0
.02
ng/
mg
De
tect
ion
mo
de
ESI,
MR
M
ESI,
po
siti
ve
mo
de,
MR
M
ESI,
po
siti
ve
mo
de,
SR
M
ESI,
MR
M
ESI,
po
siti
ve
mo
de
An
alys
is
LC-M
S/M
S
LC-M
S/M
S
LC-M
S
LC-M
S/M
S
UP
LC–T
OF-
MS
Pre
tre
atm
en
t/Ex
trac
tio
n
-Ult
raso
nic
atio
n w
ith
4 m
l of
met
ano
l (2
h).
-SP
E: C
hro
mab
on
d a
nd
au
tom
ated
SP
E d
evic
e
-In
cub
ated
wit
h 2
mL
acet
on
itri
le (
12
h a
t 5
0 ο
C
in a
bat
h).
-LLE
fo
llow
ed b
y a
SPE.
-Ult
raso
nif
icat
ion
wit
h 3
mL
of
met
han
ol (
55
οC
,
3h
).
-Ult
raso
nic
atio
n w
ith
4 m
l of
met
ano
l (2
h).
-SP
E: C
hro
mab
on
d a
nd
au
tom
ated
SP
E d
evic
e
(55
οC
, 3h
).
-In
cub
atio
n w
ith
met
han
ol:
acet
on
itri
le:
amm
on
ium
fo
rmat
e a
t 3
7 ο
C f
or
18
h.
De
con
tam
inat
ion
Thre
e so
lven
ts
2 m
L d
ich
loro
met
han
e
(th
ree
tim
es, 2
min
eac
h).
5 m
L p
etro
leu
m b
enze
ne
(Agi
tati
on
fo
r 5
min
in
a
gas-
tigh
t tu
be)
Thre
e so
lven
ts
_
Co
mp
ou
nd
Cit
alo
pra
m
Cit
alo
pra
m
Clo
zap
ine
Clo
zap
ine
and
Hal
op
erid
ol
Cit
alo
pra
m
and
Clo
zap
ine
Ab
bre
viat
ion
s:
32 | ANALYTICAL METHODOLOGIES FOR PSYCHOTROPIC DRUG ANALYSIS
The widely used chromatographic mode to separate several classes of compounds, based on
their hydrophobicity, is reversed-phase chromatography [79,80,84]. Here, the stationary phase is
less polar than the mobile phase [69,79,80], the interaction between analyte and the stationary
phase has a predominantly hydrophobic (apolar) character [69]. Thus, the more polar analytes
elute more rapidly than the less polar ones [79,80] and a decrease in the polarity of the mobile
phase results in a decrease in solute retention [82]. Reversed-phase chromatography typically
refers to the use of chemically bonded stationary phases, such silica-based alkyl (C4, C8, C18),
[69,79,80,84].
The mobile phases used in reversed-phase chromatography are mostly polar solvents such as
water, acetonitrile, methanol, and isopropanol [69,82,84]. In LC-MS certain chemicals (ionic
modifier) are often added to the mobile phase to influence analyte ionization. Small organic
acids like formic and acetic acid are among the most commonly used additives. They improve
ionization and resolution of a wide range of molecules [80].
The RT can be controlled by changing polarity of the mobile phase. For example, increasing the
polarity of the mobile phase leads to longer retention times, whereas shorter retention times
require a mobile phase of lower polarity [80].
With the developed of an elution gradient, the RT also can be controlled. In this mode of elution
the initial mobile-phase composition is relatively polar and as the separation progresses, the
mobile phase’s composition is made less polar [80,84]. In the case of the isocratic, the solvent
composition remains constant throughout the analysis [82,84].
3.2.2. MASS SPECTROMETRY
The mass spectrometer provides the most definitive identification of all of the HPLC detectors.
The molecular weight of the analyte together with the structural information that may be
generated, allows an unequivocal identification [79].
The first step in the mass spectrometric analysis of compounds is the production of gas phase
ions of the compound [78]. Thereby, the effluent from the HPLC column is directed to the
ionization source of the mass spectrometer [81]. These ions are then introduced in several
stages to the high vacuum region of the mass analyzer, where the ions are separated by mass to
charge ratio and measured by the detector [76,78,81].
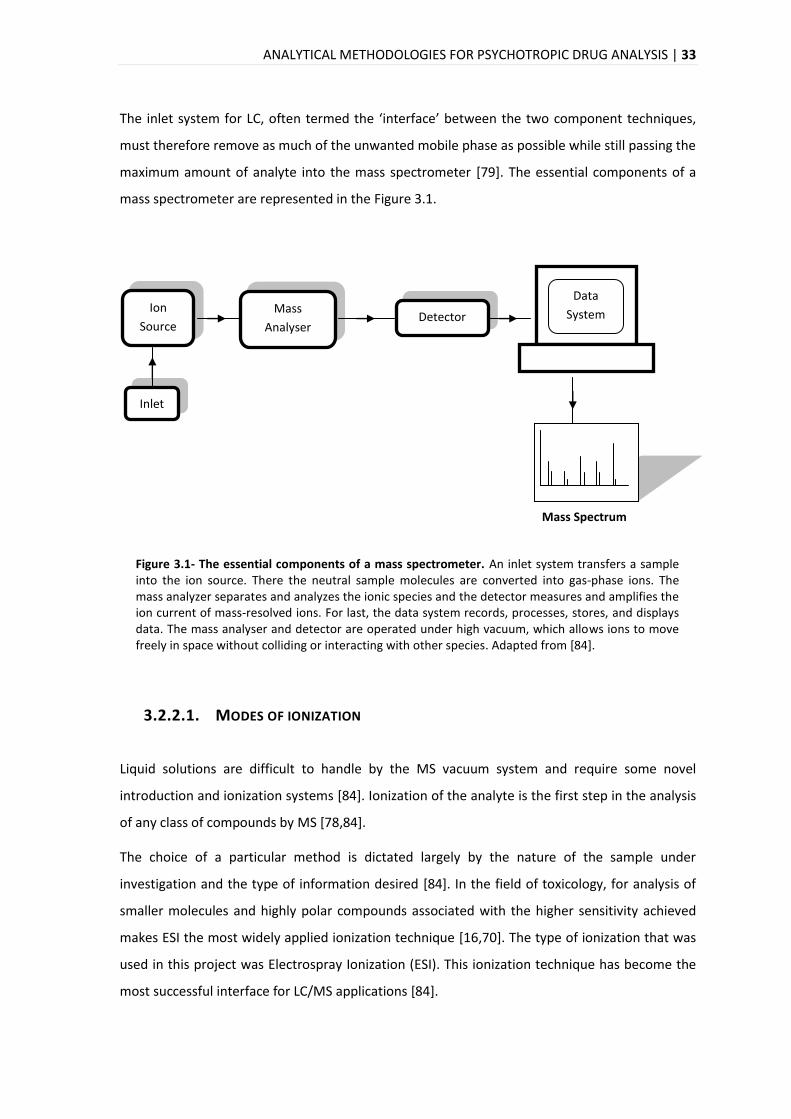
ANALYTICAL METHODOLOGIES FOR PSYCHOTROPIC DRUG ANALYSIS | 33
The inlet system for LC, often termed the ‘interface’ between the two component techniques,
must therefore remove as much of the unwanted mobile phase as possible while still passing the
maximum amount of analyte into the mass spectrometer [79]. The essential components of a
mass spectrometer are represented in the Figure 3.1.
Figure 3.1- The essential components of a mass spectrometer. An inlet system transfers a sample into the ion source. There the neutral sample molecules are converted into gas-phase ions. The mass analyzer separates and analyzes the ionic species and the detector measures and amplifies the ion current of mass-resolved ions. For last, the data system records, processes, stores, and displays data. The mass analyser and detector are operated under high vacuum, which allows ions to move freely in space without colliding or interacting with other species. Adapted from [84].
3.2.2.1. MODES OF IONIZATION
Liquid solutions are difficult to handle by the MS vacuum system and require some novel
introduction and ionization systems [84]. Ionization of the analyte is the first step in the analysis
of any class of compounds by MS [78,84].
The choice of a particular method is dictated largely by the nature of the sample under
investigation and the type of information desired [84]. In the field of toxicology, for analysis of
smaller molecules and highly polar compounds associated with the higher sensitivity achieved
makes ESI the most widely applied ionization technique [16,70]. The type of ionization that was
used in this project was Electrospray Ionization (ESI). This ionization technique has become the
most successful interface for LC/MS applications [84].
Inlet
Ion
Source
Mass
Analyser Detector
Data
System
Mass Spectrum
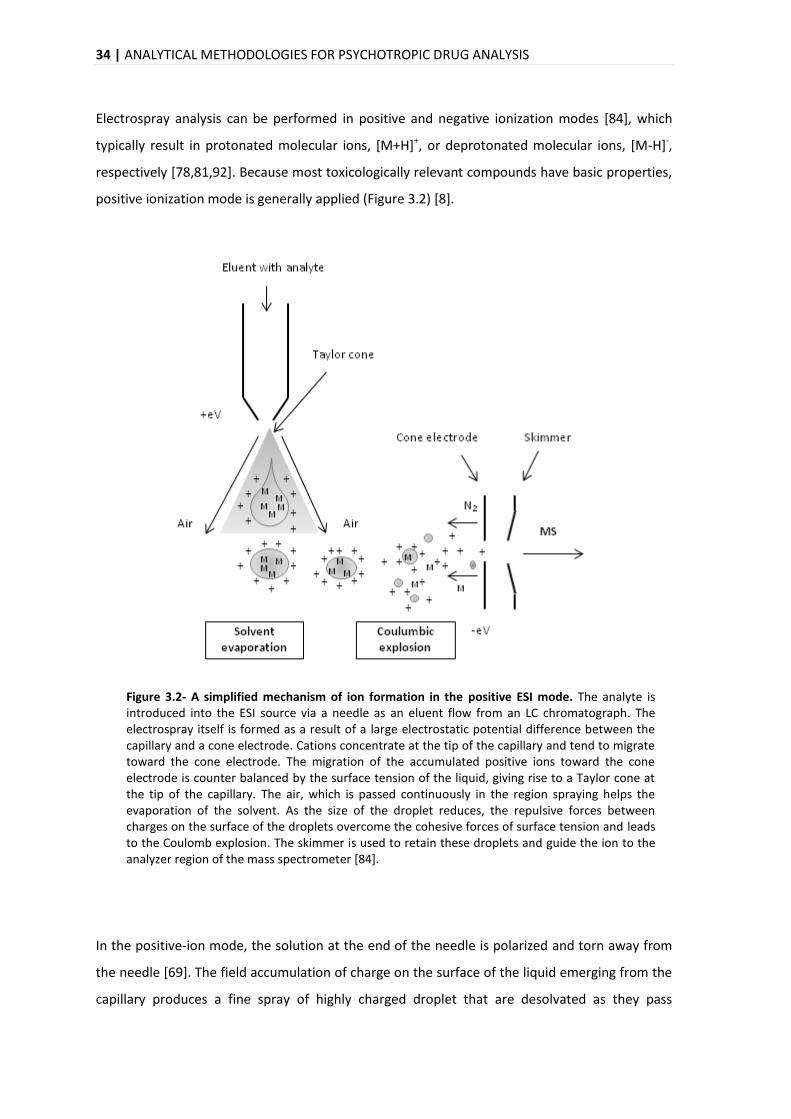
34 | ANALYTICAL METHODOLOGIES FOR PSYCHOTROPIC DRUG ANALYSIS
Electrospray analysis can be performed in positive and negative ionization modes [84], which
typically result in protonated molecular ions, [M+H]+, or deprotonated molecular ions, [M-H]-,
respectively [78,81,92]. Because most toxicologically relevant compounds have basic properties,
positive ionization mode is generally applied (Figure 3.2) [8].
Figure 3.2- A simplified mechanism of ion formation in the positive ESI mode. The analyte is introduced into the ESI source via a needle as an eluent flow from an LC chromatograph. The electrospray itself is formed as a result of a large electrostatic potential difference between the capillary and a cone electrode. Cations concentrate at the tip of the capillary and tend to migrate toward the cone electrode. The migration of the accumulated positive ions toward the cone electrode is counter balanced by the surface tension of the liquid, giving rise to a Taylor cone at the tip of the capillary. The air, which is passed continuously in the region spraying helps the evaporation of the solvent. As the size of the droplet reduces, the repulsive forces between charges on the surface of the droplets overcome the cohesive forces of surface tension and leads to the Coulomb explosion. The skimmer is used to retain these droplets and guide the ion to the analyzer region of the mass spectrometer [84].
In the positive-ion mode, the solution at the end of the needle is polarized and torn away from
the needle [69]. The field accumulation of charge on the surface of the liquid emerging from the
capillary produces a fine spray of highly charged droplet that are desolvated as they pass
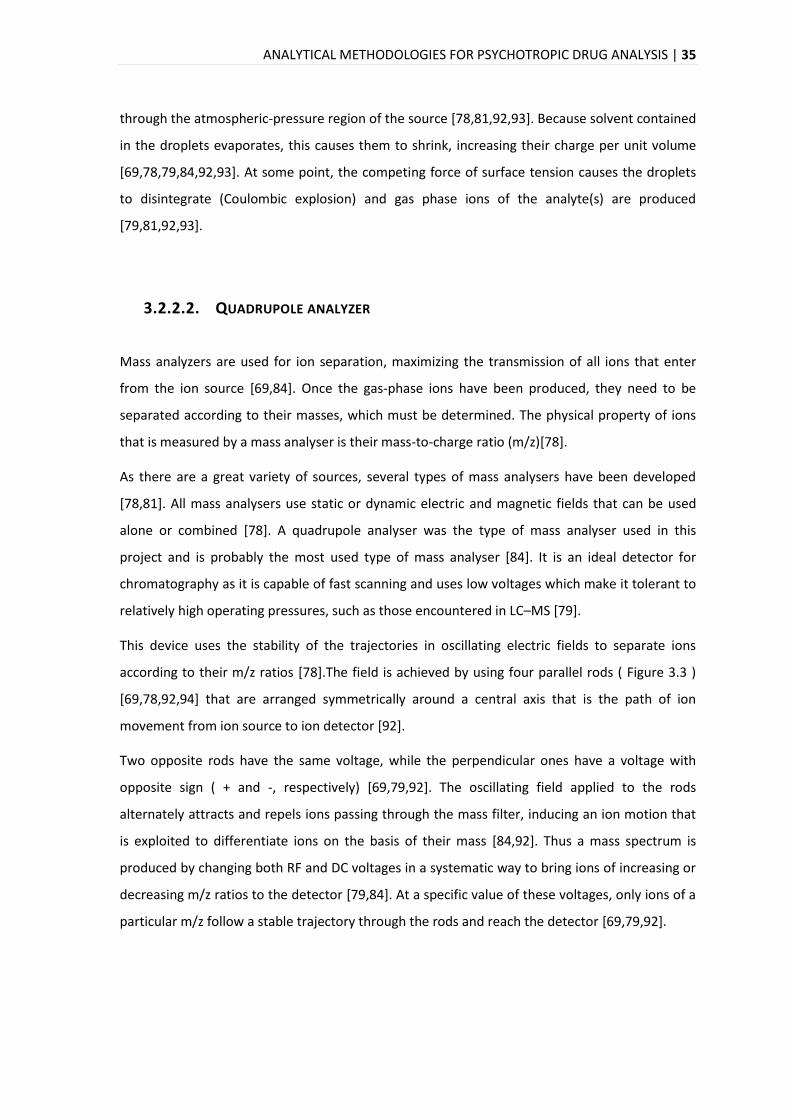
ANALYTICAL METHODOLOGIES FOR PSYCHOTROPIC DRUG ANALYSIS | 35
through the atmospheric-pressure region of the source [78,81,92,93]. Because solvent contained
in the droplets evaporates, this causes them to shrink, increasing their charge per unit volume
[69,78,79,84,92,93]. At some point, the competing force of surface tension causes the droplets
to disintegrate (Coulombic explosion) and gas phase ions of the analyte(s) are produced
[79,81,92,93].
3.2.2.2. QUADRUPOLE ANALYZER
Mass analyzers are used for ion separation, maximizing the transmission of all ions that enter
from the ion source [69,84]. Once the gas-phase ions have been produced, they need to be
separated according to their masses, which must be determined. The physical property of ions
that is measured by a mass analyser is their mass-to-charge ratio (m/z)[78].
As there are a great variety of sources, several types of mass analysers have been developed
[78,81]. All mass analysers use static or dynamic electric and magnetic fields that can be used
alone or combined [78]. A quadrupole analyser was the type of mass analyser used in this
project and is probably the most used type of mass analyser [84]. It is an ideal detector for
chromatography as it is capable of fast scanning and uses low voltages which make it tolerant to
relatively high operating pressures, such as those encountered in LC–MS [79].
This device uses the stability of the trajectories in oscillating electric fields to separate ions
according to their m/z ratios [78].The field is achieved by using four parallel rods ( Figure 3.3 )
[69,78,92,94] that are arranged symmetrically around a central axis that is the path of ion
movement from ion source to ion detector [92].
Two opposite rods have the same voltage, while the perpendicular ones have a voltage with
opposite sign ( + and -, respectively) [69,79,92]. The oscillating field applied to the rods
alternately attracts and repels ions passing through the mass filter, inducing an ion motion that
is exploited to differentiate ions on the basis of their mass [84,92]. Thus a mass spectrum is
produced by changing both RF and DC voltages in a systematic way to bring ions of increasing or
decreasing m/z ratios to the detector [79,84]. At a specific value of these voltages, only ions of a
particular m/z follow a stable trajectory through the rods and reach the detector [69,79,92].
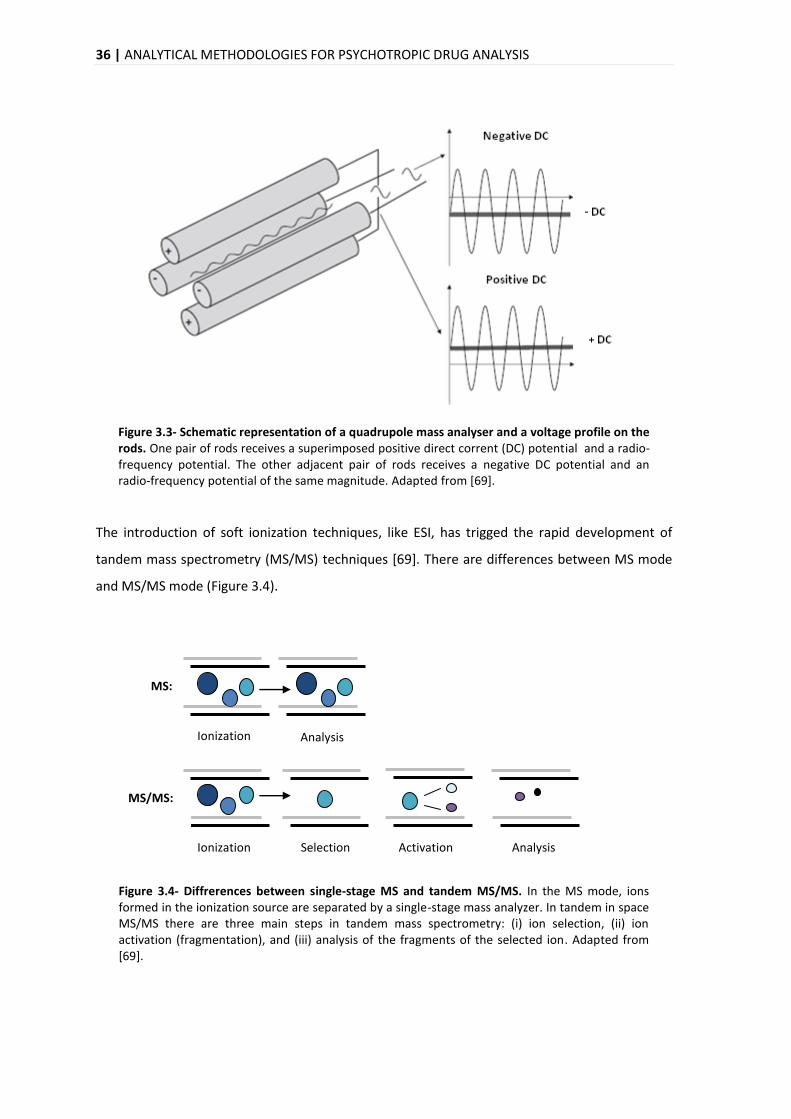
36 | ANALYTICAL METHODOLOGIES FOR PSYCHOTROPIC DRUG ANALYSIS
Figure 3.3- Schematic representation of a quadrupole mass analyser and a voltage profile on the rods. One pair of rods receives a superimposed positive direct corrent (DC) potential and a radio-frequency potential. The other adjacent pair of rods receives a negative DC potential and an radio-frequency potential of the same magnitude. Adapted from [69].
The introduction of soft ionization techniques, like ESI, has trigged the rapid development of
tandem mass spectrometry (MS/MS) techniques [69]. There are differences between MS mode
and MS/MS mode (Figure 3.4).
Figure 3.4- Diffrerences between single-stage MS and tandem MS/MS. In the MS mode, ions formed in the ionization source are separated by a single-stage mass analyzer. In tandem in space MS/MS there are three main steps in tandem mass spectrometry: (i) ion selection, (ii) ion activation (fragmentation), and (iii) analysis of the fragments of the selected ion. Adapted from [69].
Ionization Analysis
MS:
Ionization Selection Activation Analysis
MS/MS:
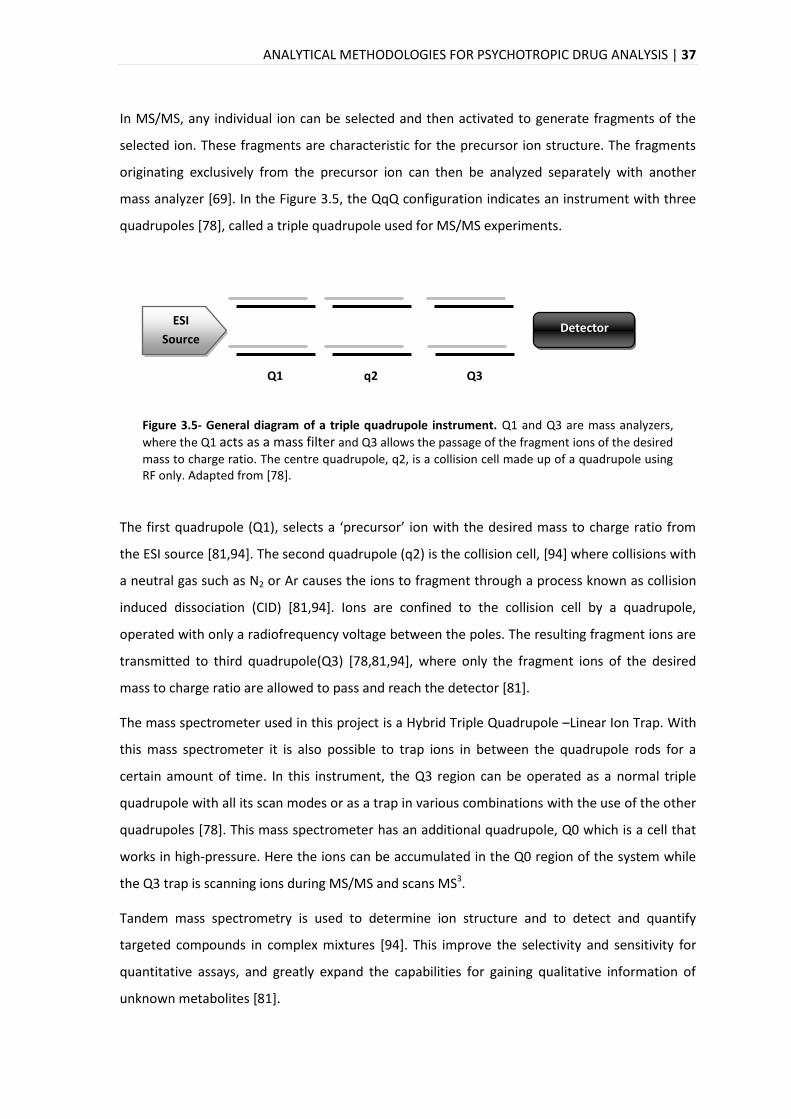
ANALYTICAL METHODOLOGIES FOR PSYCHOTROPIC DRUG ANALYSIS | 37
In MS/MS, any individual ion can be selected and then activated to generate fragments of the
selected ion. These fragments are characteristic for the precursor ion structure. The fragments
originating exclusively from the precursor ion can then be analyzed separately with another
mass analyzer [69]. In the Figure 3.5, the QqQ configuration indicates an instrument with three
quadrupoles [78], called a triple quadrupole used for MS/MS experiments.
Figure 3.5- General diagram of a triple quadrupole instrument. Q1 and Q3 are mass analyzers,
where the Q1 acts as a mass filter and Q3 allows the passage of the fragment ions of the desired
mass to charge ratio. The centre quadrupole, q2, is a collision cell made up of a quadrupole using RF only. Adapted from [78].
The first quadrupole (Q1), selects a ‘precursor’ ion with the desired mass to charge ratio from
the ESI source [81,94]. The second quadrupole (q2) is the collision cell, [94] where collisions with
a neutral gas such as N2 or Ar causes the ions to fragment through a process known as collision
induced dissociation (CID) [81,94]. Ions are confined to the collision cell by a quadrupole,
operated with only a radiofrequency voltage between the poles. The resulting fragment ions are
transmitted to third quadrupole(Q3) [78,81,94], where only the fragment ions of the desired
mass to charge ratio are allowed to pass and reach the detector [81].
The mass spectrometer used in this project is a Hybrid Triple Quadrupole –Linear Ion Trap. With
this mass spectrometer it is also possible to trap ions in between the quadrupole rods for a
certain amount of time. In this instrument, the Q3 region can be operated as a normal triple
quadrupole with all its scan modes or as a trap in various combinations with the use of the other
quadrupoles [78]. This mass spectrometer has an additional quadrupole, Q0 which is a cell that
works in high-pressure. Here the ions can be accumulated in the Q0 region of the system while
the Q3 trap is scanning ions during MS/MS and scans MS3.
Tandem mass spectrometry is used to determine ion structure and to detect and quantify
targeted compounds in complex mixtures [94]. This improve the selectivity and sensitivity for
quantitative assays, and greatly expand the capabilities for gaining qualitative information of
unknown metabolites [81].
ESI
Source
Q1 q2 Q3
Detector
38 | ANALYTICAL METHODOLOGIES FOR PSYCHOTROPIC DRUG ANALYSIS
3.2.2.3. MULTIPLE REACTION MONITORING (MRM)
Liquid chromatography-tandem mass spectrometry (LC-MS/MS) using a triple quadrupole mass
spectrometer operated in multiple reaction monitoring mode (MRM) is the method of choice for
quantitative bioanalysis of small molecules (Figure 3.6) [81,84]. And this one was the mode that
was used in this project.
The two levels of selectivity in the MRM experiment, combined with the chromatographic
separation, provided a very high level of selectivity [81]. Depending on the resolving power of
the first mass analyzer, ions can be selected either monoisotopically or with multiple isotopes
[69].
Figure 3.6- Schemating representation of Multiple reaction monitoring. Here a specific m/z value is selected in Q1 and is fragmented in q2. Q3 is set to transmit only ions of a selected m/z rather than scanning the entire fragment ion spectrum . Adapted from [78].
The Q1 (on QqQ scheme) is set to the m/z value of the precursor (first mass analysis step, MS1).
Then is induced to dissociate (fragment) via CID in a collision region of the mass spectrometer
(q2 on QqQ). Finally, a specific, structurally distinct fragment ion (product ion) is mass selected
in Q3 (second mass analysis step, MS2) and detected [69,84,94,95]. Since higher sensitivity is
desired, the Q3 is not scanned over a wide mass range of the fragments but, instead, it is set up
to monitor only a selected fragment, or fragments [69,84,94].
The term MRM refers to the monitoring of more than one reaction, either from the same
precursor or from more than one precursor [84]. This technique is very useful for quantitation
[69] and provides enhanced selectivity in quantitative analysis, leading to increased confidence
of the analyte of interest being monitored [95].
ESI
Source
Q1 q2 Q3
Detector
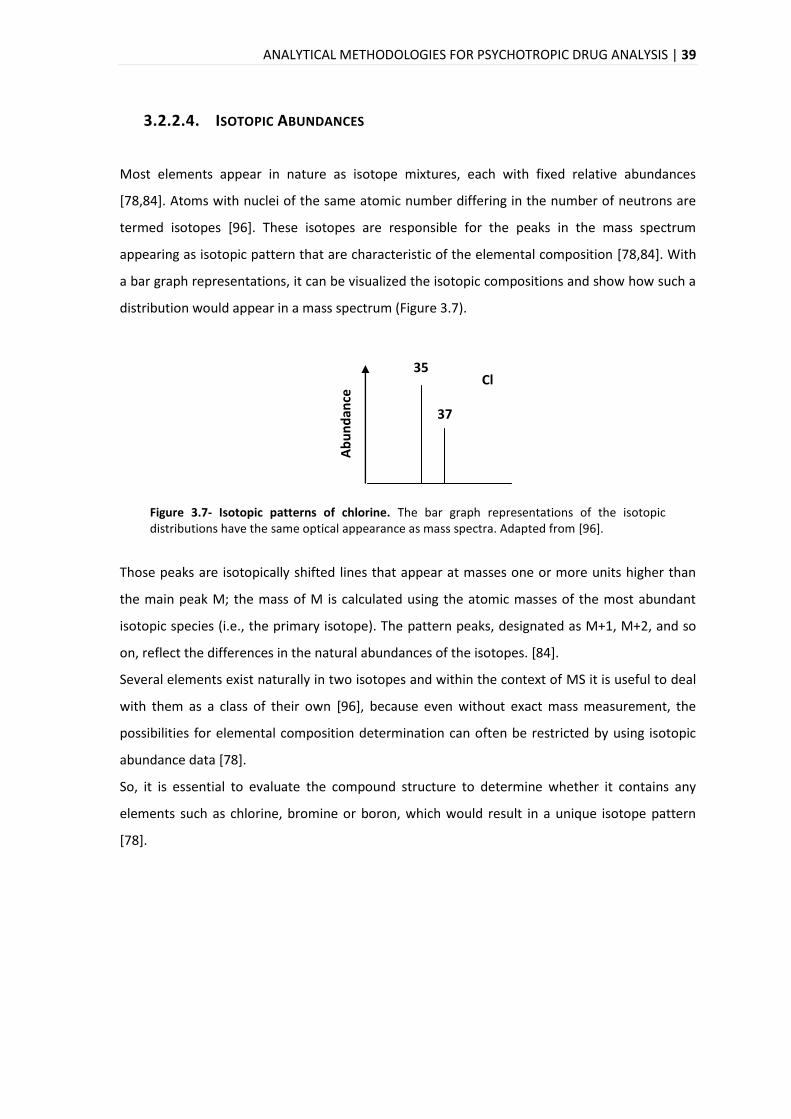
ANALYTICAL METHODOLOGIES FOR PSYCHOTROPIC DRUG ANALYSIS | 39
3.2.2.4. ISOTOPIC ABUNDANCES
Most elements appear in nature as isotope mixtures, each with fixed relative abundances
[78,84]. Atoms with nuclei of the same atomic number differing in the number of neutrons are
termed isotopes [96]. These isotopes are responsible for the peaks in the mass spectrum
appearing as isotopic pattern that are characteristic of the elemental composition [78,84]. With
a bar graph representations, it can be visualized the isotopic compositions and show how such a
distribution would appear in a mass spectrum (Figure 3.7).
Figure 3.7- Isotopic patterns of chlorine. The bar graph representations of the isotopic distributions have the same optical appearance as mass spectra. Adapted from [96].
Those peaks are isotopically shifted lines that appear at masses one or more units higher than
the main peak M; the mass of M is calculated using the atomic masses of the most abundant
isotopic species (i.e., the primary isotope). The pattern peaks, designated as M+1, M+2, and so
on, reflect the differences in the natural abundances of the isotopes. [84].
Several elements exist naturally in two isotopes and within the context of MS it is useful to deal
with them as a class of their own [96], because even without exact mass measurement, the
possibilities for elemental composition determination can often be restricted by using isotopic
abundance data [78].
So, it is essential to evaluate the compound structure to determine whether it contains any
elements such as chlorine, bromine or boron, which would result in a unique isotope pattern
[78].
Ab
un
dan
ce
35
37
Cl
40 | ANALYTICAL METHODOLOGIES FOR PSYCHOTROPIC DRUG ANALYSIS
3.3. ANALYTICAL METHOD VALIDATION
Due to the increasing interdependence among the countries during the last years, it has become
necessary for the results of many analytical methods to be acceptable internationally.
Consequently, the need for and use of validated methods has increased [97]. The international
scientific community needs published research results that are valid, reproducible and
comparable. In addition, the ‘client of the laboratory’ will have the implicit expectation of
correct results [98].
To ensure that an analytical method generates reliable information, it must be validated. The
International Organization for Standardization (ISO) defines validation as the confirmation by
examination and provision of objective evidence that the particular requirements for a specified
intended use are fulfilled. By another words, method validation is the process of defining an
analytical requirement, and confirming that the method under consideration has performance
capabilities consistent with what the application requires [99].
Method validation is usually considered to be very closely tied to method development, indeed
it is often not possible to determine exactly where method development finishes and validation
begins [99].
Reliable analytical data are a prerequisite for correct interpretation of toxicological findings in
the evaluation of scientific studies, as well as in daily routine work [100,101]. There are legal
reasons, technical and commercial for the need of implementation of validation methods. The
cost of carrying out the analyzes is high and additional costs arise from decisions made on the
basis of the results [99]. The results are used by others for case report interpretation, by judicial
authorities for implementation of legal measures and by medical doctors for patient treatment
[98]. So, unreliable results might not only be contested in court, but could also lead to
unjustified legal consequences for the defendant or to wrong treatment of the patient [101].
In several countries, judicial authorities impose proficiency testing and/or accreditation
according to the ISO standards on laboratories performing analysis of certain samples in a
forensic or clinical setting [98]. Therefore, quality management and accreditation have become
matters of increasing importance in analytical toxicology in recent years [100,101].
However, all these guidelines not often provide a practical approach to how validation should
occur in a particular laboratory setting [98].
ANALYTICAL METHODOLOGIES FOR PSYCHOTROPIC DRUG ANALYSIS| 41
Owing to the importance of method validation in the whole field of analytical chemistry, a
number of guidance documents about bioanalytical methods in which are definitions,
procedures and parameters of validation, were published. This subject has been issued by
papers, reviews and conferences [97,100-103]. However, there is no consensus on the extent of
validation experiments and on acceptance criteria for validation parameters of bioanalytical
methods in forensic and clinical toxicology [101].
International organizations such as ISO, IUPAC (International Union of Pure and Applied
Chemistry), EMA (European Medicines Agency), FDA (Food and Drug Administration) and
EUROCHEM group [99,104-106], also publish parameters and methodologies for analytical
method validation. Guidance documents for analytical method validation differ between them,
which creates confusion about the nomenclature and concepts. A single set of global guidelines
and use of the same terminology still remains the ultimate goal for full method comparison [91].
Method validation includes all of the procedures required to demonstrate that a method to
quantify the concentration of an analyte (or series of analytes) in a particular biological matrix is
reliable for the intended application [107]. Any modification of an analytical method would
require revalidation of the procedures [108].
It is essential to employ well-characterized and fully validated analytical methods to yield
reliable results which can be satisfactorily interpreted [108]. In this way, all of the variables of
the method should be considered, including sampling procedure, sample preparation,
chromatographic separation, detection and data evaluation [107].
There is a general agreement that at least the following validation parameters should be
evaluated for quantitative procedures: selectivity, calibration model (linearity), stability,
accuracy, precision (repeatability, intermediate precision), limit of detection and limit of
quantification. Additional parameters which might have to be evaluated include recovery,
reproducibility and robustness [101,109].

MATERIALS AND METHODS| 43
4. MATERIALS AND METHODS
4.1. EQUIPMENTS
System of Liquid Chromatography coupled to a mass spectrometer, with the following
components:
Liquid Chromatography, UltimateTM3000 (LC Packings, Dionex);
ESI source, turbo VTM;
Hybrid triple quadrupole/linear ion trap mass spectrometer, 4000 QTRAP®
(ABSciex);
Software Chromeleon® 6.80 (Dionex) for the LC system;
Software Analyst® 1.5.1 (ABSciex) for MS system.
Analytical balance CP 224S (Sartorius);
Bench-top Centrifuge (Minispin-Eppendorf®);
Concentrator Plus (Eppendorf®) - “speedvac”;
Quick spin, model QS 7000 (Edward Instrument Co);
Sonicator, model VibraCell - SonicsTM 75041 (Bioblock Scientific);
Thermomixer comfort (Eppendorf®);
Vortex, model MS3 basic (IKA®).
4.2. MATERIAL
C18 OMIX Tip - 100µL (Agilent Technologies);
Eppendorf® CombipTip (w/ pre-cutted end);
Micropipettes® Research Plus (Eppendorf®);
Multipipette® Plus (Eppendorf®);
PS – Microplate 384 well, 128.0/85 mm (Greiner bio-one);
Microcentrifuge tubes (500µL, 1.5mL, 2mL)
Vials 500µL (VWR®).
44 |MATERIALS AND METHODS
4.3. STANDARDS AND REAGENTS
Standards:
Citalopram hydrobromide, BIOTREND Chemicals AG (purity 99.8%);
Clozapine, BIOTREND Chemicals AG (purity 99.0%);
Haloperidol, BIOTREND Chemicals AG (purity 99.8%);
Desipramine hydrochloride, Sigma-Aldrich (purity ≥ 98%);
Haloperidol - D4, Cirilliant® (purity 99.2%);
Sulfamethazine-D4.
Reagents:
Acetonitrile (LC Grade, Biosolve) - ACN;
Dichloromethano (Sigma ≥ 99.9%);
Formic Acid (LC Grade, Sigma Aldrich) - FA;
Methanol (LC Grade, Biosolve) – MeOH;
Water (LC Grade, VWR®).
4.4. ANIMAL PROTOCOL
4.4.1. ANIMALS AND DRUG ADMINISTRATION
Young black male C57BL/6J mice were purchased from Charles River, Laboratories International,
Inc (Spain). They were divided into four groups, 5 per group and each animal weighed around 20
- 25 g with access to food and water ad libitum.
After a 1 week habituation period to needle punctuation, the animals were injected, via
intraperitoneal with clozapine, citalopram and haloperidol at a dose of 1 mg/kg, 20 mg/kg and
10 mg/kg, respectively. An additional group was treated with vehicle (control group).
The mice were injected daily for different periods: 1, 2, 4, 8, 15 and 30 days. It was also added a
saline solution control (0.13% HCl at 5 M). Then, the animals were weighed and anesthetised
with a mixture of ketamine and xylazine 24 hours after the final injection.
Animals samples were kindly prepared in Dra. Graça Baltazar’s lab with the help of Sandra Rocha
(University of Beira Interior, Covilhã).
MATERIALS AND METHODS| 45
4.4.2. PLASMA AND HAIR COLLECTION
The blood was collected by cardiac puncture and placed in EDTA-coated tubes. Then the samples
were centrifuged at 12000xg for 2 minutes and the plasma was recovered to another tubes. To
each tube was added protease and phosphatase inhibitors and stored at −80°C.
The hair samples were pulled out with tweezers and placed into a centrifuge tube and were also
stored at -80°C.
Drug-free plasma and hair samples was courtesy of Professor Carlos Duarte’s group of Center for
Neuroscience and Cell Biology (Coimbra, Portugal). The collection procedure of plasma and hair
was similar.
4.5. METHOD DEVELOPMENT The development of a LC-MS method requires the optimization of several parameters. This
optimization refers to an adjustment of instrumental parameters in order to optimize
performance characteristics of each compound.
To set the conditions a direct injection into the mass spectrometer was performed by infusing a
standard solution of each analyte with a syringe pump of 1mL, with a concentration of 0.453 μM
for haloperidol, 1 μM for clozapine, 0.125 μM for citalopram, 1.14 μM for desipramine and 0.1
μM for haloperidol-d4. Each solution was injected one by one with a flow rate of 9 μL/min.
With this procedure, the conditions to the ESI source to apply to substances and the ideal
collision energy (CE) for the fragmentation of each compound were optimized. It was also
optimized the best value for declustering potential (DP) to minimize solvent cluster ions.
Each compound fragmentation spectra was analysed with software Peak ViewTM 1.1.1.2
(ABSciex).
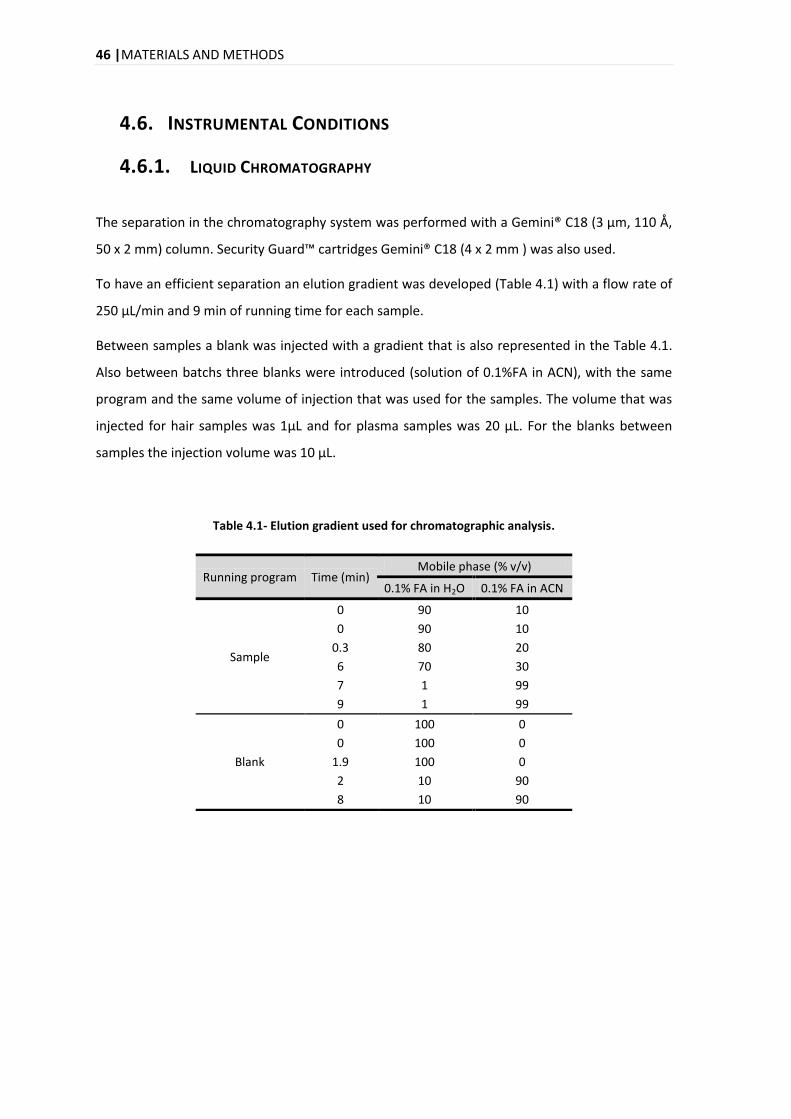
46 |MATERIALS AND METHODS
4.6. INSTRUMENTAL CONDITIONS
4.6.1. LIQUID CHROMATOGRAPHY
The separation in the chromatography system was performed with a Gemini® C18 (3 µm, 110 Å,
50 x 2 mm) column. Security Guard™ cartridges Gemini® C18 (4 x 2 mm ) was also used.
To have an efficient separation an elution gradient was developed (Table 4.1) with a flow rate of
250 μL/min and 9 min of running time for each sample.
Between samples a blank was injected with a gradient that is also represented in the Table 4.1.
Also between batchs three blanks were introduced (solution of 0.1%FA in ACN), with the same
program and the same volume of injection that was used for the samples. The volume that was
injected for hair samples was 1μL and for plasma samples was 20 μL. For the blanks between
samples the injection volume was 10 μL.
Table 4.1- Elution gradient used for chromatographic analysis.
Running program Time (min) Mobile phase (% v/v)
0.1% FA in H2O 0.1% FA in ACN
Sample
0 90 10
0 90 10
0.3 80 20
6 70 30
7 1 99
9 1 99
Blank
0 100 0
0 100 0
1.9 100 0
2 10 90
8 10 90
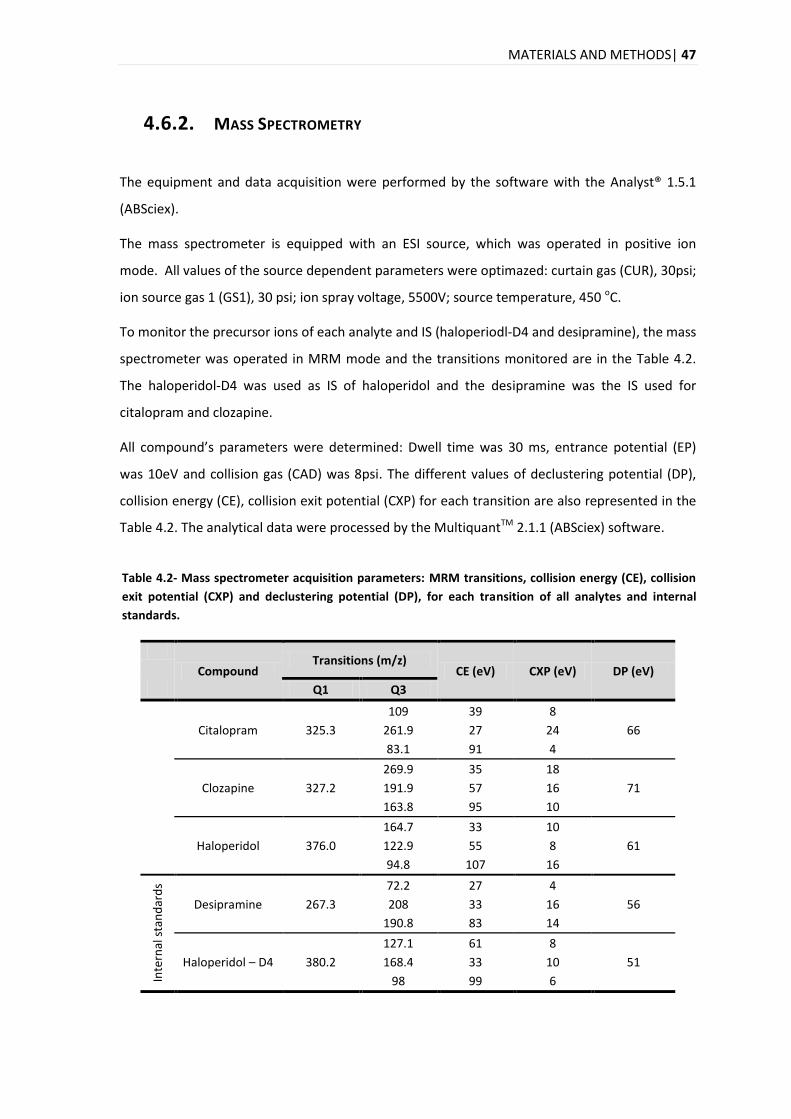
MATERIALS AND METHODS| 47
4.6.2. MASS SPECTROMETRY
The equipment and data acquisition were performed by the software with the Analyst® 1.5.1
(ABSciex).
The mass spectrometer is equipped with an ESI source, which was operated in positive ion
mode. All values of the source dependent parameters were optimazed: curtain gas (CUR), 30psi;
ion source gas 1 (GS1), 30 psi; ion spray voltage, 5500V; source temperature, 450 οC.
To monitor the precursor ions of each analyte and IS (haloperiodl-D4 and desipramine), the mass
spectrometer was operated in MRM mode and the transitions monitored are in the Table 4.2.
The haloperidol-D4 was used as IS of haloperidol and the desipramine was the IS used for
citalopram and clozapine.
All compound’s parameters were determined: Dwell time was 30 ms, entrance potential (EP)
was 10eV and collision gas (CAD) was 8psi. The different values of declustering potential (DP),
collision energy (CE), collision exit potential (CXP) for each transition are also represented in the
Table 4.2. The analytical data were processed by the MultiquantTM 2.1.1 (ABSciex) software.
Table 4.2- Mass spectrometer acquisition parameters: MRM transitions, collision energy (CE), collision
exit potential (CXP) and declustering potential (DP), for each transition of all analytes and internal
standards.
Compound Transitions (m/z)
CE (eV) CXP (eV) DP (eV)
Q1 Q3
Citalopram 325.3
109 39 8
66 261.9 27 24
83.1 91 4
Clozapine 327.2
269.9 35 18
71 191.9 57 16
163.8 95 10
Haloperidol 376.0
164.7 33 10
61 122.9 55 8
94.8 107 16
Inte
rnal
sta
nd
ard
s
Desipramine 267.3
72.2 27 4
56 208 33 16
190.8 83 14
Haloperidol – D4 380.2
127.1 61 8
51 168.4 33 10
98 99 6
48 |MATERIALS AND METHODS
4.7. EXTRACTION PROCEDURE FOR PLASMA SAMPLES
4.7.1. PROTEIN PRECIPITATION
To each microcentrifuge tube containing 70 μL of plasma, was added three volumes of methanol
(210 μL). The samples were agitated by vortex and after by continuous agitation for 5 minutes at
1000rpm’s in the thermomixer. To help the proteins to agregate, they were centrifuged at
14,000×g for 10 minutes.
The supernatant was collected to a new microcentrifuge tube and was placed on an evaporator
at 60 °C, during approximately 1 hour. Subsequently, the sample was resuspended in 50μL of 2%
ACN:0.1% FA.
4.8. EXTRACTION PROCEDURE FOR HAIR SAMPLES
4.8.1. DECONTAMINATION AND SEPARATION OF DRUGS FROM THE HAIR
MATRIX Depending on the length, some hair samples were cut in the middle. Then the samples were
weighed in amounts between 0.7 – 9.7 mg (see Appendix 8.1).
First, the hair samples were decontaminated by adding 1mL of dichloromethane for 2 minutes at
room temperature in the thermomixer. Then dichloromethane was removed, and this procedure
was repeated twice.
The hair was incubated overnight (17 hours) in 1 ml of methanol at 45 °C. Then methanol was
evaporated to dryness in the speedvach at 60 °C, during approximately 1 hour.
4.8.1.1. OMIX TIP C18 CLEAN UP
OMIX Tip C18 contains a small bed of functionalized monolithic sorbent (C18) inserted inside a
pipette tip, it can work as a miniaturized solid phase extraction bed to remove salts prior to mass
spectrometry. This procedure was used as a clean up of the hair samples.
MATERIALS AND METHODS| 49
To performe the OMIX C18 SPE, three solution were prepared: 50% ACN, 2% ACN: 1% FA and
70% ACN: 0.1% FA.
To the evaporated sample 100µL of 2% ACN: 1% FA were added and were immediatly sonicated
for 2min in the cuphorn (20% amplitude 1s on 1s off cycle). Then, to wet the tip, it was added,
from the top, 200µL of 50% ACN and the pre-cutted CombipTip was used to push the solutions
and sample through the tip. To equilibrate the tip, 300µL of 2% ACN: 1% FA were added. After,
the sample was passed through the tip 5 times. To rinse the tip 100µL of 2% ACN: 1% FA were
added and at last the analytes were eluted with 400µL of 70% ACN 0.1% FA.
All samples were evaporated to dryness in the speedvac at 60 °C and then resuspended in 50μL
of 2% ACN:0.1% FA and sonicated before being placed in the vials.
4.9. ANALYTICAL METHOD VALIDATION
Only validation can objectively demonstrate the inherent quality of an analytical method by
fulfillment of minimum acceptance criteria and thus prove its applicability for a certain purpose
[100]. Therefore, the validation of the method was performed and the parameters that were
used for validation of analytical method for the identification and quantification of psychotropic
drugs in plasma and hair samples by LC-MS evaluated are summarized in Table 4.3.
Table 4.3- Parameters used for the analytical method validation for identification and quantification of psychotropic drugs in plasma and hair by LC-MS/MS. Adapted from [102,109].
Parameter Qualitative method Quantitative method
Selectivity
Limit of detection
Limit of quantification
Linearity
Working range
Precision
Accuracy
Extraction efficiency
Carry over
Matrix effects
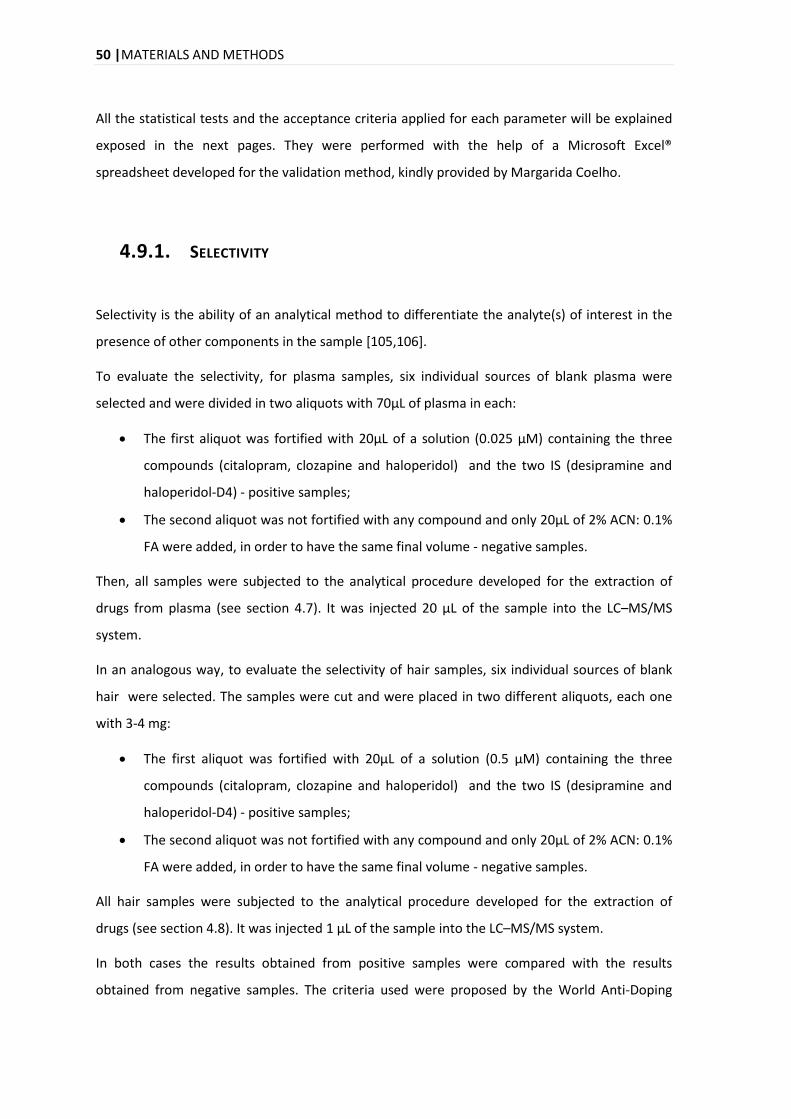
50 |MATERIALS AND METHODS
All the statistical tests and the acceptance criteria applied for each parameter will be explained
exposed in the next pages. They were performed with the help of a Microsoft Excel®
spreadsheet developed for the validation method, kindly provided by Margarida Coelho.
4.9.1. SELECTIVITY
Selectivity is the ability of an analytical method to differentiate the analyte(s) of interest in the
presence of other components in the sample [105,106].
To evaluate the selectivity, for plasma samples, six individual sources of blank plasma were
selected and were divided in two aliquots with 70μL of plasma in each:
The first aliquot was fortified with 20μL of a solution (0.025 μM) containing the three
compounds (citalopram, clozapine and haloperidol) and the two IS (desipramine and
haloperidol-D4) - positive samples;
The second aliquot was not fortified with any compound and only 20μL of 2% ACN: 0.1%
FA were added, in order to have the same final volume - negative samples.
Then, all samples were subjected to the analytical procedure developed for the extraction of
drugs from plasma (see section 4.7). It was injected 20 μL of the sample into the LC–MS/MS
system.
In an analogous way, to evaluate the selectivity of hair samples, six individual sources of blank
hair were selected. The samples were cut and were placed in two different aliquots, each one
with 3-4 mg:
The first aliquot was fortified with 20μL of a solution (0.5 μM) containing the three
compounds (citalopram, clozapine and haloperidol) and the two IS (desipramine and
haloperidol-D4) - positive samples;
The second aliquot was not fortified with any compound and only 20μL of 2% ACN: 0.1%
FA were added, in order to have the same final volume - negative samples.
All hair samples were subjected to the analytical procedure developed for the extraction of
drugs (see section 4.8). It was injected 1 μL of the sample into the LC–MS/MS system.
In both cases the results obtained from positive samples were compared with the results
obtained from negative samples. The criteria used were proposed by the World Anti-Doping
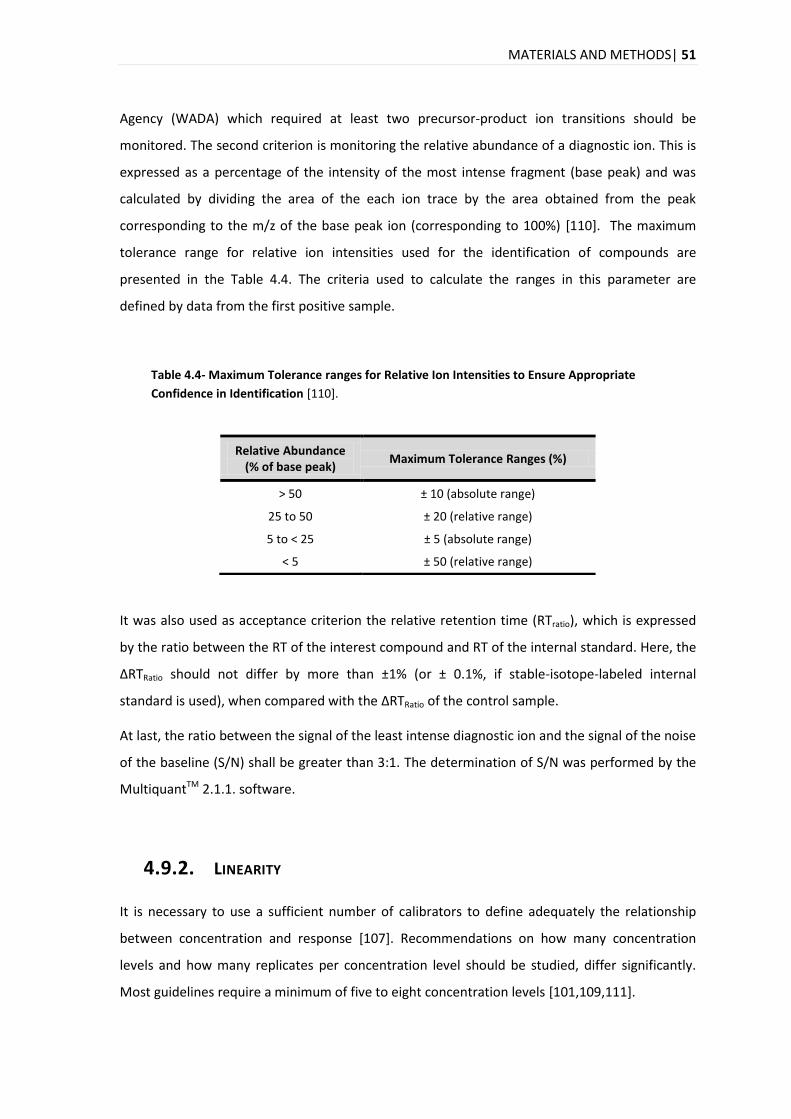
MATERIALS AND METHODS| 51
Agency (WADA) which required at least two precursor-product ion transitions should be
monitored. The second criterion is monitoring the relative abundance of a diagnostic ion. This is
expressed as a percentage of the intensity of the most intense fragment (base peak) and was
calculated by dividing the area of the each ion trace by the area obtained from the peak
corresponding to the m/z of the base peak ion (corresponding to 100%) [110]. The maximum
tolerance range for relative ion intensities used for the identification of compounds are
presented in the Table 4.4. The criteria used to calculate the ranges in this parameter are
defined by data from the first positive sample.
Table 4.4- Maximum Tolerance ranges for Relative Ion Intensities to Ensure Appropriate
Confidence in Identification [110].
Relative Abundance (% of base peak)
Maximum Tolerance Ranges (%)
> 50 ± 10 (absolute range)
25 to 50 ± 20 (relative range)
5 to < 25 ± 5 (absolute range)
< 5 ± 50 (relative range)
It was also used as acceptance criterion the relative retention time (RTratio), which is expressed
by the ratio between the RT of the interest compound and RT of the internal standard. Here, the
∆RTRatio should not differ by more than ±1% (or ± 0.1%, if stable-isotope-labeled internal
standard is used), when compared with the ∆RTRatio of the control sample.
At last, the ratio between the signal of the least intense diagnostic ion and the signal of the noise
of the baseline (S/N) shall be greater than 3:1. The determination of S/N was performed by the
MultiquantTM 2.1.1. software.
4.9.2. LINEARITY
It is necessary to use a sufficient number of calibrators to define adequately the relationship
between concentration and response [107]. Recommendations on how many concentration
levels and how many replicates per concentration level should be studied, differ significantly.
Most guidelines require a minimum of five to eight concentration levels [101,109,111].
52 |MATERIALS AND METHODS
To study the linearity, it was prepared one calibration curve with a solution containing the three
analytes (citalopram, clozapine ad haloperidol) with eleven calibrators, uniformly distributed in
the working range: 0.05, 0.1, 0.15, 0.2, 0.25, 0.5, 1, 1.5, 2, 3 and 5 μM. At each calibrator a
solution (0.5μM) containing the two IS (desipramine and haloperidol-D4) was added.
The choice of an appropriate calibration model is necessary for reliable quantification. Then, if it
is assumed that there is a linear relationship, the simplest regression model that is usually
applied is the ordinary least squares model [97,109]. This model represents the relationship
between two variables by a straight line, mathematically expressed by the equation (4.1), where
is the instrumental response and is the concentration of the compound [112].
(4.1)
Where, and are the independent and dependent variable, and are the calibration
parameters, the y-intercept and the slope, respectively.
The linearity of the calibration process was first investigated by means coefficient of correlation
(R) and coefficient of determination (R2), that should be above 0.99 in both cases. However, the
evaluation of linearity should not rely only on those parameters. Therefore, the zero-value
should be included within the confidence interval of 95% [113,114].
Additionaly, the standard error of the linear regression (Sy/x) was used as a measure of the
goodness of fit in order to exclude the residual values (response observed in relation with the
response predicted) higher than 2 × ǀSy/xǀ. In addition, visual inspection of plots for residuals
versus concentration was performed [101].
4.9.2.1. MANDEL TEST
Spite of widespread practice of evaluating a calibration model via its coefficients of correlation
or determination, this is not acceptable from a statistical point of view [101,115]. For example,
calibration models with points not uniformly distributed along the calibration range may provide
a good correlation coefficient [115]. Nevertheless, several researchers focused on the fact that R
might not be a useful indicator of linearity and other statistical tests or quality parameters have
been suggested to ascertain the goodness of fit of the calibration curve [116].
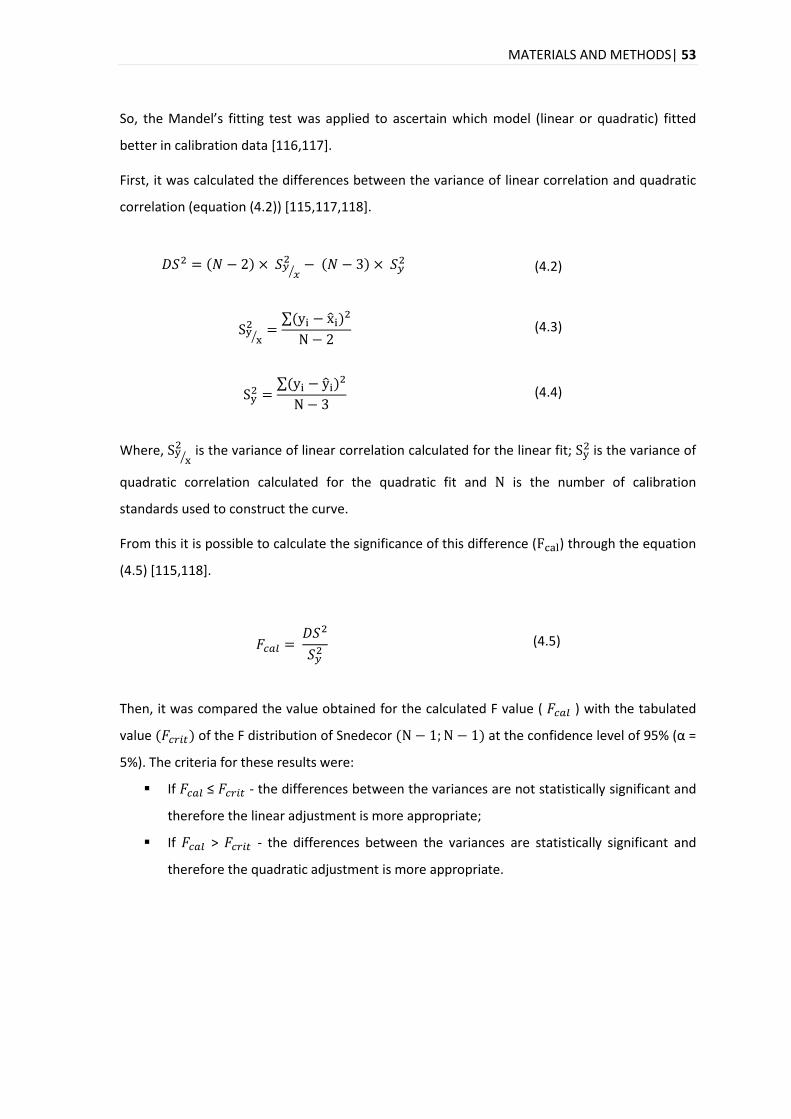
MATERIALS AND METHODS| 53
So, the Mandel’s fitting test was applied to ascertain which model (linear or quadratic) fitted
better in calibration data [116,117].
First, it was calculated the differences between the variance of linear correlation and quadratic
correlation (equation (4.2)) [115,117,118].
Where,
is the variance of linear correlation calculated for the linear fit; is the variance of
quadratic correlation calculated for the quadratic fit and is the number of calibration
standards used to construct the curve.
From this it is possible to calculate the significance of this difference ( ) through the equation
(4.5) [115,118].
(4.5)
Then, it was compared the value obtained for the calculated F value ( ) with the tabulated
value of the F distribution of Snedecor at the confidence level of 95% (α =
5%). The criteria for these results were:
If ≤ - the differences between the variances are not statistically significant and
therefore the linear adjustment is more appropriate;
If > - the differences between the variances are statistically significant and
therefore the quadratic adjustment is more appropriate.
(4.2)
(4.3)
(4.4)
54 |MATERIALS AND METHODS
4.9.3. WORKING RANGE
The working range of an analytical procedure can be defined as the interval between the upper
and lower concentration of analyte for which suitable precision, accuracy and linearity have
been demonstrated [119,120].
In addition, the concentration range in bioanalytical methods is usually broad and therefore it
might be expected that the variance of each standard point of the calibration curve might be
different (heterocedastic data) [121]. Therefore, it is mandatory to evaluate the
homoscedasticity assumption through the test of homogeneity of variances (or F test) and also
by visual evaluation of residuals versus concentration plots [112,121]. Therefore, the study of
the working range was performed simultaneous with the study of linearity and ten replicates of
the lowest and the highest concentrations levels were performed, 0.1 and 5 μM respectively. To
each calibrator it was added a solution (0.5μM) of the IS.
It was calculated the variances of the first ( ) and the last calibrator (
), according to the
following equation (4.6) [118,121].
Where, represents the variance; is the calibration sample (i =1 and i=10); is the number of
replicates for each calibration sample (j=1 to 10 for each i); is the number of results; is the
result obtained and is the mean of results obtained.
Then, it was obtained the calculated F value ( ) by the F-test, that uses the ratio between the
variances obtained at the lowest ( ) and at the highest (
) concentration level of the working
range (equations (4.7) and (4.8)) [112,121,122].
(4.6)
, if
(4.7)
, if
(4.8)
MATERIALS AND METHODS| 55
The value of is compared with tabled value ( ) of F distribution of Snedecor
at the confidence level of 95% (α = 5%) [112]. The criteria used for these results were:
If ≤ – the difference in variances is not statistically significant and thus the
working range is adjusted;
If > – the difference in variances is statistically significant and so the working
range is not adjusted.
It was also performed a visual inspections of residuals versus concentration plots in order to
check if residuals are randomly distribuited around the x-axis. If variance is constant over the
working range, this condition is verified and also Fcal will be lower than Fcrit.
On other hand, in the presence of heteroscedastic data different approaches could be followed,
such as the reduction of the working range and repeat the verification for the homogeneity of
variances by F-test, until obtain the ≤ [118,121]. Another procedure which is used is the
inverse of variance (1/S2) in each point of the calibration curve, which is impraticable in routine
analysis since several replicates are nedeed to calculate the variance (S2). Therefore, the
Weighted Least Squares Regression [112,120], choosing the approprieted weighting factor ( )
will overcome this problem [112].
4.9.3.1. WEIGHTED LEAST SQUARES LINEAR REGRESSION
The constant variance over the whole range is not always observed. Larger deviations present at
larger concentrations tend to influence (weight) the regression line. Thus if the data are
heteroscedastic, the use of WLSLR is the simplest and the most effective way to harmonise the
differences of variances of the line points [98,112,123].
For this study calibration curves for all the analytes were prepared with eleven calibrators each.
The calibrators were uniformly distributed in the working range: 0.05, 0.1, 0.15, 0.2, 0.25, 0.5, 1,
1.5, 2, 3 and 5 μM. To each calibrator it was added the IS (0.5μM). This procedure was repeated
in five different days.
Taking into account the objective of WLSLR, appropriate weighting factors ( ) can be calculated
from the inverse of the variances at the given concentration level [97,123]. However, as was
mentioned before, it is not suitable to calculate the inverse of variance in laboratory routine,
mainly because it requires several determinations for each calibration point and a fresh
calibration line each time the method is used, so other empirical weights based on x-variable
56 |MATERIALS AND METHODS
(concentration) or y-variable (response) may provide a simplistic approximation of variance
[112,124]. The empirical weights that should be study are:
;
;
;
;
and
[112,125].
Therefore, the can be obtained by the equation (4.9) [124].
(4.9)
Where, is the weighting factor; is the appropriate empirical weight for the data (
;
;
;
;
or
) and is the number of calibration standards.
The effectiveness of the weighted regression can be assessed by calculating the percentage of
the relative error ( ), which compares the estimated concentration of the sample, from the
regression equation obtained for each , with theoretical or nominal standard concentration
of the sample (equation (4.10)) [112].
Where, is the estimated concentration in the sample and is the nominal standard
concentration in the sample.
Plots of %RE versus concentration were performed for the analytes in order to choose the best
weighing factor, along with the sum of %RE ( The more adequate will be the one
which gives rise to a slight horizontal band of randomly distributed %RE around the x-axis and
presents the smallest value of across the whole concentration range [112,123].
In the simple linear regression model, the relationship between variables is established by a
straight line, mathematically expressed by the equation (4.6), that is used to calculate the
[112]. But, since it is used a WLSLR, the model parameters ( and ) of the weighted straight
line equation need to be estimated using the term according to the following equations,
before being calculate the [112,123].
(4.11)
(4.10)
MATERIALS AND METHODS| 57
(4.12)
Where, and is the ith data pair of n total data pairs and is the weighting factor chosen.
Finally, the correlation coefficient ( ) of the weighted straight line equation, can be obtained by
the following modified formula [112].
(4.13)
4.9.4. LIMITS: LIMIT OF DETECTION AND LIMIT OF QUANTIFICATION
The limit of detection (LOD) is the lowest amount of analyte in a sample which can be detected
but not necessarily quantified. And the limit of quantification (LOQ) is the lowest amount of
analyte in a sample which can be quantitatively determined with suitable precision and accuracy
[126].
The evaluation of LOD and LOQ was performed simultaneously with the study of linearity. For
this study it was prepared one calibration curve with the three analytes with six calibrators,
distributed at a lower range of the calibration curve: 0.01, 0.015, 0.025, 0.05, 0.1 and 0.15 μM.
To each calibrator it was added IS solution (0.5μM).
Several approaches for determining the detection limits are possible. The approache used to
calculate LOD and LOQ was based on the standard error of the response ( ) and the slope,
expressed by the following equations [109]:
58 |MATERIALS AND METHODS
(4.14)
(4.15)
Where, is the standard error of the response and is the slope of the calibartion curve.
The above mentioned equations use for homocedastic data. In the presence of
heterosceastic data some alterations must be performed and therefore the standard deviation
of a predicted concentration is given by the following equation [122-124].
(4.16)
Where, is the standard deviation of y-residuals of weighted regression line; is the
weight factor used in this study; is the analytical signal measured and is the analytical signal
predicted.
4.9.5. PRECISION
The precision of an analytical procedure expresses the closeness of agreement between a series
of measurements obtained from the same sample under the stipulated conditions
[105,109,118]. Precision can be expressed as the variance (S2), standard deviation (S) or
coefficient of variation (CV) of a series of measurements [109,119] and is considered at three
levels: repeatability, intermediate precision and reproducibility [109].
Repeatability, also termed within-run or intra-day precision, expresses the precision of a
determined sample by keeping constant the global factors (human, preparation, instrumental
and geographical) over a short period of time [106,109,119].
The intermediate precision, also termed between-run or inter-day precision, expresses the
precision of a determined sample by using the same procedure, despite the small changes
MATERIALS AND METHODS| 59
introduced that might occur during routine analysis (different analysts, lots of reagents,
equipment among others) over an extended period of time (different days) [119].
The term reproducibility refers to reproduce the results by changing one or more of the global
factors over a short or an extended period of time [119]. Usually it expresses the precision
between laboratories (collaborative studies, usually applied to standardization of methodology)
[109]. In this project, the reproducibility of the method was not study.
The study of intermediate precision and the repeatability consisted of analysing a test sample in
p different runs. Within each run, the sample was analysed n times under repeatability
conditions. All the important sources of variation were varied between each run [127]. Thus, it
was prepared one calibration curve with the analytes. Eleven calibrators, uniformly distributed
in the working range, were prepared: 0.05, 0.1, 0.15, 0.2, 0.25, 0.5, 1, 1.5, 2, 3 and 5 μM.
Quality controls (QCs) were also prepared at three concentration levels: low, medium and high,
respectively 0.075, 0.75 and 2.75 μM for citalopram and haloperidol. For clozapine, the
concentrations levels were 0.075, 0.75 and 1.25 μM. Each QC was prepared in triplicate and at
each sample it was added 50 μL of IS solution at 0.5μM. The procedure was repeated along five
days.
After choosing the best calibration model for each analyte, the calibration curves were obtained
by the use of linear regression and the concentration of the QCs were calculated. The results
obtained for the different levels of concentration for each compound were analysed by a one-
way analysis of variance (ANOVA) (Table 8.7 in Appendix 8.6) [127,128].
Then, it were calculated the intermediate precision and the repeatability, expressed in terms of
% CV [129], through the following equations [98,120]:
(4.17)
Where, is the coefficient of variation of repeatability; is the standard deviation of
repeatability; is the coefficient of variation of intermediate precision; is the standard
deviation and is the mean value of concentrations.
(4.18)
60 |MATERIALS AND METHODS
The limits of acceptable variability were set at 15% for all the concentrations, except at the LOQ,
for which 20% was accepted [105,106].
4.9.6. ACCURACY
The accuracy of an analytical procedure expresses the degree of agreement between the value
measured by the procedure to the value accepted as reference value [126].
The experimental procedure to evaluate the accuracy was similar to the procedure used for the
precision. Therefore, accuracy was evaluated in terms of percentage of mean relative error
[109,112,120,130].
Where, is the mean of the estimated concentration in the sample and is the nominal
standard concentration in the sample.
As acceptance criteria, the accuracy for each level of concentration should be within ±15% of the
nominal concentration, except for the LOQ for which it should be within ±20% [105,106].
4.9.7. CARRY-OVER
It is important to know how much analyte is retained or “carried over” from a preceding sample
into the following sample, since it can affect the accuracy and precision of the method,
especially when a low concentrated sample is injected after injections of samples at high levels
of concentration. Thus, to evaluate the carry-over phenomena, five blank samples (2% ACN:
0.1% FA) were injected after the injection of the highest level of concentration standard (5 μM).
The procedure was repeated for the calibrators with 0.5 μM and 0.05 μM of concentration. This
procedure was repeated in three different days.
Therefore, the carry-over in the blank sample following the highest calibrator should not be
greater than 20% of LOQ (equation (4.20))and 5% for the internal standard [105].
(4.19)
MATERIALS AND METHODS| 61
(4.20)
Where, is the mean of peak areas of the blanks samples; is the mean of peak
area for LOQ.
4.9.8. RECOVERY
The recovery of a method can be measured comparing the response of analyte spiked in the
sample before being processed with the response of the same quantity of analyte, spiked into
matrix after the extraction procedure. This measure indicates if the method provides a response
for the entire amount of analyte that is present in the sample [120,130,131].
To evaluate the recovery three levels of concentration were selected (low, medium and high),
corresponding to 0.1, 0.5 and 3 μM, with plasma from 6 different sources. Each concentration
was performed in triplicate. For each level two aliquots were prepared with 70μL each one of
them:
One was spiked with 20 μL of a solution containing citalopram, clozapine, haloperidol,
desipramine and haloperidol-D4 and then was subjected to the extraction procedure
(see section 4.7);
The other was first subjected to the extraction procedure (see section 4.7) and at the
end of the procedure (when the sample is reconstituted) was spiked with 20 μL of a
solution containing citalopram, clozapine, haloperidol, desipramine and haloperidol-D4.
In an analogous way, to evaluate the recovery in the hair three levels of concentration were
selected (low, medium and high), corresponding to 0.1, 0.5 and 3 μM, with hair from 6 different
sources. Each concentration was performed in triplicate. For each level two aliquots were
prepared each one with hair weighing between 1.9 – 3.2 mg:
One was spiked with 20 μL of a solution containing citalopram, clozapine, haloperidol,
desipramine and haloperidol-D4 and then was subjected to the extraction procedure
(see section 4.8);
The other was first subjected to the extraction procedure (see section 4.8) and at the
end of the procedure (when the sample is reconstituted) was spiked with 20 μL of a
62 |MATERIALS AND METHODS
solution containing citalopram, clozapine, haloperidol, desipramine and haloperidol-D4
and then was subjected to the extraction procedure.
To each sample, for plasma and hair, 10 μL of IS at 0.5μM were added, at the end of the
procedure. The IS used in the study of recovery was Sulfamethazine-D4, since it was also
evaluated the recovery of the two IS (desipramine and haloperidol-D4) used for the method that
was being developed.
The samples that were fortified after the extraction represent 100% recovery [120]. And it was
calculated the recovery, in percentage, by the next equation (4.21) [120,131].
Where, is the absolute area of the analyte fortified in the matrix before the extraction;
is the absolute area of the internal standard fortified in the matrix before the extraction;
is the absolute area of the analyte fortified in the matrix after the extraction at the same level of
concentration and is the absolute area of the internal standard fortified in the matrix after
the extraction at the same level of concentration.
The acceptance value for the recovery of the analyte does not need to be 100%, but the extent
of recovery of an analyte and of the IS should be consistent, precise, and reproducible [106]. The
recovery of the IS should be within 15% of that determined for the analyte [120].
4.9.9. MATRIX EFFECTS
The matrix effects (ME) can be defined as the difference between the mass spectrometric
response for an analyte in standard solution and the response for the same analyte in a
biological matrix [132].
To evaluate the matrix effect three levels of concentration were selected (low, medium and
high), corresponding to 0.1, 0.5 and 3 μM. For plasma, 70μL of blank plasma was subjected to
the extraction procedure (see section 4.7). At the end of the procedure (when the sample is
reconstituted) the sample was spiked with 20 μL of a solution containing citalopram, clozapine,
(4.21)
MATERIALS AND METHODS| 63
haloperidol, desipramine and haloperidol-D4. Each concentration level was prepared in
triplicate. In addition it was prepared a standard solution with the five compounds with
equivalent levels of concentration.
The procedure to evaluate the matrix effect in hair samples was similar, with the exception to
the amount of sample used (3-4 mg) and the extractive procedure (see section 4.8).
To each sample type, plasma and hair, 10 μL of IS at 0.5μM were added, at the end of the
procedure. And to prepare a standard solution (citalopram, clozapine, haloperidol, desipramine
and haloperidol-D4) with equivalent levels of concentration, to 50 μL of this solution, it was
added 50 μL of IS (Sulfamethazine-D4) at 0.5μM.
The difference in response between the post-extraction sample and the standard solution
divided by the response (4.22) determines the degree of matrix effect
occurring to the analyte [131,133].
Where, is the matrix effect; is the peak area of the analyte
spiked in the sample after the extraction procedure and is the peak area of the
analyte for the same concentration in standard solution
For this equation, a negative result indicates suppression and a positive result indicates
enhancement of the analyte signal. Thus, a calculated value of zero would represent no ME
[131,133].
The assessment of the presence of a relative matrix effect, expressed as , can be made
based on direct comparison of the peak areas of an analyte spiked into extracts originating from
different sources of a Blank matrix (equation (4.23)) [132].
(4.23)
Where, is the coefficient of variation of relative ; is the sandard deviation and is the
mean value.
(4.22)
64 |MATERIALS AND METHODS
When the values of are high this might indicate that the response originating from the
same amount of an analyte is different in different sources of a Blank matrix [132].
4.10. APPLICATION OF THE ANALYTICAL METHOD DEVELOPED IN REAL
SAMPLES
The method that was developed was applied for the analysis in samples of hair and plasma
collected from mice (five replicates per day) treated with different drugs: citalopram, clozapine,
haloperidol, and saline solution (control samples) for different periods of time: 1, 2, 4, 8, 15 and
30 days.
In order to see if any differences statistically significant between the days a non-parametric test,
Kruskal–Wallis test (or H test), was performed.
The test proposed by Kruskal and Wallis evaluates whether two or more samples are from the
same distribution [134,135]. The null hypothesis is that all the samples come from identical
population distributions [134-136].
Given multiple samples (k) with ni observations in the ith sample, the H statistic tests the null
hypothesis that the samples come from identical population distributions [136].
This hypothesis is tested by ranking the observations from 1 to N (giving each observation in a
group of ties the mean of the ranks tied), finding the k sum of ranks, and computing an H
statistic [134,136]. If there is no tie in all the values, the test statistic is:
Where, N is the total number of values in all samples; ni is the number of values contained in the
ith sample, and Ri is the sum of ranks in ith sample.
For ties in the scores, the tied observations are assigned the average of the ranks that would be
assigned if there were no ties [136] and thus the calculation of the test statistic should be
changed slightly [134].The correction factor for ties is:
(4.24)
MATERIALS AND METHODS| 65
(4.25)
Where, g is the number of groups of tied values, and ti is the number of tied values in the ith
group.
Then it can compute H with these new ranks but first the H is divided by this correction
[134,136]:
(4.26)
Actually the equation (4.26) is the general solution that holds no matter there are ties or not. If
there is no tie, C = 1 and thus, [134].
This statistic is then compared with a tabled value for the H statistic. This comparison will
determine whether the null hypothesis is accepted or rejected [136].
If there are more than five observations in each sample, the H statistic has been shown to be
distributed approximately as a chi-square distribution (with degrees of freedom = C-1) and
therefore chi-square tables are used for the comparison. If the samples have fewer than five
observations special approximations through exact tables, called the "critical values" for the H
statistic [136].
If the computed value of the H statistic is larger than the tabled value of the H statistic, the
results are significant and the null hypothesis is rejected and the probability that the null
hypothesis is true is less than 0.05 [136].
When the obtained value of the H statistic is statistically significant, it indicates that at least one
of the groups is different from the others. It does not indicate, however, which groups are
different or whether the difference is meaningful, nor does it specify how many of the groups
are different from each other [136].
In order to see where the differences are presented is used a procedure, called "multiple
comparisons methods” that constructs pair-wise multiple comparisons to locate the source of
significance [136]. They are also called post hoc or posteriori tests as they are only carried out
after the fact, i.e., after a significant effect.
An effective way of doing pairwise simultaneous inference was introduced by Dunn [137]. When
sample sizes are unequal, or in the presence of tied ranks, it is recommended the Dunn’s test.
Because it takes into account tied ranks, when group samples sizes are equal [135].
66 |MATERIALS AND METHODS
First the data is combined and ranked. Second it is found the group mean ranks and then is
calculated the standardized absolute differences of these average ranks by the next equations,
which is the standard error that has a correction term for tied ranks[137,138].
, j=1,.., k and j≠i (4.27)
, i=1,....,k (4.28)
(4.29)
Where, is the sum of the ranks for the ith treatment (i=1,....,k and j=1,.., k); k is the number of
samples (k > 2); is the number of observations for the ith treatment.
A new α is computed for each multiple comparisons test based on the overall α level for the
study and the number of comparison to be made. The new α is equal to α/C, where C is the
number of post hoc tests to be performed [139].


RESULTS AND DISCUSSION| 69
5. RESULTS AND DISCUSSION
5.1. METHOD DEVELOPMENT
The results obtained during method development, used to determine which parameters to use
in the spectrometric conditions are presented in this section.
The optimization of some parameters is necessary, as was mentioned in the section 4.6.2, to
establish optimal conditions for each of the molecules.
One of the important parameters that is optimized is the CE, which generate product ion scans
at different collision energies (gradual increasing) to select the product ion candidate to monitor.
This way it can be obtained the optimum CE for each product ion. As an example, the CE values
corresponding to three different fragments of haloperidol are represented in the Figure 5.1,
where for instance to obtain the lowest fragment (with m/z of 95) will need a higher CE than to
obtain the largest fragment (with m/z of 164). They represent the amount of energy that the
precursor ions receive as they accelerated into the collision cell, where they collide with gas
molecules and fragments.
Figure 5.1- Collision energy ramping values for three fragments of haloperidol. The fragments that each peak corresponds are indicated above the peak.
Another parameter that is optimized in the development of the method is the DP. This
parameter is used to minimize solvent cluster ions, which may attach to the analyte. If DP is too
high, the analyte ion itself may fragment, so an appropriate value for each molecule is
necessary. An example of optimization of this parameter is shown in Figure 5.2 for the
haloperidol, where the maximum height of the peak corresponds to the best value of DP.
70 |RESULTS AND DISCUSSION
Figure 5.2- Declustering potential ramping for haloperidol. Results show a maximum intensity at
61V for haloperidol.
After these parameters are optimized, fragmentation mass spectra for each analyte of interest
can be observed with all fragments of the analyte that is obtained in CID conditions. This
parameter controls the pressure of collision gas in the collision cell during Q3 scan, helping to
focus the ions as they pass through the collision cell (q2). With the fragmentation spectra it is
possible to choose what transitions to monitor. The choice of product ions that are close in m/z
to the precursor implies that the neutral loss fragment is of low molecular mass. For many
reasons product ions of ‘low mass’ can be problematic for MRM detection. One of these reasons
is due to the observation that ‘chemical noise’ (background) is considerably more intense at
lower m/z values. The ideal product ion to use in MRM method would be the one that can be
observed at good relative abundance in the spectrum.
The fragmentation spectrum of haloperidol (Figure 5.3) shows a peak with m/z of 376
corresponding to the intact molecule, and three most intense fragments, with m/z 123, with m/z
165 and with m/z 95, which were chosen to monitor the haloperidol, for the reasons that were
stated before. It can also be seen other peaks less intense with m/z of 113 and 75.
RESULTS AND DISCUSSION| 71
Figure 5.3- Averaged fragmentation mass spectra of haloperidol. A solution of 0.453 μM of haloperidol was infused at a flow rate of 9 μL/min and CE was ramped between 5 to 130 eV.
These fragments are characteristic for haloperidol and they are due to loss of parts of the
molecule that are illustrated in the Figure 5.4. The fragment that has the highest intensity, with
m/z of 123, corresponds to F-C6H4-CO+. The second more intense, with the m/z of 165,
corresponds to F-C6H4-C(=O)-CH2CH2CH2+. And lastly, the fragment with m/z of 95 corresponds to
F-C6H4+.
Figure 5.4- Characteristic fragments observed in mass spectrometry for the molecule of haloperidol [M+H]
+, with m/z of 376 [140].
The same approach was used for clozapine (Figure 5.5). Once again, the peak with m/z of 327
corresponds to the m/z value of the intact molecule because here the value of CE applied was
low. It can be observed in the spectra of clozapine, three more intense peaks. The fragments
with m/z of 192, 270 and 164, were consequently chosen to monitor this molecule.
72 |RESULTS AND DISCUSSION
Figure 5.5- Averaged fragmentation mass spectra of clozapine. A solution of 1 μM of clozapine was infused at a flow rate of 9 μL/min and CE was ramped between 5 to 130 eV.
The fragments characteristic for clozapine are illustrated in the Figure 5.6. The most intense
peak, with m/z of 192, corresponds to C13H8N2. The second peak more intense, with m/z of 270,
corresponds to C15H12ClN3.
Figure 5.6- Characteristic fragments observed in mass spectrometry for the molecule of clozapine [M+H]
+, with m/z of 327 [140].
The same approach was used for citalopram (Figure 5.7). The peak with m/z of 325 corresponds
to the m/z value of the intact molecule. As it can be seen in the spectrum, the fragments with
m/z of 262 and 109 are the most intense fragments so consequently these were chosen to
monitor this molecule.
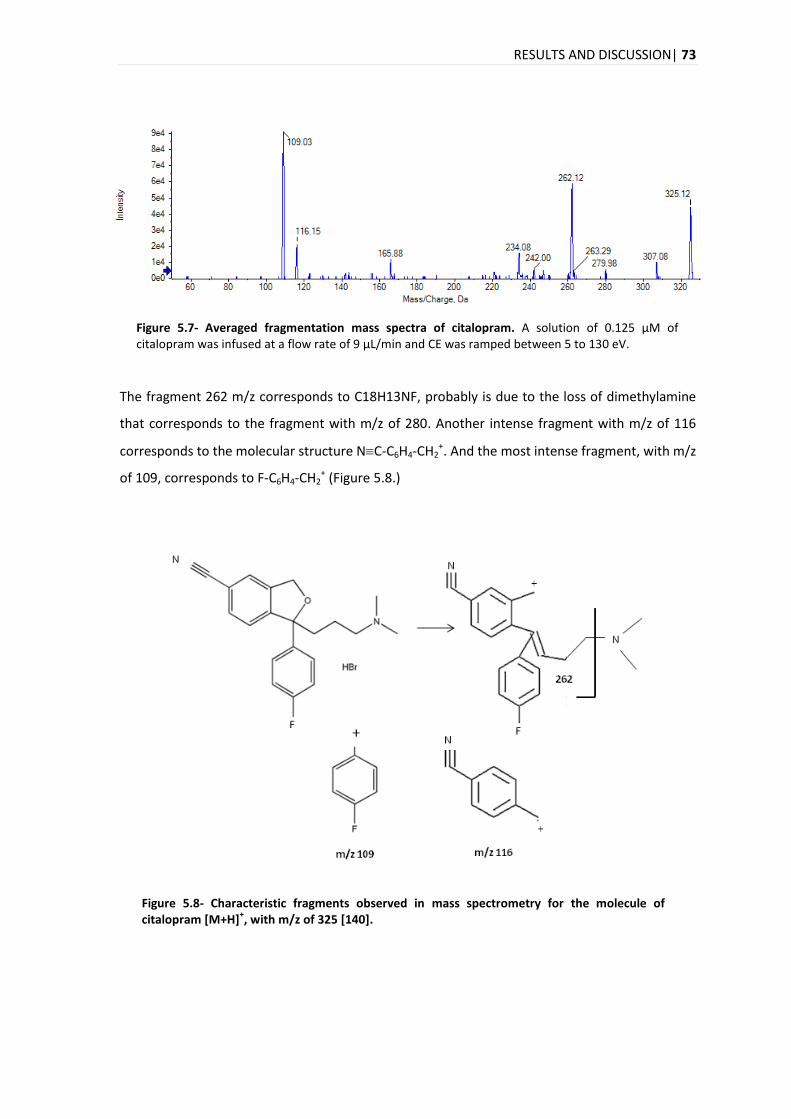
RESULTS AND DISCUSSION| 73
Figure 5.7- Averaged fragmentation mass spectra of citalopram. A solution of 0.125 μM of citalopram was infused at a flow rate of 9 μL/min and CE was ramped between 5 to 130 eV.
The fragment 262 m/z corresponds to C18H13NF, probably is due to the loss of dimethylamine
that corresponds to the fragment with m/z of 280. Another intense fragment with m/z of 116
corresponds to the molecular structure NC-C6H4-CH2+. And the most intense fragment, with m/z
of 109, corresponds to F-C6H4-CH2+ (Figure 5.8.)
Figure 5.8- Characteristic fragments observed in mass spectrometry for the molecule of citalopram [M+H]
+, with m/z of 325 [140].
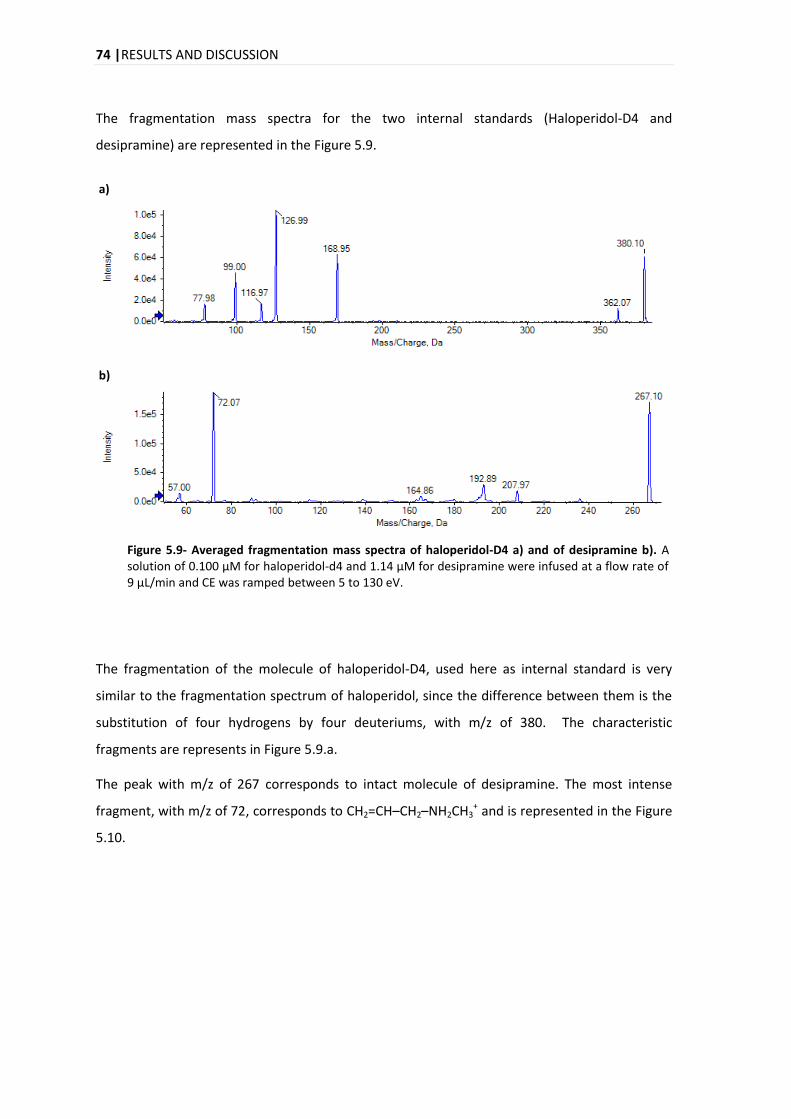
74 |RESULTS AND DISCUSSION
The fragmentation mass spectra for the two internal standards (Haloperidol-D4 and
desipramine) are represented in the Figure 5.9.
a)
b)
Figure 5.9- Averaged fragmentation mass spectra of haloperidol-D4 a) and of desipramine b). A solution of 0.100 μM for haloperidol-d4 and 1.14 μM for desipramine were infused at a flow rate of 9 μL/min and CE was ramped between 5 to 130 eV.
The fragmentation of the molecule of haloperidol-D4, used here as internal standard is very
similar to the fragmentation spectrum of haloperidol, since the difference between them is the
substitution of four hydrogens by four deuteriums, with m/z of 380. The characteristic
fragments are represents in Figure 5.9.a.
The peak with m/z of 267 corresponds to intact molecule of desipramine. The most intense
fragment, with m/z of 72, corresponds to CH2=CH–CH2–NH2CH3+ and is represented in the Figure
5.10.
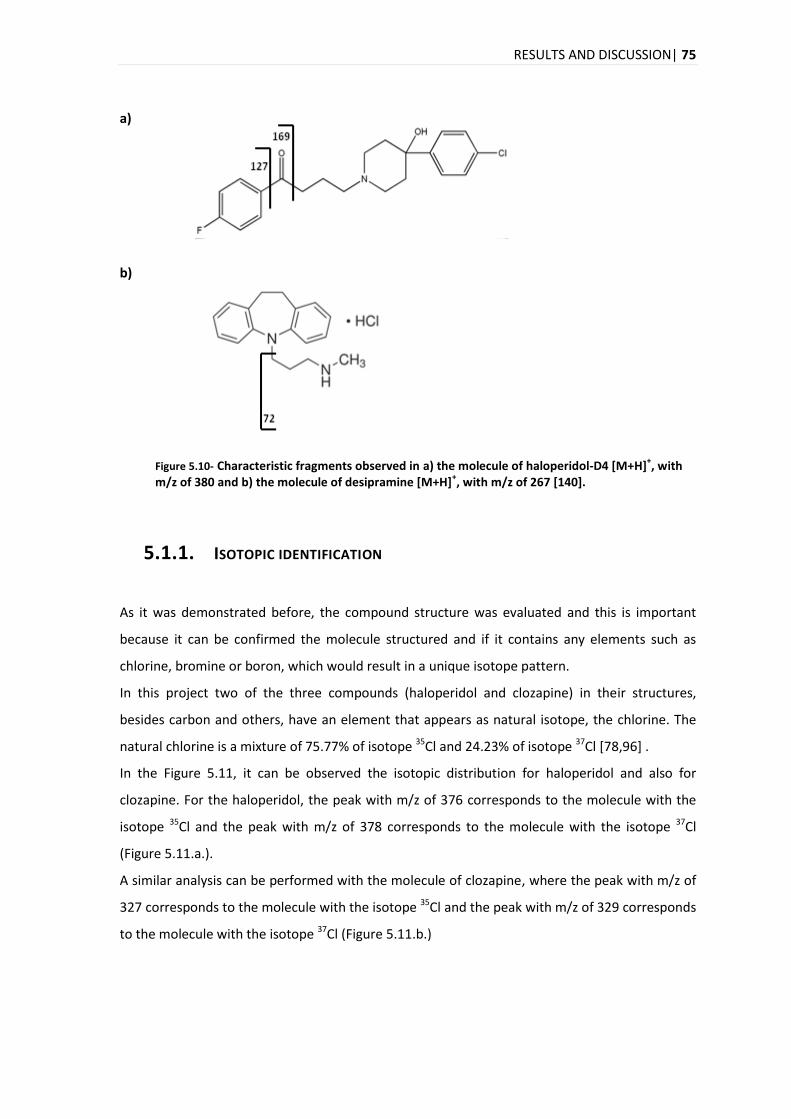
RESULTS AND DISCUSSION| 75
a)
b)
Figure 5.10- Characteristic fragments observed in a) the molecule of haloperidol-D4 [M+H]+, with
m/z of 380 and b) the molecule of desipramine [M+H]+, with m/z of 267 [140].
5.1.1. ISOTOPIC IDENTIFICATION As it was demonstrated before, the compound structure was evaluated and this is important
because it can be confirmed the molecule structured and if it contains any elements such as
chlorine, bromine or boron, which would result in a unique isotope pattern.
In this project two of the three compounds (haloperidol and clozapine) in their structures,
besides carbon and others, have an element that appears as natural isotope, the chlorine. The
natural chlorine is a mixture of 75.77% of isotope 35Cl and 24.23% of isotope 37Cl [78,96] .
In the Figure 5.11, it can be observed the isotopic distribution for haloperidol and also for
clozapine. For the haloperidol, the peak with m/z of 376 corresponds to the molecule with the
isotope 35Cl and the peak with m/z of 378 corresponds to the molecule with the isotope 37Cl
(Figure 5.11.a.).
A similar analysis can be performed with the molecule of clozapine, where the peak with m/z of
327 corresponds to the molecule with the isotope 35Cl and the peak with m/z of 329 corresponds
to the molecule with the isotope 37Cl (Figure 5.11.b.)
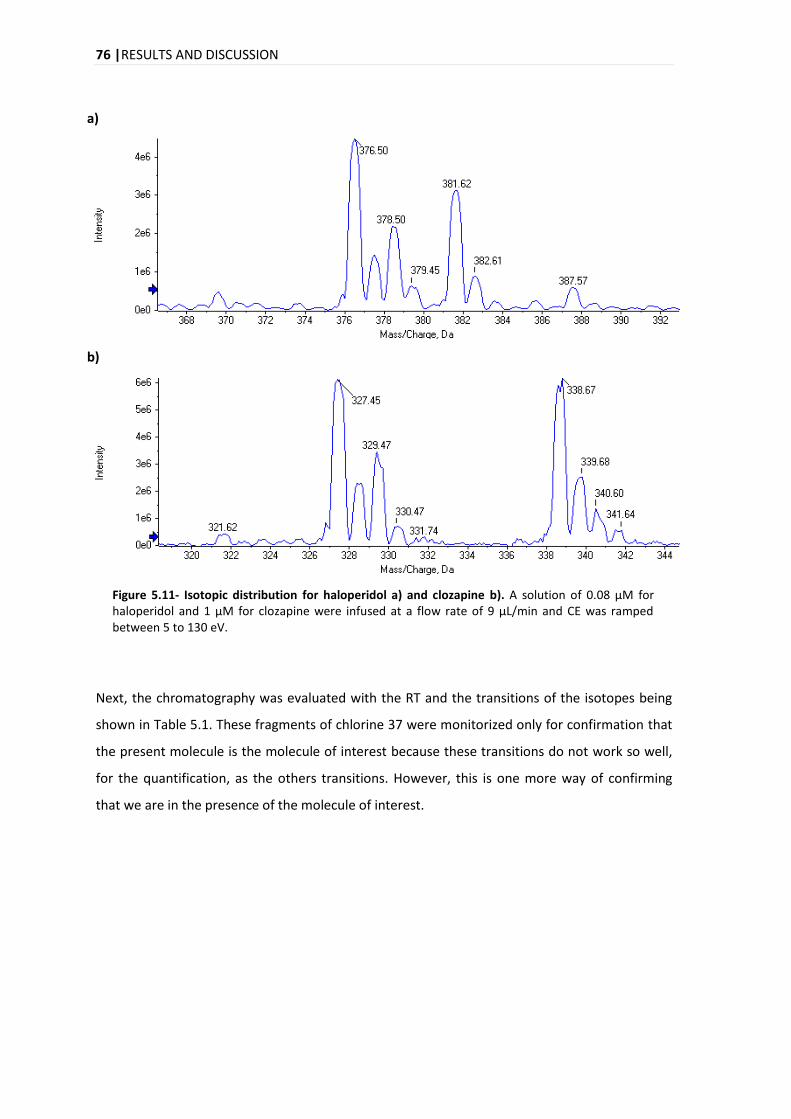
76 |RESULTS AND DISCUSSION
a)
b)
Figure 5.11- Isotopic distribution for haloperidol a) and clozapine b). A solution of 0.08 μM for haloperidol and 1 μM for clozapine were infused at a flow rate of 9 μL/min and CE was ramped between 5 to 130 eV.
Next, the chromatography was evaluated with the RT and the transitions of the isotopes being
shown in Table 5.1. These fragments of chlorine 37 were monitorized only for confirmation that
the present molecule is the molecule of interest because these transitions do not work so well,
for the quantification, as the others transitions. However, this is one more way of confirming
that we are in the presence of the molecule of interest.
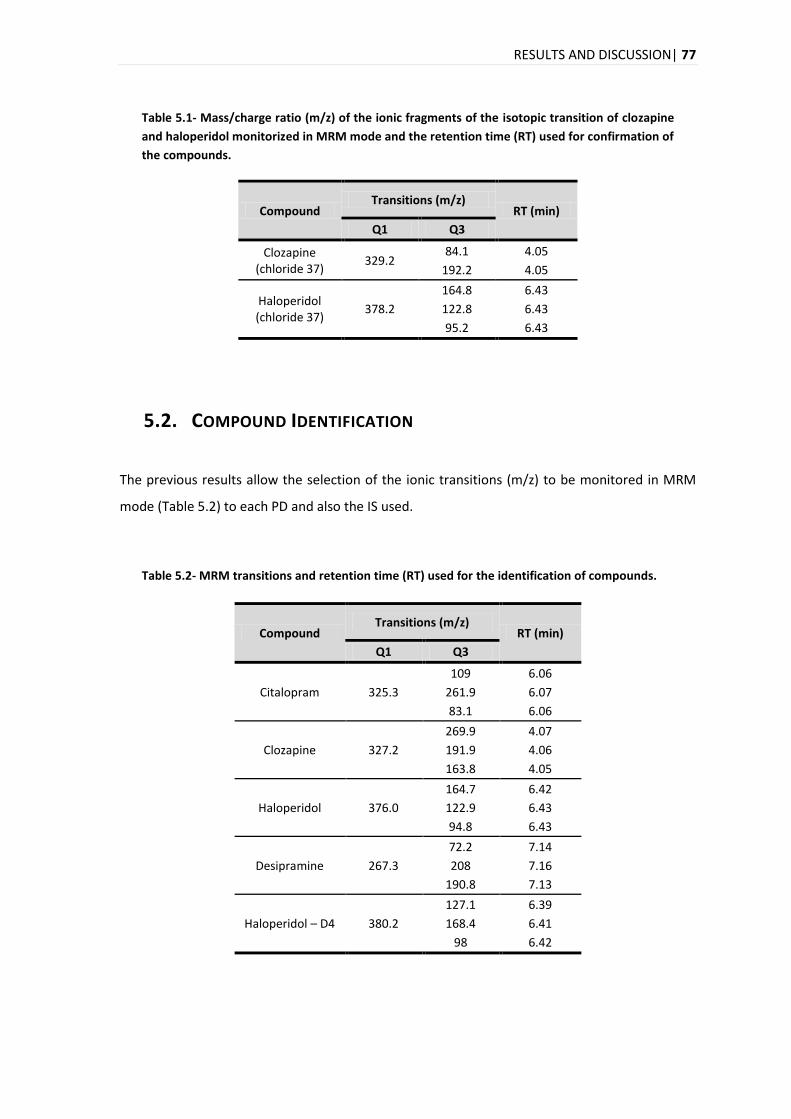
RESULTS AND DISCUSSION| 77
Table 5.1- Mass/charge ratio (m/z) of the ionic fragments of the isotopic transition of clozapine
and haloperidol monitorized in MRM mode and the retention time (RT) used for confirmation of
the compounds.
Compound Transitions (m/z)
RT (min)
Q1 Q3
Clozapine (chloride 37)
329.2 84.1 4.05
192.2 4.05
Haloperidol (chloride 37)
378.2
164.8 6.43
122.8 6.43
95.2 6.43
5.2. COMPOUND IDENTIFICATION
The previous results allow the selection of the ionic transitions (m/z) to be monitored in MRM
mode (Table 5.2) to each PD and also the IS used.
Table 5.2- MRM transitions and retention time (RT) used for the identification of compounds.
Compound Transitions (m/z)
RT (min)
Q1 Q3
Citalopram 325.3
109 6.06
261.9 6.07
83.1 6.06
Clozapine 327.2
269.9 4.07
191.9 4.06
163.8 4.05
Haloperidol 376.0
164.7 6.42
122.9 6.43
94.8 6.43
Desipramine 267.3
72.2 7.14
208 7.16
190.8 7.13
Haloperidol – D4 380.2
127.1 6.39
168.4 6.41
98 6.42
78 |RESULTS AND DISCUSSION
The criteria of WADA (section 5.9.) were applied and the results are presented and explained in
the section related to the Selectivity (section 5.3.1). To apply the criteria for unequivocal
identification of PD, mandatory the use of an IS for all analytes.
Often, the choice of an appropriate internal standard lies on the following criteria: the IS should
not be present in the samples to be analyzed and the IS also should be chemically and physically
similar to the analyte (ideally, a stable-isotope-labeled IS), and should elute in a similar time to
the analyte [79].
An isotope that is used extensively is deuterium, here the molecular weight of the compound is
higher than the unlabelled precursor and this is often sufficient to ensure that the ions in the
molecular ion region of the unlabelled compound do not occur at the same m/z ratios as those
from the labelled molecule [79]. For these reasons, for the haloperidol it was used as IS the
haloperidol-D4.
Desipramine was the IS used for the citalopram and the clozapine, as already mentioned in
literature [90,141].
5.3. ANALYTICAL METHOD VALIDATION
5.3.1. SELECTIVITY
Potential interfering substances in a biological matrix include endogenous matrix components,
metabolites, decomposition products, concomitant medication and other exogenous
compounds [106]. So it is very important to obtain a signal free from the influence of other
species contained in the sample and this signal should be unequivocally assigned to the analyte
of interest [142].
One simple way to establish method selectivity in biological fluids, which is becoming state of
the art in the procedures used in the majority in the published work related to the method
validation, is to prove the lack of response in blank matrix. Normally is used at least six
independent sources of the blank matrix [101,143]. However, interferences, present in small
quantities, may adversely affect the quantification of unknown samples at concentrations
approaching the limit of quantification [143]. Therefore, it is recommended that the selectivity
of the method should be established with respect to endogenous substances, metabolite(s) and
RESULTS AND DISCUSSION| 79
known degradation products [143], spiking pure substance of interest with appropriate levels in
a blank matrix and process the sample [144]. These results are compared with blank matrix
processed without the analyte [119,120,145].
Thus, as was mentioned in the methodology (section 4.9.1) six individual sources of blank matrix
(plasma and hair) were divided in two aliquots, each. One aliquot was spiked with the analytes
and another aliquot was not spiked. It was considered that the negative samples were the
aliquots without the analytes and the IS (citalopram, clozapine, haloperidol, desipramine and
haloperidol-D4) and the aliquots that were spiked with the analytes were considered the
positive samples.
In the results for the hair, for instance, the selectivity of the method for haloperidol can be
evaluated visually in the chromatogram, where one transition was selected, 376.0164.7
(Figure 5.12).
It can be observed in the negative samples (Figure 5.12 a-f) that only in sample 5 a small peak
appears with the same RT of haloperidol. However, the peak was not integrated because the S/N
was lower than 3. Still, in the positive samples (Figure 5.12 g-l), haloperidol was found in the
expected retention time, with a good intensity signal and apparently with no more interferents.
Selectivity results for plasma are presented in the Figure 5.13 also for the transition 376.0165
of the haloperidol.
In the negative samples (Figure 5.13. a-f)) some small peaks are observed in all samples at the
same RT of the haloperidol. However, the S/N was lower than 3 for all samples. In the positive
samples (Figure 5.13. g-l)) only the haloperidol appears with a higher intensity than the intensity
of the interference which appeared in negative samples in the same RT.
To confirm the selectivity, i.e., unequivocal identification of the analytes, was also used the
WADA criteria [110] pre-establish in the section 4.9.1. by analyzing the data in the excel
spreadsheet created for the analysis of analytical method validation data. Both positive and
negative samples were also analyzed in the same excel spreadsheet and the criteria for the
negatives were the reverse of the positive ones.
In the WADA technical report, the RT and the RTRatio are presented as criterion for LC part and
also it is stated that between RT and RTRatio it can be chosen whichever is smaller [110]. In this
case it was chosen the RTRatio because better results were obtained with this one.
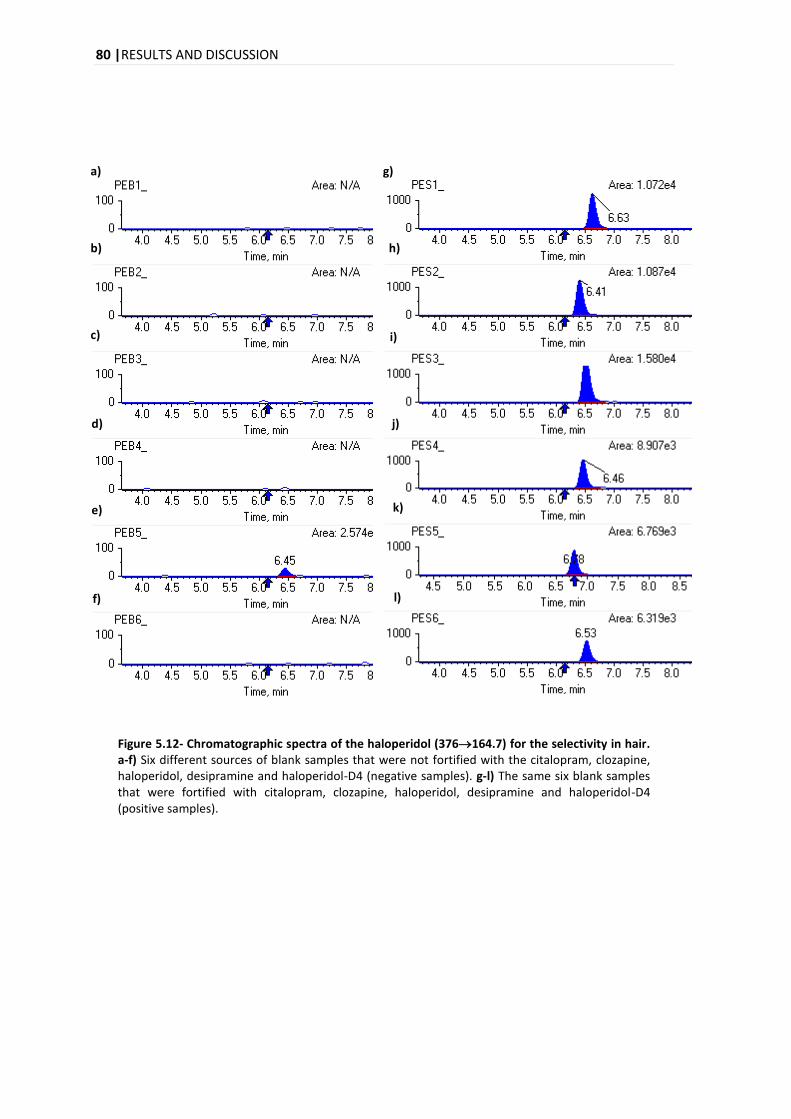
80 |RESULTS AND DISCUSSION
a) g)
Figure 5.12- Chromatographic spectra of the haloperidol (376164.7) for the selectivity in hair. a-f) Six different sources of blank samples that were not fortified with the citalopram, clozapine, haloperidol, desipramine and haloperidol-D4 (negative samples). g-l) The same six blank samples that were fortified with citalopram, clozapine, haloperidol, desipramine and haloperidol-D4 (positive samples).
b)
c)
d)
e)
f)
h)
i)
j)
k)
l)
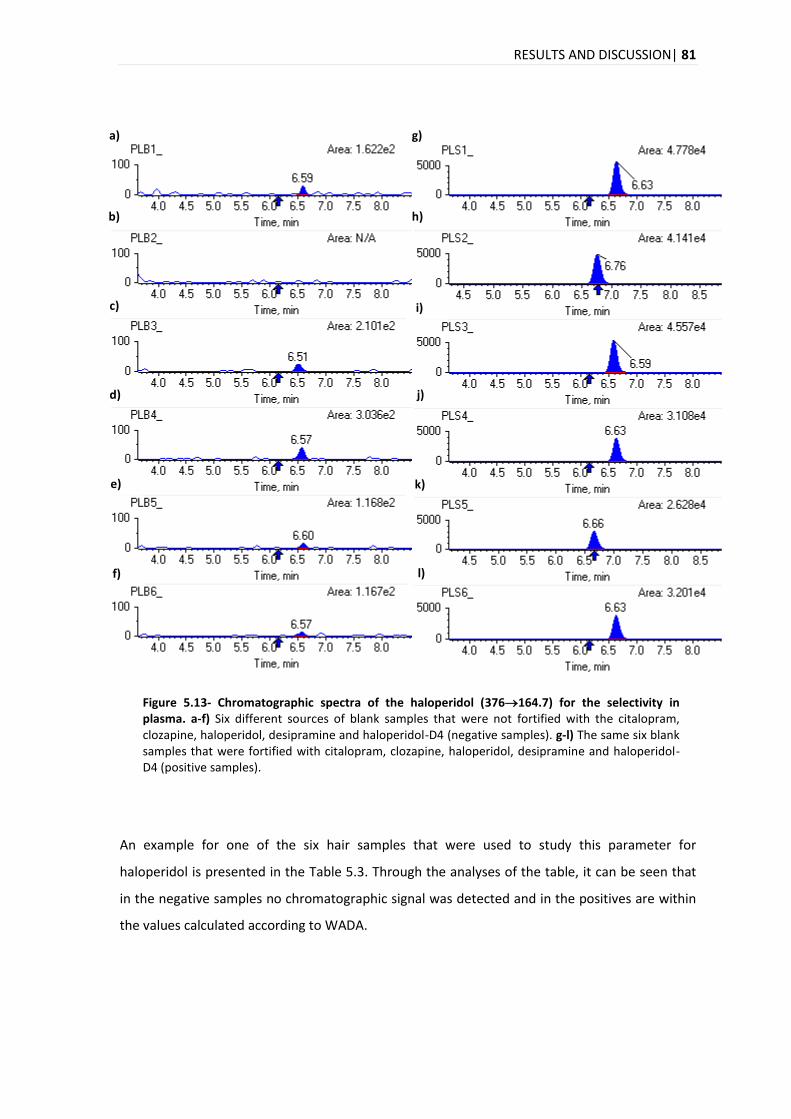
RESULTS AND DISCUSSION| 81
a) g)
Figure 5.13- Chromatographic spectra of the haloperidol (376164.7) for the selectivity in plasma. a-f) Six different sources of blank samples that were not fortified with the citalopram, clozapine, haloperidol, desipramine and haloperidol-D4 (negative samples). g-l) The same six blank samples that were fortified with citalopram, clozapine, haloperidol, desipramine and haloperidol-D4 (positive samples).
An example for one of the six hair samples that were used to study this parameter for
haloperidol is presented in the Table 5.3. Through the analyses of the table, it can be seen that
in the negative samples no chromatographic signal was detected and in the positives are within
the values calculated according to WADA.
b) h)
c) i)
d) j)
e) k)
f) l)
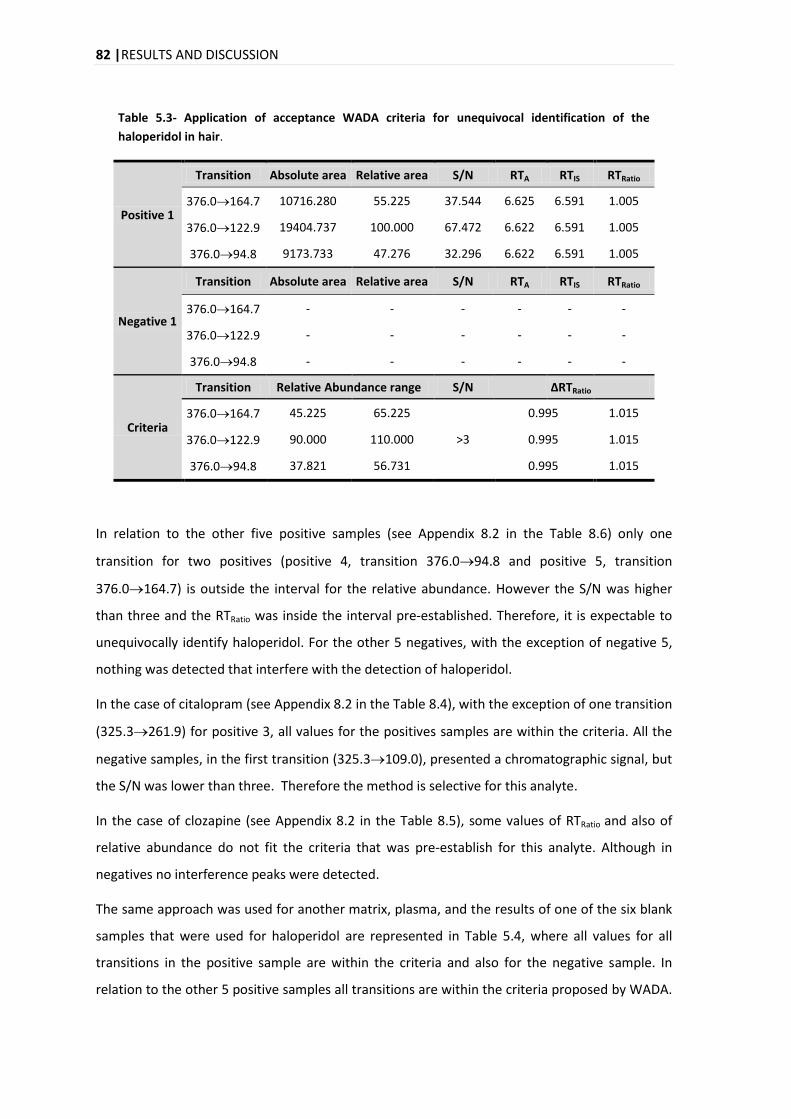
82 |RESULTS AND DISCUSSION
Table 5.3- Application of acceptance WADA criteria for unequivocal identification of the
haloperidol in hair.
Positive 1
Transition Absolute area Relative area S/N RTA RTIS RTRatio
376.0164.7 10716.280 55.225 37.544 6.625 6.591 1.005
376.0122.9 19404.737 100.000 67.472 6.622 6.591 1.005
376.094.8 9173.733 47.276 32.296 6.622 6.591 1.005
Negative 1
Transition Absolute area Relative area S/N RTA RTIS RTRatio
376.0164.7 - - - - - -
376.0122.9 - - - - - -
376.094.8 - - - - - -
Criteria
Transition Relative Abundance range S/N
ΔRTRatio
376.0164.7 45.225 65.225
>3
0.995 1.015
376.0122.9 90.000 110.000 0.995 1.015
376.094.8 37.821 56.731 0.995 1.015
In relation to the other five positive samples (see Appendix 8.2 in the Table 8.6) only one
transition for two positives (positive 4, transition 376.094.8 and positive 5, transition
376.0164.7) is outside the interval for the relative abundance. However the S/N was higher
than three and the RTRatio was inside the interval pre-established. Therefore, it is expectable to
unequivocally identify haloperidol. For the other 5 negatives, with the exception of negative 5,
nothing was detected that interfere with the detection of haloperidol.
In the case of citalopram (see Appendix 8.2 in the Table 8.4), with the exception of one transition
(325.3261.9) for positive 3, all values for the positives samples are within the criteria. All the
negative samples, in the first transition (325.3109.0), presented a chromatographic signal, but
the S/N was lower than three. Therefore the method is selective for this analyte.
In the case of clozapine (see Appendix 8.2 in the Table 8.5), some values of RTRatio and also of
relative abundance do not fit the criteria that was pre-establish for this analyte. Although in
negatives no interference peaks were detected.
The same approach was used for another matrix, plasma, and the results of one of the six blank
samples that were used for haloperidol are represented in Table 5.4, where all values for all
transitions in the positive sample are within the criteria and also for the negative sample. In
relation to the other 5 positive samples all transitions are within the criteria proposed by WADA.
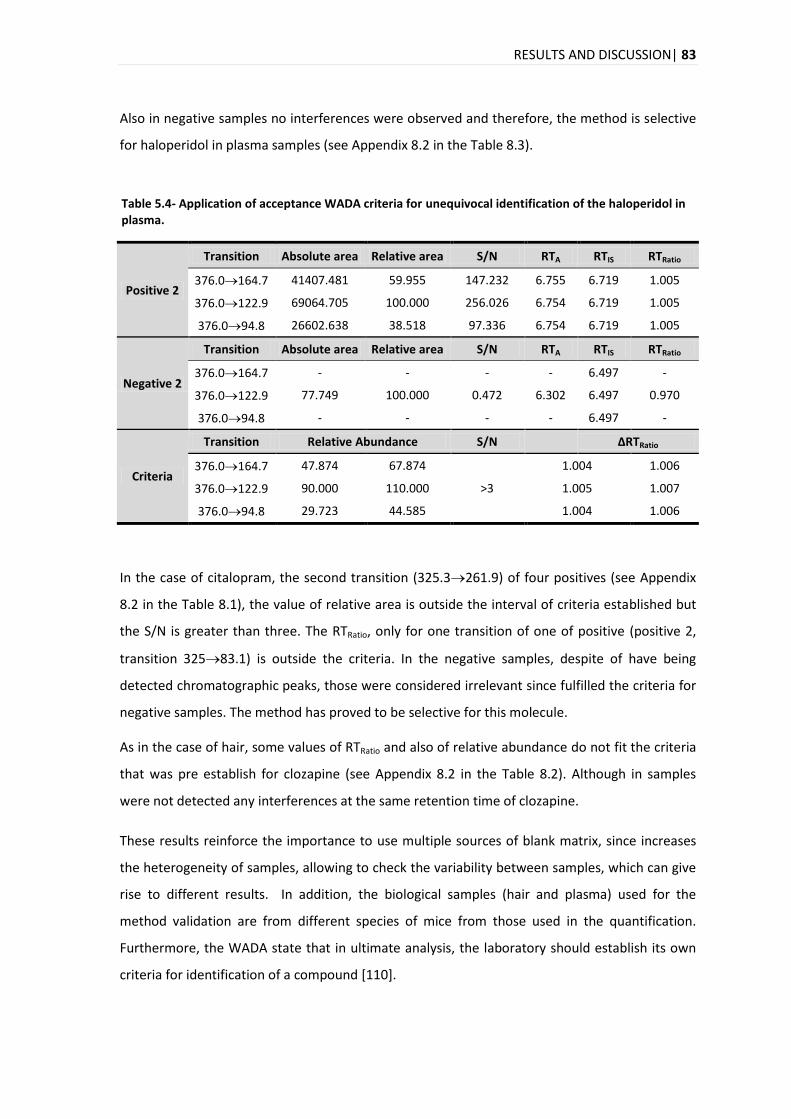
RESULTS AND DISCUSSION| 83
Also in negative samples no interferences were observed and therefore, the method is selective
for haloperidol in plasma samples (see Appendix 8.2 in the Table 8.3).
Table 5.4- Application of acceptance WADA criteria for unequivocal identification of the haloperidol in plasma.
Positive 2
Transition Absolute area Relative area S/N RTA RTIS RTRatio
376.0164.7 41407.481 59.955 147.232 6.755 6.719 1.005
376.0122.9 69064.705 100.000 256.026 6.754 6.719 1.005
376.094.8 26602.638 38.518 97.336 6.754 6.719 1.005
Negative 2
Transition Absolute area Relative area S/N RTA RTIS RTRatio
376.0164.7 - - - - 6.497 -
376.0122.9 77.749 100.000 0.472 6.302 6.497 0.970
376.094.8 - - - - 6.497 -
Criteria
Transition Relative Abundance S/N
ΔRTRatio
376.0164.7 47.874 67.874
>3
1.004 1.006
376.0122.9 90.000 110.000 1.005 1.007
376.094.8 29.723 44.585 1.004 1.006
In the case of citalopram, the second transition (325.3261.9) of four positives (see Appendix
8.2 in the Table 8.1), the value of relative area is outside the interval of criteria established but
the S/N is greater than three. The RTRatio, only for one transition of one of positive (positive 2,
transition 32583.1) is outside the criteria. In the negative samples, despite of have being
detected chromatographic peaks, those were considered irrelevant since fulfilled the criteria for
negative samples. The method has proved to be selective for this molecule.
As in the case of hair, some values of RTRatio and also of relative abundance do not fit the criteria
that was pre establish for clozapine (see Appendix 8.2 in the Table 8.2). Although in samples
were not detected any interferences at the same retention time of clozapine.
These results reinforce the importance to use multiple sources of blank matrix, since increases
the heterogeneity of samples, allowing to check the variability between samples, which can give
rise to different results. In addition, the biological samples (hair and plasma) used for the
method validation are from different species of mice from those used in the quantification.
Furthermore, the WADA state that in ultimate analysis, the laboratory should establish its own
criteria for identification of a compound [110].
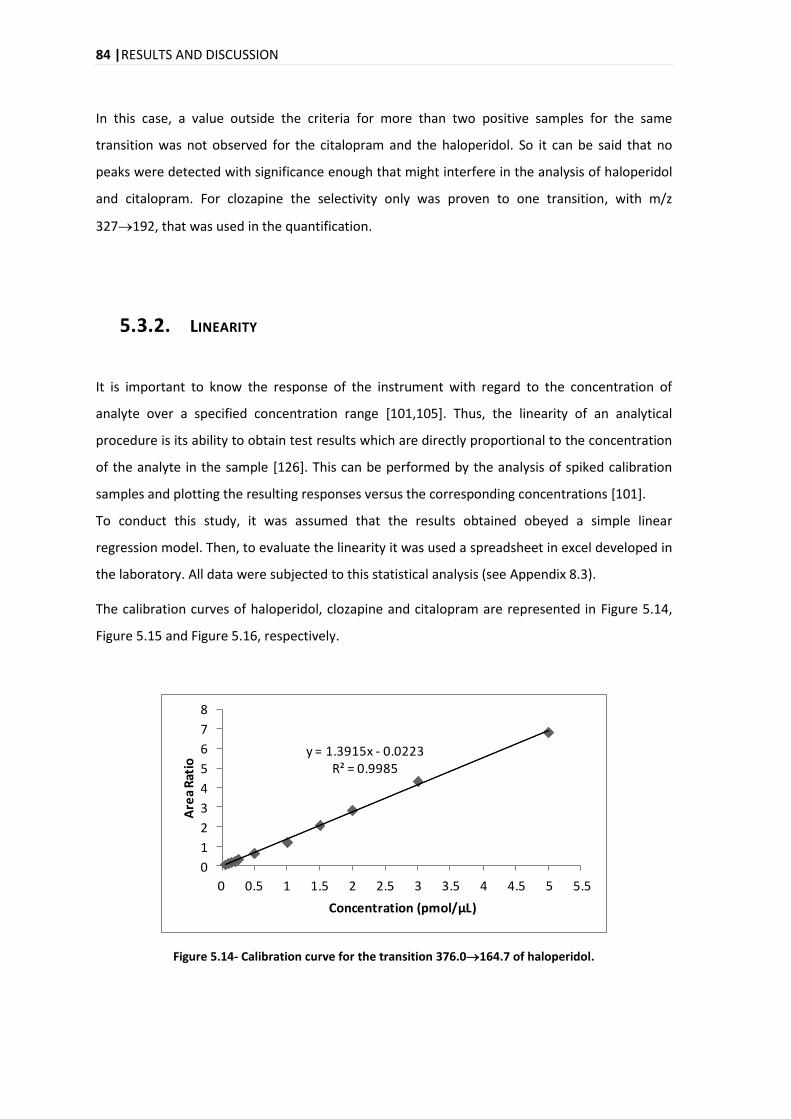
84 |RESULTS AND DISCUSSION
In this case, a value outside the criteria for more than two positive samples for the same
transition was not observed for the citalopram and the haloperidol. So it can be said that no
peaks were detected with significance enough that might interfere in the analysis of haloperidol
and citalopram. For clozapine the selectivity only was proven to one transition, with m/z
327192, that was used in the quantification.
5.3.2. LINEARITY
It is important to know the response of the instrument with regard to the concentration of
analyte over a specified concentration range [101,105]. Thus, the linearity of an analytical
procedure is its ability to obtain test results which are directly proportional to the concentration
of the analyte in the sample [126]. This can be performed by the analysis of spiked calibration
samples and plotting the resulting responses versus the corresponding concentrations [101].
To conduct this study, it was assumed that the results obtained obeyed a simple linear
regression model. Then, to evaluate the linearity it was used a spreadsheet in excel developed in
the laboratory. All data were subjected to this statistical analysis (see Appendix 8.3).
The calibration curves of haloperidol, clozapine and citalopram are represented in Figure 5.14,
Figure 5.15 and Figure 5.16, respectively.
y = 1.3915x - 0.0223R² = 0.9985
0
1
2
3
4
5
6
7
8
0 0.5 1 1.5 2 2.5 3 3.5 4 4.5 5 5.5
Are
a R
atio
Concentration (pmol/µL)
Figure 5.14- Calibration curve for the transition 376.0164.7 of haloperidol.
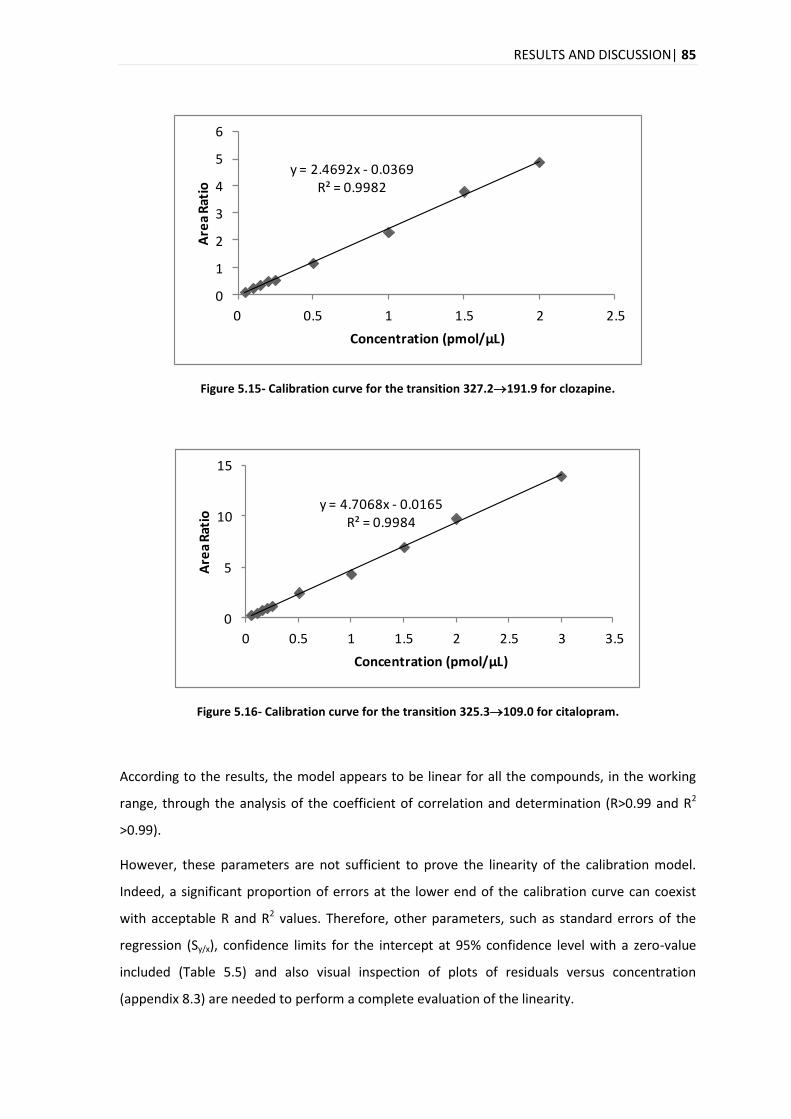
RESULTS AND DISCUSSION| 85
y = 2.4692x - 0.0369R² = 0.9982
0
1
2
3
4
5
6
0 0.5 1 1.5 2 2.5
Are
a R
atio
Concentration (pmol/μL)
Figure 5.15- Calibration curve for the transition 327.2191.9 for clozapine.
y = 4.7068x - 0.0165R² = 0.9984
0
5
10
15
0 0.5 1 1.5 2 2.5 3 3.5
Are
a R
atio
Concentration (pmol/µL)
Figure 5.16- Calibration curve for the transition 325.3109.0 for citalopram.
According to the results, the model appears to be linear for all the compounds, in the working
range, through the analysis of the coefficient of correlation and determination (R>0.99 and R2
>0.99).
However, these parameters are not sufficient to prove the linearity of the calibration model.
Indeed, a significant proportion of errors at the lower end of the calibration curve can coexist
with acceptable R and R2 values. Therefore, other parameters, such as standard errors of the
regression (Sy/x), confidence limits for the intercept at 95% confidence level with a zero-value
included (Table 5.5) and also visual inspection of plots of residuals versus concentration
(appendix 8.3) are needed to perform a complete evaluation of the linearity.
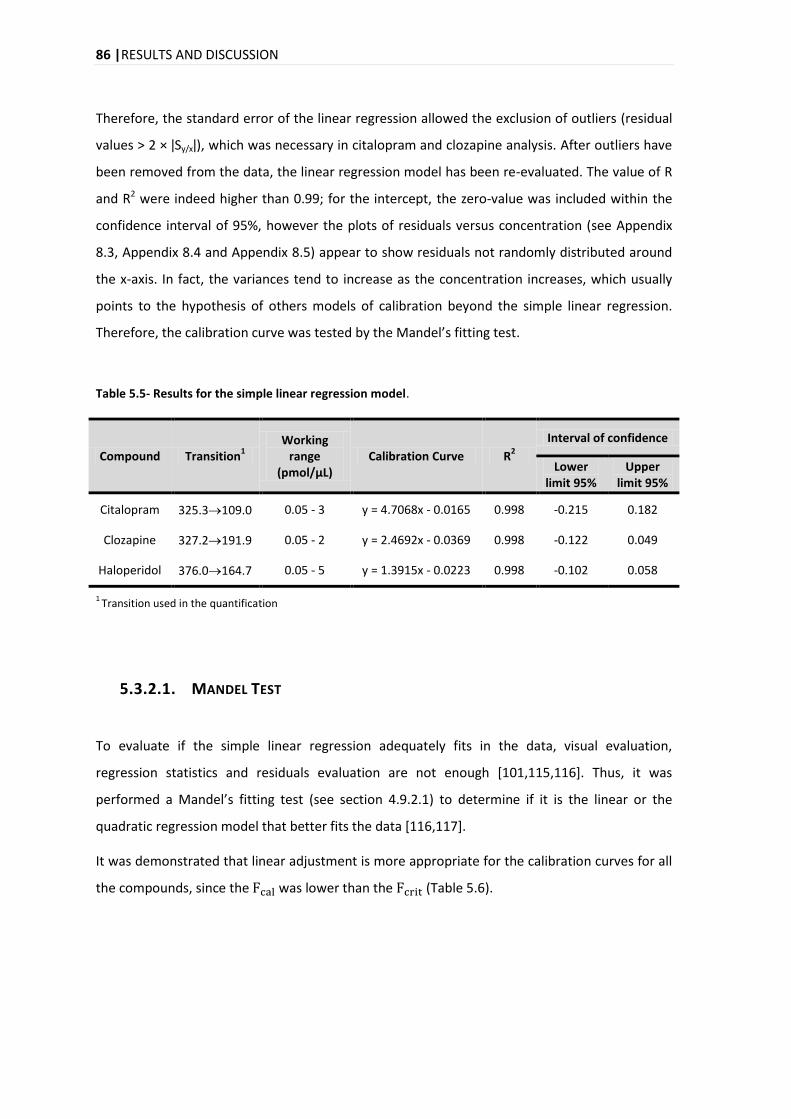
86 |RESULTS AND DISCUSSION
Therefore, the standard error of the linear regression allowed the exclusion of outliers (residual
values > 2 × ǀSy/xǀ), which was necessary in citalopram and clozapine analysis. After outliers have
been removed from the data, the linear regression model has been re-evaluated. The value of R
and R2 were indeed higher than 0.99; for the intercept, the zero-value was included within the
confidence interval of 95%, however the plots of residuals versus concentration (see Appendix
8.3, Appendix 8.4 and Appendix 8.5) appear to show residuals not randomly distributed around
the x-axis. In fact, the variances tend to increase as the concentration increases, which usually
points to the hypothesis of others models of calibration beyond the simple linear regression.
Therefore, the calibration curve was tested by the Mandel’s fitting test.
Table 5.5- Results for the simple linear regression model.
Compound Transition1
Working range
(pmol/μL) Calibration Curve R
2
Interval of confidence
Lower limit 95%
Upper limit 95%
Citalopram 325.3109.0 0.05 - 3 y = 4.7068x - 0.0165 0.998 -0.215 0.182
Clozapine 327.2191.9 0.05 - 2 y = 2.4692x - 0.0369 0.998 -0.122 0.049
Haloperidol 376.0164.7 0.05 - 5 y = 1.3915x - 0.0223 0.998 -0.102 0.058
1 Transition used in the quantification
5.3.2.1. MANDEL TEST
To evaluate if the simple linear regression adequately fits in the data, visual evaluation,
regression statistics and residuals evaluation are not enough [101,115,116]. Thus, it was
performed a Mandel’s fitting test (see section 4.9.2.1) to determine if it is the linear or the
quadratic regression model that better fits the data [116,117].
It was demonstrated that linear adjustment is more appropriate for the calibration curves for all
the compounds, since the was lower than the (Table 5.6).
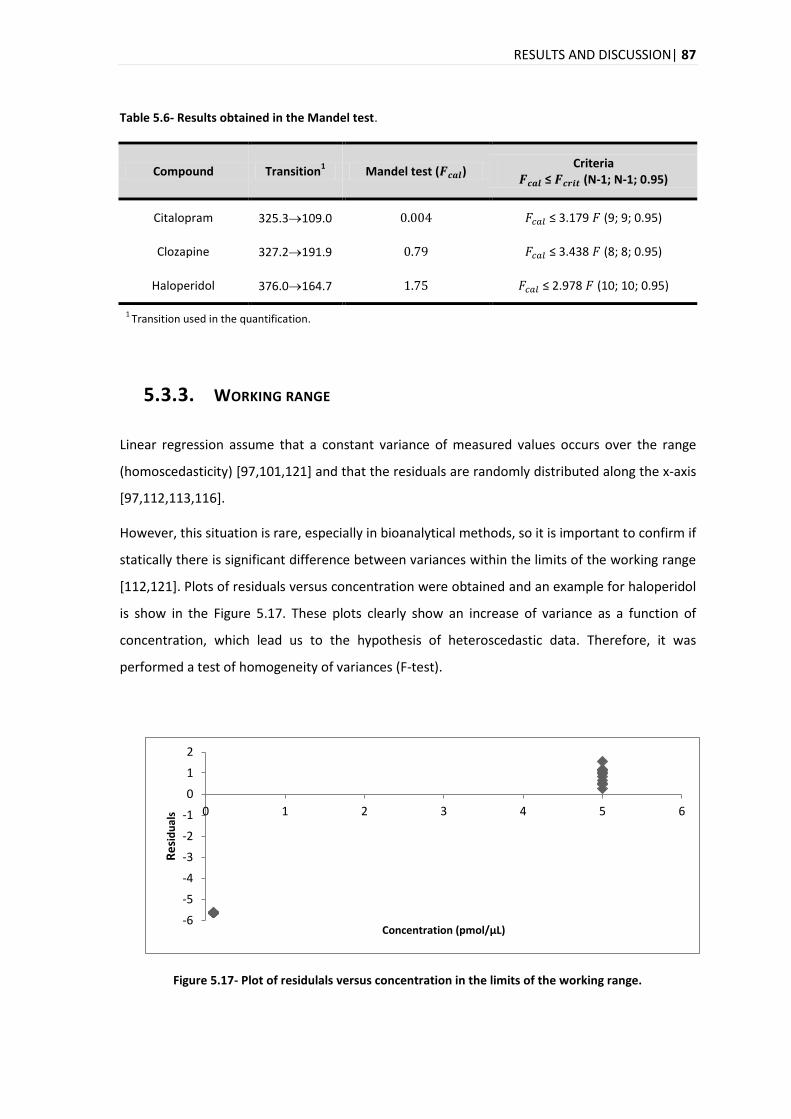
RESULTS AND DISCUSSION| 87
Table 5.6- Results obtained in the Mandel test.
Compound Transition1 Mandel test ( )
Criteria ≤ (N-1; N-1; 0.95)
Citalopram 325.3109.0 ≤ 3.179 (9; 9; 0.95)
Clozapine 327.2191.9 ≤ 3.438 (8; 8; 0.95)
Haloperidol 376.0164.7 ≤ 2.978 (10; 10; 0.95)
1 Transition used in the quantification.
5.3.3. WORKING RANGE
Linear regression assume that a constant variance of measured values occurs over the range
(homoscedasticity) [97,101,121] and that the residuals are randomly distributed along the x-axis
[97,112,113,116].
However, this situation is rare, especially in bioanalytical methods, so it is important to confirm if
statically there is significant difference between variances within the limits of the working range
[112,121]. Plots of residuals versus concentration were obtained and an example for haloperidol
is show in the Figure 5.17. These plots clearly show an increase of variance as a function of
concentration, which lead us to the hypothesis of heteroscedastic data. Therefore, it was
performed a test of homogeneity of variances (F-test).
Figure 5.17- Plot of residulals versus concentration in the limits of the working range.
-6
-5
-4
-3
-2
-1
0
1
2
0 1 2 3 4 5 6
Re
sid
ual
s
Concentration (pmol/µL)
88 |RESULTS AND DISCUSSION
With the test performed to verify the variances (equations (4.7) and (4.8) in section 1.5.3.),
differences between the values of the variances within the limits of the working range (0.05 -
5μM) were observed.
Results of the homogeneity test (Table 5.7) show that values for were above the tabled
value of ., consequently there is a significant difference between the variances, which
mean heteroscedastic data, for all compounds.
Table 5.7- Results obtained in the test of homogeneity of variances.
Compound Transition1
Test of homogeneity of variances ( )
Criteria ≤ (N-1; N-1; 0.95)
Citalopram 325.3109.0 3373.9
≤ 3.8 (9; 9; 0,95)
Clozapine 327.2191.9 1311.6
Haloperidol 376.0164.7 2104.0
1 Transition used in the quantification.
5.3.3.1. WEIGHTED LEAST SQUARES LINEAR REGRESSION
In presence of heteroscedastic data different approaches could be followed, as already
mentioned. Therefore, it is possible to reduce the working range until homoscedasticity is
observed ( ≤ ) [118,121], to use the inverse of variance (1/S2) in each point of the
calibration curve, or even to use the WLSLR [113,122], choosing the approprieted weighting
factor, [112]. In this project, it was used WLSLR and therefore it was necessary to choose an
appropriate regression model for each compound, with the application of empirical weighting
factors:
;
;
;
;
or
[112,125].
Plots of %RE versus concentration for unweighted (model 1) and weighted (models 2 – 7) of
haloperidol obtained in intermediate precision study are shown in Figure 5.18. As it can be seen,
the unweighted model overestimates the concentration, especially in lower ranges of the
calibration curves, near LOQ.
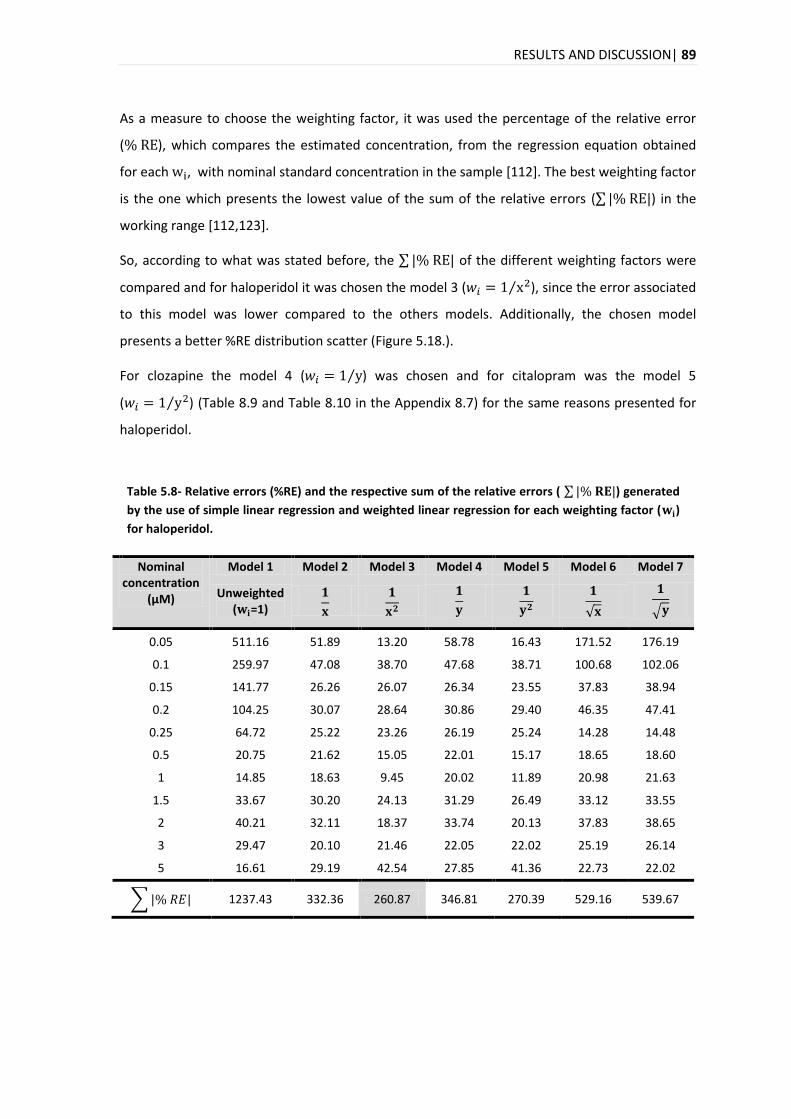
RESULTS AND DISCUSSION| 89
As a measure to choose the weighting factor, it was used the percentage of the relative error
( ), which compares the estimated concentration, from the regression equation obtained
for each , with nominal standard concentration in the sample [112]. The best weighting factor
is the one which presents the lowest value of the sum of the relative errors ( ) in the
working range [112,123].
So, according to what was stated before, the of the different weighting factors were
compared and for haloperidol it was chosen the model 3 ( ), since the error associated
to this model was lower compared to the others models. Additionally, the chosen model
presents a better %RE distribution scatter (Figure 5.18.).
For clozapine the model 4 ( ) was chosen and for citalopram was the model 5
( ) (Table 8.9 and Table 8.10 in the Appendix 8.7) for the same reasons presented for
haloperidol.
Table 5.8- Relative errors (%RE) and the respective sum of the relative errors ( ) generated
by the use of simple linear regression and weighted linear regression for each weighting factor ( )
for haloperidol.
Nominal concentration
(μM)
Model 1 Model 2 Model 3 Model 4 Model 5 Model 6 Model 7
Unweighted ( =1)
0.05 511.16 51.89 13.20 58.78 16.43 171.52 176.19
0.1 259.97 47.08 38.70 47.68 38.71 100.68 102.06
0.15 141.77 26.26 26.07 26.34 23.55 37.83 38.94
0.2 104.25 30.07 28.64 30.86 29.40 46.35 47.41
0.25 64.72 25.22 23.26 26.19 25.24 14.28 14.48
0.5 20.75 21.62 15.05 22.01 15.17 18.65 18.60
1 14.85 18.63 9.45 20.02 11.89 20.98 21.63
1.5 33.67 30.20 24.13 31.29 26.49 33.12 33.55
2 40.21 32.11 18.37 33.74 20.13 37.83 38.65
3 29.47 20.10 21.46 22.05 22.02 25.19 26.14
5 16.61 29.19 42.54 27.85 41.36 22.73 22.02
1237.43 332.36 260.87 346.81 270.39 529.16 539.67
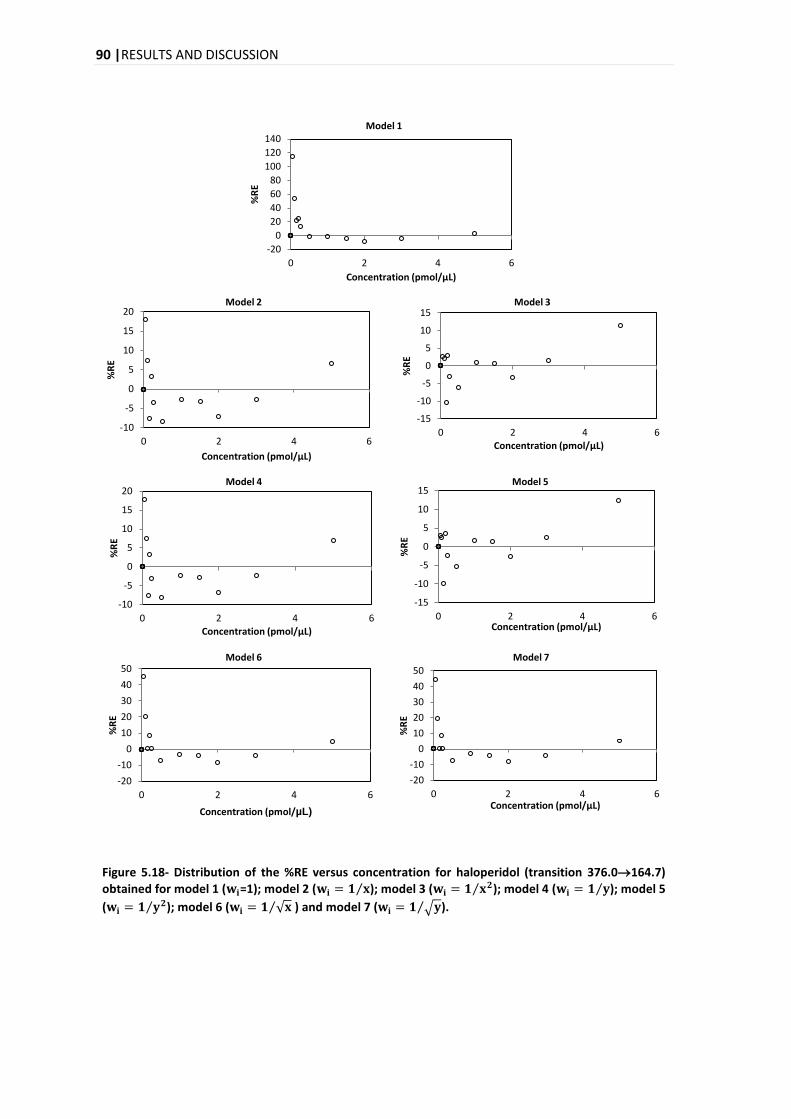
90 |RESULTS AND DISCUSSION
Figure 5.18- Distribution of the %RE versus concentration for haloperidol (transition 376.0164.7)
obtained for model 1 ( =1); model 2 ( ); model 3 ( ); model 4 ( ); model 5
( ); model 6 ( ) and model 7 ( ).
-20
0
20
40
60
80
100
120
140
0 2 4 6 %
RE
Concentration (pmol/µL)
Model 1
-10
-5
0
5
10
15
20
0 2 4 6
%R
E
Concentration (pmol/µL)
Model 2
-15
-10
-5
0
5
10
15
0 2 4 6
%R
E
Concentration (pmol/µL)
Model 3
-10
-5
0
5
10
15
20
0 2 4 6
%R
E
Concentration (pmol/µL)
Model 4
-15
-10
-5
0
5
10
15
0 2 4 6
%R
E
Concentration (pmol/µL)
Model 5
-20
-10
0
10
20
30
40
50
0 2 4 6
%R
E
Concentration (pmol/µL)
Model 6
-20
-10
0
10
20
30
40
50
0 2 4 6
%R
E
Concentration (pmol/µL)
Model 7
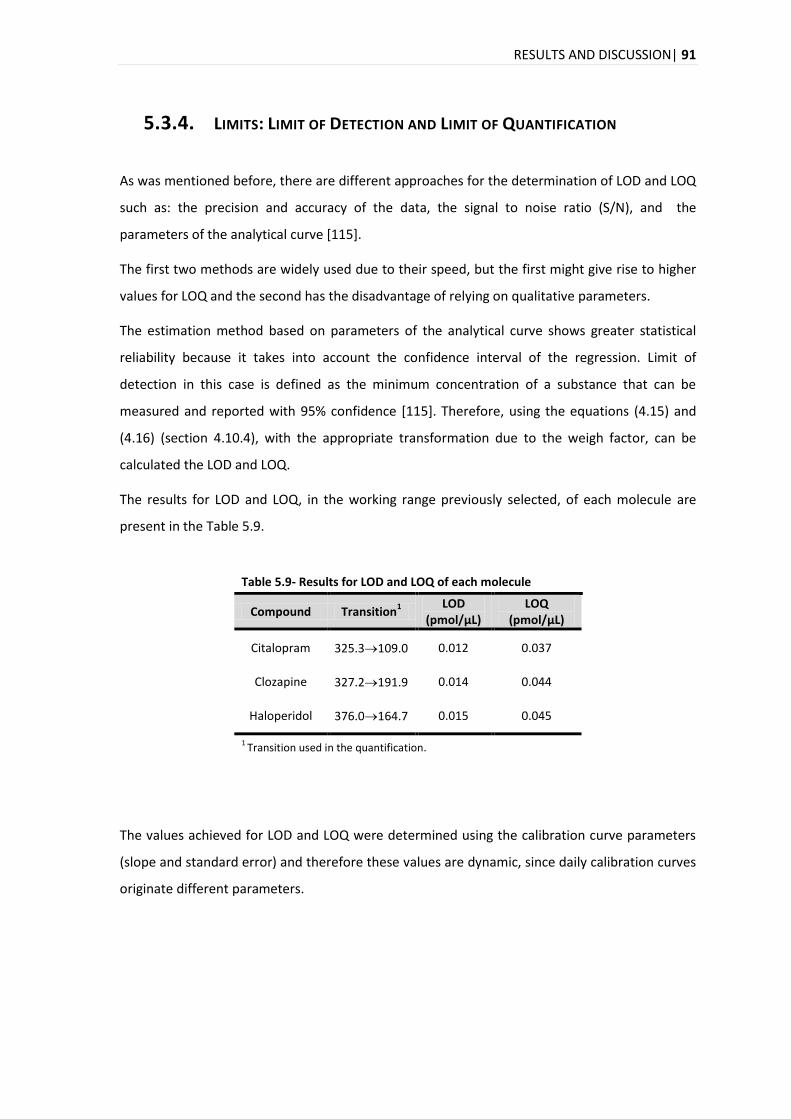
RESULTS AND DISCUSSION| 91
5.3.4. LIMITS: LIMIT OF DETECTION AND LIMIT OF QUANTIFICATION
As was mentioned before, there are different approaches for the determination of LOD and LOQ
such as: the precision and accuracy of the data, the signal to noise ratio (S/N), and the
parameters of the analytical curve [115].
The first two methods are widely used due to their speed, but the first might give rise to higher
values for LOQ and the second has the disadvantage of relying on qualitative parameters.
The estimation method based on parameters of the analytical curve shows greater statistical
reliability because it takes into account the confidence interval of the regression. Limit of
detection in this case is defined as the minimum concentration of a substance that can be
measured and reported with 95% confidence [115]. Therefore, using the equations (4.15) and
(4.16) (section 4.10.4), with the appropriate transformation due to the weigh factor, can be
calculated the LOD and LOQ.
The results for LOD and LOQ, in the working range previously selected, of each molecule are
present in the Table 5.9.
Table 5.9- Results for LOD and LOQ of each molecule
Compound Transition1
LOD (pmol/μL)
LOQ (pmol/μL)
Citalopram 325.3109.0 0.012 0.037
Clozapine 327.2191.9 0.014 0.044
Haloperidol 376.0164.7 0.015 0.045
1 Transition used in the quantification.
The values achieved for LOD and LOQ were determined using the calibration curve parameters
(slope and standard error) and therefore these values are dynamic, since daily calibration curves
originate different parameters.
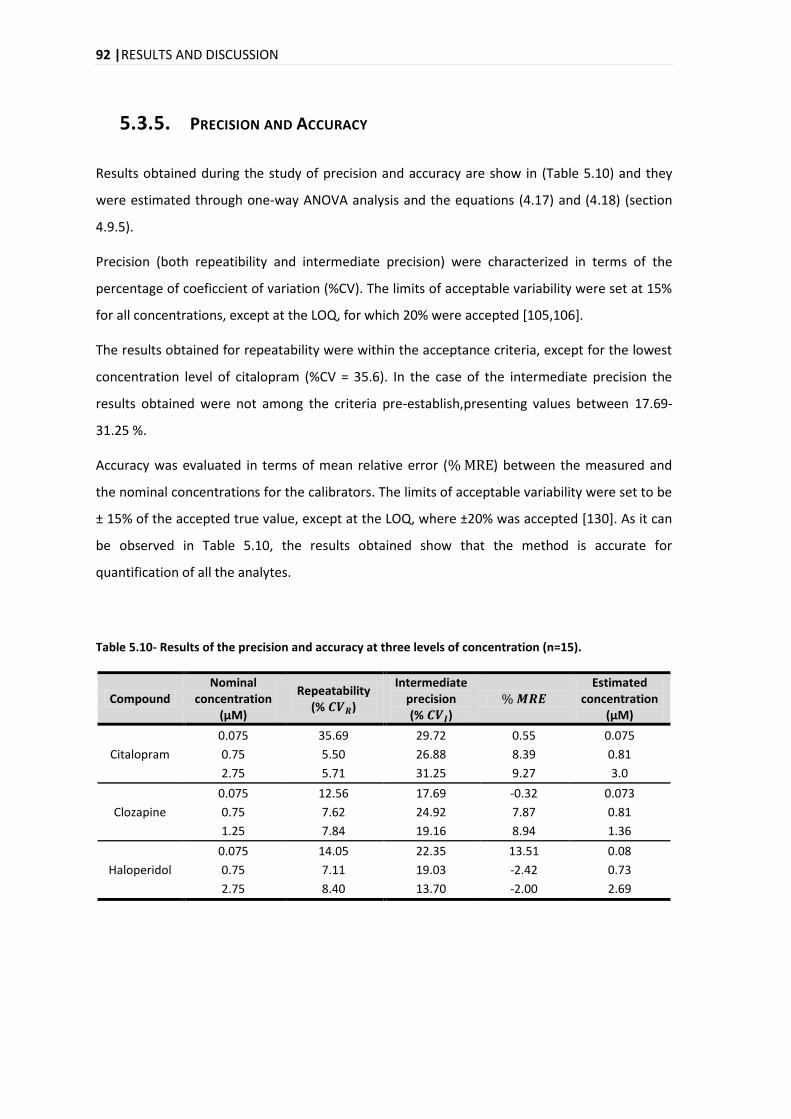
92 |RESULTS AND DISCUSSION
5.3.5. PRECISION AND ACCURACY
Results obtained during the study of precision and accuracy are show in (Table 5.10) and they
were estimated through one-way ANOVA analysis and the equations (4.17) and (4.18) (section
4.9.5).
Precision (both repeatibility and intermediate precision) were characterized in terms of the
percentage of coeficcient of variation (%CV). The limits of acceptable variability were set at 15%
for all concentrations, except at the LOQ, for which 20% were accepted [105,106].
The results obtained for repeatability were within the acceptance criteria, except for the lowest
concentration level of citalopram (%CV = 35.6). In the case of the intermediate precision the
results obtained were not among the criteria pre-establish,presenting values between 17.69-
31.25 %.
Accuracy was evaluated in terms of mean relative error ( ) between the measured and
the nominal concentrations for the calibrators. The limits of acceptable variability were set to be
± 15% of the accepted true value, except at the LOQ, where ±20% was accepted [130]. As it can
be observed in Table 5.10, the results obtained show that the method is accurate for
quantification of all the analytes.
Table 5.10- Results of the precision and accuracy at three levels of concentration (n=15).
Compound Nominal
concentration (μM)
Repeatability (% )
Intermediate precision (% )
Estimated
concentration (μM)
Citalopram
0.075 35.69 29.72 0.55 0.075
0.75 5.50 26.88 8.39 0.81
2.75 5.71 31.25 9.27 3.0
Clozapine
0.075 12.56 17.69 -0.32 0.073
0.75 7.62 24.92 7.87 0.81
1.25 7.84 19.16 8.94 1.36
Haloperidol
0.075 14.05 22.35 13.51 0.08
0.75 7.11 19.03 -2.42 0.73
2.75 8.40 13.70 -2.00 2.69
RESULTS AND DISCUSSION| 93
5.3.6. CARRY-OVER
As mentioned above, carry-over is the amount of the analyte retained in an LC system from a
preceding sample that carries over into the next injected sample [146]. This phenomena can be
measured by the response of the blank sample after the injection of a preceding sample at high
concentration [146].
Usually, the procedure to evaluate carry-over is performed with the injection of blank samples
after samples with an expected high concentration [105], but in this project it was also injected
other levels of concentration, 0.5 μM and 0.05 μM (see section 4.9.8).
So, a criterion that is accepted to evaluate if the phenomenon is relevant is proposed by EMA,
where the peak area of the analyte in a blank sample that follows the high concentration
standard must be less than 20% of the peak area of the limit of quantification and 5% for the IS
[105].
Results for carry-over of citalopram and clozapine show that the criterion establish was fulfilled,
as for the IS used, desipramine (Table 8.12 in the Appendix 8.8), thus no significant carry over
was observed. In the clozapine, same occurs (Table 8.14 in the Appendix 8.8), so it can be said
that with this molecule does not occur carry-over.
For haloperidol, the signal detected in the first blank was intense and it was higher than 20% of
the LOQ. However, the next blanks that were injected are in accordance to the criteria (Table
8.16).
These peaks that appear in the blank samples may be caused by analyte retention in previous
injections [147], which can be absorbed in the autosampler or can be residues on columns
[148]. Another cause may be the possibility of the inadvertent addition of the analyte in the
sample blank (contamination), or non-analyte related peaks which can arise either from a
previous injection (late eluters) or the current injection (interfering endogenous peaks) [147].
Sample carry-over is a major problem that can influence the accuracy and precision of the
method, with the consequences being more pronounced at lower concentrations [148].
Therefore, results that were obtained show that carry-over should be investigated and
minimized, so it is important to inject blanks with the mobile phase, between samples, to reduce
this phenomenon. In this project this phenomenon was minimized with a blank injected
between samples and three blanks were introduced between batches. In this way, it was
94 |RESULTS AND DISCUSSION
ensured that the carry-over did not affect the analysis of samples, in particular in the
quantification of real samples.
5.3.7. RECOVERY
Recovery is the amount of the substance of interest added to the blank matrix which is capable
of being extracted and quantified [145]. This parameter basically evaluates the extraction
efficiency of an analytical process of the biological samples [102,129].
Thus, recovery is best tested by comparing the response of blank matrix spiked before extraction
with the response of extracted blank matrix to which analyte has been added at the same
nominal concentration, just before injection [120,143]. This was the procedure that was
performed in this project to study the recovery (see section 4.9.8) and additionally, it was also
studied the recovery of the two IS (desipramine and haloperidol-D4), which is recommended to
be determined independently [120].
Despite the recommendations related to values close to 100% recovery, Peters et al. [100,130],
stated that the value for recovery is not important as long as precision, accuracy, LOQ and LOD
are satisfactory.
According to Ribani et al [145]., values between 70 to 120%, with a precision of ± 20%, are
acceptable intervals for recovery. Also, depending on the analytical complexity and complexity
of the sample, these values can be 50 to 120%, with a precision of ± 15%.
Other authors state that it is unlikely that recoveries of 50% or less will compromise the integrity
of the method [120] and it is not needed to provide good accuracy and precision if adequate
detection can be attained [107].
Values of recovery for hair were between 8.9 to 45.5 % (Table 5.11). The dispersion of the
results, measured by % CV, was higher for lower concentrations. Here, it is also important to
take in count that the efficiency of the method varies depending on the concentration of the
substance and in most cases the dispersion of results increases with the decrease in the
concentration, so the recovery can differ substantially from the high and low concentrations
[145].
RESULTS AND DISCUSSION| 95
Table 5.11- Recovery, in percentage, of the extraction of the hair for each compound at three concentration levels of concentration.
Recovery ± % CV
Compound 0.1 μM 0.5 μM 3 μM
Citalopram 34.0± 50.3 34.0± 27.8 38.9± 10.6
Clozapine 10.7 ± 68.5 8.9 ± 14.4 12.4 ± 9.4
Haloperidol 39.6 ± 36.4 36.5 ± 31.3 39.9 ± 20.2
Desipramine 45.5 ± 36.3 36.6 ± 30.4 36.3 ± 18.6
Haloperidol-D4 43.4 ± 39.7 34.6 ± 27.4 45.2 ± 14.4
One explanation of the low values of recovery and high %CV can be compound degradation
during extraction protocol due to the used high temperature and/or incubation time.
Recovery results for plasma were between 68.9 to 115.5 % and the % CV were within the criteria
with the exception of haloperidol-D4 and desipramine (Table 5.12).
Table 5.12- Recovery, in percentage, of the extraction of the plasma for each compound at three concentration levels of concentration
Recovery ± % CV
Compound 0.1 μM 0.5 μM 3 μM
Citalopram 87.7 ± 7.4 90.9 ± 15.0 101.5 ± 17.4
Clozapine 95.8± 23.0 116.1± 12.0 100.4± 15.5
Haloperidol 89.1 ± 17.9 93.1 ± 19.4 115.5 ± 19.9
Desipramine 69.9 ± 22.5 68.9 ± 10.0 92.2 ± 22.8
Haloperidol-D4 82.9 ± 25.9 136.2 ± 52.1 102.1 ± 19.8
The procedure of the plasma is simpler and with fewer steps where possible losses of the
analyte may occur, which may explain better results for the recovery in plasma compared to the
recovery of hair.
96 |RESULTS AND DISCUSSION
5.3.8. MATRIX EFFECTS
One of the most important aspects is competition between an analyte and a co-eluting matrix
component during ionization. As a result, depending on the environment in which the ionization
and ion evaporation processes takes place, there is a decrease in analyte ionization (ion
suppression) or an increase in this ionization (ion enhancement) [132,149]. Residual matrix
components, endogenous phospholipids in particular, are a significant source of imprecision in
quantitative analyses commonly conducted by LC-MS/MS [131,132].
Matrix effects cause a compound’s response to differ when analyzed in a biological matrix
compared to a standard solution [150], therefore a methodology to compare these differences
was developed (see section 4.9.9). Then, it was calculated the ME using the equation (4.22)
where a negative result indicates ion supression. Otherwise, if a positive result is obtained this
indicates analyte signal enhancement. Thus, a value of zero would represent no ME [131,133].
The ME calculated in this manner may be referred as an absolute matrix effect, since the signal
response of the compound present in the sample extract is compared to the response of a
compound made directly in a pure mobile phase [132].
Results show that in hair matrix mostly of the analytes had positive results for the absolute ME,
which indicates an enhancement of the signal response (Table 5.13).
Table 5.13- Matrix effects for each compound at three levels of
concentration in hair matrix
Matrix Effects
Compound 0.1 μM 0.5 μM 3 μM
Citalopram 0.182 -0.103 0.889
Clozapine 0.126 -0.004 0.991
Haloperidol -0.082 -0.383 0.464
Desipramine 0.019 -0.362 0.803
Haloperidol-D4 0.023 -0.307 0.618
The variability in these responses, expressed as % CV can be used as a measure of the relative
matrix effect for a given analyte (Table 5.14). The values were high and through the analysis of
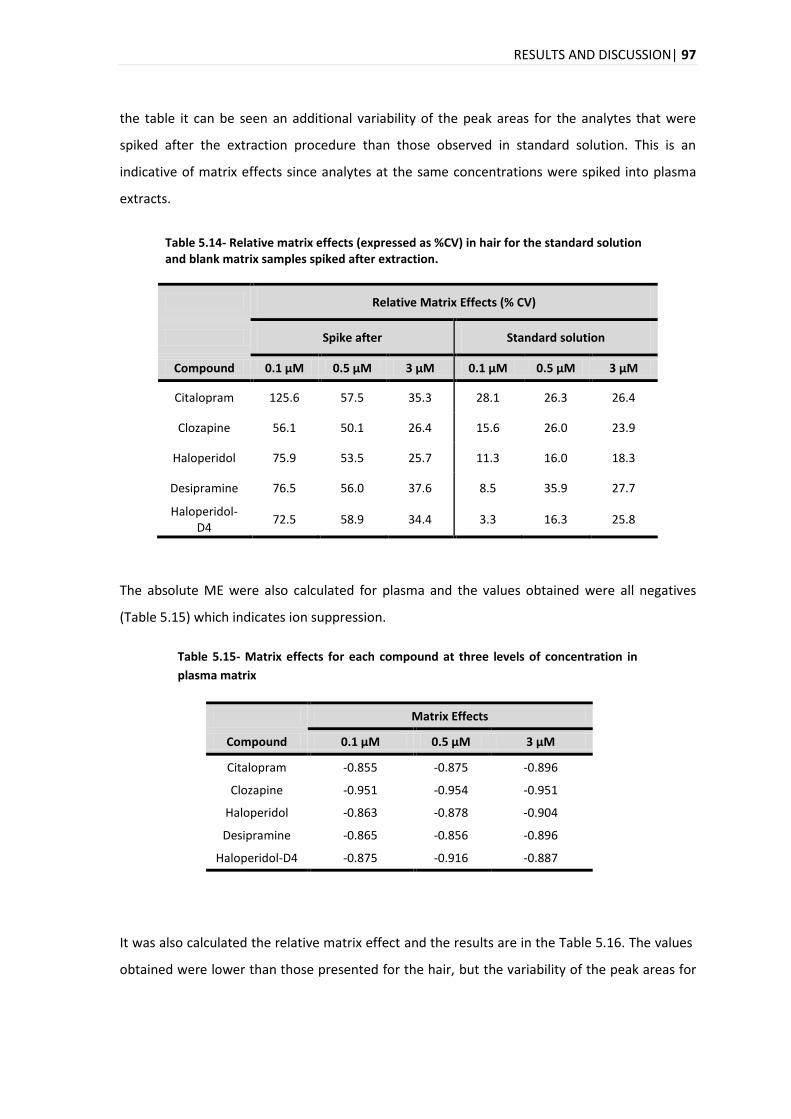
RESULTS AND DISCUSSION| 97
the table it can be seen an additional variability of the peak areas for the analytes that were
spiked after the extraction procedure than those observed in standard solution. This is an
indicative of matrix effects since analytes at the same concentrations were spiked into plasma
extracts.
Table 5.14- Relative matrix effects (expressed as %CV) in hair for the standard solution and blank matrix samples spiked after extraction.
Relative Matrix Effects (% CV)
Spike after Standard solution
Compound 0.1 μM 0.5 μM 3 μM 0.1 μM 0.5 μM 3 μM
Citalopram 125.6 57.5 35.3 28.1 26.3 26.4
Clozapine 56.1 50.1 26.4 15.6 26.0 23.9
Haloperidol 75.9 53.5 25.7 11.3 16.0 18.3
Desipramine 76.5 56.0 37.6 8.5 35.9 27.7
Haloperidol-D4
72.5 58.9 34.4 3.3 16.3 25.8
The absolute ME were also calculated for plasma and the values obtained were all negatives
(Table 5.15) which indicates ion suppression.
Table 5.15- Matrix effects for each compound at three levels of concentration in
plasma matrix
Matrix Effects
Compound 0.1 μM 0.5 μM 3 μM
Citalopram -0.855 -0.875 -0.896
Clozapine -0.951 -0.954 -0.951
Haloperidol -0.863 -0.878 -0.904
Desipramine -0.865 -0.856 -0.896
Haloperidol-D4 -0.875 -0.916 -0.887
It was also calculated the relative matrix effect and the results are in the Table 5.16. The values
obtained were lower than those presented for the hair, but the variability of the peak areas for
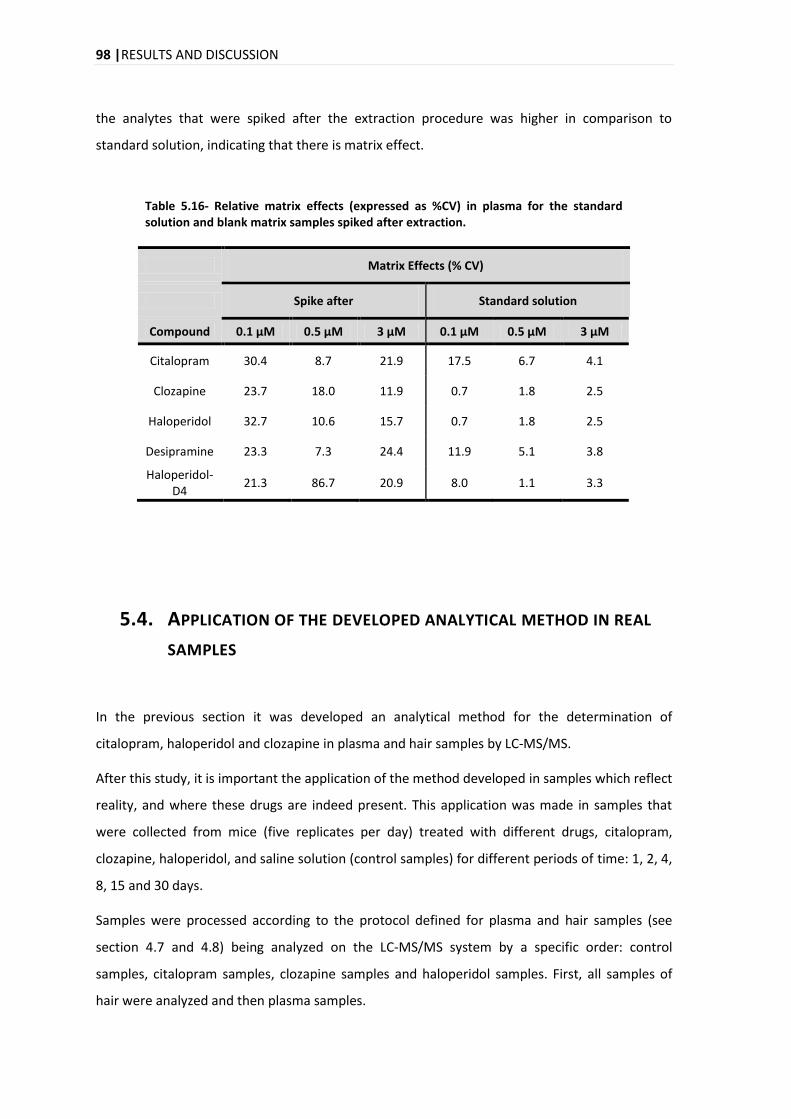
98 |RESULTS AND DISCUSSION
the analytes that were spiked after the extraction procedure was higher in comparison to
standard solution, indicating that there is matrix effect.
Table 5.16- Relative matrix effects (expressed as %CV) in plasma for the standard solution and blank matrix samples spiked after extraction.
Matrix Effects (% CV)
Spike after Standard solution
Compound 0.1 μM 0.5 μM 3 μM 0.1 μM 0.5 μM 3 μM
Citalopram 30.4 8.7 21.9 17.5 6.7 4.1
Clozapine 23.7 18.0 11.9 0.7 1.8 2.5
Haloperidol 32.7 10.6 15.7 0.7 1.8 2.5
Desipramine 23.3 7.3 24.4 11.9 5.1 3.8
Haloperidol-D4
21.3 86.7 20.9 8.0 1.1 3.3
5.4. APPLICATION OF THE DEVELOPED ANALYTICAL METHOD IN REAL
SAMPLES
In the previous section it was developed an analytical method for the determination of
citalopram, haloperidol and clozapine in plasma and hair samples by LC-MS/MS.
After this study, it is important the application of the method developed in samples which reflect
reality, and where these drugs are indeed present. This application was made in samples that
were collected from mice (five replicates per day) treated with different drugs, citalopram,
clozapine, haloperidol, and saline solution (control samples) for different periods of time: 1, 2, 4,
8, 15 and 30 days.
Samples were processed according to the protocol defined for plasma and hair samples (see
section 4.7 and 4.8) being analyzed on the LC-MS/MS system by a specific order: control
samples, citalopram samples, clozapine samples and haloperidol samples. First, all samples of
hair were analyzed and then plasma samples.
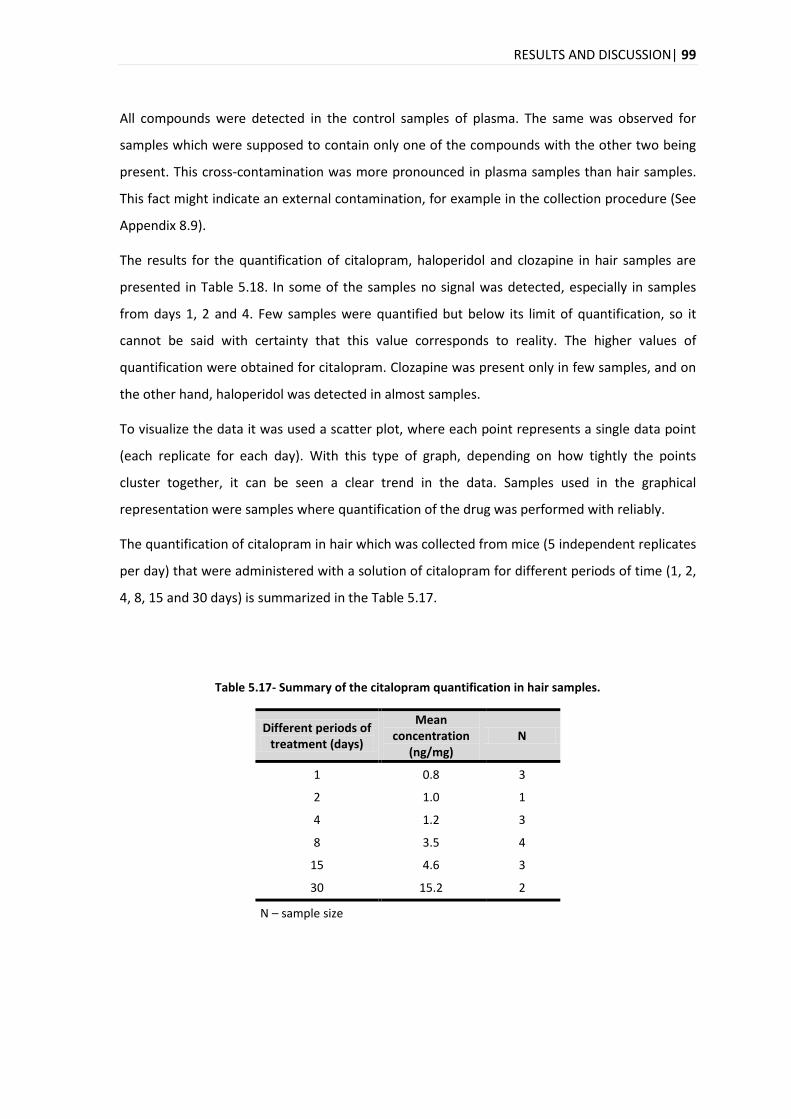
RESULTS AND DISCUSSION| 99
All compounds were detected in the control samples of plasma. The same was observed for
samples which were supposed to contain only one of the compounds with the other two being
present. This cross-contamination was more pronounced in plasma samples than hair samples.
This fact might indicate an external contamination, for example in the collection procedure (See
Appendix 8.9).
The results for the quantification of citalopram, haloperidol and clozapine in hair samples are
presented in Table 5.18. In some of the samples no signal was detected, especially in samples
from days 1, 2 and 4. Few samples were quantified but below its limit of quantification, so it
cannot be said with certainty that this value corresponds to reality. The higher values of
quantification were obtained for citalopram. Clozapine was present only in few samples, and on
the other hand, haloperidol was detected in almost samples.
To visualize the data it was used a scatter plot, where each point represents a single data point
(each replicate for each day). With this type of graph, depending on how tightly the points
cluster together, it can be seen a clear trend in the data. Samples used in the graphical
representation were samples where quantification of the drug was performed with reliably.
The quantification of citalopram in hair which was collected from mice (5 independent replicates
per day) that were administered with a solution of citalopram for different periods of time (1, 2,
4, 8, 15 and 30 days) is summarized in the Table 5.17.
Table 5.17- Summary of the citalopram quantification in hair samples.
Different periods of treatment (days)
Mean concentration
(ng/mg) N
1 0.8 3
2 1.0 1
4 1.2 3
8 3.5 4
15 4.6 3
30 15.2 2
N – sample size
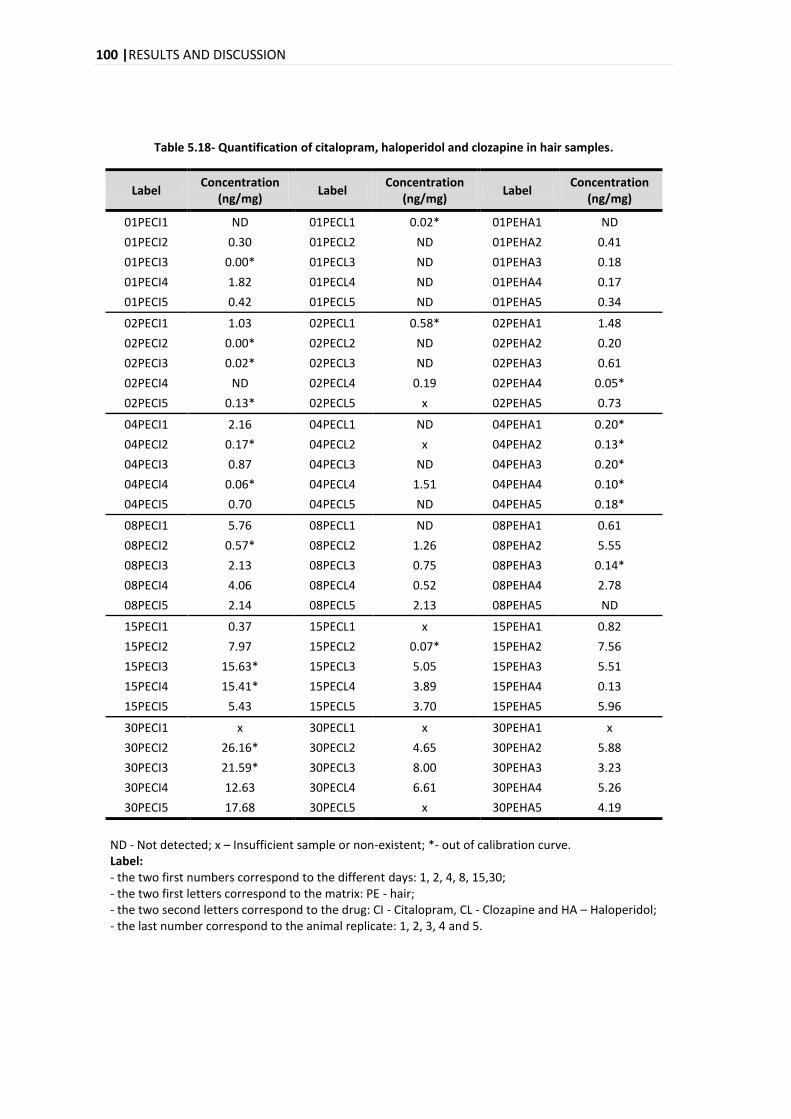
100 |RESULTS AND DISCUSSION
Table 5.18- Quantification of citalopram, haloperidol and clozapine in hair samples.
Label Concentration
(ng/mg) Label
Concentration (ng/mg)
Label Concentration
(ng/mg)
01PECI1 ND 01PECL1 0.02* 01PEHA1 ND
01PECI2 0.30 01PECL2 ND 01PEHA2 0.41
01PECI3 0.00* 01PECL3 ND 01PEHA3 0.18
01PECI4 1.82 01PECL4 ND 01PEHA4 0.17
01PECI5 0.42 01PECL5 ND 01PEHA5 0.34
02PECI1 1.03 02PECL1 0.58* 02PEHA1 1.48
02PECI2 0.00* 02PECL2 ND 02PEHA2 0.20
02PECI3 0.02* 02PECL3 ND 02PEHA3 0.61
02PECI4 ND 02PECL4 0.19 02PEHA4 0.05*
02PECI5 0.13* 02PECL5 x 02PEHA5 0.73
04PECI1 2.16 04PECL1 ND 04PEHA1 0.20*
04PECI2 0.17* 04PECL2 x 04PEHA2 0.13*
04PECI3 0.87 04PECL3 ND 04PEHA3 0.20*
04PECI4 0.06* 04PECL4 1.51 04PEHA4 0.10*
04PECI5 0.70 04PECL5 ND 04PEHA5 0.18*
08PECI1 5.76 08PECL1 ND 08PEHA1 0.61
08PECI2 0.57* 08PECL2 1.26 08PEHA2 5.55
08PECI3 2.13 08PECL3 0.75 08PEHA3 0.14*
08PECI4 4.06 08PECL4 0.52 08PEHA4 2.78
08PECI5 2.14 08PECL5 2.13 08PEHA5 ND
15PECI1 0.37 15PECL1 x 15PEHA1 0.82
15PECI2 7.97 15PECL2 0.07* 15PEHA2 7.56
15PECI3 15.63* 15PECL3 5.05 15PEHA3 5.51
15PECI4 15.41* 15PECL4 3.89 15PEHA4 0.13
15PECI5 5.43 15PECL5 3.70 15PEHA5 5.96
30PECI1 x 30PECL1 x 30PEHA1 x
30PECI2 26.16* 30PECL2 4.65 30PEHA2 5.88
30PECI3 21.59* 30PECL3 8.00 30PEHA3 3.23
30PECI4 12.63 30PECL4 6.61 30PEHA4 5.26
30PECI5 17.68 30PECL5 x 30PEHA5 4.19
ND - Not detected; x – Insufficient sample or non-existent; *- out of calibration curve. Label: - the two first numbers correspond to the different days: 1, 2, 4, 8, 15,30; - the two first letters correspond to the matrix: PE - hair; - the two second letters correspond to the drug: CI - Citalopram, CL - Clozapine and HA – Haloperidol; - the last number correspond to the animal replicate: 1, 2, 3, 4 and 5.
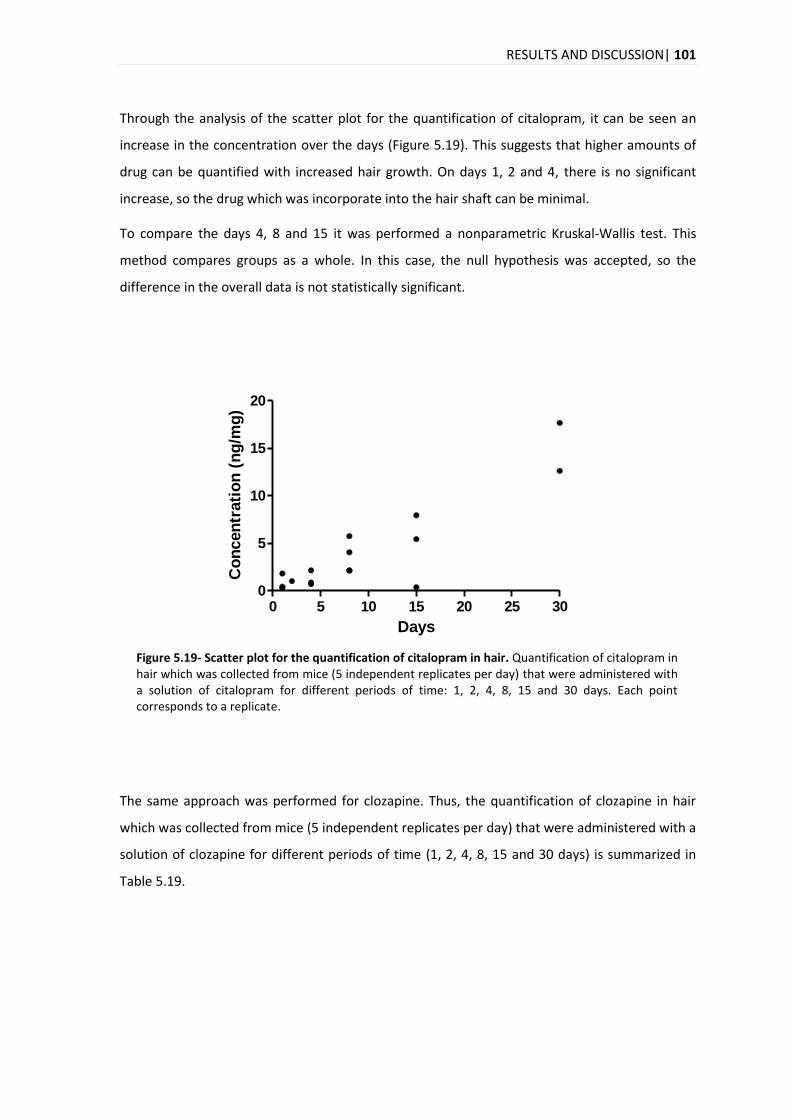
RESULTS AND DISCUSSION| 101
Through the analysis of the scatter plot for the quantification of citalopram, it can be seen an
increase in the concentration over the days (Figure 5.19). This suggests that higher amounts of
drug can be quantified with increased hair growth. On days 1, 2 and 4, there is no significant
increase, so the drug which was incorporate into the hair shaft can be minimal.
To compare the days 4, 8 and 15 it was performed a nonparametric Kruskal-Wallis test. This
method compares groups as a whole. In this case, the null hypothesis was accepted, so the
difference in the overall data is not statistically significant.
0 5 10 15 20 25 300
5
10
15
20
Days
Co
ncen
trati
on
(n
g/m
g)
Figure 5.19- Scatter plot for the quantification of citalopram in hair. Quantification of citalopram in hair which was collected from mice (5 independent replicates per day) that were administered with a solution of citalopram for different periods of time: 1, 2, 4, 8, 15 and 30 days. Each point corresponds to a replicate.
The same approach was performed for clozapine. Thus, the quantification of clozapine in hair
which was collected from mice (5 independent replicates per day) that were administered with a
solution of clozapine for different periods of time (1, 2, 4, 8, 15 and 30 days) is summarized in
Table 5.19.
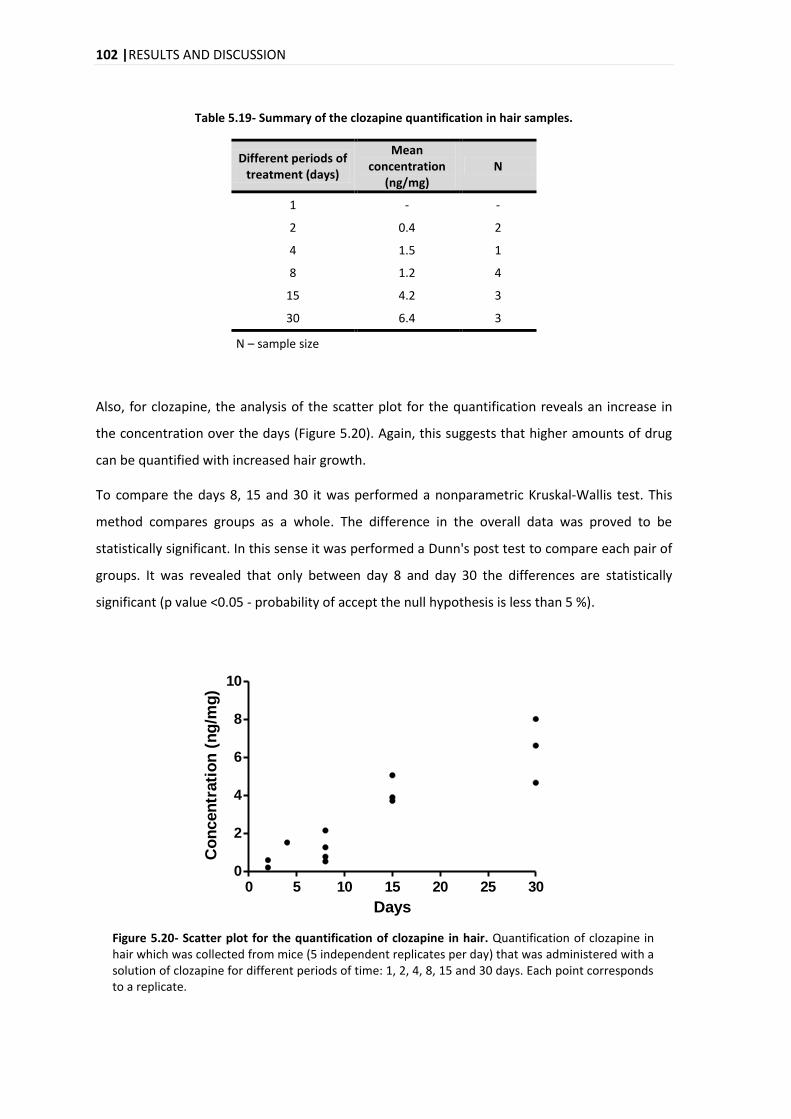
102 |RESULTS AND DISCUSSION
Table 5.19- Summary of the clozapine quantification in hair samples.
Different periods of treatment (days)
Mean concentration
(ng/mg) N
1 - -
2 0.4 2
4 1.5 1
8 1.2 4
15 4.2 3
30 6.4 3
N – sample size
Also, for clozapine, the analysis of the scatter plot for the quantification reveals an increase in
the concentration over the days (Figure 5.20). Again, this suggests that higher amounts of drug
can be quantified with increased hair growth.
To compare the days 8, 15 and 30 it was performed a nonparametric Kruskal-Wallis test. This
method compares groups as a whole. The difference in the overall data was proved to be
statistically significant. In this sense it was performed a Dunn's post test to compare each pair of
groups. It was revealed that only between day 8 and day 30 the differences are statistically
significant (p value <0.05 - probability of accept the null hypothesis is less than 5 %).
0 5 10 15 20 25 300
2
4
6
8
10
Days
Co
ncen
trati
on
(n
g/m
g)
Figure 5.20- Scatter plot for the quantification of clozapine in hair. Quantification of clozapine in hair which was collected from mice (5 independent replicates per day) that was administered with a solution of clozapine for different periods of time: 1, 2, 4, 8, 15 and 30 days. Each point corresponds to a replicate.
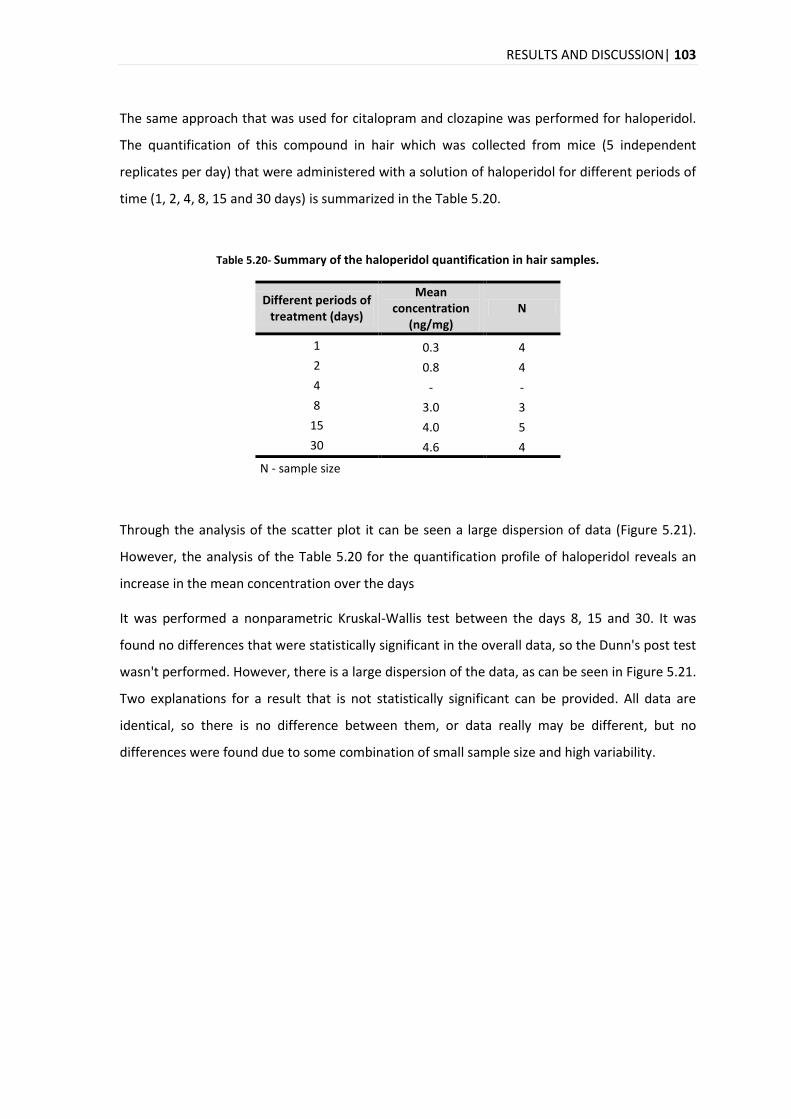
RESULTS AND DISCUSSION| 103
The same approach that was used for citalopram and clozapine was performed for haloperidol.
The quantification of this compound in hair which was collected from mice (5 independent
replicates per day) that were administered with a solution of haloperidol for different periods of
time (1, 2, 4, 8, 15 and 30 days) is summarized in the Table 5.20.
Table 5.20- Summary of the haloperidol quantification in hair samples.
Different periods of treatment (days)
Mean concentration
(ng/mg) N
1 0.3 4
2 0.8 4
4 - -
8 3.0 3
15 4.0 5
30 4.6 4
N - sample size
Through the analysis of the scatter plot it can be seen a large dispersion of data (Figure 5.21).
However, the analysis of the Table 5.20 for the quantification profile of haloperidol reveals an
increase in the mean concentration over the days
It was performed a nonparametric Kruskal-Wallis test between the days 8, 15 and 30. It was
found no differences that were statistically significant in the overall data, so the Dunn's post test
wasn't performed. However, there is a large dispersion of the data, as can be seen in Figure 5.21.
Two explanations for a result that is not statistically significant can be provided. All data are
identical, so there is no difference between them, or data really may be different, but no
differences were found due to some combination of small sample size and high variability.
104 |RESULTS AND DISCUSSION
0 5 10 15 20 25 300
2
4
6
8
Days
Co
ncen
trati
on
(n
g/m
g)
Figure 5.21- Scatter plot for the quantification of haloperidol in hair. Quantification of haloperidol in hair which was collected from mice (5 independent replicates per day) that were administered with a solution of haloperidol for different periods of time: 1, 2, 4, 8, 15 and 30 days. Each point corresponds to a replicate.
Results for the quantification of citalopram, haloperidol and clozapine in plasma samples are
presented in Table 5.22. The higher values of quantification were obtained for citalopram.
The same procedure that was used to visualize the data in hair samples was performed in
plasma samples. Again, samples used in the graphical representation were samples where
quantification of the drug was performed with reliably.
The quantification of citalopram in plasma which was collected from mice (5 independent
replicates per day) that were administered with a solution of citalopram for different periods of
time (1, 2, 4, 8, 15 and 30 days) is summarized in the Table 5.21.
Table 5.21- Summary of the citalopram quantification in plasma samples.
Different periods of treatment (days)
Mean concentration
(pg/μL) N
1 3.9 3
2 3.0 5
4 5.2 5
8 23.0 4
15 7.0 5
30 2.2 5
N - sample size
RESULTS AND DISCUSSION| 105
Table 5.22- Quantification of citalopram, haloperidol and clozapine in plasma samples.
Label Concentration
(pg/μL) Label
Concentration (pg/μL)
Label Concentration
(pg/μL)
01PLCI1 x 01PLCL1 12.2 01PLHA1 0.6*
01PLCI2 x 01PLCL2 11.6 01PLHA2 0.8
01PLCI3 3.0 01PLCL3 9.1 01PLHA3 0.4*
01PLCI4 5.0 01PLCL4 4.2 01PLHA4 x
01PLCI5 3.8 01PLCL5 x 01PLHA5 0.3*
02PLCI1 4.4 02PLCL1 x 02PLHA1 0.6*
02PLCI2 2.2 02PLCL2 x 02PLHA2 0.6*
02PLCI3 3.2 02PLCL3 11.3 02PLHA3 0.4*
02PLCI4 2.8 02PLCL4 19.7 02PLHA4 0.7
02PLCI5 2.3 02PLCL5 ND 02PLHA5 0.6*
04PLCI1 4.8 04PLCL1 x 04PLHA1 0.6*
04PLCI2 5.9 04PLCL2 1.9 04PLHA2 0.9
04PLCI3 4.9 04PLCL3 1.5 04PLHA3 1.0
04PLCI4 4.4 04PLCL4 ND 04PLHA4 1.1
04PLCI5 6.0 04PLCL5 0.9 04PLHA5 x
08PLCI1 21.0 08PLCL1 x 08PLHA1 x
08PLCI2 x 08PLCL2 2.4 08PLHA2 1.1
08PLCI3 22.4 08PLCL3 x 08PLHA3 x
08PLCI4 20.8 08PLCL4 4.9 08PLHA4 0.8
08PLCI5 28.0 08PLCL5 2.0 08PLHA5 1.0
15PLCI1 7.5 15PLCL1 x 15PLHA1 0.5*
15PLCI2 5.3 15PLCL2 ND 15PLHA2 0.5*
15PLCI3 4.8 15PLCL3 1.8 15PLHA3 0.5*
15PLCI4 6.7 15PLCL4 0.4* 15PLHA4 0.5*
15PLCI5 10.6 15PLCL5 x 15PLHA5 x
30PLCI1 1.1 30PLCL1 1.4 30PLHA1 0.9
30PLCI2 1.5 30PLCL2 1.8 30PLHA2 0.6*
30PLCI3 4.0 30PLCL3 6.0 30PLHA3 0.4*
30PLCI4 2.2 30PLCL4 1.2 30PLHA4 0.8
30PLCI5 2.1 30PLCL5 3.1 30PLHA5 0.7
ND - Not detected; x - Sample insufficient or non-existent; *- out of calibration curve. Label: - the two first numbers correspond to the different days: 1, 2, 4, 8, 15,30; - the two first letters correspond to the matrix: PL - plasma; - the two second letters correspond to the drug: CI - Citalopram, CL - Clozapine and HA – Haloperidol; - the last number correspond to the animal replicate: 1, 2, 3, 4 and 5.
106 |RESULTS AND DISCUSSION
Visualization of the scatter plot for the quantification of citalopram shows a maximum peak in
concentration on Day 8 (Figure 5.22).
In order to compare days 2, 4, 8, 15 and 30, it was performed a Kruskal-Wallis test. The
difference in the overall data was proved to be statistically significant. In this sense it was
performed a Dunn's post test to compare each pair of groups. It was revealed that were
differences statistically significant between days 2 and 8 (p value <0.05 - probability of accept
the null hypothesis is less than 5 %), days 8 and 30 (p value <0.001 - probability of accept the null
hypothesis is less than 0.1%) and days 15 and 30 (p value <0.05 - probability of accept the null
hypothesis is less than 5 %).
0 5 10 15 20 25 300
10
20
30
Days
Co
ncen
trati
on
(p
g/
L)
Figure 5.22- Scatter plot for the quantification of citalopram in plasma. Quantification of citalopram in plasma which was collected from mice (5 independent replicates per day) that were administered with a solution of citalopram for different periods of time: 1, 2, 4, 8, 15 and 30 days. Each point corresponds to a replicate.
The same approach was performed to evaluate the quantification of clozapine in plasma which
was collected from mice (5 independent replicates per day) that were administered with a
solution of clozapine for different periods of time (1, 2, 4, 8, 15 and 30 days) is summarized in
the Table 5.23.
RESULTS AND DISCUSSION| 107
Table 5.23- Summary of the clozapine quantification in plasma samples.
Different periods of treatment (days)
Mean concentration
(pg/μL) N
1 9.3 4
2 15.5 2
4 1.4 3
8 3.1 3
15 1.8 1
30 2.7 5
N – sample size
In the scatter plot for the quantification of clozapine, it can be seen that higher concentrations
are reached on day 1 and day 2 (Figure 5.23). A nonparametric Kruskal-Wallis test was
performed in order to compare days 1, 4, 8 and 30. Day 2 was not analyzed since sample sizes
were too small. It was found that there are differences statistically significant between groups as
a whole. Then, it was performed a Dunn's post test to compare each pair of groups and it was
found that only between day 1 and day 4, the difference was statistically significant (p value
<0.05 - probability of accept the null hypothesis is less than 5 %)..
0 5 10 15 20 25 300
5
10
15
20
25
Days
Co
ncen
trati
on
(p
g/
L)
Figure 5.23- Scatter plot for the quantification of clozapine in plasma. Quantification of clozapine in plasma which was collected from mice (5 independent replicates per day) that were administered with a solution of clozapine for different periods of time: 1, 2, 4, 8, 15 and 30 days. Each point corresponds to a replicate.
108 |RESULTS AND DISCUSSION
The same approach of the citalopram and clozapine was performed for haloperidol. The
quantification of haloperidol in plasma which was collected from mice (5 independent replicates
per day) that were administered with a solution of haloperidol for different periods of time (1, 2,
4, 8, 15 and 30 days) is represented in Table 5.24.
Table 5.24- Summary of the haloperidol quantification in plasma samples.
Different periods of treatment (days)
Mean concentration
(pg/μL) N
1 0.8 1
2 0.7 1
4 1.0 3
8 1.0 3
15 - -
30 0.8 2
N – sample size
In the scatter plot for the quantification of haloperidol, it can be seen that higher concentrations
are reached on day 4 and day 8. However no conclusion can be drawn since there is a large
dispersion of data and also a small sample size.
0 5 10 15 20 25 300.6
0.8
1.0
1.2
Days
Co
ncen
trati
on
(p
g/
L)
Figure 5.24- Scatter plot for the quantification of haloperidol in plasma. Quantification of haloperidol in plasma which was collected from mice (5 independent replicates per day) that were administered with a solution of haloperidol for different periods of time: 1, 2, 4, 8, 15 and 30 days. Each point corresponds to a replicate.


CONCLUSION AND FUTURE PRESPECTIVES | 111
6. CONCLUSION AND FUTURE PERSPECTIVES
In this project a method was developed for the identification and quantification of psychotropic
drugs (citalopram, clozapine and haloperidol) in plasma and hair from mice by LC-MS/MS.
The chromatographic conditions were good, with an efficient separation and a running time for
each sample of 9 min. The mass spectrometer was operated in MRM mode, allowing the
selection of the transitions to be monitored for each PD and also the internal standards used.
The application of the criteria proposed by WADA, allowed the unequivocal identification of
these transitions.
In order to obtain reliable analytical data, the method was validated by evaluation of various
analytical parameters: selectivity, limits of detection and quantification, linearity, carry over,
precision, accuracy, recovery and matrix effects.
The method proved to be selective for citalopram, haloperidol and clozapine.
This methodology was proved to be linear for all compounds over the concentration range
studied, with R2 >0.99 and the residuals values were also evaluated (Residuals < 2x|
|). The
linearity of the method was demonstrated for the intervals: 0.05 to 5 pmol/μl for haloperidol,
0.05 to 3 pmol/μl for citalopram and 0.05 to 2 pmol/μl for clozapine. However, it was observed a
heteroscedastic distribution of the residuals, so it was used a weighted linear regression, with
empirical weighting factors of 1 x2 , 1 y and 1 y2 for haloperidol, clozapine and citalopram,
respectively.
The limits of detection were 0.012, 0.014 and 0.015 pmol/μL for citalopram, clozapine and
haloperidol, respectively. These limits were good, since reduced amounts of samples were used
for the extraction (70 μl of plasma and 1.2 mg for citalopram, 2.1mg for clozapina, 0.7mg for
haloperidol of hair).
The limits of quantification obtained were: 0.037, 0.044 and 0.045 pmol/μL for citalopram,
clozapine and haloperidol, respectively.
The precision was studied by analyzing the repeatability and intermediate precision. The results
were good for the conditions of reapeatability (5.50 to 35.69 %), with high value in lowest
concentration. For intermediate precision the results were slightly higher than the criteria (13.70
112 | CONCLUSION AND FUTURE PRESPECTIVES
to 31.25 %). In future it is proposed to re-study this parameter to be able to get more precise
values. The method was proved to be accurate with values within the criteria (-2.42 to 13.51 %).
It was also evaluated the phenomenon of carry over and it was observed that citalopram,
haloperidol and clozapine do not have significant values for this parameter. Nonetheless, in the
analytical method developed, where multiple samples are analyzed, it was introduced wash
injections (blanks with ACN: 0.1%FA) in order to avoid possible contamination between samples.
The study of the recovery at different concentration levels, showed recoveries between 68.9 and
115.5% for plasma, values quite acceptable and within the limits pre-establish. The recovery for
hair showed lower values between 8.9 to 45.5%. For future it is proposed the study of different
times of incubation for the hair and also different temperatures, in order to achieve the best
recoveries for this matrix.
The matrix effects were also studied, where negatives values were obtained for plasma,
indicating ion suppression. In the matrix effects for hair were obtained positive values, indicating
enhancement of the analyte signal and also the relative ME have high values.
The developed method was applied in biological samples (plasma and hair) that were collected
from mice (5 independent replicates per day) that were submitted to a treatment with
psychotropic drugs (citalopram, clozapine and haloperidol) for different periods of time: 1, 2, 4,
8, 15 and 30 days.
The time evolution of quantification for the three compounds in hair reveals an increase in the
concentration over the days with a marked increase on day 15. This could mean that higher
amounts of drug can be quantified with increased hair growth. In the first days the amount of
drug which was quantified is very low, so the drug that actually is incorporated into the hair
shaft is also low. In these samples, the haloperidol was the compound more difficult to detect
and quantified with more disperse values. Contrary to what was expected, since the validation
results were in general very good for this compound.
In plasma the time evolution of quantification for the citalopram, clozapine and haloperidol was
different for each compound. For citalopram it can be seen a maximum peak in concentration on
Day 8. For clozapine it can be seen an increase in the concentration reached on day 1 and day 2
followed by a decrease to a steady state. And for haloperidol it can be seen that higher
concentrations are reached on day 4 and day 8. Again, less satisfactory results were obtained
with the haloperidol. Based on these data, it is suggested studies on the metabolism of this drug
to address the absorption and elimination profiles.
CONCLUSION AND FUTURE PRESPECTIVES | 113
All compounds were detected in the control samples and also for samples which were supposed
to contain only one of the compounds with the other two being present. This was observed for
plasma samples but not for the hair samples which might indicate a contamination in the plasma
collection procedure.
In the future it would be important to continue the study of clozapine with a purpose of creating
a method more appropriated, since the validation parameters for this compound were less
satisfactory.
Due to the increased use of antidepressants and antipsychotics and their involvement in
intoxications and suicide, the ability to reliably detect this class in biological specimens is very
important. The biological specimens that were used are both relevant, where plasma is
preferred in cases of therapeutic drug monitoring. And hair has become an important matrix,
since it provides evidence of longer term exposure of drugs, complementing other specimens
and also, it can be used in forensic cases, for example when there is decomposition of the body.
Thus, by the foregoing, the methodology developed proves to be of great importance in clinical
and forensic approaches.

REFERENCES | 115
7. REFERENCES
[1] Drew, N., Faydi, E., Freeman, M. et al. World Health Organization. Mental Health and Development: Targeting People with Mental Health Conditions as a Vulnerable Group, 2010. [2013 June 12]. Available: http://whqlibdoc.who.int/publications/2010/9789241563949_eng.pdf
[2] European Pact for Mental Health and Well-being. EU high-level conference Together for Mental Health and Wellbeing. Brussels, 2008.
[3] Furtado, C., Ribeirinho, M. and Gaspar, M. Observatório do Medicamento e Produtos de Saúde, Direcção de Economia do Medicamento e Produtos de Saúde - Infarmed. Análise da Evolução da Utilização de Psicofármacos em Portugal Continental entre 2000 e 2009. 2010. [2013 April]. Available: http://www.infarmed.pt/portal/page/portal/INFARMED/MONITORIZACAO_DO_MERCADO/OBSERVATORIO/INTRODUCAO_DE_FICHEIROS/Estudo_psicofarmacos.pdf
[4] Vento, A. E., Schifano, F., Corkery, J. M. et al. Suicide verdicts as opposed to accidental deaths in substance-related fatalities (UK, 2001-2007). Progress in neuro-psychopharmacology & biological psychiatry 2011, 35, 1279-83.
[5] Sampedro, M. C., Unceta, N., Gomez-Caballero, A. et al. Screening and quantification of antipsychotic drugs in human brain tissue by liquid chromatography-tandem mass spectrometry: application to postmortem diagnostics of forensic interest. Forensic Sci Int 2012, 219, 172-8.
[6] Castaing, N., Titier, K., Receveur-Daurel, M. et al. Quantification of eight new antidepressants and five of their active metabolites in whole blood by high-performance liquid chromatography-tandem mass spectrometry. J Anal Toxicol 2007, 31, 334-341.
[7] Lerner, K. L. and Lerner, B. W. World of Forensic Science: A-L. Thomson&Gale, 2006.
[8] Peters, F. T. Recent advances of liquid chromatography-(tandem) mass spectrometry in clinical and forensic toxicology. Clinical biochemistry 2011, 44, 54-65.
[9] Bulcão, R., Garcia, S. C., Limberger, R. P. et al. Designer drugs: aspectos analíticos e biológicos. Quim. Nova 2012, 35, 149-158.
[10] Saito, K., Saito, R., Kikuchi, Y. et al. Analysis of Drugs of Abuse in Biological Specimens. J Health Sci 2011, 57, 472-487.
[11] Drummer, O. H. Postmortem toxicology of drugs of abuse. Forensic Sci Int 2004, 142, 101-13.
[12] Prahlow, J. Forensic Pathology for Police, Death Investigators, Attorneys, and Forensic Scientists. Springer, 2010.
[13] Vaswani, M., Linda, F. K. and Ramesh, S. Role of selective serotonin reuptake inhibitors in psychiatric disorders: a comprehensive review. Prog Neuro-psychoph 2003, 27, 85-201.
[14] Martín-Vázquez, M.-J. Pharmacotherapy. In Psychiatric Drugs in Medical Practice. Badria, F. InTech, 2012.
[15] Roman, M., Kronstrand, R., Lindstedt, D. et al. Quantitation of seven low-dosage antipsychotic drugs in human postmortem blood using LC-MS-MS. J Anal Toxicol 2008, 32, 147-155.
[16] Saar, E., Beyer, J., Gerostamoulos, D. et al. The analysis of antipsychotic drugs in human matrices using LC-MS/MS. Drug testing and analysis 2012, 4, 376-94.
116 | REFERENCES
[17] Sanchez de la Torre, C., Martinez, M. A. and Almarza, E. Determination of several psychiatric drugs in whole blood using capillary gas-liquid chromatography with nitrogen phosphorus detection: comparison of two solid phase extraction procedures. Forensic Sci Int 2005, 155, 193-204.
[18] Baumann, P., Hiemke, C., Ulrich, S. et al. The AGNP-TDM expert group consensus guidelines: therapeutic drug monitoring in psychiatry. Pharmacopsychiatry 2004, 37, 243-65.
[19] Moreno, R. A., Moreno, D. H. and Soares, M. B. Psicofarmacologia de antidepressivos. Rev Bras Psiquiatr 1999, 21.
[20] Nash, J. and Nutt, D. Antidepressants. Psychiatry 2007, 6, 289-294.
[21] Ables, A. Z. and Baughman, O. L. Antidepressants: Update on new agents and indications. American Family Physician 2003, 67, 547-554.
[22] Ravera, S., Ramaekers, J. G., de Jong-van den Berg, L. T. et al. Are selective serotonin reuptake inhibitors safe for drivers? What is the evidence? Clinical therapeutics 2012, 34, 1070-83.
[23] Uckun, Z. and Süzen, H. S. Quantitative Determination of Citalopram and its Metabolite Desmethycitalopram in Plasma by High Performance Liquid Chromatography. FABAD J. Pharm. Sci 2009, 34, 195-201.
[24] Buschmann, H., Holenz, J., Párraga, A. et al. Antidepressants, Antipsychotics, Anxiolytics: From Chemistry and Pharmacology to Clinical Application. Wiley, 2007.
[25] Hiemke, C. and Hartter, S. Pharmacokinetics of selective serotonin reuptake inhibitors. Pharmacology & therapeutics 2000, 85, 11-28.
[26] Krzystanek, M., Krupka-Matuszczyk, I. and Klasik, A. Psychiatric Disorders – Trends and Developments. In Neurocognitive Expression of Hypofrontality in Long Term Schizophrenia. Uehara, T. InTech, 2011.
[27] Muscatello, M. R., Bruno, A., Pandolfo, G. et al. Emerging treatments in the management of schizophrenia - focus on sertindole. Drug design, development and therapy 2010, 4, 187-201.
[28] Green, A. I., Noordsy, D. L., Brunette, M. F. et al. Substance abuse and schizophrenia: pharmacotherapeutic intervention. Journal of substance abuse treatment 2008, 34, 61-71.
[29] Howard, P., Twycross, R., Shuster, J. et al. Antipsychotics. Journal of pain and symptom management 2011, 41, 956-65.
[30] Minns, A. B. and Clark, R. F. Toxicology and overdose of atypical antipsychotics. The Journal of emergency medicine 2012, 43, 906-13.
[31] Bateman, D. N. Antipsychotic drugs. Medicine 2012, 40, 105-106.
[32] Caccia, S., Pasina, L. and Nobili, A. New atypical antipsychotics for schizophrenia: iloperidone. Drug design, development and therapy 2010, 4, 33-48.
[33] Sendt, K. V., Giaroli, G. and Tracy, D. K. Beyond dopamine: glutamate as a target for future antipsychotics. ISRN pharmacology 2012, 2012, 427267.
[34] Meltzer, H. Y. and Massey, B. W. The role of serotonin receptors in the action of atypical antipsychotic drugs. Current opinion in pharmacology 2011, 11, 59-67.
[35] Mueser, K. T. and Jeste, D. V. Clinical Handbook of Schizophrenia. Guilford Press: New York, 2011.
REFERENCES | 117
[36] Jain, T., Bhandari, A., Ram, V. et al. Correlation of haloperidol levels between saliva and plasma of acutely ill schizophrenic patients. Clinical biochemistry 2011, 44, 675-80.
[37] Kudo, S. and Ishizaki, T. T. Pharmacokinetics of haloperidol: an update. Clinical pharmacokinetics 1999, 37, 435-456.
[38] Cobaugh, D. J., Erdman, A. R., Booze, L. L. et al. Atypical antipsychotic medication poisoning: an evidence-based consensus guideline for out-of-hospital management. Clin Toxicol (Phila) 2007, 45, 918-42.
[39] Meltzer, H. Y. The role of serotonin in antipsychotic drug action. Neuropharmacology 1999, 21, 106S-115S.
[40] Niederlander, H. A., Koster, E. H., Hilhorst, M. J. et al. High throughput therapeutic drug monitoring of clozapine and metabolites in serum by on-line coupling of solid phase extraction with liquid chromatography-mass spectrometry. J Chromatogr B 2006, 834, 98-107.
[41] Saukko, P. J. and Knight, B. Knight's Forensic Pathology. CRC Press, 2004.
[42] Margalho, C., Franco, J., Corte-Real, F. et al. Illicit drugs in alternative biological specimens: A case report. Journal of forensic and legal medicine 2011, 18, 132-135.
[43] Fochtman, F. W. Forensic Toxicology. In Legal Medicine: American College of Legal Medicine. Sanbar, S. S., Medicine, A. C. o. L. Mosby, 2007.
[44] Norton, L. E., Garriott, J. C. and Dimaio, V. J. M. Drug Detection at Autopsy-a Prospective-Study of 247 Cases. Journal of forensic sciences 1982, 27, 66-71.
[45] Calabuig, J. A. G. Medicina Legal y Toxicología. Salvat Editores, S.A., 1998.
[46] Bell, S. Drugs, Poisons, and Chemistry. Infobase Publishing: New York, 2009.
[47] The International Association of Forensic Toxicologist. TIAFT reference blood level list of therapeutic and toxic substances. 2004. [2013 May]. Available: http://www.gtfch.org/cms/images/stories/Updated_TIAFT_list_202005.pdf
[48] Drummer, O. H. Post-mortem toxicology. Forensic Sci Int 2007, 165, 199-203.
[49] Rozman, K. K., Doull, J. and Hayes, W.J. Dose and Time Determining, and Other Factors Influencing, Toxicity. In Hayes' Handbook of Pesticide Toxicology. Academic Press, 2010.
[50] Bernardes, S., Miyazawa, D., Silva, R. et al. Antidepressants Self-Poisoning in Suicide and Suicide Attempt: Acute Toxicity and Treatment. In Effects of Antidepressants. Lu, R. B. InTech, 2012.
[51] Abrams, R. C., Leon, A. C., Tardiff, K. et al. Suicidal overdoses of psychotropic drugs by elderly in New York City: comparison with younger adults. Psychiatry research 2011, 188, 459-61.
[52] Bronstein, A. C., Spyker, D. A., Cantilena, L. R., Jr. et al. 2011 Annual report of the American Association of Poison Control Centers' National Poison Data System (NPDS): 29th Annual Report. Clin Toxicol (Phila) 2012, 50, 911-1164.
[53] Instituto Nacional de Emergência Médica (INEM). Statistic data of intoxications. [2013 August 29]. Available: http://www.inem.pt/stats/stats.asp?stat=20&stats=23
[54] Gjerde, H., Øiestad, E. L. and Christophersen, A. S. Using biological samples in epidemiological research on drugs of abuse. Norsk Epidemiologi 2011, 21, 5-14.
[55] Skopp, G. Preanalytic aspects in postmortem toxicology. Forensic Sci Int 2004, 142, 75-100.
118 | REFERENCES
[56] Maurer, H. H. Multi-analyte procedures for screening for and quantification of drugs in blood, plasma, or serum by liquid chromatography-single stage or tandem mass spectrometry (LC-MS or LC-MS/MS) relevant to clinical and forensic toxicology. Clinical biochemistry 2005, 38, 310-8.
[57] Langman, L. J. and Kapur, B. M. Toxicology: then and now. Clinical biochemistry 2006, 39, 498-510.
[58] Gallardo, E. and Queiroz, J. A. The role of alternative specimens in toxicological analysis. Biomedical chromatography : BMC 2008, 22, 795-821.
[59] Cirimele, V., Kintz, P., Gosselin, O. et al. Clozapine dose-concentration relationships in plasma, hair and sweat specimens of schizophrenic patients. Forensic Sci Int 2000, 107, 289-300.
[60] Lendoiro, E., Quintela, O., de Castro, A. et al. Target screening and confirmation of 35 licit and illicit drugs and metabolites in hair by LC-MSMS. Forensic Sci Int 2012, 217, 207-15.
[61] Broecker, S., Herre, S. and Pragst, F. General unknown screening in hair by liquid chromatography-hybrid quadrupole time-of-flight mass spectrometry (LC-QTOF-MS). Forensic Sci Int 2012, 218, 68-81.
[62] Thieme, D. and Sachs, H. Examination of a long-term clozapine administration by high resolution segmental hair analysis. Forensic Sci Int 2007, 166, 110-4.
[63] Pragst, F. and Balikova, M. A. State of the art in hair analysis for detection of drug and alcohol abuse. Clinica chimica acta; international journal of clinical chemistry 2006, 370, 17-49.
[64] Muller, C., Vogt, S., Goerke, R. et al. Identification of selected psychopharmaceuticals and their metabolites in hair by LC/ESI-CID/MS and LC/MS/MS. Forensic Sci Int 2000, 113, 415-421.
[65] Weinmann, W., Muller, C., Vogt, S. et al. LC-MS-MS analysis of the neuroleptics clozapine, flupentixol, haloperidol, penfluridol, thioridazine, and zuclopenthixol in hair obtained from psychiatric patients. J Anal Toxicol 2002, 26, 303-307.
[66] Musshoff, F. and Madea, B. New trends in hair analysis and scientific demands on validation and technical notes. Forensic Sci Int 2007, 165, 204-15.
[67] Oiestad, E. L., Johansen, U., Oiestad, A. M. et al. Drug screening of whole blood by ultra-performance liquid chromatography-tandem mass spectrometry. J Anal Toxicol 2011, 35, 280-93.
[68] Zhang, G., Jr, A. V. and Bartlett, M. G. Bioanalytical methods for the determination of antipsychotic drugs. Biomedical chromatography : BMC 2008, 22, 671-87.
[69] Vekey, K., Telekes, A. and Vertes, A. Medical Applications of Mass Spectrometry. Elsevier Science, 2007.
[70] Couchman, L. and Morgan, P. E. LC-MS in analytical toxicology: some practical considerations. Biomedical chromatography : BMC 2011, 25, 100-23.
[71] Vogeser, M. and Kirchhoff, F. Progress in automation of LC-MS in laboratory medicine. Clinical biochemistry 2011, 44, 4-13.
[72] Unceta, N., Goicolea, M. A. and Barrio, R. J. Analytical procedures for the determination of the selective serotonin reuptake inhibitor antidepressant citalopram and its metabolites. Biomedical chromatography : BMC 2011, 25, 238-57.
[73] Chang, M. S., Ji, Q., Zhang, J. et al. Historical review of sample preparation for chromatographic bioanalysis: pros and cons. Drug Development Research 2007, 68, 107-133.
REFERENCES | 119
[74] Ma, J., Shi, J., Le, H. et al. A fully automated plasma protein precipitation sample preparation method for LC-MS/MS bioanalysis. Journal of chromatography. B, Analytical technologies in the biomedical and life sciences 2008, 862, 219-26.
[75] Kintz, P. Value of hair analysis in postmortem toxicology. Forensic Sci Int 2004, 142, 127-34.
[76] Huestis, M. A. and Smith, M. L. Modern analytical technologies for the detection of drug abuse and doping. Drug Discovery Today: Technologies 2006, 3, 49-57.
[77] Hempenius, J., Steenvoorden, R. J., Lagerwerf, F. M. et al. 'High throughput' solid-phase extraction technology and turbo ionspray LC-MS-MS applied to the determination of haloperidol in human plasma. Journal of pharmaceutical and biomedical analysis 1999, 20, 889-98.
[78] Hoffmann, E. and Stroobant, V. Mass Spectrometry: Principles and Applications. John Wiley & Sons, 2007.
[79] Ardrey, R. E. Liquid Chromatography - Mass Spectrometry: An Introduction. Wiley: England, 2003.
[80] Harvey, D. Modern Analytical Chemistry. McGraw-Hill, 1999.
[81] Ni, J. and Rowe, J. Microdosing Assessment to Evaluate Pharmacokinetics and Drug Metabolism Using Liquid Chromatography-Tandem Mass Spectrometry Technology. In Topics on Drug Metabolism. Paxton, J. InTech, 2012.
[82] Weston, A. and Brown, P. R. High Performance Liquid Chromatography & Capillary Electrophoresis: Principles and Practices. Elsevier Science, 1997.
[83] Danielson, N. D. Liquid Chromatography. In Encyclopedia of physical science and technology. Meyers, R. A. Academic Press, 2002.
[84] Dass, C. Fundamentals of Contemporary Mass Spectrometry. Wiley, 2007.
[85] Suresh, P. S., Giri, S., Husain, R. et al. A highly sensitive LC-MS/MS method for the determination of S-citalopram in rat plasma: application to a pharmacokinetic study in rats. Biomedical chromatography : BMC 2010, 24, 1052-8.
[86] Pistos, C., Panderi, I. and Atta-Politou, J. Liquid chromatography-positive ion electrospray mass spectrometry method for the quantification of citalopram in human plasma. Journal of chromatography. B, Analytical technologies in the biomedical and life sciences 2004, 810, 235-44.
[87] Singh, S. S. and Sharma, K. Validation of LC–MS electrospray ionisation method for quantitation of haloperidol in human plasma and its application to bioequivalence study. Analytica Chimica Acta 2005, 551, 159-167.
[88] Reubsaet, J. L. E. and Pedersen-Bjergaard, S. Screening for central nervous system-stimulating drugs in human plasma by liquid chromatography with mass spectrometric detection. Journal of Chromatography A 2004, 1031, 203-211.
[89] Song, M., Yu, X., Zhao, H. et al. LC-MS-MS Determination and Pharmacokinetic Study of Clozapine in Human Plasma. Chromatographia 2009, 69, 1049-1054.
[90] Jiang, T., Rong, Z., Peng, L. et al. Simultaneous determination of citalopram and its metabolite in human plasma by LC-MS/MS applied to pharmacokinetic study. Journal of chromatography. B, Analytical technologies in the biomedical and life sciences 2010, 878, 615-9.
[91] Nielsen, M. K., Johansen, S. S., Dalsgaard, P. W. et al. Simultaneous screening and quantification of 52 common pharmaceuticals and drugs of abuse in hair using UPLC-TOF-MS. Forensic Sci Int 2010, 196, 85-92.
120 | REFERENCES
[92] Busch, K. Mass Spectrometry. In Encyclopedia of physical science and technology. Academic Press, 2002.
[93] Fifield, F. W. and Kealey, D. Principles and Practice of Analytical Chemistry. John Wiley & Sons, 2000.
[94] Dawson, P. H. and Douglas, D. J. Quadrupoles, use of in Mass Spectrometry. In Encyclopedia of spectroscopy and spectrometry. Tranter, G., Holmes, J., Lindon, J. Academic Press, 1999.
[95] Boyd, R. K., Basic, C. and Bethem, R. A. Trace Quantitative Analysis by Mass Spectrometry. Wiley, 2011.
[96] Gross, J. H. Mass Spectrometry: A Textbook. Springer Verlag, 2004.
[97] Hartmann, C., Smeyers-Verbeke, J., Massart, D. L. et al. Validation of bioanalytical chromatographic methods. Journal of pharmaceutical and biomedical analysis 1998, 17, 193-218.
[98] Wille, S. M. R., Peters, F. T., Fazio, V. et al. Practical aspects concerning validation and quality control for forensic and clinical bioanalytical quantitative methods. Accreditation and Quality Assurance 2011, 16, 279-292.
[99] Eurachem. The fitness for purpose of analytical methods. 1998. [2013 July]. Available: http://www.eurachem.org/index.php/publications/guides/mv
[100] Peters, F. T., Drummer, O. H. and Musshoff, F. Validation of new methods. Forensic Sci Int 2007, 165, 216-24.
[101] Peters, F. T. and Maurer, H. H. Bioanalytical method validation and its implications for forensic and clinical toxicology - A review. Accreditation and Quality Assurance 2002, 7, 441-449.
[102] Shah, V. P., Midha, K. K., Findlay, J. W. et al. Bioanalytical method validation--a revisit with a decade of progress. Pharmaceutical research 2000, 17, 1551-7.
[103] Gustavo González, A. and Ángeles Herrador, M. A practical guide to analytical method validation, including measurement uncertainty and accuracy profiles. TrAC Trends in Analytical Chemistry 2007, 26, 227-238.
[104] Thompson, M., Ellison, S. L. and Wood, R. International Union of Pure and Applied Chemistry (IUPAC). Harmonized guidelines for single-Laboratory validation of methods of analysis (IUPAC Technical Report). 2002. [2013 May]. Available: http://mollabs.com/pdf/A.%20Guidelines%20single%20lab%20validation%20IUPAC%202002.pdf
[105] European Medicines Agency (EMA). Guideline on bioanalytical method validation. 2011. [2013 May]. Available: http://www.ema.europa.eu/docs/en_GB/document_library/Scientific_guideline/2011/08/WC500109686.pdf
[106] United States Food and Drug Administration (FDA). Guidance for industry-Bioanalytical Method Validation. 2001. [2013 May]. Available: http://www.fda.gov/downloads/Drugs/Guidances/ucm070107.pdf
[107] Bressolle, F., Bromet-Petit, M. and Audran, M. Validation of liquid chromatographic and gas chromatographic methods. Applications to pharmacokinetics. Journal of chromatography. B, Biomedical applications 1996, 686, 3-10.
[108] Shah, V. P., Midha, K. K., Dighe, S. et al. Analytical Methods Validation - Bioavailability, Bioequivalence and Pharmacokinetic Studies. Pharmaceutical research 1992, 9, 588-592.
REFERENCES | 121
[109] International Conference on Harmonisation (ICH). Validation of analytical procedures: Text and Methodology, Q2 (R1). 2005. Available: http://www.ich.org/fileadmin/Public_Web_Site/ICH_Products/Guidelines/Quality/Q2_R1/Step4/Q2_R1__Guideline.pdf
[110] World Anti-Doping Agency (WADA). Identification criteria for qualitative assays incorporating column chromatography and mass spectrometry, 2010. [2013 June]. Available: http://www.wada-ama.org/Documents/World_Anti-Doping_Program/WADP-IS-Laboratories/WADA_TD2010IDCRv1.0_Identification%20Criteria%20for%20Qualitative%20Assays_May%2008%202010_EN.doc.pdf
[111] Taverniers, I., De Loose, M. and Van Bockstaele, E. Trends in quality in the analytical laboratory. II. Analytical method validation and quality assurance. TrAC Trends in Analytical Chemistry 2004, 23, 535-552.
[112] Almeida, A. M., Castel-Branco, M. M. and Falcao, A. C. Linear regression for calibration lines revisited: weighting schemes for bioanalytical methods. Journal of chromatography. B, Analytical technologies in the biomedical and life sciences 2002, 774, 215-22.
[113] Ermer, J. and Miller, J. H. M. B. Method Validation in Pharmaceutical Analysis. Wiley, 2006.
[114] Kimanani, E. K. Bioanalytical calibration curves proposal for statistical criteria. Journal of pharmaceutical and biomedical analysis 1998, 16, 1117-1124.
[115] Ribeiro, F., Ferreira, M., Morano, S. et al. Planilha de validação: uma nova ferramenta para estimar figuras de mérito na validação de métodos analíticos univariados. Quim. Nova. 2008, 31, 164-171.
[116] Van Loco, J., Elskens, M., Croux, C. et al. Linearity of calibration curves: use and misuse of the correlation coefficient. Accreditation and Quality Assurance 2002, 7, 281-285.
[117] Brüggemann, L., Quapp, W. and Wennrich, R. Test for non-linearity concerning linear calibrated chemical measurements. Accreditation and Quality Assurance 2006, 11, 625-631.
[118] Associação de Laboratórios Acreditados de Portugal (Relacre). Validação de métodos internos de ensaio em análise química. 2000. [2013 July]. Available: http://www.relacre.pt/assets/relacreassets/files/commissionsandpublications/Guia%20RELACRE%2013.pdf
[119] Araujo, P. Key aspects of analytical method validation and linearity evaluation. Journal of chromatography. B, Analytical technologies in the biomedical and life sciences 2009, 877, 2224-34.
[120] Causon, R. Validation of chromatographic methods in biomedical analysis. Journal of Chromatography B. 1997, 175-180.
[121] Funk, W., Dammann, V., Donnevert, G. et al. Quality Assurance in Analytical Chemistry: Applications in Environmental, Food and Materials Analysis, Biotechnology, and Medical Engineering. Wiley, 2007.
[122] Miller, J. N. and Miller, J. C. Statistics and Chemometrics for Analytical Chemistry. Pearson&Prentice Hall, 2005.
[123] Mansilha, C., Melo, A., Rebelo, H. et al. Quantification of endocrine disruptors and pesticides in water by gas chromatography-tandem mass spectrometry. Method validation using weighted linear regression schemes. Journal of chromatography. A 2010, 1217, 6681-91.
122 | REFERENCES
[124] International Union of Pure and Applied chemistry (IUPAC). Guidelines for calibration in analytical chemistry, 1999. [2013 May]. Available: http://w3.uniroma1.it/chemo/ftp/7004x0993.pdf
[125] Rozet, E., Marini, R. D., Ziemons, E. et al. Advances in validation, risk and uncertainty assessment of bioanalytical methods. Journal of pharmaceutical and biomedical analysis 2011, 55, 848-58.
[126] International Conference on Harmonisation (ICH). Validation of Analytical Methods: Definitions and Terminology, Q2 A. 1995. Available: http://www.pharma.gally.ch/ich/q2a038195en.pdf
[127] Maroto, A., Boqué, R., Riu, J. et al. Estimation of measurement uncertainty by using regression techniques and spiked samples. Analytica Chimica Acta 2001, 446, 133–145.
[128] Maroto, A., Boqué, R., Riu, J. et al. Estimating uncertainties of analytical results using information from the validation process. Analytica Chimica Acta 1999, 391, 173-185.
[129] Cassiano, M. N., Barreiro, J. C., Martins, L. R. et al. Validação em métodos cromatográficos para análises de pequenas moléculas em matrizes biológicas. Quim. Nova 2009, 32, 1021-1030.
[130] Peters, F. T. and Maurer, H. H. Review Bioanalytical method validation – How, how much and why.
[131] Chambers, E., Wagrowski-Diehl, D. M., Lu, Z. et al. Systematic and comprehensive strategy for reducing matrix effects in LC/MS/MS analyses. Journal of chromatography. B, Analytical technologies in the biomedical and life sciences 2007, 852, 22-34.
[132] Matuszewski, B. K., Constanzer, M. L. and Chavez-Eng, C. M. Strategies for the Assessment of Matrix Effect in Quantitative Bioanalytical Methods Based on HPLC-MS/MS. Anal. Chem. 2003, 75, 3019-3030.
[133] Taylor, P. J. Matrix effects: the Achilles heel of quantitative high-performance liquid chromatography-electrospray-tandem mass spectrometry. Clinical biochemistry 2005, 38, 328-34.
[134] Guo, S., Zhong, S. and Zhang, A. Privacy-preserving Kruskal-Wallis test. Computer methods and programs in biomedicine 2013.
[135] Elliott, A. C. and Hynan, L. S. A SAS macro implementation of a multiple comparison post hoc test for a Kruskal-Wallis analysis. Computer methods and programs in biomedicine 2011, 102, 75-80.
[136] Y., C. and R.P., W. Learning and Understanding the Kruskal-Wallis One-Way Analysis-of- Variance-by-Ranks Test for Differences Among Three or More Independent Groups. Phys Ther. 1997, 77, 1755-1762.
[137] O., S. and Minitab, I. Kruskal-Wallis Multiple Comparisons with a MINITAB Macro. [2013 August]. Available: http://www.minitab.com/en-US/support/macros/default.aspx?action=doc&id=27
[138] Rafter, J. A., Abell, M. L. and Braselton, J. P. Multiple Comparison Methods for Means. Siam Review 2002, 44, 259-278.
[139] Cabral, H. J. Multiple comparisons procedures. Circulation 2008, 117, 698-701.
[140] Niessen, W. M. Fragmentation of toxicologically relevant drugs in positive-ion liquid chromatography-tandem mass spectrometry. Mass spectrometry reviews 2011, 30, 626-63.
REFERENCES | 123
[141] Tang, Y. L., Mao, P., Li, F. M. et al. Gender, age, smoking behaviour and plasma clozapine concentrations in 193 Chinese inpatients with schizophrenia. British journal of clinical pharmacology 2007, 64, 49-56.
[142] Valcárcel, M., Gómez-Hens, A. and Rubio, S. Selectivity in analytical chemistry revisited. Trends in analytical chemistry 2001, 20.
[143] Dadgar, D., Burnett, P. E., Choc, M. G. et al. Application Issues in Bioanalytical Method Validation, Sample Analysis and Data Reporting. Journal of pharmaceutical and biomedical analysis 1995, 13, 89-97.
[144] International Conference on Harmonisation (ICH). Validation of Analytical Methods, Q2B, 1995. Available: http://www.ipm-biotech.de/fileadmin/user_upload/pdf/guidelines/12_ICH_Q2B.pdf
[145] Ribani, M., Bottoli, C., Collins, C. et al. Validação em métodos cromatográficos e eletroforéticos. Quim. Nova 2004, 27, 771-780.
[146] Zeng, W., Musson, D. G., Fisher, A. L. et al. A new approach for evaluating carryover and its influence on quantitation in high-performance liquid chromatography and tandem mass spectrometry assay. Rapid Commun. Mass Spectrom. 2006, 20, 635-40.
[147] Clouser-Roche, A., Johnson, K., Fast, D. et al. Beyond pass/fail: A procedure for evaluating the effect of carryover in bioanalytical LC/MS/MS methods. Journal of pharmaceutical and biomedical analysis 2008, 47, 146-155.
[148] Hughes, N. C., Wong, E. Y., Fan, J. et al. Determination of carryover and contamination for mass spectrometry-based chromatographic assays. The AAPS journal 2007, 9, E353-60.
[149] Caban, M., Migowska, N., Stepnowski, P. et al. Matrix effects and recovery calculations in analyses of pharmaceuticals based on the determination of beta-blockers and beta-agonists in environmental samples. Journal of chromatography. A 2012, 1258, 117-27.
[150] Van Eeckhaut, A., Lanckmans, K., Sarre, S. et al. Validation of bioanalytical LC-MS/MS assays: evaluation of matrix effects. Journal of chromatography. B, Analytical technologies in the biomedical and life sciences 2009, 877, 2198-207.

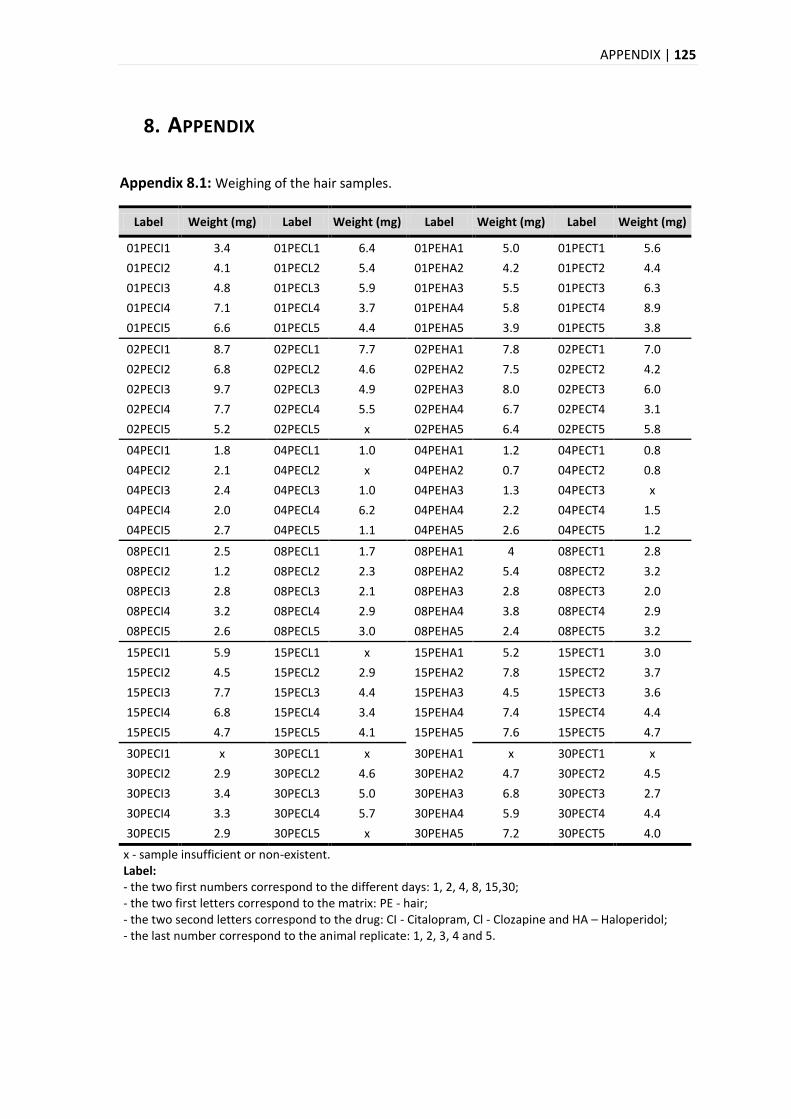
APPENDIX | 125
8. APPENDIX
Appendix 8.1: Weighing of the hair samples.
Label Weight (mg) Label Weight (mg) Label Weight (mg) Label Weight (mg)
01PECI1 3.4 01PECL1 6.4 01PEHA1 5.0 01PECT1 5.6
01PECI2 4.1 01PECL2 5.4 01PEHA2 4.2 01PECT2 4.4
01PECI3 4.8 01PECL3 5.9 01PEHA3 5.5 01PECT3 6.3
01PECI4 7.1 01PECL4 3.7 01PEHA4 5.8 01PECT4 8.9
01PECI5 6.6 01PECL5 4.4 01PEHA5 3.9 01PECT5 3.8
02PECI1 8.7 02PECL1 7.7 02PEHA1 7.8 02PECT1 7.0
02PECI2 6.8 02PECL2 4.6 02PEHA2 7.5 02PECT2 4.2
02PECI3 9.7 02PECL3 4.9 02PEHA3 8.0 02PECT3 6.0
02PECI4 7.7 02PECL4 5.5 02PEHA4 6.7 02PECT4 3.1
02PECI5 5.2 02PECL5 x 02PEHA5 6.4 02PECT5 5.8
04PECI1 1.8 04PECL1 1.0 04PEHA1 1.2 04PECT1 0.8
04PECI2 2.1 04PECL2 x 04PEHA2 0.7 04PECT2 0.8
04PECI3 2.4 04PECL3 1.0 04PEHA3 1.3 04PECT3 x
04PECI4 2.0 04PECL4 6.2 04PEHA4 2.2 04PECT4 1.5
04PECI5 2.7 04PECL5 1.1 04PEHA5 2.6 04PECT5 1.2
08PECI1 2.5 08PECL1 1.7 08PEHA1 4 08PECT1 2.8
08PECI2 1.2 08PECL2 2.3 08PEHA2 5.4 08PECT2 3.2
08PECI3 2.8 08PECL3 2.1 08PEHA3 2.8 08PECT3 2.0
08PECI4 3.2 08PECL4 2.9 08PEHA4 3.8 08PECT4 2.9
08PECI5 2.6 08PECL5 3.0 08PEHA5 2.4 08PECT5 3.2
15PECI1 5.9 15PECL1 x 15PEHA1 5.2 15PECT1 3.0
15PECI2 4.5 15PECL2 2.9 15PEHA2 7.8 15PECT2 3.7
15PECI3 7.7 15PECL3 4.4 15PEHA3 4.5 15PECT3 3.6
15PECI4 6.8 15PECL4 3.4 15PEHA4 7.4 15PECT4 4.4
15PECI5 4.7 15PECL5 4.1 15PEHA5 7.6 15PECT5 4.7
30PECI1 x 30PECL1 x 30PEHA1 x 30PECT1 x
30PECI2 2.9 30PECL2 4.6 30PEHA2 4.7 30PECT2 4.5
30PECI3 3.4 30PECL3 5.0 30PEHA3 6.8 30PECT3 2.7
30PECI4 3.3 30PECL4 5.7 30PEHA4 5.9 30PECT4 4.4
30PECI5 2.9 30PECL5 x 30PEHA5 7.2 30PECT5 4.0
x - sample insufficient or non-existent. Label: - the two first numbers correspond to the different days: 1, 2, 4, 8, 15,30; - the two first letters correspond to the matrix: PE - hair; - the two second letters correspond to the drug: CI - Citalopram, Cl - Clozapine and HA – Haloperidol; - the last number correspond to the animal replicate: 1, 2, 3, 4 and 5.
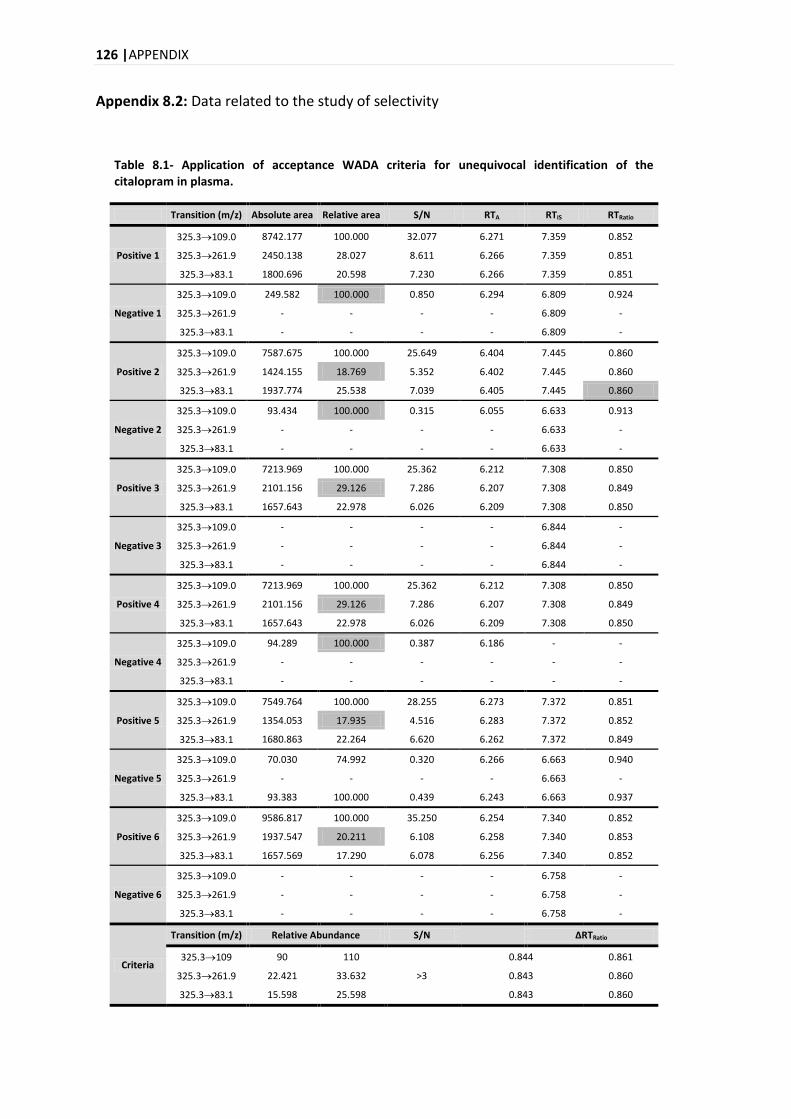
126 |APPENDIX
Appendix 8.2: Data related to the study of selectivity
Table 8.1- Application of acceptance WADA criteria for unequivocal identification of the citalopram in plasma.
Transition (m/z) Absolute area Relative area S/N RTA RTIS RTRatio
Positive 1
325.3109.0 8742.177 100.000 32.077 6.271 7.359 0.852
325.3261.9 2450.138 28.027 8.611 6.266 7.359 0.851
325.383.1 1800.696 20.598 7.230 6.266 7.359 0.851
Negative 1
325.3109.0 249.582 100.000 0.850 6.294 6.809 0.924
325.3261.9 - - - - 6.809 -
325.383.1 - - - - 6.809 -
Positive 2
325.3109.0 7587.675 100.000 25.649 6.404 7.445 0.860
325.3261.9 1424.155 18.769 5.352 6.402 7.445 0.860
325.383.1 1937.774 25.538 7.039 6.405 7.445 0.860
Negative 2
325.3109.0 93.434 100.000 0.315 6.055 6.633 0.913
325.3261.9 - - - - 6.633 -
325.383.1 - - - - 6.633 -
Positive 3
325.3109.0 7213.969 100.000 25.362 6.212 7.308 0.850
325.3261.9 2101.156 29.126 7.286 6.207 7.308 0.849
325.383.1 1657.643 22.978 6.026 6.209 7.308 0.850
Negative 3
325.3109.0 - - - - 6.844 -
325.3261.9 - - - - 6.844 -
325.383.1 - - - - 6.844 -
Positive 4
325.3109.0 7213.969 100.000 25.362 6.212 7.308 0.850
325.3261.9 2101.156 29.126 7.286 6.207 7.308 0.849
325.383.1 1657.643 22.978 6.026 6.209 7.308 0.850
Negative 4
325.3109.0 94.289 100.000 0.387 6.186 - -
325.3261.9 - - - - - -
325.383.1 - - - - - -
Positive 5
325.3109.0 7549.764 100.000 28.255 6.273 7.372 0.851
325.3261.9 1354.053 17.935 4.516 6.283 7.372 0.852
325.383.1 1680.863 22.264 6.620 6.262 7.372 0.849
Negative 5
325.3109.0 70.030 74.992 0.320 6.266 6.663 0.940
325.3261.9 - - - - 6.663 -
325.383.1 93.383 100.000 0.439 6.243 6.663 0.937
Positive 6
325.3109.0 9586.817 100.000 35.250 6.254 7.340 0.852
325.3261.9 1937.547 20.211 6.108 6.258 7.340 0.853
325.383.1 1657.569 17.290 6.078 6.256 7.340 0.852
Negative 6
325.3109.0 - - - - 6.758 -
325.3261.9 - - - - 6.758 -
325.383.1 - - - - 6.758 -
Criteria
Transition (m/z) Relative Abundance S/N
ΔRTRatio
325.3109 90 110
>3
0.844 0.861
325.3261.9 22.421 33.632 0.843 0.860
325.383.1 15.598 25.598 0.843 0.860
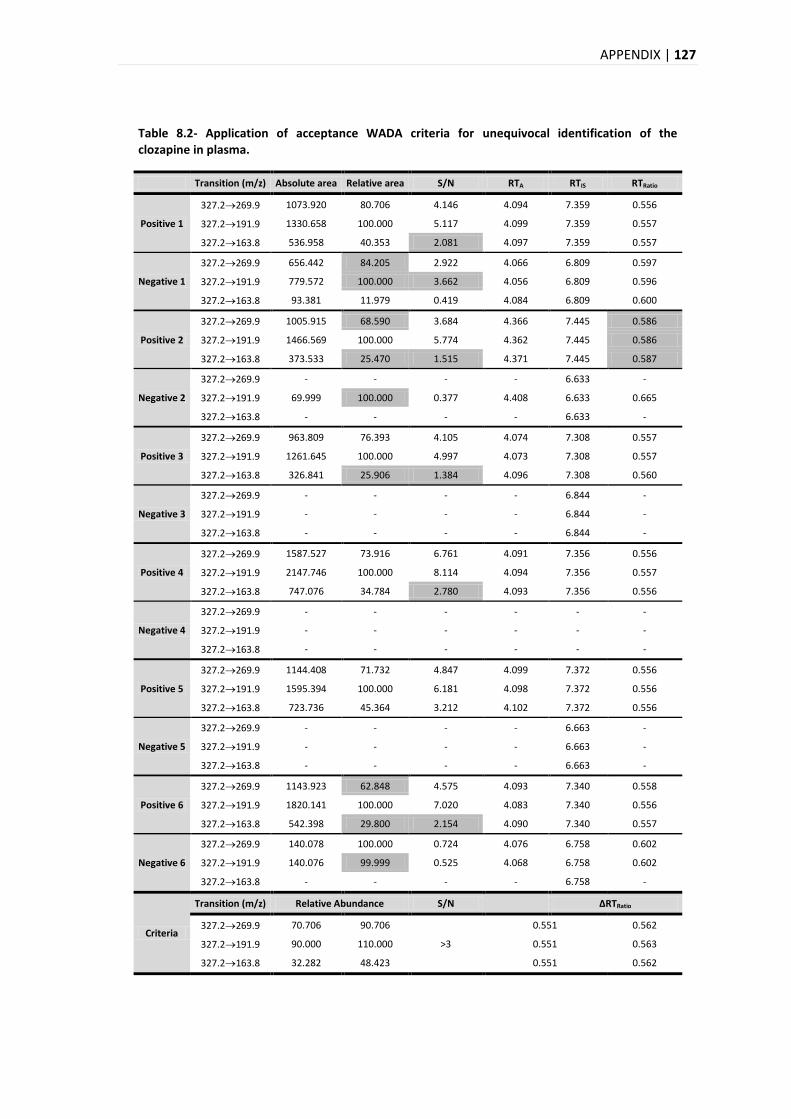
APPENDIX | 127
Table 8.2- Application of acceptance WADA criteria for unequivocal identification of the clozapine in plasma.
Transition (m/z) Absolute area Relative area S/N RTA RTIS RTRatio
Positive 1
327.2269.9 1073.920 80.706 4.146 4.094 7.359 0.556
327.2191.9 1330.658 100.000 5.117 4.099 7.359 0.557
327.2163.8 536.958 40.353 2.081 4.097 7.359 0.557
Negative 1
327.2269.9 656.442 84.205 2.922 4.066 6.809 0.597
327.2191.9 779.572 100.000 3.662 4.056 6.809 0.596
327.2163.8 93.381 11.979 0.419 4.084 6.809 0.600
Positive 2
327.2269.9 1005.915 68.590 3.684 4.366 7.445 0.586
327.2191.9 1466.569 100.000 5.774 4.362 7.445 0.586
327.2163.8 373.533 25.470 1.515 4.371 7.445 0.587
Negative 2
327.2269.9 - - - - 6.633 -
327.2191.9 69.999 100.000 0.377 4.408 6.633 0.665
327.2163.8 - - - - 6.633 -
Positive 3
327.2269.9 963.809 76.393 4.105 4.074 7.308 0.557
327.2191.9 1261.645 100.000 4.997 4.073 7.308 0.557
327.2163.8 326.841 25.906 1.384 4.096 7.308 0.560
Negative 3
327.2269.9 - - - - 6.844 -
327.2191.9 - - - - 6.844 -
327.2163.8 - - - - 6.844 -
Positive 4
327.2269.9 1587.527 73.916 6.761 4.091 7.356 0.556
327.2191.9 2147.746 100.000 8.114 4.094 7.356 0.557
327.2163.8 747.076 34.784 2.780 4.093 7.356 0.556
Negative 4
327.2269.9 - - - - - -
327.2191.9 - - - - - -
327.2163.8 - - - - - -
Positive 5
327.2269.9 1144.408 71.732 4.847 4.099 7.372 0.556
327.2191.9 1595.394 100.000 6.181 4.098 7.372 0.556
327.2163.8 723.736 45.364 3.212 4.102 7.372 0.556
Negative 5
327.2269.9 - - - - 6.663 -
327.2191.9 - - - - 6.663 -
327.2163.8 - - - - 6.663 -
Positive 6
327.2269.9 1143.923 62.848 4.575 4.093 7.340 0.558
327.2191.9 1820.141 100.000 7.020 4.083 7.340 0.556
327.2163.8 542.398 29.800 2.154 4.090 7.340 0.557
Negative 6
327.2269.9 140.078 100.000 0.724 4.076 6.758 0.602
327.2191.9 140.076 99.999 0.525 4.068 6.758 0.602
327.2163.8 - - - - 6.758 -
Criteria
Transition (m/z) Relative Abundance S/N
ΔRTRatio
327.2269.9 70.706 90.706
>3
0.551 0.562
327.2191.9 90.000 110.000 0.551 0.563
327.2163.8 32.282 48.423 0.551 0.562
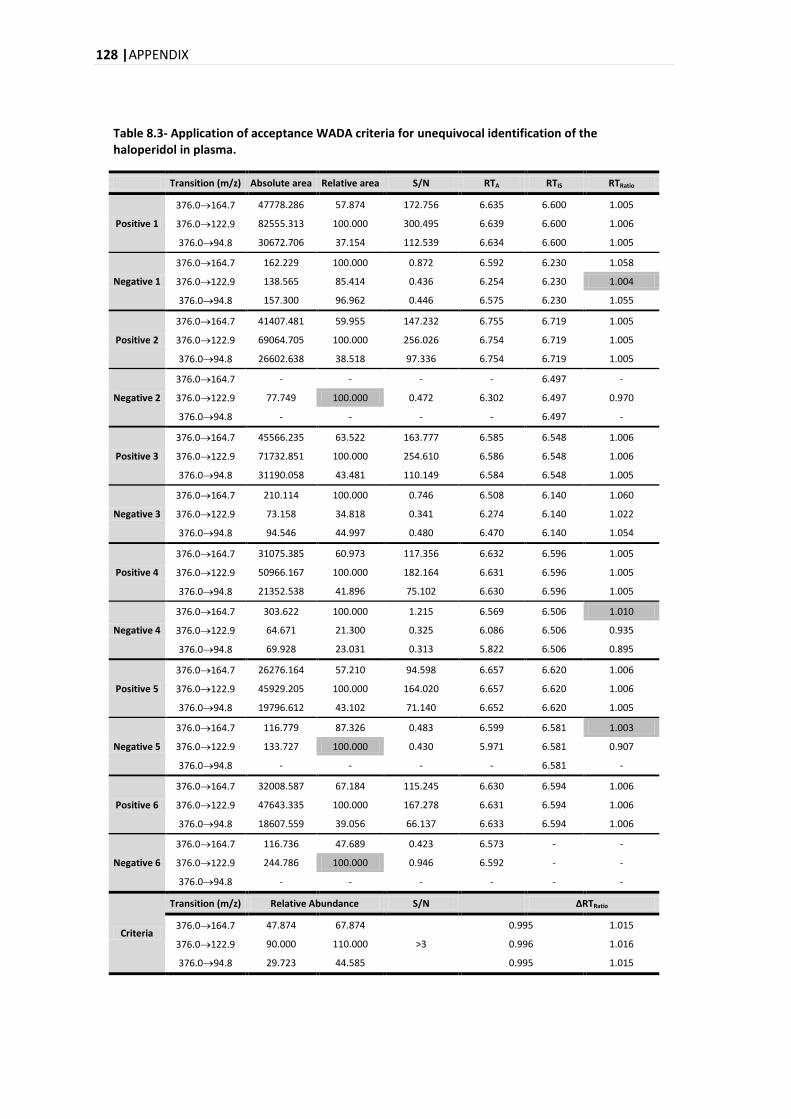
128 |APPENDIX
Table 8.3- Application of acceptance WADA criteria for unequivocal identification of the haloperidol in plasma.
Transition (m/z) Absolute area Relative area S/N RTA RTIS RTRatio
Positive 1
376.0164.7 47778.286 57.874 172.756 6.635 6.600 1.005
376.0122.9 82555.313 100.000 300.495 6.639 6.600 1.006
376.094.8 30672.706 37.154 112.539 6.634 6.600 1.005
Negative 1
376.0164.7 162.229 100.000 0.872 6.592 6.230 1.058
376.0122.9 138.565 85.414 0.436 6.254 6.230 1.004
376.094.8 157.300 96.962 0.446 6.575 6.230 1.055
Positive 2
376.0164.7 41407.481 59.955 147.232 6.755 6.719 1.005
376.0122.9 69064.705 100.000 256.026 6.754 6.719 1.005
376.094.8 26602.638 38.518 97.336 6.754 6.719 1.005
Negative 2
376.0164.7 - - - - 6.497 -
376.0122.9 77.749 100.000 0.472 6.302 6.497 0.970
376.094.8 - - - - 6.497 -
Positive 3
376.0164.7 45566.235 63.522 163.777 6.585 6.548 1.006
376.0122.9 71732.851 100.000 254.610 6.586 6.548 1.006
376.094.8 31190.058 43.481 110.149 6.584 6.548 1.005
Negative 3
376.0164.7 210.114 100.000 0.746 6.508 6.140 1.060
376.0122.9 73.158 34.818 0.341 6.274 6.140 1.022
376.094.8 94.546 44.997 0.480 6.470 6.140 1.054
Positive 4
376.0164.7 31075.385 60.973 117.356 6.632 6.596 1.005
376.0122.9 50966.167 100.000 182.164 6.631 6.596 1.005
376.094.8 21352.538 41.896 75.102 6.630 6.596 1.005
Negative 4
376.0164.7 303.622 100.000 1.215 6.569 6.506 1.010
376.0122.9 64.671 21.300 0.325 6.086 6.506 0.935
376.094.8 69.928 23.031 0.313 5.822 6.506 0.895
Positive 5
376.0164.7 26276.164 57.210 94.598 6.657 6.620 1.006
376.0122.9 45929.205 100.000 164.020 6.657 6.620 1.006
376.094.8 19796.612 43.102 71.140 6.652 6.620 1.005
Negative 5
376.0164.7 116.779 87.326 0.483 6.599 6.581 1.003
376.0122.9 133.727 100.000 0.430 5.971 6.581 0.907
376.094.8 - - - - 6.581 -
Positive 6
376.0164.7 32008.587 67.184 115.245 6.630 6.594 1.006
376.0122.9 47643.335 100.000 167.278 6.631 6.594 1.006
376.094.8 18607.559 39.056 66.137 6.633 6.594 1.006
Negative 6
376.0164.7 116.736 47.689 0.423 6.573 - -
376.0122.9 244.786 100.000 0.946 6.592 - -
376.094.8 - - - - - -
Criteria
Transition (m/z) Relative Abundance S/N
ΔRTRatio
376.0164.7 47.874 67.874
>3
0.995 1.015
376.0122.9 90.000 110.000 0.996 1.016
376.094.8 29.723 44.585 0.995 1.015
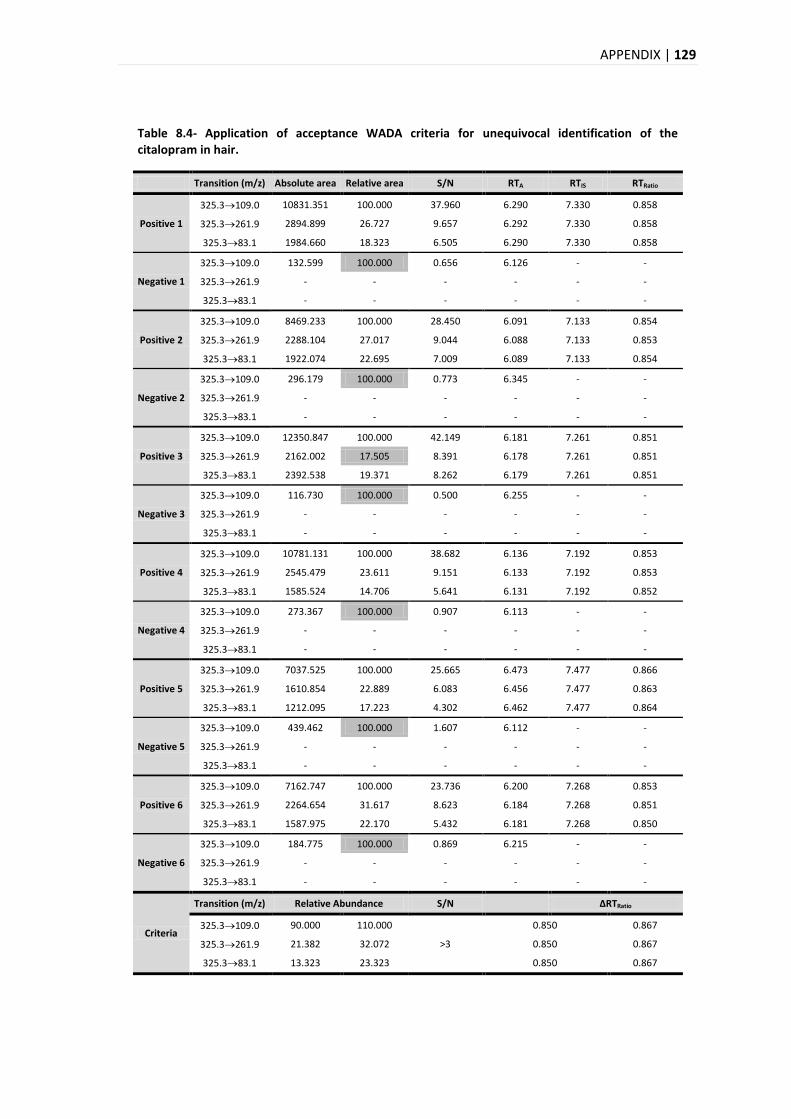
APPENDIX | 129
Table 8.4- Application of acceptance WADA criteria for unequivocal identification of the citalopram in hair.
Transition (m/z) Absolute area Relative area S/N RTA RTIS RTRatio
Positive 1
325.3109.0 10831.351 100.000 37.960 6.290 7.330 0.858
325.3261.9 2894.899 26.727 9.657 6.292 7.330 0.858
325.383.1 1984.660 18.323 6.505 6.290 7.330 0.858
Negative 1
325.3109.0 132.599 100.000 0.656 6.126 - -
325.3261.9 - - - - - -
325.383.1 - - - - - -
Positive 2
325.3109.0 8469.233 100.000 28.450 6.091 7.133 0.854
325.3261.9 2288.104 27.017 9.044 6.088 7.133 0.853
325.383.1 1922.074 22.695 7.009 6.089 7.133 0.854
Negative 2
325.3109.0 296.179 100.000 0.773 6.345 - -
325.3261.9 - - - - - -
325.383.1 - - - - - -
Positive 3
325.3109.0 12350.847 100.000 42.149 6.181 7.261 0.851
325.3261.9 2162.002 17.505 8.391 6.178 7.261 0.851
325.383.1 2392.538 19.371 8.262 6.179 7.261 0.851
Negative 3
325.3109.0 116.730 100.000 0.500 6.255 - -
325.3261.9 - - - - - -
325.383.1 - - - - - -
Positive 4
325.3109.0 10781.131 100.000 38.682 6.136 7.192 0.853
325.3261.9 2545.479 23.611 9.151 6.133 7.192 0.853
325.383.1 1585.524 14.706 5.641 6.131 7.192 0.852
Negative 4
325.3109.0 273.367 100.000 0.907 6.113 - -
325.3261.9 - - - - - -
325.383.1 - - - - - -
Positive 5
325.3109.0 7037.525 100.000 25.665 6.473 7.477 0.866
325.3261.9 1610.854 22.889 6.083 6.456 7.477 0.863
325.383.1 1212.095 17.223 4.302 6.462 7.477 0.864
Negative 5
325.3109.0 439.462 100.000 1.607 6.112 - -
325.3261.9 - - - - - -
325.383.1 - - - - - -
Positive 6
325.3109.0 7162.747 100.000 23.736 6.200 7.268 0.853
325.3261.9 2264.654 31.617 8.623 6.184 7.268 0.851
325.383.1 1587.975 22.170 5.432 6.181 7.268 0.850
Negative 6
325.3109.0 184.775 100.000 0.869 6.215 - -
325.3261.9 - - - - - -
325.383.1 - - - - - -
Criteria
Transition (m/z) Relative Abundance S/N
ΔRTRatio
325.3109.0 90.000 110.000
>3
0.850 0.867
325.3261.9 21.382 32.072 0.850 0.867
325.383.1 13.323 23.323 0.850 0.867
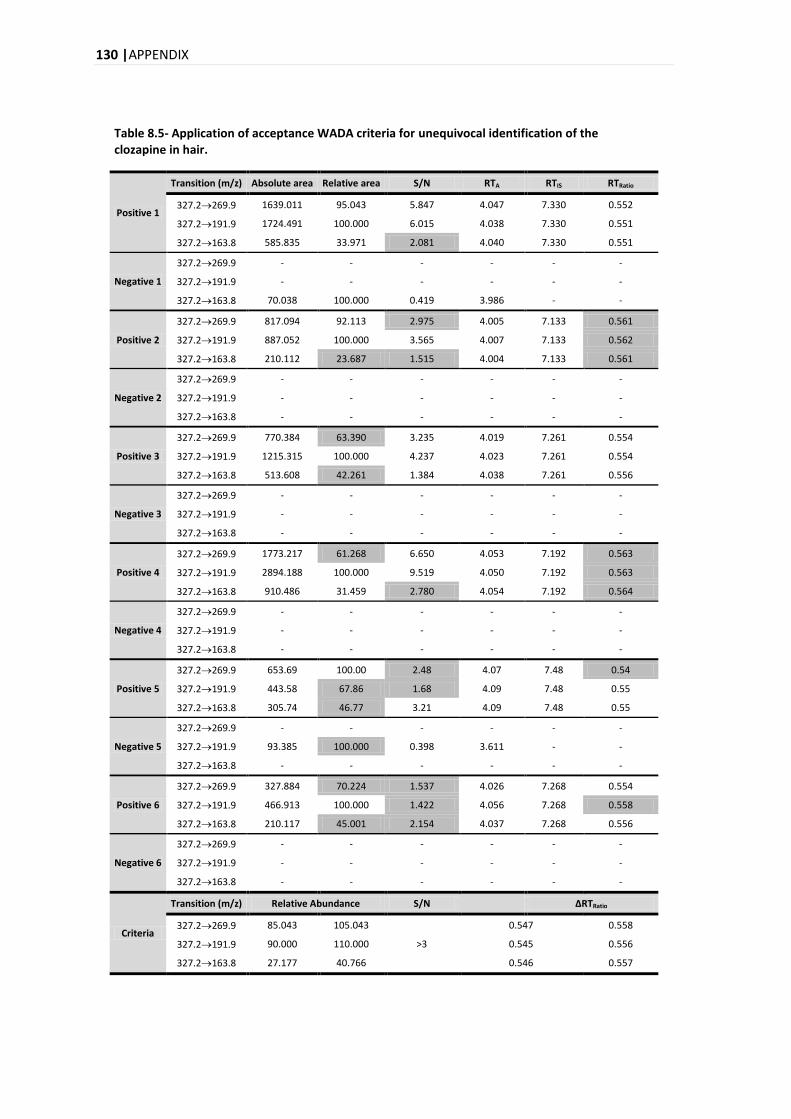
130 |APPENDIX
Table 8.5- Application of acceptance WADA criteria for unequivocal identification of the clozapine in hair.
Positive 1
Transition (m/z) Absolute area Relative area S/N RTA RTIS RTRatio
327.2269.9 1639.011 95.043 5.847 4.047 7.330 0.552
327.2191.9 1724.491 100.000 6.015 4.038 7.330 0.551
327.2163.8 585.835 33.971 2.081 4.040 7.330 0.551
Negative 1
327.2269.9 - - - - - -
327.2191.9 - - - - - -
327.2163.8 70.038 100.000 0.419 3.986 - -
Positive 2
327.2269.9 817.094 92.113 2.975 4.005 7.133 0.561
327.2191.9 887.052 100.000 3.565 4.007 7.133 0.562
327.2163.8 210.112 23.687 1.515 4.004 7.133 0.561
Negative 2
327.2269.9 - - - - - -
327.2191.9 - - - - - -
327.2163.8 - - - - - -
Positive 3
327.2269.9 770.384 63.390 3.235 4.019 7.261 0.554
327.2191.9 1215.315 100.000 4.237 4.023 7.261 0.554
327.2163.8 513.608 42.261 1.384 4.038 7.261 0.556
Negative 3
327.2269.9 - - - - - -
327.2191.9 - - - - - -
327.2163.8 - - - - - -
Positive 4
327.2269.9 1773.217 61.268 6.650 4.053 7.192 0.563
327.2191.9 2894.188 100.000 9.519 4.050 7.192 0.563
327.2163.8 910.486 31.459 2.780 4.054 7.192 0.564
Negative 4
327.2269.9 - - - - - -
327.2191.9 - - - - - -
327.2163.8 - - - - - -
Positive 5
327.2269.9 653.69 100.00 2.48 4.07 7.48 0.54
327.2191.9 443.58 67.86 1.68 4.09 7.48 0.55
327.2163.8 305.74 46.77 3.21 4.09 7.48 0.55
Negative 5
327.2269.9 - - - - - -
327.2191.9 93.385 100.000 0.398 3.611 - -
327.2163.8 - - - - - -
Positive 6
327.2269.9 327.884 70.224 1.537 4.026 7.268 0.554
327.2191.9 466.913 100.000 1.422 4.056 7.268 0.558
327.2163.8 210.117 45.001 2.154 4.037 7.268 0.556
Negative 6
327.2269.9 - - - - - -
327.2191.9 - - - - - -
327.2163.8 - - - - - -
Criteria
Transition (m/z) Relative Abundance S/N
ΔRTRatio
327.2269.9 85.043 105.043
>3
0.547 0.558
327.2191.9 90.000 110.000 0.545 0.556
327.2163.8 27.177 40.766 0.546 0.557
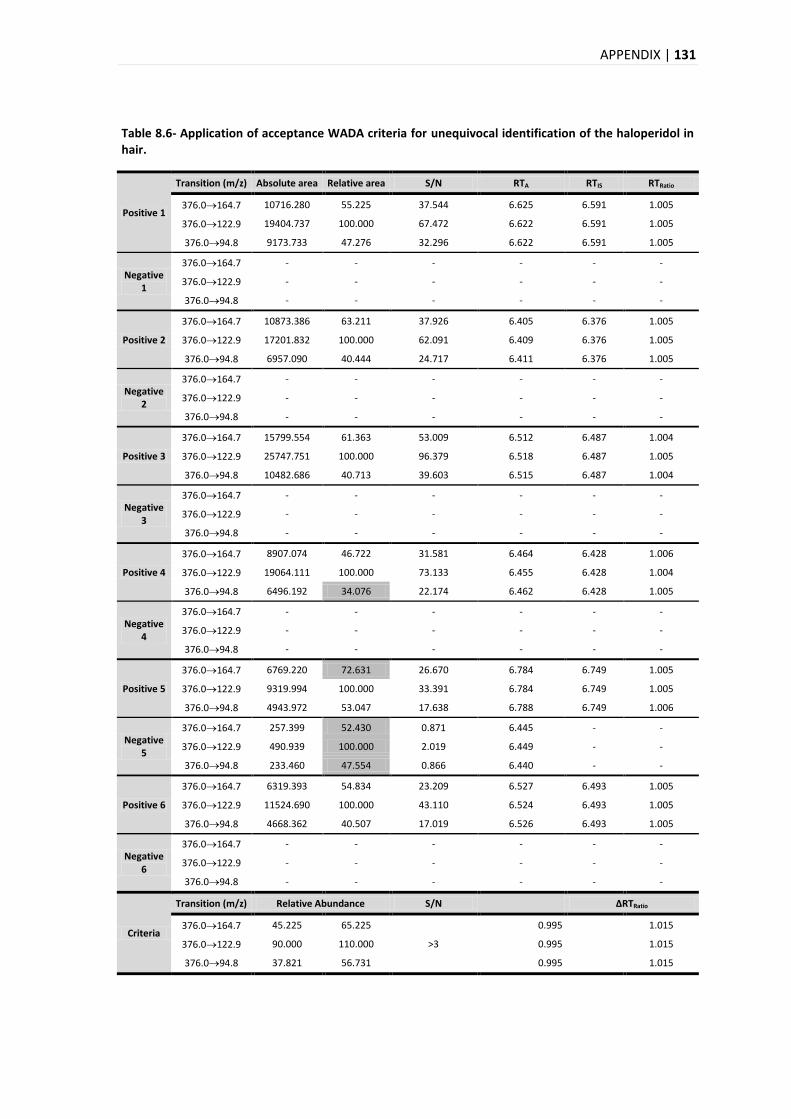
APPENDIX | 131
Table 8.6- Application of acceptance WADA criteria for unequivocal identification of the haloperidol in hair.
Positive 1
Transition (m/z) Absolute area Relative area S/N RTA RTIS RTRatio
376.0164.7 10716.280 55.225 37.544 6.625 6.591 1.005
376.0122.9 19404.737 100.000 67.472 6.622 6.591 1.005
376.094.8 9173.733 47.276 32.296 6.622 6.591 1.005
Negative 1
376.0164.7 - - - - - -
376.0122.9 - - - - - -
376.094.8 - - - - - -
Positive 2
376.0164.7 10873.386 63.211 37.926 6.405 6.376 1.005
376.0122.9 17201.832 100.000 62.091 6.409 6.376 1.005
376.094.8 6957.090 40.444 24.717 6.411 6.376 1.005
Negative 2
376.0164.7 - - - - - -
376.0122.9 - - - - - -
376.094.8 - - - - - -
Positive 3
376.0164.7 15799.554 61.363 53.009 6.512 6.487 1.004
376.0122.9 25747.751 100.000 96.379 6.518 6.487 1.005
376.094.8 10482.686 40.713 39.603 6.515 6.487 1.004
Negative 3
376.0164.7 - - - - - -
376.0122.9 - - - - - -
376.094.8 - - - - - -
Positive 4
376.0164.7 8907.074 46.722 31.581 6.464 6.428 1.006
376.0122.9 19064.111 100.000 73.133 6.455 6.428 1.004
376.094.8 6496.192 34.076 22.174 6.462 6.428 1.005
Negative 4
376.0164.7 - - - - - -
376.0122.9 - - - - - -
376.094.8 - - - - - -
Positive 5
376.0164.7 6769.220 72.631 26.670 6.784 6.749 1.005
376.0122.9 9319.994 100.000 33.391 6.784 6.749 1.005
376.094.8 4943.972 53.047 17.638 6.788 6.749 1.006
Negative 5
376.0164.7 257.399 52.430 0.871 6.445 - -
376.0122.9 490.939 100.000 2.019 6.449 - -
376.094.8 233.460 47.554 0.866 6.440 - -
Positive 6
376.0164.7 6319.393 54.834 23.209 6.527 6.493 1.005
376.0122.9 11524.690 100.000 43.110 6.524 6.493 1.005
376.094.8 4668.362 40.507 17.019 6.526 6.493 1.005
Negative 6
376.0164.7 - - - - - -
376.0122.9 - - - - - -
376.094.8 - - - - - -
Criteria
Transition (m/z) Relative Abundance S/N
ΔRTRatio
376.0164.7 45.225 65.225
>3
0.995 1.015
376.0122.9 90.000 110.000 0.995 1.015
376.094.8 37.821 56.731 0.995 1.015
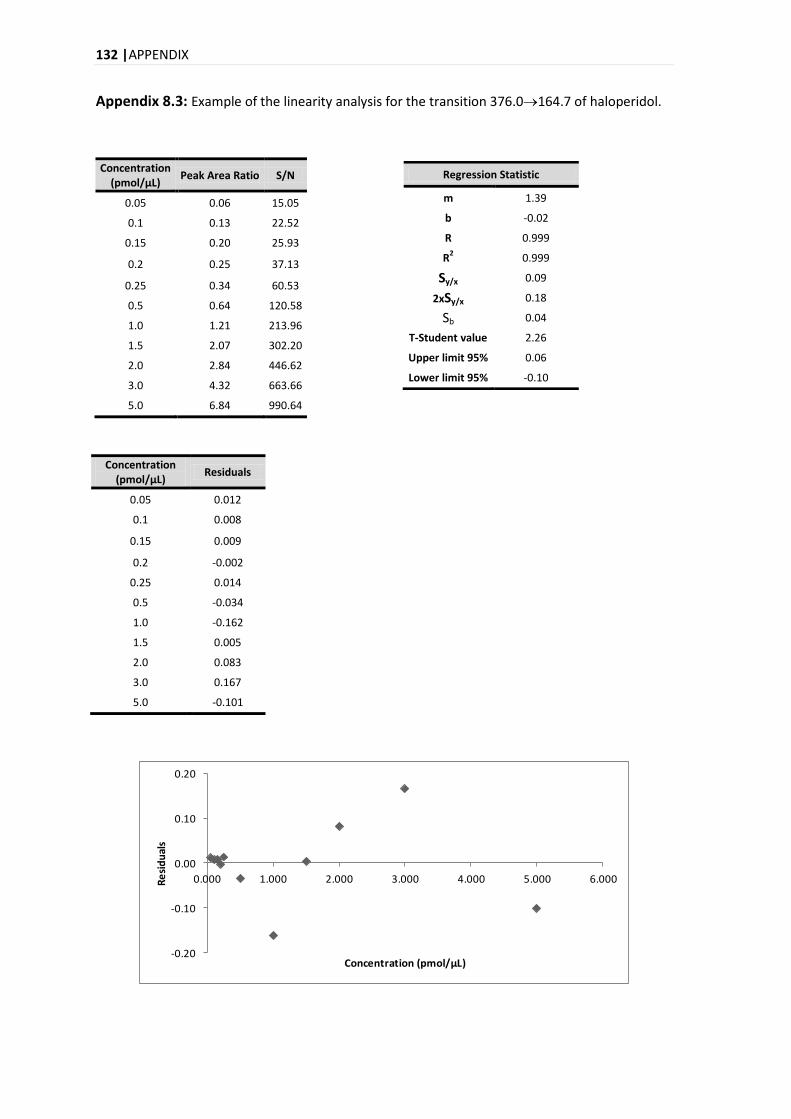
132 |APPENDIX
Appendix 8.3: Example of the linearity analysis for the transition 376.0164.7 of haloperidol.
Concentration (pmol/μL)
Peak Area Ratio S/N
0.05 0.06 15.05
0.1 0.13 22.52
0.15 0.20 25.93
0.2 0.25 37.13
0.25 0.34 60.53
0.5 0.64 120.58
1.0 1.21 213.96
1.5 2.07 302.20
2.0 2.84 446.62
3.0 4.32 663.66
5.0 6.84 990.64
-0.20
-0.10
0.00
0.10
0.20
0.000 1.000 2.000 3.000 4.000 5.000 6.000Re
sid
ual
s
Concentration (pmol/µL)
Regression Statistic
m 1.39
b -0.02
R 0.999
R2 0.999
Sy/x 0.09
2xSy/x 0.18
Sb 0.04
T-Student value 2.26
Upper limit 95% 0.06
Lower limit 95% -0.10
Concentration (pmol/µL)
Residuals
0.05 0.012
0.1 0.008
0.15 0.009
0.2 -0.002
0.25 0.014
0.5 -0.034
1.0 -0.162
1.5 0.005
2.0 0.083
3.0 0.167
5.0 -0.101
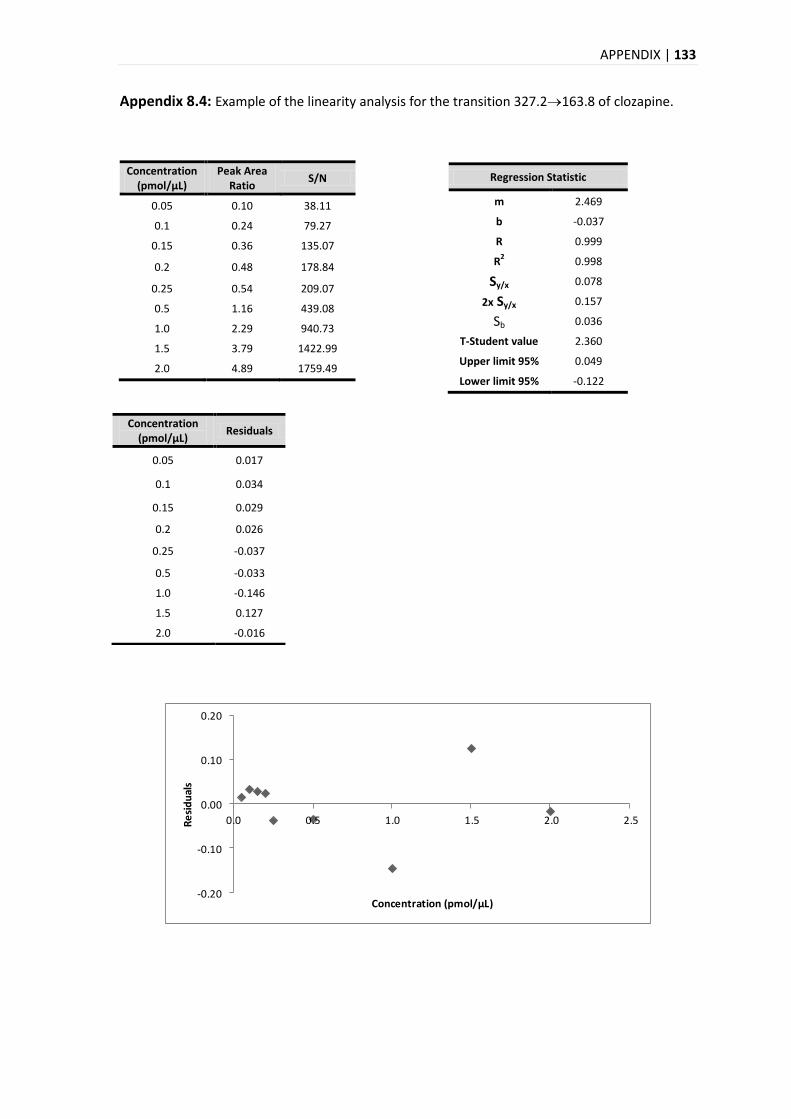
APPENDIX | 133
Appendix 8.4: Example of the linearity analysis for the transition 327.2163.8 of clozapine.
Concentration (pmol/μL)
Peak Area Ratio
S/N
0.05 0.10 38.11
0.1 0.24 79.27
0.15 0.36 135.07
0.2 0.48 178.84
0.25 0.54 209.07
0.5 1.16 439.08
1.0 2.29 940.73
1.5 3.79 1422.99
2.0 4.89 1759.49
-0.20
-0.10
0.00
0.10
0.20
0.0 0.5 1.0 1.5 2.0 2.5Re
sid
ual
s
Concentration (pmol/µL)
Regression Statistic
m 2.469
b -0.037
R 0.999
R2 0.998
Sy/x 0.078
2x Sy/x 0.157
Sb 0.036
T-Student value 2.360
Upper limit 95% 0.049
Lower limit 95% -0.122
Concentration (pmol/µL)
Residuals
0.05 0.017
0.1 0.034
0.15 0.029
0.2 0.026
0.25 -0.037
0.5 -0.033
1.0 -0.146
1.5 0.127
2.0 -0.016
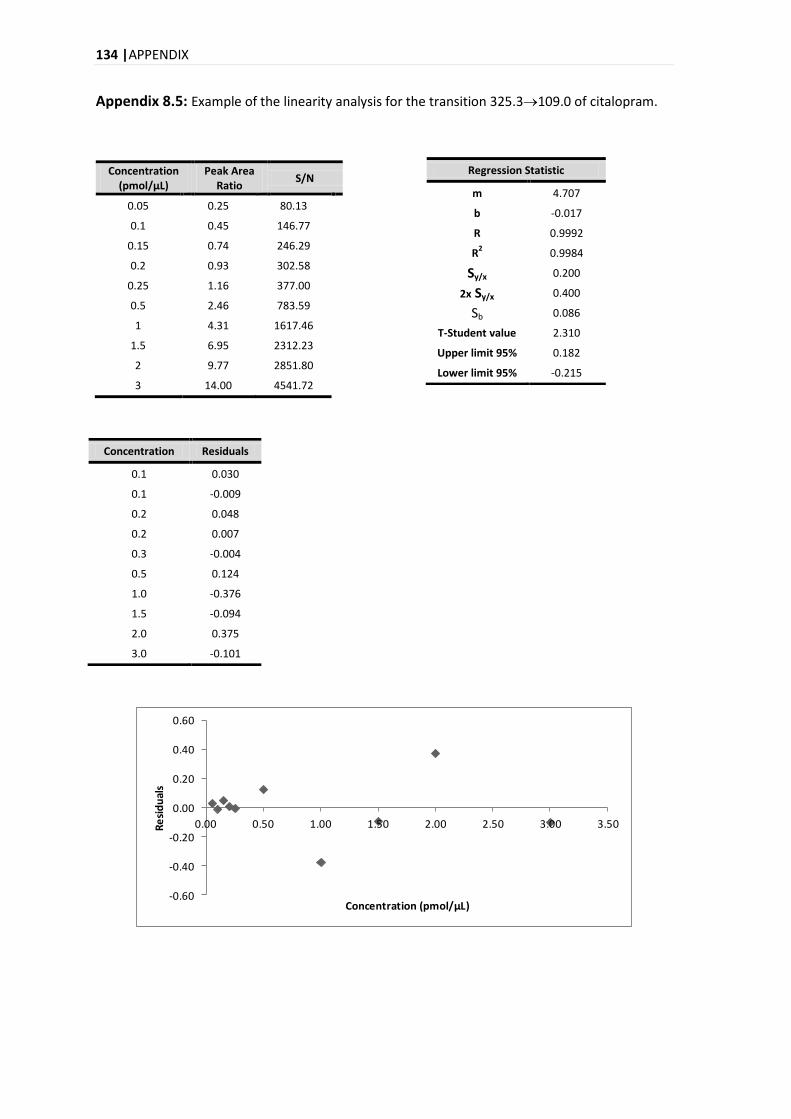
134 |APPENDIX
Appendix 8.5: Example of the linearity analysis for the transition 325.3109.0 of citalopram.
Concentration (pmol/μL)
Peak Area Ratio
S/N
0.05 0.25 80.13
0.1 0.45 146.77
0.15 0.74 246.29
0.2 0.93 302.58
0.25 1.16 377.00
0.5 2.46 783.59
1 4.31 1617.46
1.5 6.95 2312.23
2 9.77 2851.80
3 14.00 4541.72
-0.60
-0.40
-0.20
0.00
0.20
0.40
0.60
0.00 0.50 1.00 1.50 2.00 2.50 3.00 3.50Re
sid
ual
s
Concentration (pmol/µL)
Regression Statistic
m 4.707
b -0.017
R 0.9992
R2 0.9984
Sy/x 0.200
2x Sy/x 0.400
Sb 0.086
T-Student value 2.310
Upper limit 95% 0.182
Lower limit 95% -0.215
Concentration Residuals
0.1 0.030
0.1 -0.009
0.2 0.048
0.2 0.007
0.3 -0.004
0.5 0.124
1.0 -0.376
1.5 -0.094
2.0 0.375
3.0 -0.101
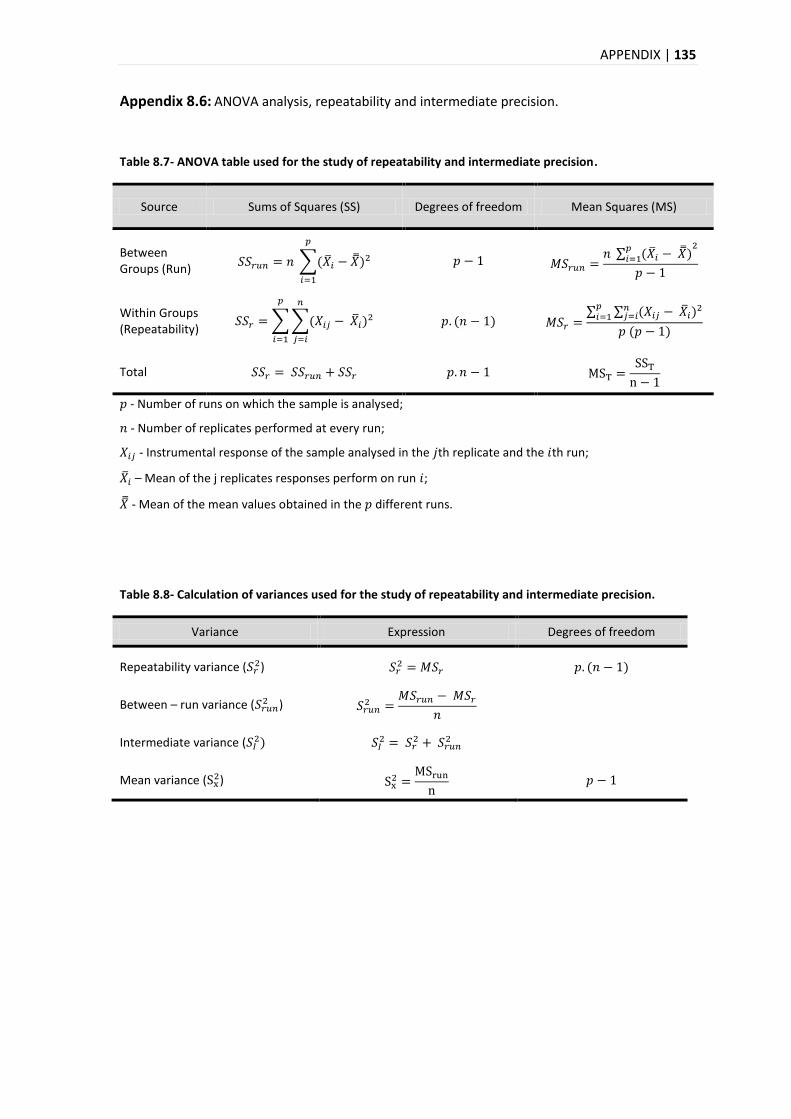
APPENDIX | 135
Appendix 8.6: ANOVA analysis, repeatability and intermediate precision.
Table 8.7- ANOVA table used for the study of repeatability and intermediate precision.
Source Sums of Squares (SS) Degrees of freedom Mean Squares (MS)
Between Groups (Run)
Within Groups (Repeatability)
Total
- Number of runs on which the sample is analysed;
- Number of replicates performed at every run;
- Instrumental response of the sample analysed in the th replicate and the th run;
– Mean of the j replicates responses perform on run ;
- Mean of the mean values obtained in the different runs.
Table 8.8- Calculation of variances used for the study of repeatability and intermediate precision.
Variance Expression Degrees of freedom
Repeatability variance ( )
Between – run variance ( )
Intermediate variance (
Mean variance ( )
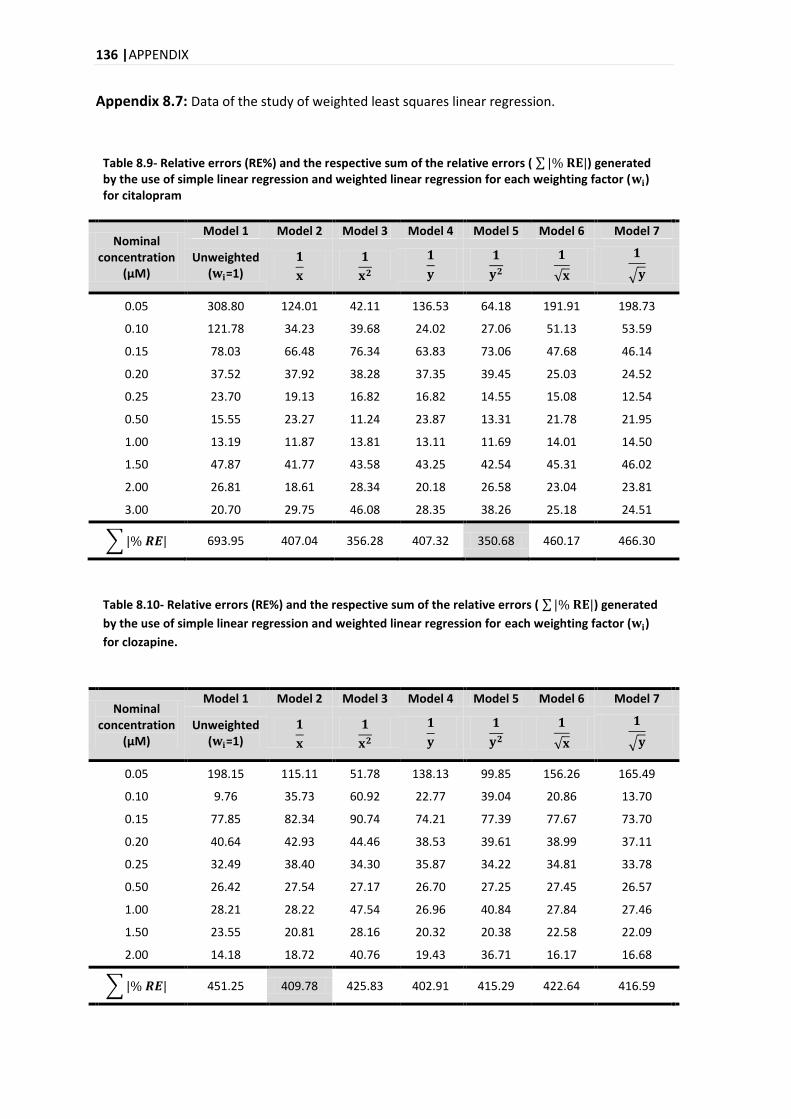
136 |APPENDIX
Appendix 8.7: Data of the study of weighted least squares linear regression.
Table 8.9- Relative errors (RE%) and the respective sum of the relative errors ( ) generated by the use of simple linear regression and weighted linear regression for each weighting factor ( ) for citalopram
Nominal concentration
(μM)
Model 1 Model 2 Model 3 Model 4 Model 5 Model 6 Model 7
Unweighted ( =1)
0.05 308.80 124.01 42.11 136.53 64.18 191.91 198.73
0.10 121.78 34.23 39.68 24.02 27.06 51.13 53.59
0.15 78.03 66.48 76.34 63.83 73.06 47.68 46.14
0.20 37.52 37.92 38.28 37.35 39.45 25.03 24.52
0.25 23.70 19.13 16.82 16.82 14.55 15.08 12.54
0.50 15.55 23.27 11.24 23.87 13.31 21.78 21.95
1.00 13.19 11.87 13.81 13.11 11.69 14.01 14.50
1.50 47.87 41.77 43.58 43.25 42.54 45.31 46.02
2.00 26.81 18.61 28.34 20.18 26.58 23.04 23.81
3.00 20.70 29.75 46.08 28.35 38.26 25.18 24.51
693.95 407.04 356.28 407.32 350.68 460.17 466.30
Table 8.10- Relative errors (RE%) and the respective sum of the relative errors ( ) generated
by the use of simple linear regression and weighted linear regression for each weighting factor ( )
for clozapine.
Nominal concentration
(μM)
Model 1 Model 2 Model 3 Model 4 Model 5 Model 6 Model 7
Unweighted ( =1)
0.05 198.15 115.11 51.78 138.13 99.85 156.26 165.49
0.10 9.76 35.73 60.92 22.77 39.04 20.86 13.70
0.15 77.85 82.34 90.74 74.21 77.39 77.67 73.70
0.20 40.64 42.93 44.46 38.53 39.61 38.99 37.11
0.25 32.49 38.40 34.30 35.87 34.22 34.81 33.78
0.50 26.42 27.54 27.17 26.70 27.25 27.45 26.57
1.00 28.21 28.22 47.54 26.96 40.84 27.84 27.46
1.50 23.55 20.81 28.16 20.32 20.38 22.58 22.09
2.00 14.18 18.72 40.76 19.43 36.71 16.17 16.68
451.25 409.78 425.83 402.91 415.29 422.64 416.59
APPENDIX | 137
Appendix 8.8: Data of the study of Carry-Over.
Table 8.11- Area of LOQ of citalopram and desipramine used to calculate the criteria for carry-over.
Table 8.12- Results of carry-over for citalopram and desipramine. Data obtained of the injections of blanks after sample that was fortified with 5, 0.5 and 0.05 μM with the compounds of the study.
Citalopram Desipramine
Concentration (μM) Injection Area1 Area
1
5
Sample 856213.45 48079.04
Blank 1 1037.29 340.70
Blank 2 540.03 69.02
Blank 3 200.27 112.77
Blank 4 188.09 205.41
Blank 5 98.69 103.75
0.5
Sample 100896.00 68323.04
Blank 1 274.44 108.36
Blank 2 148.42 129.21
Blank 3 100.75 222.56
Blank 4 144.79 114.22
Blank 5 103.01 140.25
0.05
Sample 9022.31 38356.54
Blank 1 76.15 296.67
Blank 2 133.71 235.05
Blank 3 101.30 157.02
Blank 4 128.20 96.34
Blank 5 104.27 125.82 1 The value of the area presented is the average of the data obtained in the 3 days that the procedure was
repeated
Control LOQ
Citalopram Desipramine
Concentration
(µM) Area
Concentration
(µM) Area
0.05 11465.98 0.5 99834.11
138 |APPENDIX
Table 8.13- Area of LOQ of clozapine and desipramine used to calculate the criteria for carry-over.
Control LOQ
Clozapine Desipramine
Concentration
(µM) Area
Concentration
(µM) Area
0.05 1480.90
0.5 99834.11
Table 8.14- Results of carry-over for clozapine and desipramine. Data obtained of the injections of blanks after sample that was fortified with 5, 0.5 and 0.05 μM with the compounds of the study.
Clozapine Desipramine
Concentration (μM) Injection Area1 Area
1
5
Sample 177879.25 48079.04
Blank 1 353.18 340.70
Blank 2 97.63 69.02
Blank 3 86.01 112.77
Blank 4 ND 205.41
Blank 5 45.82 103.75
0.5
Sample 22015.99 68323.04
Blank 1 127.91 108.36
Blank 2 70.58 129.21
Blank 3 58.11 222.56
Blank 4 ND 114.22
Blank 5 46.44 140.25
0.05
Sample 2120.56 38356.54
Blank 1 111.32 296.67
Blank 2 116.72 235.05
Blank 3 70.03 157.02
Blank 4 ND 96.34
Blank 5 46.11 125.82 1 The value of the area presented is the average of the data obtained in the 3 days that the procedure was
repeated; ND – Not Detected.
APPENDIX | 139
Table 8.15- Area of LOQ of haloperidol and haloperidol-D4 used to calculate the criteria for carry-over.
Control LOQ
Haloperidol Haloperidol-D4
Concentration
(µM) Area
Concentration
(µM) Area
0.05 9691.26
0.5 210345.35
Table 8.16- Results of carry-over for haloperidol and haloperidol-D4. Data obtained of the injections of blanks after sample that was fortified with 5, 0.5 and 0.05 μM with the compounds of the study.
Haloperidol Haloperidol-D4
Concentration (μM) Injection Area1 Area
1
5
Sample 887658.99 166663.54
Blank 1 5123.66 1416.41
Blank 2 1594.62 542.83
Blank 3 910.34 214.88
Blank 4 467.47 163.70
Blank 5 426.84 122.07
0.5
Sample 108201.71 199866.04
Blank 1 940.34 1664.06
Blank 2 296.29 376.27
Blank 3 307.68 197.21
Blank 4 244.01 157.89
Blank 5 129.08 79.69
0.05
Sample 10226.17 174195.86
Blank 1 214.52 1240.46
Blank 2 77.35 414.63
Blank 3 131.49 223.01
Blank 4 103.58 144.09
Blank 5 83.58 125.42 1 The value of the area presented is the average of the data obtained in the 3 days that the procedure was
repeated
140 |APPENDIX
Appendix 8.9: Data related of the contamination of plasma samples.
Table 8.17- Contamination of citalopram in plasma samples. Citalopram quantification in plasma samples of clozapine, haloperidol and control.
Label Concentration
(pg/μL) Label
Concentration (pg/μL)
Label Concentration
(pg/μL)
01PLCL1 0.58 01PLHA1 1.87 01PLCT1 0.54*
01PLCL2 0.79 01PLHA2 1.82 01PLCT2 0.34*
01PLCL3 0.83 01PLHA3 1.38 01PLCT3 0.58
01PLCL4 0.40* 01PLHA4 x 01PLCT4 0.43*
01PLCL5 x 01PLHA5 1.98 01PLCT5 0.58
02PLCL1 x 02PLHA1 0.77* 02PLCT1 1.00
02PLCL2 x 02PLHA2 0.48* 02PLCT2 0.78
02PLCL3 1.55 02PLHA3 1.00 02PLCT3 0.73
02PLCL4 1.32 02PLHA4 0.68 02PLCT4 1.10
02PLCL5 0.70* 02PLHA5 0.49* 02PLCT5 x
04PLCL1 x 04PLHA1 4.16 04PLCT1 x
04PLCL2 1.26 04PLHA2 3.25 04PLCT2 0.18*
04PLCL3 1.36 04PLHA3 4.29 04PLCT3 0.05*
04PLCL4 0.76 04PLHA4 3.88 04PLCT4 0.05*
04PLCL5 0.88 04PLHA5 x 04PLCT5 0.06*
08PLCL1 x 08PLHA1 x 08PLCT1 17.69
08PLCL2 23.77 08PLHA2 34.83 08PLCT2 7.80
08PLCL3 x 08PLHA3 x 08PLCT3 22.38
08PLCL4 31.30 08PLHA4 35.76* 08PLCT4 14.49
08PLCL5 21.20 08PLHA5 27.78 08PLCT5 16.48
15PLCL1 x 15PLHA1 4.39 15PLCT1 3.73
15PLCL2 3.31 15PLHA2 5.72 15PLCT2 4.12
15PLCL3 6.07 15PLHA3 6.95 15PLCT3 4.58
15PLCL4 4.96 15PLHA4 7.00 15PLCT4 3.84
15PLCL5 x 15PLHA5 x 15PLCT5 3.60
30PLCL1 0.30* 30PLHA1 0.51* 30PLCT1 0.23*
30PLCL2 0.52* 30PLHA2 0.52* 30PLCT2 0.25*
30PLCL3 0.28* 30PLHA3 0.28* 30PLCT3 0.17*
30PLCL4 0.38* 30PLHA4 0.27* 30PLCT4 0.20*
30PLCL5 0.51* 30PLHA5 0.44* 30PLCT5 0.20*
x - Sample insufficient or non-existent; *- out of calibration curve. Label: - the two first numbers correspond to the different days: 1, 2, 4, 8, 15,30; - the two first letters correspond to the matrix: PL - plasma; - the two second letters correspond to the drug: CL – Clozapine, HA – Haloperidol and CT - Control; - the last number correspond to the animal replicate: 1, 2, 3, 4 and 5.
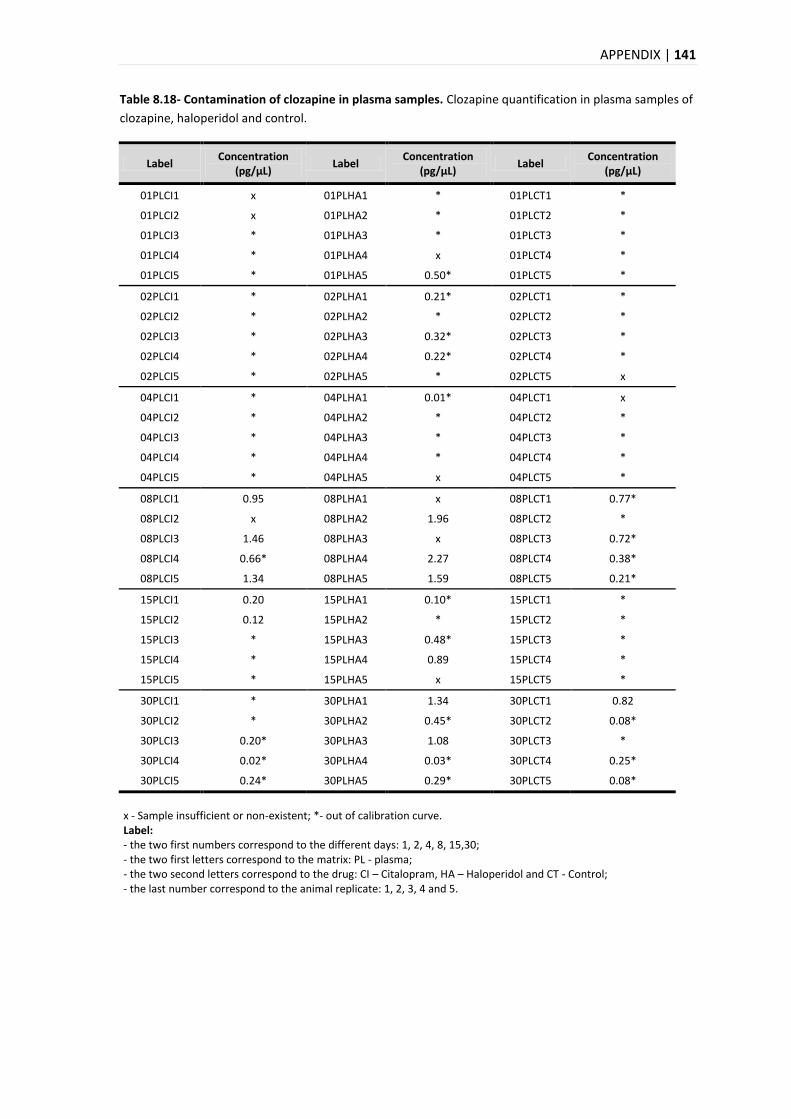
APPENDIX | 141
Table 8.18- Contamination of clozapine in plasma samples. Clozapine quantification in plasma samples of
clozapine, haloperidol and control.
Label Concentration
(pg/μL) Label
Concentration (pg/μL)
Label Concentration
(pg/μL)
01PLCI1 x 01PLHA1 * 01PLCT1 *
01PLCI2 x 01PLHA2 * 01PLCT2 *
01PLCI3 * 01PLHA3 * 01PLCT3 *
01PLCI4 * 01PLHA4 x 01PLCT4 *
01PLCI5 * 01PLHA5 0.50* 01PLCT5 *
02PLCI1 * 02PLHA1 0.21* 02PLCT1 *
02PLCI2 * 02PLHA2 * 02PLCT2 *
02PLCI3 * 02PLHA3 0.32* 02PLCT3 *
02PLCI4 * 02PLHA4 0.22* 02PLCT4 *
02PLCI5 * 02PLHA5 * 02PLCT5 x
04PLCI1 * 04PLHA1 0.01* 04PLCT1 x
04PLCI2 * 04PLHA2 * 04PLCT2 *
04PLCI3 * 04PLHA3 * 04PLCT3 *
04PLCI4 * 04PLHA4 * 04PLCT4 *
04PLCI5 * 04PLHA5 x 04PLCT5 *
08PLCI1 0.95 08PLHA1 x 08PLCT1 0.77*
08PLCI2 x 08PLHA2 1.96 08PLCT2 *
08PLCI3 1.46 08PLHA3 x 08PLCT3 0.72*
08PLCI4 0.66* 08PLHA4 2.27 08PLCT4 0.38*
08PLCI5 1.34 08PLHA5 1.59 08PLCT5 0.21*
15PLCI1 0.20 15PLHA1 0.10* 15PLCT1 *
15PLCI2 0.12 15PLHA2 * 15PLCT2 *
15PLCI3 * 15PLHA3 0.48* 15PLCT3 *
15PLCI4 * 15PLHA4 0.89 15PLCT4 *
15PLCI5 * 15PLHA5 x 15PLCT5 *
30PLCI1 * 30PLHA1 1.34 30PLCT1 0.82
30PLCI2 * 30PLHA2 0.45* 30PLCT2 0.08*
30PLCI3 0.20* 30PLHA3 1.08 30PLCT3 *
30PLCI4 0.02* 30PLHA4 0.03* 30PLCT4 0.25*
30PLCI5 0.24* 30PLHA5 0.29* 30PLCT5 0.08*
x - Sample insufficient or non-existent; *- out of calibration curve. Label: - the two first numbers correspond to the different days: 1, 2, 4, 8, 15,30; - the two first letters correspond to the matrix: PL - plasma; - the two second letters correspond to the drug: CI – Citalopram, HA – Haloperidol and CT - Control; - the last number correspond to the animal replicate: 1, 2, 3, 4 and 5.
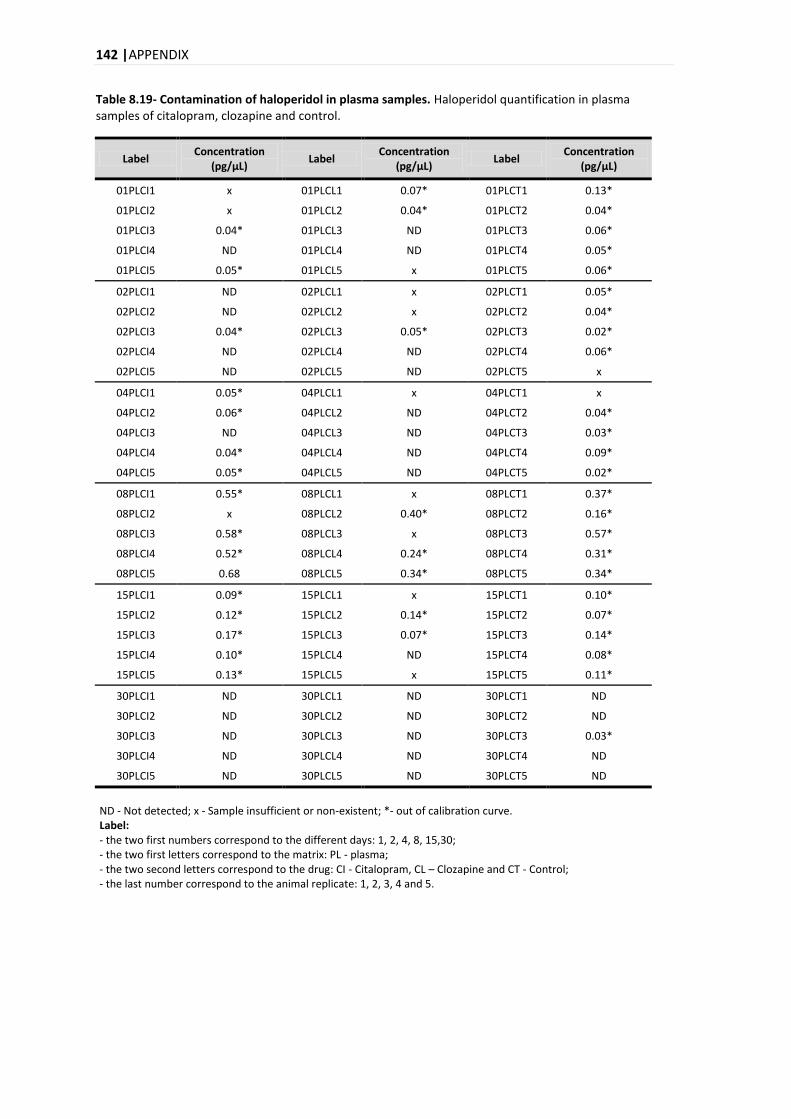
142 |APPENDIX
Table 8.19- Contamination of haloperidol in plasma samples. Haloperidol quantification in plasma samples of citalopram, clozapine and control.
Label Concentration
(pg/μL) Label
Concentration (pg/μL)
Label Concentration
(pg/μL)
01PLCI1 x 01PLCL1 0.07* 01PLCT1 0.13*
01PLCI2 x 01PLCL2 0.04* 01PLCT2 0.04*
01PLCI3 0.04* 01PLCL3 ND 01PLCT3 0.06*
01PLCI4 ND 01PLCL4 ND 01PLCT4 0.05*
01PLCI5 0.05* 01PLCL5 x 01PLCT5 0.06*
02PLCI1 ND 02PLCL1 x 02PLCT1 0.05*
02PLCI2 ND 02PLCL2 x 02PLCT2 0.04*
02PLCI3 0.04* 02PLCL3 0.05* 02PLCT3 0.02*
02PLCI4 ND 02PLCL4 ND 02PLCT4 0.06*
02PLCI5 ND 02PLCL5 ND 02PLCT5 x
04PLCI1 0.05* 04PLCL1 x 04PLCT1 x
04PLCI2 0.06* 04PLCL2 ND 04PLCT2 0.04*
04PLCI3 ND 04PLCL3 ND 04PLCT3 0.03*
04PLCI4 0.04* 04PLCL4 ND 04PLCT4 0.09*
04PLCI5 0.05* 04PLCL5 ND 04PLCT5 0.02*
08PLCI1 0.55* 08PLCL1 x 08PLCT1 0.37*
08PLCI2 x 08PLCL2 0.40* 08PLCT2 0.16*
08PLCI3 0.58* 08PLCL3 x 08PLCT3 0.57*
08PLCI4 0.52* 08PLCL4 0.24* 08PLCT4 0.31*
08PLCI5 0.68 08PLCL5 0.34* 08PLCT5 0.34*
15PLCI1 0.09* 15PLCL1 x 15PLCT1 0.10*
15PLCI2 0.12* 15PLCL2 0.14* 15PLCT2 0.07*
15PLCI3 0.17* 15PLCL3 0.07* 15PLCT3 0.14*
15PLCI4 0.10* 15PLCL4 ND 15PLCT4 0.08*
15PLCI5 0.13* 15PLCL5 x 15PLCT5 0.11*
30PLCI1 ND 30PLCL1 ND 30PLCT1 ND
30PLCI2 ND 30PLCL2 ND 30PLCT2 ND
30PLCI3 ND 30PLCL3 ND 30PLCT3 0.03*
30PLCI4 ND 30PLCL4 ND 30PLCT4 ND
30PLCI5 ND 30PLCL5 ND 30PLCT5 ND
ND - Not detected; x - Sample insufficient or non-existent; *- out of calibration curve. Label: - the two first numbers correspond to the different days: 1, 2, 4, 8, 15,30; - the two first letters correspond to the matrix: PL - plasma; - the two second letters correspond to the drug: CI - Citalopram, CL – Clozapine and CT - Control; - the last number correspond to the animal replicate: 1, 2, 3, 4 and 5.
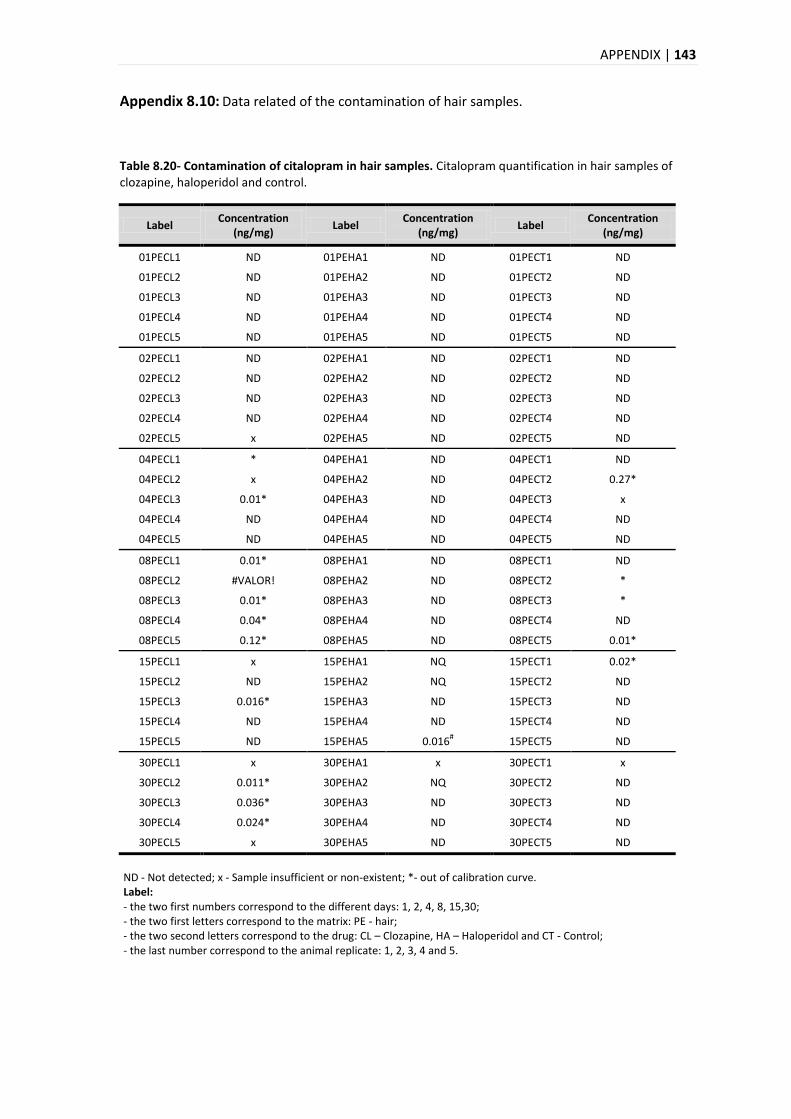
APPENDIX | 143
Appendix 8.10: Data related of the contamination of hair samples.
Table 8.20- Contamination of citalopram in hair samples. Citalopram quantification in hair samples of clozapine, haloperidol and control.
Label Concentration
(ng/mg) Label
Concentration (ng/mg)
Label Concentration
(ng/mg)
01PECL1 ND 01PEHA1 ND 01PECT1 ND
01PECL2 ND 01PEHA2 ND 01PECT2 ND
01PECL3 ND 01PEHA3 ND 01PECT3 ND
01PECL4 ND 01PEHA4 ND 01PECT4 ND
01PECL5 ND 01PEHA5 ND 01PECT5 ND
02PECL1 ND 02PEHA1 ND 02PECT1 ND
02PECL2 ND 02PEHA2 ND 02PECT2 ND
02PECL3 ND 02PEHA3 ND 02PECT3 ND
02PECL4 ND 02PEHA4 ND 02PECT4 ND
02PECL5 x 02PEHA5 ND 02PECT5 ND
04PECL1 * 04PEHA1 ND 04PECT1 ND
04PECL2 x 04PEHA2 ND 04PECT2 0.27*
04PECL3 0.01* 04PEHA3 ND 04PECT3 x
04PECL4 ND 04PEHA4 ND 04PECT4 ND
04PECL5 ND 04PEHA5 ND 04PECT5 ND
08PECL1 0.01* 08PEHA1 ND 08PECT1 ND
08PECL2 #VALOR! 08PEHA2 ND 08PECT2 *
08PECL3 0.01* 08PEHA3 ND 08PECT3 *
08PECL4 0.04* 08PEHA4 ND 08PECT4 ND
08PECL5 0.12* 08PEHA5 ND 08PECT5 0.01*
15PECL1 x 15PEHA1 NQ 15PECT1 0.02*
15PECL2 ND 15PEHA2 NQ 15PECT2 ND
15PECL3 0.016* 15PEHA3 ND 15PECT3 ND
15PECL4 ND 15PEHA4 ND 15PECT4 ND
15PECL5 ND 15PEHA5 0.016# 15PECT5 ND
30PECL1 x 30PEHA1 x 30PECT1 x
30PECL2 0.011* 30PEHA2 NQ 30PECT2 ND
30PECL3 0.036* 30PEHA3 ND 30PECT3 ND
30PECL4 0.024* 30PEHA4 ND 30PECT4 ND
30PECL5 x 30PEHA5 ND 30PECT5 ND
ND - Not detected; x - Sample insufficient or non-existent; *- out of calibration curve. Label: - the two first numbers correspond to the different days: 1, 2, 4, 8, 15,30; - the two first letters correspond to the matrix: PE - hair; - the two second letters correspond to the drug: CL – Clozapine, HA – Haloperidol and CT - Control; - the last number correspond to the animal replicate: 1, 2, 3, 4 and 5.
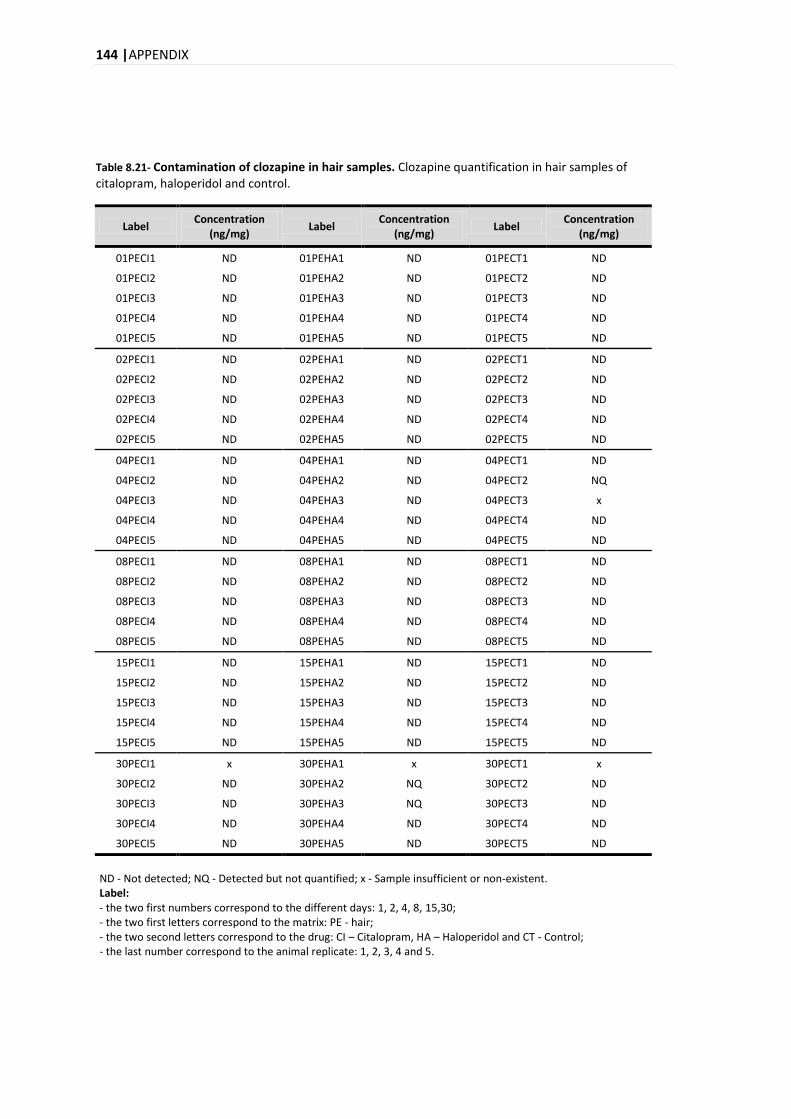
144 |APPENDIX
Table 8.21- Contamination of clozapine in hair samples. Clozapine quantification in hair samples of citalopram, haloperidol and control.
Label Concentration
(ng/mg) Label
Concentration (ng/mg)
Label Concentration
(ng/mg)
01PECI1 ND 01PEHA1 ND 01PECT1 ND
01PECI2 ND 01PEHA2 ND 01PECT2 ND
01PECI3 ND 01PEHA3 ND 01PECT3 ND
01PECI4 ND 01PEHA4 ND 01PECT4 ND
01PECI5 ND 01PEHA5 ND 01PECT5 ND
02PECI1 ND 02PEHA1 ND 02PECT1 ND
02PECI2 ND 02PEHA2 ND 02PECT2 ND
02PECI3 ND 02PEHA3 ND 02PECT3 ND
02PECI4 ND 02PEHA4 ND 02PECT4 ND
02PECI5 ND 02PEHA5 ND 02PECT5 ND
04PECI1 ND 04PEHA1 ND 04PECT1 ND
04PECI2 ND 04PEHA2 ND 04PECT2 NQ
04PECI3 ND 04PEHA3 ND 04PECT3 x
04PECI4 ND 04PEHA4 ND 04PECT4 ND
04PECI5 ND 04PEHA5 ND 04PECT5 ND
08PECI1 ND 08PEHA1 ND 08PECT1 ND
08PECI2 ND 08PEHA2 ND 08PECT2 ND
08PECI3 ND 08PEHA3 ND 08PECT3 ND
08PECI4 ND 08PEHA4 ND 08PECT4 ND
08PECI5 ND 08PEHA5 ND 08PECT5 ND
15PECI1 ND 15PEHA1 ND 15PECT1 ND
15PECI2 ND 15PEHA2 ND 15PECT2 ND
15PECI3 ND 15PEHA3 ND 15PECT3 ND
15PECI4 ND 15PEHA4 ND 15PECT4 ND
15PECI5 ND 15PEHA5 ND 15PECT5 ND
30PECI1 x 30PEHA1 x 30PECT1 x
30PECI2 ND 30PEHA2 NQ 30PECT2 ND
30PECI3 ND 30PEHA3 NQ 30PECT3 ND
30PECI4 ND 30PEHA4 ND 30PECT4 ND
30PECI5 ND 30PEHA5 ND 30PECT5 ND
ND - Not detected; NQ - Detected but not quantified; x - Sample insufficient or non-existent. Label: - the two first numbers correspond to the different days: 1, 2, 4, 8, 15,30; - the two first letters correspond to the matrix: PE - hair; - the two second letters correspond to the drug: CI – Citalopram, HA – Haloperidol and CT - Control; - the last number correspond to the animal replicate: 1, 2, 3, 4 and 5.
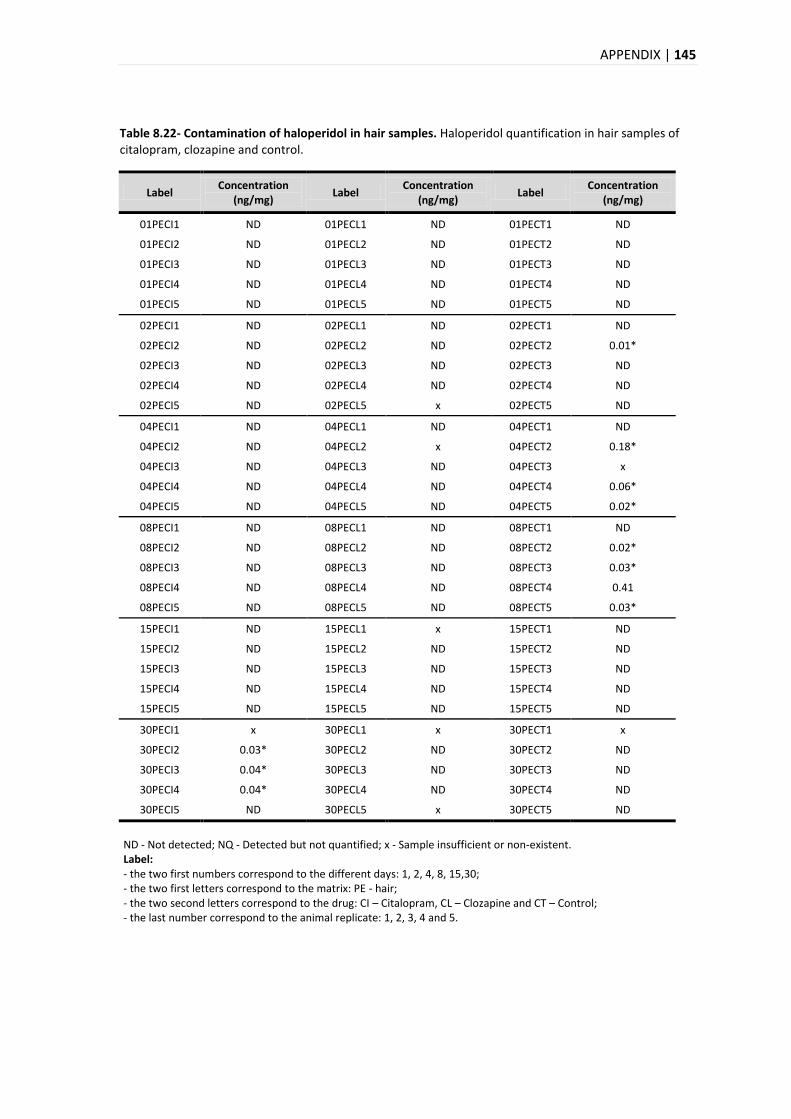
APPENDIX | 145
Table 8.22- Contamination of haloperidol in hair samples. Haloperidol quantification in hair samples of citalopram, clozapine and control.
Label Concentration
(ng/mg) Label
Concentration (ng/mg)
Label Concentration
(ng/mg)
01PECI1 ND 01PECL1 ND 01PECT1 ND
01PECI2 ND 01PECL2 ND 01PECT2 ND
01PECI3 ND 01PECL3 ND 01PECT3 ND
01PECI4 ND 01PECL4 ND 01PECT4 ND
01PECI5 ND 01PECL5 ND 01PECT5 ND
02PECI1 ND 02PECL1 ND 02PECT1 ND
02PECI2 ND 02PECL2 ND 02PECT2 0.01*
02PECI3 ND 02PECL3 ND 02PECT3 ND
02PECI4 ND 02PECL4 ND 02PECT4 ND
02PECI5 ND 02PECL5 x 02PECT5 ND
04PECI1 ND 04PECL1 ND 04PECT1 ND
04PECI2 ND 04PECL2 x 04PECT2 0.18*
04PECI3 ND 04PECL3 ND 04PECT3 x
04PECI4 ND 04PECL4 ND 04PECT4 0.06*
04PECI5 ND 04PECL5 ND 04PECT5 0.02*
08PECI1 ND 08PECL1 ND 08PECT1 ND
08PECI2 ND 08PECL2 ND 08PECT2 0.02*
08PECI3 ND 08PECL3 ND 08PECT3 0.03*
08PECI4 ND 08PECL4 ND 08PECT4 0.41
08PECI5 ND 08PECL5 ND 08PECT5 0.03*
15PECI1 ND 15PECL1 x 15PECT1 ND
15PECI2 ND 15PECL2 ND 15PECT2 ND
15PECI3 ND 15PECL3 ND 15PECT3 ND
15PECI4 ND 15PECL4 ND 15PECT4 ND
15PECI5 ND 15PECL5 ND 15PECT5 ND
30PECI1 x 30PECL1 x 30PECT1 x
30PECI2 0.03* 30PECL2 ND 30PECT2 ND
30PECI3 0.04* 30PECL3 ND 30PECT3 ND
30PECI4 0.04* 30PECL4 ND 30PECT4 ND
30PECI5 ND 30PECL5 x 30PECT5 ND
ND - Not detected; NQ - Detected but not quantified; x - Sample insufficient or non-existent. Label: - the two first numbers correspond to the different days: 1, 2, 4, 8, 15,30; - the two first letters correspond to the matrix: PE - hair; - the two second letters correspond to the drug: CI – Citalopram, CL – Clozapine and CT – Control; - the last number correspond to the animal replicate: 1, 2, 3, 4 and 5.