Embed Size (px)
Citation preview
Mark Jurjen van Eeks
VALUING UNCONVENTIONAL STARTUP
FUNDING MECHANISMS: CROWDFUNDING AND
INITIAL COIN OFFERINGS
Dissertation for the master’s program in economics, with specialization in financial
economics, advised by Professor Manuel Paulo de Albuquerque Melo, presented to
the faculty of economics of the University of Coimbra for obtaining a master’s degree
February 2020
i
Resumo (Português)
Nas últimas décadas, a Internet e outros novos desenvolvimentos tecnológicos, tais como os
avanços na criptografia, permitiram que as empresas se lançassem em novas formas criativas
de procurar financiamento. Uma grande variedade de artigos na literatura económica têm
sido escritos sobre crowdfunding e Initial Coin Offerings (ICO), embora poucos deles façam
uma comparação direta entre estes mecanismos de financiamento. Este projeto de trabalho
tenta preencher essa lacuna através da análise das relações entre oferta pública inicial (IPO),
ICOs e projetos de crowdfunding que tiveram uma data final entre Abril de 2017 e Setembro
de 2019. A principal área de foco deste trabalho foi a teoria da sinalização e o grau de
subpreço / subcotação de preços (underpricing) das IPO e das ICO. Para analisar as
hipóteses, utilizei um conjunto de dados transversais, que foram recolhidos de fontes
secundárias como o NASDAQ.com, Kickstarter.com e Icobench.com, para produzir uma
regressão linear OLS. Fiz uma regressão de múltiplos possíveis sinais em relação ao capital
angariado por qualquer um dos mecanismos de financiamento anteriormente mencionados.
Em primeiro lugar, testei o efeito da percentagem de retenção das ICO e das IPO. Em
segundo lugar, testei o efeito do objetivo de financiamento das ICO e do crowdfunding. Por
último, testei o efeito do tempo de financiamento das ICOs e do financiamento por
crowdfunding. Além disso, foram discutidas três hipóteses relativas aos fatores
determinantes dos subpreços nas ICO e nas IPO. Testei se o montante médio de subcotação
de preços, o número de emissões anteriores e o montante do capital mobilizado poderiam
explicar nível de subpreço verificado. Por último, testei se o tempo decorrido até à cotação
estava positivamente relacionado com o montante da subcotação de preços nas ICO. Os
resultados sugerem que o ICO e os projetos de financiamento em regime de crowdfunding
com um tempo de financiamento mais longo são menos financiados. Além disso, encontrei
uma relação positiva entre o objetivo de financiamento e o montante do capital angariado
nas ICO e no Crowdfunding.
JEL tags: G11 E22 M13 O16 G39
Palavras-chave: IPO, ICO, Crowdfunding, Mecanismos de financiamento, Tokens digitais
ii
Abstract
In the last few decades, the internet and other new technology developments, such as
advancements in cryptography have allowed ventures new creative ways to seek funding. In
the economic literature, there is a large variety of papers that have been written on
crowdfunding and Initial Coin Offerings (ICO). Though few of them do a direct comparison
between these funding mechanisms. This work project tries to fill that gap by analyzing
relationships between Initial public offerings (IPOs), ICOs, and reward-based crowdfunding
projects that had an ending date between April 2017 and September 2019. The main area of
focus of this paper was signaling theory and the degree of underpricing of IPOs and ICOs.
For analyzing the hypotheses, I have utilized a cross-sectional dataset, that was gathered
from secondary sources such as NASDAQ.com, Kickstarter.com, and Icobench.com to
conduct an OLS linear regression. I have regressed multiple possible signals on the capital
raised by any of the previously mentioned funding mechanisms. Firstly, I tested the effect of
the retention percentage of ICOs and IPOs. Secondly, I have tested the effect of the funding
goal of ICOs and crowdfunding. Finally, I have tested the effect of the funding time of ICOs
and crowdfunding. Furthermore, three hypotheses regarding the determinants of
underpricing in ICOs and IPOs were discussed. I have tested if the average amount of
underpricing, the number of previous issues, and the amount of capital raised could explain
the amount of underpricing. Finally, I tested if the time to listing was positively related to
the amount of underpricing in ICOs. The results suggest that ICO and crowdfunding projects
with a longer funding time are less funded. Furthermore, I’ve found a positive relationship
between the funding goal and the amount of capital raised in ICOs and Crowdfunding.
JEL tags: G11 E22 M13 O16 G39
Keywords: IPO, ICO, Crowdfunding, Funding mechanisms, Digital tokens
iii
Index 1. Introduction .................................................................................................................... 1
2. Related research ............................................................................................................. 3
2.1. Initial Public Offerings (IPOs) ................................................................................... 3
2.2 Reward-based crowdfunding ....................................................................................... 3
2.3 Initial Coin Offerings (ICOs) ...................................................................................... 4
2.4 Costs ............................................................................................................................ 5
2.5 Signaling ...................................................................................................................... 7
2.6 Underpricing ................................................................................................................ 7
3. Problem description and List of Hypothesis .................................................................. 9
3.1 Signaling theory ........................................................................................................... 9
3.2 Underpricing .............................................................................................................. 10
4. Methodology and Data collection ................................................................................ 12
4.1 Signaling .................................................................................................................... 12
4.2 Underpricing .............................................................................................................. 13
4.3 Data Collection .......................................................................................................... 14
5. Descriptive statistics ..................................................................................................... 17
6. Results .......................................................................................................................... 21
6.1 Results from the signaling models ............................................................................ 21
6.1.2 Control variables of the signaling models. ............................................................. 22
6.2 Results from the models regarding underpricing ...................................................... 23
6.2.2 Control variables .................................................................................................... 24
6.3 Collinearity ................................................................................................................ 25
6.4 Further tests ............................................................................................................... 25
7. Discussion and Conclusion .......................................................................................... 29
7.1 Main results ............................................................................................................... 29

iv
7.2 Study implications ..................................................................................................... 30
7.3 Limitations: ................................................................................................................ 30
7.4 Future research .......................................................................................................... 31
8. Bibliography ................................................................................................................. 32
v
List of figures
Figure 1: Q-Q plots of regressions ...................................................................................... 21
Figure 2: Q-Q plot of the residuals of the ICO-underpricing regression with a log-
transformed dependent variable........................................................................................... 28
List of tables
Table 1: IPO costs in Millions of USD for an IPO raising between 25 to 100 million USD 5
Table 2: Low and high estimate of ICO costs in USD .......................................................... 6
Table 3: Cost estimate of reward-based crowdfunding campaign raising 54 000 USD........ 6
Table 4: Descriptive statistics of the signaling dataset ........................................................ 17
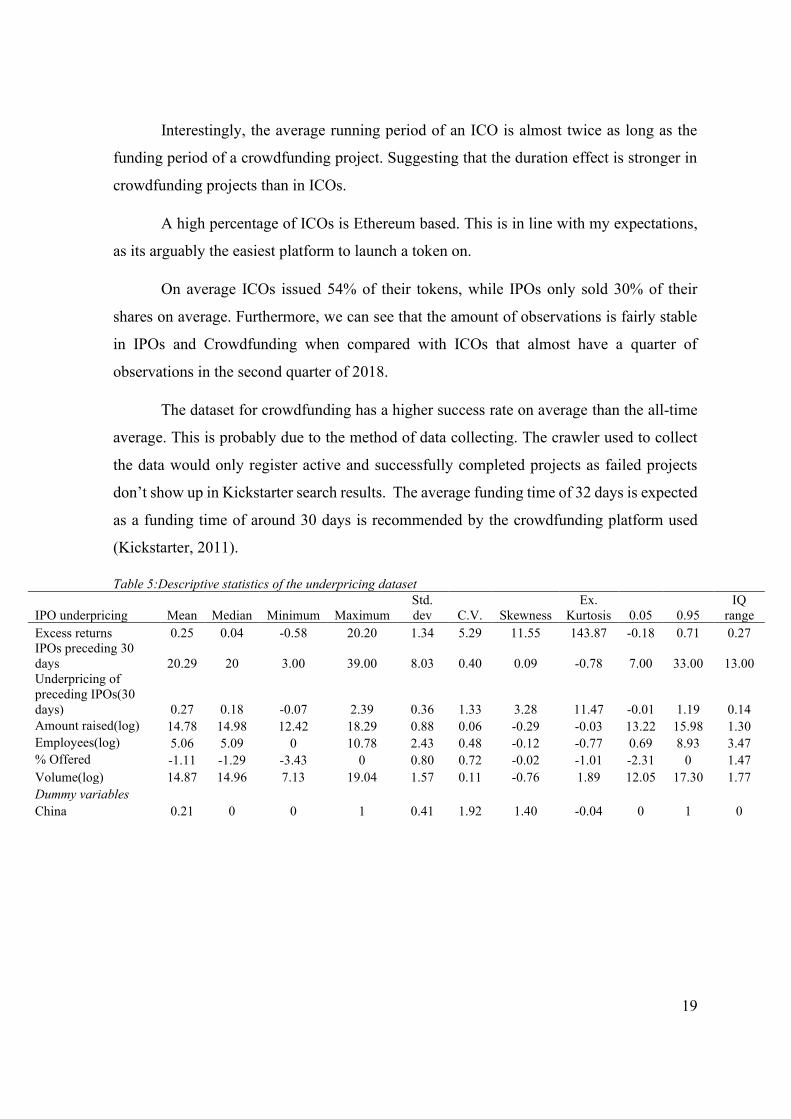
Table 5:Descriptive statistics of the underpricing dataset ................................................... 19
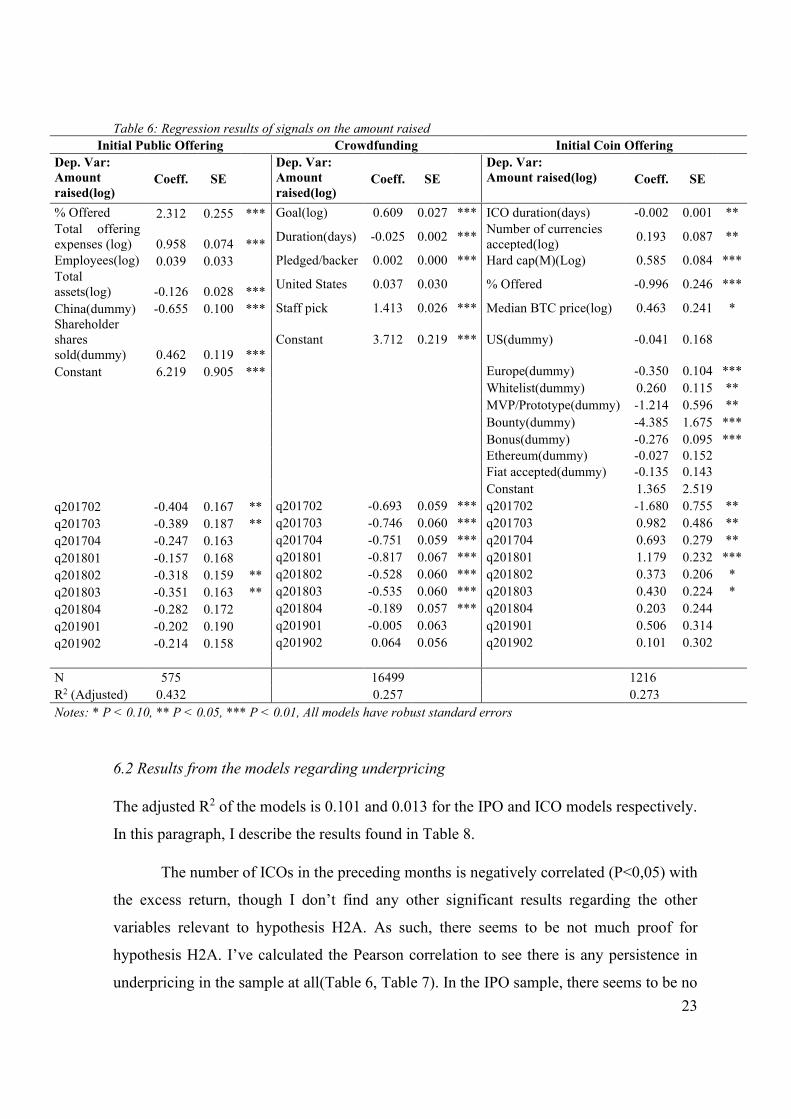
Table 6: Regression results of signals on the amount raised ............................................... 23
Table 7: Pearson correlation coefficients of the lagged aggregate variables. ..................... 24
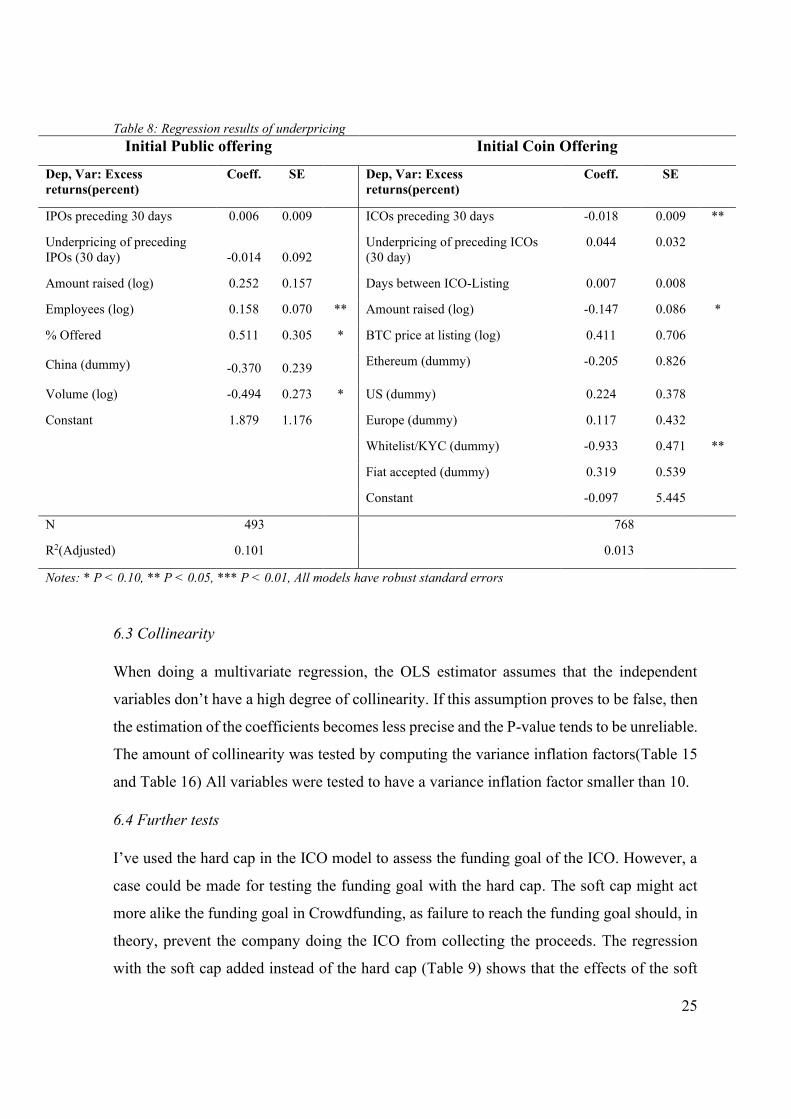
Table 8: Regression results of underpricing ........................................................................ 25
Table 9: Extra robustness test pertaining the ICO signaling model .................................... 27
Table 10: Summary of signaling results .............................................................................. 29
Table 11: Summary of underpricing results ........................................................................ 30
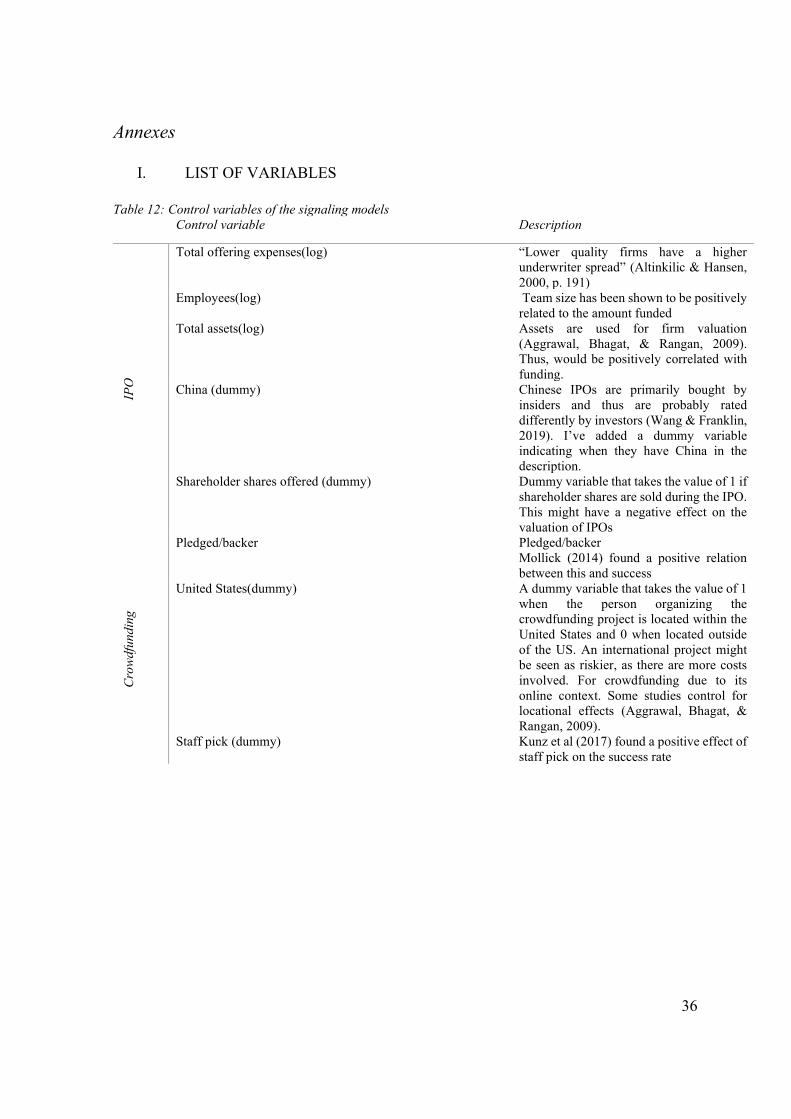
Table 12: Control variables of the signaling models ........................................................... 36
Table 13: Control variables of the underpricing models ..................................................... 38
Table 14: Results of the Breusch pagan test. ....................................................................... 40
Table 15: Variance inflation factors of the signaling models .............................................. 41
Table 16: Variance inflation factors of the underpricing models ........................................ 42
1
1. Introduction
Initial Public Offerings (IPOs) have been an important way of funding companies for
centuries. In the last decade, other pathways opened for start-ups seeking funding. With the
advent of the Internet, crowdfunding grew into a viable alternative to traditional funding
mechanisms. In recent years Initial Coin Offerings (ICOs) were popularized as being a viable
path to funding as well. The estimated world market for crowdfunding was almost 11 billion
dollars in 2018 (QYResearch, 2019). Similarly, in 2019 about 11 billion dollars has been
raised by ICOs (Icobench, 2019).
The upside of these new ways of funding is that companies can attract money without
having to give equity in. They lower the costs of capital raising and (at least for now) bypass
most regulations (Clayton, 2017). However, these options pose a new question: How does a
start-up know which funding mechanism has the highest chance of success? While there is
research done on how crowdfunding and ICOs compare to IPOs, there are far as we know
there are no papers that compare all three funding mechanisms.
Another attribute of these new funding mechanisms is that there is no central
authority where researchers can get reliable information. Due to this spread of information,
the datasets research teams use differ wildly (especially those used in ICO research).
Therefore, retesting some results from earlier studies with a new dataset might uncover
interesting results.
The objective of this study is to create a comparative analysis of IPOs, crowdfunding,
and ICOs. Secondly, with this study, I try to reproduce some of the results other studies have
found when comparing crowdfunding and ICOs with IPOs.
The starting point of this research was the creation of a database containing time
series data on IPOs, crowdfunding, and ICOs. The database contains data on funding
projects with an end date between April 2017 and September 2019, as ICOs were not quite
common before 2017.
The main concepts related to crowdfunding and Initial Coin Offerings are described
more in-depth in chapter 2. In the same chapter, the main topics of the work are linked
together. While in chapter 3 testable statements are synthesized within those topics. The
statements are then operationalized in chapter 4. In chapter 5 the dataset used to test the

2
hypotheses is described. The results of the research can be found in chapter 6. Finally, in
chapter 7 I discuss the results, limitations, and possibilities for future research.
3
2. Related research
The first part of this chapter consists of a small introduction to the selected funding
mechanisms. The second part contains a summary of areas where comparable research has
been done on these mechanisms.
2.1. Initial Public Offerings (IPOs)
As legislation between countries varies considerably, I will focus on the IPOs of companies
incorporated in the United States unless stated otherwise. The IPO process is often similar
to the following (Corporate finance institute, 2020): Firstly an underwriter to guide the IPO
process is picked. Thereafter the firm can choose to do a best-effort order, where the
underwriter only sells the security or a firm commitment order, where an underwriter
guarantees the sale of securities. A roadshow is held to market the shares to investors and a
prospectus with company information is provided. Finally, the share price is determined, and
the stock is listed on an exchange.
2.2 Reward-based crowdfunding
Crowdfunding is usually defined as raising small amounts of money from a large group of
people (the crowd). There are multiple types of crowdfunding, i.e. reward-based, equity-
based, debt-based, and donation-based crowdfunding (Bird & Meyskens, 2015). As the
names suggest, these types of crowdfunding differ primarily in the way investors are
compensated. Due to data being more readily available, this paper will focus primarily on
reward-based crowdfunding.
The majority of reward-based crowdfunding is done for small projects amounting up
to 10.000 USD (Kickstarter, 2019), but a large part of crowdfunding is being done to seed
entrepreneurial capital (Schwienbacher & Larralde, 2010). When utilizing crowdfunding,
start-ups often use intermediate companies (e.g. Kickstarter or Indiegogo) to help with the
process. These intermediaries usually offer an escrow service and a place to advertise the
project. The benefits of crowdfunding extend beyond obtaining a loan. Companies use
crowdfunding as a marketing opportunity, for attracting venture capital (Dingman, 2018) or
to learn more about the preferences of future customers (Tinn & Chemla, 2019). Research
suggests that investors assess companies that acquire funding through venture capital and
4
crowdfunding in a similar way (Mollick, 2013). This indicates that previous research with a
focus on venture capital investors might apply to investors who fund companies through
crowdfunding.
2.3 Initial Coin Offerings (ICOs)
ICOs are another funding mechanism that makes use of the crowd. In contrast to reward-
based crowdfunding, ICOs sell tokens to the crowd. Fish (2019) argues that due to ICOs
using a similar process as crowdfunding many similarities can be found between them.
The tokens sold in the ICO can be roughly categorized into cryptocurrency, utility-
and/or security tokens (Oliveira, Zavolokina, Bauer, & Schwabe, 2018). Utility tokens make
up the vast majority of the tokens sold and provide some way of accessing services and
products. An example of a utility token would be a token that can be traded for storage space.
When a token gives right to contribute to a company's capital and share’s in its profits or if
the proceeds of a token are the sole result of individuals other than the issuer, then the token
is regarded as a security and must comply with the same SEC regulations as other securities
(Sameeh, 2018).
A whitepaper describing the capabilities of the token and the funding process is often
made available for potential investors. According to Howell et al. (2019), ICOs have a higher
success rate when they disclose information in a whitepaper and when the whitepaper
specifies the use of the proceeds of the ICO.
Companies might take away some doubts of investors by communicating their
intentions. However, it is often unclear if investors have any possibility of legal recourse
when these intentions fail to materialize. Zetzsche et al. (2019) found that only 33% of ICO’s
had any information about which laws were applicable to them. Furthermore, they found
that, in 40% of the researched cases, the whitepaper writer differed from the ICO
issuer/initiator. This uncertainty about the legal responsibility of ICOs might invite some
entities to take advantage of this situation. And in fact, over 80 percent of ICOs in 2017 were
allegedly scams (Satis Group, 2018). However, the impact of scam-ICOs looks slightly less
bad when the researches adjusted for volume. They then identified that over 70 percent of
ICO volume as high-quality.
5
A recent development in the issuing process of ICOs is the Initial Exchange Offering
(IEO). Where ICO s are usually managed completely by the issuing company themselves,
the IEO has a cryptocurrency exchange to act as an intermediary between issuer and investor
(Binance, 2019). Investors buy the tokens from the exchange and can trade it immediately
after the IEO period. For brevity’s sake, this paper will refer to both as ICOs.
There is one extra hurdle compared to IPOs and crowdfunding, which is that
investors usually (EY Research, 2018) need some form of cryptocurrency to be able to invest
in ICOs. On the other side of this issue is the issuer, who will typically receive the funding
in cryptocurrency as well and thus is exposed to an exchange rate risk. This hurdle might be
smaller in the future, with many new cryptocurrencies being tied to fiat money (Bezverhi,
2019).
2.4 Costs
There are many papers written on the successes of IPOs, ICOs, and crowdfunding. However,
there is not a lot of in-depth data to go on which accurately describes the costs of ICOs and
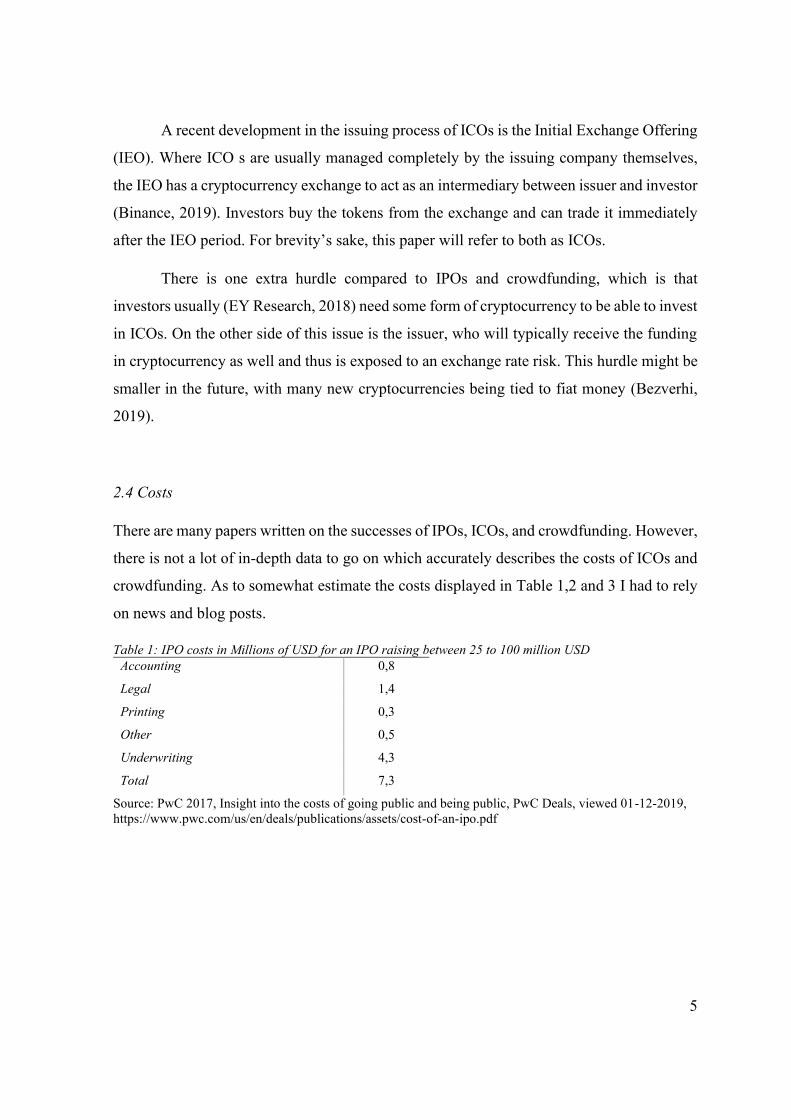
crowdfunding. As to somewhat estimate the costs displayed in Table 1,2 and 3 I had to rely
on news and blog posts.
Table 1: IPO costs in Millions of USD for an IPO raising between 25 to 100 million USD
Accounting 0,8
Legal 1,4
Printing 0,3
Other 0,5
Underwriting 4,3
Total 7,3
Source: PwC 2017, Insight into the costs of going public and being public, PwC Deals, viewed 01-12-2019,
https://www.pwc.com/us/en/deals/publications/assets/cost-of-an-ipo.pdf
6
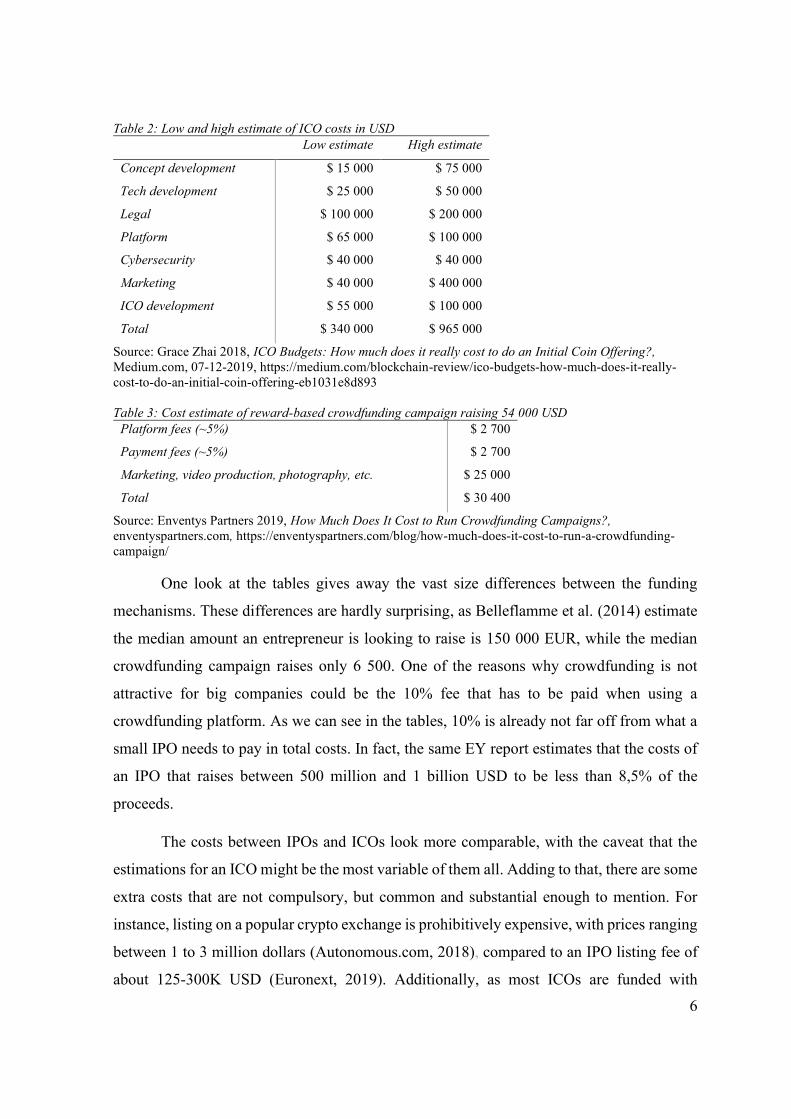
Table 2: Low and high estimate of ICO costs in USD
Low estimate High estimate
Concept development $ 15 000 $ 75 000
Tech development $ 25 000 $ 50 000
Legal $ 100 000 $ 200 000
Platform $ 65 000 $ 100 000
Cybersecurity $ 40 000 $ 40 000
Marketing $ 40 000 $ 400 000
ICO development $ 55 000 $ 100 000
Total $ 340 000 $ 965 000
Source: Grace Zhai 2018, ICO Budgets: How much does it really cost to do an Initial Coin Offering?,
Medium.com, 07-12-2019, https://medium.com/blockchain-review/ico-budgets-how-much-does-it-really-
cost-to-do-an-initial-coin-offering-eb1031e8d893
Table 3: Cost estimate of reward-based crowdfunding campaign raising 54 000 USD
Platform fees (~5%) $ 2 700
Payment fees (~5%) $ 2 700
Marketing, video production, photography, etc. $ 25 000
Total $ 30 400
Source: Enventys Partners 2019, How Much Does It Cost to Run Crowdfunding Campaigns?,
enventyspartners.com, https://enventyspartners.com/blog/how-much-does-it-cost-to-run-a-crowdfunding-
campaign/
One look at the tables gives away the vast size differences between the funding
mechanisms. These differences are hardly surprising, as Belleflamme et al. (2014) estimate
the median amount an entrepreneur is looking to raise is 150 000 EUR, while the median
crowdfunding campaign raises only 6 500. One of the reasons why crowdfunding is not
attractive for big companies could be the 10% fee that has to be paid when using a
crowdfunding platform. As we can see in the tables, 10% is already not far off from what a
small IPO needs to pay in total costs. In fact, the same EY report estimates that the costs of
an IPO that raises between 500 million and 1 billion USD to be less than 8,5% of the
proceeds.
The costs between IPOs and ICOs look more comparable, with the caveat that the
estimations for an ICO might be the most variable of them all. Adding to that, there are some
extra costs that are not compulsory, but common and substantial enough to mention. For
instance, listing on a popular crypto exchange is prohibitively expensive, with prices ranging
between 1 to 3 million dollars (Autonomous.com, 2018), compared to an IPO listing fee of
about 125-300K USD (Euronext, 2019). Additionally, as most ICOs are funded with
7
cryptocurrency, a conversion fee (2-4%) (OECD, 2019) must be paid when costs are made
in fiat.
2.5 Signaling
When there is a high degree of information asymmetry between two parties, one side may
look for signals that tell them something about the true quality of the object that the other
party is offering. For signaling to be possible, the cost of a signal needs to be lower for high-
quality firms (Connelly, Certo, Ireland, & Reutzel, 2011) otherwise low-quality firms would
simply imitate the signal to achieve more funding.
ICOs (Ofir & Sadeh, 2019) and crowdfunding (Belleflamme, Lambert, &
Schwienbacher, 2014) are both characterized as having high degrees of information
asymmetry. This is due to the absence of reporting requirements, probably even more so
than the traditional IPOs. According to Ofir and Sadeh (2019), the main drivers of
information asymmetry in ICOs is threefold. Firstly, there are no standard disclosure
requirements or any other kind of standard. Secondly, the companies usually don´t have
much of a track record during the offering. Thirdly, the investors lack enough fundamental
technical knowledge to determine ICO quality.
Belleflame et al. (2014) looked specifically at information asymmetry coming from
the start-up knowing the product better than the investors. The result of their research was
that higher levels of when information asymmetry about the product increases startups are
more likely to get their funding through equity crowdfunding instead of reward-based
crowdfunding, as people who buy equity are more concerned with profitability than product
quality.
As for IPOs, underpricing has long been seen as a signal for quality. Arthurs et al.
(2009) found some results that the lock-up period might be a signal for quality. A longer
lock-up period would signal to the investors that management is in no hurry to sell the stock
on the market, thus making the stock more attractive as a long-term investment.
2.6 Underpricing
“Underpricing is estimated as the percentage difference between the price at which the IPO
shares were sold to investors (the offer price) and the price at which the shares subsequently
8
trade in the market” (Lljungqvist, 2007, p. 381). It has long been a topic of interest for
researchers, as at first glance the act of selling equity too cheap doesn’t make much sense
intuitively. This paper uses the terms underpricing, excess returns, and first-day returns
interchangeably.
The first research on underpricing has been done by Ritter (1987), who found that on
average IPOs were priced about 21% higher at the end of the first day of trading compared
to the offering price. The amount of underpricing varies over time. For instance, the
proceeds-weighed first-day average-return was about 18,4% in 2018 (Ritter, Initial Public
Offerings: Underpricing, 2018). Recent studies have also found underpricing to be common
in ICOs as well (Lyandres, Palazzo, & Rabetti, 2019).
Like ICOs and IPOs, pre-sale crowdfunding is often paired with offering things at a
discount. According to Tinn and Chemla (2019), companies will give a discount at the pre-
selling stage as the uncertainty about the ability to deliver is higher when the assumption is
made that consumers are rational.
All funding mechanisms have some rationale for underpricing to be present. Firstly,
companies seeking crowdfunding through Kickstarter need to raise a self-determined goal
within 60 days. If the amount is not raised within the time allotted, then the company receives
none of the pledged funding. Secondly, one of the main determinants of the value of a token
is the network size (Momtaz, 2018), which in turn is affected by the number of persons
buying into an ICO. Lastly, IPO underpricing has a multitude of reasons, some researchers
attribute it to information asymmetry between the investors and the issuer or between the
issuer and the underwriter (Rock, 1986). Others argue that IPO underpricing is intentional
(Baron, 1982), with managers underpricing stock to raise the price at lock up-expiration
(Rajesh, Aggarwala, Krigman, & Womack, 2002) or firms underpricing the stock to obtain
a higher price at a seasoned offering (Welch, 1989).
9
3. Problem description and List of Hypothesis
In the previous chapter, I’ve described some similarities in research done on IPOs, ICOs,
and crowdfunding. In this chapter, I formulate hypotheses related to signaling theory and
underpricing. All relationships hypothesized have been confirmed to exist at least once in
one of the funding mechanisms by previous research.
3.1 Signaling theory
I pose that there are some similarities between how receivers rate signalers. I try to capture
these similarities trough comparing signals that have been tested at least in one of the funding
mechanisms in previous research.
Only part of the equity(tokens) is sold in an IPO(ICO). The rest is kept by the signalers
to keep the benefits and/or to be sold at a later moment. From a receiver’s perspective, a
higher retention percentage of equity(tokens) by the venture might signal for quality. For
example, the signalers assure investors that they sell to fund the venture rather than selling
stock to cash out. Or conversely, a low retention rate might signal for low quality. Similar
findings have been reported in the past for IPOs (Sindelar, Ritter, & Roger, 1994) and ICOs
(Lyandres, Palazzo, & Rabetti, 2019). To test these relationships, I pose the following
hypothesis:
H1A. A higher retention percentage will be beneficial for the amount raised of ICOs and
IPOs.
The goal in crowdfunding might be seen as a proxy for the amount of effort a
company will put in the funding process. In crowdfunding, the company is highly penalized
for not reaching the funding goal (no funding received, but there are costs). Thus, a higher
goal implies the amount of trust a company has in its project. In ICOs we can see a similar
relationship between the amount of funding and the hard cap. Some ICOs pledge to give
back their funding to their investors when they don’t reach a certain funding goal (soft cap)
Furthermore Fish (2019) found that a higher funding goal was associated with a higher
amount raised. In concurrence with Fish, Lyandres et al. (2019) found that a higher funding
goal was correlated with a higher absolute and relative amount raised. Seeing as there are
similar forces on both mechanisms, I propose the following hypothesis:
10
H1B. A higher funding goal will be positively correlated with returns in crowdfunding and
ICOs
Most ICOs and crowdfunding projects have a period in which they offer their
product. A longer funding period allows for higher funding as it runs longer (Fisch, 2019)
Thus, a shorter funding period might indicate that a venture has faith in its product.
Furthermore, a shorter funding period has been found to signal for success in crowdfunding
(Mollick, 2013) and in ICOs (Fisch, 2019).
H1C. A longer funding period will have a negative effect on the amount raised through ICO
and crowdfunding.
3.2 Underpricing
In the literature review, we have seen that underpricing has historically been observed in
ICOs and IPOs and that there was significant oversubscription on crowdfunding.
A study by Kadlec & Edelen (2005) found a significant positive relationship between
the average return of IPOs completed 30 days earlier and the excess return of an IPO.
Ibbotson et al. (1994) found that hot markets might be explained by traders following a
momentum strategy, as monthly average returns and the monthly number of issues are
correlated. If such a strategy exists in ICOs and IPOs, then we might see some of the
underpricing being positively correlated with underpricing in the previous months
H2A. Excess returns and the number of listings are cyclical in both ICOs and IPOs.
Chowdry and Sherman (1995) found a link between the amount of underpricing and
the time between the pricing date and the first day of trading in IPOs. The authors reasoned
that this was due to a higher chance of information leakage if this time period was longer. In
addition, they assumed that, on average, underpricing would already be present as
uninformed investors have to be compensated (Rock, 1986). With this in mind, it is not a
stretch to assume that uninformed investors in ICOs need some degree of underpricing as
well to make investing attractive. Furthermore, I assume that the degree of underpricing is
modulated by the amount of time between the end of the ICO and the listing on an exchange
as seen in IPOs as well. This statement can be further formalized as:

11
H2B. The amount of underpricing in ICOs is positively correlated with the number of days
between the ICO and listing time.
Lastly, Ibbotson et al. (1994) found that smaller issues are commonly underpriced
more than larger issues. The rationale behind smaller issues being underpriced more is that
smaller firms are often younger than older firms and as a result, there is more uncertainty.
This relationship has been found previously in ICO research as well (von Eije & Heine,
2019). Thus, I pose my final hypothesis:
H2C. Smaller issues should see higher excess returns than larger IPO and ICO issues.
12
4. Methodology and Data collection
Like the previous part of the work, the part of the chapter where the methodology is
discussed is divided into the respective areas of research. The rationale for the chosen
dependent and independent variables can be found in this chapter. A description of the
control variables is available in the appendix (Table 12 & Table 13) In the second part of the
chapter I describe the data gathering process more in detail.
4.1 Signaling
Signaling theory has been applied in the past to funding mechanisms. For a signal to be
viable over a longer period of time it needs to have some cost and shouldn’t be easy to fake.
I chose signals that were used in previous studies done on IPO, ICO, and crowdfunding.
There are two prominent ways to test for the effect of signals on the success in
crowdfunding/ICO literature. The first way is to regress the signals on the success rate
(Kunz, Bretschneider, Erler, & Leimeister, 2017). The second method is to regress the
signals on the amount raised (Fisch, 2019). Data on the success rate of IPOs is particularly
hard to come by. Thus, I’ve chosen to go for the latter as this method makes it viable to
include IPO data into the models.
In the previous chapter I've stated that investors are looking for signals of quality. In this
part, I will elaborate on the signals I've used for the model. In line with previous research in
finance and ICOs (Fisch, 2019), the natural logarithm of the gross amount raised in US
dollars is used as the dependent variable for all three funding methods. Furthermore, I will
estimate the coefficients by doing an ordinary linear squares regression.
To test the hypotheses, I’ve added the following independent variables to the model:
Percentage offered: Calculated by dividing the shares offered by the shares outstanding for
the IPO. Percentage offered in ICO is given on index sites.
Goal: The hard cap values were denominated in fiat, cryptocurrency, and native tokens. All
amounts were converter to USD by taking the median exchange rate found for the duration
of the ICO.
Funding time: Crowdfunding the difference between the deadline and the launch date
13
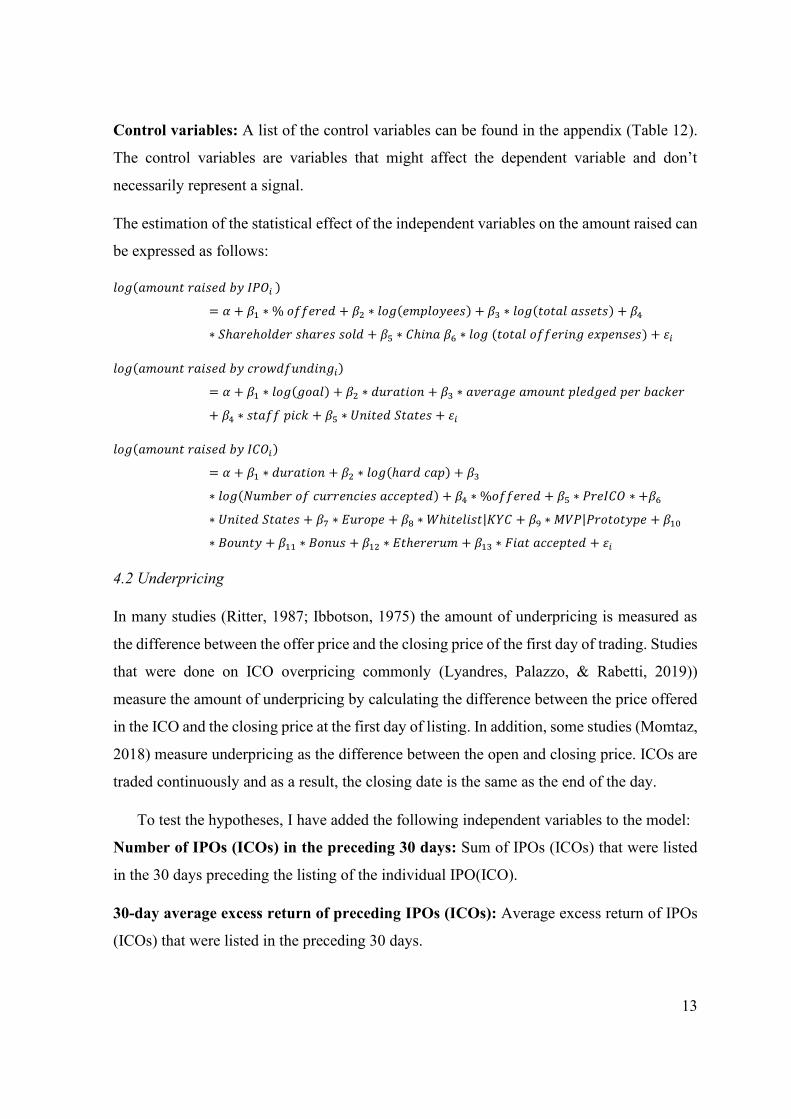
Control variables: A list of the control variables can be found in the appendix (Table 12).
The control variables are variables that might affect the dependent variable and don’t
necessarily represent a signal.
The estimation of the statistical effect of the independent variables on the amount raised can
be expressed as follows:
𝑙𝑜𝑔(𝑎𝑚𝑜𝑢𝑛𝑡 𝑟𝑎𝑖𝑠𝑒𝑑 𝑏𝑦 𝐼𝑃𝑂𝑖 )
= 𝛼 + 𝛽1 ∗ % 𝑜𝑓𝑓𝑒𝑟𝑒𝑑 + 𝛽2 ∗ 𝑙𝑜𝑔(𝑒𝑚𝑝𝑙𝑜𝑦𝑒𝑒𝑠) + 𝛽3 ∗ 𝑙𝑜𝑔(𝑡𝑜𝑡𝑎𝑙 𝑎𝑠𝑠𝑒𝑡𝑠) + 𝛽4
∗ 𝑆ℎ𝑎𝑟𝑒ℎ𝑜𝑙𝑑𝑒𝑟 𝑠ℎ𝑎𝑟𝑒𝑠 𝑠𝑜𝑙𝑑 + 𝛽5 ∗ 𝐶ℎ𝑖𝑛𝑎 𝛽6 ∗ 𝑙𝑜𝑔 (𝑡𝑜𝑡𝑎𝑙 𝑜𝑓𝑓𝑒𝑟𝑖𝑛𝑔 𝑒𝑥𝑝𝑒𝑛𝑠𝑒𝑠) + 𝜀𝑖
𝑙𝑜𝑔(𝑎𝑚𝑜𝑢𝑛𝑡 𝑟𝑎𝑖𝑠𝑒𝑑 𝑏𝑦 𝑐𝑟𝑜𝑤𝑑𝑓𝑢𝑛𝑑𝑖𝑛𝑔𝑖)
= 𝛼 + 𝛽1 ∗ 𝑙𝑜𝑔(𝑔𝑜𝑎𝑙) + 𝛽2 ∗ 𝑑𝑢𝑟𝑎𝑡𝑖𝑜𝑛 + 𝛽3 ∗ 𝑎𝑣𝑒𝑟𝑎𝑔𝑒 𝑎𝑚𝑜𝑢𝑛𝑡 𝑝𝑙𝑒𝑑𝑔𝑒𝑑 𝑝𝑒𝑟 𝑏𝑎𝑐𝑘𝑒𝑟
+ 𝛽4 ∗ 𝑠𝑡𝑎𝑓𝑓 𝑝𝑖𝑐𝑘 + 𝛽5 ∗ 𝑈𝑛𝑖𝑡𝑒𝑑 𝑆𝑡𝑎𝑡𝑒𝑠 + 𝜀𝑖
𝑙𝑜𝑔(𝑎𝑚𝑜𝑢𝑛𝑡 𝑟𝑎𝑖𝑠𝑒𝑑 𝑏𝑦 𝐼𝐶𝑂𝑖)
= 𝛼 + 𝛽1 ∗ 𝑑𝑢𝑟𝑎𝑡𝑖𝑜𝑛 + 𝛽2 ∗ 𝑙𝑜𝑔(ℎ𝑎𝑟𝑑 𝑐𝑎𝑝) + 𝛽3
∗ 𝑙𝑜𝑔(𝑁𝑢𝑚𝑏𝑒𝑟 𝑜𝑓 𝑐𝑢𝑟𝑟𝑒𝑛𝑐𝑖𝑒𝑠 𝑎𝑐𝑐𝑒𝑝𝑡𝑒𝑑) + 𝛽4 ∗ %𝑜𝑓𝑓𝑒𝑟𝑒𝑑 + 𝛽5 ∗ 𝑃𝑟𝑒𝐼𝐶𝑂 ∗ +𝛽6
∗ 𝑈𝑛𝑖𝑡𝑒𝑑 𝑆𝑡𝑎𝑡𝑒𝑠 + 𝛽7 ∗ 𝐸𝑢𝑟𝑜𝑝𝑒 + 𝛽8 ∗ 𝑊ℎ𝑖𝑡𝑒𝑙𝑖𝑠𝑡|𝐾𝑌𝐶 + 𝛽9 ∗ 𝑀𝑉𝑃|𝑃𝑟𝑜𝑡𝑜𝑡𝑦𝑝𝑒 + 𝛽10
∗ 𝐵𝑜𝑢𝑛𝑡𝑦 + 𝛽11 ∗ 𝐵𝑜𝑛𝑢𝑠 + 𝛽12 ∗ 𝐸𝑡ℎ𝑒𝑟𝑒𝑟𝑢𝑚 + 𝛽13 ∗ 𝐹𝑖𝑎𝑡 𝑎𝑐𝑐𝑒𝑝𝑡𝑒𝑑 + 𝜀𝑖
4.2 Underpricing
In many studies (Ritter, 1987; Ibbotson, 1975) the amount of underpricing is measured as
the difference between the offer price and the closing price of the first day of trading. Studies
that were done on ICO overpricing commonly (Lyandres, Palazzo, & Rabetti, 2019))
measure the amount of underpricing by calculating the difference between the price offered
in the ICO and the closing price at the first day of listing. In addition, some studies (Momtaz,
2018) measure underpricing as the difference between the open and closing price. ICOs are
traded continuously and as a result, the closing date is the same as the end of the day.
To test the hypotheses, I have added the following independent variables to the model:
Number of IPOs (ICOs) in the preceding 30 days: Sum of IPOs (ICOs) that were listed
in the 30 days preceding the listing of the individual IPO(ICO).
30-day average excess return of preceding IPOs (ICOs): Average excess return of IPOs
(ICOs) that were listed in the preceding 30 days.
14
Days between the ICO and listing time: Time in days between the end of the ICO and the
first day an ICO is listed on an exchange.
Amount raised (log): This is the same variable used as a dependent variable in the signaling
model.
Control variables: A list of the control variables can be found in the appendix (Table 13).
The control variables are variables that might affect the dependent variable and don’t
necessarily represent a signal.
The estimation of the statistical effect of the independent variables on the excess return can
be expressed as follows:
𝐸𝑥𝑐𝑒𝑠𝑠 𝑟𝑒𝑡𝑢𝑟𝑛 𝑜𝑓 𝐼𝑃𝑂𝑖
= 𝛼 + 𝛽1 ∗ 𝑁𝑢𝑚𝑏𝑒𝑟 𝑜𝑓 𝐼𝑃𝑂𝑠 𝑝𝑟𝑒𝑐𝑒𝑑𝑖𝑛𝑔 30 𝑑𝑎𝑦𝑠 + 𝛽2
∗ 𝑈𝑛𝑑𝑒𝑟𝑝𝑟𝑖𝑐𝑖𝑛𝑔 𝑜𝑓 𝑝𝑟𝑒𝑐𝑒𝑑𝑖𝑛𝑔 𝐼𝑃𝑂𝑠 (30 𝑑𝑎𝑦𝑠) + 𝛽3 ∗ log(𝑎𝑚𝑜𝑢𝑛𝑡 𝑟𝑎𝑖𝑠𝑒𝑑) + 𝛽4
∗ log(𝑒𝑚𝑝𝑙𝑜𝑦𝑒𝑒𝑠) + 𝛽5 ∗ % offered + 𝛽6 ∗ log(𝑣𝑜𝑙𝑢𝑚𝑒) + 𝛽7 ∗ 𝐶ℎ𝑖𝑛𝑎 + 𝛽8
∗ 𝑠ℎ𝑎𝑟𝑒ℎ𝑜𝑙𝑑𝑒𝑟 𝑠ℎ𝑎𝑟𝑒𝑠 𝑜𝑓𝑓𝑒𝑟𝑒𝑑+𝜀𝑖
𝐸𝑥𝑐𝑒𝑠𝑠 𝑟𝑒𝑡𝑢𝑟𝑛 𝑜𝑓 𝐼𝐶𝑂𝑖
= 𝛼 + 𝛽1 ∗ ICOs preceding 30 days + 𝛽2 ∗ Underpricing of preceding ICOs (30 day)
+ 𝛽3 ∗ Days between ICO − Notation + 𝛽4 ∗ log (Amount raised ) + 𝛽5
∗ log (BTC price at listing) + 𝛽6 ∗ Ethereum + 𝛽7 ∗ US + 𝛽8 ∗ Europe + 𝛽9
∗ Whitelist/KYC + 𝛽10 ∗ Fiat accepted +𝜀𝑖
4.3 Data Collection
To be able to compare the funding mechanisms somewhat, the full dataset had to have the
same starting- and endpoint for all funding mechanisms researched. The starting point of
April 2017 was easy to determine, as ICOs were quite rare before 2017. There was no up-
to-date database available and thus the data was collected manually. No data on funding
projects ending after September 2019 was collected. The data was gathered from September
2019 until January 2020.
4.3.1 IPO Dataset
Data on 640 IPOs was gathered from the NASDAQ IPO calendar. The sample consists of
best effort and firm commitment offers. The data was scraped by indexing the IPO calendar
and subsequently query the NASDAQ API. Thereafter, I have pulled pricing data using the
15
symbol and date of pricing obtained in the previous step. As not every IPO had data on every
variable the dataset had to be shrunk to 575 observations for the signaling model. I was able
to match 493 IPOs with pricing data for the underpricing model.
4.3.2 Crowdfunding dataset
The website webrobots.io serves scrapes from the Kickstarter and Indiegogo websites. It
took some trial and error to parse the data correctly as the data strings were longer than the
maximum string size of an excel cell. During this process, it came to light that the data from
Indiegogo wasn`t usable due to the success identifier missing. The full process is described
more detailed in appendix III. The full dataset contained 88586 crowdfunding projects. I had
16499 observations left after removing duplicates, ongoing projects, old projects, projects
denominated in other currencies, and projects that had a goal under 5.000 USD.
4.3.3 ICO dataset
The data has been collected from icobench.com as it is considered one of the leading sources
for ICO information (Lyandres, Palazzo, & Rabetti, 2019). At first, a list of 5595 ICOs was
created by scraping the names and links to individual pages of ICOs with a google chrome
extension (Webrobots.io, 2019). The data collection process from icobench.com is described
more in detail in appendix (III). Missing ICO dates, token price and the number of offered
tokens were supplanted with data from Trackico.com
Pricing data on 4044 crypto tokens was obtained via the Coinpaprika API and
thereafter imported into excel with the power query add-in. Due to a limited number of
matches, I have pulled data on the closing price from coingecko.com as well. The ICOs were
matched by using their website as an identifier. Firstly, I stripped the addresses gathered
from ICObench down to their name + domain name and subsequently searched the websites
in the other datasets with wildcards for the start and end of the string. About 75 percent of
the pricing data is from Coinpaprika, and 25 percent originates from Coingecko.
4.2.3 Data Quality
The data from crowdfunding and IPOs is only from companies that have chosen to use an
intermediary. The use of a dataset consisting of only using ICOs that made use of an

16
intermediary (IEO) was considered, but IEOs only started to become popular since early
2019 (MPCX Platform, 2019) and thus would have shrunk the dataset considerably
17
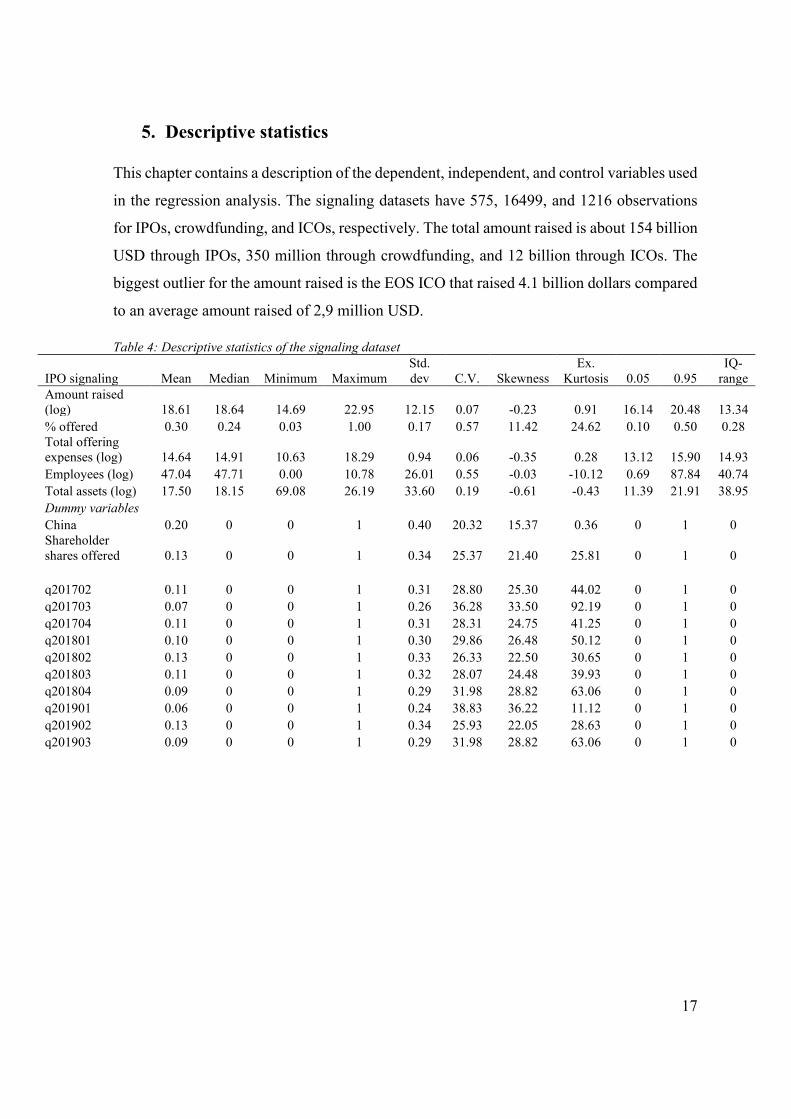
5. Descriptive statistics
This chapter contains a description of the dependent, independent, and control variables used
in the regression analysis. The signaling datasets have 575, 16499, and 1216 observations
for IPOs, crowdfunding, and ICOs, respectively. The total amount raised is about 154 billion
USD through IPOs, 350 million through crowdfunding, and 12 billion through ICOs. The
biggest outlier for the amount raised is the EOS ICO that raised 4.1 billion dollars compared
to an average amount raised of 2,9 million USD.
Table 4: Descriptive statistics of the signaling dataset
IPO signaling Mean Median Minimum Maximum
Std.
dev C.V. Skewness
Ex.
Kurtosis 0.05 0.95
IQ-
range
Amount raised
(log) 18.61 18.64 14.69 22.95 12.15 0.07 -0.23 0.91 16.14 20.48 13.34
% offered 0.30 0.24 0.03 1.00 0.17 0.57 11.42 24.62 0.10 0.50 0.28
Total offering
expenses (log) 14.64 14.91 10.63 18.29 0.94 0.06 -0.35 0.28 13.12 15.90 14.93
Employees (log) 47.04 47.71 0.00 10.78 26.01 0.55 -0.03 -10.12 0.69 87.84 40.74
Total assets (log) 17.50 18.15 69.08 26.19 33.60 0.19 -0.61 -0.43 11.39 21.91 38.95
Dummy variables China 0.20 0 0 1 0.40 20.32 15.37 0.36 0 1 0
Shareholder
shares offered 0.13 0 0 1 0.34 25.37 21.40 25.81 0 1 0
q201702 0.11 0 0 1 0.31 28.80 25.30 44.02 0 1 0
q201703 0.07 0 0 1 0.26 36.28 33.50 92.19 0 1 0
q201704 0.11 0 0 1 0.31 28.31 24.75 41.25 0 1 0
q201801 0.10 0 0 1 0.30 29.86 26.48 50.12 0 1 0
q201802 0.13 0 0 1 0.33 26.33 22.50 30.65 0 1 0
q201803 0.11 0 0 1 0.32 28.07 24.48 39.93 0 1 0
q201804 0.09 0 0 1 0.29 31.98 28.82 63.06 0 1 0
q201901 0.06 0 0 1 0.24 38.83 36.22 11.12 0 1 0
q201902 0.13 0 0 1 0.34 25.93 22.05 28.63 0 1 0
q201903 0.09 0 0 1 0.29 31.98 28.82 63.06 0 1 0
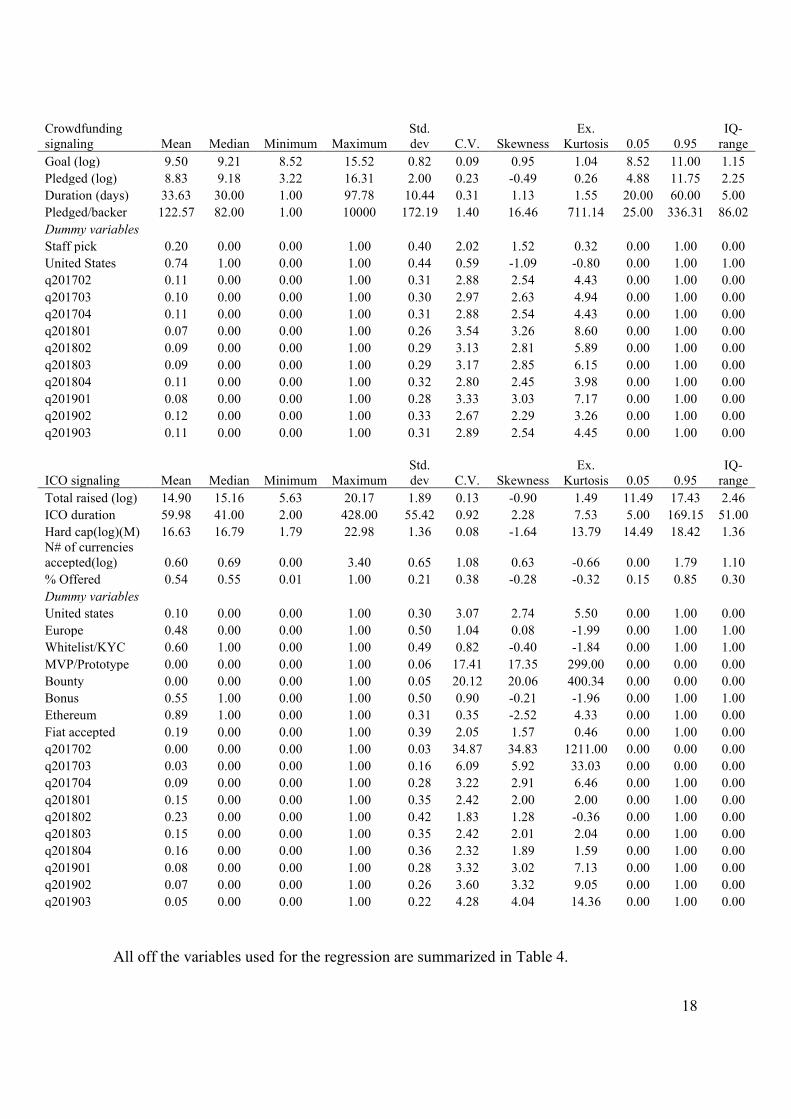
18
Crowdfunding
signaling Mean Median Minimum Maximum
Std.
dev C.V. Skewness
Ex.
Kurtosis 0.05 0.95
IQ-
range
Goal (log) 9.50 9.21 8.52 15.52 0.82 0.09 0.95 1.04 8.52 11.00 1.15
Pledged (log) 8.83 9.18 3.22 16.31 2.00 0.23 -0.49 0.26 4.88 11.75 2.25
Duration (days) 33.63 30.00 1.00 97.78 10.44 0.31 1.13 1.55 20.00 60.00 5.00
Pledged/backer 122.57 82.00 1.00 10000 172.19 1.40 16.46 711.14 25.00 336.31 86.02
Dummy variables Staff pick 0.20 0.00 0.00 1.00 0.40 2.02 1.52 0.32 0.00 1.00 0.00
United States 0.74 1.00 0.00 1.00 0.44 0.59 -1.09 -0.80 0.00 1.00 1.00
q201702 0.11 0.00 0.00 1.00 0.31 2.88 2.54 4.43 0.00 1.00 0.00
q201703 0.10 0.00 0.00 1.00 0.30 2.97 2.63 4.94 0.00 1.00 0.00
q201704 0.11 0.00 0.00 1.00 0.31 2.88 2.54 4.43 0.00 1.00 0.00
q201801 0.07 0.00 0.00 1.00 0.26 3.54 3.26 8.60 0.00 1.00 0.00
q201802 0.09 0.00 0.00 1.00 0.29 3.13 2.81 5.89 0.00 1.00 0.00
q201803 0.09 0.00 0.00 1.00 0.29 3.17 2.85 6.15 0.00 1.00 0.00
q201804 0.11 0.00 0.00 1.00 0.32 2.80 2.45 3.98 0.00 1.00 0.00
q201901 0.08 0.00 0.00 1.00 0.28 3.33 3.03 7.17 0.00 1.00 0.00
q201902 0.12 0.00 0.00 1.00 0.33 2.67 2.29 3.26 0.00 1.00 0.00
q201903 0.11 0.00 0.00 1.00 0.31 2.89 2.54 4.45 0.00 1.00 0.00
ICO signaling Mean Median Minimum Maximum
Std.
dev C.V. Skewness
Ex.
Kurtosis 0.05 0.95
IQ-
range
Total raised (log) 14.90 15.16 5.63 20.17 1.89 0.13 -0.90 1.49 11.49 17.43 2.46
ICO duration 59.98 41.00 2.00 428.00 55.42 0.92 2.28 7.53 5.00 169.15 51.00
Hard cap(log)(M) 16.63 16.79 1.79 22.98 1.36 0.08 -1.64 13.79 14.49 18.42 1.36
N# of currencies
accepted(log) 0.60 0.69 0.00 3.40 0.65 1.08 0.63 -0.66 0.00 1.79 1.10
% Offered 0.54 0.55 0.01 1.00 0.21 0.38 -0.28 -0.32 0.15 0.85 0.30
Dummy variables United states 0.10 0.00 0.00 1.00 0.30 3.07 2.74 5.50 0.00 1.00 0.00
Europe 0.48 0.00 0.00 1.00 0.50 1.04 0.08 -1.99 0.00 1.00 1.00
Whitelist/KYC 0.60 1.00 0.00 1.00 0.49 0.82 -0.40 -1.84 0.00 1.00 1.00
MVP/Prototype 0.00 0.00 0.00 1.00 0.06 17.41 17.35 299.00 0.00 0.00 0.00
Bounty 0.00 0.00 0.00 1.00 0.05 20.12 20.06 400.34 0.00 0.00 0.00
Bonus 0.55 1.00 0.00 1.00 0.50 0.90 -0.21 -1.96 0.00 1.00 1.00
Ethereum 0.89 1.00 0.00 1.00 0.31 0.35 -2.52 4.33 0.00 1.00 0.00
Fiat accepted 0.19 0.00 0.00 1.00 0.39 2.05 1.57 0.46 0.00 1.00 0.00
q201702 0.00 0.00 0.00 1.00 0.03 34.87 34.83 1211.00 0.00 0.00 0.00
q201703 0.03 0.00 0.00 1.00 0.16 6.09 5.92 33.03 0.00 0.00 0.00
q201704 0.09 0.00 0.00 1.00 0.28 3.22 2.91 6.46 0.00 1.00 0.00
q201801 0.15 0.00 0.00 1.00 0.35 2.42 2.00 2.00 0.00 1.00 0.00
q201802 0.23 0.00 0.00 1.00 0.42 1.83 1.28 -0.36 0.00 1.00 0.00
q201803 0.15 0.00 0.00 1.00 0.35 2.42 2.01 2.04 0.00 1.00 0.00
q201804 0.16 0.00 0.00 1.00 0.36 2.32 1.89 1.59 0.00 1.00 0.00
q201901 0.08 0.00 0.00 1.00 0.28 3.32 3.02 7.13 0.00 1.00 0.00
q201902 0.07 0.00 0.00 1.00 0.26 3.60 3.32 9.05 0.00 1.00 0.00
q201903 0.05 0.00 0.00 1.00 0.22 4.28 4.04 14.36 0.00 1.00 0.00
All off the variables used for the regression are summarized in Table 4.
19
Interestingly, the average running period of an ICO is almost twice as long as the
funding period of a crowdfunding project. Suggesting that the duration effect is stronger in
crowdfunding projects than in ICOs.
A high percentage of ICOs is Ethereum based. This is in line with my expectations,
as its arguably the easiest platform to launch a token on.
On average ICOs issued 54% of their tokens, while IPOs only sold 30% of their
shares on average. Furthermore, we can see that the amount of observations is fairly stable
in IPOs and Crowdfunding when compared with ICOs that almost have a quarter of
observations in the second quarter of 2018.
The dataset for crowdfunding has a higher success rate on average than the all-time
average. This is probably due to the method of data collecting. The crawler used to collect
the data would only register active and successfully completed projects as failed projects
don’t show up in Kickstarter search results. The average funding time of 32 days is expected
as a funding time of around 30 days is recommended by the crowdfunding platform used
(Kickstarter, 2011).
Table 5:Descriptive statistics of the underpricing dataset
IPO underpricing Mean Median Minimum Maximum
Std.
dev C.V. Skewness
Ex.
Kurtosis 0.05 0.95
IQ
range
Excess returns 0.25 0.04 -0.58 20.20 1.34 5.29 11.55 143.87 -0.18 0.71 0.27
IPOs preceding 30
days 20.29 20 3.00 39.00 8.03 0.40 0.09 -0.78 7.00 33.00 13.00
Underpricing of
preceding IPOs(30
days) 0.27 0.18 -0.07 2.39 0.36 1.33 3.28 11.47 -0.01 1.19 0.14
Amount raised(log) 14.78 14.98 12.42 18.29 0.88 0.06 -0.29 -0.03 13.22 15.98 1.30
Employees(log) 5.06 5.09 0 10.78 2.43 0.48 -0.12 -0.77 0.69 8.93 3.47
% Offered -1.11 -1.29 -3.43 0 0.80 0.72 -0.02 -1.01 -2.31 0 1.47
Volume(log) 14.87 14.96 7.13 19.04 1.57 0.11 -0.76 1.89 12.05 17.30 1.77
Dummy variables
China 0.21 0 0 1 0.41 1.92 1.40 -0.04 0 1 0
20
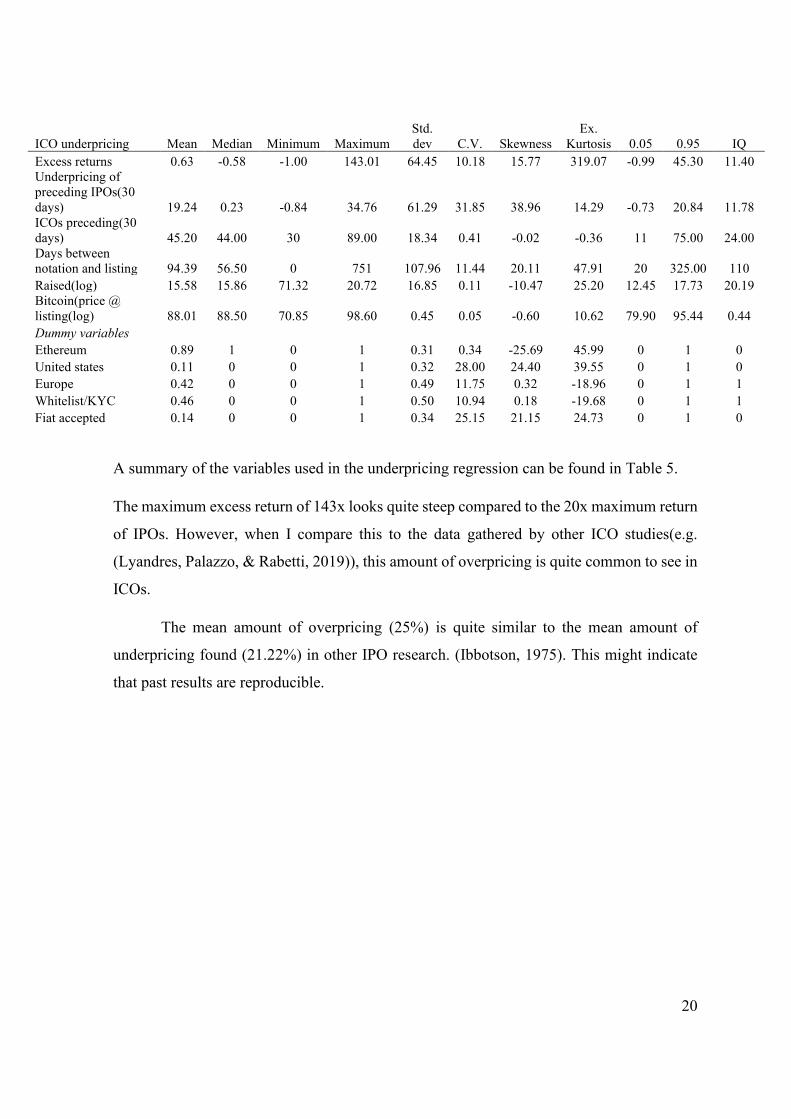
ICO underpricing Mean Median Minimum Maximum
Std.
dev C.V. Skewness
Ex.
Kurtosis 0.05 0.95 IQ
Excess returns 0.63 -0.58 -1.00 143.01 64.45 10.18 15.77 319.07 -0.99 45.30 11.40
Underpricing of
preceding IPOs(30
days) 19.24 0.23 -0.84 34.76 61.29 31.85 38.96 14.29 -0.73 20.84 11.78
ICOs preceding(30
days) 45.20 44.00 30 89.00 18.34 0.41 -0.02 -0.36 11 75.00 24.00
Days between
notation and listing 94.39 56.50 0 751 107.96 11.44 20.11 47.91 20 325.00 110
Raised(log) 15.58 15.86 71.32 20.72 16.85 0.11 -10.47 25.20 12.45 17.73 20.19
Bitcoin(price @
listing(log) 88.01 88.50 70.85 98.60 0.45 0.05 -0.60 10.62 79.90 95.44 0.44
Dummy variables
Ethereum 0.89 1 0 1 0.31 0.34 -25.69 45.99 0 1 0
United states 0.11 0 0 1 0.32 28.00 24.40 39.55 0 1 0
Europe 0.42 0 0 1 0.49 11.75 0.32 -18.96 0 1 1
Whitelist/KYC 0.46 0 0 1 0.50 10.94 0.18 -19.68 0 1 1
Fiat accepted 0.14 0 0 1 0.34 25.15 21.15 24.73 0 1 0
A summary of the variables used in the underpricing regression can be found in Table 5.
The maximum excess return of 143x looks quite steep compared to the 20x maximum return
of IPOs. However, when I compare this to the data gathered by other ICO studies(e.g.
(Lyandres, Palazzo, & Rabetti, 2019)), this amount of overpricing is quite common to see in
ICOs.
The mean amount of overpricing (25%) is quite similar to the mean amount of
underpricing found (21.22%) in other IPO research. (Ibbotson, 1975). This might indicate
that past results are reproducible.
21
6. Results
At the start of this part, I display the results of some tests for heteroskedasticity. Thereafter
the results of the main regression are discussed. Finally, I test for collinearity between the
variables and display some further tests.
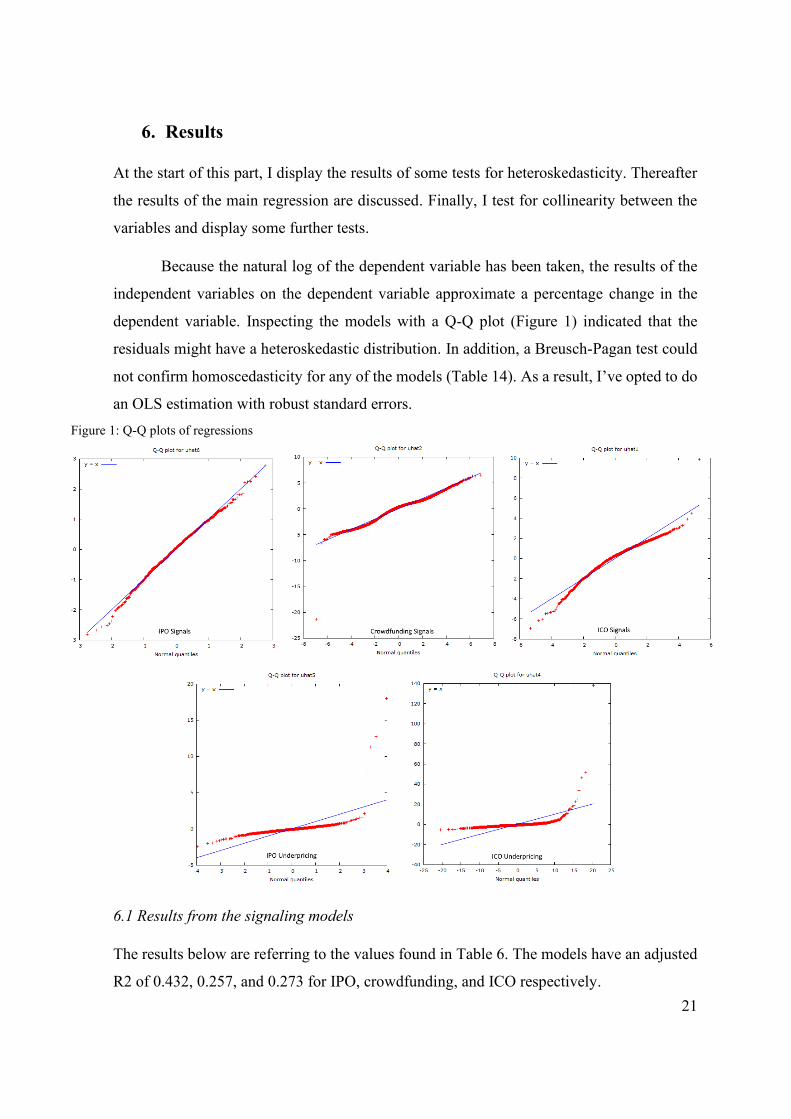
Because the natural log of the dependent variable has been taken, the results of the
independent variables on the dependent variable approximate a percentage change in the
dependent variable. Inspecting the models with a Q-Q plot (Figure 1) indicated that the
residuals might have a heteroskedastic distribution. In addition, a Breusch-Pagan test could
not confirm homoscedasticity for any of the models (Table 14). As a result, I’ve opted to do
an OLS estimation with robust standard errors.
6.1 Results from the signaling models
The results below are referring to the values found in Table 6. The models have an adjusted
R2 of 0.432, 0.257, and 0.273 for IPO, crowdfunding, and ICO respectively.
Figure 1: Q-Q plots of regressions
22
In both the IPO and ICO a higher offering percentage is significantly(P<0.01) related
to the amount raised. Curiously, I find a negative relation between the percentage offered
and the amount raised for ICOs, while I find the inverse relation for IPOs. Therefore, there
doesn’t seem to be much proof of hypothesis H1A.
A higher hard cap was significantly (P<0.01) correlated with a higher funding
amount. In concurrence with that result, a bigger goal has a positive (P<0.01) effect on the
amount raised through crowdfunding. Thus, both results are in line with hypothesis H1B
A longer funding period was significantly (P<0.01) negatively correlated with the
amount raised in both crowdfunding and ICOs. These results are in line with my expectations
stated in hypothesis H1C.
6.1.2 Control variables of the signaling models.
The following results pertain to the control variables found in the signaling model(Table 6).
All results below are significant to the 5% level unless stated otherwise.
The offering expense of IPOs is highly positively correlated with the amount raised,
which is slightly surprising when considering the expected variability when expressed as a
percentage of offering size. In addition, the total asset size is slightly negatively correlated
with the amount raised.
Projects that raised money through crowdfunding raised a higher amount when they
were highlighted. The amount pledged per backer had the same effect, albeit much weaker.
The amount raised by ICOs was negatively correlated with the Europe location
dummy, but positively correlated with the Whitelist/KYC dummy. In addition, ICOs with a
bonus scheme performed worse than ICOs without (P<0.10). Finally, the median bitcoin
price does have a strong correlation with the amount raised in ICOs as expected.
The last time dummy variable has been dropped due to collinearity. Thus, the
coefficients of the time dummies can be interpreted as relative to the dropped time dummy.
Interestingly the highest amount of observed ICOs in a quarter(Q201802) succeeded the
quarter where the time dummy of ICOs had the highest value(Q201801).
23
Table 6: Regression results of signals on the amount raised
Initial Public Offering Crowdfunding Initial Coin Offering
Dep. Var:
Amount
raised(log) Coeff. SE
Dep. Var:
Amount
raised(log) Coeff. SE
Dep. Var:
Amount raised(log) Coeff. SE
% Offered 2.312 0.255 *** Goal(log) 0.609 0.027 *** ICO duration(days) -0.002 0.001 **
Total offering
expenses (log) 0.958 0.074 *** Duration(days) -0.025 0.002 ***
Number of currencies
accepted(log) 0.193 0.087 **
Employees(log) 0.039 0.033 Pledged/backer 0.002 0.000 *** Hard cap(M)(Log) 0.585 0.084 ***
Total
assets(log) -0.126 0.028 *** United States 0.037 0.030 % Offered -0.996 0.246 ***
China(dummy) -0.655 0.100 *** Staff pick 1.413 0.026 *** Median BTC price(log) 0.463 0.241 *
Shareholder
shares
sold(dummy) 0.462 0.119 ***
Constant 3.712 0.219 *** US(dummy) -0.041 0.168
Constant 6.219 0.905 *** Europe(dummy) -0.350 0.104 ***
Whitelist(dummy) 0.260 0.115 **
MVP/Prototype(dummy) -1.214 0.596 **
Bounty(dummy) -4.385 1.675 ***
Bonus(dummy) -0.276 0.095 ***
Ethereum(dummy) -0.027 0.152
Fiat accepted(dummy) -0.135 0.143
Constant 1.365 2.519
q201702 -0.404 0.167 ** q201702 -0.693 0.059 *** q201702 -1.680 0.755 **
q201703 -0.389 0.187 ** q201703 -0.746 0.060 *** q201703 0.982 0.486 **
q201704 -0.247 0.163 q201704 -0.751 0.059 *** q201704 0.693 0.279 **
q201801 -0.157 0.168 q201801 -0.817 0.067 *** q201801 1.179 0.232 ***
q201802 -0.318 0.159 ** q201802 -0.528 0.060 *** q201802 0.373 0.206 *
q201803 -0.351 0.163 ** q201803 -0.535 0.060 *** q201803 0.430 0.224 *
q201804 -0.282 0.172 q201804 -0.189 0.057 *** q201804 0.203 0.244
q201901 -0.202 0.190 q201901 -0.005 0.063 q201901 0.506 0.314
q201902 -0.214 0.158 q201902 0.064 0.056 q201902 0.101 0.302
N 575 16499 1216
R2 (Adjusted) 0.432 0.257 0.273
Notes: * P < 0.10, ** P < 0.05, *** P < 0.01, All models have robust standard errors
6.2 Results from the models regarding underpricing
The adjusted R2 of the models is 0.101 and 0.013 for the IPO and ICO models respectively.
In this paragraph, I describe the results found in Table 8.
The number of ICOs in the preceding months is negatively correlated (P<0,05) with
the excess return, though I don’t find any other significant results regarding the other
variables relevant to hypothesis H2A. As such, there seems to be not much proof for
hypothesis H2A. I’ve calculated the Pearson correlation to see there is any persistence in
underpricing in the sample at all(Table 6, Table 7). In the IPO sample, there seems to be no
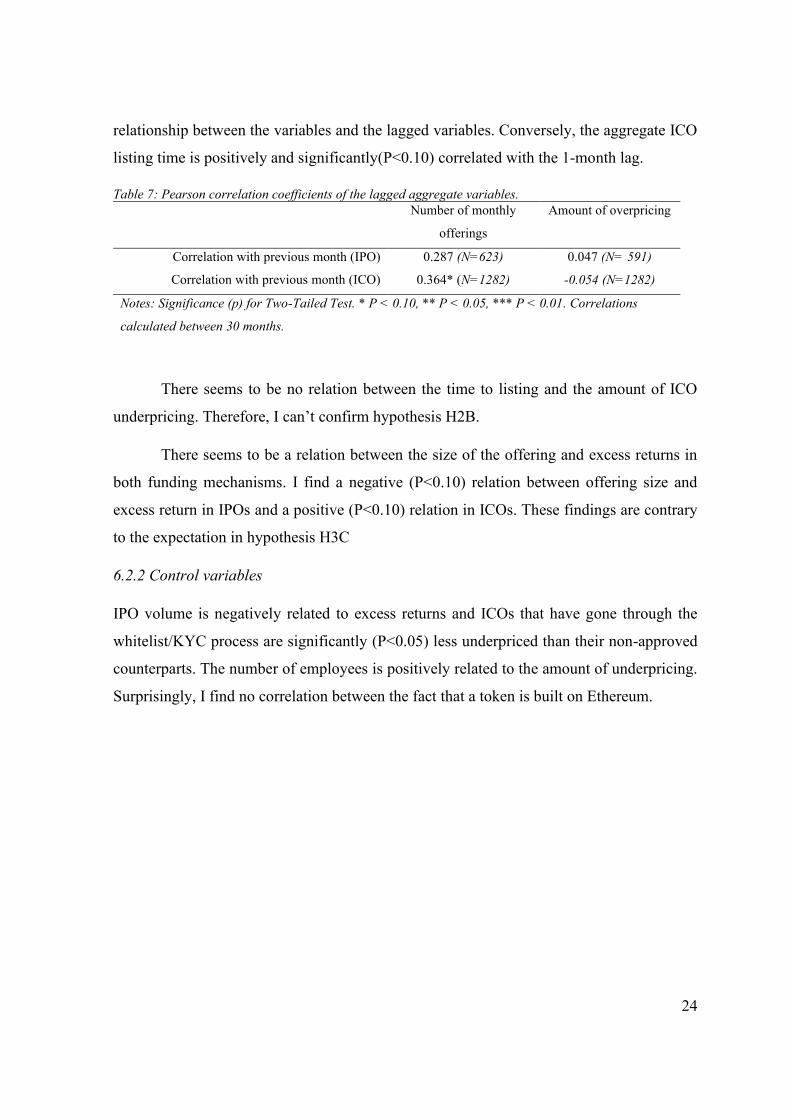
24
relationship between the variables and the lagged variables. Conversely, the aggregate ICO
listing time is positively and significantly(P<0.10) correlated with the 1-month lag.
Table 7: Pearson correlation coefficients of the lagged aggregate variables. Number of monthly
offerings
Amount of overpricing
Correlation with previous month (IPO) 0.287 (N=623) 0.047 (N= 591)
Correlation with previous month (ICO) 0.364* (N=1282) -0.054 (N=1282)
Notes: Significance (p) for Two-Tailed Test. * P < 0.10, ** P < 0.05, *** P < 0.01. Correlations
calculated between 30 months.
There seems to be no relation between the time to listing and the amount of ICO
underpricing. Therefore, I can’t confirm hypothesis H2B.
There seems to be a relation between the size of the offering and excess returns in
both funding mechanisms. I find a negative (P<0.10) relation between offering size and
excess return in IPOs and a positive (P<0.10) relation in ICOs. These findings are contrary
to the expectation in hypothesis H3C
6.2.2 Control variables
IPO volume is negatively related to excess returns and ICOs that have gone through the
whitelist/KYC process are significantly (P<0.05) less underpriced than their non-approved
counterparts. The number of employees is positively related to the amount of underpricing.
Surprisingly, I find no correlation between the fact that a token is built on Ethereum.
25
Table 8: Regression results of underpricing
Initial Public offering Initial Coin Offering
Dep, Var: Excess
returns(percent)
Coeff. SE
Dep, Var: Excess
returns(percent)
Coeff. SE
IPOs preceding 30 days 0.006 0.009 ICOs preceding 30 days -0.018 0.009 **
Underpricing of preceding
IPOs (30 day) -0.014 0.092
Underpricing of preceding ICOs
(30 day)
0.044 0.032
Amount raised (log) 0.252 0.157 Days between ICO-Listing 0.007 0.008
Employees (log) 0.158 0.070 ** Amount raised (log) -0.147 0.086 *
% Offered 0.511 0.305 * BTC price at listing (log) 0.411 0.706
China (dummy) -0.370 0.239 Ethereum (dummy) -0.205 0.826
Volume (log) -0.494 0.273 * US (dummy) 0.224 0.378
Constant 1.879 1.176 Europe (dummy) 0.117 0.432
Whitelist/KYC (dummy) -0.933 0.471 **
Fiat accepted (dummy) 0.319 0.539
Constant -0.097 5.445
N 493
768
R2(Adjusted) 0.101
0.013
Notes: * P < 0.10, ** P < 0.05, *** P < 0.01, All models have robust standard errors
6.3 Collinearity
When doing a multivariate regression, the OLS estimator assumes that the independent
variables don’t have a high degree of collinearity. If this assumption proves to be false, then
the estimation of the coefficients becomes less precise and the P-value tends to be unreliable.
The amount of collinearity was tested by computing the variance inflation factors(Table 15
and Table 16) All variables were tested to have a variance inflation factor smaller than 10.
6.4 Further tests
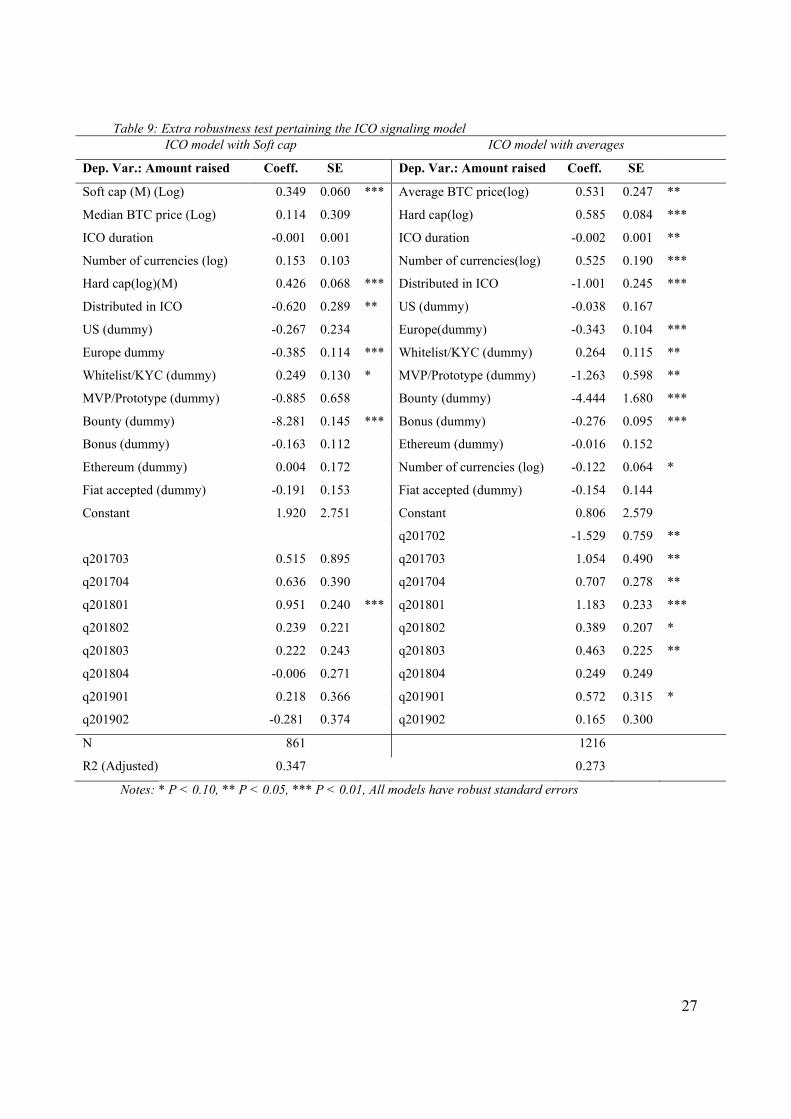
I’ve used the hard cap in the ICO model to assess the funding goal of the ICO. However, a
case could be made for testing the funding goal with the hard cap. The soft cap might act
more alike the funding goal in Crowdfunding, as failure to reach the funding goal should, in
theory, prevent the company doing the ICO from collecting the proceeds. The regression
with the soft cap added instead of the hard cap (Table 9) shows that the effects of the soft
26
and hard cap are quite similar in effect size and significance (P<0.01). In this model the
bounty dummy and bitcoin price during funding lose significance. Though this might be due
to the smaller sample size (N=768) compared to the full model (N=1216).
When calculating the bitcoin price and the ICO hard cap the median price has been
used to transform the values in USD. I assumed that the median would be a better number
to represent the value of bitcoin during the funding period as the median is less dependent
on extreme values. However, I would be cutting out information if investors react stronger
to these extreme values. Therefore, I’ve estimated the ICO signaling model again (Table 7),
with this time the conversions to USD dollar done by taking the average value at the time of
funding.
27
Table 9: Extra robustness test pertaining the ICO signaling model
ICO model with Soft cap ICO model with averages
Dep. Var.: Amount raised Coeff. SE
Dep. Var.: Amount raised Coeff. SE
Soft cap (M) (Log) 0.349 0.060 *** Average BTC price(log) 0.531 0.247 **
Median BTC price (Log) 0.114 0.309
Hard cap(log) 0.585 0.084 ***
ICO duration -0.001 0.001
ICO duration -0.002 0.001 **
Number of currencies (log) 0.153 0.103
Number of currencies(log) 0.525 0.190 ***
Hard cap(log)(M) 0.426 0.068 *** Distributed in ICO -1.001 0.245 ***
Distributed in ICO -0.620 0.289 ** US (dummy) -0.038 0.167
US (dummy) -0.267 0.234
Europe(dummy) -0.343 0.104 ***
Europe dummy -0.385 0.114 *** Whitelist/KYC (dummy) 0.264 0.115 **
Whitelist/KYC (dummy) 0.249 0.130 * MVP/Prototype (dummy) -1.263 0.598 **
MVP/Prototype (dummy) -0.885 0.658
Bounty (dummy) -4.444 1.680 ***
Bounty (dummy) -8.281 0.145 *** Bonus (dummy) -0.276 0.095 ***
Bonus (dummy) -0.163 0.112
Ethereum (dummy) -0.016 0.152
Ethereum (dummy) 0.004 0.172
Number of currencies (log) -0.122 0.064 *
Fiat accepted (dummy) -0.191 0.153
Fiat accepted (dummy) -0.154 0.144
Constant 1.920 2.751
Constant 0.806 2.579
q201702 -1.529 0.759 **
q201703 0.515 0.895 q201703 1.054 0.490 **
q201704 0.636 0.390 q201704 0.707 0.278 **
q201801 0.951 0.240 *** q201801 1.183 0.233 ***
q201802 0.239 0.221 q201802 0.389 0.207 *
q201803 0.222 0.243 q201803 0.463 0.225 **
q201804 -0.006 0.271 q201804 0.249 0.249
q201901 0.218 0.366 q201901 0.572 0.315 *
q201902 -0.281 0.374
q201902 0.165 0.300
N 861
1216
R2 (Adjusted) 0.347
0.273
Notes: * P < 0.10, ** P < 0.05, *** P < 0.01, All models have robust standard errors
28
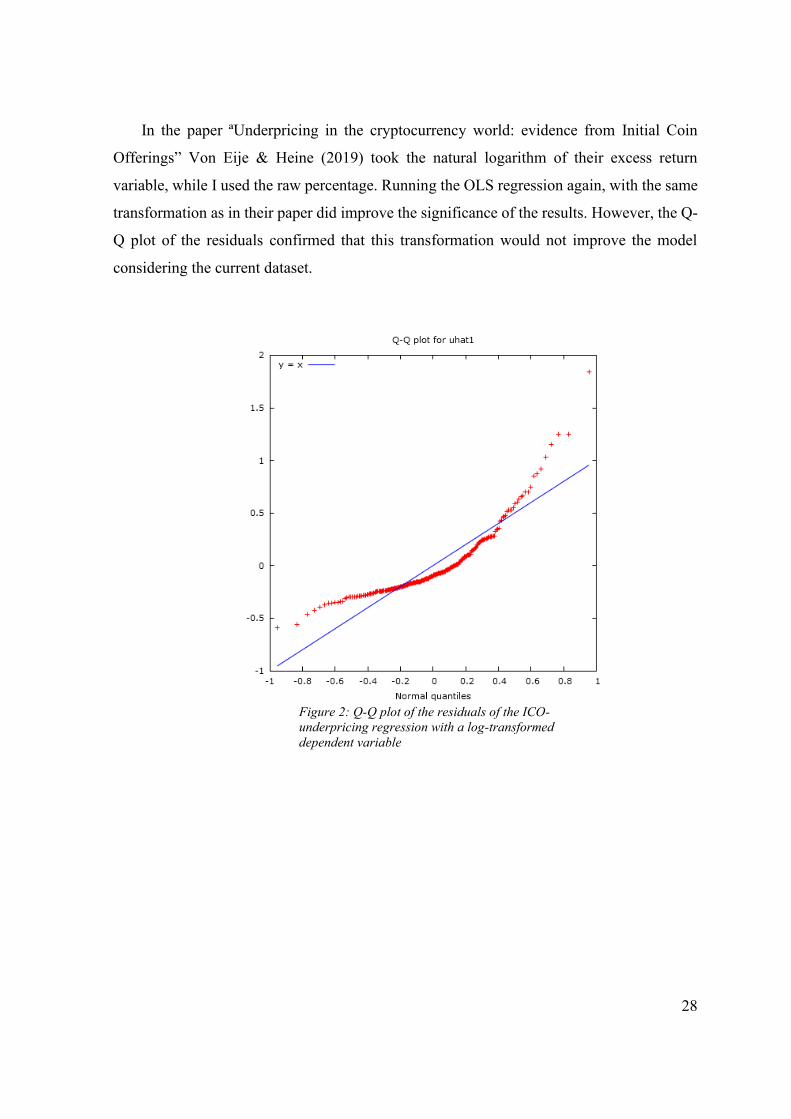
In the paper ªUnderpricing in the cryptocurrency world: evidence from Initial Coin
Offerings” Von Eije & Heine (2019) took the natural logarithm of their excess return
variable, while I used the raw percentage. Running the OLS regression again, with the same
transformation as in their paper did improve the significance of the results. However, the Q-
Q plot of the residuals confirmed that this transformation would not improve the model
considering the current dataset.
Figure 2: Q-Q plot of the residuals of the ICO-
underpricing regression with a log-transformed
dependent variable
29
7. Discussion and Conclusion
In this chapter, I will discuss the main results of the study, list the implications of the study,
identify some limitations of the study, and give some advice on possible future research.
7.1 Main results
Two out of three hypotheses regarding the signaling models are supported by the results
(Table 10). There was an indication that a higher funding goal has a positive impact on the
amount raised in ICOs and Crowdfunding. I suspect that it is not the funding goal that has
an impact on the funding amount, but that it acts as an indicator of the amount of effort a
company will put into funding. Furthermore, I found that a longer funding period is
negatively related to returns in ICOs and crowdfunding projects alike. This relationship was
quite expected as it has been documented in multiple other studies (Momtaz, 2018; Mollick,
2013). The positive link between the percentage offered and the amount raised was the odd
one out, though not completely without precedent. In 1988 researchers (Morck, Shleifer, &
Vishny, 1988) found a negative relationship between firm value and the level of board
ownership in the 5% to 25% range, and a positive relationship in the 0% to 5% and the 25%
and up range.
Table 10: Summary of signaling results
Hypothesis Result
H1A. A higher retention percentage will be beneficial for the amount raised of
ICOs and IPOs. Positive for ICOs,
negative for IPOs
H1B. A higher funding goal will be positively correlated with returns in
crowdfunding and ICOs Positive correlation
H1C. A longer funding period will have a negative effect on the amount raised
through ICO and crowdfunding. Negative correlation
My predictions regarding underpricing were less fruitful, with none of the results
supporting the hypotheses (Table 11). The finding that I didn’t find a link between historical
underpricing and current underpricing on the individual level was not too surprising as the
effect was not seen at the aggregate level in IPOs as well. There were two notable differences
between the study that found this result previously and this one (Kadlec & Edelen, 2005)
that might explain the different findings. Firstly the study cited had a larger sample size (N=
4,605) than mine (N= 493 & 768). Secondly, the sample period of the study was around the
internet bubble, which might have influenced the amount of underpricing.
30
Table 11: Summary of underpricing results
Hypothesis Result
H2A: Excess returns and the number of listings are cyclical in both ICOs and IPOs.
Negative
relation for the
number of
ICOs
H2B: The amount of underpricing in ICOs is positively correlated with the number of days
between the ICO and listing time. No relation
H2C Smaller issues should see higher excess returns than larger IPO and ICO issues.
Only
significant for
ICOs
7.2 Study implications
This study expands on the current literature by finding links between multiple funding
mechanisms in a similar timeframe. Furthermore, this study might lead to more nuanced
studies comparing different funding mechanisms.
7.3 Limitations:
The datasets I’ve collected were all pulled from aggregate websites and thus might contain
some biases. This might affect the ability of the model to be generalized to the whole
population. Furthermore, I’ve primarily focused my research on the United States. I’ve
controlled for differences between countries in ICOs, but not in IPOs. As a result, the study
might not apply to countries other than the United States.
The dataset of crowdfunding and ICOs both contain projects that were able to raise
money but didn’t reach the funding goal. Whereas the dataset of IPOs only contained data
on successful IPOs.
Due to the estimation of multiple mechanisms, there was not enough time available to gather
all control variables that were used in previous research. As a consequence, some effects
found in the study might be due to other variables that were not added to the model. Many
studies add some kind of control variable for ‘hype’ or use some way to incorporate social
media data into the model (Lyandres, Palazzo, & Rabetti, 2019; Fisch, 2019).
There might be a mismatch between the listing time of an ICO noted in the source
and the “true first listing”. A study by EY research (2018) showed that many ICOs lose all
value after some time. Thus, the average amount of underpricing might be understated if the
reported listing dates are after the ‘true’ listing date.
31
7.4 Future research
Though I have tried to include as many signals as possible, there are some other promising
signals that I couldn’t include in the model. As an example, a more prestigious underwriter
is a positive signal in IPOs (Loughran & Ritter, 2003). Due to time limitations, it wasn’t
possible to research the effects of platform intermediaries in crowdfunding and ICOs, but
there might be some link there as well. Another example is the relationship that has been
found between Spelling errors in description and the amount raised in ICOs (Fisch, 2019).
I have used the median of the bitcoin price as a control variable as the bitcoin price
might affect the amount of funding an ICO would get. A better way to capture this might be
some measure of the relative bitcoin price at that moment. For instance, a bitcoin price of
10.000 USD might have a different impact on investors depending on the price history.
32
8. Bibliography
Aggrawal, R., Bhagat, S., & Rangan, S. (2009). The Impact of Fundamentals on IPO Valuation. Financial
Management, 38(2), pp. 253-284.
Altinkilic, O., & Hansen, R. (2000). Are There Economies of Scale in Underwriting Fees? Evidence of
Rising External Financing Costs. Review of Financial Studies, 13(1), 191-218.
Arthurs, J., Busenitz, L., Hoskisson, R., & Johnson, R. (2009). Signaling and Initial Public Offerings: The
Use and Impact of the Lockup Period. Journal of Business Venturing, 24(4), 360-372.
doi:10.1016/j.jbusvent.2008.02.004
Autonomous.com. (2018). CRYPTO: Token and Coin Exchange Listing Fees. Retrieved December 12, 2019,
from Autonomous.com: https://next.autonomous.com/thoughts/crypto-exchange-listing-fees
Baron, D. P. (1982). A Model of the Demand for Investment Banking Advising and Distribution Services for
New Issues. The Journal of Finance, 37(4), 955-976.
Belleflamme, P., Lambert, T., & Schwienbacher, A. (2014). Crowdfunding: Tapping the right crowd. Journal
of Business Venturing, 29(5), 610-611.
Bezverhi, K. (2019). Stablecoins Instead of ICO: New HYIP of 2019. Retrieved November 18, 2019, from
hackernoon.com: https://hackernoon.com/stablecoins-instead-of-ico-new-hyip-of-2019-
66f4e8919c70
Bi, S., Zhiying, L., & Usman, K. (2017). The influence of online information on investing decisions of
reward-based crowdfunding. Journal of Business Research, 71(1), 10-18.
Binance. (2019). Binance.com. Retrieved November 30, 2019, from Initial Exchange Offering (IEO):
https://www.binance.vision/glossary/initial-exchange-offering
Bird, L., & Meyskens, M. (2015). Crowdfunding and Value Creation. Entrepreneurship Research Journal,
5(2), 155–166. doi:10.1515/erj-2015-0007.
Chowdhry, B., & Sherman, A. (1995). International differences in oversubscription and underpricing of
IPOs. Journal of Corporate Finance, 2(4), 359-381.
Clayton, J. (2017, 12 11). Statement on Cryptocurrencies and Initial Coin Offerings. Retrieved 02 02, 2020,
from SEC.gov: https://www.sec.gov/news/public-statement/statement-clayton-2017-12-11
Connelly, B., Certo, T., Ireland, R., & Reutzel, C. (2011). Signaling Theory: A Review and Assessment.
Journal of Management, 37(1), 39-67. doi:10.1177/0149206310388419
33
Corporate finance institute. (2020). The first-time sale of new or existing securities to the public. Retrieved 2
25, 2020, from Corporate finance institute:
https://corporatefinanceinstitute.com/resources/knowledge/finance/ipo-process/
Dingman, S. (2018). Canadian's smartwatch startup matches record $15-million in VC funding. Retrieved
November 30, 2019, from The Globe and Mail:
https://www.theglobeandmail.com/technology/business-technology/canadians-smartwatch-startup-
matches-record-15-million-in-vc-funding/article11965214/
Drobetz, W. &. (2019 ). Investor Sentiment and Initial Coin Offerings. The Journal of Alternative
Investments, 21(4), 41-55. doi:10.3905/jai.2019.1.069
Dunbar, C. G., & Foerster, S. R. (2008). Second time lucky? Withdrawn IPOs that return to the market.
Journal of Financial Economics, 87(3), 610-635.
Euronext. (2019). LISTING FEE BOOK. Retrieved December 02, 2019, from Euronext.com:
https://www.euronext.com/sites/default/files/2019-04/listing_fee_book_eng_20190102.pdf
EY Research. (2018). Initial Coin Offerings (ICOs) The Class of 2017 – one year later. Retrieved November
21, 2019, from EY.com: https://www.ey.com/Publication/vwLUAssets/ey-study-ico-
research/$FILE/ey-study-ico-research.pdf
Fisch, C. (2019). Initial coin offerings (ICOs) to finance new ventures. Journal of Business Venturing, 34(1),
1-22.
How, J., & Low, J. (1993). Fractional ownership and underpricing: signals of IPO firm value? Pacific-Basin
Finance Journal 1, 1(1), 47-65.
Howell, S., Niessner, M., & Yermack, D. (2019). Initial Coin Offerings: Financing Growth with
Cryptocurrency Token Sales. Cambridge, MA: National Bureau of Economic Research.
doi:10.3386/w24774
Ibbotson, R. (1975). Price performance of common stock new issues. Journal of Financial Economics, 2(3),
235-272.
Icobench. (2019). ICO Market Analysis 2018. Retrieved from icobench.com:
https://icobench.com/reports/ICO_Market_Analysis_2018.pdf
Kadlec, G., & Edelen, R. (2005). Issuer surplus and the partial adjustment of IPO prices to public
information. Journal of Financial Economics, 77(2), 347-373.
Kickstarter. (2011). Shortening the Maximum Project Length. Retrieved December 16, 2019, from
Kickstarter.com: https://www.kickstarter.com/blog/shortening-the-maximum-project-length
34
Kickstarter. (2019). Stats. Retrieved November 30, 2019, from Kickstarter.com:
https://www.kickstarter.com/help/stats
Kunz, M. M., Bretschneider, U., Erler, M., & Leimeister, J. M. (2017). An empirical investigation of
signaling in reward-based crowdfunding. Electronic Commerce Research, 17(3), 425–461.
Lljungqvist, A. (2007). Handbook of Corporate Finance. In B. Eckbo, Handbook of Corporate Finance (pp.
376-418).
Loughran, T., & Ritter, J. (2003). Why Has IPO Underpricing Changed over Time? Journal of Financial
Management, 33(3), 5-37.
Lyandres, E., Palazzo, B., & Rabetti, D. (2019). Do Tokens Behave like Securities? An Anatomy of Initial
Coin Offerings. SSRN Electronic Journal. doi:10.2139/ssrn.3287583
Mollick, E. (2013, March 25). Swept Away by the Crowd? Crowdfunding, Venture Capital, and the Selection
of Entrepreneurs. SSRN's eLibrary.
Momtaz, P. (2018). Initial Coin Offerings. SSRN Electronic Journal. doi:10.2139/ssrn.3166709.
Morck, R., Shleifer, A., & Vishny, R. (1988). Management Ownership and Market Valuation. Journal of
Financial Economics, 20, 293–315. doi:10.1016/0304-405X(88)90048-7
MPCX Platform. (2019). What is an Initial Exchange Offering (IEO)? Why XDMC is a wise choice
according to market trend? Retrieved December 04, 2019, from Medium.com:
https://medium.com/@mpcxplatform/what-is-an-initial-exchange-offering-ieo-why-xdmc-is-a-wise-
choice-according-to-market-trend-6b4cf38ac26f
OECD. (2019). Initial Coin Offerings (ICOs) for SME Financing. Retrieved December 02, 2019, from
OECD.com: http://www.oecd.org/finance/ICOs-for-SME-Financing.pdf
Ofir, M., & Sadeh, I. (2019). ICO vs IPO: Empirical Findings, Information Asymmetry and the Appropriate
Regulatory Framework. Vanderbilt Journal of Transnational Law, Forthcoming.
Oliveira, L., Zavolokina, L., Bauer, I., & Schwabe, G. (2018). To Token or not to Token: Tools for
Understanding Blockchain Tokens. 39TH INTERNATIONAL CONFERENCE ON INFORMATION
SYSTEMS. San Francisco.
QYResearch. (2019, May). Crowdfunding Synopsis. Retrieved from valuates.com:
https://reports.valuates.com/sreport/QYRE-Auto-
1598/Global_Crowdfunding_Market_Size_Status_and_Forecast_2019_2025
Rajesh, K., Aggarwala, L., Krigman, B., & Womack, K. L. (2002). Strategic IPO underpricing, information
momentum, and lockup expiration selling. Journal of Financial Economics, 105-137.
Ritter, J. (1987). The costs of going public. Journal of Financial Economics, 19(2), 269-281.
35
Ritter, J. (2018, November 19). Initial Public Offerings: Underpricing. Retrieved 2019, from
warrington.ufl.edu: https://site.warrington.ufl.edu/ritter/files/2019/03/IPOs2018_Underpricing.pdf
Rock, K. (1986). Why new issues are underpriced. Journal of Financial Economics, 15(1-2), 187-212.
Sameeh, T. (2018). ICO basics - the difference between security tokens and utility tokens. Retrieved
December 01, 2019, from cointelligence.com: https://www.cointelligence.com/content/ico-basics-
security-tokens-vs-utility-tokens/
Satis Group. (2018). CRYPTOASSET MARKET COVERAGE INITIATION: NETWORK CREATION.
Colorado: Satis Group. Retrieved from
https://research.bloomberg.com/pub/res/d28giW28tf6G7T_Wr77aU0gDgFQ
Schwienbacher, A., & Larralde, B. (2010). Crowdfunding of Small Entrepreneurial Ventures. Handbook of
entrepreneurial finance.
Sindelar, J. L., Ritter, J. R., & Roger, I. (1994). THE MARKET'S PROBLEMS WITH THE PRICING OF
INITIAL PUBLIC OFFERINGS. Journal of Applied Corporate Finance, 7(1), 66-74.
Tinn, K., & Chemla, G. (2019). Learning Through Crowdfunding. Management Science (Ahead of print).
doi:https://doi.org/10.1287/mnsc.2018.3278
von Eije, H., & Heine, T. (2019). Underpricing in the cryptocurrency world: evidence from initial coin
offerings. Journal of Managerial Finance, 45(4), 563-578.
Wang, E., & Franklin, J. (2019, September 29). Exclusive: Nasdaq cracks down on IPOs of small Chinese
companies. Retrieved from Reuters.com: https://www.reuters.com/article/us-usa-china-ipos-nasdaq-
exclusive/exclusive-nasdaq-cracks-down-on-ipos-of-small-chinese-companies-idUSKBN1WE0P5
Webrobots.io. (2019). Web Robots Scraper. Retrieved from Chrome web store:
https://chrome.google.com/webstore/detail/web-robots-
scraper/pmagfjeddlknbohojnepcplpgjlincak?hl=en
Welch, I. (1989). Seasoned Offerings, Imitation Costs, and the Underpricing of Initial Public Offerings. The
Journal of Finance, 44(2), 421-449.
Welch, I. (1992). Sequential Sales, Learning, and Cascades. The Journal of Finance, 47(2), 695-732.
Zetzsche, D., Buckley, R., Arner, D., & Föhr, L. (2019). The ICO Gold Rush: It's a Scam, It's a Bubble, It's a
Super Challenge for Regulators. Harvard International Law Journal, 60(2), 286-315.
36
Annexes
I. LIST OF VARIABLES
Table 12: Control variables of the signaling models
Control variable Description
IPO
Total offering expenses(log) “Lower quality firms have a higher
underwriter spread” (Altinkilic & Hansen,
2000, p. 191)
Employees(log) Team size has been shown to be positively
related to the amount funded
Total assets(log) Assets are used for firm valuation
(Aggrawal, Bhagat, & Rangan, 2009).
Thus, would be positively correlated with
funding.
China (dummy) Chinese IPOs are primarily bought by
insiders and thus are probably rated
differently by investors (Wang & Franklin,
2019). I’ve added a dummy variable
indicating when they have China in the
description.
Shareholder shares offered (dummy) Dummy variable that takes the value of 1 if
shareholder shares are sold during the IPO.
This might have a negative effect on the
valuation of IPOs
Cro
wd
fun
din
g
Pledged/backer Pledged/backer
Mollick (2014) found a positive relation
between this and success
United States(dummy) A dummy variable that takes the value of 1
when the person organizing the
crowdfunding project is located within the
United States and 0 when located outside
of the US. An international project might
be seen as riskier, as there are more costs
involved. For crowdfunding due to its
online context. Some studies control for
locational effects (Aggrawal, Bhagat, &
Rangan, 2009).
Staff pick (dummy) Kunz et al (2017) found a positive effect of
staff pick on the success rate
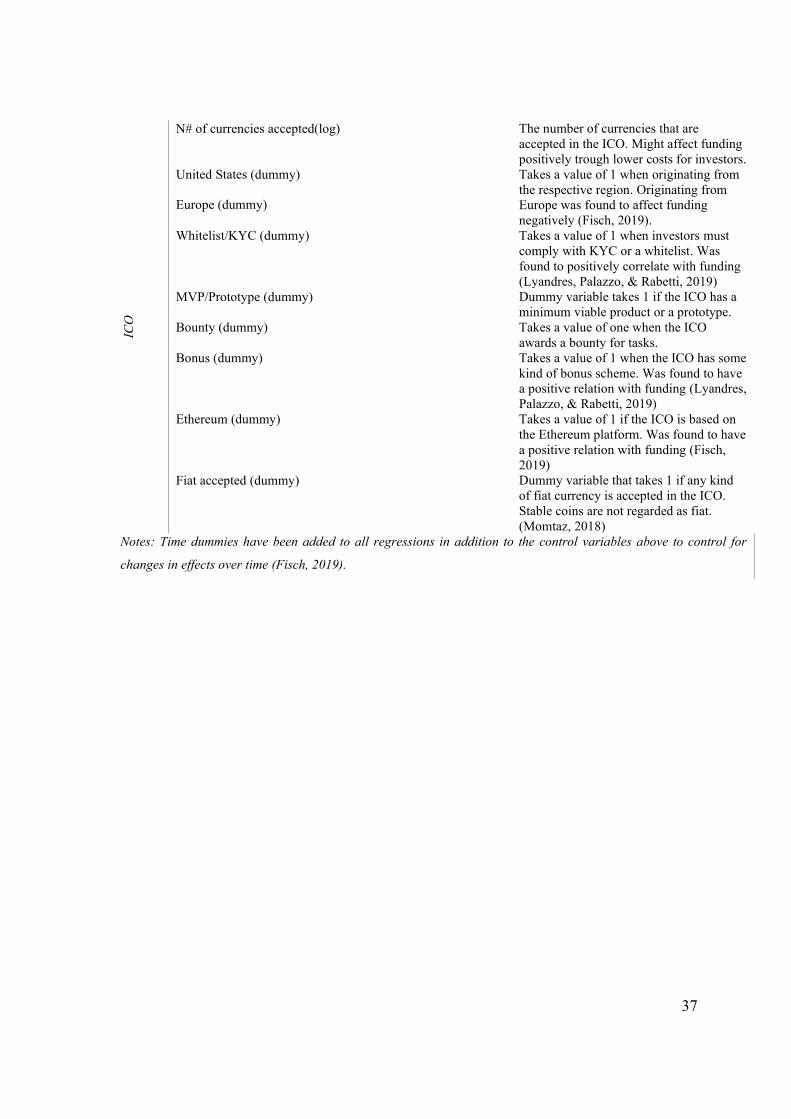
37
ICO
N# of currencies accepted(log) The number of currencies that are
accepted in the ICO. Might affect funding
positively trough lower costs for investors.
United States (dummy) Takes a value of 1 when originating from
the respective region. Originating from
Europe was found to affect funding
negatively (Fisch, 2019).
Europe (dummy)
Whitelist/KYC (dummy) Takes a value of 1 when investors must
comply with KYC or a whitelist. Was
found to positively correlate with funding
(Lyandres, Palazzo, & Rabetti, 2019) MVP/Prototype (dummy) Dummy variable takes 1 if the ICO has a
minimum viable product or a prototype.
Bounty (dummy) Takes a value of one when the ICO
awards a bounty for tasks.
Bonus (dummy) Takes a value of 1 when the ICO has some
kind of bonus scheme. Was found to have
a positive relation with funding (Lyandres,
Palazzo, & Rabetti, 2019) Ethereum (dummy) Takes a value of 1 if the ICO is based on
the Ethereum platform. Was found to have
a positive relation with funding (Fisch,
2019) Fiat accepted (dummy) Dummy variable that takes 1 if any kind
of fiat currency is accepted in the ICO.
Stable coins are not regarded as fiat.
(Momtaz, 2018) Notes: Time dummies have been added to all regressions in addition to the control variables above to control for
changes in effects over time (Fisch, 2019).
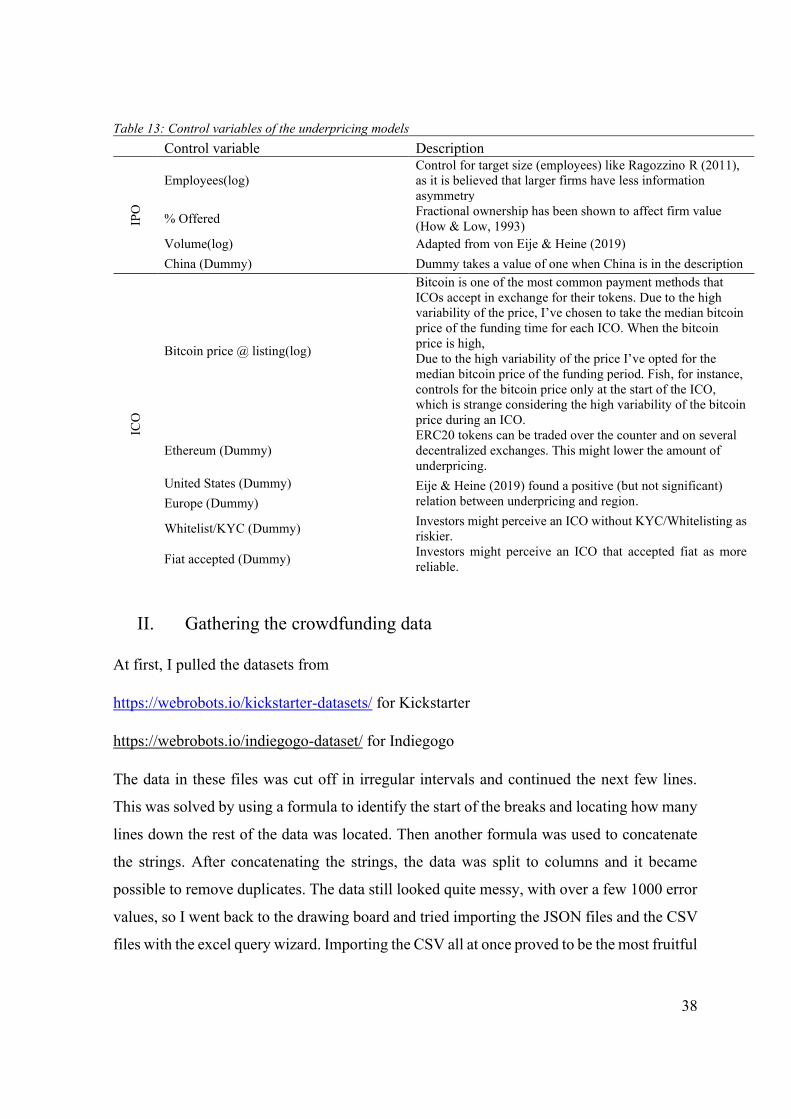
38
Table 13: Control variables of the underpricing models
Control variable Description IP
O
Employees(log)
Control for target size (employees) like Ragozzino R (2011),
as it is believed that larger firms have less information
asymmetry
% Offered Fractional ownership has been shown to affect firm value
(How & Low, 1993)
Volume(log) Adapted from von Eije & Heine (2019)
China (Dummy) Dummy takes a value of one when China is in the description
ICO
Bitcoin price @ listing(log)
Bitcoin is one of the most common payment methods that
ICOs accept in exchange for their tokens. Due to the high
variability of the price, I’ve chosen to take the median bitcoin
price of the funding time for each ICO. When the bitcoin
price is high,
Due to the high variability of the price I’ve opted for the
median bitcoin price of the funding period. Fish, for instance,
controls for the bitcoin price only at the start of the ICO,
which is strange considering the high variability of the bitcoin
price during an ICO.
Ethereum (Dummy)
ERC20 tokens can be traded over the counter and on several
decentralized exchanges. This might lower the amount of
underpricing.
United States (Dummy) Eije & Heine (2019) found a positive (but not significant)
relation between underpricing and region. Europe (Dummy)
Whitelist/KYC (Dummy) Investors might perceive an ICO without KYC/Whitelisting as
riskier.
Fiat accepted (Dummy) Investors might perceive an ICO that accepted fiat as more
reliable.
II. Gathering the crowdfunding data
At first, I pulled the datasets from
https://webrobots.io/kickstarter-datasets/ for Kickstarter
https://webrobots.io/indiegogo-dataset/ for Indiegogo
The data in these files was cut off in irregular intervals and continued the next few lines.
This was solved by using a formula to identify the start of the breaks and locating how many
lines down the rest of the data was located. Then another formula was used to concatenate
the strings. After concatenating the strings, the data was split to columns and it became
possible to remove duplicates. The data still looked quite messy, with over a few 1000 error
values, so I went back to the drawing board and tried importing the JSON files and the CSV
files with the excel query wizard. Importing the CSV all at once proved to be the most fruitful
39
method. The Kickstarter data proved usable, but the IndieGoGo data didn’t have an identifier
to tell if the project was still ongoing.
The data was in JSON streaming format, which means that instead of the file being a valid
JSON file, every line in the file is a valid JSON object, which excel can’t read. Changing the
file type to .TXT and then importing it with the query editor in excel proved to be the solution
III. Gathering the ICO data
The Xpath of data tables was then copied to a googles sheet and the data of each individual
ICO was imported using the IMPORTXML function. This avenue worked but populating
the sheets this way would have taken weeks. Then I’ve tried to upload the data into excel
with the help of an extension1 and the following formula:
=XPathOnUrl(URL;Xpath;"";HttpSettings(;;;"500|1000|Host");"text")
Retrieving data from the following Xpaths: //*[@id="financial"]/div/div[2] |
//*[@id="financial"]/div/div[1] | /*[@id="profile_header"]/div/div[2]/div[3]
The data came out in one string, for each of the retrieved tables, so some manipulation was
needed to extract the needed information. One formula was used for getting the rightmost
data from the string =RIGHT(Cell with string; LEN(Cell with string)-FIND(Category name;
Cell with string)-LEN(Category name)), and this formula was used to cut the retrieved
information out of the string =LEFT(Cell with string; LEN(Cell with string)-LEN(Category
name)-LEN(Cell with category info))
11 ICOs out of 5596 in total in the master list were not found on ICObench
Information about: start/end date(duration), Emission amount, soft cap, hard cap, Platform,
Type, bounty program, Origin country, Restricted country, Whitepaper/yes/no
The profile information needed 4-5 different Xpaths to retrieve the information
The amount raised in multiple cryptocurrencies was in one string as well. Sadly, there was
no separator between the amount in cryptocurrencies and the guestimate of ICObench. Thus,
1 https://seotoolsforexcel.com/
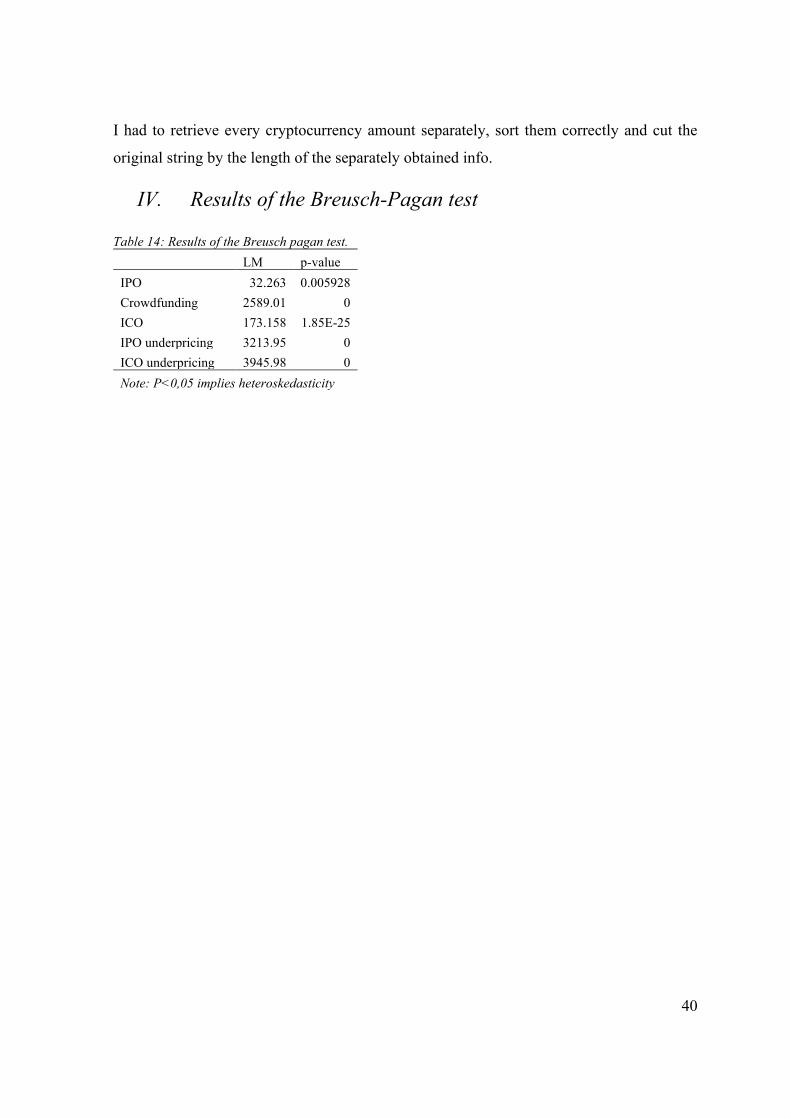
40
I had to retrieve every cryptocurrency amount separately, sort them correctly and cut the
original string by the length of the separately obtained info.
IV. Results of the Breusch-Pagan test
Table 14: Results of the Breusch pagan test.
LM p-value
IPO 32.263 0.005928
Crowdfunding 2589.01 0
ICO 173.158 1.85E-25
IPO underpricing 3213.95 0
ICO underpricing 3945.98 0
Note: P<0,05 implies heteroskedasticity
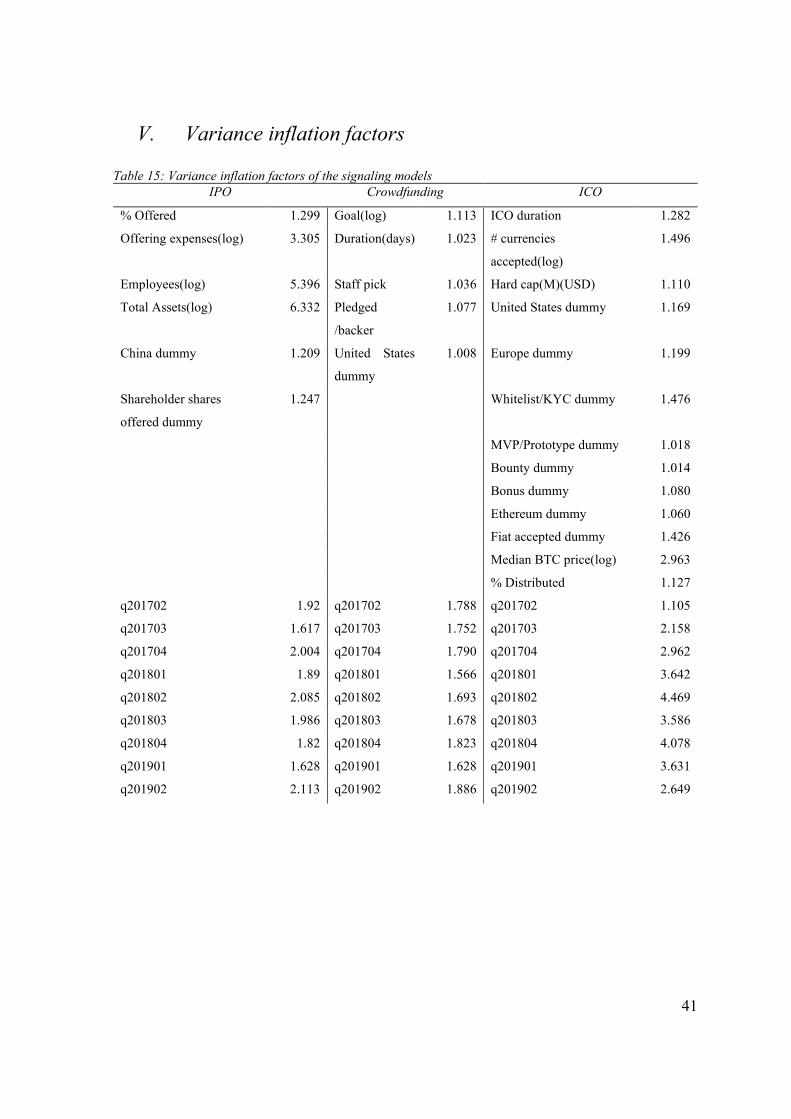
41
V. Variance inflation factors
Table 15: Variance inflation factors of the signaling models
IPO Crowdfunding ICO
% Offered 1.299 Goal(log) 1.113 ICO duration 1.282
Offering expenses(log) 3.305 Duration(days) 1.023 # currencies
accepted(log)
1.496
Employees(log) 5.396 Staff pick 1.036 Hard cap(M)(USD) 1.110
Total Assets(log) 6.332 Pledged
/backer
1.077 United States dummy 1.169
China dummy 1.209 United States
dummy
1.008 Europe dummy 1.199
Shareholder shares
offered dummy
1.247
Whitelist/KYC dummy 1.476
MVP/Prototype dummy 1.018
Bounty dummy 1.014
Bonus dummy 1.080
Ethereum dummy 1.060
Fiat accepted dummy 1.426
Median BTC price(log) 2.963
% Distributed 1.127
q201702 1.92 q201702 1.788 q201702 1.105
q201703 1.617 q201703 1.752 q201703 2.158
q201704 2.004 q201704 1.790 q201704 2.962
q201801 1.89 q201801 1.566 q201801 3.642
q201802 2.085 q201802 1.693 q201802 4.469
q201803 1.986 q201803 1.678 q201803 3.586
q201804 1.82 q201804 1.823 q201804 4.078
q201901 1.628 q201901 1.628 q201901 3.631
q201902 2.113 q201902 1.886 q201902 2.649
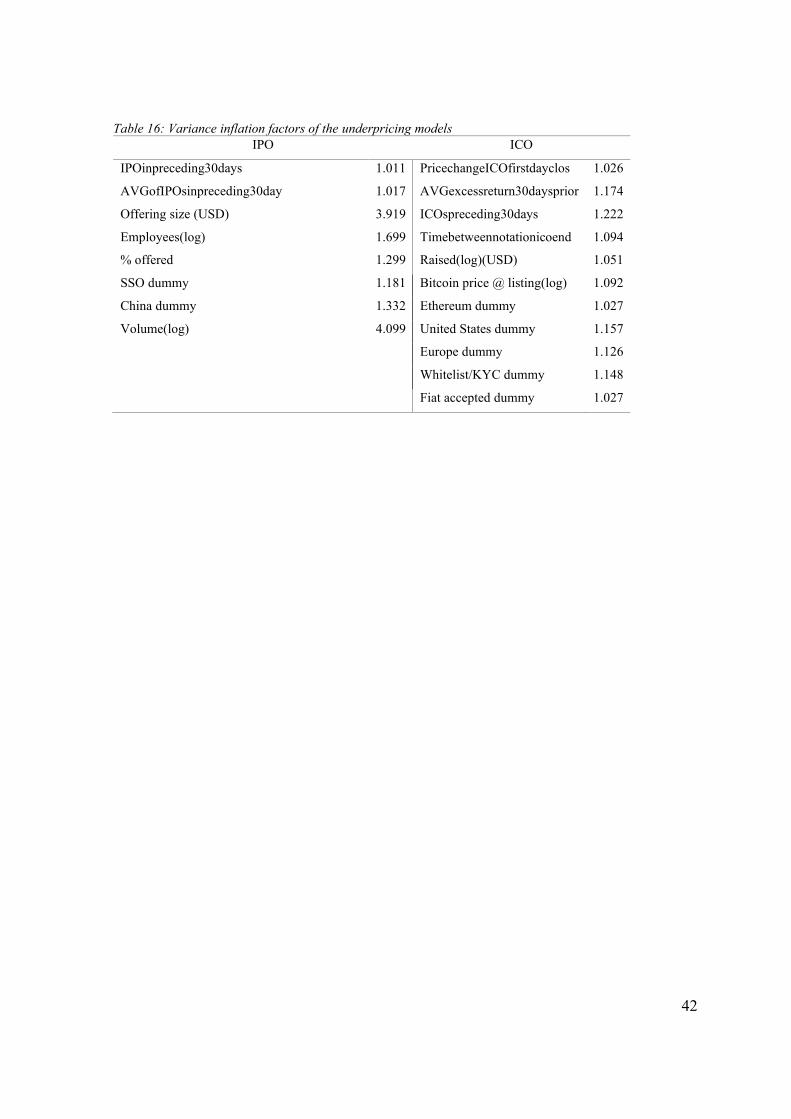
42
Table 16: Variance inflation factors of the underpricing models
IPO ICO
IPOinpreceding30days 1.011 PricechangeICOfirstdayclos 1.026
AVGofIPOsinpreceding30day 1.017 AVGexcessreturn30daysprior 1.174
Offering size (USD) 3.919 ICOspreceding30days 1.222
Employees(log) 1.699 Timebetweennotationicoend 1.094
% offered 1.299 Raised(log)(USD) 1.051
SSO dummy 1.181 Bitcoin price @ listing(log) 1.092
China dummy 1.332 Ethereum dummy 1.027
Volume(log) 4.099 United States dummy 1.157
Europe dummy 1.126
Whitelist/KYC dummy 1.148
Fiat accepted dummy 1.027