Embed Size (px)
Citation preview
R
Et
Ya
b
c
O
a
ARRA
KODCTNTA
1
nwttinhtdum
oS
h1l
Japanese Dental Science Review 56 (2020) 109–118
Contents lists available at ScienceDirect
Japanese Dental Science Review
j ourna l ho mepage: www.elsev ier .com/ locate / jdsr
eview Article
valuation of dental caries, tooth crack, and age-related changes inooth structure using optical coherence tomography
asushi Shimadaa,b,∗, Masahiro Yoshiyamaa, Junji Tagamib, Yasunori Sumic
Department of Operative Dentistry, Graduate School of Medicine, Dentistry, and Pharmaceutical Sciences, Okayama University, JapanDepartment of Cariology and Operative Dentistry, Graduate School of Medical and Dental Sciences, Tokyo Medical and Dental University, Tokyo, JapanDepartment for Advanced Dental Research, Center of Advanced Medicine for Dental and Oral Diseases, National Center for Geriatrics and Gerontology,bu, Japan
r t i c l e i n f o
rticle history:eceived 24 May 2019eceived in revised form 7 July 2020ccepted 22 August 2020
eywords:ptical coherence tomographyiagnosisariesooth crackCCL
a b s t r a c t
Optical coherence tomography (OCT) is an imaging technique that can visualize the internal biologicalstructure without X-ray exposure. Swept-source OCT (SS-OCT) is one of the latest version of OCT, whereinthe light source is a tunable laser that sweeps near-infrared wavelength light to achieve real-time imaging.The imaging depth of OCT is highly influenced by the translucency of the medium. The medium thatdoes not transmit light and the deeper structure beyond the range of light penetration depth are notrelevant for OCT imaging. In OCT, sound enamel is almost transparent at the OCT wavelength range, andenamel and dentin can be distinguished from each other as the dentin–enamel junction (DEJ) appearsas a dark border. Demineralized enamel and dentin are imaged as bright zones because of the formationof numerous micro-porosities where the backscatter of OCT signal is increased. In cavitated caries atinterproximal or occlusal hidden zone, the upper margin of the cavity reflects the signal showing a
ooth wearge-related changes
distinct bright border in the SS-OCT image. SS-OCT is capable of determining crack penetration deptheven when the cracks extended beyond the DEJ. SS-OCT has a high degree of sensitivity and specificity forthe detection of dental caries and tooth cracks. SS-OCT is also capable of detecting non-carious cervicallesions and occlusal tooth wear in cross-sectional views to estimate the amount of tooth structure loss.
© 2020 The Authors. Published by Elsevier Ltd on behalf of The Japanese Association for DentalScience. This is an open access article under the CC BY-NC-ND license (http://creativecommons.org/
. Introduction
Optical coherence tomography (OCT) is an interferometric tech-ique that can create cross-sectional images of biological structuresithout X-ray exposure [1]. The imaging mechanism is analogous
o ultrasonography [2]. Ultrasonography uses sound to measurehe echo and time delay from the deep structures to generate themages, while OCT uses light and measures the backscattered sig-als from the deep structures [2]. Since the velocity of light is tooigh to measure the time delay, OCT employs an interferometero measure the pathway difference of the light and construct theepth profile [1,2]. To create fringe responses of the light, OCT
ses coherent light of near-infrared wavelength, where light has itsaximum depth of penetration in the biological structures (near-∗ Corresponding author at: Department of Operative Dentistry, Graduate Schoolf Medicine, Dentistry and Pharmaceutical Sciences, Okayama University, 2-5-1hikata-cho, Kita-ku, Okayama 700-8525 Japan.
E-mail address: [email protected] (Y. Shimada).
ttps://doi.org/10.1016/j.jdsr.2020.08.001882-7616/© 2020 The Authors. Published by Elsevier Ltd on behalf of The Japanese Ass
icense (http://creativecommons.org/licenses/by-nc-nd/4.0/).
licenses/by-nc-nd/4.0/).
infrared window) [2]. The first in vitro and in vivo images of dentalhard and soft tissue with OCT were acquired by Colston et al. [3].
OCT is a non-invasive imaging method that uses light and elim-inates the risk of radiation exposure. Thus, OCT is a safe diagnosticmethod for dental diseases and can be used in pregnant womanand young children. The early OCT systems were based on time-domain (TD) detection in which echo time delays of light wereidentified by measuring the interference signal as a function oftime, while scanning the optical path length of the reference arm[2]. Advances in OCT technology have enabled dramatic increasesin image resolution and speed of imaging. Fourier-domain (FD)techniques provide distinct increase in sensitivity as comparedto the traditional TD-OCT [2,4]. Swept-source (SS-)OCT is one ofthe implements of FD-OCT and employs an interferometer with anarrow-linewidth, frequency-sweep laser, and detectors to mea-sure interference versus time (Fig. 1) [2,5]. Recent SS-OCT systemsoffer cross-sectional images of the internal biological structures in
real time with microscopic level resolution (Fig. 2).The imaging depth of OCT is highly influenced by the translu-cency of the medium [2]. OCT imaging is favorable for an object
ociation for Dental Science. This is an open access article under the CC BY-NC-ND
110 Y. Shimada et al. / Japanese Dental Scie
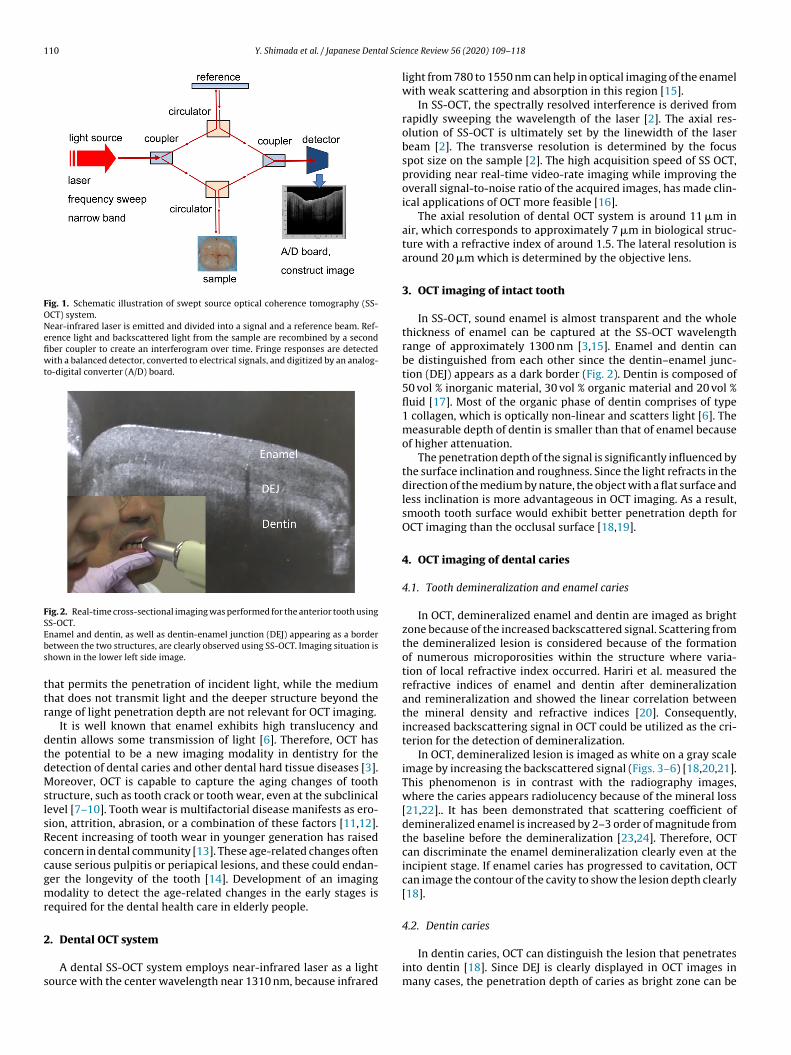
Fig. 1. Schematic illustration of swept source optical coherence tomography (SS-OCT) system.Near-infrared laser is emitted and divided into a signal and a reference beam. Ref-erence light and backscattered light from the sample are recombined by a secondfiber coupler to create an interferogram over time. Fringe responses are detectedwith a balanced detector, converted to electrical signals, and digitized by an analog-to-digital converter (A/D) board.
Fig. 2. Real-time cross-sectional imaging was performed for the anterior tooth usingSS-OCT.Ebs
ttr
dtdMslsRccgmr
2
s
namel and dentin, as well as dentin-enamel junction (DEJ) appearing as a borderetween the two structures, are clearly observed using SS-OCT. Imaging situation ishown in the lower left side image.
hat permits the penetration of incident light, while the mediumhat does not transmit light and the deeper structure beyond theange of light penetration depth are not relevant for OCT imaging.
It is well known that enamel exhibits high translucency andentin allows some transmission of light [6]. Therefore, OCT hashe potential to be a new imaging modality in dentistry for theetection of dental caries and other dental hard tissue diseases [3].oreover, OCT is capable to capture the aging changes of tooth
tructure, such as tooth crack or tooth wear, even at the subclinicalevel [7–10]. Tooth wear is multifactorial disease manifests as ero-ion, attrition, abrasion, or a combination of these factors [11,12].ecent increasing of tooth wear in younger generation has raisedoncern in dental community [13]. These age-related changes oftenause serious pulpitis or periapical lesions, and these could endan-er the longevity of the tooth [14]. Development of an imagingodality to detect the age-related changes in the early stages is
equired for the dental health care in elderly people.
. Dental OCT system
A dental SS-OCT system employs near-infrared laser as a lightource with the center wavelength near 1310 nm, because infrared
nce Review 56 (2020) 109–118
light from 780 to 1550 nm can help in optical imaging of the enamelwith weak scattering and absorption in this region [15].
In SS-OCT, the spectrally resolved interference is derived fromrapidly sweeping the wavelength of the laser [2]. The axial res-olution of SS-OCT is ultimately set by the linewidth of the laserbeam [2]. The transverse resolution is determined by the focusspot size on the sample [2]. The high acquisition speed of SS OCT,providing near real-time video-rate imaging while improving theoverall signal-to-noise ratio of the acquired images, has made clin-ical applications of OCT more feasible [16].
The axial resolution of dental OCT system is around 11 �m inair, which corresponds to approximately 7 �m in biological struc-ture with a refractive index of around 1.5. The lateral resolution isaround 20 �m which is determined by the objective lens.
3. OCT imaging of intact tooth
In SS-OCT, sound enamel is almost transparent and the wholethickness of enamel can be captured at the SS-OCT wavelengthrange of approximately 1300 nm [3,15]. Enamel and dentin canbe distinguished from each other since the dentin–enamel junc-tion (DEJ) appears as a dark border (Fig. 2). Dentin is composed of50 vol % inorganic material, 30 vol % organic material and 20 vol %fluid [17]. Most of the organic phase of dentin comprises of type1 collagen, which is optically non-linear and scatters light [6]. Themeasurable depth of dentin is smaller than that of enamel becauseof higher attenuation.
The penetration depth of the signal is significantly influenced bythe surface inclination and roughness. Since the light refracts in thedirection of the medium by nature, the object with a flat surface andless inclination is more advantageous in OCT imaging. As a result,smooth tooth surface would exhibit better penetration depth forOCT imaging than the occlusal surface [18,19].
4. OCT imaging of dental caries
4.1. Tooth demineralization and enamel caries
In OCT, demineralized enamel and dentin are imaged as brightzone because of the increased backscattered signal. Scattering fromthe demineralized lesion is considered because of the formationof numerous microporosities within the structure where varia-tion of local refractive index occurred. Hariri et al. measured therefractive indices of enamel and dentin after demineralizationand remineralization and showed the linear correlation betweenthe mineral density and refractive indices [20]. Consequently,increased backscattering signal in OCT could be utilized as the cri-terion for the detection of demineralization.
In OCT, demineralized lesion is imaged as white on a gray scaleimage by increasing the backscattered signal (Figs. 3–6) [18,20,21].This phenomenon is in contrast with the radiography images,where the caries appears radiolucency because of the mineral loss[21,22].. It has been demonstrated that scattering coefficient ofdemineralized enamel is increased by 2–3 order of magnitude fromthe baseline before the demineralization [23,24]. Therefore, OCTcan discriminate the enamel demineralization clearly even at theincipient stage. If enamel caries has progressed to cavitation, OCTcan image the contour of the cavity to show the lesion depth clearly[18].
4.2. Dentin caries
In dentin caries, OCT can distinguish the lesion that penetratesinto dentin [18]. Since DEJ is clearly displayed in OCT images inmany cases, the penetration depth of caries as bright zone can be
Y. Shimada et al. / Japanese Dental Science Review 56 (2020) 109–118 111
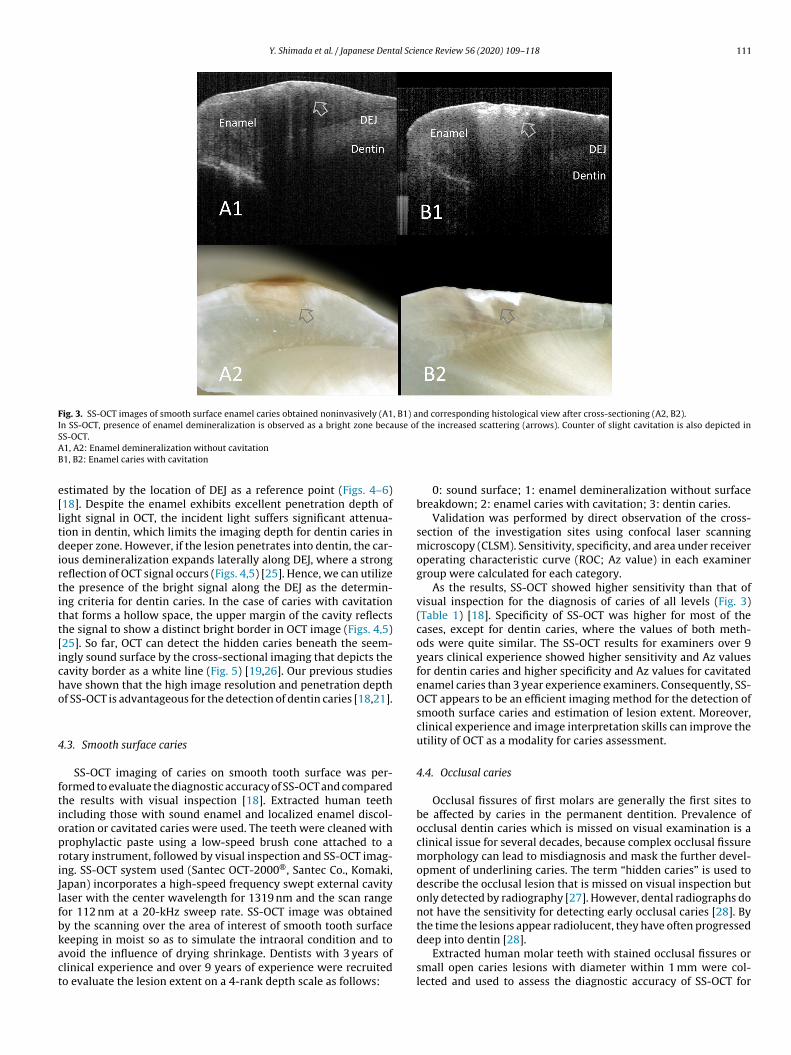
Fig. 3. SS-OCT images of smooth surface enamel caries obtained noninvasively (A1, B1) and corresponding histological view after cross-sectioning (A2, B2).In SS-OCT, presence of enamel demineralization is observed as a bright zone because of the increased scattering (arrows). Counter of slight cavitation is also depicted inSAB
e[ltdirtitt[icho
4
ftiopriJlfbkact
S-OCT.1, A2: Enamel demineralization without cavitation1, B2: Enamel caries with cavitation
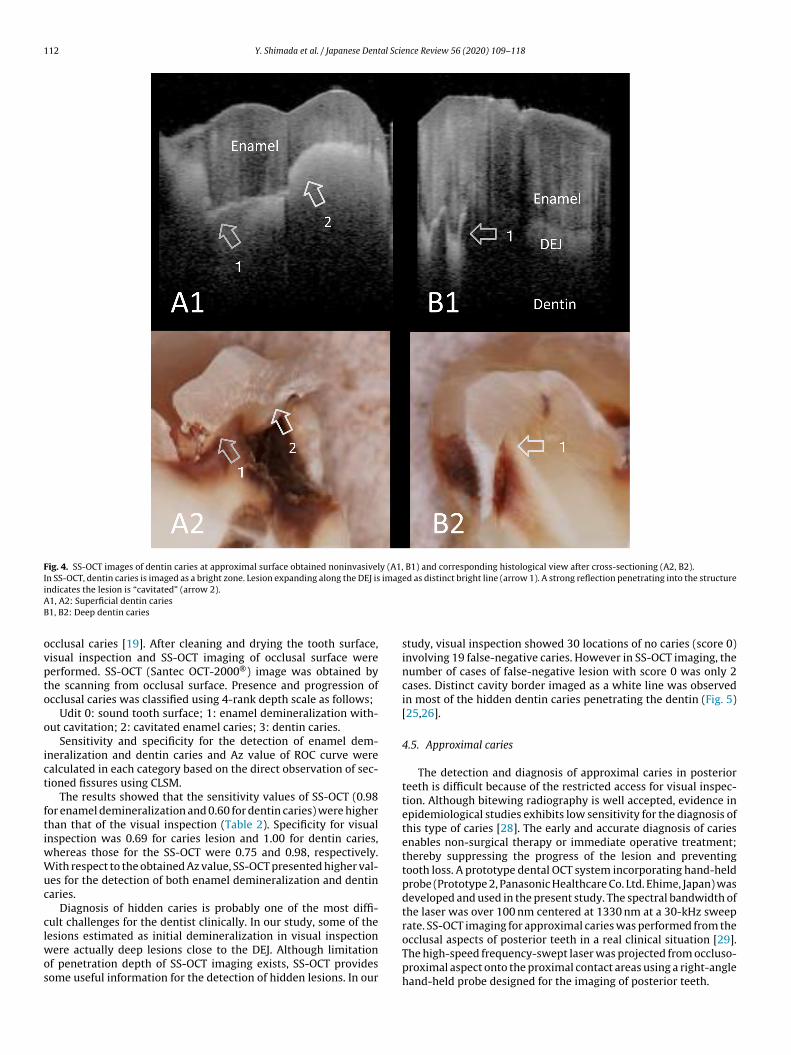
stimated by the location of DEJ as a reference point (Figs. 4–6)18]. Despite the enamel exhibits excellent penetration depth ofight signal in OCT, the incident light suffers significant attenua-ion in dentin, which limits the imaging depth for dentin caries ineeper zone. However, if the lesion penetrates into dentin, the car-
ous demineralization expands laterally along DEJ, where a strongeflection of OCT signal occurs (Figs. 4,5) [25]. Hence, we can utilizehe presence of the bright signal along the DEJ as the determin-ng criteria for dentin caries. In the case of caries with cavitationhat forms a hollow space, the upper margin of the cavity reflectshe signal to show a distinct bright border in OCT image (Figs. 4,5)25]. So far, OCT can detect the hidden caries beneath the seem-ngly sound surface by the cross-sectional imaging that depicts theavity border as a white line (Fig. 5) [19,26]. Our previous studiesave shown that the high image resolution and penetration depthf SS-OCT is advantageous for the detection of dentin caries [18,21].
.3. Smooth surface caries
SS-OCT imaging of caries on smooth tooth surface was per-ormed to evaluate the diagnostic accuracy of SS-OCT and comparedhe results with visual inspection [18]. Extracted human teethncluding those with sound enamel and localized enamel discol-ration or cavitated caries were used. The teeth were cleaned withrophylactic paste using a low-speed brush cone attached to aotary instrument, followed by visual inspection and SS-OCT imag-ng. SS-OCT system used (Santec OCT-2000®, Santec Co., Komaki,apan) incorporates a high-speed frequency swept external cavityaser with the center wavelength for 1319 nm and the scan rangeor 112 nm at a 20-kHz sweep rate. SS-OCT image was obtainedy the scanning over the area of interest of smooth tooth surface
eeping in moist so as to simulate the intraoral condition and tovoid the influence of drying shrinkage. Dentists with 3 years oflinical experience and over 9 years of experience were recruitedo evaluate the lesion extent on a 4-rank depth scale as follows:0: sound surface; 1: enamel demineralization without surfacebreakdown; 2: enamel caries with cavitation; 3: dentin caries.
Validation was performed by direct observation of the cross-section of the investigation sites using confocal laser scanningmicroscopy (CLSM). Sensitivity, specificity, and area under receiveroperating characteristic curve (ROC; Az value) in each examinergroup were calculated for each category.
As the results, SS-OCT showed higher sensitivity than that ofvisual inspection for the diagnosis of caries of all levels (Fig. 3)(Table 1) [18]. Specificity of SS-OCT was higher for most of thecases, except for dentin caries, where the values of both meth-ods were quite similar. The SS-OCT results for examiners over 9years clinical experience showed higher sensitivity and Az valuesfor dentin caries and higher specificity and Az values for cavitatedenamel caries than 3 year experience examiners. Consequently, SS-OCT appears to be an efficient imaging method for the detection ofsmooth surface caries and estimation of lesion extent. Moreover,clinical experience and image interpretation skills can improve theutility of OCT as a modality for caries assessment.
4.4. Occlusal caries
Occlusal fissures of first molars are generally the first sites tobe affected by caries in the permanent dentition. Prevalence ofocclusal dentin caries which is missed on visual examination is aclinical issue for several decades, because complex occlusal fissuremorphology can lead to misdiagnosis and mask the further devel-opment of underlining caries. The term “hidden caries” is used todescribe the occlusal lesion that is missed on visual inspection butonly detected by radiography [27]. However, dental radiographs donot have the sensitivity for detecting early occlusal caries [28]. Bythe time the lesions appear radiolucent, they have often progressed
deep into dentin [28].Extracted human molar teeth with stained occlusal fissures orsmall open caries lesions with diameter within 1 mm were col-lected and used to assess the diagnostic accuracy of SS-OCT for
112 Y. Shimada et al. / Japanese Dental Science Review 56 (2020) 109–118
Fig. 4. SS-OCT images of dentin caries at approximal surface obtained noninvasively (A1, B1) and corresponding histological view after cross-sectioning (A2, B2).In SS-OCT, dentin caries is imaged as a bright zone. Lesion expanding along the DEJ is imaged as distinct bright line (arrow 1). A strong reflection penetrating into the structureiAB
ovpto
o
ict
ftiwWuc
clwos
ndicates the lesion is “cavitated” (arrow 2).1, A2: Superficial dentin caries1, B2: Deep dentin caries
cclusal caries [19]. After cleaning and drying the tooth surface,isual inspection and SS-OCT imaging of occlusal surface wereerformed. SS-OCT (Santec OCT-2000®) image was obtained byhe scanning from occlusal surface. Presence and progression ofcclusal caries was classified using 4-rank depth scale as follows;
Udit 0: sound tooth surface; 1: enamel demineralization with-ut cavitation; 2: cavitated enamel caries; 3: dentin caries.
Sensitivity and specificity for the detection of enamel dem-neralization and dentin caries and Az value of ROC curve werealculated in each category based on the direct observation of sec-ioned fissures using CLSM.
The results showed that the sensitivity values of SS-OCT (0.98or enamel demineralization and 0.60 for dentin caries) were higherhan that of the visual inspection (Table 2). Specificity for visualnspection was 0.69 for caries lesion and 1.00 for dentin caries,
hereas those for the SS-OCT were 0.75 and 0.98, respectively.ith respect to the obtained Az value, SS-OCT presented higher val-
es for the detection of both enamel demineralization and dentinaries.
Diagnosis of hidden caries is probably one of the most diffi-ult challenges for the dentist clinically. In our study, some of the
esions estimated as initial demineralization in visual inspectionere actually deep lesions close to the DEJ. Although limitationf penetration depth of SS-OCT imaging exists, SS-OCT providesome useful information for the detection of hidden lesions. In our
study, visual inspection showed 30 locations of no caries (score 0)involving 19 false-negative caries. However in SS-OCT imaging, thenumber of cases of false-negative lesion with score 0 was only 2cases. Distinct cavity border imaged as a white line was observedin most of the hidden dentin caries penetrating the dentin (Fig. 5)[25,26].
4.5. Approximal caries
The detection and diagnosis of approximal caries in posteriorteeth is difficult because of the restricted access for visual inspec-tion. Although bitewing radiography is well accepted, evidence inepidemiological studies exhibits low sensitivity for the diagnosis ofthis type of caries [28]. The early and accurate diagnosis of cariesenables non-surgical therapy or immediate operative treatment;thereby suppressing the progress of the lesion and preventingtooth loss. A prototype dental OCT system incorporating hand-heldprobe (Prototype 2, Panasonic Healthcare Co. Ltd. Ehime, Japan) wasdeveloped and used in the present study. The spectral bandwidth ofthe laser was over 100 nm centered at 1330 nm at a 30-kHz sweeprate. SS-OCT imaging for approximal caries was performed from the
occlusal aspects of posterior teeth in a real clinical situation [29].The high-speed frequency-swept laser was projected from occluso-proximal aspect onto the proximal contact areas using a right-anglehand-held probe designed for the imaging of posterior teeth.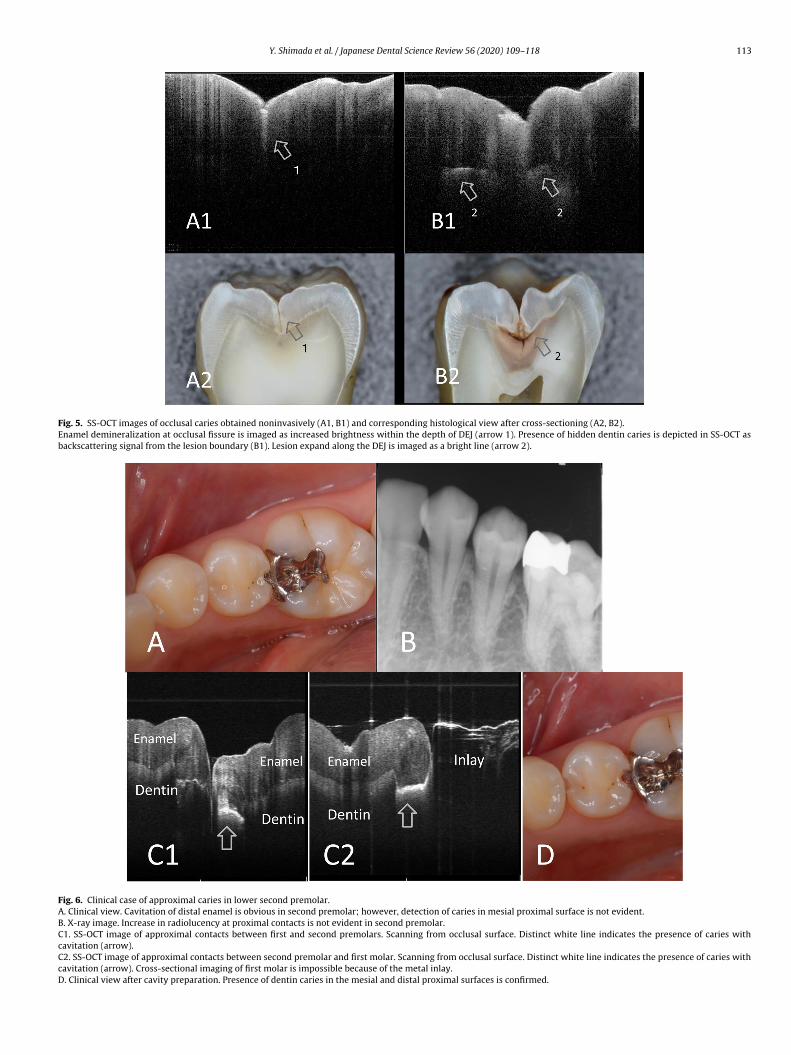
Y. Shimada et al. / Japanese Dental Science Review 56 (2020) 109–118 113
Fig. 5. SS-OCT images of occlusal caries obtained noninvasively (A1, B1) and corresponding histological view after cross-sectioning (A2, B2).Enamel demineralization at occlusal fissure is imaged as increased brightness within the depth of DEJ (arrow 1). Presence of hidden dentin caries is depicted in SS-OCT asbackscattering signal from the lesion boundary (B1). Lesion expand along the DEJ is imaged as a bright line (arrow 2).
Fig. 6. Clinical case of approximal caries in lower second premolar.A. Clinical view. Cavitation of distal enamel is obvious in second premolar; however, detection of caries in mesial proximal surface is not evident.B. X-ray image. Increase in radiolucency at proximal contacts is not evident in second premolar.C1. SS-OCT image of approximal contacts between first and second premolars. Scanning from occlusal surface. Distinct white line indicates the presence of caries withcavitation (arrow).C2. SS-OCT image of approximal contacts between second premolar and first molar. Scanning from occlusal surface. Distinct white line indicates the presence of caries withcavitation (arrow). Cross-sectional imaging of first molar is impossible because of the metal inlay.D. Clinical view after cavity preparation. Presence of dentin caries in the mesial and distal proximal surfaces is confirmed.
114 Y. Shimada et al. / Japanese Dental Science Review 56 (2020) 109–118
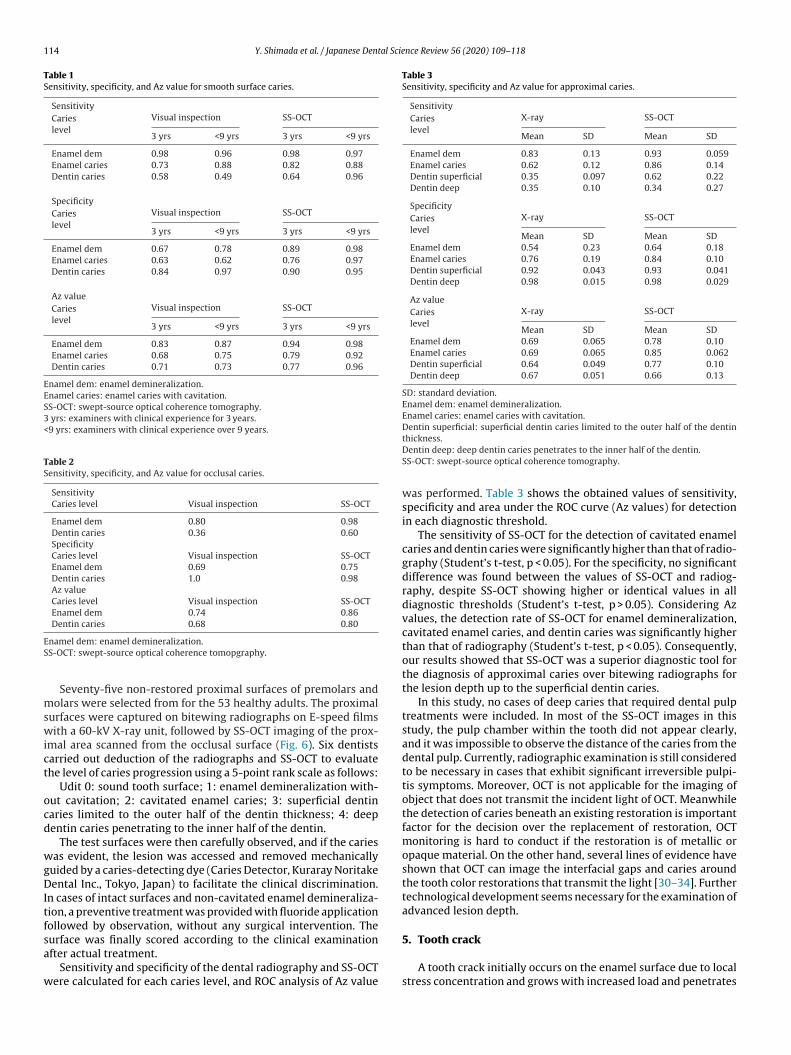
Table 1Sensitivity, specificity, and Az value for smooth surface caries.
SensitivityCarieslevel
Visual inspection SS-OCT
3 yrs <9 yrs 3 yrs <9 yrs
Enamel dem 0.98 0.96 0.98 0.97Enamel caries 0.73 0.88 0.82 0.88Dentin caries 0.58 0.49 0.64 0.96
SpecificityCarieslevel
Visual inspection SS-OCT
3 yrs <9 yrs 3 yrs <9 yrs
Enamel dem 0.67 0.78 0.89 0.98Enamel caries 0.63 0.62 0.76 0.97Dentin caries 0.84 0.97 0.90 0.95
Az valueCarieslevel
Visual inspection SS-OCT
3 yrs <9 yrs 3 yrs <9 yrs
Enamel dem 0.83 0.87 0.94 0.98Enamel caries 0.68 0.75 0.79 0.92Dentin caries 0.71 0.73 0.77 0.96
Enamel dem: enamel demineralization.Enamel caries: enamel caries with cavitation.SS-OCT: swept-source optical coherence tomography.3 yrs: examiners with clinical experience for 3 years.<9 yrs: examiners with clinical experience over 9 years.
Table 2Sensitivity, specificity, and Az value for occlusal caries.
SensitivityCaries level Visual inspection SS-OCT
Enamel dem 0.80 0.98Dentin caries 0.36 0.60SpecificityCaries level Visual inspection SS-OCTEnamel dem 0.69 0.75Dentin caries 1.0 0.98Az valueCaries level Visual inspection SS-OCTEnamel dem 0.74 0.86Dentin caries 0.68 0.80
ES
mswict
ocd
wgDItfsa
w
Table 3Sensitivity, specificity and Az value for approximal caries.
SensitivityCarieslevel
X-ray SS-OCT
Mean SD Mean SD
Enamel dem 0.83 0.13 0.93 0.059Enamel caries 0.62 0.12 0.86 0.14Dentin superficial 0.35 0.097 0.62 0.22Dentin deep 0.35 0.10 0.34 0.27
SpecificityCarieslevel
X-ray SS-OCT
Mean SD Mean SDEnamel dem 0.54 0.23 0.64 0.18Enamel caries 0.76 0.19 0.84 0.10Dentin superficial 0.92 0.043 0.93 0.041Dentin deep 0.98 0.015 0.98 0.029
Az valueCarieslevel
X-ray SS-OCT
Mean SD Mean SDEnamel dem 0.69 0.065 0.78 0.10Enamel caries 0.69 0.065 0.85 0.062Dentin superficial 0.64 0.049 0.77 0.10Dentin deep 0.67 0.051 0.66 0.13
SD: standard deviation.Enamel dem: enamel demineralization.Enamel caries: enamel caries with cavitation.Dentin superficial: superficial dentin caries limited to the outer half of the dentin
namel dem: enamel demineralization.S-OCT: swept-source optical coherence tomopgraphy.
Seventy-five non-restored proximal surfaces of premolars andolars were selected from for the 53 healthy adults. The proximal
urfaces were captured on bitewing radiographs on E-speed filmsith a 60-kV X-ray unit, followed by SS-OCT imaging of the prox-
mal area scanned from the occlusal surface (Fig. 6). Six dentistsarried out deduction of the radiographs and SS-OCT to evaluatehe level of caries progression using a 5-point rank scale as follows:
Udit 0: sound tooth surface; 1: enamel demineralization with-ut cavitation; 2: cavitated enamel caries; 3: superficial dentinaries limited to the outer half of the dentin thickness; 4: deepentin caries penetrating to the inner half of the dentin.
The test surfaces were then carefully observed, and if the cariesas evident, the lesion was accessed and removed mechanically
uided by a caries-detecting dye (Caries Detector, Kuraray Noritakeental Inc., Tokyo, Japan) to facilitate the clinical discrimination.
n cases of intact surfaces and non-cavitated enamel demineraliza-ion, a preventive treatment was provided with fluoride applicationollowed by observation, without any surgical intervention. The
urface was finally scored according to the clinical examinationfter actual treatment.Sensitivity and specificity of the dental radiography and SS-OCTere calculated for each caries level, and ROC analysis of Az value
thickness.Dentin deep: deep dentin caries penetrates to the inner half of the dentin.SS-OCT: swept-source optical coherence tomography.
was performed. Table 3 shows the obtained values of sensitivity,specificity and area under the ROC curve (Az values) for detectionin each diagnostic threshold.
The sensitivity of SS-OCT for the detection of cavitated enamelcaries and dentin caries were significantly higher than that of radio-graphy (Student’s t-test, p < 0.05). For the specificity, no significantdifference was found between the values of SS-OCT and radiog-raphy, despite SS-OCT showing higher or identical values in alldiagnostic thresholds (Student’s t-test, p > 0.05). Considering Azvalues, the detection rate of SS-OCT for enamel demineralization,cavitated enamel caries, and dentin caries was significantly higherthan that of radiography (Student’s t-test, p < 0.05). Consequently,our results showed that SS-OCT was a superior diagnostic tool forthe diagnosis of approximal caries over bitewing radiographs forthe lesion depth up to the superficial dentin caries.
In this study, no cases of deep caries that required dental pulptreatments were included. In most of the SS-OCT images in thisstudy, the pulp chamber within the tooth did not appear clearly,and it was impossible to observe the distance of the caries from thedental pulp. Currently, radiographic examination is still consideredto be necessary in cases that exhibit significant irreversible pulpi-tis symptoms. Moreover, OCT is not applicable for the imaging ofobject that does not transmit the incident light of OCT. Meanwhilethe detection of caries beneath an existing restoration is importantfactor for the decision over the replacement of restoration, OCTmonitoring is hard to conduct if the restoration is of metallic oropaque material. On the other hand, several lines of evidence haveshown that OCT can image the interfacial gaps and caries aroundthe tooth color restorations that transmit the light [30–34]. Furthertechnological development seems necessary for the examination ofadvanced lesion depth.
5. Tooth crack
A tooth crack initially occurs on the enamel surface due to localstress concentration and grows with increased load and penetrates
Y. Shimada et al. / Japanese Dental Science Review 56 (2020) 109–118 115
FAB imaged as a white line penetrating into the depth to DEJ (whole thickness enamel crack).
itticcdtssacosSr
wettl
ecwt
(stpbsvvt
a(Dsaiaao
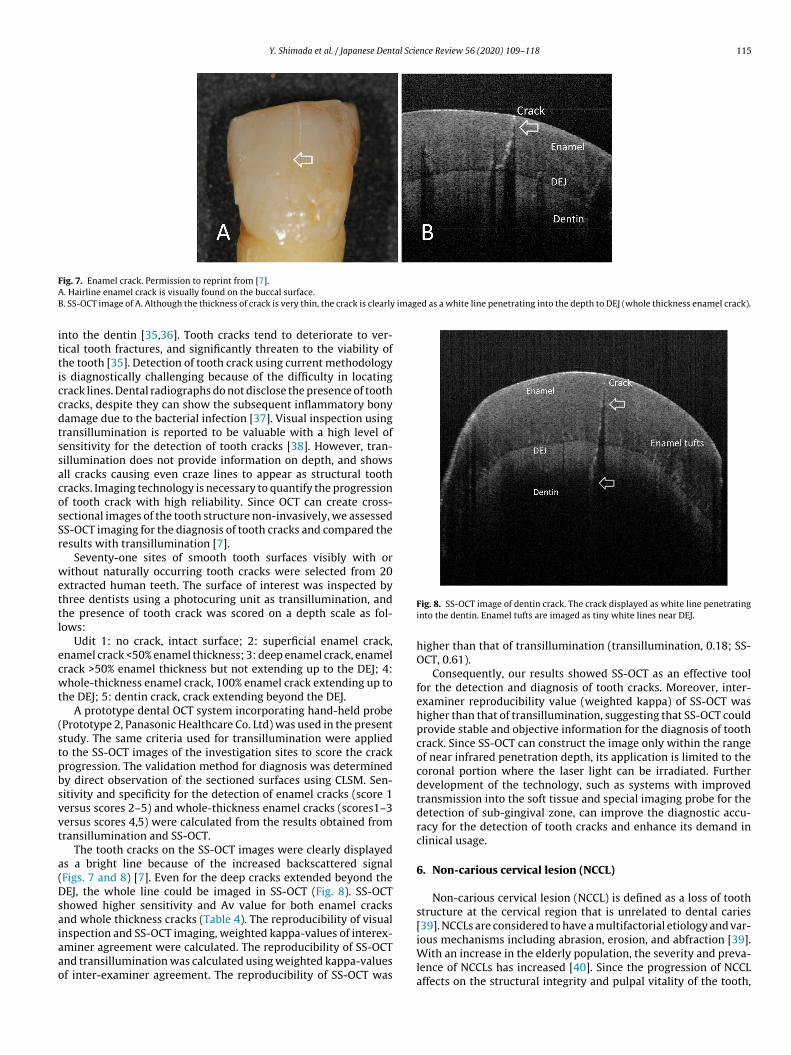
ig. 7. Enamel crack. Permission to reprint from [7].. Hairline enamel crack is visually found on the buccal surface.. SS-OCT image of A. Although the thickness of crack is very thin, the crack is clearly
nto the dentin [35,36]. Tooth cracks tend to deteriorate to ver-ical tooth fractures, and significantly threaten to the viability ofhe tooth [35]. Detection of tooth crack using current methodologys diagnostically challenging because of the difficulty in locatingrack lines. Dental radiographs do not disclose the presence of toothracks, despite they can show the subsequent inflammatory bonyamage due to the bacterial infection [37]. Visual inspection usingransillumination is reported to be valuable with a high level ofensitivity for the detection of tooth cracks [38]. However, tran-illumination does not provide information on depth, and showsll cracks causing even craze lines to appear as structural toothracks. Imaging technology is necessary to quantify the progressionf tooth crack with high reliability. Since OCT can create cross-ectional images of the tooth structure non-invasively, we assessedS-OCT imaging for the diagnosis of tooth cracks and compared theesults with transillumination [7].
Seventy-one sites of smooth tooth surfaces visibly with orithout naturally occurring tooth cracks were selected from 20
xtracted human teeth. The surface of interest was inspected byhree dentists using a photocuring unit as transillumination, andhe presence of tooth crack was scored on a depth scale as fol-ows:
Udit 1: no crack, intact surface; 2: superficial enamel crack,namel crack <50% enamel thickness; 3: deep enamel crack, enamelrack >50% enamel thickness but not extending up to the DEJ; 4:hole-thickness enamel crack, 100% enamel crack extending up to
he DEJ; 5: dentin crack, crack extending beyond the DEJ.A prototype dental OCT system incorporating hand-held probe
Prototype 2, Panasonic Healthcare Co. Ltd) was used in the presenttudy. The same criteria used for transillumination were appliedo the SS-OCT images of the investigation sites to score the crackrogression. The validation method for diagnosis was determinedy direct observation of the sectioned surfaces using CLSM. Sen-itivity and specificity for the detection of enamel cracks (score 1ersus scores 2–5) and whole-thickness enamel cracks (scores1–3ersus scores 4,5) were calculated from the results obtained fromransillumination and SS-OCT.
The tooth cracks on the SS-OCT images were clearly displayeds a bright line because of the increased backscattered signalFigs. 7 and 8) [7]. Even for the deep cracks extended beyond theEJ, the whole line could be imaged in SS-OCT (Fig. 8). SS-OCT
howed higher sensitivity and Av value for both enamel cracksnd whole thickness cracks (Table 4). The reproducibility of visual
nspection and SS-OCT imaging, weighted kappa-values of interex-miner agreement were calculated. The reproducibility of SS-OCTnd transillumination was calculated using weighted kappa-valuesf inter-examiner agreement. The reproducibility of SS-OCT wasFig. 8. SS-OCT image of dentin crack. The crack displayed as white line penetratinginto the dentin. Enamel tufts are imaged as tiny white lines near DEJ.
higher than that of transillumination (transillumination, 0.18; SS-OCT, 0.61).
Consequently, our results showed SS-OCT as an effective toolfor the detection and diagnosis of tooth cracks. Moreover, inter-examiner reproducibility value (weighted kappa) of SS-OCT washigher than that of transillumination, suggesting that SS-OCT couldprovide stable and objective information for the diagnosis of toothcrack. Since SS-OCT can construct the image only within the rangeof near infrared penetration depth, its application is limited to thecoronal portion where the laser light can be irradiated. Furtherdevelopment of the technology, such as systems with improvedtransmission into the soft tissue and special imaging probe for thedetection of sub-gingival zone, can improve the diagnostic accu-racy for the detection of tooth cracks and enhance its demand inclinical usage.
6. Non-carious cervical lesion (NCCL)
Non-carious cervical lesion (NCCL) is defined as a loss of toothstructure at the cervical region that is unrelated to dental caries[39]. NCCLs are considered to have a multifactorial etiology and var-
ious mechanisms including abrasion, erosion, and abfraction [39].With an increase in the elderly population, the severity and preva-lence of NCCLs has increased [40]. Since the progression of NCCLaffects on the structural integrity and pulpal vitality of the tooth,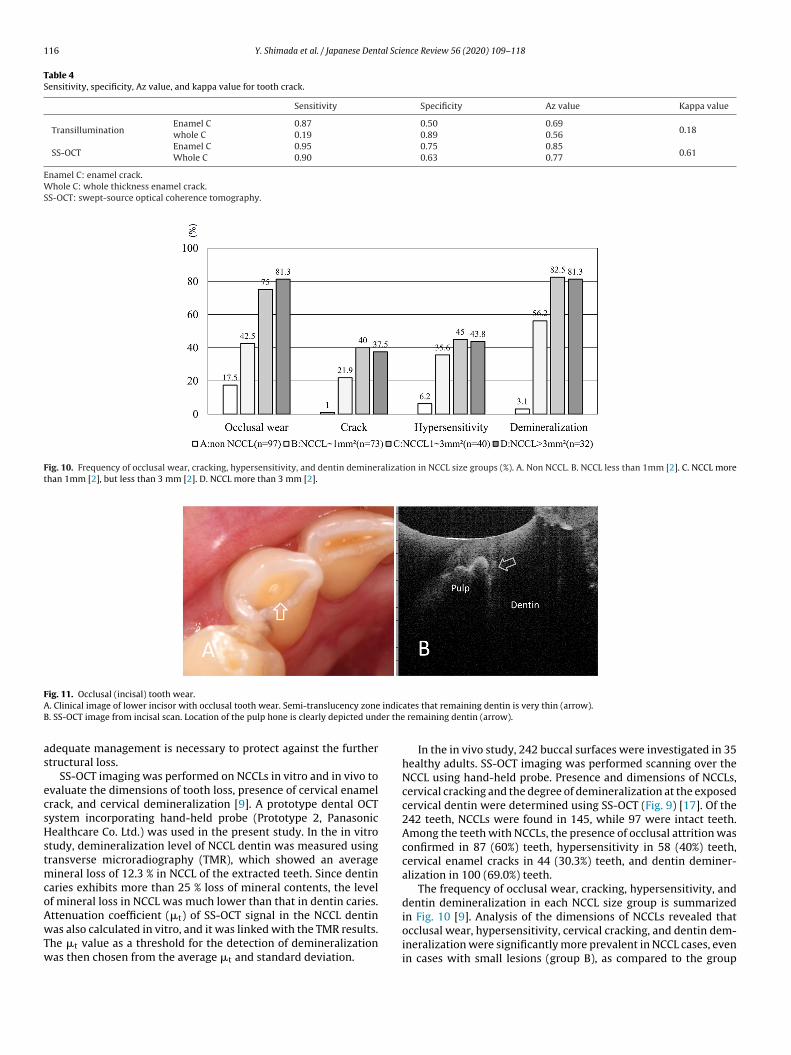
116 Y. Shimada et al. / Japanese Dental Science Review 56 (2020) 109–118
Table 4Sensitivity, specificity, Az value, and kappa value for tooth crack.
Sensitivity Specificity Az value Kappa value
TransilluminationEnamel C 0.87 0.50 0.69
0.18whole C 0.19 0.89 0.56
SS-OCTEnamel C 0.95 0.75 0.85
0.61Whole C 0.90 0.63 0.77
Enamel C: enamel crack.Whole C: whole thickness enamel crack.SS-OCT: swept-source optical coherence tomography.
Fig. 10. Frequency of occlusal wear, cracking, hypersensitivity, and dentin demineralization in NCCL size groups (%). A. Non NCCL. B. NCCL less than 1mm [2]. C. NCCL morethan 1mm [2], but less than 3 mm [2]. D. NCCL more than 3 mm [2].
FA indicB er the
as
ecsHstmcoAwTw
occlusal wear, hypersensitivity, cervical cracking, and dentin dem-
ig. 11. Occlusal (incisal) tooth wear.. Clinical image of lower incisor with occlusal tooth wear. Semi-translucency zone. SS-OCT image from incisal scan. Location of the pulp hone is clearly depicted und
dequate management is necessary to protect against the furthertructural loss.
SS-OCT imaging was performed on NCCLs in vitro and in vivo tovaluate the dimensions of tooth loss, presence of cervical enamelrack, and cervical demineralization [9]. A prototype dental OCTystem incorporating hand-held probe (Prototype 2, Panasonicealthcare Co. Ltd.) was used in the present study. In the in vitro
tudy, demineralization level of NCCL dentin was measured usingransverse microradiography (TMR), which showed an average
ineral loss of 12.3 % in NCCL of the extracted teeth. Since dentinaries exhibits more than 25 % loss of mineral contents, the levelf mineral loss in NCCL was much lower than that in dentin caries.ttenuation coefficient (�t) of SS-OCT signal in the NCCL dentinas also calculated in vitro, and it was linked with the TMR results.
he �t value as a threshold for the detection of demineralizationas then chosen from the average �t and standard deviation.
ates that remaining dentin is very thin (arrow). remaining dentin (arrow).
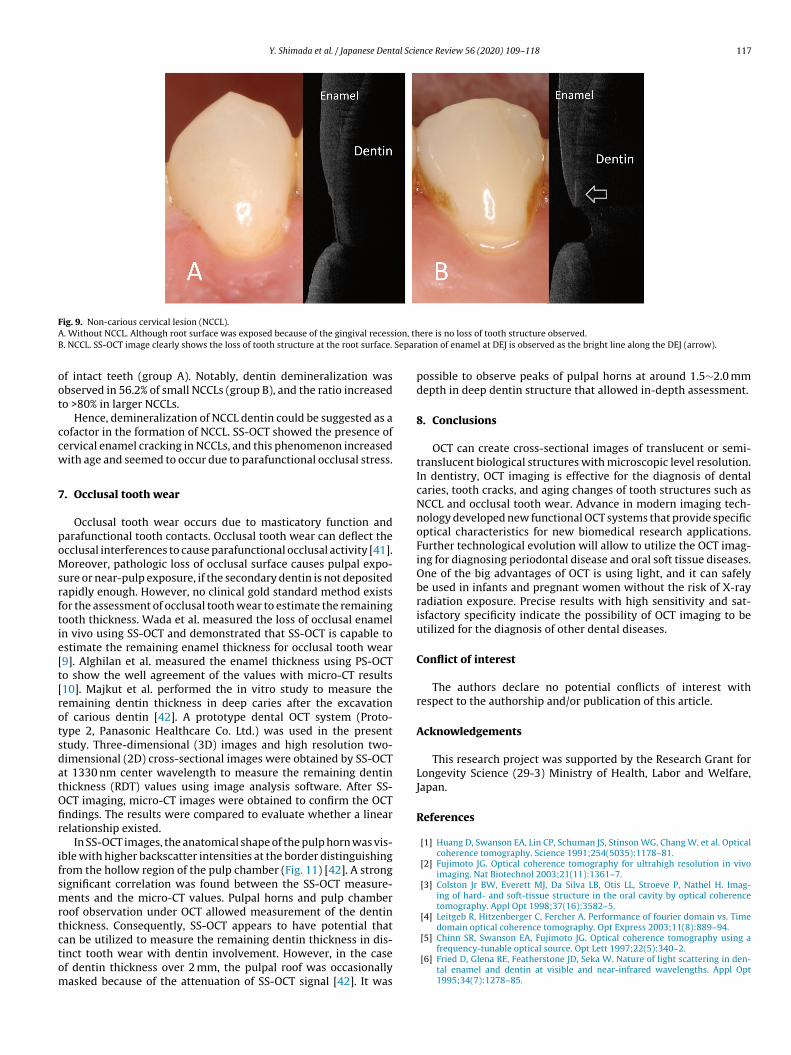
In the in vivo study, 242 buccal surfaces were investigated in 35healthy adults. SS-OCT imaging was performed scanning over theNCCL using hand-held probe. Presence and dimensions of NCCLs,cervical cracking and the degree of demineralization at the exposedcervical dentin were determined using SS-OCT (Fig. 9) [17]. Of the242 teeth, NCCLs were found in 145, while 97 were intact teeth.Among the teeth with NCCLs, the presence of occlusal attrition wasconfirmed in 87 (60%) teeth, hypersensitivity in 58 (40%) teeth,cervical enamel cracks in 44 (30.3%) teeth, and dentin deminer-alization in 100 (69.0%) teeth.
The frequency of occlusal wear, cracking, hypersensitivity, anddentin demineralization in each NCCL size group is summarizedin Fig. 10 [9]. Analysis of the dimensions of NCCLs revealed that
ineralization were significantly more prevalent in NCCL cases, evenin cases with small lesions (group B), as compared to the group
Y. Shimada et al. / Japanese Dental Science Review 56 (2020) 109–118 117
FA ion, thB Separ
oot
ccw
7
poMsrftie[t[rotsdatOfir
ifsmrtctom
ig. 9. Non-carious cervical lesion (NCCL).. Without NCCL. Although root surface was exposed because of the gingival recess. NCCL. SS-OCT image clearly shows the loss of tooth structure at the root surface.
f intact teeth (group A). Notably, dentin demineralization wasbserved in 56.2% of small NCCLs (group B), and the ratio increasedo >80% in larger NCCLs.
Hence, demineralization of NCCL dentin could be suggested as aofactor in the formation of NCCL. SS-OCT showed the presence ofervical enamel cracking in NCCLs, and this phenomenon increasedith age and seemed to occur due to parafunctional occlusal stress.
. Occlusal tooth wear
Occlusal tooth wear occurs due to masticatory function andarafunctional tooth contacts. Occlusal tooth wear can deflect thecclusal interferences to cause parafunctional occlusal activity [41].oreover, pathologic loss of occlusal surface causes pulpal expo-
ure or near-pulp exposure, if the secondary dentin is not depositedapidly enough. However, no clinical gold standard method existsor the assessment of occlusal tooth wear to estimate the remainingooth thickness. Wada et al. measured the loss of occlusal enameln vivo using SS-OCT and demonstrated that SS-OCT is capable tostimate the remaining enamel thickness for occlusal tooth wear9]. Alghilan et al. measured the enamel thickness using PS-OCTo show the well agreement of the values with micro-CT results10]. Majkut et al. performed the in vitro study to measure theemaining dentin thickness in deep caries after the excavationf carious dentin [42]. A prototype dental OCT system (Proto-ype 2, Panasonic Healthcare Co. Ltd.) was used in the presenttudy. Three-dimensional (3D) images and high resolution two-imensional (2D) cross-sectional images were obtained by SS-OCTt 1330 nm center wavelength to measure the remaining dentinhickness (RDT) values using image analysis software. After SS-CT imaging, micro-CT images were obtained to confirm the OCTndings. The results were compared to evaluate whether a linearelationship existed.
In SS-OCT images, the anatomical shape of the pulp horn was vis-ble with higher backscatter intensities at the border distinguishingrom the hollow region of the pulp chamber (Fig. 11) [42]. A strongignificant correlation was found between the SS-OCT measure-ents and the micro-CT values. Pulpal horns and pulp chamber
oof observation under OCT allowed measurement of the dentinhickness. Consequently, SS-OCT appears to have potential that
an be utilized to measure the remaining dentin thickness in dis-inct tooth wear with dentin involvement. However, in the casef dentin thickness over 2 mm, the pulpal roof was occasionallyasked because of the attenuation of SS-OCT signal [42]. It wasere is no loss of tooth structure observed.ation of enamel at DEJ is observed as the bright line along the DEJ (arrow).
possible to observe peaks of pulpal horns at around 1.5∼2.0 mmdepth in deep dentin structure that allowed in-depth assessment.
8. Conclusions
OCT can create cross-sectional images of translucent or semi-translucent biological structures with microscopic level resolution.In dentistry, OCT imaging is effective for the diagnosis of dentalcaries, tooth cracks, and aging changes of tooth structures such asNCCL and occlusal tooth wear. Advance in modern imaging tech-nology developed new functional OCT systems that provide specificoptical characteristics for new biomedical research applications.Further technological evolution will allow to utilize the OCT imag-ing for diagnosing periodontal disease and oral soft tissue diseases.One of the big advantages of OCT is using light, and it can safelybe used in infants and pregnant women without the risk of X-rayradiation exposure. Precise results with high sensitivity and sat-isfactory specificity indicate the possibility of OCT imaging to beutilized for the diagnosis of other dental diseases.
Conflict of interest
The authors declare no potential conflicts of interest withrespect to the authorship and/or publication of this article.
Acknowledgements
This research project was supported by the Research Grant forLongevity Science (29-3) Ministry of Health, Labor and Welfare,Japan.
References
[1] Huang D, Swanson EA, Lin CP, Schuman JS, Stinson WG, Chang W, et al. Opticalcoherence tomography. Science 1991;254(5035):1178–81.
[2] Fujimoto JG. Optical coherence tomography for ultrahigh resolution in vivoimaging. Nat Biotechnol 2003;21(11):1361–7.
[3] Colston Jr BW, Everett MJ, Da Silva LB, Otis LL, Stroeve P, Nathel H. Imag-ing of hard- and soft-tissue structure in the oral cavity by optical coherencetomography. Appl Opt 1998;37(16):3582–5.
[4] Leitgeb R, Hitzenberger C, Fercher A. Performance of fourier domain vs. Timedomain optical coherence tomography. Opt Express 2003;11(8):889–94.
[5] Chinn SR, Swanson EA, Fujimoto JG. Optical coherence tomography using afrequency-tunable optical source. Opt Lett 1997;22(5):340–2.
[6] Fried D, Glena RE, Featherstone JD, Seka W. Nature of light scattering in den-tal enamel and dentin at visible and near-infrared wavelengths. Appl Opt1995;34(7):1278–85.
1 al Scie
[
[
[
[
[
[
[
[
[
[
[
[
[
[
[
[
[
[
[
[
[
[
[
[
[
[[
[
[
[
[
[41] Smith BG, Knight JK. An index for measuring the wear of teeth. Br Dent J1984;156(12):435–8.
[42] Majkut P, Sadr A, Shimada Y, Sumi Y, Tagami J. Validation of optical coherencetomography against micro-computed tomography for evaluation of remainingcoronal dentin thickness. J Endod 2015;41(8):1349–52.
18 Y. Shimada et al. / Japanese Dent
[7] Imai K, Shimada Y, Sadr A, Sumi Y, Tagami J. Noninvasive cross-sectional visu-alization of enamel cracks by optical coherence tomography in vitro. J Endod2012;38(9):1269–74.
[8] Segarra MS, Shimada Y, Sadr A, Sumi Y, Tagami J. Three-dimensional analy-sis of enamel crack behavior using optical coherence tomography. J Dent Res2017;96(3):308–14.
[9] Wada I, Shimada Y, Ikeda M, Sadr A, Nakashima S, Tagami J, et al. Clinicalassessment of non carious cervical lesion using swept-source optical coherencetomography. J Biophotonics 2015;8(10):846–54.
10] Alghilan MA, Lippert F, Platt JA, Eckert GJ, González-Cabezas C, Fried D, et al.In vitro longitudinal evaluation of enamel wear by cross-polarization opticalcoherence tomography. Dent Mater 2019;35(10):1464–70.
11] Addy M, Shellis RP. Interaction between attrition, abrasion and erosion in toothwear. Monogr Oral Sci 2006;20:17–31.
12] Bartlett DW. The role of erosion in tooth wear: aetiology, prevention and man-agement. Int Dent J 2005;55(4 Suppl 1):277–84.
13] Truin GJ, van Rijkom HM, Mulder J, van’t Hof MA. Caries trends 1996-2002among 6- and 12-year-old children and erosive wear prevalence among 12-year-old children in the Hague. Caries Res 2005;39(1):2–8.
14] Cvek M, Cleaton-Jones PE, Austin JC, Andreasen JO. Pulp reactions to expo-sure after experimental crown fractures or grinding in adult monkeys. J Endod1982;8(9):391–7.
15] Fried D, Staninec M, Darling CL, Lee C, Kang H, Chan KH. In vivo Near-IR imagingof occlusal lesions at 1310-nm. Proc SPIE Int Soc Opt Eng 2011, 7884(78840b).
16] Choma M, Sarunic M, Yang C, Izatt J. Sensitivity advantage of sweptsource and Fourier domain optical coherence tomography. Opt Express2003;11(18):2183–9.
17] Marshall Jr GW, Marshall SJ, Kinney JH, Balooch M. The dentin substrate: struc-ture and properties related to bonding. J Dent 1997;25(6):441–58.
18] Nakagawa H, Sadr A, Shimada Y, Tagami J, Sumi Y. Validation of swept sourceoptical coherence tomography (SS-OCT) for the diagnosis of smooth surfacecaries in vitro. J Dent 2013;41(1):80–9.
19] Shimada Y, Sadr A, Burrow MF, Tagami J, Ozawa N, Sumi Y. Validation of swept-source optical coherence tomography (SS-OCT) for the diagnosis of occlusalcaries. J Dent 2010;38(8):655–65.
20] Hariri I, Sadr A, Nakashima S, Shimada Y, Tagami J, Sumi Y. Estimation ofthe enamel and dentin mineral content from the refractive index. Caries Res2013;47(1):18–26.
21] Natsume Y, Nakashima S, Sadr A, Shimada Y, Tagami J, Sumi Y. Estimationof lesion progress in artificial root caries by swept source optical coherencetomography in comparison to transverse microradiography. J Biomed Opt2011;16(7):071408.
22] Takagi S, Liao H, Chow LC. Effect of tooth-bound fluoride on enamel deminer-alization/ remineralization in vitro. Caries Res 2000;34(4):281–8.
23] Darling CL, Huynh GD, Fried D. Light scattering properties of naturaland artificially demineralized dental enamel at 1310 nm. J Biomed Opt2006;11(3):34023.
24] Jones RS, Fried D. Remineralization of enamel caries can decrease optical reflec-tivity. J Dent Res 2006;85(9):804–8.
25] Shimada Y, Sadr A, Sumi Y, Tagami J. Application of optical coherence tomogra-phy (OCT) for diagnosis of caries, cracks, and defects of restorations. Curr OralHealth Rep 2015;2(2):73–80.
nce Review 56 (2020) 109–118
26] Luong MN, Shimada Y, Araki K, Yoshiyama M, Tagami J, Sadr A. Diagnosisof occlusal caries with dynamic slicing of 3D optical coherence tomographyimages. Sensors (Basel) 2020;20(6).
27] Ricketts D, Kidd E, Weerheijm K, de Soet H. Hidden caries: what is it? Does itexist? does it matter? Int Dent J 1997;47(5):259–65.
28] Bader JD, Shugars DA, Bonito AJ. Systematic reviews of selected dental cariesdiagnostic and management methods. J Dent Educ 2001;65(10):960–8.
29] Shimada Y, Nakagawa H, Sadr A, Wada I, Nakajima M, Nikaido T, et al. Nonin-vasive cross-sectional imaging of proximal caries using swept-source opticalcoherence tomography (SS-OCT) in vivo. J Biophotonics 2014;7(7):506–13.
30] Bakhsh TA, Sadr A, Shimada Y, Tagami J, Sumi Y. Non-invasive quantification ofresin-dentin interfacial gaps using optical coherence tomography: validationagainst confocal microscopy. Dent Mater 2011;27(9):915–25.
31] Haak R, Hähnel M, Schneider H, Rosolowski M, Park KJ, Ziebolz D, et al. Clinicaland OCT outcomes of a universal adhesive in a randomized clinical trial after12 months. J Dent 2019;90:103200.
32] Han SH, Shimada Y, Sadr A, Tagami J, Kum KY, Park SH. Effect of pretreatmentand activation mode on the interfacial adaptation of nanoceramic resin inlayand self-adhesive resin cement. Dent Mater 2020.
33] Zhou Y, Shimada Y, Matin K, Sadr A, Sumi Y, Tagami J. Assessment of bacterialdemineralization around composite restorations using swept-source opticalcoherence tomography (SS-OCT). Dent Mater 2016;32(9):1177–88.
34] Matsuura C, Shimada Y, Sadr A, Sumi Y, Tagami J. Three-dimensional diagnosisof dentin caries beneath composite restorations using swept-source opticalcoherence tomography. Dent Mater J 2018;37(4):642–9.
35] Cameron CE. Cracked-tooth syndrome. J Am Dent Assoc 1964;68:405–11.36] Ellis SG. Incomplete tooth fracture–proposal for a new definition. Br Dent J
2001;190(8):424–8.37] Dowker SE, Davis GR, Elliott JC. X-ray microtomography: nondestructive three-
dimensional imaging for in vitro endodontic studies. Oral Surg Oral Med OralPathol Oral Radiol Endod 1997;83(4):510–6.
38] Clark DJ, Sheets CG, Paquette JM. Definitive diagnosis of early enamel and dentincracks based on microscopic evaluation. Journal of esthetic and restorative den-tistry : official publication of the American Academy of Esthetic Dentistry [etal] 2003;15(7):391–401, discussion.
39] Piotrowski BT, Gillette WB, Hancock EB. Examining the prevalence and charac-teristics of abfractionlike cervical lesions in a population of U.S. Veterans. J AmDent Assoc 2001;132(12):1694–701, quiz 726-727.
40] Aw TC, Lepe X, Johnson GH, Mancl L. Characteristics of noncarious cervicallesions: a clinical investigation. J Am Dent Assoc 2002;133(6):725–33.