Embed Size (px)
Citation preview
238
2015Oct. 2015
Digest of Japanese Science and Technology
Indicators 2016 Aug. 2016
Research Unit for Science and Technology Analysis and Indicators National Institute of Science and Technology Policy, MEXT
Research Material-251
背厚:1mm
Digest of Japanese Science-H1-H4.indd 1 2016/09/07 16:54:24
This material is the English translation of the executive summary of the “Japanese Science and Technology
Indicators 2016” published by NISTEP in August 2016.
【Contributors】
Yumiko KANDA Senior Research Fellow, Research Unit for Science and Technology
Analysis and Indicators, National Institute of Science and Technology Policy,
MEXT
Akiyoshi MURAKAMI Research Fellow, Research Unit for Science and Technology Analysis and
Indicators, National Institute of Science and Technology Policy, MEXT
Naomi FUKUZAWA Research Fellow, Research Unit for Science and Technology Analysis and
Indicators, National Institute of Science and Technology Policy, MEXT
Masatsura IGAMI Director, Research Unit for Science and Technology Analysis and Indicators,
National Institute of Science and Technology Policy, MEXT
Please specify reference as the following example when citing this NISTEP RESEARCH MATERIAL.
“Japanese Science and Technology Indicators 2016”, NISTEP RESEARCH MATERIAL No. 251,
National Institute of Science and Technology Policy, Tokyo.
DOI:http://doi.org/10.15108/rm251e
Japanese Science and Technology Indicators 2016 (ABSTRACT)
"Science and Technology Indicators" is a basic resource for understanding Japanese science and
technology activities based on objective and quantitative data. It classifies science and technology
activities into five categories, R&D Expenditure; R&D Personnel; Higher Education; The Output of R&D;
and Science, Technology, and Innovation. The multiple relevant indicators (approximately 150 indicators)
show the state of Japanese science and technology activities. "Japanese Science and Technology Indicators
2016" includes new indicators and indicators with modified visualization, totally about 10 indicators, such
as the global mobility of foreign students (higher education level), the respective situations of
technological trade in Japan and the United States, and the external sources of information that companies
think important in innovation activities.
Overviewing the latest Japan’s situation from "Science and Technology Indicators 2016," it was found
that in the Japanese business enterprise sector, the manufacturing industry accounts for 87% of research
and development expenditure and for 88% of the researchers. Also, the number of researchers per 1,000
labor force is 547 in the manufacturing industry and 53 in the non-manufacturing industry.
The number of Japanese students studying overseas (1.0% of students worldwide) and the number of
students from overseas accepted into higher education institutions in Japan (4.2%) are both small. The
country that sent out the largest number of students for overseas studies is China at 20.7%. The United
States accepted the largest number of foreign students at higher education institutions (24.0% of students
worldwide), followed by the United Kingdom at 12.8%.
The number of scientific publications from Japan remained almost flat in last 10 years, however the
position of Japan in the global rank moved down due to a growth of other countries. Japan has remained,
however, as the top in the number of patent families since 10 years ago.

Blank page
- 1 -
1. Circumstances in Japan and the selected countries in terms of R&D expenditure
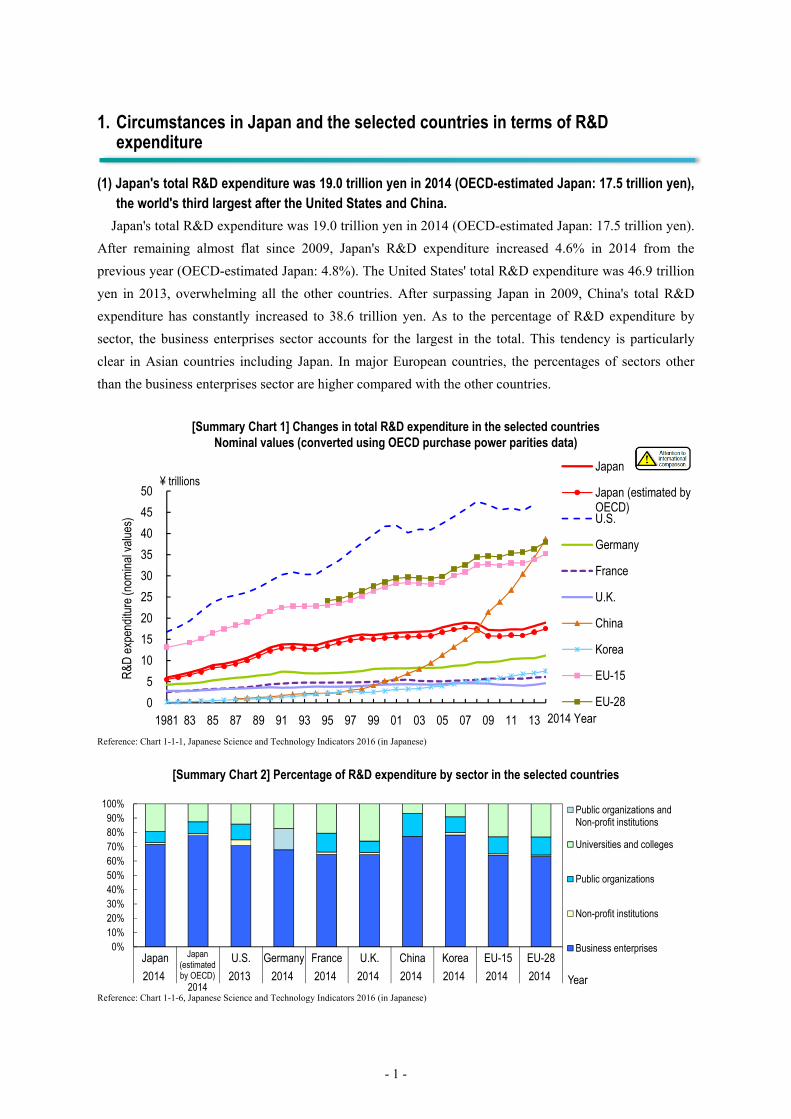
(1) Japan's total R&D expenditure was 19.0 trillion yen in 2014 (OECD-estimated Japan: 17.5 trillion yen),
the world's third largest after the United States and China.
Japan's total R&D expenditure was 19.0 trillion yen in 2014 (OECD-estimated Japan: 17.5 trillion yen).
After remaining almost flat since 2009, Japan's R&D expenditure increased 4.6% in 2014 from the
previous year (OECD-estimated Japan: 4.8%). The United States' total R&D expenditure was 46.9 trillion
yen in 2013, overwhelming all the other countries. After surpassing Japan in 2009, China's total R&D
expenditure has constantly increased to 38.6 trillion yen. As to the percentage of R&D expenditure by
sector, the business enterprises sector accounts for the largest in the total. This tendency is particularly
clear in Asian countries including Japan. In major European countries, the percentages of sectors other
than the business enterprises sector are higher compared with the other countries.
[Summary Chart 1] Changes in total R&D expenditure in the selected countries Nominal values (converted using OECD purchase power parities data)
Reference: Chart 1-1-1, Japanese Science and Technology Indicators 2016 (in Japanese)
[Summary Chart 2] Percentage of R&D expenditure by sector in the selected countries
Reference: Chart 1-1-6, Japanese Science and Technology Indicators 2016 (in Japanese)
0
5
10
15
20
25
30
35
40
45
50
1981 83 85 87 89 91 93 95 97 99 01 03 05 07 09 11 13
R&D
exp
endi
ture
(nom
inal
val
ues)
2014 Year
Japan
Japan (estimated byOECD)U.S.
Germany
France
U.K.
China
Korea
EU-15
EU-28
¥ trillions
0%10%20%30%40%50%60%70%80%90%
100%
Japan U.S. Germany France U.K. China Korea EU-15 EU-28
2014 2014 2013 2014 2014 2014 2014 2014 2014 2014 Year
Public organizations andNon-profit institutions
Universities and colleges
Public organizations
Non-profit institutions
Business enterprisesJapan (estimated by OECD)
2014
- 2 -
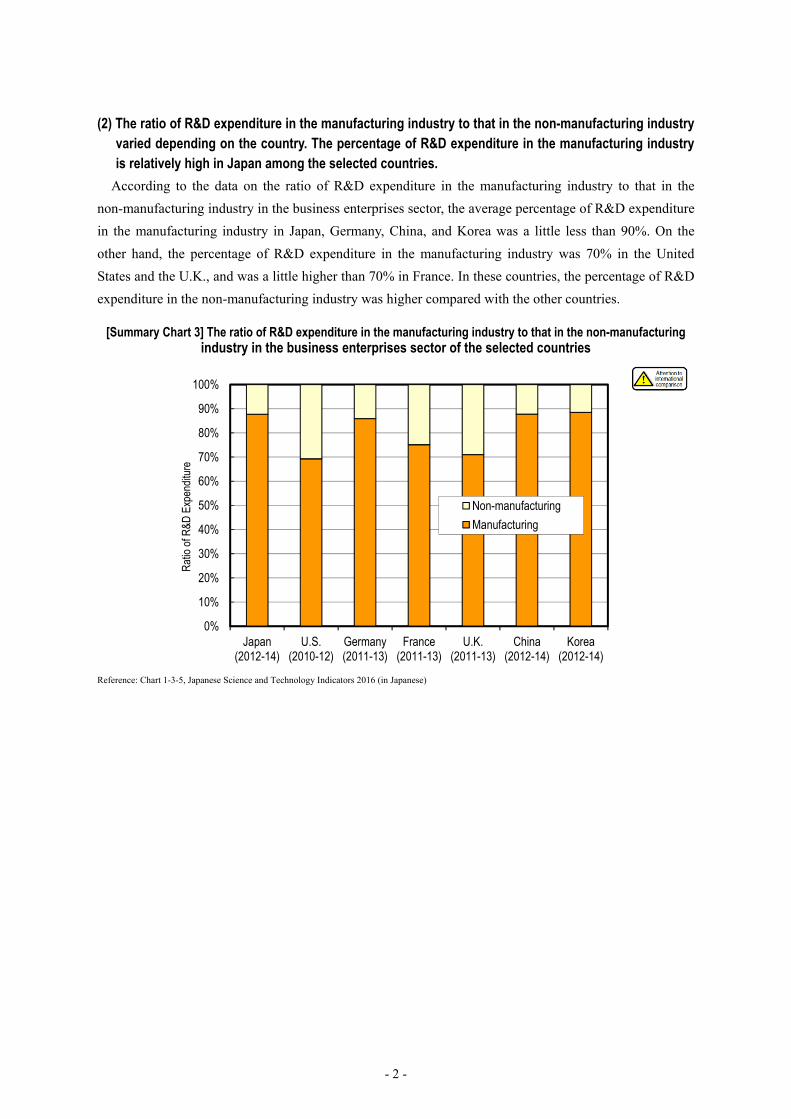
(2) The ratio of R&D expenditure in the manufacturing industry to that in the non-manufacturing industry varied depending on the country. The percentage of R&D expenditure in the manufacturing industry is relatively high in Japan among the selected countries.
According to the data on the ratio of R&D expenditure in the manufacturing industry to that in the
non-manufacturing industry in the business enterprises sector, the average percentage of R&D expenditure
in the manufacturing industry in Japan, Germany, China, and Korea was a little less than 90%. On the
other hand, the percentage of R&D expenditure in the manufacturing industry was 70% in the United
States and the U.K., and was a little higher than 70% in France. In these countries, the percentage of R&D
expenditure in the non-manufacturing industry was higher compared with the other countries.
[Summary Chart 3] The ratio of R&D expenditure in the manufacturing industry to that in the non-manufacturing industry in the business enterprises sector of the selected countries
Reference: Chart 1-3-5, Japanese Science and Technology Indicators 2016 (in Japanese)
0%
10%
20%
30%
40%
50%
60%
70%
80%
90%
100%
Japan(2012-14)
U.S.(2010-12)
Germany(2011-13)
France(2011-13)
U.K.(2011-13)
China(2012-14)
Korea(2012-14)
Rat
io o
f R&D
Exp
endi
ture
Non-manufacturing
Manufacturing
- 3 -
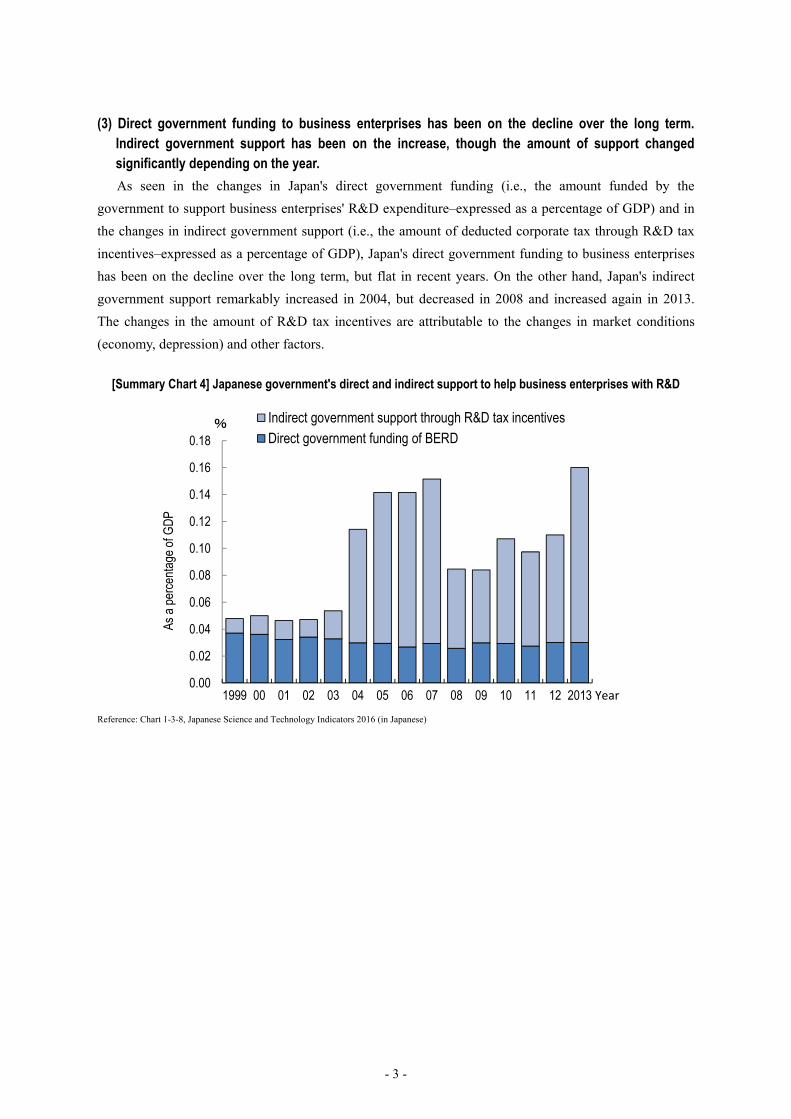
(3) Direct government funding to business enterprises has been on the decline over the long term. Indirect government support has been on the increase, though the amount of support changed significantly depending on the year.
As seen in the changes in Japan's direct government funding (i.e., the amount funded by the
government to support business enterprises' R&D expenditure–expressed as a percentage of GDP) and in
the changes in indirect government support (i.e., the amount of deducted corporate tax through R&D tax
incentives–expressed as a percentage of GDP), Japan's direct government funding to business enterprises
has been on the decline over the long term, but flat in recent years. On the other hand, Japan's indirect
government support remarkably increased in 2004, but decreased in 2008 and increased again in 2013.
The changes in the amount of R&D tax incentives are attributable to the changes in market conditions
(economy, depression) and other factors.
[Summary Chart 4] Japanese government's direct and indirect support to help business enterprises with R&D
Reference: Chart 1-3-8, Japanese Science and Technology Indicators 2016 (in Japanese)
0.00
0.02
0.04
0.06
0.08
0.10
0.12
0.14
0.16
0.18
1999 00 01 02 03 04 05 06 07 08 09 10 11 12 2013
% Indirect government support through R&D tax incentivesDirect government funding of BERD
As a
per
cent
age
of G
DP
Year
- 4 -
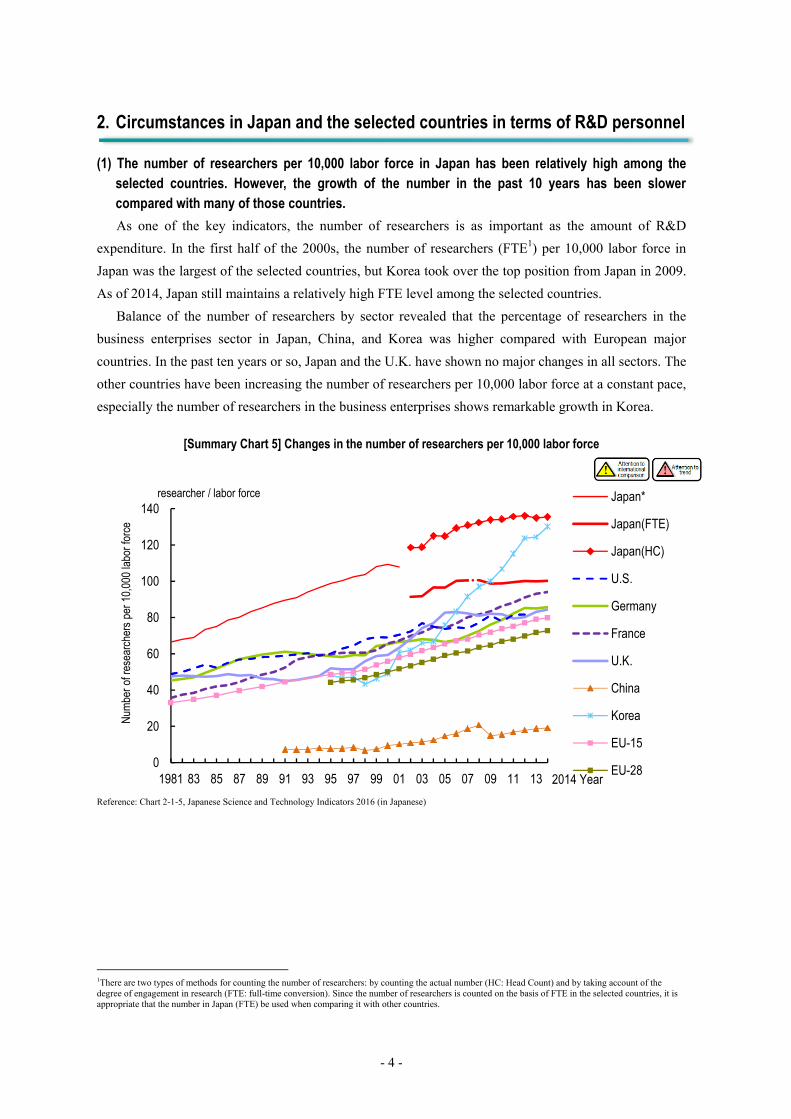
2. Circumstances in Japan and the selected countries in terms of R&D personnel
(1) The number of researchers per 10,000 labor force in Japan has been relatively high among the selected countries. However, the growth of the number in the past 10 years has been slower compared with many of those countries.
As one of the key indicators, the number of researchers is as important as the amount of R&D
expenditure. In the first half of the 2000s, the number of researchers (FTE1) per 10,000 labor force in
Japan was the largest of the selected countries, but Korea took over the top position from Japan in 2009.
As of 2014, Japan still maintains a relatively high FTE level among the selected countries.
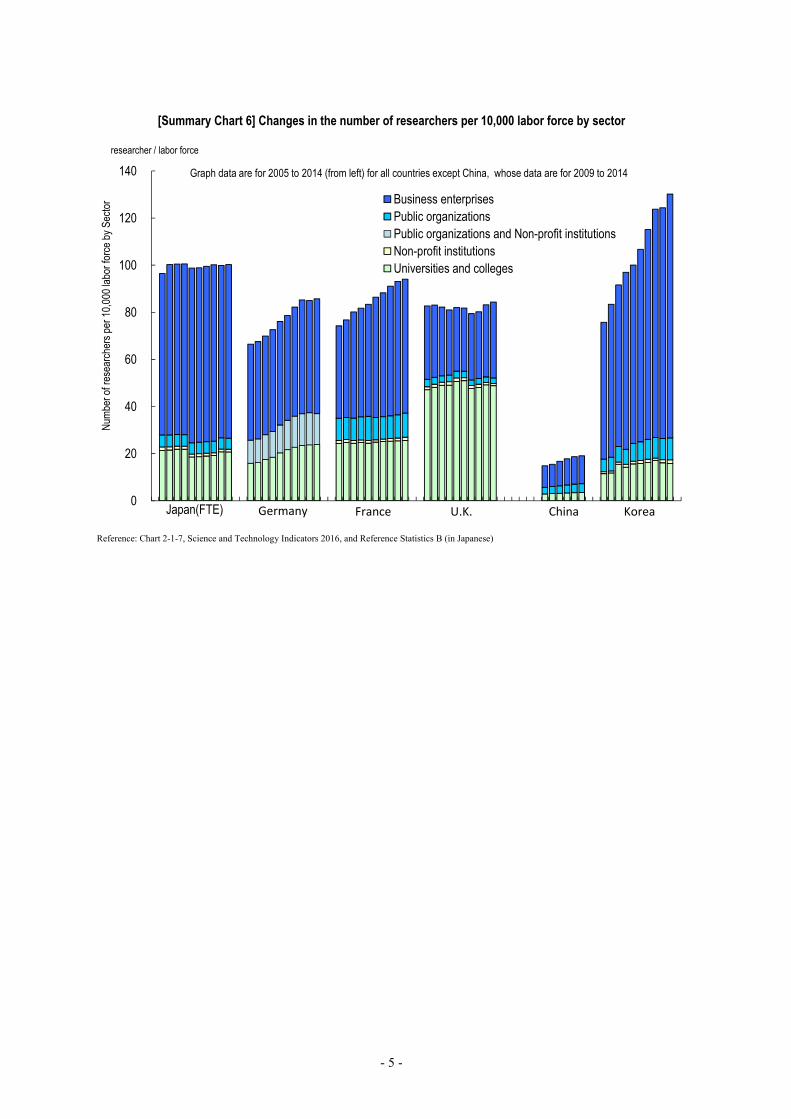
Balance of the number of researchers by sector revealed that the percentage of researchers in the
business enterprises sector in Japan, China, and Korea was higher compared with European major
countries. In the past ten years or so, Japan and the U.K. have shown no major changes in all sectors. The
other countries have been increasing the number of researchers per 10,000 labor force at a constant pace,
especially the number of researchers in the business enterprises shows remarkable growth in Korea.
[Summary Chart 5] Changes in the number of researchers per 10,000 labor force
Reference: Chart 2-1-5, Japanese Science and Technology Indicators 2016 (in Japanese)
1There are two types of methods for counting the number of researchers: by counting the actual number (HC: Head Count) and by taking account of the degree of engagement in research (FTE: full-time conversion). Since the number of researchers is counted on the basis of FTE in the selected countries, it is appropriate that the number in Japan (FTE) be used when comparing it with other countries.
0
20
40
60
80
100
120
140
1981 83 85 87 89 91 93 95 97 99 01 03 05 07 09 11 13
Num
ber o
f res
earc
hers
per
10,
000
labo
r for
ce
Japan*
Japan(FTE)
Japan(HC)
U.S.
Germany
France
U.K.
China
Korea
EU-15
EU-282014 Year
researcher / labor force
- 5 -
[Summary Chart 6] Changes in the number of researchers per 10,000 labor force by sector
Reference: Chart 2-1-7, Science and Technology Indicators 2016, and Reference Statistics B (in Japanese)
0
20
40
60
80
100
120
140
Num
ber o
f res
earc
hers
per
10,
000
labo
r for
ce b
y Se
ctor
Business enterprisesPublic organizationsPublic organizations and Non-profit institutionsNon-profit institutionsUniversities and colleges
GermanyJapan(FTE) France U.K. Korea
Graph data are for 2005 to 2014 (from left) for all countries except China, whose data are for 2009 to 2014
China
researcher / labor force
- 6 -
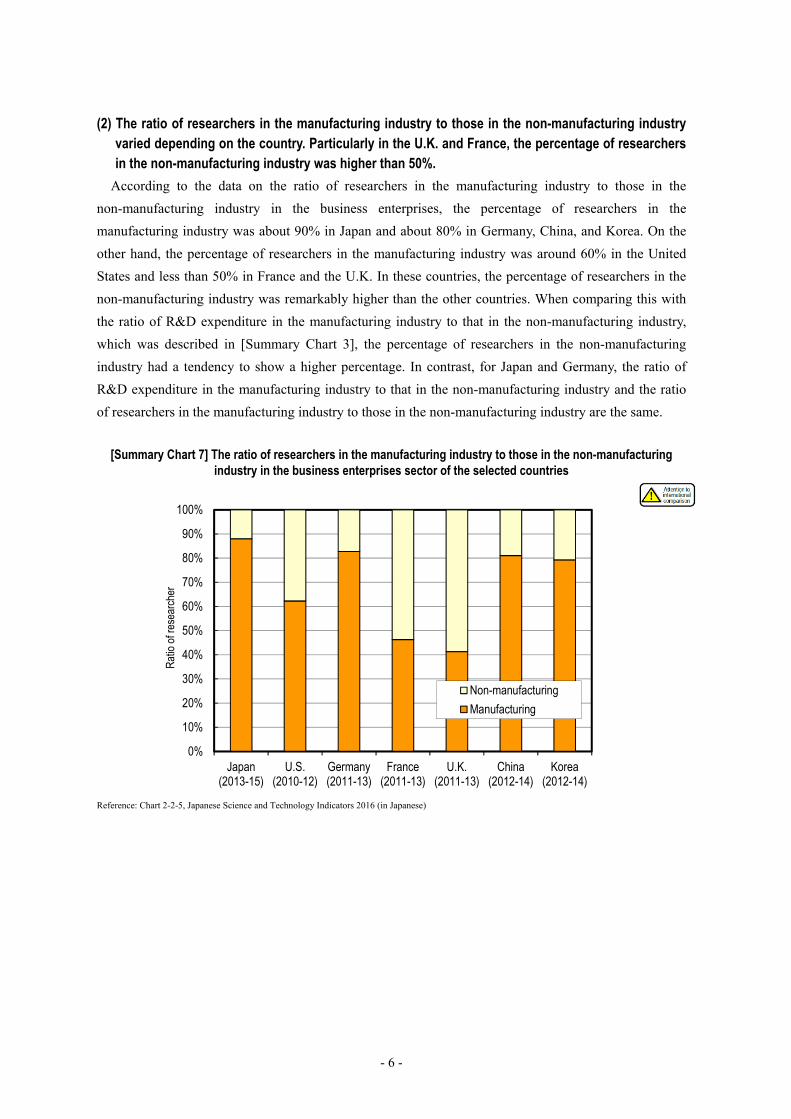
(2) The ratio of researchers in the manufacturing industry to those in the non-manufacturing industry varied depending on the country. Particularly in the U.K. and France, the percentage of researchers in the non-manufacturing industry was higher than 50%.
According to the data on the ratio of researchers in the manufacturing industry to those in the
non-manufacturing industry in the business enterprises, the percentage of researchers in the
manufacturing industry was about 90% in Japan and about 80% in Germany, China, and Korea. On the
other hand, the percentage of researchers in the manufacturing industry was around 60% in the United
States and less than 50% in France and the U.K. In these countries, the percentage of researchers in the
non-manufacturing industry was remarkably higher than the other countries. When comparing this with
the ratio of R&D expenditure in the manufacturing industry to that in the non-manufacturing industry,
which was described in [Summary Chart 3], the percentage of researchers in the non-manufacturing
industry had a tendency to show a higher percentage. In contrast, for Japan and Germany, the ratio of
R&D expenditure in the manufacturing industry to that in the non-manufacturing industry and the ratio
of researchers in the manufacturing industry to those in the non-manufacturing industry are the same.
[Summary Chart 7] The ratio of researchers in the manufacturing industry to those in the non-manufacturing industry in the business enterprises sector of the selected countries
Reference: Chart 2-2-5, Japanese Science and Technology Indicators 2016 (in Japanese)
0%
10%
20%
30%
40%
50%
60%
70%
80%
90%
100%
Japan(2013-15)
U.S.(2010-12)
Germany(2011-13)
France(2011-13)
U.K.(2011-13)
China(2012-14)
Korea(2012-14)
Rat
io o
f res
earc
her
Non-manufacturing
Manufacturing
- 7 -
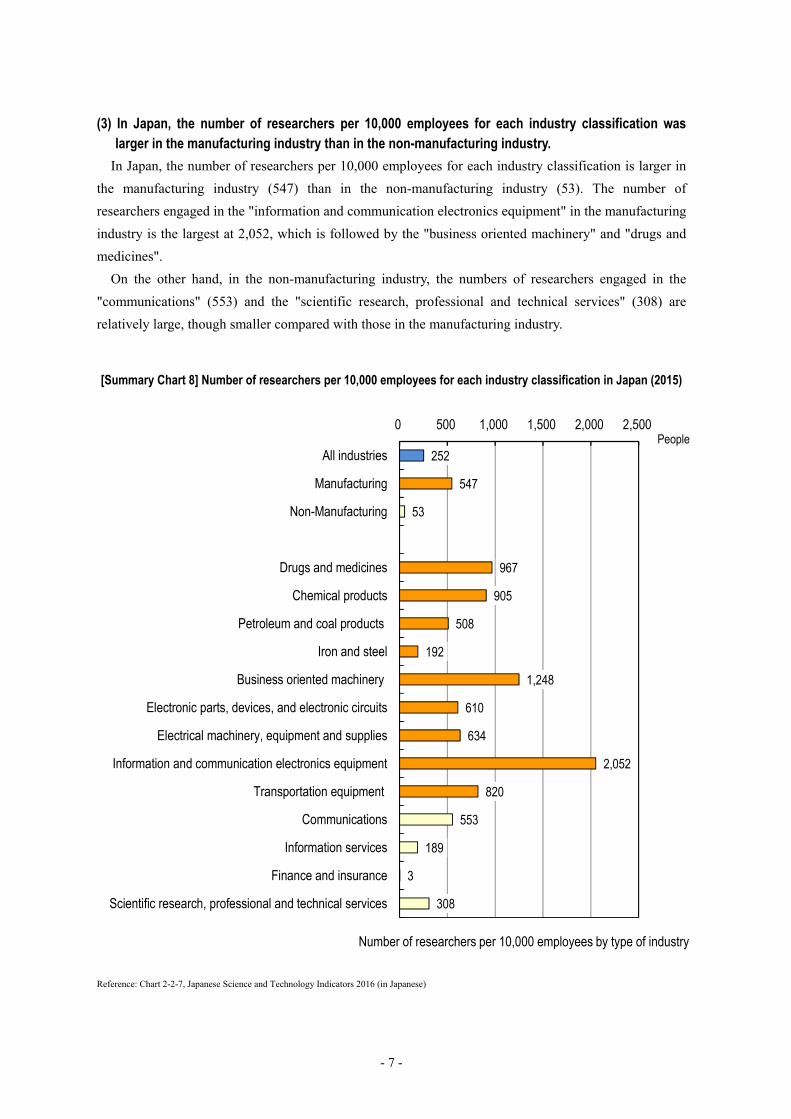
(3) In Japan, the number of researchers per 10,000 employees for each industry classification was larger in the manufacturing industry than in the non-manufacturing industry.
In Japan, the number of researchers per 10,000 employees for each industry classification is larger in
the manufacturing industry (547) than in the non-manufacturing industry (53). The number of
researchers engaged in the "information and communication electronics equipment" in the manufacturing
industry is the largest at 2,052, which is followed by the "business oriented machinery" and "drugs and
medicines".
On the other hand, in the non-manufacturing industry, the numbers of researchers engaged in the
"communications" (553) and the "scientific research, professional and technical services" (308) are
relatively large, though smaller compared with those in the manufacturing industry.
[Summary Chart 8] Number of researchers per 10,000 employees for each industry classification in Japan (2015)
Reference: Chart 2-2-7, Japanese Science and Technology Indicators 2016 (in Japanese)
252
547
53
967
905
508
192
1,248
610
634
2,052
820
553
189
3
308
0 500 1,000 1,500 2,000 2,500
All industries
Manufacturing
Non-Manufacturing
Drugs and medicines
Chemical products
Petroleum and coal products
Iron and steel
Business oriented machinery
Electronic parts, devices, and electronic circuits
Electrical machinery, equipment and supplies
Information and communication electronics equipment
Transportation equipment
Communications
Information services
Finance and insurance
Scientific research, professional and technical services
Number of researchers per 10,000 employees by type of industry
People
- 8 -
3. The situation in Japan in terms of graduates of universities and colleges
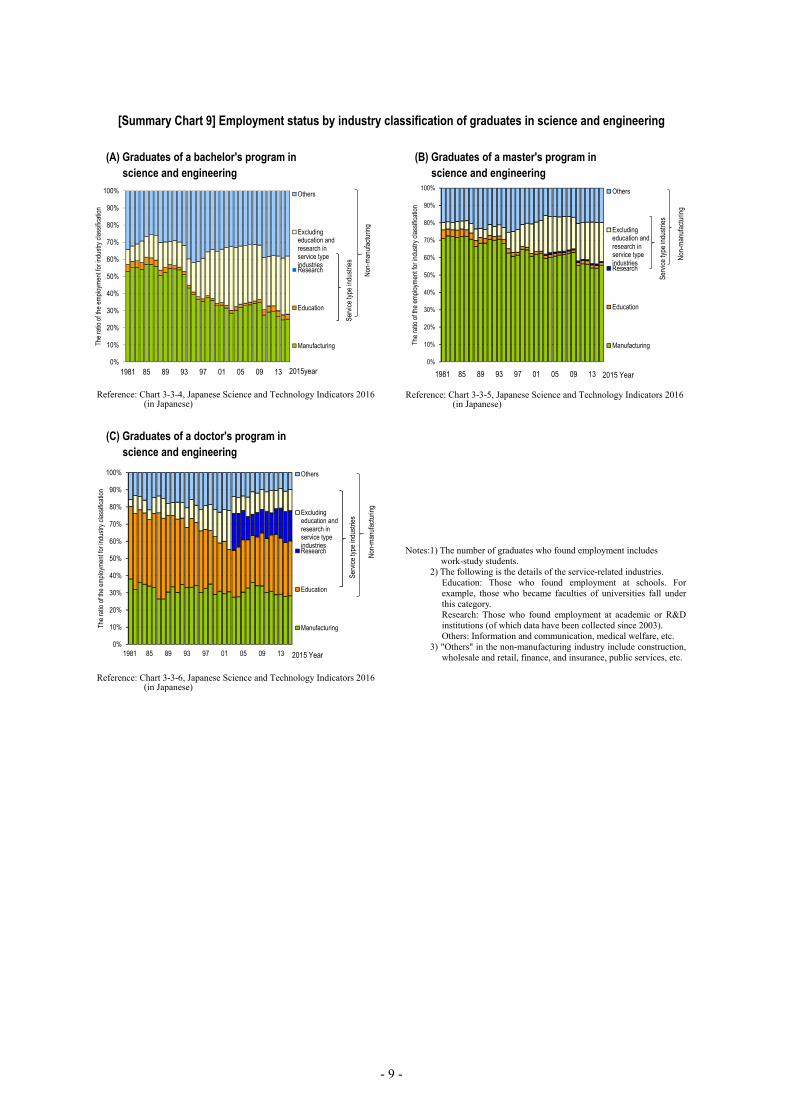
(1) The percentage of the graduates in science and engineering who found employment in the non-manufacturing industry (except research and education) was 72.0% of the graduates of a bachelor’s program and 42.2% of the graduates of a master’s program. Those percentages have been on the increase over the long term. On the other hand, the percentage of graduates who found employment in the non-manufacturing industry (except R&D) of a doctor’s program has slightly declined over the past 10 years to 22.2%.
The data for each industry classification show that 50–60% of the graduates of a bachelor’s program in
science and engineering found employment in the "manufacturing industry" in the 1980s. Since then, that
percentage has constantly declined to 25.0% in 2015. In contrast, the percentage of the graduates of a
bachelor’s program in science and engineering who found employment in the non-manufacturing
industry (except the research and education) has increased to 72.0% in 2015.
In the 1980s, 70–80% of the graduates of a master’s program in science and engineering found
employment in the "manufacturing industry." Since then that percentage has constantly decreased to 60%
in 2010 and then to 55.6% in 2015. In contrast, the percentage of the graduates of a master’s program in
science and engineering who found employment in the non-manufacturing industry (except the research
and education) has increased to 42.2% in 2015.
About 30% of the graduates of a doctor’s program in science and engineering found employment in
the "manufacturing industry," and the percentage was 28.3% in 2015. The percentage of the graduates of
a doctor’s program in science and engineering who found employment in the "education" (e.g., schools)
reached 50% in the middle of the 1980s. However, entering the 2000s, that percentage declined to a little
less than 30% but the percentage in 2015 was 31.9%. Similarly, the percentage of the graduates of a
doctor’s program in science and engineering who found employment in the "research" (e.g., academic
and R&D institutions) was 17.6% in 2015. On the other hand, the percentage of the graduates of a
doctor’s program in science and engineering who found employment in the non-manufacturing industry
(except the research and education) has slightly declined in the past 10 years to 22.2% in 2015.
- 9 -
[Summary Chart 9] Employment status by industry classification of graduates in science and engineering
(A) Graduates of a bachelor's program in science and engineering
Reference: Chart 3-3-4, Japanese Science and Technology Indicators 2016
(in Japanese)
(C) Graduates of a doctor's program in science and engineering
Reference: Chart 3-3-6, Japanese Science and Technology Indicators 2016
(in Japanese)
(B) Graduates of a master's program in science and engineering
Reference: Chart 3-3-5, Japanese Science and Technology Indicators 2016
(in Japanese)
Notes:1) The number of graduates who found employment includes
work-study students. 2) The following is the details of the service-related industries.
Education: Those who found employment at schools. For example, those who became faculties of universities fall under this category. Research: Those who found employment at academic or R&D institutions (of which data have been collected since 2003). Others: Information and communication, medical welfare, etc.
3) "Others" in the non-manufacturing industry include construction, wholesale and retail, finance, and insurance, public services, etc.
0%
10%
20%
30%
40%
50%
60%
70%
80%
90%
100%
1981 85 89 93 97 01 05 09 13
The
ratio
of t
he e
mpl
oym
ent f
or in
dust
ry c
lass
ifica
tion
2015year
Others
Excludingeducation andresearch inservice typeindustriesResearch
Education
ManufacturingSe
rvic
ety
pe in
dust
ries
Non
-man
ufac
turin
g0%
10%
20%
30%
40%
50%
60%
70%
80%
90%
100%
1981 85 89 93 97 01 05 09 13
The
ratio
of t
he e
mpl
oym
ent f
or in
dust
ry c
lass
ifica
tion
Others
Excludingeducation andresearch inservice typeindustriesResearch
Education
Manufacturing
2015 Year
Non
-man
ufac
turin
g
Serv
ice
type
indu
strie
s
0%
10%
20%
30%
40%
50%
60%
70%
80%
90%
100%
1981 85 89 93 97 01 05 09 13
The
ratio
of t
he e
mpl
oym
ent f
or in
dust
ry c
lass
ifica
tion
Others
Excludingeducation andresearch inservice typeindustriesResearch
Education
Manufacturing
2015 Year
Serv
ice
type
indu
strie
s
Non
-man
ufac
turin
g
- 10 -
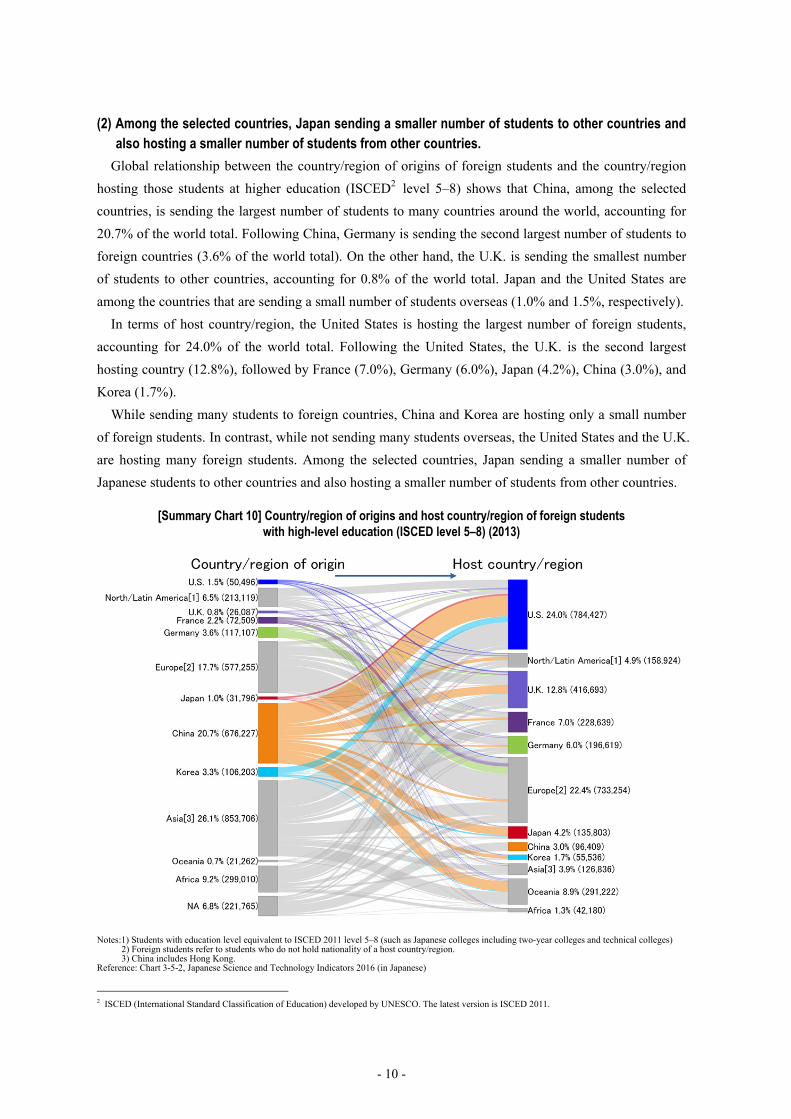
(2) Among the selected countries, Japan sending a smaller number of students to other countries and also hosting a smaller number of students from other countries.
Global relationship between the country/region of origins of foreign students and the country/region
hosting those students at higher education (ISCED2 level 5–8) shows that China, among the selected
countries, is sending the largest number of students to many countries around the world, accounting for
20.7% of the world total. Following China, Germany is sending the second largest number of students to
foreign countries (3.6% of the world total). On the other hand, the U.K. is sending the smallest number
of students to other countries, accounting for 0.8% of the world total. Japan and the United States are
among the countries that are sending a small number of students overseas (1.0% and 1.5%, respectively).
In terms of host country/region, the United States is hosting the largest number of foreign students,
accounting for 24.0% of the world total. Following the United States, the U.K. is the second largest
hosting country (12.8%), followed by France (7.0%), Germany (6.0%), Japan (4.2%), China (3.0%), and
Korea (1.7%).
While sending many students to foreign countries, China and Korea are hosting only a small number
of foreign students. In contrast, while not sending many students overseas, the United States and the U.K.
are hosting many foreign students. Among the selected countries, Japan sending a smaller number of
Japanese students to other countries and also hosting a smaller number of students from other countries.
[Summary Chart 10] Country/region of origins and host country/region of foreign students with high-level education (ISCED level 5–8) (2013)
Notes:1) Students with education level equivalent to ISCED 2011 level 5–8 (such as Japanese colleges including two-year colleges and technical colleges)
2) Foreign students refer to students who do not hold nationality of a host country/region. 3) China includes Hong Kong.
Reference: Chart 3-5-2, Japanese Science and Technology Indicators 2016 (in Japanese)
2 ISCED (International Standard Classification of Education) developed by UNESCO. The latest version is ISCED 2011.
- 11 -
4. Circumstances in Japan and the selected countries in terms of R&D output
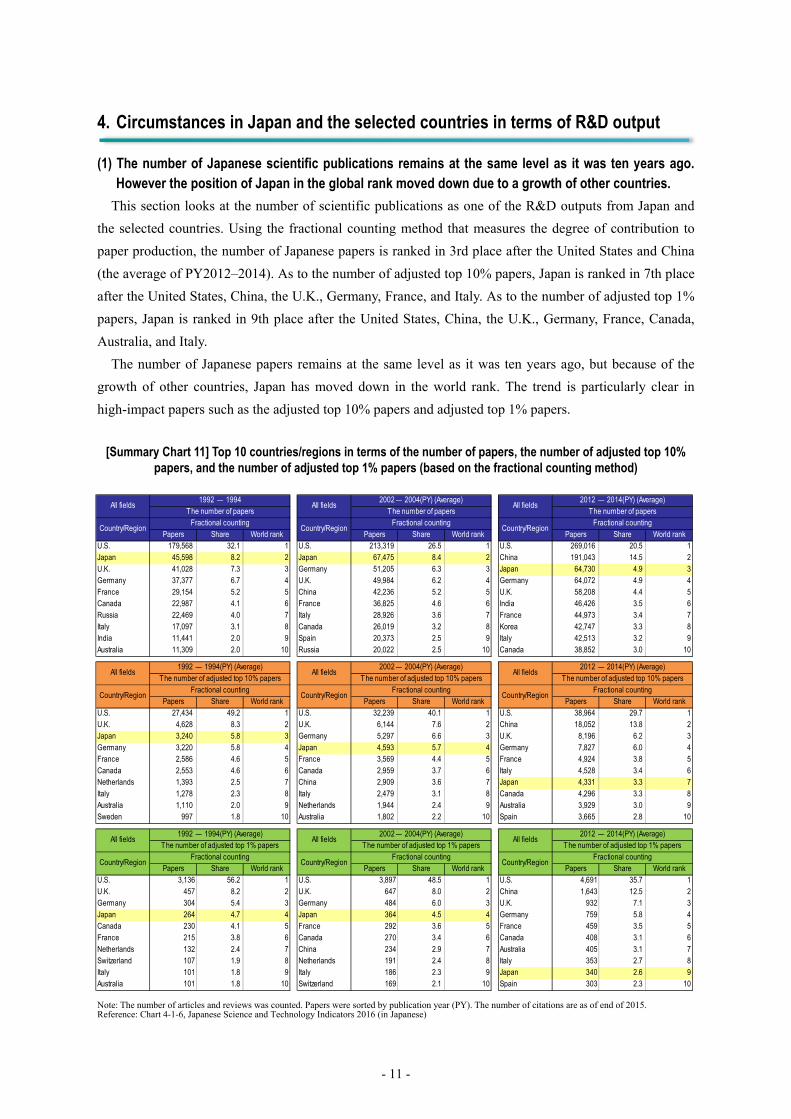
(1) The number of Japanese scientific publications remains at the same level as it was ten years ago. However the position of Japan in the global rank moved down due to a growth of other countries.
This section looks at the number of scientific publications as one of the R&D outputs from Japan and
the selected countries. Using the fractional counting method that measures the degree of contribution to
paper production, the number of Japanese papers is ranked in 3rd place after the United States and China
(the average of PY2012–2014). As to the number of adjusted top 10% papers, Japan is ranked in 7th place
after the United States, China, the U.K., Germany, France, and Italy. As to the number of adjusted top 1%
papers, Japan is ranked in 9th place after the United States, China, the U.K., Germany, France, Canada,
Australia, and Italy.
The number of Japanese papers remains at the same level as it was ten years ago, but because of the
growth of other countries, Japan has moved down in the world rank. The trend is particularly clear in
high-impact papers such as the adjusted top 10% papers and adjusted top 1% papers.
[Summary Chart 11] Top 10 countries/regions in terms of the number of papers, the number of adjusted top 10% papers, and the number of adjusted top 1% papers (based on the fractional counting method)
Note: The number of articles and reviews was counted. Papers were sorted by publication year (PY). The number of citations are as of end of 2015. Reference: Chart 4-1-6, Japanese Science and Technology Indicators 2016 (in Japanese)
Papers Share World rank Papers Share World rank Papers Share World rankU.S. 179,568 32.1 1 U.S. 213,319 26.5 1 U.S. 269,016 20.5 1Japan 45,598 8.2 2 Japan 67,475 8.4 2 China 191,043 14.5 2U.K. 41,028 7.3 3 Germany 51,205 6.3 3 Japan 64,730 4.9 3Germany 37,377 6.7 4 U.K. 49,984 6.2 4 Germany 64,072 4.9 4France 29,154 5.2 5 China 42,236 5.2 5 U.K. 58,208 4.4 5Canada 22,987 4.1 6 France 36,825 4.6 6 India 46,426 3.5 6Russia 22,469 4.0 7 Italy 28,926 3.6 7 France 44,973 3.4 7Italy 17,097 3.1 8 Canada 26,019 3.2 8 Korea 42,747 3.3 8India 11,441 2.0 9 Spain 20,373 2.5 9 Italy 42,513 3.2 9Australia 11,309 2.0 10 Russia 20,022 2.5 10 Canada 38,852 3.0 10
Papers Share World rank Papers Share World rank Papers Share World rankU.S. 27,434 49.2 1 U.S. 32,239 40.1 1 U.S. 38,964 29.7 1U.K. 4,628 8.3 2 U.K. 6,144 7.6 2 China 18,052 13.8 2Japan 3,240 5.8 3 Germany 5,297 6.6 3 U.K. 8,196 6.2 3Germany 3,220 5.8 4 Japan 4,593 5.7 4 Germany 7,827 6.0 4France 2,586 4.6 5 France 3,569 4.4 5 France 4,924 3.8 5Canada 2,553 4.6 6 Canada 2,959 3.7 6 Italy 4,528 3.4 6Netherlands 1,393 2.5 7 China 2,909 3.6 7 Japan 4,331 3.3 7Italy 1,278 2.3 8 Italy 2,479 3.1 8 Canada 4,296 3.3 8Australia 1,110 2.0 9 Netherlands 1,944 2.4 9 Australia 3,929 3.0 9Sweden 997 1.8 10 Australia 1,802 2.2 10 Spain 3,665 2.8 10
Papers Share World rank Papers Share World rank Papers Share World rankU.S. 3,136 56.2 1 U.S. 3,897 48.5 1 U.S. 4,691 35.7 1U.K. 457 8.2 2 U.K. 647 8.0 2 China 1,643 12.5 2Germany 304 5.4 3 Germany 484 6.0 3 U.K. 932 7.1 3Japan 264 4.7 4 Japan 364 4.5 4 Germany 759 5.8 4Canada 230 4.1 5 France 292 3.6 5 France 459 3.5 5France 215 3.8 6 Canada 270 3.4 6 Canada 408 3.1 6Netherlands 132 2.4 7 China 234 2.9 7 Australia 405 3.1 7Switzerland 107 1.9 8 Netherlands 191 2.4 8 Italy 353 2.7 8Italy 101 1.8 9 Italy 186 2.3 9 Japan 340 2.6 9Australia 101 1.8 10 Switzerland 169 2.1 10 Spain 303 2.3 10
2012 - 2014(PY) (Average)The number of adjusted top 1% papers The number of adjusted top 1% papers The number of adjusted top 1% papers
All fields1992 - 1994(PY) (Average)
All fields2002- 2004(PY) (Average)
All fields
2012 - 2014(PY) (Average)The number of adjusted top 10% papers The number of adjusted top 10% papers The number of adjusted top 10% papers
Country/Region
All fields1992 - 1994(PY) (Average)
All fields2002- 2004(PY) (Average)
All fields
Fractional counting
All fields1992 - 1994
All fields2002- 2004(PY) (Average)
All fields2012 - 2014(PY) (Average)
The number of papers The number of papers The number of papers
Country/RegionFractional counting
Country/RegionFractional counting
Country/Region
Fractional countingCountry/Region
Fractional countingCountry/Region
Fractional counting
Fractional countingCountry/Region
Fractional countingCountry/Region
Fractional countingCountry/Region
- 12 -
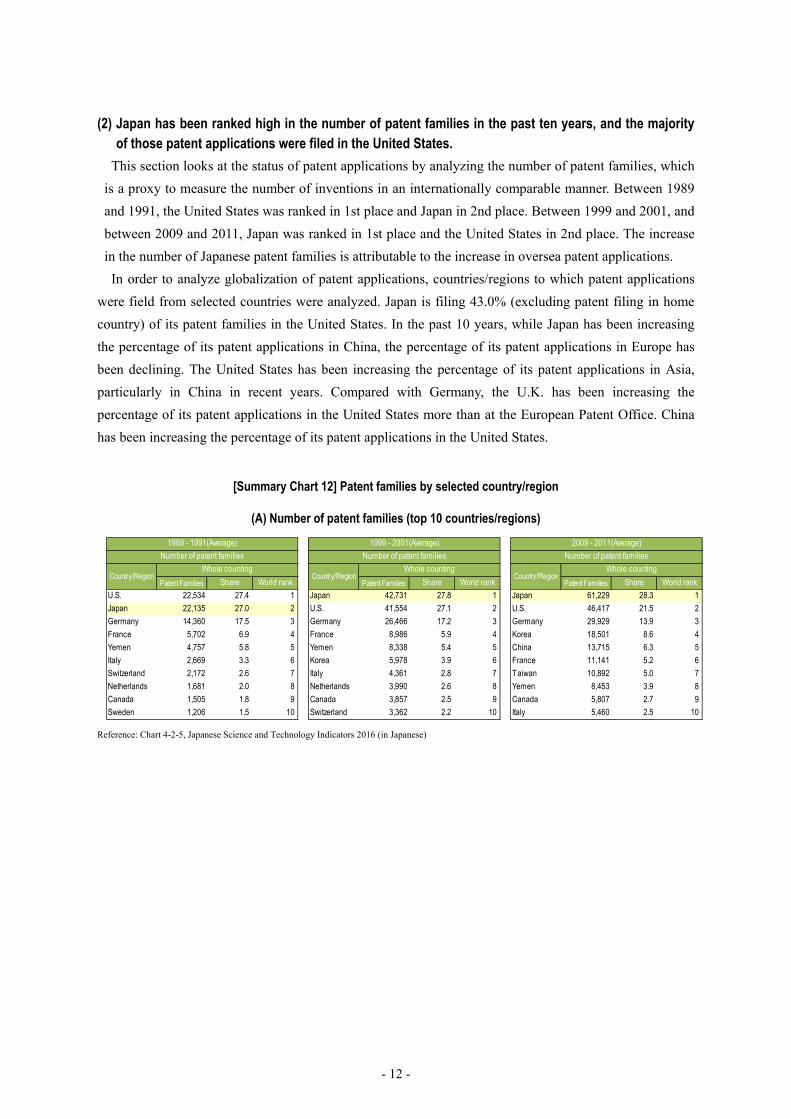
(2) Japan has been ranked high in the number of patent families in the past ten years, and the majority of those patent applications were filed in the United States.
This section looks at the status of patent applications by analyzing the number of patent families, which
is a proxy to measure the number of inventions in an internationally comparable manner. Between 1989
and 1991, the United States was ranked in 1st place and Japan in 2nd place. Between 1999 and 2001, and
between 2009 and 2011, Japan was ranked in 1st place and the United States in 2nd place. The increase
in the number of Japanese patent families is attributable to the increase in oversea patent applications.
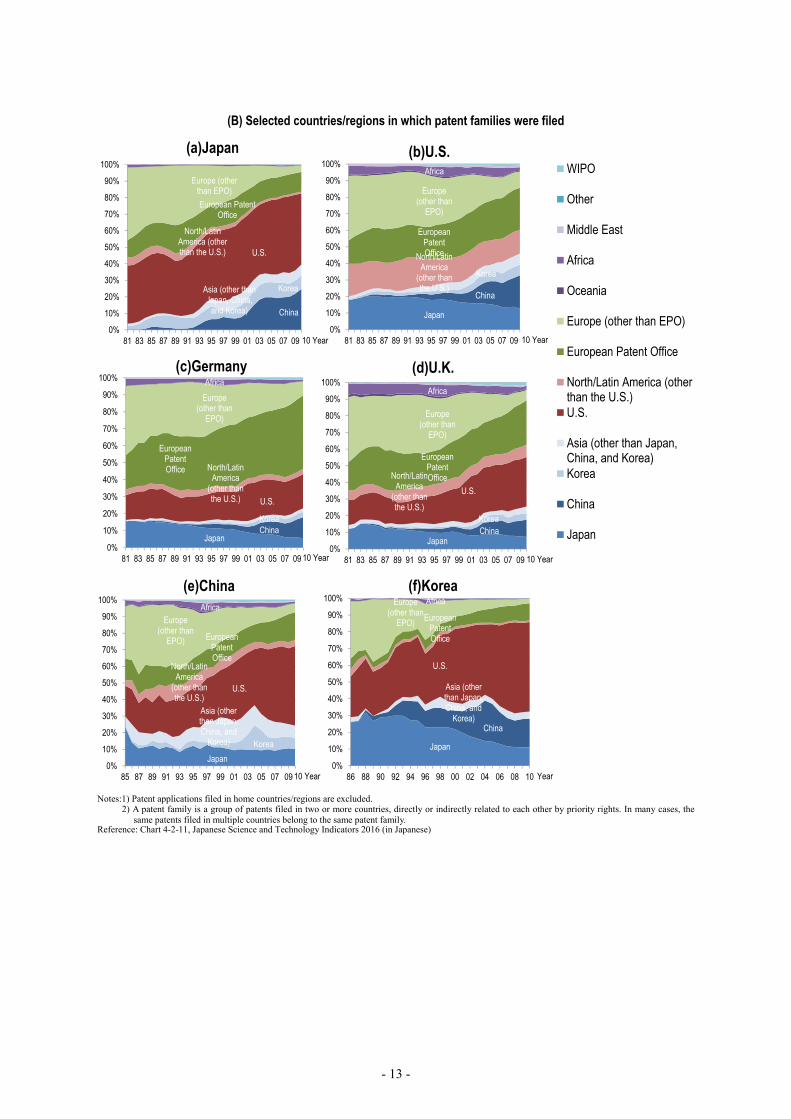
In order to analyze globalization of patent applications, countries/regions to which patent applications
were field from selected countries were analyzed. Japan is filing 43.0% (excluding patent filing in home
country) of its patent families in the United States. In the past 10 years, while Japan has been increasing
the percentage of its patent applications in China, the percentage of its patent applications in Europe has
been declining. The United States has been increasing the percentage of its patent applications in Asia,
particularly in China in recent years. Compared with Germany, the U.K. has been increasing the
percentage of its patent applications in the United States more than at the European Patent Office. China
has been increasing the percentage of its patent applications in the United States.
[Summary Chart 12] Patent families by selected country/region
(A) Number of patent families (top 10 countries/regions)
Reference: Chart 4-2-5, Japanese Science and Technology Indicators 2016 (in Japanese)
Patent Families Share World rank Patent Families Share World rank Patent Families Share World rank
U.S. 22,534 27.4 1 Japan 42,731 27.8 1 Japan 61,229 28.3 1
Japan 22,135 27.0 2 U.S. 41,554 27.1 2 U.S. 46,417 21.5 2
Germany 14,360 17.5 3 Germany 26,466 17.2 3 Germany 29,929 13.9 3
France 5,702 6.9 4 France 8,986 5.9 4 Korea 18,501 8.6 4
Yemen 4,757 5.8 5 Yemen 8,338 5.4 5 China 13,715 6.3 5
Italy 2,669 3.3 6 Korea 5,978 3.9 6 France 11,141 5.2 6
Switzerland 2,172 2.6 7 Italy 4,361 2.8 7 Taiwan 10,892 5.0 7
Netherlands 1,681 2.0 8 Netherlands 3,990 2.6 8 Yemen 8,453 3.9 8
Canada 1,505 1.8 9 Canada 3,857 2.5 9 Canada 5,807 2.7 9
Sweden 1,206 1.5 10 Switzerland 3,362 2.2 10 Italy 5,460 2.5 10
Whole countingCountry/Region
Whole countingCountry/Region
Whole countingCountry/Region
1989 - 1991(Average) 1999 - 2001(Average) 2009 - 2011(Average)
Number of patent families Number of patent families Number of patent families
- 13 -
(B) Selected countries/regions in which patent families were filed
Notes:1) Patent applications filed in home countries/regions are excluded.
2) A patent family is a group of patents filed in two or more countries, directly or indirectly related to each other by priority rights. In many cases, the same patents filed in multiple countries belong to the same patent family.
Reference: Chart 4-2-11, Japanese Science and Technology Indicators 2016 (in Japanese)
China
KoreaAsia (other than Japan, China,
and Korea)
U.S.
North/Latin America (other than the U.S.)
European Patent Office
Europe (other than EPO)
0%
10%
20%
30%
40%
50%
60%
70%
80%
90%
100%
81 83 85 87 89 91 93 95 97 99 01 03 05 07 09
(a)Japan
Japan
China
Korea
Asia (other than Japan, China, and Korea)
U.S.
North/Latin America
(other than the U.S.)
European Patent Office
Europe (other than
EPO)
Oceania
Africa
Middle East
Other
WIPO
0%
10%
20%
30%
40%
50%
60%
70%
80%
90%
100%
1
WIPO
Other
Middle East
Africa
Oceania
Europe (other than EPO)
European Patent Office
North/Latin America (otherthan the U.S.)U.S.
Asia (other than Japan,China, and Korea)Korea
China
JapanJapan
ChinaKorea
U.S.
North/Latin America
(other than the U.S.)
European Patent Office
Europe (other than
EPO)
Africa
0%
10%
20%
30%
40%
50%
60%
70%
80%
90%
100%
81 83 85 87 89 91 93 95 97 99 01 03 05 07 09
(d)U.K.
Japan
Korea
Asia (other than Japan, China, and
Korea)
U.S.
North/Latin America
(other than the U.S.)
European Patent Office
Europe (other than
EPO)
Africa
0%
10%
20%
30%
40%
50%
60%
70%
80%
90%
100%
85 87 89 91 93 95 97 99 01 03 05 07 09
(e)China
JapanChinaKorea
U.S.
North/Latin America
(other than the U.S.)
European Patent Office
Europe (other than
EPO)
Africa
0%
10%
20%
30%
40%
50%
60%
70%
80%
90%
100%
81 83 85 87 89 91 93 95 97 99 01 03 05 07 09
(c)Germany
Japan
China
Asia (other than Japan, China, and
Korea)
U.S.
European Patent Office
Europe (other than
EPO)
Africa
0%
10%
20%
30%
40%
50%
60%
70%
80%
90%
100%
86 88 90 92 94 96 98 00 02 04 06 08 10
(f)Korea
10 Year Year
10 Year 10 Year
Japan
China
Korea
North/Latin America
(other than the U.S.)
European Patent Office
Europe (other than
EPO)
Africa
0%
10%
20%
30%
40%
50%
60%
70%
80%
90%
100%
81 83 85 87 89 91 93 95 97 99 01 03 05 07 09
(b)U.S.
10 Year 10 Year
- 14 -
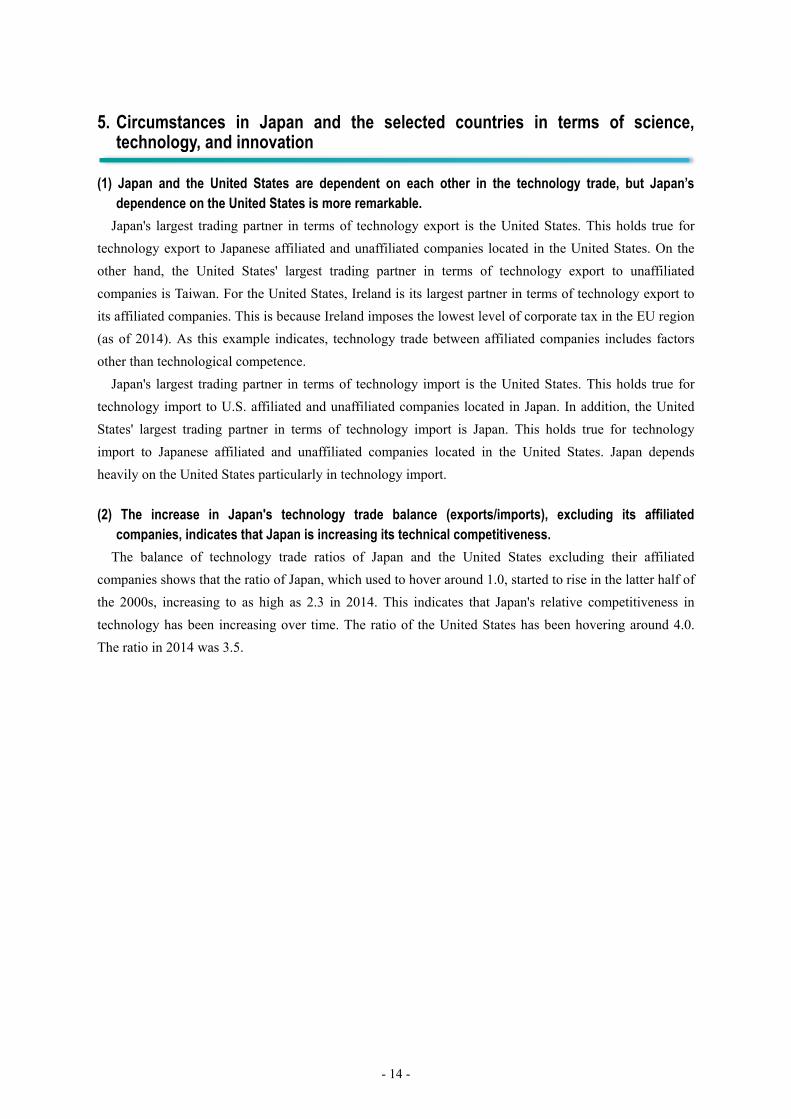
5. Circumstances in Japan and the selected countries in terms of science, technology, and innovation
(1) Japan and the United States are dependent on each other in the technology trade, but Japan’s
dependence on the United States is more remarkable.
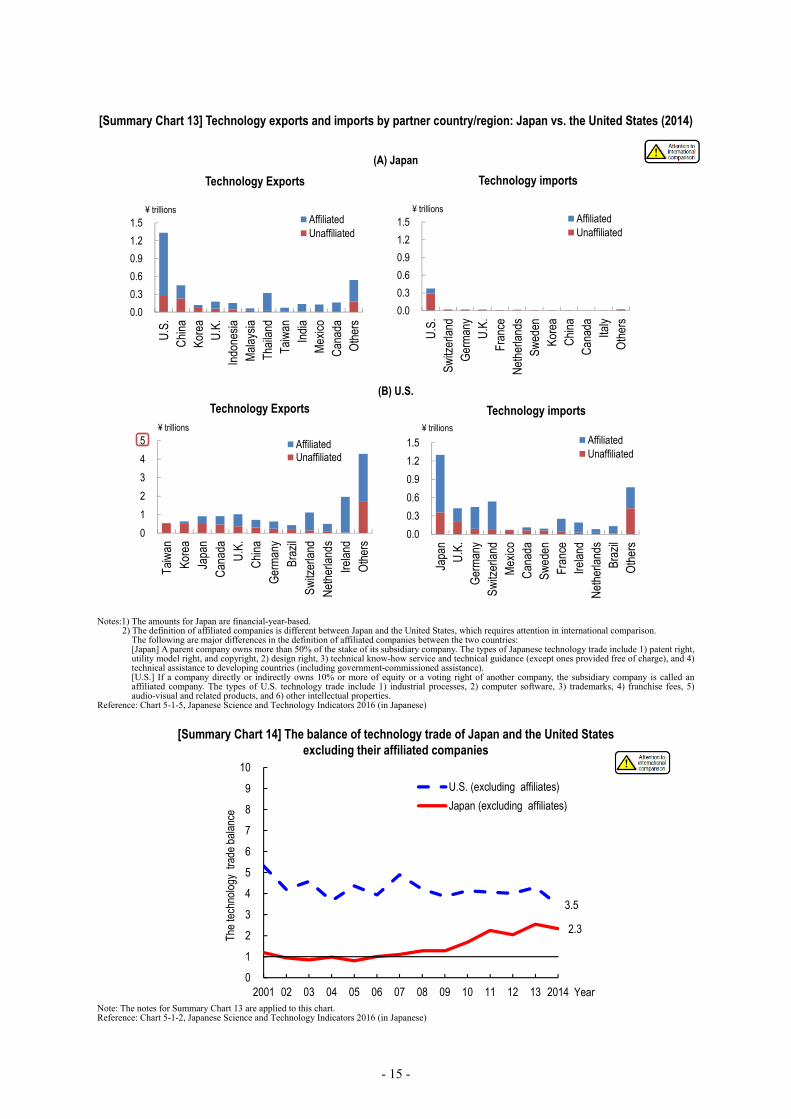
Japan's largest trading partner in terms of technology export is the United States. This holds true for
technology export to Japanese affiliated and unaffiliated companies located in the United States. On the
other hand, the United States' largest trading partner in terms of technology export to unaffiliated
companies is Taiwan. For the United States, Ireland is its largest partner in terms of technology export to
its affiliated companies. This is because Ireland imposes the lowest level of corporate tax in the EU region
(as of 2014). As this example indicates, technology trade between affiliated companies includes factors
other than technological competence.
Japan's largest trading partner in terms of technology import is the United States. This holds true for
technology import to U.S. affiliated and unaffiliated companies located in Japan. In addition, the United
States' largest trading partner in terms of technology import is Japan. This holds true for technology
import to Japanese affiliated and unaffiliated companies located in the United States. Japan depends
heavily on the United States particularly in technology import.
(2) The increase in Japan's technology trade balance (exports/imports), excluding its affiliated
companies, indicates that Japan is increasing its technical competitiveness.
The balance of technology trade ratios of Japan and the United States excluding their affiliated
companies shows that the ratio of Japan, which used to hover around 1.0, started to rise in the latter half of
the 2000s, increasing to as high as 2.3 in 2014. This indicates that Japan's relative competitiveness in
technology has been increasing over time. The ratio of the United States has been hovering around 4.0.
The ratio in 2014 was 3.5.
- 15 -
[Summary Chart 13] Technology exports and imports by partner country/region: Japan vs. the United States (2014)
(A) Japan
(B) U.S.
Notes:1) The amounts for Japan are financial-year-based.
2) The definition of affiliated companies is different between Japan and the United States, which requires attention in international comparison. The following are major differences in the definition of affiliated companies between the two countries: [Japan] A parent company owns more than 50% of the stake of its subsidiary company. The types of Japanese technology trade include 1) patent right, utility model right, and copyright, 2) design right, 3) technical know-how service and technical guidance (except ones provided free of charge), and 4) technical assistance to developing countries (including government-commissioned assistance). [U.S.] If a company directly or indirectly owns 10% or more of equity or a voting right of another company, the subsidiary company is called an affiliated company. The types of U.S. technology trade include 1) industrial processes, 2) computer software, 3) trademarks, 4) franchise fees, 5) audio-visual and related products, and 6) other intellectual properties.
Reference: Chart 5-1-5, Japanese Science and Technology Indicators 2016 (in Japanese)
[Summary Chart 14] The balance of technology trade of Japan and the United States
excluding their affiliated companies
Note: The notes for Summary Chart 13 are applied to this chart. Reference: Chart 5-1-2, Japanese Science and Technology Indicators 2016 (in Japanese)
0.0
0.3
0.6
0.9
1.2
1.5
U.S
.Sw
itzer
land
Ger
man
yU
.K.
Fran
ceN
ethe
rland
sSw
eden
Kore
aC
hina
Can
ada
Italy
Oth
ers
¥ trillions
Technology imports
AffiliatedUnaffiliated
0.0
0.3
0.6
0.9
1.2
1.5
U.S
.C
hina
Kore
aU
.K.
Indo
nesi
aM
alay
sia
Thai
land
Taiw
anIn
dia
Mex
ico
Can
ada
Oth
ers
¥ trillions
Technology Exports
AffiliatedUnaffiliated
0.0
0.3
0.6
0.9
1.2
1.5Ja
pan
U.K
.G
erm
any
Switz
erla
ndM
exic
oC
anad
aSw
eden
Fran
ceIre
land
Net
herla
nds
Braz
ilO
ther
s
¥ trillions
Technology imports
AffiliatedUnaffiliated
0
1
2
3
4
5
Taiw
anKo
rea
Japa
nC
anad
aU
.K.
Chi
naG
erm
any
Braz
ilSw
itzer
land
Net
herla
nds
Irela
ndO
ther
s
¥ trillions
Technology Exports
AffiliatedUnaffiliated
3.5
2.3
0
1
2
3
4
5
6
7
8
9
10
2001 02 03 04 05 06 07 08 09 10 11 12 13 2014
The
tech
nolo
gy t
rade
bal
ance
Year
U.S. (excluding affiliates)
Japan (excluding affiliates)
- 16 -
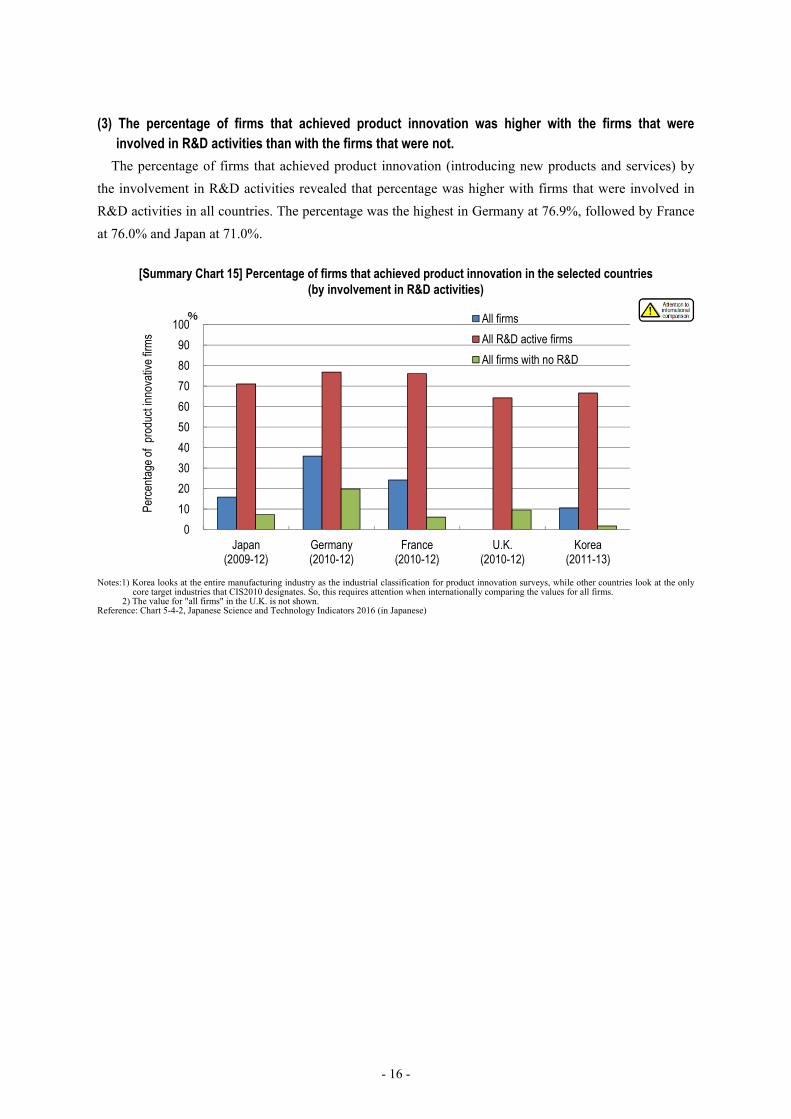
(3) The percentage of firms that achieved product innovation was higher with the firms that were involved in R&D activities than with the firms that were not.
The percentage of firms that achieved product innovation (introducing new products and services) by
the involvement in R&D activities revealed that percentage was higher with firms that were involved in
R&D activities in all countries. The percentage was the highest in Germany at 76.9%, followed by France
at 76.0% and Japan at 71.0%.
[Summary Chart 15] Percentage of firms that achieved product innovation in the selected countries
(by involvement in R&D activities)
Notes:1) Korea looks at the entire manufacturing industry as the industrial classification for product innovation surveys, while other countries look at the only
core target industries that CIS2010 designates. So, this requires attention when internationally comparing the values for all firms. 2) The value for "all firms" in the U.K. is not shown.
Reference: Chart 5-4-2, Japanese Science and Technology Indicators 2016 (in Japanese)
0
10
20
30
40
50
60
70
80
90
100
Japan(2009-12)
Germany(2010-12)
France(2010-12)
U.K.(2010-12)
Korea(2011-13)
Perc
enta
ge o
f pr
oduc
t inn
ovat
ive
firm
s
All firms
All R&D active firms
All firms with no R&D
%
- 17 -
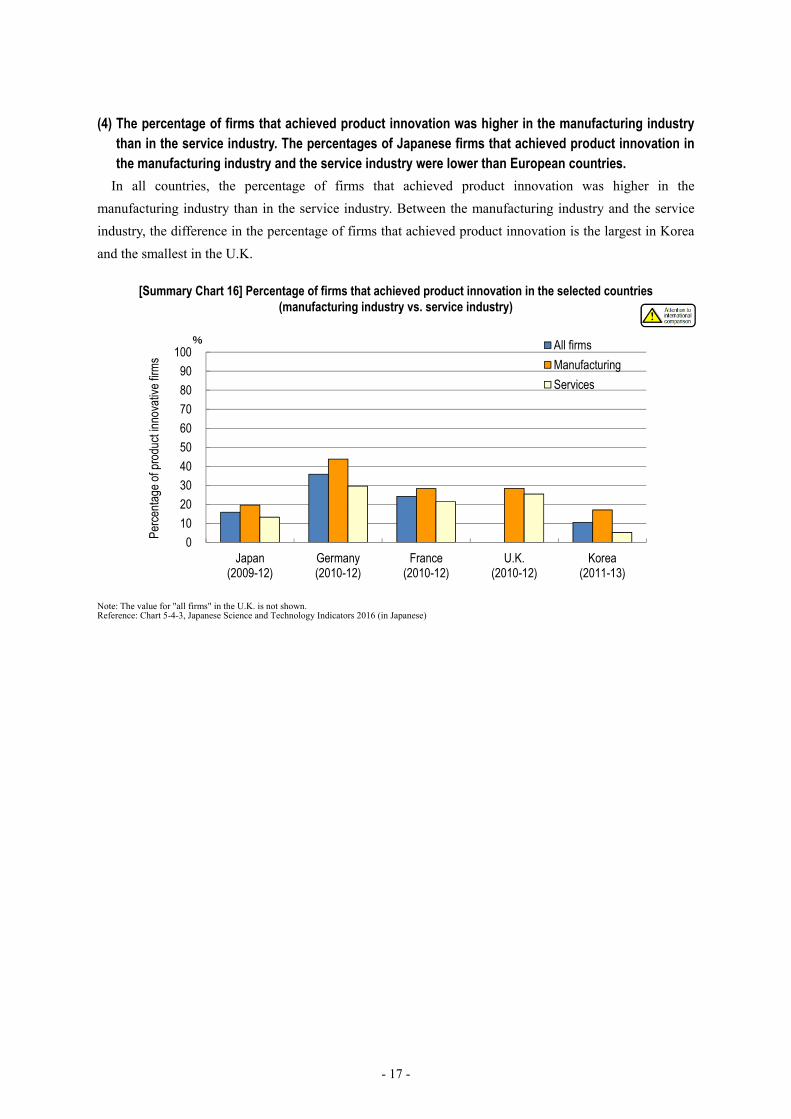
(4) The percentage of firms that achieved product innovation was higher in the manufacturing industry than in the service industry. The percentages of Japanese firms that achieved product innovation in the manufacturing industry and the service industry were lower than European countries.
In all countries, the percentage of firms that achieved product innovation was higher in the
manufacturing industry than in the service industry. Between the manufacturing industry and the service
industry, the difference in the percentage of firms that achieved product innovation is the largest in Korea
and the smallest in the U.K.
[Summary Chart 16] Percentage of firms that achieved product innovation in the selected countries (manufacturing industry vs. service industry)
Note: The value for "all firms" in the U.K. is not shown. Reference: Chart 5-4-3, Japanese Science and Technology Indicators 2016 (in Japanese)
0
10
20
30
40
50
60
70
80
90
100
Japan(2009-12)
Germany(2010-12)
France(2010-12)
U.K.(2010-12)
Korea(2011-13)
Perc
enta
ge o
f pro
duct
inno
vativ
e fir
ms
All firms
Manufacturing
Services
%
- 18 -
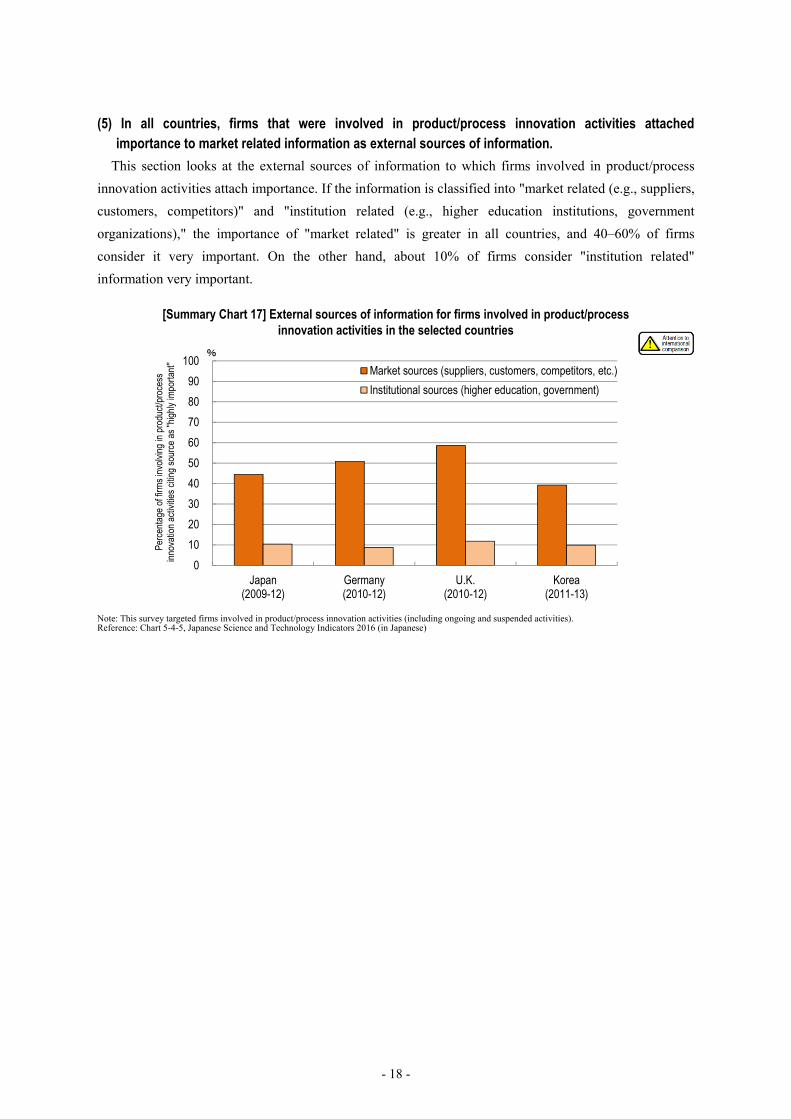
(5) In all countries, firms that were involved in product/process innovation activities attached importance to market related information as external sources of information.
This section looks at the external sources of information to which firms involved in product/process
innovation activities attach importance. If the information is classified into "market related (e.g., suppliers,
customers, competitors)" and "institution related (e.g., higher education institutions, government
organizations)," the importance of "market related" is greater in all countries, and 40–60% of firms
consider it very important. On the other hand, about 10% of firms consider "institution related"
information very important.
[Summary Chart 17] External sources of information for firms involved in product/process innovation activities in the selected countries
Note: This survey targeted firms involved in product/process innovation activities (including ongoing and suspended activities). Reference: Chart 5-4-5, Japanese Science and Technology Indicators 2016 (in Japanese)
0
10
20
30
40
50
60
70
80
90
100
Japan(2009-12)
Germany(2010-12)
U.K.(2010-12)
Korea(2011-13)
Perc
enta
ge o
f firm
s in
volv
ing
in p
rodu
ct/p
roce
ss
inno
vatio
n ac
tiviti
es c
iting
sou
rce
as ''h
ighl
y im
porta
nt''
Market sources (suppliers, customers, competitors, etc.)
Institutional sources (higher education, government)
%
- 19 -
Characteristics of the Japanese Science and Technology Indicators
The Japanese Science and Technology Indicators is published annually to present the most recent
statistics/indicators at the time of publication. Items that allow time-series comparisons as well as
comparisons among the selected countries based on data that are updated each year in principle are
collected.
Use of original statistical data published by authorities in each country
Wherever possible, statistical data published by authorities in each country are used as the sources of
data for indicators appearing in Japanese Science and Technology Indicators. Every effort has been made
to clarify each country’s method of collecting statistics and how it differs from other countries’ methods.
NISTEP conducted analysis of paper and patent databases
Paper data were aggregated and analyzed by NISTEP using Thomson Reuters Web of Science.
Patents family data were aggregated and analyzed by NISTEP using PATSTAT (the patent database of
the European Patent Office).
Use of “reminder marks” for international comparisons and time-series comparisons
The reminder marks “attention to international comparison” and “attention to trend”
have been attached to graphs where they are required. Generally, the data for each country
conform to OECD manuals and other materials. However, differences in methods of collecting data or
scope of focus do in fact exist, and therefore attention is necessary when making comparisons in some
cases. Such cases are marked “attention to international comparison.” Likewise, for some time series data,
data could not be continuously collected under the same conditions due to changes in statistical standards.
Cases where special attention is required when reading chronological trends are marked “attention to
trend.” Specifics for such points requiring attention are provided in the notes of individual charts.

Blank page
RESEARCH MATERIAL No. 251
Digest of Japanese Science and Technology Indicators 2016
August 2016
Research Unit for Science and Technology Analysis and Indicators
National Institute of Science and Technology Policy (NISTEP)
Ministry of Education, Culture, Sports, Science and Technology (MEXT)
Japan
DOI:http://doi.org/10.15108/rm251e
238
2015Oct. 2015
Digest of Japanese Science and Technology
Indicators 2016 Aug. 2016
Research Unit for Science and Technology Analysis and Indicators National Institute of Science and Technology Policy, MEXT
Research Material-251
背厚:1mm
Digest of Japanese Science-H1-H4.indd 1 2016/09/07 16:54:24