Embed Size (px)
Citation preview
THE JAPANESE JOURNAL OF
ADMINISTRATIVE SCIENCEJune, 1999 (Vol. 13, No. 1)
Edited by
THE JAPANESE ASSOCIATION OF ADMINISTRATIVE SCIENCE
President : Mitsuru Wakabayashi, Nagoya University
Editor : Naotaka Watanabe, Keio University
Associate Editors :
Toshihiro Kanai, Kobe University
Yasuaki Kido, Sanno University
Haruo Takagi, Keio University
Mitsuru Wakabayashi, Nagoya University
CONTENTS
ARTICLE "
Practices of Critical Managerial Skills:A Comparison among Japanese, Chinese and Taiwanese Managers 1
Mitsuru WAKABAYASHI,-Ziguang CHEN, and Kuo Long HUANG
Performance of Japanese Overseas Subsidiaries:The Effects of Entry Mode and Ownership Advantages 19
Pimonwan SIRIPAISALPIPAT and Yasuo HOSHINO
A Reconsideration of Network Centrality: Information Flow Betweeness 33Tsutomu HARADA
The Study of Career- and Psychosocial-Support in Organizations:Through An Investigation of Causal Factors to Mentoring Behavior. 43
Keiko KUMURA
The Impact of Information Technology on the Attitude and Behaviorof Female Clerical Workers 53
Youko OHTSU and Hiroko MATSUSHITA
THE JAPANESE ASSOCIATION OF ADMINISTRATIVE SCIENCE
Department of Business Administration, Aichi-Gakuin University, 12 Araike, Iwasaki,Nisshin 470-0131, Aichi, Japan (Phone: +81-5617-3-1111 (Ex.380) ; Fax: +81-5617-4-2420)
E-mail: [email protected] Page: http://www.aichi-gakuin.ac.jp/,vmatsu/JAAS/
Japanese Journal of Administrative ScienceVolume 13, No. 1, 1999, 19 - 32.^'aWiVt^lZ^W, 1 -Sf, 1999, 19-32.
Performance of Japanese Overseas Subsidiaries:
The Effects of Entry Mode and Ownership Advantages
Pimonwan SIRIPAISALPIPAT* and Yasuo HOSHINO"(University of Tsukuba)
Performance of foreign subsidiaries of multinational enterprises (MNEs) isinfluenced by several factors. This study proposes that ownership advantages andentry mode choice of MNEs have influence on performance of their directly ownedsubsidiaries overseas. We investigate performance difference between the two FDImodes frequently used for entering to less-developed countries (LDCs), namely,international joint venture and greenfield venture. Ownership advantages of MNEsare hypothesized to be positively associated with subsidiary performance as thoseadvantages are transferable from a parent firm to a subsidiary level. An empiricaltest based on a sample of 190 Japanese directly-owned subsidiaries located inThailand provides supporting evidence.
INTRODUCTION
A multinational enterprise (MNE) invests over
seas since it realizes the advantages of interna
tional market expansion and/or international
production. The total value of Japanese outward-
investment places Japan among the leading
outward-investing countries in the world. Japa
nese MNEs engage in foreign direct investment
(FDI) for two reasons; one is market orientation,
and the other is factor orientation. The latter one
is the key reason for Japanese direct investment in
less developing countries (LDCs). Being attracted
by the location advantages, many Japanese MNEs
transplant their productions of intermediate
products and build the regional networks of verti
cal integration of value-adding activities in several
LDCs.
Performance of FDI activities is influenced by
several factors. This study aims to explore some
* Pimonwan Siripaisalpipat, Doctoral student
of Management Sciences and Engineering,Doctoral Program in Policy and PlanningSciences, University of Tsukuba, Japan.
** Yasuo Hoshino, Professor of QuantitativeFinance and Management, Institute of Policyand Planning Sciences, University of Tsukuba,Japan.
factors which affect performance of Japanese FDI
in LDCs. The influencing factors in the scope of
this study include two areas; ownership advan
tages of Japanese parent firms and their entry
mode choice for FDI activities.
The previous research on entry mode perform
ance of Japanese overseas investment found evi
dence of performance difference between owner
ship-based entry modes, showing that greenfield
venture has higher performance profile than
international joint venture and acquisition (Li and
Guisinger, 1991; Nitsch, Beamish, and Makino,
1996; Woodcock, Beamish, and Makino, 1994).
Nevertheless, the empirical tests are limited to the
samples of Japanese subsidiaries in developed
countries.
This study investigates performance of entry
modes which Japanese firms used to established
directly-owned subsidiaries in LDCs. Further,
this study also attempts to examine the effect of
ownership advantages of a Japanese parent on
performance of its subsidiary. The empirical test
is conducted using the sample of 190 Japanese
manufacturing subsidiaries in Thailand0.
BACKGROUND AND LITERATURE
REVIEWS
Possession of superior advantages drives an
19-
m m m^nmm^mmm 1 -§•
enterprise to engage in foreign direct investment
(FDI). Firms which own specific advantages in a
particular activity find it economic to exploit these
advantages by expanding internationally
(Hymer, 1976). Firms with specific advantages
find it in their interests to locate (part of) their
production overseas where the host country offers
certain location-specific advantages (Dunning,
1981), and to internalize the value-adding activities
of international production where structural
and/or transactional market imperfections exist
(Buckley and Casson, 1976; Dunning, 1981;
Hymer, 1976; Kindleberger, 1969).
The degree of internalization, or the level of
ownership in a subsidiary, usually depends on the
parent firm's need for control over that subsidiary
as well as the parent firm's resource availability.
Different entry modes provide a firm with differ
ent levels of control (Caves, 1982; Davidson, 1982)
and resource commitment (Vernon, 1983). A firm
that possesses vital resources and is unwilling to
share (transfer) them with other firms may prefer
the wholly-owned mode, in which a parent firm
has sole control over that subsidiary. In addition,
resource transfer is internal to the firm, reducing
the possible transaction costs of external market.
In contrast, a firm which lacks necessary re
sources will be better off by employing a coopera
tive form of entry mode, namely an international
joint venture. In joint venture, a foreign parent
firm also has (some) control over the operation
and decision-making process of a local firm.
(Buckley and Casson, 1985). Joint venture facili
tates inter-firm learning and transfer of intangible
assets (Kogut, 1988), while reducing incentives for
opportunism by creating interdependence between
the transacting parties (Hennart, 1988). In addi
tion, in some countries, usually in less developed
countries, the host country governments restrict
the level of foreign ownership in local firms due to
the need for foreign contributions in technology
transfer and skill development to the local part
nering firm. This is one reason why the joint
venture mode is the predominant mode used by
MNEs investing in LDCs.
Thai government has also enacted some
restrictions on foreign ownership in a local entity.
In the case of manufacturing sector, share owner
ship by foreign investor is restricted to not over
than 49% if the subsidiary's production is at least
50% for the domestic market. Where at least 50% is
for export, foreign investor may hold a majority
or total of the shares. However, such restrictions
are relaxed for subsidiaries which directly involve
in technological development.
HYPOTHESIS DEVELOPMENT
Entry Mode versus Performance
Entry mode and performance
Normally, a firm which invests abroad has the
disadvantage of being foreign in the host country
(Hymer, 1976). Although LDCs have a number of
location advantages attractive to foreign firms,
they are usually characterized by more govern
ment restrictions imposed to foreign investors and
more uncertainty. In such circumstance, cost of
full control would be higher, relative to that in less
restricted, less risky markets.
Hypothesis 1: The international joint venture
mode will, on average, perform
better than the greenfield mode in
Thailand.
Share Ownership and performance
The evidence concerning the relationship be
tween share ownership and performance is am
biguous. While some studies (such as Killing,
1983) found that dominant-owned ventures per
form better, Beamish (1985) and Tomlinson (1970)
found that balanced control ventures obtained
higher performance outcome. If everything is
constant, the cooperative relationship will pro
duce synergy effects derived from the input efforts
of two (or more) parties. Equal sharing of interest
between foreign firm and the local partners will
lead to greater contribution from both sides
(Tomlinson, 1970), and thereby generate greater
benefits to the subsidiary which is the output of
their cooperative efforts. In contrast, joint ven
tures with dominant foreign parent are usually
managed like wholly-owned subsidiaries in which
-20-
Performance of Japanese Overseas Subsidiaries:
key decisions are made by the dominant parent
(Killing, 1983). Consequently, dominant foreign
parent might regard the local partner's contribu
tion as unimportant. Beamish (1987) suggested
that the lack of need for a partner would result in
poor performance in a joint venture. Since joint
venture operation incurs additional costs (such as
communication costs), using joint venture form of
organization is not an efficient use of resources
when a contribution from the partner is not
sought.
Hypothesis 2: The balanced-ownership joint ven
ture will, on average, perform
better than the majority-owned
joint venture or the minority-owned
joint venture.
Ownership Advantages versus Performance
Ownership advantages refer to the ownership of
specific assets, particularly intangible assets, and
capabilities which bring a superior competitive
position to the possessing firm. Such asset power
leads to the competitive advantages and thus a
firm's success in the market it serves. Ownership
advantages of a MNE are expected to have positive
influence on performance of the subsidiary, since
those advantages are usually transferable from a
parent firm to a subsidiary level.
Ownership advantages can be classified into 2
subgroups: transaction-specific advantages and
international management capabilities. Transac
tion-specific advantages are the key resources,
which have been accumulated inside the firm over
the time it has been operated, and which is neces
sary to compete efficiently in a certain business
line or a certain industry. Differentiated product,
advanced technology and specialized knowledge
or know-how are some examples of transaction-
specific advantages. International management
capabilities are the advantages obtained from the
increasing experience in international operations.
As a firm expands the operation overseas, a firm
has learned more about how to cope with the
different environments in terms of the economic,
political and legal systems, as well as the cultural
distances. The international experience and coun
try experience are the stocks of knowledge which a
newly established subsidiary can apply into its
own operational process.
Hypothesis 3: The transaction-specific advantages
of the foreign parent are positively
associated with the subsidiary
performance.
Hypothesis 4: The international management
capabilities of the foreign parent
are positively associated with the
subsidiary performance.
METHODOLOGY
Scope of the Study
The study focuses on the Japanese manufactur
ing MNEs which established new entities in manu
facturing sector in Thailand. The modes of entry
are restricted to new entities which initiate invest
ments in new facilities, namely international joint
venture (IJV) and greenfield investment (GF), to
control for the effect of the prior advantages
inherit in subsidiaries as merger or acquisition
mode would have been employed. To examine the
effect of share ownership, the entries are further
classified into four types of share ownership;
minority-owned joint venture, balanced-
ownership joint venture, majority-owned joint
venture, and greenfield venture.
Sources of Data
The measurement of subsidiary's performance,
the dependent variable in this study, is obtained
from financial ratio-based performance reported
in the Million Baht Business Information Thai
land (the profiles of 6000 leading companies in
Thailand), 1995. The rate of return on asset in
vested (ROA) in a subsidiary is employed to
measure performance in term of profitability.
The classification of entry modes and ownership
types is based on the data of the Toyo Keizai,
Japanese Overseas Investments, listed by coun
tries, 1995. The database covers all Japanese
21-
m m m-gnmn^mizmnm
overseas investments undertaken by Japanese
firms listed on the Japan stock exchanges (Tokyo,
Osaka, and Nagoya) as well as by major unlisted
Japanese firms. Based on share ownership data
reported in this database, the subsidiaries are
categorized into two entry modes, as well as four
ownership types.
The data for ownership advantages of parent
firms are obtained from two Japanese databases,
using the year 1994 as the base year. The data for
transaction-specific advantages are derived from
Nikkei Zaimu database, and Nikkei Kaisha
Nenkan when unavailable from the former source.
The data for international management capabili
ties are obtained from Toyo Keizai, Japanese
Overseas Investments, listed by firms.
Since newly-established subsidiaries require
some time to learn for establishing themselves,
performance during the start-up period is not yet
stable. The study of Woodcock, Beamish, and
Makino (1994), using piece-wise linear regression
with a breakpoint, found that performance of
subsidiaries tended to stabilize two years after
entry. Following this result, the subsidiaries
which the age of establishment was less than two
years at the time of the data collection have been
excluded.
Data Selection and Sample
From the census of subsidiaries recorded by
Toyo Keizai, those with performance data avail
able were selected. Ownership share by Japanese
firms was computed, with shares of multiple
Japanese investors aggregated and indirect shares
due to Japanese ownership of local parent firm
are also added to the Japanese share. Although
many studies restrict attention to subsidiaries
with a single foreign parent, we accept multiple
partners. Partly this is due to the prevalence of
multiple foreign partners in our data. However,
since this behavior evidently reflects the "keiretsu"
relations of Japanese firms, this should mitigate
conflicts of interest. Thereby considering this
share as determining degree of control by the
Japanese partner seems reasonable. Beamish's
(1985) study of joint venture performance in LDCs
also suggests that there is no performance differ
ence between joint ventures with two partners, or
more than two partners.
As a result, the sample of 190 cases was used for
the analysis of mode performance. In order to
examine the effect of ownership advantages on
performance, we associate performance with
ownership advantages of a dominant Japanese
shareholder, which we take as the (main) Japa
nese parent firm. For the regression analysis, the
sample was reduced to 105 cases according to
availability of data for the Japanese parent firms.
Model Development
The study attempts to assess how ownership
advantages and entry mode choice of a foreign
parent firm affect performance of its subsidiary.
Performance of a subsidiary is explained by the
following model.
Performance = f [Parent's Transaction-
Specific Advantages, Parent's
International Management
Capabilities, and Entry
Mode]
The model can be expressed as
Y = &o+ &,Xt+ 02X2+ ...+ £,
where Y is the rate of return on assets invested,
Xi is the independent variables, and /3 5 is the
coefficients of the independent variables. # ois the
constant and e is the disturbance term.
Measures of the Independent Variables
Entry Mode and Share Ownership
FDI entries with at least 95 percent Japanese
ownership are categorized as greenfield invest
ment (GF); and as international joint venture
(IJV) if otherwise (Anderson and Gatignon,
1986). In the model, entry mode (MODE) is cap
tured by a dummy variable equal to zero for IJV,
and one for GF.
The classification of IJV is based on the Japa
nese ownership level; lower than 49 percent for
minority IJV, between 49 to 51 percent for
balanced-ownership IJV, and higher than 51
percent for majority IJV respectively". Owner
ship type is captured by dummy variables IJV1
•22-
Performance of Japanese Overseas Subsidiaries:
and IJV2; IJVI equal to one if the entries are
balanced-ownership IJV and zero otherwise, IJV2
equal to one if the entries are majority IJV and
zero otherwise.
Ownership Advantages
Transaction-specific advantages are measured
by several proxies. First, the parent's sales size in
logarithm form (SIZE) is used as a proxy for the
asset power of a parent firm. Firms with larger
size usually possess greater potential to make
intensive investments in advanced technology and
product innovation.
Brand, image and reputation are those kinds of
product related intangible assets of a firm. The
degree of advertising intensity (ADINTEN) may
imply the level of value a parent firm places on
product differentiation.
The major source of specialized knowledge and
technology is a firm's contribution in research
and development. The parent's R&D intensity (
RDINTEN) is also used as a proxy for intangible
assets of a firm.
Managerial know-how is the other type of intan
gible assets, which helps enhance efficiency and
profitability in an operation. Managerial know-
how is measured by the parent's capital turnover
rate for efficiency (EFFICNT) and rate of return
on sales of productive outputs for profitability
(PROFIT).
As for international management capabilities,
international experience (INTER) is measured by
the number of overall subsidiaries the parent firm
established in IJV and greenfield modes overseas.
Local experience (LOCAL) is the stock of all
experience learned from operating every FDI
subsidiary in the host country. LOCAL is meas
ured based on the combined length of time (years)
that the parent has been operating each of the
manufacturing IJV or greenfield subsidiaries in
the host country. However, the advantage of par
ent's prior local experience inclines to decrease as
a subsidiary accumulates more operating experi
ence. Hence, subsidiary experience (SUBEXP), or
length of time of operation, together with interac
tion between LOCAL and SUBEXP are added into
the regression model.
RESULTS OF THE EMPIRICAL
ANALYSIS
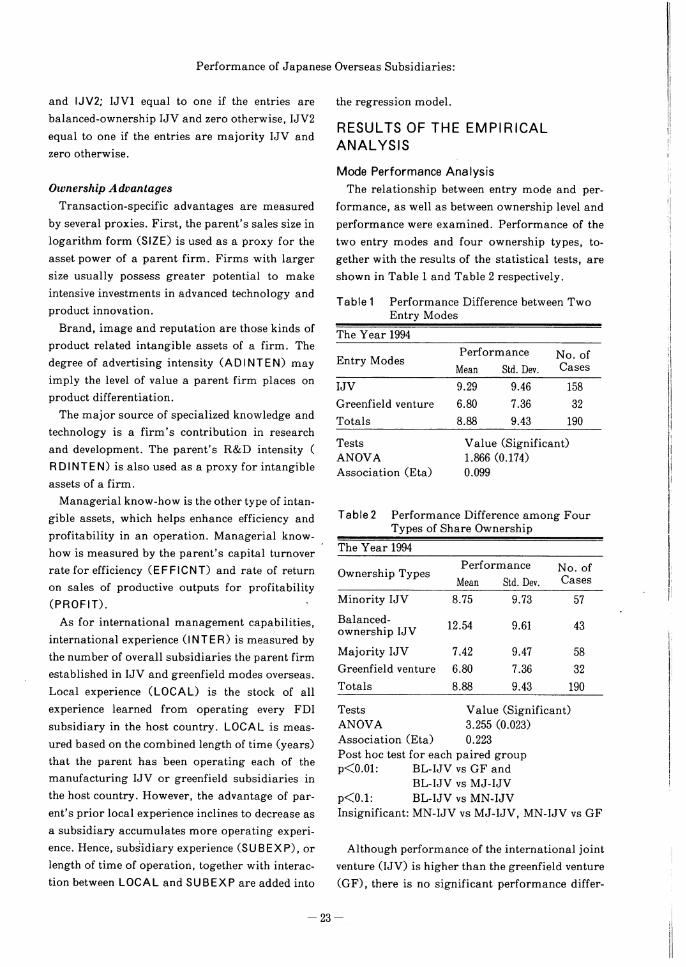
Mode Performance Analysis
The relationship between entry mode and per
formance, as well as between ownership level and
performance were examined. Performance of the
two entry modes and four ownership types, to
gether with the results of the statistical tests, are
shown in Table 1 and Table 2 respectively.
Table 1 Performance Difference between Two
Entry Modes
The Year 1994
Entry ModesPerformance
Mean Std. Dev.
No. of
Cases
IJV
Greenfield venture
Totals
9.29
6.80
8.88
9.46
7.36
9.43
158
32
190
Tests
ANOVA
Association (Eta)
Value (Significant)1.866 (0.174)
0.099
Table 2 Performance Difference among FourTypes of Share Ownership
The Year 1994
Ownership TypesPerformance
Mean Std. Dev.
No. ofCases
Minority IJV 8.75 9.73 57
Balanced-
ownership IJV12.54 9.61 43
Majority IJV 7.42 9.47 58
Greenfield venture 6.80 7.36 32
Totals 8.88 9.43 190
Tests Value (Significant)ANOVA 3.255 (0.023)
Association (Eta) 0.223
Post hoc test for each paired groupp<0.01: BL-IJV vs GF and
BL-IJV vs MJ-IJV
p<0.1: BL-IJV vs MN-IJVInsignificant: MN-IJV vs MJ-IJV, MN-IJV vs GF
Although performance of the international joint
venture (IJV) is higher than the greenfield venture
(GF), there is no significant performance differ-
23-
mnmm^mzmm 1 ^
ence between them. When the subsidiaries are
classified into 4 types of share ownership, the
result shows that balanced-ownership IJV outper
forms the other three ownership types. Perform
ance difference within ownership types is signifi
cant at 0.023 level. When a post hoc test is applied
to each paired group, performance of balanced-
ownership IJV is significantly higher than minor
ity IJV, majority IJV, and greenfield venture. The
results support the view that equally-controlled
IJV is more effective for joint venture formation.
While balanced-ownership IJV is, on average,
considerably profitable than greenfield venture,
the profitability in dominant IJV does not much
differ from that in greenfield venture. In dominant
IJV, local partners - even if they have passive role
- are involved in the venture's operations, though
their contribution might be only little. This results
in an efficiency cost to the venture without a corre
sponding benefit (Beamish, 1987).
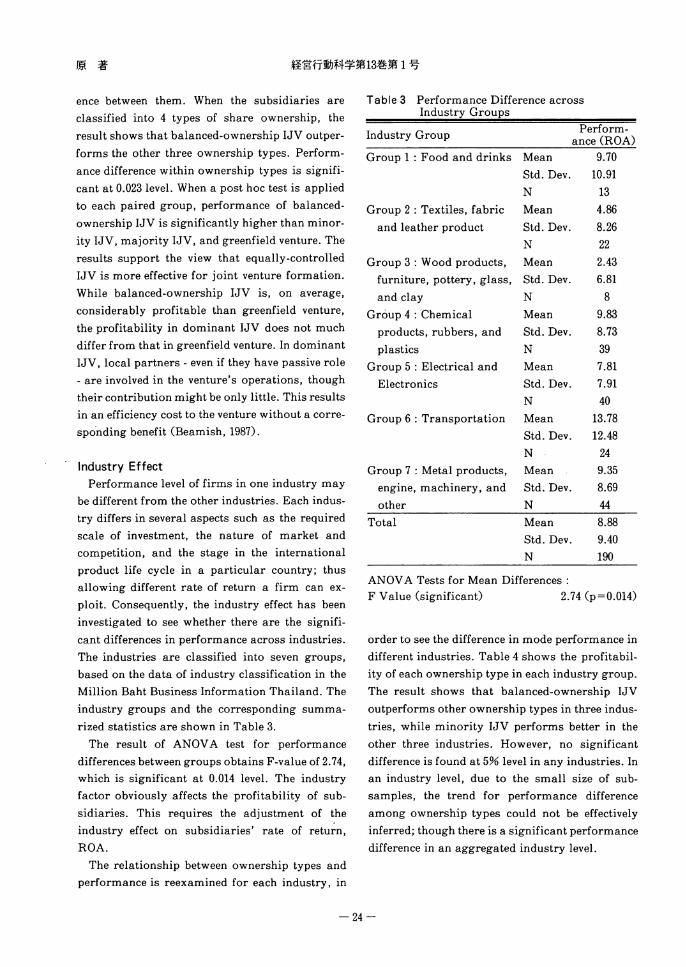
Industry Effect
Performance level of firms in one industry may
be different from the other industries. Each indus
try differs in several aspects such as the required
scale of investment, the nature of market and
competition, and the stage in the international
product life cycle in a particular country; thus
allowing different rate of return a firm can ex
ploit. Consequently, the industry effect has been
investigated to see whether there are the signifi
cant differences in performance across industries.
The industries are classified into seven groups,
based on the data of industry classification in the
Million Baht Business Information Thailand. The
industry groups and the corresponding summa
rized statistics are shown in Table 3.
The result of ANOVA test for performance
differences between groups obtains F-value of 2.74,
which is significant at 0.014 level. The industry
factor obviously affects the profitability of sub
sidiaries. This requires the adjustment of the
industry effect on subsidiaries' rate of return,
ROA.
The relationship between ownership types and
performance is reexamined for each industry, in
Table 3 Performance Difference acrossIndustry Groups
Industry Group
Group 1 : Food and drinks
Group 2 : Textiles, fabric
and leather product
Group 3 : Wood products,
furniture, pottery, glass,
and clay
Group 4 : Chemical
products, rubbers, and
plastics
Group 5 : Electrical and
Electronics
Group 6 : Transportation
Group 7 : Metal products,
engine, machinery, and
other
Total
Perform
ance (ROA)
Mean 9.70
Std. Dev. 10.91
N 13
Mean 4.86
Std. Dev. 8.26
N 22
Mean 2.43
Std. Dev. 6.81
N 8
Mean 9.83
Std. Dev. 8.73
N 39
Mean 7.81
Std. Dev. 7.91
N 40
Mean 13.78
Std. Dev. 12.48
N 24
Mean 9.35
Std. Dev. 8.69
N 44
Mean
Std. Dev.
N
8.88
9.40
190
ANOVA Tests for Mean Differences :
F Value (significant) 2.74(p = 0.014)
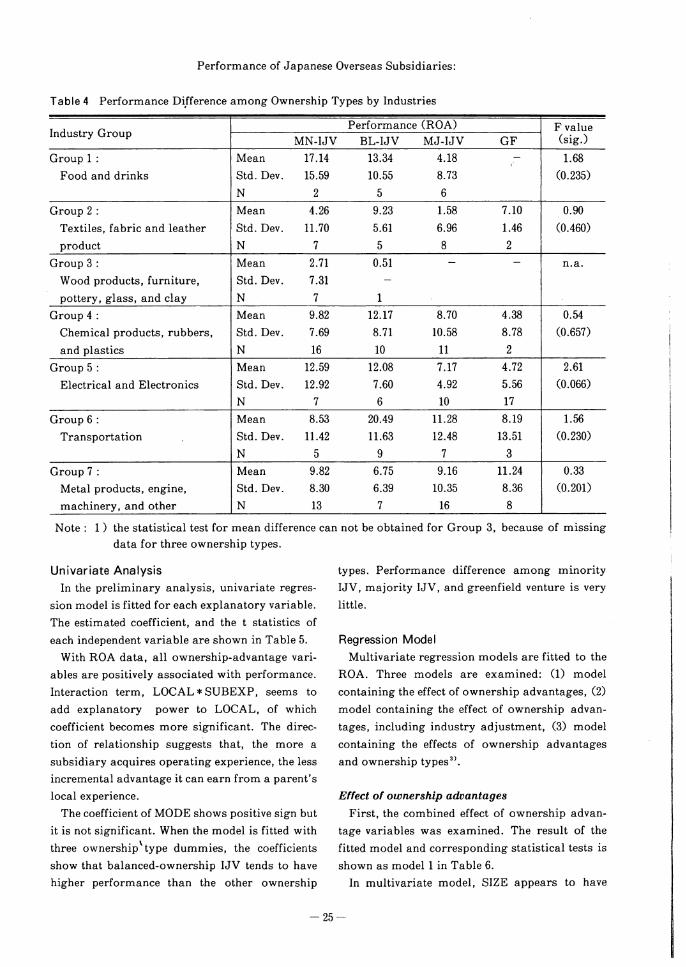
order to see the difference in mode performance in
different industries. Table 4 shows the profitabil
ity of each ownership type in each industry group.
The result shows that balanced-ownership IJV
outperforms other ownership types in three indus
tries, while minority IJV performs better in the
other three industries. However, no significant
difference is found at 5% level in any industries. In
an industry level, due to the small size of sub-
samples, the trend for performance difference
among ownership types could not be effectively
inferred; though there is a significant performance
difference in an aggregated industry level.
24-
Performance of Japanese Overseas Subsidiaries:
Table 4 Performance Difference among Ownership Types by Industries
Industry GroupPerformance (ROA) F value
MN-IJV BL-IJV MJ-IJV GF (sig.)
Group 1 : Mean 17.14 13.34 4.18 - 1.68
Food and drinks Std. Dev. 15.59 10.55 8.73 (0.235)
N 2 5 6
Group 2 : Mean 4.26 9.23 1.58 7.10 0.90
Textiles, fabric and leather Std. Dev. 11.70 5.61 6.96 1.46 (0.460)
product N 7 5 8 2
Group 3 : Mean 2.71 0.51 - - n.a.
Wood products, furniture, Std. Dev. 7.31 -
pottery, glass, and clay N 7 1
Group 4 : Mean 9.82 12.17 8.70 4.38 0.54
Chemical products, rubbers, Std. Dev. 7.69 8.71 10.58 8.78 (0.657)
and plastics N 16 10 11 2
Group 5 : Mean 12.59 12.08 7.17 4.72 2.61
Electrical and Electronics Std. Dev. 12.92 7.60 4.92 5.56 (0.066)
N 7 6 10 17
Group 6 : Mean 8.53 20.49 11.28 8.19 1.56
Transportation Std. Dev. 11.42 11.63 12.48 13.51 (0.230)
N 5 9 7 3
Group 7 : Mean 9.82 6.75 9.16 11.24 0.33
Metal products, engine, Std. Dev. 8.30 6.39 10.35 8.36 (0.201)
machinery, and other N 13 7 16 8
Note : 1 ) the statistical test for mean difference can not be obtained for Group 3, because of missing
data for three ownership types.
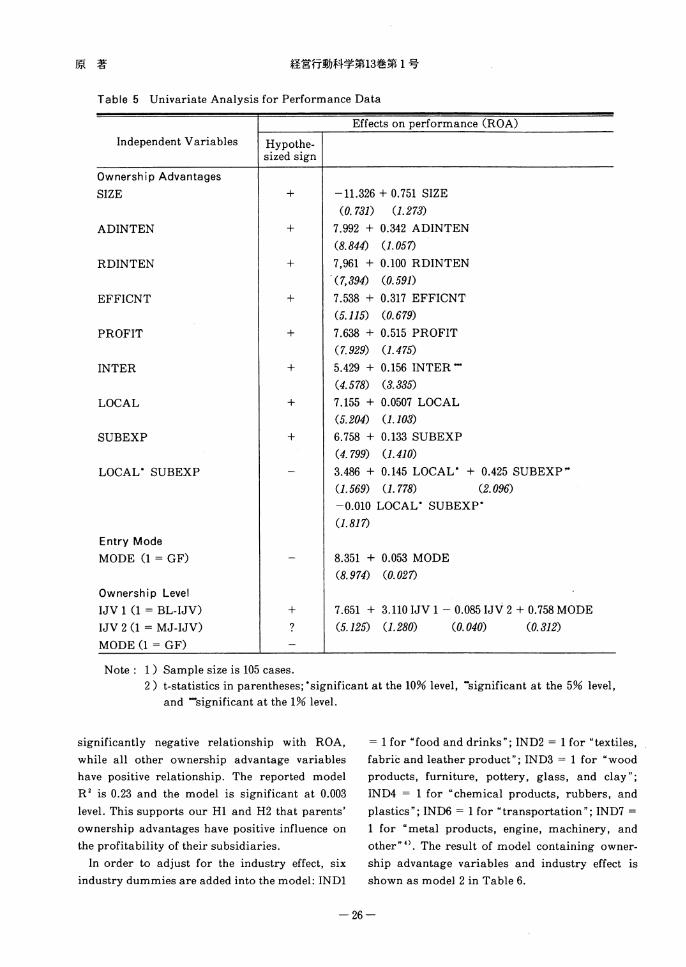
Univariate Analysis
In the preliminary analysis, univariate regres
sion model is fitted for each explanatory variable.
The estimated coefficient, and the t statistics of
each independent variable are shown in Table 5.
With ROA data, all ownership-advantage vari
ables are positively associated with performance.
Interaction term, LOCAL*SUBEXP, seems to
add explanatory power to LOCAL, of which
coefficient becomes more significant. The direc
tion of relationship suggests that, the more a
subsidiary acquires operating experience, the less
incremental advantage it can earn from a parent's
local experience.
The coefficient of MODE shows positive sign but
it is not significant. When the model is fitted with
three ownership type dummies, the coefficients
show that balanced-ownership IJV tends to have
higher performance than the other ownership
types. Performance difference among minority
IJV, majority IJV, and greenfield venture is very
little.
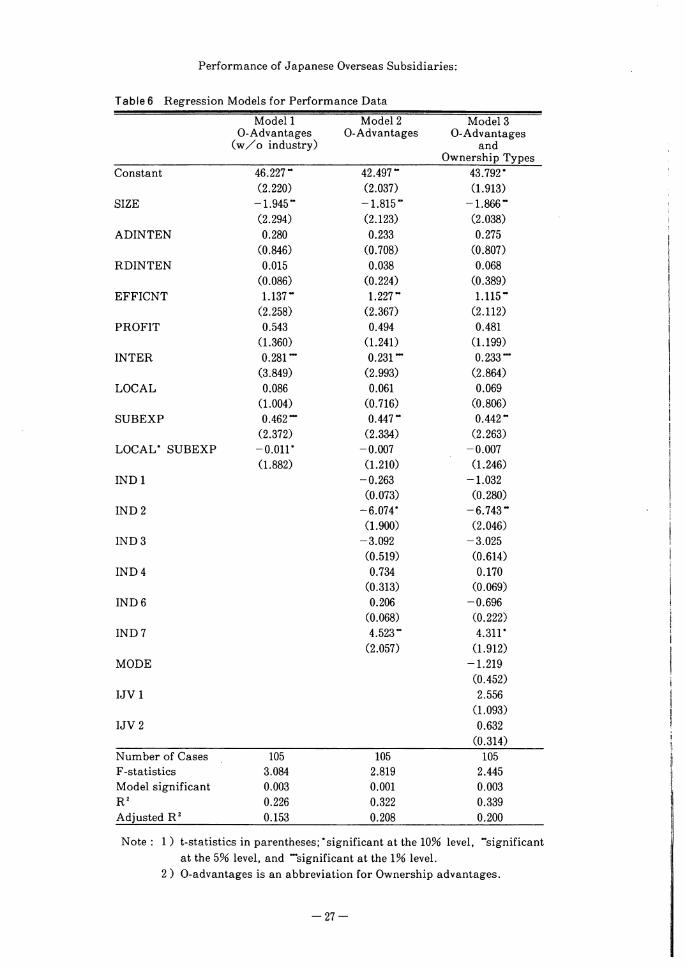
Regression Model
Multivariate regression models are fitted to the
ROA. Three models are examined: (1) model
containing the effect of ownership advantages, (2)
model containing the effect of ownership advan
tages, including industry adjustment, (3) model
containing the effects of ownership advantages
and ownership types3).
Effect of ownership advantages
First, the combined effect of ownership advan
tage variables was examined. The result of the
fitted model and corresponding statistical tests is
shown as model 1 in Table 6.
In multivariate model, SIZE appears to have
25-
mnrnm^mzg^ 1 *%
Table 5 Univariate Analysis for Performance Data
dent Variables
Effects on performance (ROA)
Indepen Hypothesized sign
Ownership Advantages
SIZE + -11.326 + 0.751 SIZE
(0.731) (1.273)
ADINTEN + 7.992 +
(8.844)
0.342 ADINTEN
(1.057)
RDINTEN + 7,961 +
(7,394)
0.100 RDINTEN
(0.597)
EFFICNT + 7.538 +
(5.115)
0.317 EFFICNT
(0.679)
PROFIT + 7.638 +
(7.929)
0.515 PROFIT
(1.475)
INTER + 5.429 +
(4.578)
0.156 INTER ***
(3.335)
LOCAL + 7.155 +
(5.204)
0.0507 LOCAL
(1.103)
SUBEXP + 6.758 +
(4.799)
0.133 SUBEXP
(1.410)
LOCAL* SUBEXP - 3.486 + 0.145 LOCAL* + 0.425 SUBEXP**
(1.569) (1.778) (2.096)
-0.010 LOCAL* SUBEXP*
(1.817)
Entry Mode
MODE (1 = GF)"
8.351 +
(8.974)
0.053 MODE
(0.027)
Ownership Level
IJV 1 (1 = BL-IJV) + 7.651 + 3.110 IJV 1 - 0.085 IJV 2 + 0.758 MODE
IJV 2 (1 = MJ-IJV) ? (5.125) (1.280) (0.040) (0.312)
MODE (1 -= GF) -
Note : 1) Sample size is 105 cases.2) t-statistics in parentheses;*significant at the 10% level, ""significant at the 5% level,
and ""significant at the 1% level.
significantly negative relationship with ROA,
while all other ownership advantage variables
have positive relationship. The reported model
R2 is 0.23 and the model is significant at 0.003
level. This supports our HI and H2 that parents'
ownership advantages have positive influence on
the profitability of their subsidiaries.
In order to adjust for the industry effect, six
industry dummies are added into the model: IND1
= 1 for "food and drinks"; IND2 = 1 for "textiles,
fabric and leather product"; IND3 = 1 for "wood
products, furniture, pottery, glass, and clay";
IND4 = 1 for "chemical products, rubbers, and
plastics"; IND6 = 1 for "transportation"; IND7 =
1 for "metal products, engine, machinery, and
other"0. The result of model containing owner
ship advantage variables and industry effect is
shown as model 2 in Table 6.
26-
Performance of Japanese Overseas Subsidiaries:
Table 6 Regression Models for Performance Data
Model 1
O-Advantages(w/o industry)
Model 2
O-AdvantagesModel 3
O-Advantagesand
Ownership TypesConstant 46.227" 42.497" 43.792*
(2.220) (2.037) (1.913)
SIZE -1.945" -1.815" -1.866**
(2.294) (2.123) (2.038)
ADINTEN 0.280 0.233 0.275
(0.846) (0.708) (0.807)
RDINTEN 0.015 0.038 0.068
(0.086) (0.224) (0.389)
EFFICNT 1.137" 1.227** 1.115"
(2.258) (2.367) (2.112)
PROFIT 0.543 0.494 0.481
(1.360) (1.241) (1.199)
INTER 0.281"* 0.231*" 0.233***
(3.849) (2.993) (2.864)
LOCAL 0.086 0.061 0.069
(1.004) (0.716) (0.806)
SUBEXP 0.462*** 0.447** 0.442"
(2.372) (2.334) (2.263)
LOCAL* SUBEXP -0.011* -0.007 -0.007
(1.882) (1.210) (1.246)
IND1 -0.263 -1.032
(0.073) (0.280)
IND2 -6.074* -6.743**
(1.900) (2.046)
IND3 -3.092 -3.025
(0.519) (0.614)
IND4 0.734 0.170
(0.313) (0.069)
IND6 0.206 -0.696
(0.068) (0.222)
IND7 4.523" 4.311*
(2.057) (1.912)
MODE -1.219
(0.452)
IJV1 2.556
(1.093)
IJV 2 0.632
(0.314)
Number of Cases 105 105 105
F-statistics 3.084 2.819 2.445
Model significant 0.003 0.001 0.003
R2 0.226 0.322 0.339
Adjusted R2 0.153 0.208 0.200
Note : 1 ) t-statistics in parentheses;'significant at the 10% level, "significantat the 5% level, and "significant at the 1% level.
2 ) O-advantages is an abbreviation for Ownership advantages.
-27-
««ff»»5**i3**i-
Similar to model 1, all ownership advantage
variables, except SIZE, are positively associated
with performance. As for industrial factor, IND1,
IND2, and IND3 have lower rate of return than
average, while IND 4, IND6 and IND7 have higher
rate of return than average. Yet, only IND2 and
IND7 are significant. After industry variables
were added, R2 was improve from 0.23 to 0.32,
reflecting higher explanatory power of the new
model with industry adjustment.
Effects of ownership advantages and ownership
types
The effects of ownership advantages and owner
ship types, together with industrial factor, were
examined. The result in model 3 of Table 6 shows
that MODE (GF =1) inclines to be the least profit
able, while IJVl (BL-IJV = 1) seems to have higher
profitability than average about 2.6 point. How
ever, none of ownership type variable is signifi
cant. The effects of ownership advantage variables
and industry variables do not differ from those
without ownership types, except IND6 which
becomes negative. R2 of model 3 was obtained the
value of 0.34, increasing slightly from the previous
model. Though the sample for the empirical
analysis in this study includes subsidiaries with
both single and multiple Japanese parents, we
tested the model by fitting the regression using
sub-sample of single Japanese parent. According
to the result (see Appendix 2), there seems to be no
difference between the full sample and sub-
sample.
CONCLUSIONS
The results of this study provide strong evidence
for the important role of MNEs' ownership advan
tages in the operations of their overseas subsidiar
ies. The results of the empirical analyses suggest
that the variables related to product differentia
tion, specialized technology, managerial know-
how, international experience, and country expe
rience appear to have positive influences on the
profitability of subsidiaries. Through the inter
nalization process, the proprietary product and
technology as well as the operational and
international management know-how possessed
by MNEs are transferred to their directly-owned
foreign subsidiaries. Firm-specific intangible
assets both in terms of transaction-specific assets
and international management capabilities of
Japanese MNEs lead to the competitiveness and
the performance of their subsidiaries in foreign
markets.
Firm size seems to be negatively associated with
profitability. Previous research on corporate size
and profit rates reveals that the profit rates of
small firms are rather lower than those of middle-
sized firm, whereas larger-sized firms yield profit
rates that are slightly lower but more stable than
the profit rates of middle-sized firms. Although
firm size can increase profitability significantly
via market power, this might be offset by ineffi
ciency caused by a degree of bureaucracy in many
larger firms (see Shepherd, 1979). Further, larger-
sized firms usually aim to maintain stable and
long term growth, thus satisfy with moderate
profit rates.
The mode performance analysis reveals that
there exists the performance difference among
different forms of organization. Being different
from the evidence in developed countries, perform
ance of greenfield venture tends to be lower than
IJV, particularly balanced-ownership IJV.
Balanced-ownership IJV appears to outperform
other types of ownership, while performance of
minority IJV and majority IJV do not differ that
much. The insignificance of performance differ
ence between aggregated IJV and greenfield ven
ture implies that viewing all types of joint venture
as common might not be appropriate. Different
forms of joint venture differ in several aspects,
including the distribution of control and the way
the ventures are managed. In joint venture, equally
shared control between foreign firm and the local
partners can lead to greater contribution from
both sides, and thereby to the profitability of the
venture (Tomlinson, 1970).
Nevertheless, this study has some limitations.
Firstly, the sample is limited to only FDI activi
ties of MNEs of single nationality and those
invested in one host country. This is partly
28-
Performance of Japanese Overseas Subsidiaries:
because the financial performance data of foreign
subsidiaries in many LDCs is very hard to obtain.
Secondly, rate of return of subsidiary is merely an
explicit measure of performance. In some cases, a
firm accepts moderate to lower rate of return for
some strategic reasons such as market share
orientation, transfer pricing, and etc. Other mean
ingful performance measurement could be consid
ered, including subjective performance indicators
like management satisfaction on the operations.
Notes:
1 . Thailand is the fourth largest Japanese invest
ment recipients in the world, following The
U.S., China, and Hong Kong. There are in total
1,289 Japanese subsidiaries in Thailand in the
year 1996, reported in Toyo Keizai, Japanese
Overseas Investments [Toyo Keizai (1997)].
2 . In our sample, there exists a number of for
eign subsidiaries of which foreign parents hold
balance equity at 49 percent instead of 50 per
cent. This is because, in Thailand a foreign
parent firm cannot hold share ownership larger
than 49% of the total shares if the subsidiary
sells more than 50% of outputs in domestic
market.
3 . The descriptive statistics and the correlation
matrix of variables in the regression model are
shown in Appendix 1.
4 . Because the performance mean of IND5 was
closest to the performance mean of all industry
combined, IND5 was omitted from the model. In
other words, the performance of "electrical and
electronics" is regarded as the industry average
rate of return.
References
Anderson, E. and Gatignon, H. 1986 Modes of
foreign Entry: Transaction Cost Analysis and
Propositions. Journal of International Busi
ness Studies, 3, 1-26.
Beamish, P. W. 1985 The Characteristics of Joint
Ventures in Developed and Developing Coun
tries. Columbia Journal of World Business,
Fall,13-19.
Beamish, P. W. 1987 Joint Ventures in LDCs.
Management International Review, 27, 23-37.
Buckley, P. J. and Casson, M. 1976 The Future of
The Multinational Enterprise. London: Mac-
millan.
Buckley, P. J. and Casson, M. 1985 The Economic
Theory of The Multinational Enterprise.
London: Macmillan.
Caves, R. 1982 Multinational Enterprise and
Economic Analysis. New York: Cambridge
University Press.
Davidson, W. 1982 Global Strategic Management.
New York: John Wiley.
Dunning, J. H. 1981 International Production and
the Multinational Enterprise. London: George
Allen & Unwin.
Hennart, J. F. 1988 A Transaction Costs Theory of
Equity Joint Ventures. Strategic Management
Journal, 9, 361-374.
Hymer, S. 1976 The International Operations of
National Firms: A Study of Direct Foreign
Investment. Cambridge: MIT Press. (Origi
nally presented as Unpublished Doctoral
Dissertation MIT, 1960)
International Business Research. 1995 Million
Baht Business Information Thailand. Bang
kok: International Business Research (Thai
land) Co., Ltd.
Li, J. and S. Guisinger. 1991 Comparative Busi
ness Failures of Foreign-Controlled Firms in
the United States. Journal of International
Business Studies, 2, 209-224.
Killing, J. P. 1983 Strategies for Joint Venture
Success. New York: Praeger.
Kindleberger, C. P. 1969 American Business
Abroad: Six Lectures on Direct Investment.
New Haven: Yale University Press.
Kogut, B. 1988 Joint Ventures : Theoretical and
Empirical Perspectives. Strategic Manage
ment Journal, 9, 319-332.
Nihon Keizai Shinbunsha. 1995 Kaisha Nenkan
(Annual Company Profiles). Tokyo: Nihon
Keizai Shinbunsha.
Nihon Keizai Shinbunsha. Nikkei Zaimu Data
base. Tokyo: Nihon Keizai Shinbunsha.
29-
R tgnnm^msmm 1 *§•
Nitsch, D., Beamish, P. W. and Makino, S. 1996
Entry Mode and Performance of Japanese FDI
in Western Europe. Management Interna
tional Review, 36, 27-43.
Shepherd, W. G. 1979 The Economics of Industrial
Organization. London: Prentice-Hall Interna
tional Inc.
Siripaisalpipat, P. and Hoshino, Y. Firm-Specific
Advantages, Entry Modes, and Performance
of Japanese FDI in Thailand. Japan and the
World Economy (forthcoming).
Tomlinson, J. W. C. 1970 The Joint Venture Proc
ess in International Business: India and Paki
stan. Cambridge: the MIT Press.
Toyo Keizai. 1995 Kaigai Shinshutsu Kigyo Soran
(Japanese Overseas Investments): Listed by
Countries. Tokyo: Toyo Keizai Inc.
Toyo Keizai. 1995 Kaigai Shinshutsu Kigyo Soran
(Japanese Overseas Investments): Listed by
Firms. Tokyo: Toyo Keizai Inc.
Vernon, R. 1983 Organizational and Institutional
Responses to International Risk, in Herring,
R. J. (ed.). Managing International Risk.
Cambridge: Cambridge University Press.
Woodcock, C. P., Beamish, P. W. and Makino, S.
1994 Ownership-Based Entry Mode Strategies
and International Performance. Journal of
International Business Studies, 2, 253-273.
(¥^11^3^25HSm, ¥i£ll*M£27BSI)
-30-
Performance of Japanese Overseas Subsidiaries:
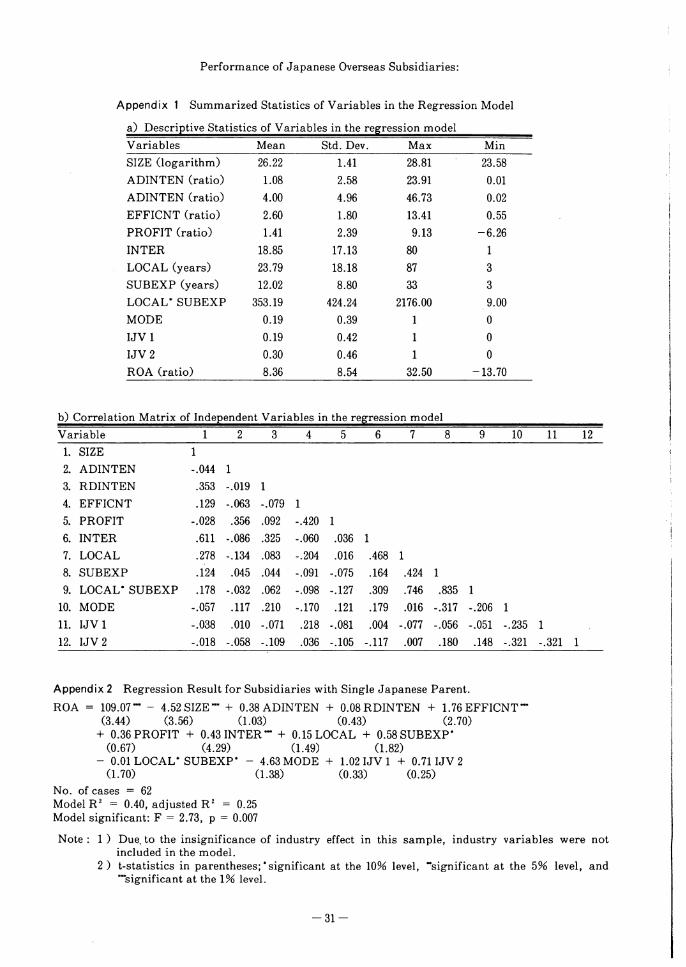
Appendix 1 Summarized Statistics of Variables in the Regression Model
a) Descriptive Statistics of Variables in the regression model
Variables Mean Std. Dev. Max Min
SIZE (logarithm) 26.22 1.41 28.81 23.58
ADINTEN (ratio) 1.08 2.58 23.91 0.01
ADINTEN (ratio) 4.00 4.96 46.73 0.02
EFFICNT (ratio) 2.60 1.80 13.41 0.55
PROFIT (ratio) 1.41 2.39 9.13 -6.26
INTER 18.85 17.13 80 1
LOCAL (years) 23.79 18.18 87 3
SUBEXP (years) 12.02 8.80 33 3
LOCAL* SUBEXP 353.19 424.24 2176.00 9.00
MODE 0.19 0.39 1 0
IJVl 0.19 0.42 1 0
IJV 2 0.30 0.46 1 0
ROA (ratio) 8.36 8.54 32.50 -13.70
b) Correlation Matrix of Independent Variables in the regression model
Variable 10 11 12
1. SIZE 1
2. ADINTEN -.044 1
3. RDINTEN .353 -.019 1
4. EFFICNT .129 -.063 -.079 1
5. PROFIT -.028 .356 .092 -.420 1
6. INTER .611 -.086 .325 -.060 .036 1
7. LOCAL .278 -.134 .083 -.204 .016 .468 1
8. SUBEXP .124 .045 .044 -.091 -.075 .164 .424 1
9. LOCAL* SUBEXP .178 -.032 .062 -.098 -.127 .309 .746 .835 1
10. MODE -.057 .117 .210 -.170 .121 .179 .016 -.317 -.206 1
11. IJVl -.038 .010 -.071 .218 -.081 .004 -.077 -.056 -.051 -.235 1
12. IJV 2 -.018 -.058 -.109 .036 -.105 -.117 .007 .180 .148 -.321 -.321 1
Appendix 2 Regression Result for Subsidiaries with Single Japanese Parent.
ROA = 109.07*" - 4.52 SIZE*" + 0.38 ADINTEN + 0.08 RDINTEN 4- 1.76 EFFICNT*"
(3.44) (3.56) (1.03) (0.43) (2.70)+ 0.36 PROFIT + 0.43 INTER"* + 0.15 LOCAL + 0.58SUBEXP*
(0.67) (4.29) (1.49) (1.82)- 0.01 LOCAL* SUBEXP* - 4.63 MODE + 1.02 IJV 1 + 0.71 IJV 2
(1.70) (1.38) (0.33) (0.25)
No. of cases = 62
Model R2 = 0.40, adjusted R2 = 0.25Model significant: F = 2.73, p = 0.007
Note : 1 ) Due, to the insignificance of industry effect in this sample, industry variables were notincluded in the model.
2) t-statistics in parentheses;'significant at the 10% level, "significant at the 5% level, and""significant at the 1% level.
-31-
mwiimn^mismm 1 ^
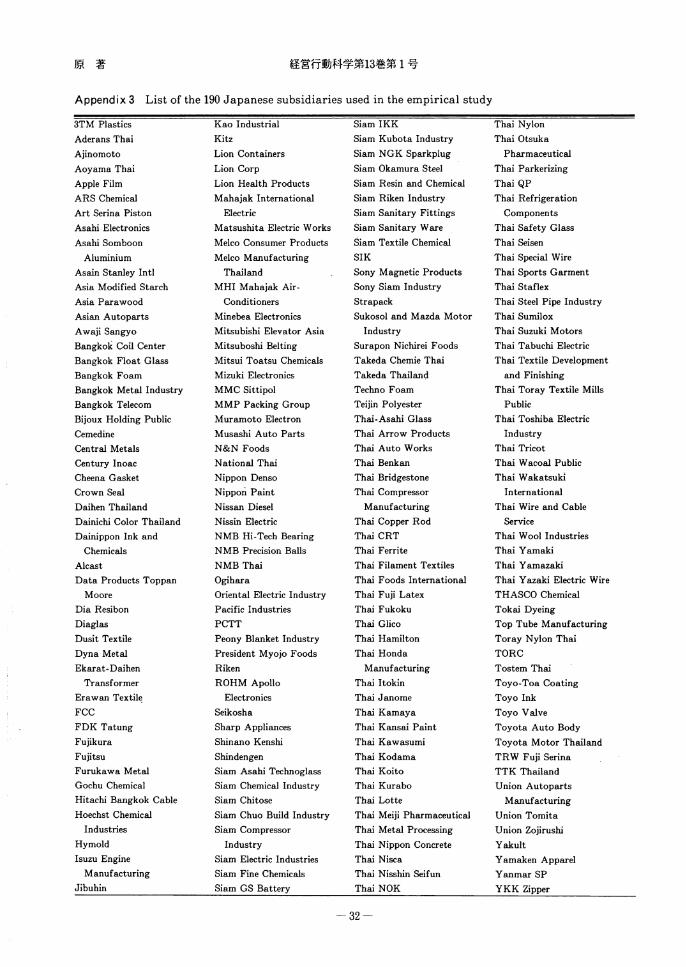
Appendix 3 List of the 190 Japanese subsidiaries used in the empirical study
3TM Plastics
Aderans Thai
Ajinomoto
Aoyama Thai
Apple Film
ARS Chemical
Art Serina Piston
Asahi Electronics
Asahi Somboon
Aluminium
Asain Stanley Intl
Asia Modified Starch
Asia Parawood
Asian Autoparts
Awaji Sangyo
Bangkok Coil Center
Bangkok Float Glass
Bangkok Foam
Bangkok Metal Industry
Bangkok Telecom
Bijoux Holding Public
Cemedine
Central Metals
Century Inoac
Cheena Gasket
Crown Seal
Daihen Thailand
Dainichi Color Thailand
Dainippon Ink and
Chemicals
Alcast
Data Products Toppan
Moore
Dia Resibon
Diaglas
Dusit Textile
Dyna Metal
Ekarat-Daihen
Transformer
Erawan Textile
FCC
FDK Tatung
Fujikura
Fujitsu
Furukawa Metal
Gochu Chemical
Hitachi Bangkok Cable
Hoechst Chemical
Industries
Hymold
Isuzu Engine
Manufacturing
Jibuhin
Kao Industrial
Kitz
Lion Containers
Lion Corp
Lion Health Products
Mahajak International
Electric
Matsushita Electric Works
Melco Consumer Products
Melco Manufacturing
Thailand
MHI Mahajak Air-
Conditioners
Minebea Electronics
Mitsubishi Elevator Asia
Mitsuboshi Belting
Mitsui Toatsu Chemicals
Mizuki Electronics
MMC Sittipol
MMP Packing Group
Muramoto Electron
Musashi Auto Parts
N&N Foods
National Thai
Nippon Denso
Nippon Paint
Nissan Diesel
Nissin Electric
NMB Hi-Tech Bearing
NMB Precision Balls
NMB Thai
Ogihara
Oriental Electric Industry
Pacific Industries
PCTT
Peony Blanket Industry
President Myojo Foods
Riken
ROHM Apollo
Electronics
Seikosha
Sharp Appliances
Shinano Kenshi
Shindengen
Siam Asahi Technoglass
Siam Chemical Industry
Siam Chitose
Siam Chuo Build Industry
Siam Compressor
Industry
Siam Electric Industries
Siam Fine Chemicals
Siam GS Battery
Siam IKK
Siam Kubota Industry
Siam NGK Sparkplug
Siam Okamura Steel
Siam Resin and Chemical
Siam Riken Industry
Siam Sanitary Fittings
Siam Sanitary Ware
Siam Textile Chemical
SIK
Sony Magnetic Products
Sony Siam Industry
Strapack
Sukosol and Mazda Motor
Industry
Surapon Nichirei Foods
Takeda Chemie Thai
Takeda Thailand
Techno Foam
Teijin Polyester
Thai-Asahi Glass
Thai Arrow Products
Thai Auto Works
Thai Benkan
Thai Bridgestone
Thai Compressor
Manufacturing
Thai Copper Rod
Thai CRT
Thai Ferrite
Thai Filament Textiles
Thai Foods International
Thai Fuji Latex
Thai Fukoku
Thai Glico
Thai Hamilton
Thai Honda
Manufacturing
Thai Itokin
Thai Janome
Thai Kamaya
Thai Kansai Paint
Thai Kawasumi
Thai Kodama
Thai Koito
Thai Kurabo
Thai Lotte
Thai Meiji Pharmaceutical
Thai Metal Processing
Thai Nippon Concrete
Thai Nisca
Thai Nisshin Seifun
Thai NOK
32-
Thai Nylon
Thai Otsuka
Pharmaceutical
Thai Parkerizing
Thai QP
Thai Refrigeration
Components
Thai Safety Glass
Thai Seisen
Thai Special Wire
Thai Sports Garment
Thai Staflex
Thai Steel Pipe Industry
Thai Sumilox
Thai Suzuki Motors
Thai Tabuchi Electric
Thai Textile Development
and Finishing
Thai Toray Textile Mills
Public
Thai Toshiba Electric
Industry
Thai Tricot
Thai Wacoal Public
Thai Wakatsuki
International
Thai Wire and Cable
Service
Thai Wool Industries
Thai Yamaki
Thai Yamazaki
Thai Yazaki Electric Wire
THASCO Chemical
Tokai Dyeing
Top Tube Manufacturing
Toray Nylon Thai
TORC
Tostem Thai
Toyo-Toa Coating
Toyo Ink
Toyo Valve
Toyota Auto Body
Toyota Motor Thailand
TRW Fuji Serina
TTK Thailand
Union Autoparts
Manufacturing
Union Tomita
Union Zojirushi
Yakult
Yamaken Apparel
Yanmar SP
YKK Zipper