Embed Size (px)
Citation preview

Greentech / 1
Index Performance(1)
January Ending Versus First Day of the
January YTD CY 2019 52 Wk High 52 Wk Low
Dow Jones Industrial Average (1.0%) (1.0%) 22.3% (3.7%) 13.9%
NASDAQ Composite 2.0% 2.0% 35.2% (2.7%) 25.6%
S&P 500 (0.2%) (0.2%) 28.9% (3.1%) 19.2%
NASDAQ Clean Edge Green Energy 5.9% 5.9% 40.7% (2.9%) 39.7%
(10.0%)
0.0%
10.0%
20.0%
30.0%
40.0%
50.0%
Jan-19 Mar-19 May-19 Jul-19 Sep-19 Nov-19 Jan-20
NASDAQ Clean Edge Green Energy Dow Jones Industrial Average NASDAQ Composite S&P 500
Corporate M&A
Transactions
Target Acquiror Transaction Description
GFL, a provider of waste management and recycling
services, entered into a definitive agreement to acquire
the solid and liquid waste business of American Waste, a
Michigan-based subsidiary of a waste management
company, for $380mm
Brookfield Renewable Partners, an operator of a large
publicly traded renewable power portfolio, submitted a
proposal to acquire the outstanding class A common
shares of TerraForm Power, a New York-based YieldCo,
for $4bn(2)
BorgWarner, a provider of auto-parts for combustion,
hybrid and electric vehicles, acquired Delphi
Technologies, a provider of innovative propulsion
systems, in an all-stock transaction for $3.3bn
Capital Raises
Company Transaction Description
Altus Power America, an investor in solar generation projects, raised $850mm
through a recapitalization initiative initiated with Blackstone GSO Partners and
Blackstone Insurance Solutions (BIS) to fund existing capital structures and future
development
Joby Aviation, a developer of vertical take-off and landing personal air vehicles,
raised a $590mm Series C round of funding, including $394mm from lead
investor Toyota Motor Corporation, with participation from other investors such
as Capricorn Investment Group and JetBlue Technology Ventures
Scale Microgrid Solutions, a leading provider of distributed clean energy and
microgrid platforms, raised a $300mm equity commitment from Warburg Pincus,
a global private equity firm with a focus on growth investing
Sustainable Technology and
Infrastructure Monthly Market Update
January 2020
About Greentech Capital Advisors
Our mission is to empower companies and investors who are creating a more efficient and sustainable global infrastructure. We are
purpose-built to ensure that our clients achieve success. Our team of experienced bankers are sector experts and understand our
clients' industries and needs. We reach a vast global network of buyers, growth companies, asset owners and investors, and thereby
provide clients with more ways to succeed through a deeper relationship network. We have directly relevant transaction experience
which enables us to find creative structures and solutions to close transactions. We are an expert team of 75 professionals working
seamlessly on our clients' behalf in New York, Zurich and San Francisco.
Performance of Key Market Indices(1)
Notable Recent Transactions & Capital Raises
(1) Performance does not include reinvestment of dividends.
(2) Proposed transaction.
31.7%
23.6%
17.8%
11.2%
Greentech advising on transaction
Greentech / 2
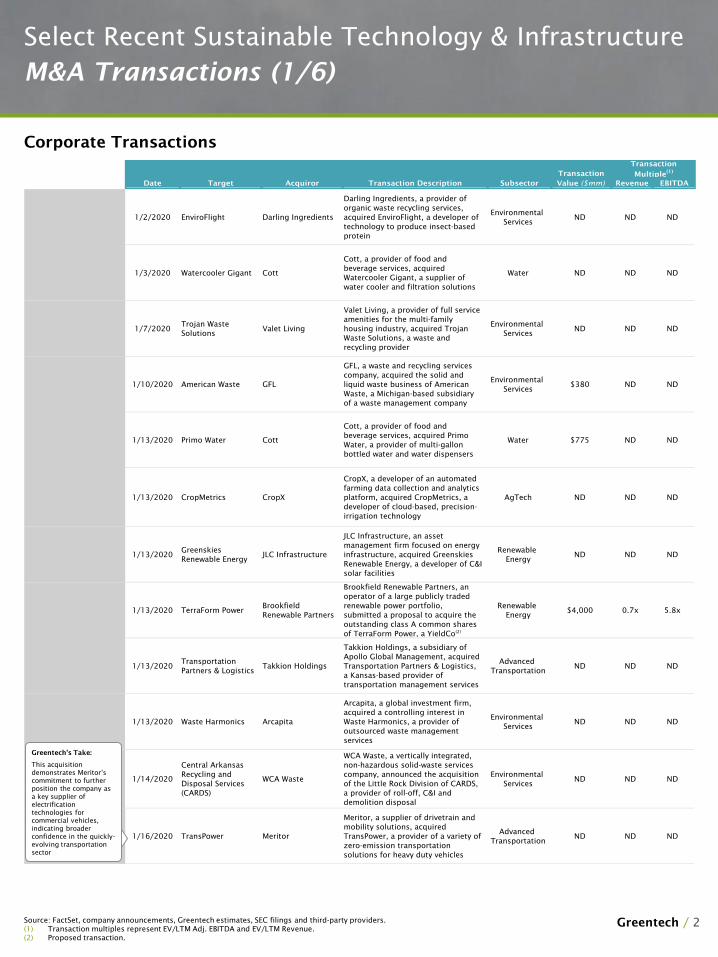
1/2/2020 EnviroFlight Darling Ingredients
Darling Ingredients, a provider of
organic waste recycling services,
acquired EnviroFlight, a developer of
technology to produce insect-based
protein
Environmental
ServicesND ND ND
1/3/2020 Watercooler Gigant Cott
Cott, a provider of food and
beverage services, acquired
Watercooler Gigant, a supplier of
water cooler and filtration solutions
Water ND ND ND
1/7/2020Trojan Waste
Solutions Valet Living
Valet Living, a provider of full service
amenities for the multi-family
housing industry, acquired Trojan
Waste Solutions, a waste and
recycling provider
Environmental
ServicesND ND ND
1/10/2020 American Waste GFL
GFL, a waste and recycling services
company, acquired the solid and
liquid waste business of American
Waste, a Michigan-based subsidiary
of a waste management company
Environmental
Services$380 ND ND
1/13/2020 Primo Water Cott
Cott, a provider of food and
beverage services, acquired Primo
Water, a provider of multi-gallon
bottled water and water dispensers
Water $775 ND ND
1/13/2020 CropMetrics CropX
CropX, a developer of an automated
farming data collection and analytics
platform, acquired CropMetrics, a
developer of cloud-based, precision-
irrigation technology
AgTech ND ND ND
1/13/2020Greenskies
Renewable Energy JLC Infrastructure
JLC Infrastructure, an asset
management firm focused on energy
infrastructure, acquired Greenskies
Renewable Energy, a developer of C&I
solar facilities
Renewable
Energy ND ND ND
1/13/2020 TerraForm PowerBrookfield
Renewable Partners
Brookfield Renewable Partners, an
operator of a large publicly traded
renewable power portfolio,
submitted a proposal to acquire the
outstanding class A common shares
of TerraForm Power, a YieldCo(2)
Renewable
Energy $4,000 0.7x 5.8x
1/13/2020Transportation
Partners & LogisticsTakkion Holdings
Takkion Holdings, a subsidiary of
Apollo Global Management, acquired
Transportation Partners & Logistics,
a Kansas-based provider of
transportation management services
Advanced
Transportation ND ND ND
1/13/2020 Waste Harmonics Arcapita
Arcapita, a global investment firm,
acquired a controlling interest in
Waste Harmonics, a provider of
outsourced waste management
services
Environmental
ServicesND ND ND
1/14/2020
Central Arkansas
Recycling and
Disposal Services
(CARDS)
WCA Waste
WCA Waste, a vertically integrated,
non-hazardous solid-waste services
company, announced the acquisition
of the Little Rock Division of CARDS,
a provider of roll-off, C&I and
demolition disposal
Environmental
ServicesND ND ND
1/16/2020 TransPower Meritor
Meritor, a supplier of drivetrain and
mobility solutions, acquired
TransPower, a provider of a variety of
zero-emission transportation
solutions for heavy duty vehicles
Advanced
Transportation ND ND ND
Corporate Transactions
Select Recent Sustainable Technology & Infrastructure
M&A Transactions (1/6)
Source: FactSet, company announcements, Greentech estimates, SEC filings and third-party providers.
(1) Transaction multiples represent EV/LTM Adj. EBITDA and EV/LTM Revenue.
(2) Proposed transaction.
Transaction
Transaction
Multiple(1)
Date Target Acquiror Transaction Description Subsector Value ($mm) Revenue EBITDA
Greentech’s Take:
This acquisition
demonstrates Meritor’s
commitment to further
position the company as
a key supplier of
electrification
technologies for
commercial vehicles,
indicating broader
confidence in the quickly-
evolving transportation
sector
Greentech / 3
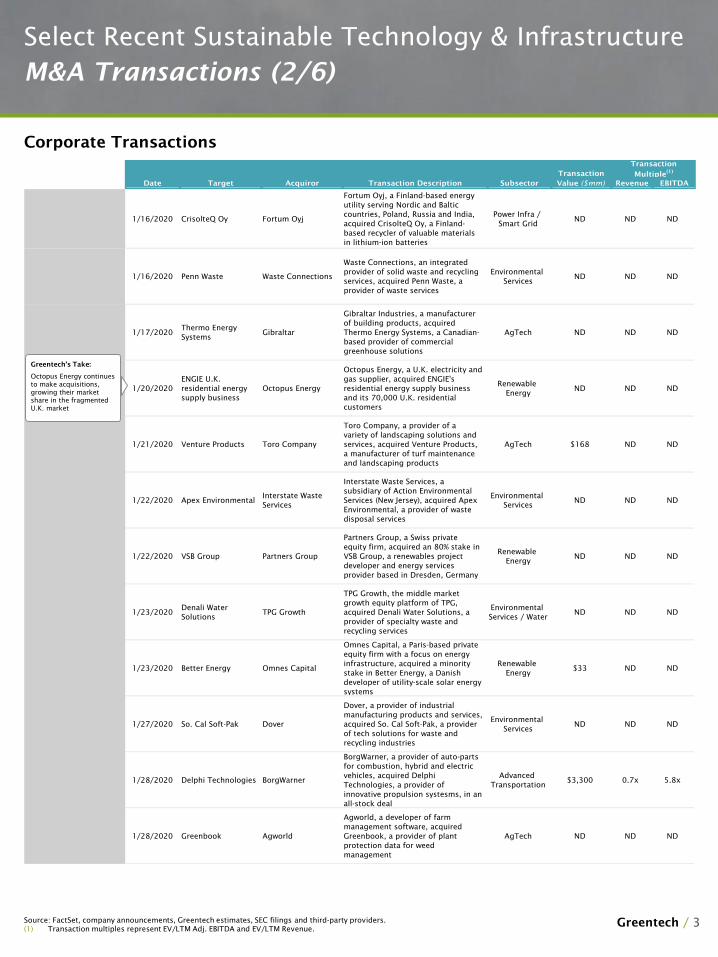
1/16/2020 CrisolteQ Oy Fortum Oyj
Fortum Oyj, a Finland-based energy
utility serving Nordic and Baltic
countries, Poland, Russia and India,
acquired CrisolteQ Oy, a Finland-
based recycler of valuable materials
in lithium-ion batteries
Power Infra /
Smart GridND ND ND
1/16/2020 Penn Waste Waste Connections
Waste Connections, an integrated
provider of solid waste and recycling
services, acquired Penn Waste, a
provider of waste services
Environmental
ServicesND ND ND
1/17/2020Thermo Energy
SystemsGibraltar
Gibraltar Industries, a manufacturer
of building products, acquired
Thermo Energy Systems, a Canadian-
based provider of commercial
greenhouse solutions
AgTech ND ND ND
1/20/2020
ENGIE U.K.
residential energy
supply business
Octopus Energy
Octopus Energy, a U.K. electricity and
gas supplier, acquired ENGIE's
residential energy supply business
and its 70,000 U.K. residential
customers
Renewable
Energy ND ND ND
1/21/2020 Venture Products Toro Company
Toro Company, a provider of a
variety of landscaping solutions and
services, acquired Venture Products,
a manufacturer of turf maintenance
and landscaping products
AgTech $168 ND ND
1/22/2020 Apex EnvironmentalInterstate Waste
Services
Interstate Waste Services, a
subsidiary of Action Environmental
Services (New Jersey), acquired Apex
Environmental, a provider of waste
disposal services
Environmental
ServicesND ND ND
1/22/2020 VSB Group Partners Group
Partners Group, a Swiss private
equity firm, acquired an 80% stake in
VSB Group, a renewables project
developer and energy services
provider based in Dresden, Germany
Renewable
Energy ND ND ND
1/23/2020Denali Water
Solutions TPG Growth
TPG Growth, the middle market
growth equity platform of TPG,
acquired Denali Water Solutions, a
provider of specialty waste and
recycling services
Environmental
Services / WaterND ND ND
1/23/2020 Better Energy Omnes Capital
Omnes Capital, a Paris-based private
equity firm with a focus on energy
infrastructure, acquired a minority
stake in Better Energy, a Danish
developer of utility-scale solar energy
systems
Renewable
Energy $33 ND ND
1/27/2020 So. Cal Soft-Pak Dover
Dover, a provider of industrial
manufacturing products and services,
acquired So. Cal Soft-Pak, a provider
of tech solutions for waste and
recycling industries
Environmental
ServicesND ND ND
1/28/2020 Delphi Technologies BorgWarner
BorgWarner, a provider of auto-parts
for combustion, hybrid and electric
vehicles, acquired Delphi
Technologies, a provider of
innovative propulsion systesms, in an
all-stock deal
Advanced
Transportation $3,300 0.7x 5.8x
1/28/2020 Greenbook Agworld
Agworld, a developer of farm
management software, acquired
Greenbook, a provider of plant
protection data for weed
management
AgTech ND ND ND
Corporate Transactions
Select Recent Sustainable Technology & Infrastructure
M&A Transactions (2/6)
Source: FactSet, company announcements, Greentech estimates, SEC filings and third-party providers.
(1) Transaction multiples represent EV/LTM Adj. EBITDA and EV/LTM Revenue.
Transaction
Transaction
Multiple(1)
Date Target Acquiror Transaction Description Subsector Value ($mm) Revenue EBITDA
Greentech’s Take:
Octopus Energy continues
to make acquisitions,
growing their market
share in the fragmented
U.K. market
Greentech / 4
Corporate Transactions
Select Recent Sustainable Technology & Infrastructure
M&A Transactions (3/6)
Source: FactSet, company announcements, Greentech estimates, SEC filings and third-party providers.
(1) Transaction multiples represent EV/LTM Adj. EBITDA and EV/LTM Revenue.
Transaction
Transaction
Multiple(1)
Date Target Acquiror Transaction Description Subsector Value ($mm) Revenue EBITDA
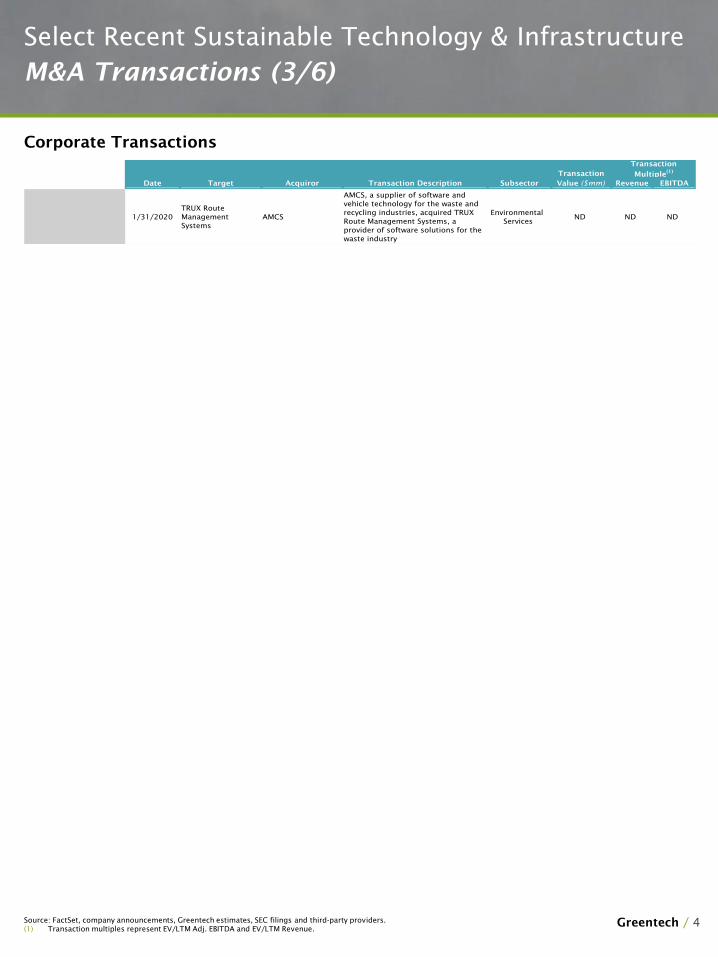
1/31/2020
TRUX Route
Management
Systems
AMCS
AMCS, a supplier of software and
vehicle technology for the waste and
recycling industries, acquired TRUX
Route Management Systems, a
provider of software solutions for the
waste industry
Environmental
ServicesND ND ND
Greentech / 5
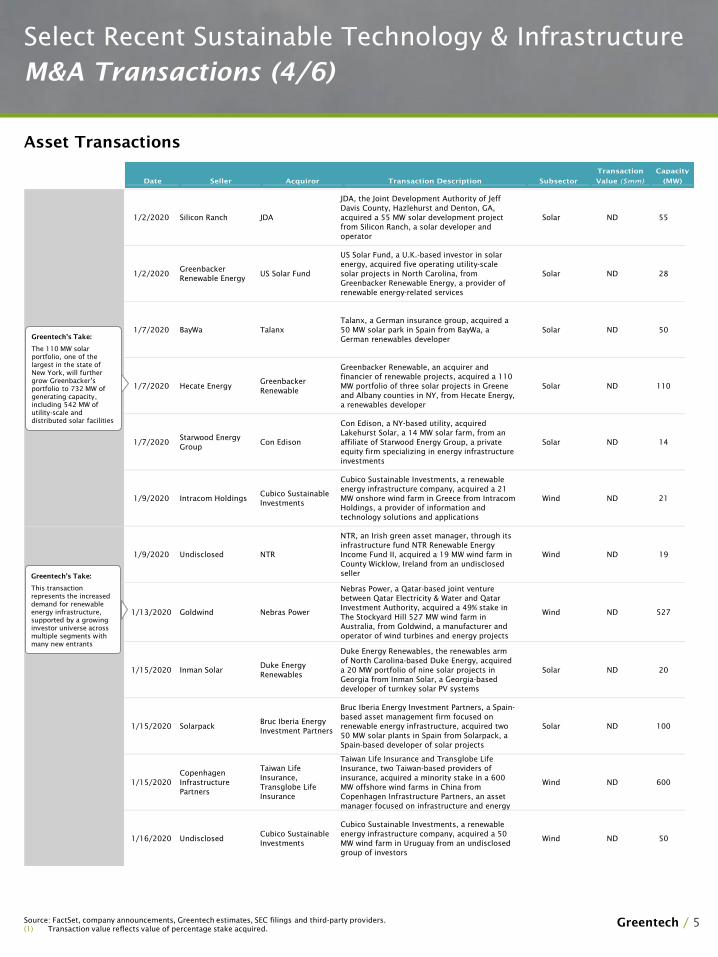
1/2/2020 Silicon Ranch JDA
JDA, the Joint Development Authority of Jeff
Davis County, Hazlehurst and Denton, GA,
acquired a 55 MW solar development project
from Silicon Ranch, a solar developer and
operator
Solar ND 55
1/2/2020Greenbacker
Renewable Energy US Solar Fund
US Solar Fund, a U.K.-based investor in solar
energy, acquired five operating utility-scale
solar projects in North Carolina, from
Greenbacker Renewable Energy, a provider of
renewable energy-related services
Solar ND 28
1/7/2020 BayWa Talanx
Talanx, a German insurance group, acquired a
50 MW solar park in Spain from BayWa, a
German renewables developer
Solar ND 50
1/7/2020 Hecate Energy Greenbacker
Renewable
Greenbacker Renewable, an acquirer and
financier of renewable projects, acquired a 110
MW portfolio of three solar projects in Greene
and Albany counties in NY, from Hecate Energy,
a renewables developer
Solar ND 110
1/7/2020Starwood Energy
Group Con Edison
Con Edison, a NY-based utility, acquired
Lakehurst Solar, a 14 MW solar farm, from an
affiliate of Starwood Energy Group, a private
equity firm specializing in energy infrastructure
investments
Solar ND 14
1/9/2020 Intracom HoldingsCubico Sustainable
Investments
Cubico Sustainable Investments, a renewable
energy infrastructure company, acquired a 21
MW onshore wind farm in Greece from Intracom
Holdings, a provider of information and
technology solutions and applications
Wind ND 21
1/9/2020 Undisclosed NTR
NTR, an Irish green asset manager, through its
infrastructure fund NTR Renewable Energy
Income Fund II, acquired a 19 MW wind farm in
County Wicklow, Ireland from an undisclosed
seller
Wind ND 19
1/13/2020 Goldwind Nebras Power
Nebras Power, a Qatar-based joint venture
between Qatar Electricity & Water and Qatar
Investment Authority, acquired a 49% stake in
The Stockyard Hill 527 MW wind farm in
Australia, from Goldwind, a manufacturer and
operator of wind turbines and energy projects
Wind ND 527
1/15/2020 Inman SolarDuke Energy
Renewables
Duke Energy Renewables, the renewables arm
of North Carolina-based Duke Energy, acquired
a 20 MW portfolio of nine solar projects in
Georgia from Inman Solar, a Georgia-based
developer of turnkey solar PV systems
Solar ND 20
1/15/2020 SolarpackBruc Iberia Energy
Investment Partners
Bruc Iberia Energy Investment Partners, a Spain-
based asset management firm focused on
renewable energy infrastructure, acquired two
50 MW solar plants in Spain from Solarpack, a
Spain-based developer of solar projects
Solar ND 100
1/15/2020
Copenhagen
Infrastructure
Partners
Taiwan Life
Insurance,
Transglobe Life
Insurance
Taiwan Life Insurance and Transglobe Life
Insurance, two Taiwan-based providers of
insurance, acquired a minority stake in a 600
MW offshore wind farms in China from
Copenhagen Infrastructure Partners, an asset
manager focused on infrastructure and energy
Wind ND 600
1/16/2020 UndisclosedCubico Sustainable
Investments
Cubico Sustainable Investments, a renewable
energy infrastructure company, acquired a 50
MW wind farm in Uruguay from an undisclosed
group of investors
Wind ND 50
Select Recent Sustainable Technology & Infrastructure
M&A Transactions (4/6)
Asset Transactions
Source: FactSet, company announcements, Greentech estimates, SEC filings and third-party providers.
(1) Transaction value reflects value of percentage stake acquired.
Transaction Capacity
Date Seller Acquiror Transaction Description Subsector Value ($mm) (MW)
Greentech’s Take:
The 110 MW solar
portfolio, one of the
largest in the state of
New York, will further
grow Greenbacker’s
portfolio to 732 MW of
generating capacity,
including 542 MW of
utility-scale and
distributed solar facilities
Greentech’s Take:
This transaction
represents the increased
demand for renewable
energy infrastructure,
supported by a growing
investor universe across
multiple segments with
many new entrants
Greentech / 6
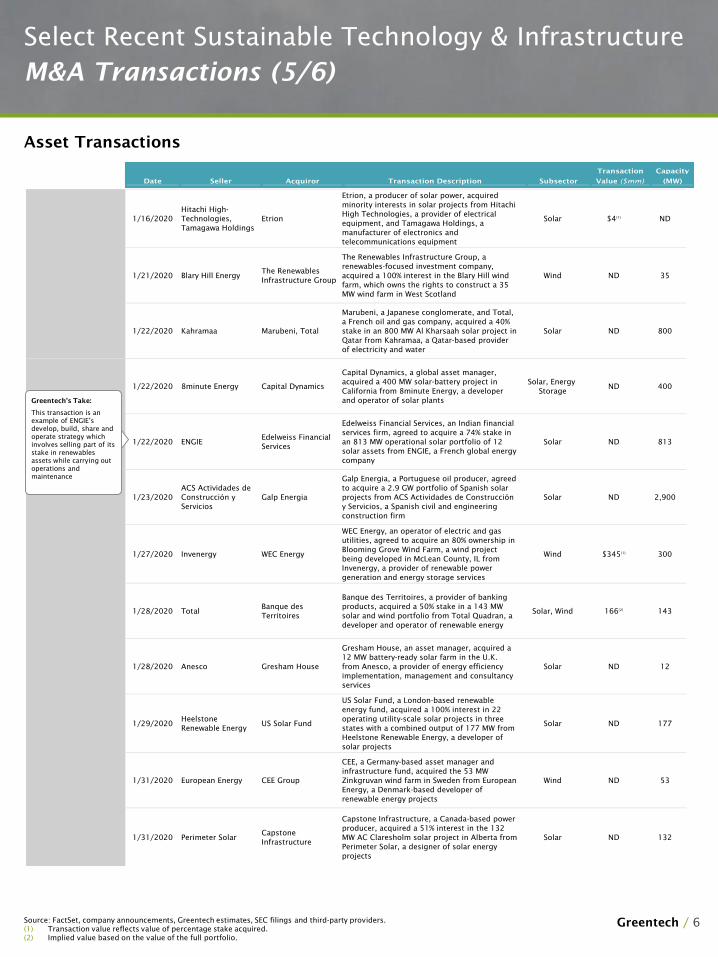
1/16/2020
Hitachi High-
Technologies,
Tamagawa Holdings
Etrion
Etrion, a producer of solar power, acquired
minority interests in solar projects from Hitachi
High Technologies, a provider of electrical
equipment, and Tamagawa Holdings, a
manufacturer of electronics and
telecommunications equipment
Solar $4(1)
ND
1/21/2020 Blary Hill Energy The Renewables
Infrastructure Group
The Renewables Infrastructure Group, a
renewables-focused investment company,
acquired a 100% interest in the Blary Hill wind
farm, which owns the rights to construct a 35
MW wind farm in West Scotland
Wind ND 35
1/22/2020 Kahramaa Marubeni, Total
Marubeni, a Japanese conglomerate, and Total,
a French oil and gas company, acquired a 40%
stake in an 800 MW Al Kharsaah solar project in
Qatar from Kahramaa, a Qatar-based provider
of electricity and water
Solar ND 800
1/22/2020 8minute Energy Capital Dynamics
Capital Dynamics, a global asset manager,
acquired a 400 MW solar-battery project in
California from 8minute Energy, a developer
and operator of solar plants
Solar, Energy
StorageND 400
1/22/2020 ENGIE Edelweiss Financial
Services
Edelweiss Financial Services, an Indian financial
services firm, agreed to acquire a 74% stake in
an 813 MW operational solar portfolio of 12
solar assets from ENGIE, a French global energy
company
Solar ND 813
1/23/2020
ACS Actividades de
Construcción y
Servicios
Galp Energia
Galp Energia, a Portuguese oil producer, agreed
to acquire a 2.9 GW portfolio of Spanish solar
projects from ACS Actividades de Construcción
y Servicios, a Spanish civil and engineering
construction firm
Solar ND 2,900
1/27/2020 Invenergy WEC Energy
WEC Energy, an operator of electric and gas
utilities, agreed to acquire an 80% ownership in
Blooming Grove Wind Farm, a wind project
being developed in McLean County, IL from
Invenergy, a provider of renewable power
generation and energy storage services
Wind $345(1)
300
1/28/2020 TotalBanque des
Territoires
Banque des Territoires, a provider of banking
products, acquired a 50% stake in a 143 MW
solar and wind portfolio from Total Quadran, a
developer and operator of renewable energy
Solar, Wind 166(2)
143
1/28/2020 Anesco Gresham House
Gresham House, an asset manager, acquired a
12 MW battery-ready solar farm in the U.K.
from Anesco, a provider of energy efficiency
implementation, management and consultancy
services
Solar ND 12
1/29/2020Heelstone
Renewable EnergyUS Solar Fund
US Solar Fund, a London-based renewable
energy fund, acquired a 100% interest in 22
operating utility-scale solar projects in three
states with a combined output of 177 MW from
Heelstone Renewable Energy, a developer of
solar projects
Solar ND 177
1/31/2020 European Energy CEE Group
CEE, a Germany-based asset manager and
infrastructure fund, acquired the 53 MW
Zinkgruvan wind farm in Sweden from European
Energy, a Denmark-based developer of
renewable energy projects
Wind ND 53
1/31/2020 Perimeter SolarCapstone
Infrastructure
Capstone Infrastructure, a Canada-based power
producer, acquired a 51% interest in the 132
MW AC Claresholm solar project in Alberta from
Perimeter Solar, a designer of solar energy
projects
Solar ND 132
Select Recent Sustainable Technology & Infrastructure
M&A Transactions (5/6)
Asset Transactions
Transaction Capacity
Date Seller Acquiror Transaction Description Subsector Value ($mm) (MW)
Greentech’s Take:
This transaction is an
example of ENGIE’s
develop, build, share and
operate strategy which
involves selling part of its
stake in renewables
assets while carrying out
operations and
maintenance
Source: FactSet, company announcements, Greentech estimates, SEC filings and third-party providers.
(1) Transaction value reflects value of percentage stake acquired.
(2) Implied value based on the value of the full portfolio.
Greentech / 7
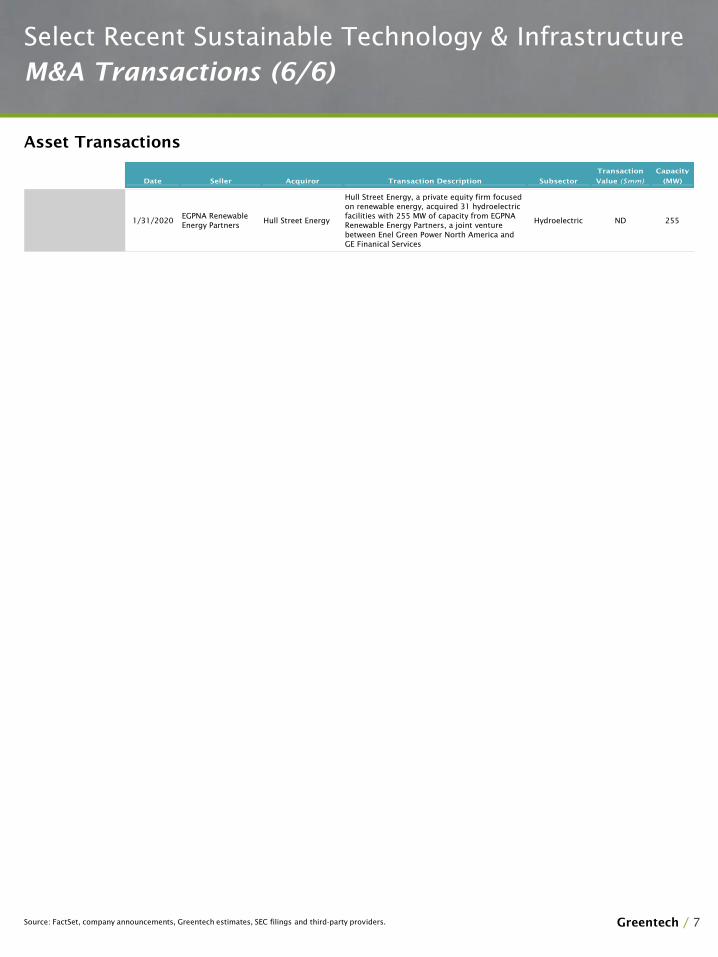
Select Recent Sustainable Technology & Infrastructure
M&A Transactions (6/6)
Asset Transactions
Transaction Capacity
Date Seller Acquiror Transaction Description Subsector Value ($mm) (MW)
Source: FactSet, company announcements, Greentech estimates, SEC filings and third-party providers.
1/31/2020EGPNA Renewable
Energy PartnersHull Street Energy
Hull Street Energy, a private equity firm focused
on renewable energy, acquired 31 hydroelectric
facilities with 255 MW of capacity from EGPNA
Renewable Energy Partners, a joint venture
between Enel Green Power North America and
GE Finanical Services
Hydroelectric ND 255
Greentech / 8
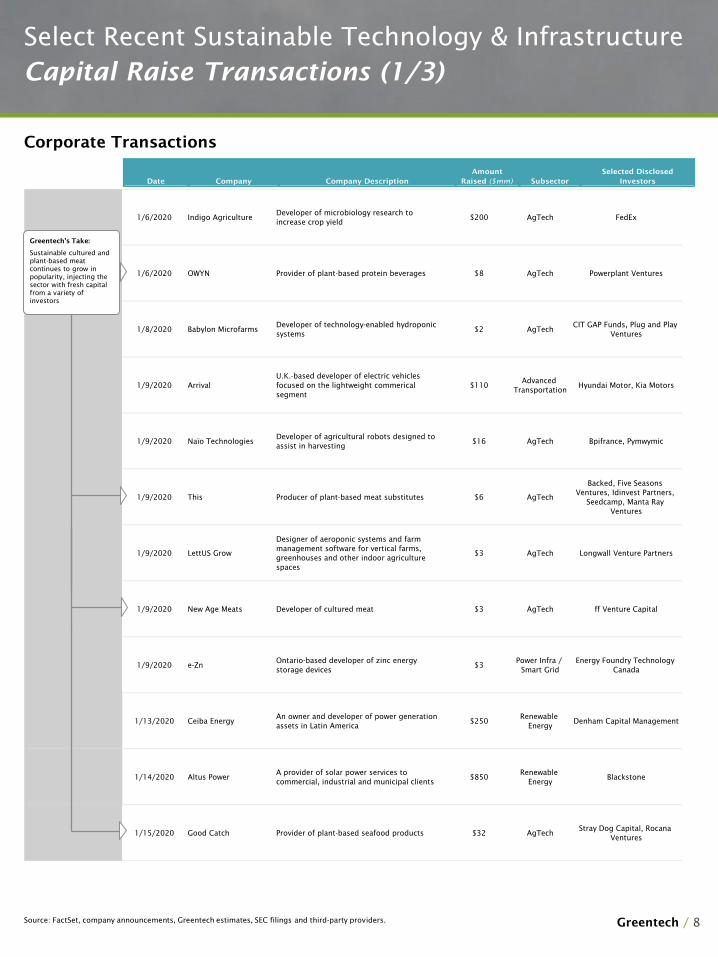
1/6/2020 Indigo Agriculture Developer of microbiology research to
increase crop yield$200 AgTech FedEx
1/6/2020 OWYN Provider of plant-based protein beverages $8 AgTech Powerplant Ventures
1/8/2020 Babylon MicrofarmsDeveloper of technology-enabled hydroponic
systems$2 AgTech
CIT GAP Funds, Plug and Play
Ventures
1/9/2020 Arrival
U.K.-based developer of electric vehicles
focused on the lightweight commerical
segment
$110Advanced
TransportationHyundai Motor, Kia Motors
1/9/2020 Naïo TechnologiesDeveloper of agricultural robots designed to
assist in harvesting $16 AgTech Bpifrance, Pymwymic
1/9/2020 This Producer of plant-based meat substitutes $6 AgTech
Backed, Five Seasons
Ventures, Idinvest Partners,
Seedcamp, Manta Ray
Ventures
1/9/2020 LettUS Grow
Designer of aeroponic systems and farm
management software for vertical farms,
greenhouses and other indoor agriculture
spaces
$3 AgTech Longwall Venture Partners
1/9/2020 New Age Meats Developer of cultured meat $3 AgTech ff Venture Capital
1/9/2020 e-ZnOntario-based developer of zinc energy
storage devices$3
Power Infra /
Smart Grid
Energy Foundry Technology
Canada
1/13/2020 Ceiba Energy An owner and developer of power generation
assets in Latin America$250
Renewable
Energy Denham Capital Management
1/14/2020 Altus PowerA provider of solar power services to
commercial, industrial and municipal clients$850
Renewable
Energy Blackstone
1/15/2020 Good Catch Provider of plant-based seafood products $32 AgTechStray Dog Capital, Rocana
Ventures
Select Recent Sustainable Technology & Infrastructure
Capital Raise Transactions (1/3)
Corporate Transactions
Source: FactSet, company announcements, Greentech estimates, SEC filings and third-party providers.
Amount Selected Disclosed
Date Company Company Description Raised ($mm) Subsector Investors
Greentech’s Take:
Sustainable cultured and
plant-based meat
continues to grow in
popularity, injecting the
sector with fresh capital
from a variety of
investors
Greentech / 9
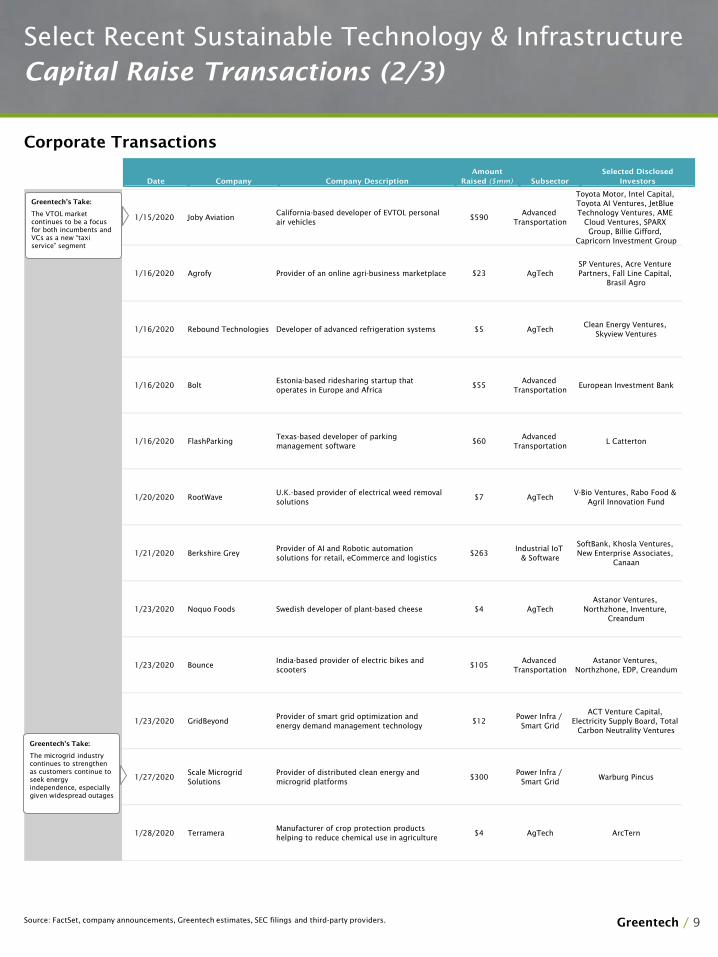
1/15/2020 Joby Aviation California-based developer of EVTOL personal
air vehicles $590
Advanced
Transportation
Toyota Motor, Intel Capital,
Toyota AI Ventures, JetBlue
Technology Ventures, AME
Cloud Ventures, SPARX
Group, Billie Gifford,
Capricorn Investment Group
1/16/2020 Agrofy Provider of an online agri-business marketplace $23 AgTech
SP Ventures, Acre Venture
Partners, Fall Line Capital,
Brasil Agro
1/16/2020 Rebound Technologies Developer of advanced refrigeration systems $5 AgTechClean Energy Ventures,
Skyview Ventures
1/16/2020 Bolt Estonia-based ridesharing startup that
operates in Europe and Africa $55
Advanced
TransportationEuropean Investment Bank
1/16/2020 FlashParking Texas-based developer of parking
management software$60
Advanced
TransportationL Catterton
1/20/2020 RootWaveU.K.-based provider of electrical weed removal
solutions $7 AgTech
V-Bio Ventures, Rabo Food &
Agril Innovation Fund
1/21/2020 Berkshire Grey Provider of AI and Robotic automation
solutions for retail, eCommerce and logistics$263
Industrial IoT
& Software
SoftBank, Khosla Ventures,
New Enterprise Associates,
Canaan
1/23/2020 Noquo Foods Swedish developer of plant-based cheese $4 AgTech
Astanor Ventures,
Northzhone, Inventure,
Creandum
1/23/2020 BounceIndia-based provider of electric bikes and
scooters$105
Advanced
Transportation
Astanor Ventures,
Northzhone, EDP, Creandum
1/23/2020 GridBeyond Provider of smart grid optimization and
energy demand management technology $12
Power Infra /
Smart Grid
ACT Venture Capital,
Electricity Supply Board, Total
Carbon Neutrality Ventures
1/27/2020Scale Microgrid
Solutions
Provider of distributed clean energy and
microgrid platforms$300
Power Infra /
Smart GridWarburg Pincus
1/28/2020 Terramera Manufacturer of crop protection products
helping to reduce chemical use in agriculture $4 AgTech ArcTern
Select Recent Sustainable Technology & Infrastructure
Capital Raise Transactions (2/3)
Corporate Transactions
Source: FactSet, company announcements, Greentech estimates, SEC filings and third-party providers.
Amount Selected Disclosed
Date Company Company Description Raised ($mm) Subsector Investors
Greentech’s Take:
The microgrid industry
continues to strengthen
as customers continue to
seek energy
independence, especially
given widespread outages
Greentech’s Take:
The VTOL market
continues to be a focus
for both incumbents and
VCs as a new “taxi
service” segment
Greentech / 10
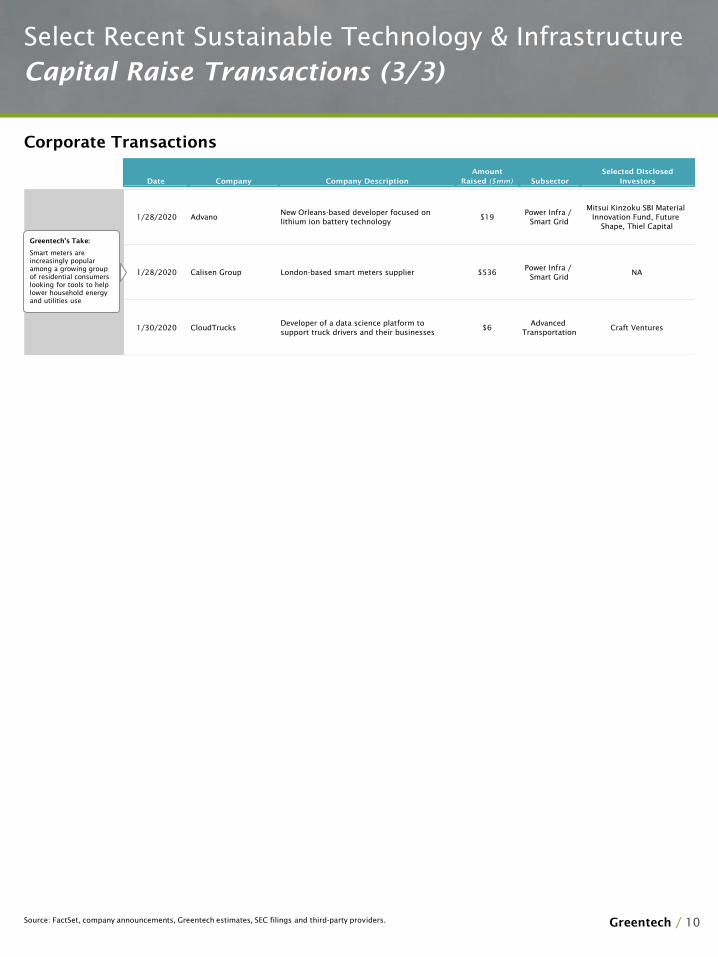
Select Recent Sustainable Technology & Infrastructure
Capital Raise Transactions (3/3)
Corporate Transactions
Source: FactSet, company announcements, Greentech estimates, SEC filings and third-party providers.
Amount Selected Disclosed
Date Company Company Description Raised ($mm) Subsector Investors
1/28/2020 AdvanoNew Orleans-based developer focused on
lithium ion battery technology $19
Power Infra /
Smart Grid
Mitsui Kinzoku SBI Material
Innovation Fund, Future
Shape, Thiel Capital
1/28/2020 Calisen Group London-based smart meters supplier $536Power Infra /
Smart GridNA
1/30/2020 CloudTrucksDeveloper of a data science platform to
support truck drivers and their businesses$6
Advanced
TransportationCraft Ventures
Greentech’s Take:
Smart meters are
increasingly popular
among a growing group
of residential consumers
looking for tools to help
lower household energy
and utilities use
Greentech / 11
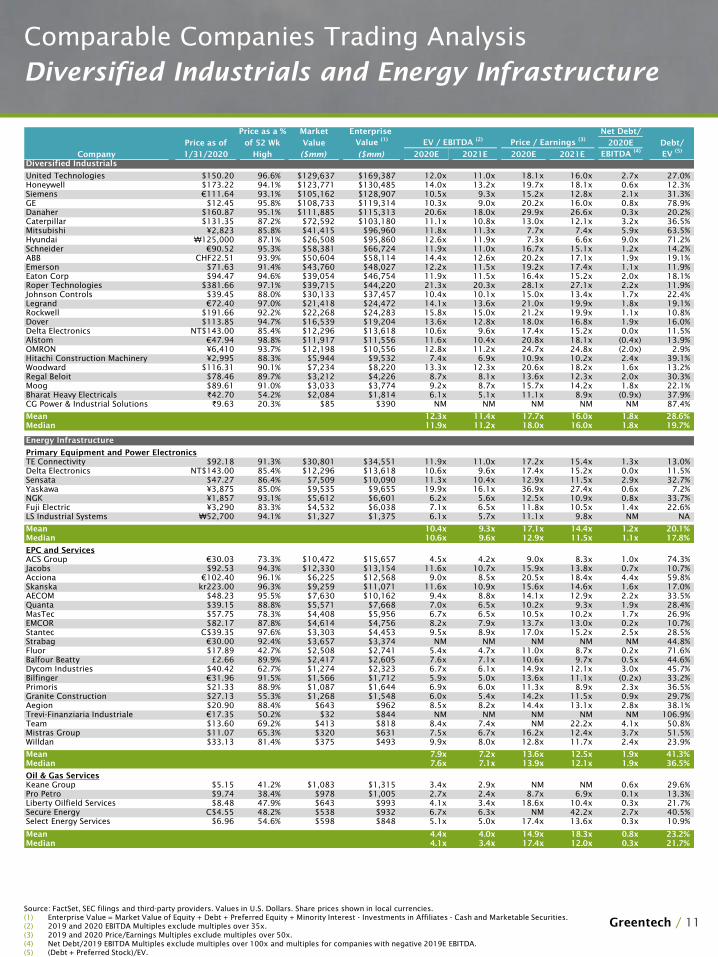
Comparable Companies Trading Analysis
Diversified Industrials and Energy Infrastructure
Source: FactSet, SEC filings and third-party providers. Values in U.S. Dollars. Share prices shown in local currencies.
(1) Enterprise Value = Market Value of Equity + Debt + Preferred Equity + Minority Interest - Investments in Affiliates - Cash and Marketable Securities.
(2) 2019 and 2020 EBITDA Multiples exclude multiples over 35x.
(3) 2019 and 2020 Price/Earnings Multiples exclude multiples over 50x.
(4) Net Debt/2019 EBITDA Multiples exclude multiples over 100x and multiples for companies with negative 2019E EBITDA.
(5) (Debt + Preferred Stock)/EV.
Price as a % Market Enterprise Net Debt/
Price as of of 52 Wk Value Value (1)
EV / EBITDA (2)
Price / Earnings (3)
2020E Debt/
Company 1/31/2020 High ($mm) ($mm) 2020E 2021E 2020E 2021E EBITDA (4)
EV (5)
Diversified Industrials
United Technologies $150.20 96.6% $129,637 $169,387 12.0x 11.0x 18.1x 16.0x 2.7x 27.0%
Honeywell $173.22 94.1% $123,771 $130,485 14.0x 13.2x 19.7x 18.1x 0.6x 12.3%
Siemens €111.64 93.1% $105,162 $128,907 10.5x 9.3x 15.2x 12.8x 2.1x 31.3%
GE $12.45 95.8% $108,733 $119,314 10.3x 9.0x 20.2x 16.0x 0.8x 78.9%
Danaher $160.87 95.1% $111,885 $115,313 20.6x 18.0x 29.9x 26.6x 0.3x 20.2%
Caterpillar $131.35 87.2% $72,592 $103,180 11.1x 10.8x 13.0x 12.1x 3.2x 36.5%
Mitsubishi ¥2,823 85.8% $41,415 $96,960 11.8x 11.3x 7.7x 7.4x 5.9x 63.5%
Hyundai ₩125,000 87.1% $26,508 $95,860 12.6x 11.9x 7.3x 6.6x 9.0x 71.2%
Schneider €90.52 95.3% $58,381 $66,724 11.9x 11.0x 16.7x 15.1x 1.2x 14.2%
ABB CHF22.51 93.9% $50,604 $58,114 14.4x 12.6x 20.2x 17.1x 1.9x 19.1%
Emerson $71.63 91.4% $43,760 $48,027 12.2x 11.5x 19.2x 17.4x 1.1x 11.9%
Eaton Corp $94.47 94.6% $39,054 $46,754 11.9x 11.5x 16.4x 15.2x 2.0x 18.1%
Roper Technologies $381.66 97.1% $39,715 $44,220 21.3x 20.3x 28.1x 27.1x 2.2x 11.9%
Johnson Controls $39.45 88.0% $30,133 $37,457 10.4x 10.1x 15.0x 13.4x 1.7x 22.4%
Legrand €72.40 97.0% $21,418 $24,472 14.1x 13.6x 21.0x 19.9x 1.8x 19.1%
Rockwell $191.66 92.2% $22,268 $24,283 15.8x 15.0x 21.2x 19.9x 1.1x 10.8%
Dover $113.85 94.7% $16,539 $19,204 13.6x 12.8x 18.0x 16.8x 1.9x 16.0%
Delta Electronics NT$143.00 85.4% $12,296 $13,618 10.6x 9.6x 17.4x 15.2x 0.0x 11.5%
Alstom €47.94 98.8% $11,917 $11,556 11.6x 10.4x 20.8x 18.1x (0.4x) 13.9%
OMRON ¥6,410 93.7% $12,198 $10,556 12.8x 11.2x 24.7x 24.8x (2.0x) 2.9%
Hitachi Construction Machinery ¥2,995 88.3% $5,944 $9,532 7.4x 6.9x 10.9x 10.2x 2.4x 39.1%
Woodward $116.31 90.1% $7,234 $8,220 13.3x 12.3x 20.6x 18.2x 1.6x 13.2%
Regal Beloit $78.46 89.7% $3,212 $4,226 8.7x 8.1x 13.6x 12.3x 2.0x 30.3%
Moog $89.61 91.0% $3,033 $3,774 9.2x 8.7x 15.7x 14.2x 1.8x 22.1%
Bharat Heavy Electricals ₹42.70 54.2% $2,084 $1,814 6.1x 5.1x 11.1x 8.9x (0.9x) 37.9%
CG Power & Industrial Solutions ₹9.63 20.3% $85 $390 NM NM NM NM NM 87.4%
Mean 12.3x 11.4x 17.7x 16.0x 1.8x 28.6%
Median 11.9x 11.2x 18.0x 16.0x 1.8x 19.7%
Energy Infrastructure
Primary Equipment and Power Electronics
TE Connectivity $92.18 91.3% $30,801 $34,551 11.9x 11.0x 17.2x 15.4x 1.3x 13.0%
Delta Electronics NT$143.00 85.4% $12,296 $13,618 10.6x 9.6x 17.4x 15.2x 0.0x 11.5%
Sensata $47.27 86.4% $7,509 $10,090 11.3x 10.4x 12.9x 11.5x 2.9x 32.7%
Yaskawa ¥3,875 85.0% $9,535 $9,655 19.9x 16.1x 36.9x 27.4x 0.6x 7.2%
NGK ¥1,857 93.1% $5,612 $6,601 6.2x 5.6x 12.5x 10.9x 0.8x 33.7%
Fuji Electric ¥3,290 83.3% $4,532 $6,038 7.1x 6.5x 11.8x 10.5x 1.4x 22.6%
LS Industrial Systems ₩52,700 94.1% $1,327 $1,375 6.1x 5.7x 11.1x 9.8x NM NA
Mean 10.4x 9.3x 17.1x 14.4x 1.2x 20.1%
Median 10.6x 9.6x 12.9x 11.5x 1.1x 17.8%
EPC and Services
ACS Group €30.03 73.3% $10,472 $15,657 4.5x 4.2x 9.0x 8.3x 1.0x 74.3%
Jacobs $92.53 94.3% $12,330 $13,154 11.6x 10.7x 15.9x 13.8x 0.7x 10.7%
Acciona €102.40 96.1% $6,225 $12,568 9.0x 8.5x 20.5x 18.4x 4.4x 59.8%
Skanska kr223.00 96.3% $9,259 $11,071 11.6x 10.9x 15.6x 14.6x 1.6x 17.0%
AECOM $48.23 95.5% $7,630 $10,162 9.4x 8.8x 14.1x 12.9x 2.2x 33.5%
Quanta $39.15 88.8% $5,571 $7,668 7.0x 6.5x 10.2x 9.3x 1.9x 28.4%
MasTec $57.75 78.3% $4,408 $5,956 6.7x 6.5x 10.5x 10.2x 1.7x 26.9%
EMCOR $82.17 87.8% $4,614 $4,756 8.2x 7.9x 13.7x 13.0x 0.2x 10.7%
Stantec C$39.35 97.6% $3,303 $4,453 9.5x 8.9x 17.0x 15.2x 2.5x 28.5%
Strabag €30.00 92.4% $3,657 $3,374 NM NM NM NM NM 44.8%
Fluor $17.89 42.7% $2,508 $2,741 5.4x 4.7x 11.0x 8.7x 0.2x 71.6%
Balfour Beatty £2.66 89.9% $2,417 $2,605 7.6x 7.1x 10.6x 9.7x 0.5x 44.6%
Dycom Industries $40.42 62.7% $1,274 $2,323 6.7x 6.1x 14.9x 12.1x 3.0x 45.7%
Bilfinger €31.96 91.5% $1,566 $1,712 5.9x 5.0x 13.6x 11.1x (0.2x) 33.2%
Primoris $21.33 88.9% $1,087 $1,644 6.9x 6.0x 11.3x 8.9x 2.3x 36.5%
Granite Construction $27.13 55.3% $1,268 $1,548 6.0x 5.4x 14.2x 11.5x 0.9x 29.7%
Aegion $20.90 88.4% $643 $962 8.5x 8.2x 14.4x 13.1x 2.8x 38.1%
Trevi-Finanziaria Industriale €17.35 50.2% $32 $844 NM NM NM NM NM 106.9%
Team $13.60 69.2% $413 $818 8.4x 7.4x NM 22.2x 4.1x 50.8%
Mistras Group $11.07 65.3% $320 $631 7.5x 6.7x 16.2x 12.4x 3.7x 51.5%
Willdan $33.13 81.4% $375 $493 9.9x 8.0x 12.8x 11.7x 2.4x 23.9%
Mean 7.9x 7.2x 13.6x 12.5x 1.9x 41.3%
Median 7.6x 7.1x 13.9x 12.1x 1.9x 36.5%
Oil & Gas Services
Keane Group $5.15 41.2% $1,083 $1,315 3.4x 2.9x NM NM 0.6x 29.6%
Pro Petro $9.74 38.4% $978 $1,005 2.7x 2.4x 8.7x 6.9x 0.1x 13.3%
Liberty Oilfield Services $8.48 47.9% $643 $993 4.1x 3.4x 18.6x 10.4x 0.3x 21.7%
Secure Energy C$4.55 48.2% $538 $932 6.7x 6.3x NM 42.2x 2.7x 40.5%
Select Energy Services $6.96 54.6% $598 $848 5.1x 5.0x 17.4x 13.6x 0.3x 10.9%
Mean 4.4x 4.0x 14.9x 18.3x 0.8x 23.2%
Median 4.1x 3.4x 17.4x 12.0x 0.3x 21.7%
Greentech / 12
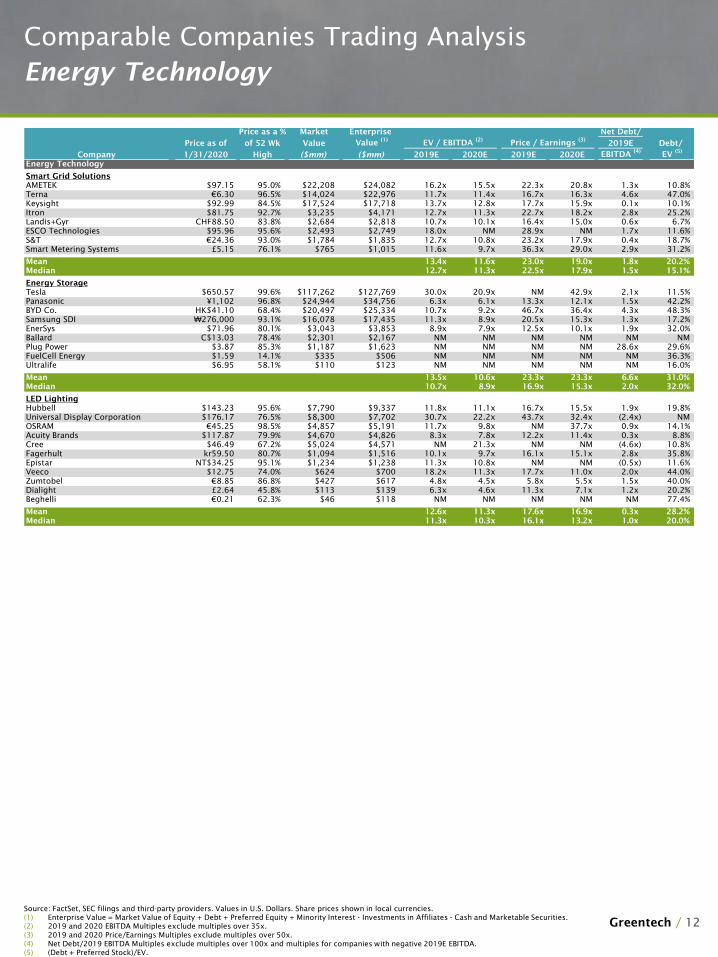
Comparable Companies Trading Analysis
Energy Technology
Source: FactSet, SEC filings and third-party providers. Values in U.S. Dollars. Share prices shown in local currencies.
(1) Enterprise Value = Market Value of Equity + Debt + Preferred Equity + Minority Interest - Investments in Affiliates - Cash and Marketable Securities.
(2) 2019 and 2020 EBITDA Multiples exclude multiples over 35x.
(3) 2019 and 2020 Price/Earnings Multiples exclude multiples over 50x.
(4) Net Debt/2019 EBITDA Multiples exclude multiples over 100x and multiples for companies with negative 2019E EBITDA.
(5) (Debt + Preferred Stock)/EV.
Price as a % Market Enterprise Net Debt/
Price as of of 52 Wk Value Value (1)
EV / EBITDA (2)
Price / Earnings (3)
2019E Debt/
Company 1/31/2020 High ($mm) ($mm) 2019E 2020E 2019E 2020E EBITDA (4)
EV (5)
Energy Technology
Smart Grid Solutions
AMETEK $97.15 95.0% $22,208 $24,082 16.2x 15.5x 22.3x 20.8x 1.3x 10.8%
Terna €6.30 96.5% $14,024 $22,976 11.7x 11.4x 16.7x 16.3x 4.6x 47.0%
Keysight $92.99 84.5% $17,524 $17,718 13.7x 12.8x 17.7x 15.9x 0.1x 10.1%
Itron $81.75 92.7% $3,235 $4,171 12.7x 11.3x 22.7x 18.2x 2.8x 25.2%
Landis+Gyr CHF88.50 83.8% $2,684 $2,818 10.7x 10.1x 16.4x 15.0x 0.6x 6.7%
ESCO Technologies $95.96 95.6% $2,493 $2,749 18.0x NM 28.9x NM 1.7x 11.6%
S&T €24.36 93.0% $1,784 $1,835 12.7x 10.8x 23.2x 17.9x 0.4x 18.7%
Smart Metering Systems £5.15 76.1% $765 $1,015 11.6x 9.7x 36.3x 29.0x 2.9x 31.2%
Mean 13.4x 11.6x 23.0x 19.0x 1.8x 20.2%
Median 12.7x 11.3x 22.5x 17.9x 1.5x 15.1%
Energy Storage
Tesla $650.57 99.6% $117,262 $127,769 30.0x 20.9x NM 42.9x 2.1x 11.5%
Panasonic ¥1,102 96.8% $24,944 $34,756 6.3x 6.1x 13.3x 12.1x 1.5x 42.2%
BYD Co. HK$41.10 68.4% $20,497 $25,334 10.7x 9.2x 46.7x 36.4x 4.3x 48.3%
Samsung SDI ₩276,000 93.1% $16,078 $17,435 11.3x 8.9x 20.5x 15.3x 1.3x 17.2%
EnerSys $71.96 80.1% $3,043 $3,853 8.9x 7.9x 12.5x 10.1x 1.9x 32.0%
Ballard C$13.03 78.4% $2,301 $2,167 NM NM NM NM NM NM
Plug Power $3.87 85.3% $1,187 $1,623 NM NM NM NM 28.6x 29.6%
FuelCell Energy $1.59 14.1% $335 $506 NM NM NM NM NM 36.3%
Ultralife $6.95 58.1% $110 $123 NM NM NM NM NM 16.0%
Mean 13.5x 10.6x 23.3x 23.3x 6.6x 31.0%
Median 10.7x 8.9x 16.9x 15.3x 2.0x 32.0%
LED Lighting
Hubbell $143.23 95.6% $7,790 $9,337 11.8x 11.1x 16.7x 15.5x 1.9x 19.8%
Universal Display Corporation $176.17 76.5% $8,300 $7,702 30.7x 22.2x 43.7x 32.4x (2.4x) NM
OSRAM €45.25 98.5% $4,857 $5,191 11.7x 9.8x NM 37.7x 0.9x 14.1%
Acuity Brands $117.87 79.9% $4,670 $4,826 8.3x 7.8x 12.2x 11.4x 0.3x 8.8%
Cree $46.49 67.2% $5,024 $4,571 NM 21.3x NM NM (4.6x) 10.8%
Fagerhult kr59.50 80.7% $1,094 $1,516 10.1x 9.7x 16.1x 15.1x 2.8x 35.8%
Epistar NT$34.25 95.1% $1,234 $1,238 11.3x 10.8x NM NM (0.5x) 11.6%
Veeco $12.75 74.0% $624 $700 18.2x 11.3x 17.7x 11.0x 2.0x 44.0%
Zumtobel €8.85 86.8% $427 $617 4.8x 4.5x 5.8x 5.5x 1.5x 40.0%
Dialight £2.64 45.8% $113 $139 6.3x 4.6x 11.3x 7.1x 1.2x 20.2%
Beghelli €0.21 62.3% $46 $118 NM NM NM NM NM 77.4%
Mean 12.6x 11.3x 17.6x 16.9x 0.3x 28.2%
Median 11.3x 10.3x 16.1x 13.2x 1.0x 20.0%
Greentech / 13
Price as a % Market Enterprise Net Debt/
Price as of of 52 Wk Value Value (1)
EV / EBITDA (2)
Price / Earnings (3)
2019E Debt/
Company 1/31/2020 High ($mm) ($mm) 2019E 2020E 2019E 2020E EBITDA (4)
EV (5)
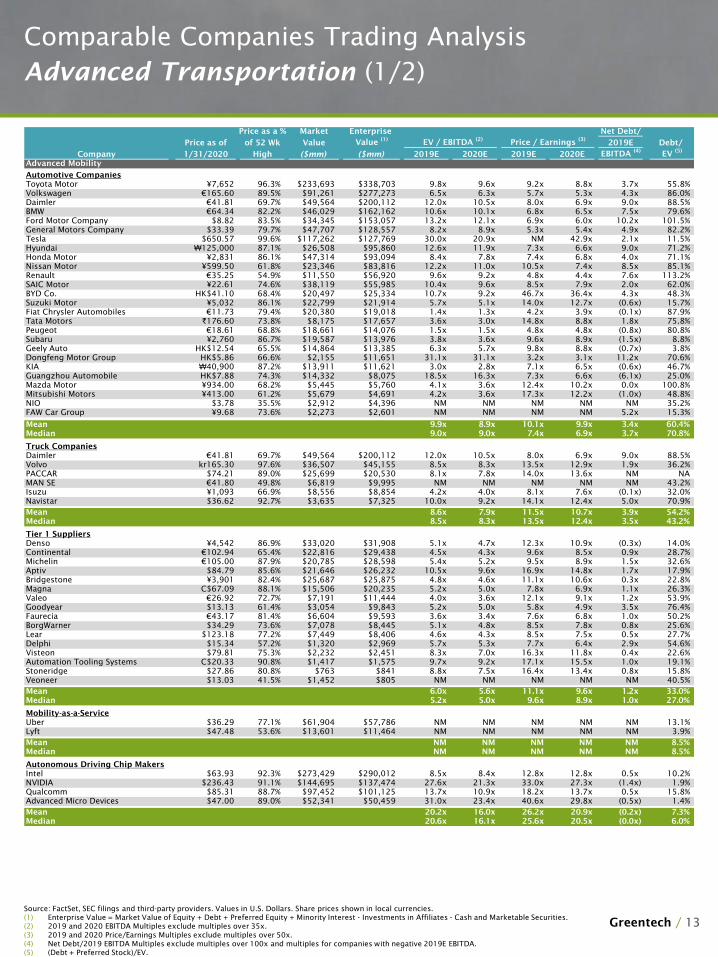
Advanced Mobility
Automotive Companies
Toyota Motor ¥7,652 96.3% $233,693 $338,703 9.8x 9.6x 9.2x 8.8x 3.7x 55.8%
Volkswagen €165.60 89.5% $91,261 $277,273 6.5x 6.3x 5.7x 5.3x 4.3x 86.0%
Daimler €41.81 69.7% $49,564 $200,112 12.0x 10.5x 8.0x 6.9x 9.0x 88.5%
BMW €64.34 82.2% $46,029 $162,162 10.6x 10.1x 6.8x 6.5x 7.5x 79.6%
Ford Motor Company $8.82 83.5% $34,345 $153,057 13.2x 12.1x 6.9x 6.0x 10.2x 101.5%
General Motors Company $33.39 79.7% $47,707 $128,557 8.2x 8.9x 5.3x 5.4x 4.9x 82.2%
Tesla $650.57 99.6% $117,262 $127,769 30.0x 20.9x NM 42.9x 2.1x 11.5%
Hyundai ₩125,000 87.1% $26,508 $95,860 12.6x 11.9x 7.3x 6.6x 9.0x 71.2%
Honda Motor ¥2,831 86.1% $47,314 $93,094 8.4x 7.8x 7.4x 6.8x 4.0x 71.1%
Nissan Motor ¥599.50 61.8% $23,346 $83,816 12.2x 11.0x 10.5x 7.4x 8.5x 85.1%
Renault €35.25 54.9% $11,550 $56,920 9.6x 9.2x 4.8x 4.4x 7.6x 113.2%
SAIC Motor ¥22.61 74.6% $38,119 $55,985 10.4x 9.6x 8.5x 7.9x 2.0x 62.0%
BYD Co. HK$41.10 68.4% $20,497 $25,334 10.7x 9.2x 46.7x 36.4x 4.3x 48.3%
Suzuki Motor ¥5,032 86.1% $22,799 $21,914 5.7x 5.1x 14.0x 12.7x (0.6x) 15.7%
Fiat Chrysler Automobiles €11.73 79.4% $20,380 $19,018 1.4x 1.3x 4.2x 3.9x (0.1x) 87.9%
Tata Motors ₹176.60 73.8% $8,175 $17,657 3.6x 3.0x 14.8x 8.8x 1.8x 75.8%
Peugeot €18.61 68.8% $18,661 $14,076 1.5x 1.5x 4.8x 4.8x (0.8x) 80.8%
Subaru ¥2,760 86.7% $19,587 $13,976 3.8x 3.6x 9.6x 8.9x (1.5x) 8.8%
Geely Auto HK$12.54 65.5% $14,864 $13,385 6.3x 5.7x 9.8x 8.8x (0.7x) 3.8%
Dongfeng Motor Group HK$5.86 66.6% $2,155 $11,651 31.1x 31.1x 3.2x 3.1x 11.2x 70.6%
KIA ₩40,900 87.2% $13,911 $11,621 3.0x 2.8x 7.1x 6.5x (0.6x) 46.7%
Guangzhou Automobile HK$7.88 74.3% $14,332 $8,075 18.5x 16.3x 7.3x 6.6x (6.1x) 25.0%
Mazda Motor ¥934.00 68.2% $5,445 $5,760 4.1x 3.6x 12.4x 10.2x 0.0x 100.8%
Mitsubishi Motors ¥413.00 61.2% $5,679 $4,691 4.2x 3.6x 17.3x 12.2x (1.0x) 48.8%
NIO $3.78 35.5% $2,912 $4,396 NM NM NM NM NM 35.2%
FAW Car Group ¥9.68 73.6% $2,273 $2,601 NM NM NM NM 5.2x 15.3%
Mean 9.9x 8.9x 10.1x 9.9x 3.4x 60.4%
Median 9.0x 9.0x 7.4x 6.9x 3.7x 70.8%
Truck Companies
Daimler €41.81 69.7% $49,564 $200,112 12.0x 10.5x 8.0x 6.9x 9.0x 88.5%
Volvo kr165.30 97.6% $36,507 $45,155 8.5x 8.3x 13.5x 12.9x 1.9x 36.2%
PACCAR $74.21 89.0% $25,699 $20,530 8.1x 7.8x 14.0x 13.6x NM NA
MAN SE €41.80 49.8% $6,819 $9,995 NM NM NM NM NM 43.2%
Isuzu ¥1,093 66.9% $8,556 $8,854 4.2x 4.0x 8.1x 7.6x (0.1x) 32.0%
Navistar $36.62 92.7% $3,635 $7,325 10.0x 9.2x 14.1x 12.4x 5.0x 70.9%
Mean 8.6x 7.9x 11.5x 10.7x 3.9x 54.2%
Median 8.5x 8.3x 13.5x 12.4x 3.5x 43.2%
Tier 1 Suppliers
Denso ¥4,542 86.9% $33,020 $31,908 5.1x 4.7x 12.3x 10.9x (0.3x) 14.0%
Continental €102.94 65.4% $22,816 $29,438 4.5x 4.3x 9.6x 8.5x 0.9x 28.7%
Michelin €105.00 87.9% $20,785 $28,598 5.4x 5.2x 9.5x 8.9x 1.5x 32.6%
Aptiv $84.79 85.6% $21,646 $26,232 10.5x 9.6x 16.9x 14.8x 1.7x 17.9%
Bridgestone ¥3,901 82.4% $25,687 $25,875 4.8x 4.6x 11.1x 10.6x 0.3x 22.8%
Magna C$67.09 88.1% $15,506 $20,235 5.2x 5.0x 7.8x 6.9x 1.1x 26.3%
Valeo €26.92 72.7% $7,191 $11,444 4.0x 3.6x 12.1x 9.1x 1.2x 53.9%
Goodyear $13.13 61.4% $3,054 $9,843 5.2x 5.0x 5.8x 4.9x 3.5x 76.4%
Faurecia €43.17 81.4% $6,604 $9,593 3.6x 3.4x 7.6x 6.8x 1.0x 50.2%
BorgWarner $34.29 73.6% $7,078 $8,445 5.1x 4.8x 8.5x 7.8x 0.8x 25.6%
Lear $123.18 77.2% $7,449 $8,406 4.6x 4.3x 8.5x 7.5x 0.5x 27.7%
Delphi $15.34 57.2% $1,320 $2,969 5.7x 5.3x 7.7x 6.4x 2.9x 54.6%
Visteon $79.81 75.3% $2,232 $2,451 8.3x 7.0x 16.3x 11.8x 0.4x 22.6%
Automation Tooling Systems C$20.33 90.8% $1,417 $1,575 9.7x 9.2x 17.1x 15.5x 1.0x 19.1%
Stoneridge $27.86 80.8% $763 $841 8.8x 7.5x 16.4x 13.4x 0.8x 15.8%
Veoneer $13.03 41.5% $1,452 $805 NM NM NM NM NM 40.5%
Mean 6.0x 5.6x 11.1x 9.6x 1.2x 33.0%
Median 5.2x 5.0x 9.6x 8.9x 1.0x 27.0%
Mobility-as-a-Service
Uber $36.29 77.1% $61,904 $57,786 NM NM NM NM NM 13.1%
Lyft $47.48 53.6% $13,601 $11,464 NM NM NM NM NM 3.9%
Mean NM NM NM NM NM 8.5%
Median NM NM NM NM NM 8.5%
Autonomous Driving Chip Makers
Intel $63.93 92.3% $273,429 $290,012 8.5x 8.4x 12.8x 12.8x 0.5x 10.2%
NVIDIA $236.43 91.1% $144,695 $137,474 27.6x 21.3x 33.0x 27.3x (1.4x) 1.9%
Qualcomm $85.31 88.7% $97,452 $101,125 13.7x 10.9x 18.2x 13.7x 0.5x 15.8%
Advanced Micro Devices $47.00 89.0% $52,341 $50,459 31.0x 23.4x 40.6x 29.8x (0.5x) 1.4%
Mean 20.2x 16.0x 26.2x 20.9x (0.2x) 7.3%
Median 20.6x 16.1x 25.6x 20.5x (0.0x) 6.0%
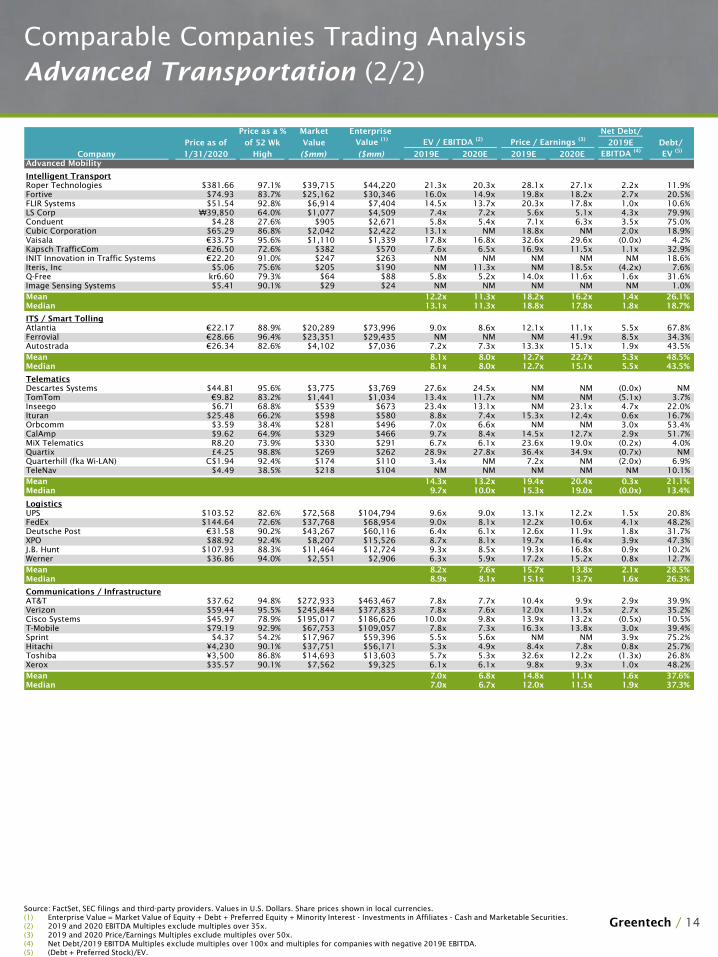
Comparable Companies Trading Analysis
Advanced Transportation (1/2)
Source: FactSet, SEC filings and third-party providers. Values in U.S. Dollars. Share prices shown in local currencies.
(1) Enterprise Value = Market Value of Equity + Debt + Preferred Equity + Minority Interest - Investments in Affiliates - Cash and Marketable Securities.
(2) 2019 and 2020 EBITDA Multiples exclude multiples over 35x.
(3) 2019 and 2020 Price/Earnings Multiples exclude multiples over 50x.
(4) Net Debt/2019 EBITDA Multiples exclude multiples over 100x and multiples for companies with negative 2019E EBITDA.
(5) (Debt + Preferred Stock)/EV.
Greentech / 14
Price as a % Market Enterprise Net Debt/
Price as of of 52 Wk Value Value (1)
EV / EBITDA (2)
Price / Earnings (3)
2019E Debt/
Company 1/31/2020 High ($mm) ($mm) 2019E 2020E 2019E 2020E EBITDA (4)
EV (5)
Advanced Mobility
Intelligent Transport
Roper Technologies $381.66 97.1% $39,715 $44,220 21.3x 20.3x 28.1x 27.1x 2.2x 11.9%
Fortive $74.93 83.7% $25,162 $30,346 16.0x 14.9x 19.8x 18.2x 2.7x 20.5%
FLIR Systems $51.54 92.8% $6,914 $7,404 14.5x 13.7x 20.3x 17.8x 1.0x 10.6%
LS Corp ₩39,850 64.0% $1,077 $4,509 7.4x 7.2x 5.6x 5.1x 4.3x 79.9%
Conduent $4.28 27.6% $905 $2,671 5.8x 5.4x 7.1x 6.3x 3.5x 75.0%
Cubic Corporation $65.29 86.8% $2,042 $2,422 13.1x NM 18.8x NM 2.0x 18.9%
Vaisala €33.75 95.6% $1,110 $1,339 17.8x 16.8x 32.6x 29.6x (0.0x) 4.2%
Kapsch TrafficCom €26.50 72.6% $382 $570 7.6x 6.5x 16.9x 11.5x 1.1x 32.9%
INIT Innovation in Traffic Systems €22.20 91.0% $247 $263 NM NM NM NM NM 18.6%
Iteris, Inc $5.06 75.6% $205 $190 NM 11.3x NM 18.5x (4.2x) 7.6%
Q-Free kr6.60 79.3% $64 $88 5.8x 5.2x 14.0x 11.6x 1.6x 31.6%
Image Sensing Systems $5.41 90.1% $29 $24 NM NM NM NM NM 1.0%
Mean 12.2x 11.3x 18.2x 16.2x 1.4x 26.1%
Median 13.1x 11.3x 18.8x 17.8x 1.8x 18.7%
ITS / Smart Tolling
Atlantia €22.17 88.9% $20,289 $73,996 9.0x 8.6x 12.1x 11.1x 5.5x 67.8%
Ferrovial €28.66 96.4% $23,351 $29,435 NM NM NM 41.9x 8.5x 34.3%
Autostrada €26.34 82.6% $4,102 $7,036 7.2x 7.3x 13.3x 15.1x 1.9x 43.5%
Mean 8.1x 8.0x 12.7x 22.7x 5.3x 48.5%
Median 8.1x 8.0x 12.7x 15.1x 5.5x 43.5%
Telematics
Descartes Systems $44.81 95.6% $3,775 $3,769 27.6x 24.5x NM NM (0.0x) NM
TomTom €9.82 83.2% $1,441 $1,034 13.4x 11.7x NM NM (5.1x) 3.7%
Inseego $6.71 68.8% $539 $673 23.4x 13.1x NM 23.1x 4.7x 22.0%
Ituran $25.48 66.2% $598 $580 8.8x 7.4x 15.3x 12.4x 0.6x 16.7%
Orbcomm $3.59 38.4% $281 $496 7.0x 6.6x NM NM 3.0x 53.4%
CalAmp $9.62 64.9% $329 $466 9.7x 8.4x 14.5x 12.7x 2.9x 51.7%
MiX Telematics R8.20 73.9% $330 $291 6.7x 6.1x 23.6x 19.0x (0.2x) 4.0%
Quartix £4.25 98.8% $269 $262 28.9x 27.8x 36.4x 34.9x (0.7x) NM
Quarterhill (fka Wi-LAN) C$1.94 92.4% $174 $110 3.4x NM 7.2x NM (2.0x) 6.9%
TeleNav $4.49 38.5% $218 $104 NM NM NM NM NM 10.1%
Mean 14.3x 13.2x 19.4x 20.4x 0.3x 21.1%
Median 9.7x 10.0x 15.3x 19.0x (0.0x) 13.4%
Logistics
UPS $103.52 82.6% $72,568 $104,794 9.6x 9.0x 13.1x 12.2x 1.5x 20.8%
FedEx $144.64 72.6% $37,768 $68,954 9.0x 8.1x 12.2x 10.6x 4.1x 48.2%
Deutsche Post €31.58 90.2% $43,267 $60,116 6.4x 6.1x 12.6x 11.9x 1.8x 31.7%
XPO $88.92 92.4% $8,207 $15,526 8.7x 8.1x 19.7x 16.4x 3.9x 47.3%
J.B. Hunt $107.93 88.3% $11,464 $12,724 9.3x 8.5x 19.3x 16.8x 0.9x 10.2%
Werner $36.86 94.0% $2,551 $2,906 6.3x 5.9x 17.2x 15.2x 0.8x 12.7%
Mean 8.2x 7.6x 15.7x 13.8x 2.1x 28.5%
Median 8.9x 8.1x 15.1x 13.7x 1.6x 26.3%
Communications / Infrastructure
AT&T $37.62 94.8% $272,933 $463,467 7.8x 7.7x 10.4x 9.9x 2.9x 39.9%
Verizon $59.44 95.5% $245,844 $377,833 7.8x 7.6x 12.0x 11.5x 2.7x 35.2%
Cisco Systems $45.97 78.9% $195,017 $186,626 10.0x 9.8x 13.9x 13.2x (0.5x) 10.5%
T-Mobile $79.19 92.9% $67,753 $109,057 7.8x 7.3x 16.3x 13.8x 3.0x 39.4%
Sprint $4.37 54.2% $17,967 $59,396 5.5x 5.6x NM NM 3.9x 75.2%
Hitachi ¥4,230 90.1% $37,751 $56,171 5.3x 4.9x 8.4x 7.8x 0.8x 25.7%
Toshiba ¥3,500 86.8% $14,693 $13,603 5.7x 5.3x 32.6x 12.2x (1.3x) 26.8%
Xerox $35.57 90.1% $7,562 $9,325 6.1x 6.1x 9.8x 9.3x 1.0x 48.2%
Mean 7.0x 6.8x 14.8x 11.1x 1.6x 37.6%
Median 7.0x 6.7x 12.0x 11.5x 1.9x 37.3%
Comparable Companies Trading Analysis
Advanced Transportation (2/2)
Source: FactSet, SEC filings and third-party providers. Values in U.S. Dollars. Share prices shown in local currencies.
(1) Enterprise Value = Market Value of Equity + Debt + Preferred Equity + Minority Interest - Investments in Affiliates - Cash and Marketable Securities.
(2) 2019 and 2020 EBITDA Multiples exclude multiples over 35x.
(3) 2019 and 2020 Price/Earnings Multiples exclude multiples over 50x.
(4) Net Debt/2019 EBITDA Multiples exclude multiples over 100x and multiples for companies with negative 2019E EBITDA.
(5) (Debt + Preferred Stock)/EV.
Greentech / 15
Price as a % Market Enterprise Net Debt/
Price as of of 52 Wk Value Value (1)
EV / EBITDA (2)
Price / Earnings (3)
2019E Debt/
Company 1/31/2020 High ($mm) ($mm) 2019E 2020E 2019E 2020E EBITDA (4)
EV (5)
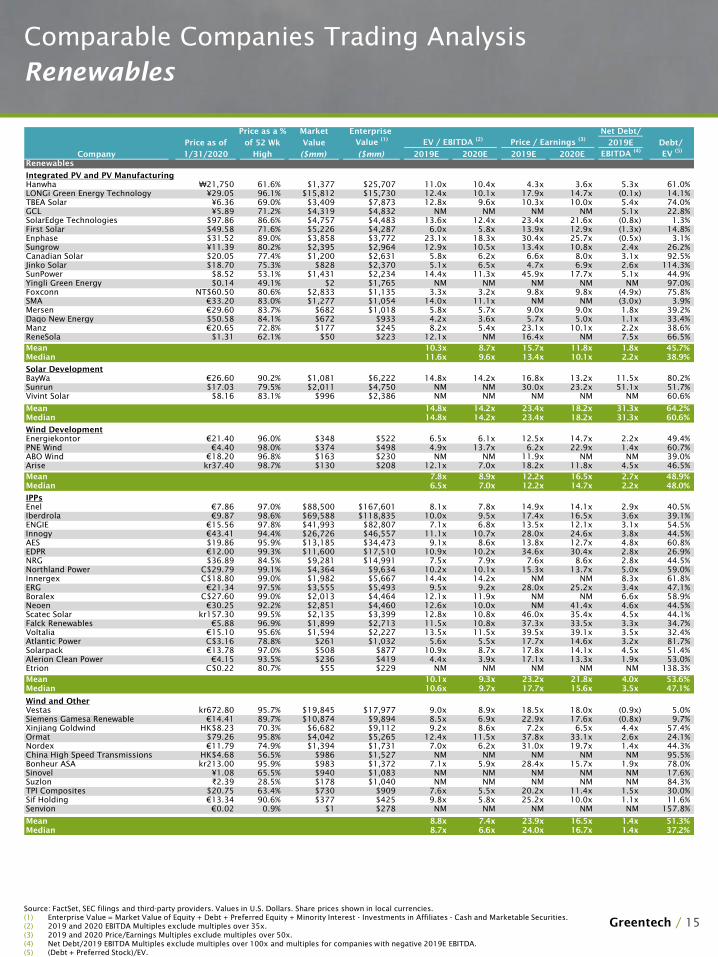
Renewables
Integrated PV and PV Manufacturing
Hanwha ₩21,750 61.6% $1,377 $25,707 11.0x 10.4x 4.3x 3.6x 5.3x 61.0%
LONGi Green Energy Technology ¥29.05 96.1% $15,812 $15,730 12.4x 10.1x 17.9x 14.7x (0.1x) 14.1%
TBEA Solar ¥6.36 69.0% $3,409 $7,873 12.8x 9.6x 10.3x 10.0x 5.4x 74.0%
GCL ¥5.89 71.2% $4,319 $4,832 NM NM NM NM 5.1x 22.8%
SolarEdge Technologies $97.86 86.6% $4,757 $4,483 13.6x 12.4x 23.4x 21.6x (0.8x) 1.3%
First Solar $49.58 71.6% $5,226 $4,287 6.0x 5.8x 13.9x 12.9x (1.3x) 14.8%
Enphase $31.52 89.0% $3,858 $3,772 23.1x 18.3x 30.4x 25.7x (0.5x) 3.1%
Sungrow ¥11.39 80.2% $2,395 $2,964 12.9x 10.5x 13.4x 10.8x 2.4x 26.2%
Canadian Solar $20.05 77.4% $1,200 $2,631 5.8x 6.2x 6.6x 8.0x 3.1x 92.5%
Jinko Solar $18.70 75.3% $828 $2,370 5.1x 6.5x 4.7x 6.9x 2.6x 114.3%
SunPower $8.52 53.1% $1,431 $2,234 14.4x 11.3x 45.9x 17.7x 5.1x 44.9%
Yingli Green Energy $0.14 49.1% $2 $1,765 NM NM NM NM NM 97.0%
Foxconn NT$60.50 80.6% $2,833 $1,135 3.3x 3.2x 9.8x 9.8x (4.9x) 75.8%
SMA €33.20 83.0% $1,277 $1,054 14.0x 11.1x NM NM (3.0x) 3.9%
Mersen €29.60 83.7% $682 $1,018 5.8x 5.7x 9.0x 9.0x 1.8x 39.2%
Daqo New Energy $50.58 84.1% $672 $933 4.2x 3.6x 5.7x 5.0x 1.1x 33.4%
Manz €20.65 72.8% $177 $245 8.2x 5.4x 23.1x 10.1x 2.2x 38.6%
ReneSola $1.31 62.1% $50 $223 12.1x NM 16.4x NM 7.5x 66.5%
Mean 10.3x 8.7x 15.7x 11.8x 1.8x 45.7%
Median 11.6x 9.6x 13.4x 10.1x 2.2x 38.9%
Solar Development
BayWa €26.60 90.2% $1,081 $6,222 14.8x 14.2x 16.8x 13.2x 11.5x 80.2%
Sunrun $17.03 79.5% $2,011 $4,750 NM NM 30.0x 23.2x 51.1x 51.7%
Vivint Solar $8.16 83.1% $996 $2,386 NM NM NM NM NM 60.6%
Mean 14.8x 14.2x 23.4x 18.2x 31.3x 64.2%
Median 14.8x 14.2x 23.4x 18.2x 31.3x 60.6%
Wind Development
Energiekontor €21.40 96.0% $348 $522 6.5x 6.1x 12.5x 14.7x 2.2x 49.4%
PNE Wind €4.40 98.0% $374 $498 4.9x 13.7x 6.2x 22.9x 1.4x 60.7%
ABO Wind €18.20 96.8% $163 $230 NM NM 11.9x NM NM 39.0%
Arise kr37.40 98.7% $130 $208 12.1x 7.0x 18.2x 11.8x 4.5x 46.5%
Mean 7.8x 8.9x 12.2x 16.5x 2.7x 48.9%
Median 6.5x 7.0x 12.2x 14.7x 2.2x 48.0%
IPPs
Enel €7.86 97.0% $88,500 $167,601 8.1x 7.8x 14.9x 14.1x 2.9x 40.5%
Iberdrola €9.87 98.6% $69,588 $118,835 10.0x 9.5x 17.4x 16.5x 3.6x 39.1%
ENGIE €15.56 97.8% $41,993 $82,807 7.1x 6.8x 13.5x 12.1x 3.1x 54.5%
Innogy €43.41 94.4% $26,726 $46,557 11.1x 10.7x 28.0x 24.6x 3.8x 44.5%
AES $19.86 95.9% $13,185 $34,473 9.1x 8.6x 13.8x 12.7x 4.8x 60.8%
EDPR €12.00 99.3% $11,600 $17,510 10.9x 10.2x 34.6x 30.4x 2.8x 26.9%
NRG $36.89 84.5% $9,281 $14,991 7.5x 7.9x 7.6x 8.6x 2.8x 44.5%
Northland Power C$29.79 99.1% $4,364 $9,634 10.2x 10.1x 15.3x 13.7x 5.0x 59.0%
Innergex C$18.80 99.0% $1,982 $5,667 14.4x 14.2x NM NM 8.3x 61.8%
ERG €21.34 97.5% $3,555 $5,493 9.5x 9.2x 28.0x 25.2x 3.4x 47.1%
Boralex C$27.60 99.0% $2,013 $4,464 12.1x 11.9x NM NM 6.6x 58.9%
Neoen €30.25 92.2% $2,851 $4,460 12.6x 10.0x NM 41.4x 4.6x 44.5%
Scatec Solar kr157.30 99.5% $2,135 $3,399 12.8x 10.8x 46.0x 35.4x 4.5x 44.1%
Falck Renewables €5.88 96.9% $1,899 $2,713 11.5x 10.8x 37.3x 33.5x 3.3x 34.7%
Voltalia €15.10 95.6% $1,594 $2,227 13.5x 11.5x 39.5x 39.1x 3.5x 32.4%
Atlantic Power C$3.16 78.8% $261 $1,032 5.6x 5.5x 17.7x 14.6x 3.2x 81.7%
Solarpack €13.78 97.0% $508 $877 10.9x 8.7x 17.8x 14.1x 4.5x 51.4%
Alerion Clean Power €4.15 93.5% $236 $419 4.4x 3.9x 17.1x 13.3x 1.9x 53.0%
Etrion C$0.22 80.7% $55 $229 NM NM NM NM NM 138.3%
Mean 10.1x 9.3x 23.2x 21.8x 4.0x 53.6%
Median 10.6x 9.7x 17.7x 15.6x 3.5x 47.1%
Wind and Other
Vestas kr672.80 95.7% $19,845 $17,977 9.0x 8.9x 18.5x 18.0x (0.9x) 5.0%
Siemens Gamesa Renewable €14.41 89.7% $10,874 $9,894 8.5x 6.9x 22.9x 17.6x (0.8x) 9.7%
Xinjiang Goldwind HK$8.23 70.3% $6,682 $9,112 9.2x 8.6x 7.2x 6.5x 4.4x 57.4%
Ormat $79.26 95.8% $4,042 $5,265 12.4x 11.5x 37.8x 33.1x 2.6x 24.1%
Nordex €11.79 74.9% $1,394 $1,731 7.0x 6.2x 31.0x 19.7x 1.4x 44.3%
China High Speed Transmissions HK$4.68 56.5% $986 $1,527 NM NM NM NM NM 95.5%
Bonheur ASA kr213.00 95.9% $983 $1,372 7.1x 5.9x 28.4x 15.7x 1.9x 78.0%
Sinovel ¥1.08 65.5% $940 $1,083 NM NM NM NM NM 17.6%
Suzlon ₹2.39 28.5% $178 $1,040 NM NM NM NM NM 84.3%
TPI Composites $20.75 63.4% $730 $909 7.6x 5.5x 20.2x 11.4x 1.5x 30.0%
Sif Holding €13.34 90.6% $377 $425 9.8x 5.8x 25.2x 10.0x 1.1x 11.6%
Senvion €0.02 0.9% $1 $278 NM NM NM NM NM 157.8%
Mean 8.8x 7.4x 23.9x 16.5x 1.4x 51.3%
Median 8.7x 6.6x 24.0x 16.7x 1.4x 37.2%
Comparable Companies Trading Analysis
Renewables
Source: FactSet, SEC filings and third-party providers. Values in U.S. Dollars. Share prices shown in local currencies.
(1) Enterprise Value = Market Value of Equity + Debt + Preferred Equity + Minority Interest - Investments in Affiliates - Cash and Marketable Securities.
(2) 2019 and 2020 EBITDA Multiples exclude multiples over 35x.
(3) 2019 and 2020 Price/Earnings Multiples exclude multiples over 50x.
(4) Net Debt/2019 EBITDA Multiples exclude multiples over 100x and multiples for companies with negative 2019E EBITDA.
(5) (Debt + Preferred Stock)/EV.
Greentech / 16
Price as a % Market Enterprise Net Debt/
Price as of of 52 Wk Value Value (1)
EV / EBITDA (2)
Price / Earnings (3)
2019E Debt/
Company 1/31/2020 High ($mm) ($mm) 2019E 2020E 2019E 2020E EBITDA (4)
EV (5)
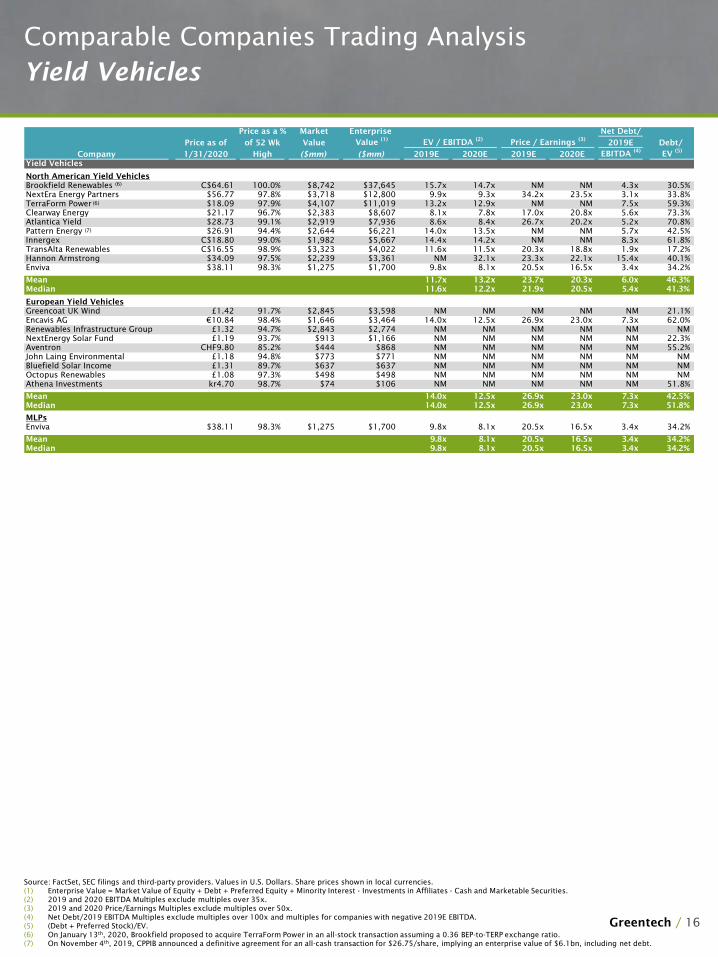
Yield Vehicles
North American Yield Vehicles
Brookfield Renewables C$64.61 100.0% $8,742 $37,645 15.7x 14.7x NM NM 4.3x 30.5%
NextEra Energy Partners $56.77 97.8% $3,718 $12,800 9.9x 9.3x 34.2x 23.5x 3.1x 33.8%
TerraForm Power $18.09 97.9% $4,107 $11,019 13.2x 12.9x NM NM 7.5x 59.3%
Clearway Energy $21.17 96.7% $2,383 $8,607 8.1x 7.8x 17.0x 20.8x 5.6x 73.3%
Atlantica Yield $28.73 99.1% $2,919 $7,936 8.6x 8.4x 26.7x 20.2x 5.2x 70.8%
Pattern Energy $26.91 94.4% $2,644 $6,221 14.0x 13.5x NM NM 5.7x 42.5%
Innergex C$18.80 99.0% $1,982 $5,667 14.4x 14.2x NM NM 8.3x 61.8%
TransAlta Renewables C$16.55 98.9% $3,323 $4,022 11.6x 11.5x 20.3x 18.8x 1.9x 17.2%
Hannon Armstrong $34.09 97.5% $2,239 $3,361 NM 32.1x 23.3x 22.1x 15.4x 40.1%
Enviva $38.11 98.3% $1,275 $1,700 9.8x 8.1x 20.5x 16.5x 3.4x 34.2%
Mean 11.7x 13.2x 23.7x 20.3x 6.0x 46.3%
Median 11.6x 12.2x 21.9x 20.5x 5.4x 41.3%
European Yield Vehicles
Greencoat UK Wind £1.42 91.7% $2,845 $3,598 NM NM NM NM NM 21.1%
Encavis AG €10.84 98.4% $1,646 $3,464 14.0x 12.5x 26.9x 23.0x 7.3x 62.0%
Renewables Infrastructure Group £1.32 94.7% $2,843 $2,774 NM NM NM NM NM NM
NextEnergy Solar Fund £1.19 93.7% $913 $1,166 NM NM NM NM NM 22.3%
Aventron CHF9.80 85.2% $444 $868 NM NM NM NM NM 55.2%
John Laing Environmental £1.18 94.8% $773 $771 NM NM NM NM NM NM
Bluefield Solar Income £1.31 89.7% $637 $637 NM NM NM NM NM NM
Octopus Renewables £1.08 97.3% $498 $498 NM NM NM NM NM NM
Athena Investments kr4.70 98.7% $74 $106 NM NM NM NM NM 51.8%
Mean 14.0x 12.5x 26.9x 23.0x 7.3x 42.5%
Median 14.0x 12.5x 26.9x 23.0x 7.3x 51.8%
MLPs
Enviva $38.11 98.3% $1,275 $1,700 9.8x 8.1x 20.5x 16.5x 3.4x 34.2%
Mean 9.8x 8.1x 20.5x 16.5x 3.4x 34.2%
Median 9.8x 8.1x 20.5x 16.5x 3.4x 34.2%
Comparable Companies Trading Analysis
Yield Vehicles
Source: FactSet, SEC filings and third-party providers. Values in U.S. Dollars. Share prices shown in local currencies.
(1) Enterprise Value = Market Value of Equity + Debt + Preferred Equity + Minority Interest - Investments in Affiliates - Cash and Marketable Securities.
(2) 2019 and 2020 EBITDA Multiples exclude multiples over 35x.
(3) 2019 and 2020 Price/Earnings Multiples exclude multiples over 50x.
(4) Net Debt/2019 EBITDA Multiples exclude multiples over 100x and multiples for companies with negative 2019E EBITDA.
(5) (Debt + Preferred Stock)/EV.
(6) On January 13th
, 2020, Brookfield proposed to acquire TerraForm Power in an all-stock transaction assuming a 0.36 BEP-to-TERP exchange ratio.
(7) On November 4th
, 2019, CPPIB announced a definitive agreement for an all-cash transaction for $26.75/share, implying an enterprise value of $6.1bn, including net debt.
(6)
(6)
(7)
Greentech / 17
Price as a % Market Enterprise Net Debt/
Price as of of 52 Wk Value Value (1)
EV / EBITDA (2)
Price / Earnings (3)
2019E Debt/
Company 1/31/2020 High ($mm) ($mm) 2019E 2020E 2019E 2020E EBITDA (4)
EV (5)
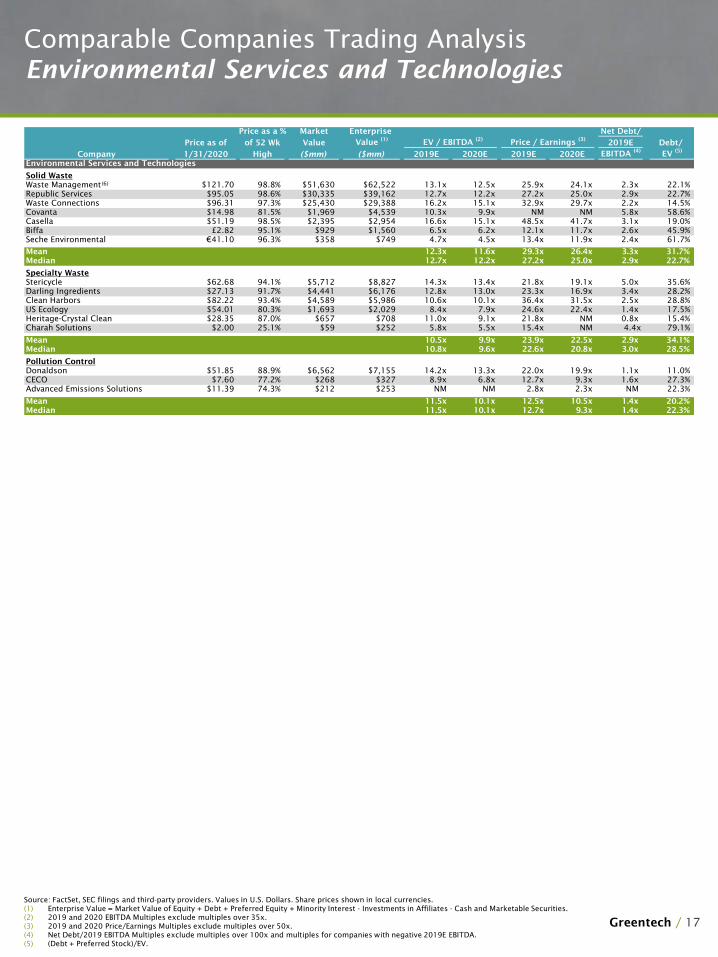
Environmental Services and Technologies
Solid Waste
Waste Management $121.70 98.8% $51,630 $62,522 13.1x 12.5x 25.9x 24.1x 2.3x 22.1%
Republic Services $95.05 98.6% $30,335 $39,162 12.7x 12.2x 27.2x 25.0x 2.9x 22.7%
Waste Connections $96.31 97.3% $25,430 $29,388 16.2x 15.1x 32.9x 29.7x 2.2x 14.5%
Covanta $14.98 81.5% $1,969 $4,539 10.3x 9.9x NM NM 5.8x 58.6%
Casella $51.19 98.5% $2,395 $2,954 16.6x 15.1x 48.5x 41.7x 3.1x 19.0%
Biffa £2.82 95.1% $929 $1,560 6.5x 6.2x 12.1x 11.7x 2.6x 45.9%
Seche Environmental €41.10 96.3% $358 $749 4.7x 4.5x 13.4x 11.9x 2.4x 61.7%
Mean 12.3x 11.6x 29.3x 26.4x 3.3x 31.7%
Median 12.7x 12.2x 27.2x 25.0x 2.9x 22.7%
Specialty Waste
Stericycle $62.68 94.1% $5,712 $8,827 14.3x 13.4x 21.8x 19.1x 5.0x 35.6%
Darling Ingredients $27.13 91.7% $4,441 $6,176 12.8x 13.0x 23.3x 16.9x 3.4x 28.2%
Clean Harbors $82.22 93.4% $4,589 $5,986 10.6x 10.1x 36.4x 31.5x 2.5x 28.8%
US Ecology $54.01 80.3% $1,693 $2,029 8.4x 7.9x 24.6x 22.4x 1.4x 17.5%
Heritage-Crystal Clean $28.35 87.0% $657 $708 11.0x 9.1x 21.8x NM 0.8x 15.4%
Charah Solutions $2.00 25.1% $59 $252 5.8x 5.5x 15.4x NM 4.4x 79.1%
Mean 10.5x 9.9x 23.9x 22.5x 2.9x 34.1%
Median 10.8x 9.6x 22.6x 20.8x 3.0x 28.5%
Pollution Control
Donaldson $51.85 88.9% $6,562 $7,155 14.2x 13.3x 22.0x 19.9x 1.1x 11.0%
CECO $7.60 77.2% $268 $327 8.9x 6.8x 12.7x 9.3x 1.6x 27.3%
Advanced Emissions Solutions $11.39 74.3% $212 $253 NM NM 2.8x 2.3x NM 22.3%
Mean 11.5x 10.1x 12.5x 10.5x 1.4x 20.2%
Median 11.5x 10.1x 12.7x 9.3x 1.4x 22.3%
Comparable Companies Trading Analysis
Environmental Services and Technologies
Source: FactSet, SEC filings and third-party providers. Values in U.S. Dollars. Share prices shown in local currencies.
(1) Enterprise Value = Market Value of Equity + Debt + Preferred Equity + Minority Interest - Investments in Affiliates - Cash and Marketable Securities.
(2) 2019 and 2020 EBITDA Multiples exclude multiples over 35x.
(3) 2019 and 2020 Price/Earnings Multiples exclude multiples over 50x.
(4) Net Debt/2019 EBITDA Multiples exclude multiples over 100x and multiples for companies with negative 2019E EBITDA.
(5) (Debt + Preferred Stock)/EV.
(6)
Greentech / 18
Price as a % Market Enterprise Net Debt/
Price as of of 52 Wk Value Value (1)
EV / EBITDA (2)
Price / Earnings (3)
2019E Debt/
Company 1/31/2020 High ($mm) ($mm) 2019E 2020E 2019E 2020E EBITDA (4)
EV (5)
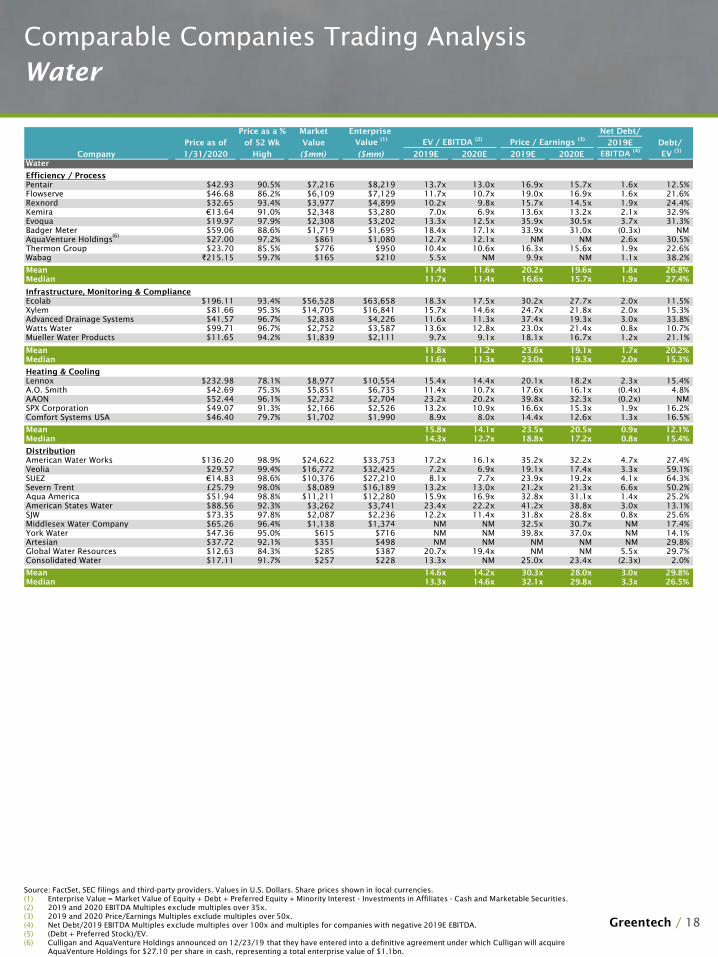
Water
Efficiency / Process
Pentair $42.93 90.5% $7,216 $8,219 13.7x 13.0x 16.9x 15.7x 1.6x 12.5%
Flowserve $46.68 86.2% $6,109 $7,129 11.7x 10.7x 19.0x 16.9x 1.6x 21.6%
Rexnord $32.65 93.4% $3,977 $4,899 10.2x 9.8x 15.7x 14.5x 1.9x 24.4%
Kemira €13.64 91.0% $2,348 $3,280 7.0x 6.9x 13.6x 13.2x 2.1x 32.9%
Evoqua $19.97 97.9% $2,308 $3,202 13.3x 12.5x 35.9x 30.5x 3.7x 31.3%
Badger Meter $59.06 88.6% $1,719 $1,695 18.4x 17.1x 33.9x 31.0x (0.3x) NM
AquaVenture Holdings $27.00 97.2% $861 $1,080 12.7x 12.1x NM NM 2.6x 30.5%
Thermon Group $23.70 85.5% $776 $950 10.4x 10.6x 16.3x 15.6x 1.9x 22.6%
Wabag ₹215.15 59.7% $165 $210 5.5x NM 9.9x NM 1.1x 38.2%
Mean 11.4x 11.6x 20.2x 19.6x 1.8x 26.8%
Median 11.7x 11.4x 16.6x 15.7x 1.9x 27.4%
Infrastructure, Monitoring & Compliance
Ecolab $196.11 93.4% $56,528 $63,658 18.3x 17.5x 30.2x 27.7x 2.0x 11.5%
Xylem $81.66 95.3% $14,705 $16,841 15.7x 14.6x 24.7x 21.8x 2.0x 15.3%
Advanced Drainage Systems $41.57 96.7% $2,838 $4,226 11.6x 11.3x 37.4x 19.3x 3.0x 33.8%
Watts Water $99.71 96.7% $2,752 $3,587 13.6x 12.8x 23.0x 21.4x 0.8x 10.7%
Mueller Water Products $11.65 94.2% $1,839 $2,111 9.7x 9.1x 18.1x 16.7x 1.2x 21.1%
Mean 11.8x 11.2x 23.6x 19.1x 1.7x 20.2%
Median 11.6x 11.3x 23.0x 19.3x 2.0x 15.3%
Heating & Cooling
Lennox $232.98 78.1% $8,977 $10,554 15.4x 14.4x 20.1x 18.2x 2.3x 15.4%
A.O. Smith $42.69 75.3% $5,851 $6,735 11.4x 10.7x 17.6x 16.1x (0.4x) 4.8%
AAON $52.44 96.1% $2,732 $2,704 23.2x 20.2x 39.8x 32.3x (0.2x) NM
SPX Corporation $49.07 91.3% $2,166 $2,526 13.2x 10.9x 16.6x 15.3x 1.9x 16.2%
Comfort Systems USA $46.40 79.7% $1,702 $1,990 8.9x 8.0x 14.4x 12.6x 1.3x 16.5%
Mean 15.8x 14.1x 23.5x 20.5x 0.9x 12.1%
Median 14.3x 12.7x 18.8x 17.2x 0.8x 15.4%
Distribution
American Water Works $136.20 98.9% $24,622 $33,753 17.2x 16.1x 35.2x 32.2x 4.7x 27.4%
Veolia $29.57 99.4% $16,772 $32,425 7.2x 6.9x 19.1x 17.4x 3.3x 59.1%
SUEZ €14.83 98.6% $10,376 $27,210 8.1x 7.7x 23.9x 19.2x 4.1x 64.3%
Severn Trent £25.79 98.0% $8,089 $16,189 13.2x 13.0x 21.2x 21.3x 6.6x 50.2%
Aqua America $51.94 98.8% $11,211 $12,280 15.9x 16.9x 32.8x 31.1x 1.4x 25.2%
American States Water $88.56 92.3% $3,262 $3,741 23.4x 22.2x 41.2x 38.8x 3.0x 13.1%
SJW $73.35 97.8% $2,087 $2,236 12.2x 11.4x 31.8x 28.8x 0.8x 25.6%
Middlesex Water Company $65.26 96.4% $1,138 $1,374 NM NM 32.5x 30.7x NM 17.4%
York Water $47.36 95.0% $615 $716 NM NM 39.8x 37.0x NM 14.1%
Artesian $37.72 92.1% $351 $498 NM NM NM NM NM 29.8%
Global Water Resources $12.63 84.3% $285 $387 20.7x 19.4x NM NM 5.5x 29.7%
Consolidated Water $17.11 91.7% $257 $228 13.3x NM 25.0x 23.4x (2.3x) 2.0%
Mean 14.6x 14.2x 30.3x 28.0x 3.0x 29.8%
Median 13.3x 14.6x 32.1x 29.8x 3.3x 26.5%
Comparable Companies Trading Analysis
Water
Source: FactSet, SEC filings and third-party providers. Values in U.S. Dollars. Share prices shown in local currencies.
(1) Enterprise Value = Market Value of Equity + Debt + Preferred Equity + Minority Interest - Investments in Affiliates - Cash and Marketable Securities.
(2) 2019 and 2020 EBITDA Multiples exclude multiples over 35x.
(3) 2019 and 2020 Price/Earnings Multiples exclude multiples over 50x.
(4) Net Debt/2019 EBITDA Multiples exclude multiples over 100x and multiples for companies with negative 2019E EBITDA.
(5) (Debt + Preferred Stock)/EV.
(6) Culligan and AquaVenture Holdings announced on 12/23/19 that they have entered into a definitive agreement under which Culligan will acquire
AquaVenture Holdings for $27.10 per share in cash, representing a total enterprise value of $1.1bn.
(6)

Greentech / 19
Price as a % Market Enterprise Net Debt/
Price as of of 52 Wk Value Value (1)
EV / EBITDA (2)
Price / Earnings (3)
2019E Debt/
Company 1/31/2020 High ($mm) ($mm) 2019E 2020E 2019E 2020E EBITDA (4)
EV (5)
AgTech
Large Crop / Life Science
Bayer €73.05 94.9% $79,531 $123,368 8.8x 8.1x 10.0x 8.9x 3.1x 39.3%
BASF €61.07 81.9% $62,161 $82,874 8.4x 7.7x 14.4x 12.8x 2.0x 26.8%
DuPont de Nemours $51.18 61.1% $37,915 $54,276 9.6x 9.1x 13.0x 11.7x 2.8x 32.1%
Archer-Daniels-Midland $44.76 94.8% $24,917 $33,004 9.3x 8.9x 13.6x 12.4x 2.3x 27.1%
Bunge Limited $52.43 87.9% $7,423 $15,145 10.1x 9.7x 14.6x 12.5x 4.3x 52.0%
Mosaic $19.84 58.5% $7,540 $11,981 7.5x 6.3x 20.9x 12.5x 2.7x 40.7%
Mean 9.0x 8.3x 14.4x 11.8x 2.9x 36.7%
Median 9.1x 8.5x 14.0x 12.4x 2.7x 38.8%
Irrigation / Equipment
Deere $158.58 87.9% $49,922 $90,836 20.3x 16.8x 16.4x 13.9x 9.1x 49.9%
CNH Industrial $9.42 78.6% $12,730 $32,505 9.7x 9.1x 10.5x 9.3x 5.9x 73.5%
Kubota ¥1,741 95.6% $19,601 $24,434 9.8x 9.2x 13.9x 13.0x 1.6x 32.8%
Mahindra & Mahindra ₹567.35 79.3% $9,884 $17,275 18.6x 16.8x 15.9x 14.6x 7.9x 52.1%
Toro $80.02 95.0% $8,530 $9,090 15.4x 14.5x 23.4x 21.3x 0.9x 7.7%
AGCO $70.14 86.2% $5,297 $7,067 7.8x 7.3x 13.3x 11.8x 1.9x 28.2%
Valmont $142.06 92.4% $3,058 $3,653 9.7x 8.6x 16.2x 13.9x 1.5x 24.0%
Lindsay $100.03 89.5% $1,082 $1,106 16.9x 14.7x 34.6x 27.6x 0.4x 13.2%
Raven Industries $31.36 75.8% $1,121 $1,048 16.3x 13.3x 41.8x 32.7x (1.1x) NM
Jain ₹7.16 11.1% $52 $903 NM NM NM NM NM 94.6%
Mean 13.8x 12.3x 20.7x 17.6x 3.1x 41.8%
Median 15.4x 13.3x 16.2x 13.9x 1.6x 32.8%5
Industrial Biotechnology
Neste €35.88 97.5% $30,586 $30,912 12.5x 11.4x 18.9x 17.0x 0.2x 4.4%
Cosan R$79.70 97.5% $7,352 $9,260 6.1x 5.7x 15.7x 14.4x 1.3x 32.5%
Renewable Energy Group $26.28 88.8% $1,024 $1,219 9.5x 8.3x 5.7x 5.2x 1.5x 21.5%
Green Plains Renewable Energy $12.47 70.3% $448 $897 11.7x 7.5x NM 28.3x 4.4x 65.7%
MGP Ingredients $34.06 34.1% $580 $623 9.7x 9.2x 14.6x 13.4x 0.7x 7.6%
Amyris $2.56 42.2% $270 $502 NM 7.3x NM NM 57.5x 46.4%
REX American Resources $75.35 76.3% $474 $347 NM NM 29.1x NM NM 4.9%
Pacific Ethanol $0.65 45.1% $36 $323 7.8x NM NM NM 6.6x 89.7%
FutureFuel $10.96 56.8% $479 $170 NM NM NM NM NM NM
Mean 9.9x 8.2x 16.8x 15.7x 10.9x 26.1%
Median 9.7x 7.9x 15.7x 14.4x 1.4x 21.5%
Building Materials
Multi-Industry
CRH $37.59 92.0% $29,658 $42,002 8.8x 8.3x 14.3x 12.9x 2.4x 31.7%
Saint-Gobain €34.24 86.5% $20,665 $34,821 6.0x 5.8x 9.6x 8.9x 2.4x 52.1%
Masco $47.52 95.2% $13,500 $16,170 12.5x 12.1x 18.2x 16.4x 1.9x 18.4%
Owens Corning $60.49 88.0% $6,581 $9,972 7.3x 6.9x 11.5x 10.3x 2.5x 34.0%
Armstrong World Industries $100.33 94.2% $4,866 $5,454 12.8x 12.1x 19.9x 17.9x 1.4x 12.6%
Beacon Roofing Supply $33.11 82.8% $2,276 $5,202 10.1x 9.6x 12.5x 11.0x 4.9x 57.6%
Simpson Manufacturing $82.67 94.3% $3,665 $3,507 13.8x 12.6x 23.7x 20.9x (0.6x) 1.0%
Griffon Corporation $20.79 81.5% $975 $2,216 10.3x NM 15.0x NM 5.7x 58.9%
Gibraltar $54.52 96.4% $1,759 $1,651 11.3x 10.0x 19.3x 17.6x (0.7x) 1.7%
Mean 10.3x 9.7x 16.0x 14.5x 2.2x 29.8%
Median 10.3x 9.8x 15.0x 14.6x 2.4x 31.7%
Sustainable Products/Materials
Kingspan €55.65 95.8% $11,163 $12,194 17.1x 16.3x 25.0x 23.6x 1.4x 9.5%
Trex $98.24 97.0% $5,731 $5,640 23.0x 20.0x 33.5x 29.1x (0.4x) NM
Cabot Corporation $39.85 78.8% $2,259 $3,290 6.2x 5.7x 10.1x 8.7x 1.7x 32.3%
Quanex $17.72 86.8% $586 $713 6.8x NM 16.1x NM 1.2x 22.1%
Aspen Aerogels $8.27 77.2% $201 $206 20.9x 10.3x NM 45.1x 0.5x 4.2%
DIRTT Environmental Solutions C$3.43 36.9% $220 $185 6.2x 6.4x 22.9x 32.5x (1.2x) 12.0%
Mean 13.4x 11.7x 21.5x 27.8x 0.5x 16.0%
Median 11.9x 10.3x 22.9x 29.1x 0.9x 12.0%
Comparable Companies Trading Analysis
AgTech, Industrial Biotechnology and
Building Materials
Source: FactSet, SEC filings and third-party providers. Values in U.S. Dollars. Share prices shown in local currencies.
(1) Enterprise Value = Market Value of Equity + Debt + Preferred Equity + Minority Interest - Investments in Affiliates - Cash and Marketable Securities.
(2) 2019 and 2020 EBITDA Multiples exclude multiples over 35x.
(3) 2019 and 2020 Price/Earnings Multiples exclude multiples over 50x.
(4) Net Debt/2019 EBITDA Multiples exclude multiples over 100x and multiples for companies with negative 2019E EBITDA.
(5) (Debt + Preferred Stock)/EV.
Greentech / 20
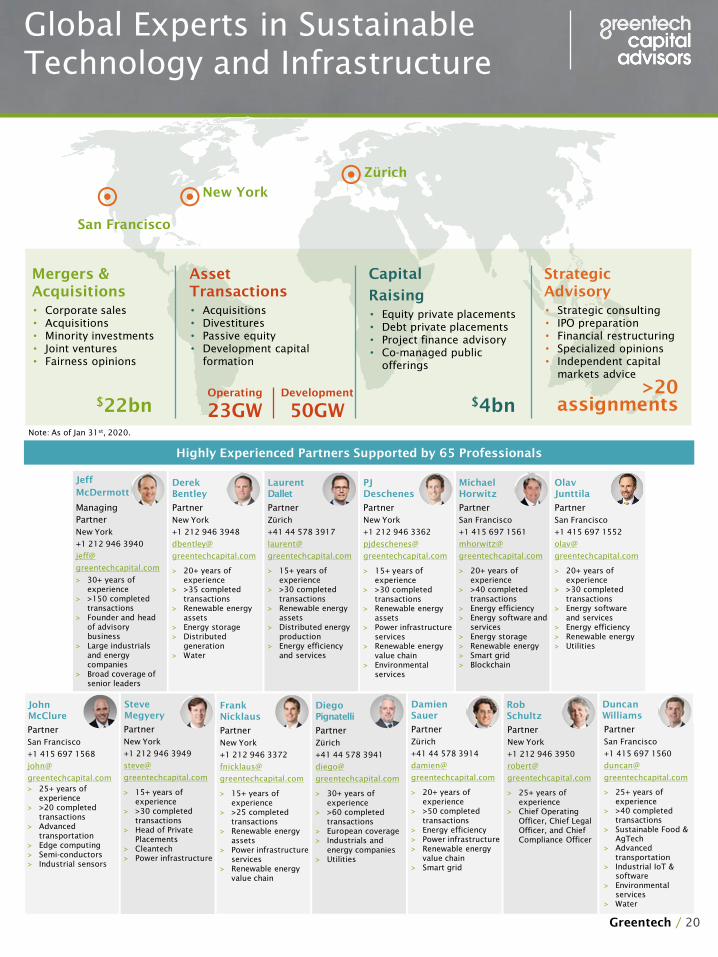
San Francisco
New York
Zürich
Highly Experienced Partners Supported by 65 Professionals
Global Experts in Sustainable
Technology and Infrastructure
Diego
Pignatelli
Partner
Zürich
+41 44 578 3941
diego@
greentechcapital.com
> 30+ years of
experience
> >60 completed
transactions
> European coverage
> Industrials and
energy companies
> Utilities
Laurent
Dallet
Partner
Zürich
+41 44 578 3917
laurent@
greentechcapital.com
> 15+ years of
experience
> >30 completed
transactions
> Renewable energy
assets
> Distributed energy
production
> Energy efficiency
and services
Jeff
McDermott
Managing
Partner
New York
+1 212 946 3940
jeff@
greentechcapital.com
> 30+ years of
experience
> >150 completed
transactions
> Founder and head
of advisory
business
> Large industrials
and energy
companies
> Broad coverage of
senior leaders
Derek
Bentley
Partner
New York
+1 212 946 3948
dbentley@
greentechcapital.com
> 20+ years of
experience
> >35 completed
transactions
> Renewable energy
assets
> Energy storage
> Distributed
generation
> Water
PJ
Deschenes
Partner
New York
+1 212 946 3362
pjdeschenes@
greentechcapital.com
> 15+ years of
experience
> >30 completed
transactions
> Renewable energy
assets
> Power infrastructure
services
> Renewable energy
value chain
> Environmental
services
Duncan
Williams
Partner
San Francisco
+1 415 697 1560
duncan@
greentechcapital.com
> 25+ years of
experience
> >40 completed
transactions
> Sustainable Food &
AgTech
> Advanced
transportation
> Industrial IoT &
software
> Environmental
services
> Water
Michael
Horwitz
Partner
San Francisco
+1 415 697 1561
mhorwitz@
greentechcapital.com
> 20+ years of
experience
> >40 completed
transactions
> Energy efficiency
> Energy software and
services
> Energy storage
> Renewable energy
> Smart grid
> Blockchain
Damien
Sauer
Partner
Zürich
+41 44 578 3914
damien@
greentechcapital.com
> 20+ years of
experience
> >50 completed
transactions
> Energy efficiency
> Power infrastructure
> Renewable energy
value chain
> Smart grid
Rob
Schultz
Partner
New York
+1 212 946 3950
robert@
greentechcapital.com
> 25+ years of
experience
> Chief Operating
Officer, Chief Legal
Officer, and Chief
Compliance Officer
Olav
Junttila
Partner
San Francisco
+1 415 697 1552
olav@
greentechcapital.com
> 20+ years of
experience
> >30 completed
transactions
> Energy software
and services
> Energy efficiency
> Renewable energy
> Utilities
Frank
Nicklaus
Partner
New York
+1 212 946 3372
fnicklaus@
greentechcapital.com
> 15+ years of
experience
> >25 completed
transactions
> Renewable energy
assets
> Power infrastructure
services
> Renewable energy
value chain
Steve
Megyery
Partner
New York
+1 212 946 3949
steve@
greentechcapital.com
> 15+ years of
experience
> >30 completed
transactions
> Head of Private
Placements
> Cleantech
> Power infrastructure
John
McClure
Partner
San Francisco
+1 415 697 1568
john@
greentechcapital.com
> 25+ years of
experience
> >20 completed
transactions
> Advanced
transportation
> Edge computing
> Semi-conductors
> Industrial sensors
Capital
Raising
• Equity private placements
• Debt private placements
• Project finance advisory
• Co-managed public
offerings
Mergers &
Acquisitions
• Corporate sales
• Acquisitions
• Minority investments
• Joint ventures
• Fairness opinions
Strategic
Advisory
• Strategic consulting
• IPO preparation
• Financial restructuring
• Specialized opinions
• Independent capital
markets advice
>20
assignments
Asset
Transactions
• Acquisitions
• Divestitures
• Passive equity
• Development capital
formation
$22bn
$4bn
Development
50GW
Operating
23GW
Note: As of Jan 31st, 2020.
Greentech / 21
Disclaimer
This industry update, (the “Monthly Update”) was developed from publicly available information,
without any independent investigation or verification thereof by Greentech Capital Advisors, LLC, taken
together with its affiliates, (“Greentech”), and Greentech makes no representation or warranty as to the
accuracy and completeness of such information. The Monthly Update is not intended to provide, and
should not be relied upon for, legal, tax, regulatory, financial, accounting or investment advice. Prior to
entering into any transaction advised by Greentech (a “Transaction”), you should determine, without
reliance upon Greentech, the economic risks and merits (and independently determine that you are
able to assume these risks) as well as the legal, tax and accounting characterizations and
consequences of any such Transaction. In this regard, by accepting this Presentation, you acknowledge
that (a) Greentech is not in the business of providing (and you are not relying on Greentech for) legal,
tax or accounting advice, (b) there may be legal, tax or accounting risks associated with any
Transaction, (c) you should receive (and rely on) separate and qualified legal, tax and accounting advice
and (d) you should apprise senior management in your organization as to such legal, tax and
accounting advice (and any risks associated with any Transaction) and our disclaimers to these matters.
The Monthly Update does not purport to be complete on any topic addressed. The information in the
Presentation is provided to you as of the dates indicated and Greentech does not intend to update the
information after its distribution, even in the event that the information becomes materially inaccurate.
Certain information contained in the Presentation includes calculations or figures which have been
prepared by Greentech using physically available information and have not been audited or verified by
Greentech or a third-party. Greentech has used data sourced from FactSet and has not reviewed or
verified this data in the preparation of the Monthly Update. Greentech expressly prohibits any
redistribution of the Monthly Update without the prior written consent of Greentech. The Monthly
Update is not intended for distribution, or use by, any person or entity in any jurisdiction or country
where such distribution or use is contrary to law, rule or regulation.
Greentech is engaged in or may be engaged in the future in investment banking, securities trading,
brokerage activities and principal investing activities, as well as providing financial advisory services.
The Monthly Update is neither an expressed nor an implied agreement by Greentech to act in any
capacity with respect to you, and any such agreement shall only be as set forth in an executed
engagement letter, the terms of which are to be agreed upon by you and Greentech. The Monthly
Update in no way restricts Greentech or its affiliates from any other engagement, including acting in
any capacity in a manner adverse to you.
No fiduciary, advisory or agency relationship between Greentech, on the one hand, and you and your
affiliates, employees, officers, directors, or stockholders on the other hand, has been created in
respect of the Presentation, and none of your affiliates, employees, officers, directors, or stockholders
may rely on the Presentation.
On December 11, 2019, the parent companies of Nomura Securities International, Inc. (“NSI”) and
Greentech Capital Advisors Securities, LLC (“Greentech”) entered into a merger agreement. The merger
has not closed. The merger is expected to close on March 31, 2020, subject to certain conditions
including relevant regulatory approvals. Because the merger has not closed: NSI and Greentech operate
as separate, independent, unaffiliated broker-dealers. Employees of NSI do not act on behalf of or
represent Greentech. Employees of Greentech do not act on behalf of or represent NSI. No employees
are “dual hatted” with both NSI and Greentech. This is for informational purposes only and is not a
solicitation of any product or service offered by Nomura.