Embed Size (px)
Citation preview

| J |P|E| L |JPEL Private Equity Limited
Annual Report and Financial Statementsfor the year ended 30 June 2017

Table of Contents
Financial Summary (Company Information) 1
Historical Performance 2
Overview & Strategy 3
Investment Policy 5
Chairman’s Statement 7
Corporate Actions 11
Manager’s Report 14
Portfolio Review 14
Capital Calls and Distributions 17
Buyout Company Valuations and Performance 18
Top 20 Funds & Companies Information 19
Top 10 Investments 20
Directors’ Report 22
Independent Auditors’ Report 34
Financial Statements:
Statement of Comprehensive Income 39
Statement of Financial Position 40
Statement of Changes in Equity 41
Statement of Cash Flows 42
Notes to the Financial Statements 43
Information about the Company 74
Financial Summary (Company Information) finsummarymark
1 JPEL Private Equity Limited ANNUAL REPORT AND FINANCIAL STATEMENTS 30 JUNE 2017
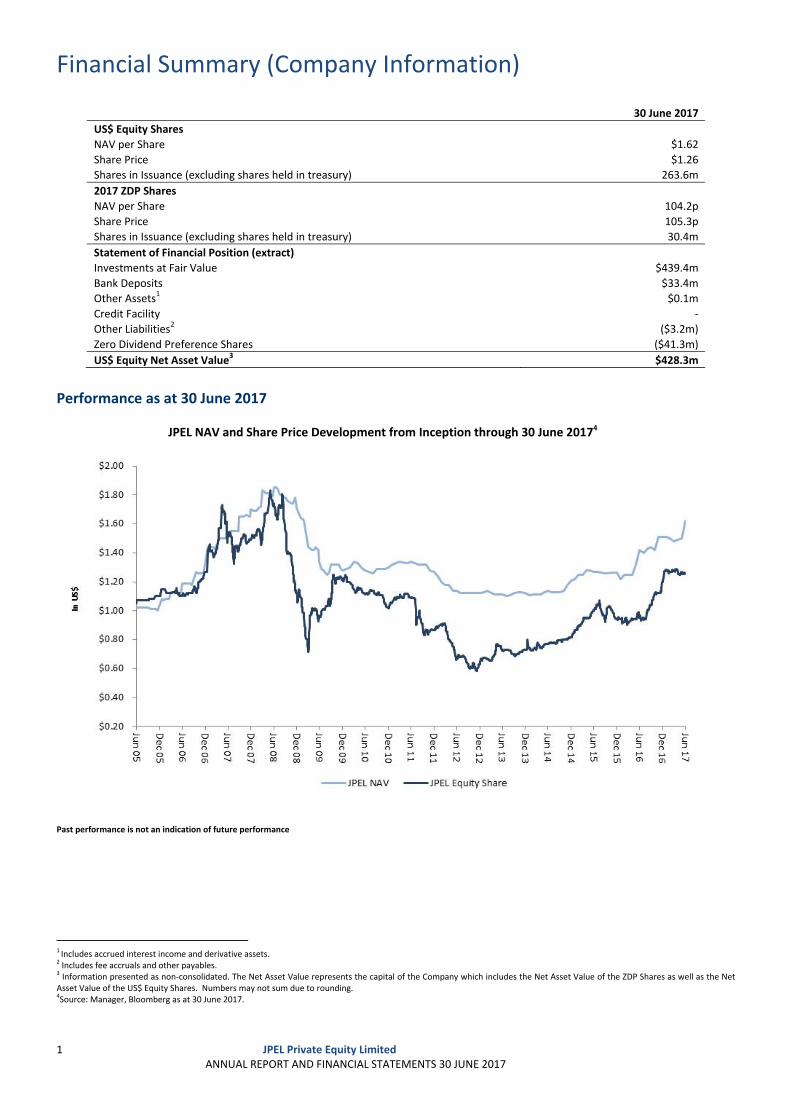
30 June 2017
US$ Equity Shares
NAV per Share $1.62
Share Price $1.26
Shares in Issuance (excluding shares held in treasury) 263.6m
2017 ZDP Shares
NAV per Share 104.2p
Share Price 105.3p
Shares in Issuance (excluding shares held in treasury) 30.4m
Statement of Financial Position (extract)
Investments at Fair Value $439.4m
Bank Deposits $33.4m
Other Assets1 $0.1m
Credit Facility ‐
Other Liabilities2 ($3.2m)
Zero Dividend Preference Shares ($41.3m)
US$ Equity Net Asset Value3 $428.3m
Performance as at 30 June 2017
JPEL NAV and Share Price Development from Inception through 30 June 20174
Past performance is not an indication of future performance
1 Includes accrued interest income and derivative assets. 2 Includes fee accruals and other payables. 3 Information presented as non‐consolidated. The Net Asset Value represents the capital of the Company which includes the Net Asset Value of the ZDP Shares as well as the Net Asset Value of the US$ Equity Shares. Numbers may not sum due to rounding. 4Source: Manager, Bloomberg as at 30 June 2017.
Historical Performancef
2 JPEL Private Equity Limited
ANNUAL REPORT AND FINANCIAL STATEMENTS 30 JUNE 2017
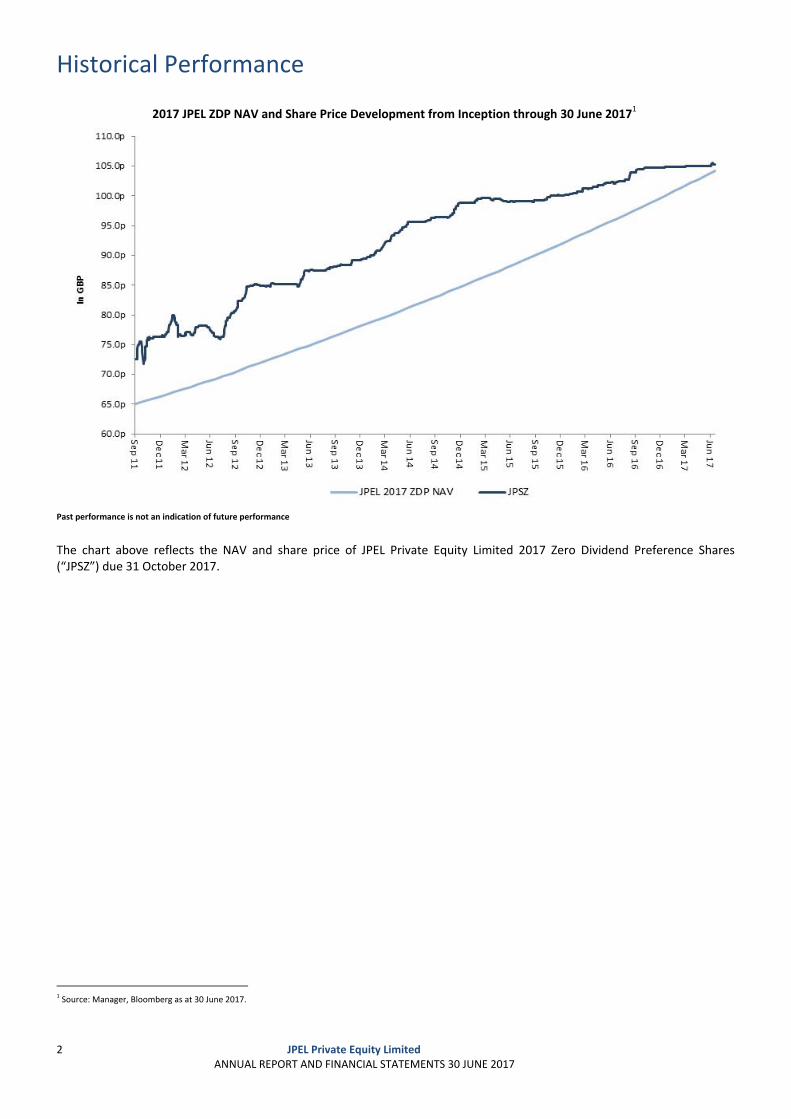
2017 JPEL ZDP NAV and Share Price Development from Inception through 30 June 20171
Past performance is not an indication of future performance The chart above reflects the NAV and share price of JPEL Private Equity Limited 2017 Zero Dividend Preference Shares (“JPSZ”) due 31 October 2017.
1 Source: Manager, Bloomberg as at 30 June 2017.
Overview & Strategy
3 JPEL Private Equity Limited
ANNUAL REPORT AND FINANCIAL STATEMENTS 30 JUNE 2017
OVERVIEW JPEL Private Equity Limited1 (formerly J.P. Morgan Private Equity Limited) (“JPEL” or the “Company”) is a Guernsey registered and incorporated closed ended investment company with a Premium Listing on the London Stock Exchange (LSE: JPEL, JPSZ). JPEL’s current core strategy is to directly invest in private companies purchased in the secondary market with an emphasis on buying assets from tail end funds.2 The fair value of the Company’s total assets as at 30 June 2017 was $472.9 million.
JPEL held its initial public offering on 30 June 2005 under the name “Bear Stearns Private Equity Limited”. The Company currently has two classes of shares: US$ Equity Shares, and 2017 Zero Dividend Preference Shares (“2017 ZDP Shares”). At 30 June 2017, 2017 ZDP Shares made up 9% of total capital3 and US$ Equity Shares made up the remaining 91%.
At 30 June 2017, JPEL is managed by FCF JPEL Management LLC (“FCF JPEL” or the “Manager”), an affiliate of Fortress Investment Group LLC (“FIG” or “Fortress”). On 11 March 2016, JPEL signed an investment management agreement with the Manager, which, other than provisions specifically reflecting the appointment of a new investment manager, is similar to the prior investment management agreement with J.P. Morgan Asset Management (“JPMAM”) in all material aspects. Accordingly, JPEL terminated its investment management agreement with JPMAM on 11 March 2016 (the “Fortress Transaction”). Prior to 11 March 2016, JPEL was managed by Bear Stearns Asset Management Inc., JPMorgan Asset Management (UK) Limited and JF International Management Inc., all wholly‐owned subsidiaries of JPMorgan Chase & Co.
As part of the Fortress Transaction, the investment management team that has been responsible for managing JPEL, led by Troy Duncan and Greg Getschow, has transitioned from JPMAM to the Credit business of FIG. There was no change in the Company’s underlying investment strategy, investment team or investment committee members as a result of the Fortress Transaction. The Company has entered into a management agreement with the Manager to invest the assets of the Company on a discretionary basis, subject to the overall supervision of the Board of Directors (the “Directors”). From 28 October 2016 when Greg Getschow retired as a Director of the Company, all the remaining Directors are independent of the Company. The Directors have overall responsibility for the Company’s investment policy and the Company’s activities.
FIG is a highly diversified global investment firm with approximately $72.4 billion4 in assets under management as of 30 June 2017. Founded in 1998, Fortress manages assets on behalf of approximately 1,700 institutional and private investors worldwide across a range of private equity, credit and real estate, liquid hedge funds and traditional asset management strategies. Fortress is publicly traded on the New York Stock Exchange (NYSE: FIG).
FIG’s Credit business (“Fortress Credit”) was launched in 2002 by Pete Briger. Today, the Fortress Credit team consists of over 500 professionals and is focused on investing globally, primarily in undervalued assets and distressed and illiquid credit investments. The investment team, led by Co‐Chief Investment Officers Pete Briger and Dean Dakolias, has a long and established track record investing throughout a number of credit and distressed cycles around the world. With over 85 professionals dedicated to asset management in over 15 geographic locations, the Fortress Credit team also has the experience to manage and service assets with operational complexity.
On 14 February 2017, Fortress and SoftBank Group Corp, (“SoftBank”) announced that they had entered into a definitive merger agreement under which a limited partnership or other entity (the “Parent”) controlled by SoftBank will acquire Fortress (the “Merger”). The Merger is subject to various closing conditions, and there is no assurance that the Merger will be completed. Following the completion of the Merger, Fortress will operate within SoftBank as an independent business. Fortress’s principals have agreed to continue day‐to‐day management of Fortress, and the Company’s investment advisory arrangement with Fortress is not changing as a result of the Merger. SoftBank and its affiliates have committed to provide sufficient funds to the Parent to complete the Merger. Additional information regarding the Merger is included in the Form 8‐K filed by Fortress with the SEC on 15 February 2017 and the proxy statement pursuant to Section 14(a) of the Securities Exchange Act of 1934, as amended, filed with the SEC on 7 June 2017 (which Form 8‐K and proxy statement do not form part of these financial statements).
The key measure of performance used by the Board and Shareholders to assess the Company’s performance is the NAV which is prepared on a monthly basis by Augentius (Guernsey) Limited (the “Administrator”).
1 On 26 February 2016, Shareholders voted to change the Company’s name from J.P. Morgan Private Equity Limited to JPEL Private Equity Limited. The name change was effective on 11 March 2016. 2 Please refer to the section entitled “Investment Strategy” on page 4. 3 Total capital is represented by ZDP share capital and Total equity. 4 Includes $1.4 billion of AUM related to co‐managed funds as at 30 June 2017. Includes $4.5 billion of AUM related to Affiliated Managers as at 30 June 2017.
Overview & Strategy continued
4 JPEL Private Equity Limited
ANNUAL REPORT AND FINANCIAL STATEMENTS 30 JUNE 2017
INVESTMENT STRATEGY Currently, the Company primarily pursues the following investment policies and strategies to enhance shareholder value and to meet its investment objective:
acquires secondary portfolios of direct investments and significantly invested partnership investments to accelerate NAV development;
opportunistically invests in buyout, venture capital, and special situations funds and investments throughout the world based on attractive transaction values, advantageous market conditions, and compelling risk‐adjusted return potential;
obtains exposure to individual companies by co‐investing alongside private equity sponsors in companies that offer the potential for substantial equity appreciation;
diversifies its portfolio by manager, industry, geography, investment stage, and vintage year; and
actively manages the portfolio by repositioning its investment composition from time to time in order to capitalise on changes in private equity market conditions.
In summary, the investment objective and policy of the Company is to achieve both short‐term and long‐term capital appreciation by investing in a well‐diversified portfolio of private equity interests and by capitalising on the inefficiencies of the global secondary private equity market. At an Extraordinary General Meeting ("EGM") and a separate class meeting of US$ Equity Shareholders (“Separate Class Meeting”) of the Company which was held on 5 July 2016, Shareholders voted in favour of resolutions to amend the Company’s investment policy to take effect from the date of the repayment of the 2017 Final Capital Entitlement1 to the holders of the 2017 ZDP Shares. Following the repayment to the holders of 2017 ZDP Shares of their 2017 Final Capital Entitlement in October 2017 and change to the Company’s investment policy coming into effect, the Manager will effect an orderly realisation of the investments and other assets comprised in the Company’s portfolio and will seek to realise such investments and assets in order to maximize returns to US$ Equity Shareholders. This will include the Manager exploring the private equity secondary market for the Company’s legacy fund interests within three years from June 2016 as well as holding the direct investment portfolio until maturity, unless the Manager believes that market pricing would be more favourable than realising such investments before their maturity. Conditional upon the resolutions being passed at the Extraordinary General Meeting (“EGM”) and Separate Class Meeting (“SCM”), the Company also undertook that, commencing June 2016, the Company would not make any new investments save for follow‐on investments associated with investments in existence as of June 2016 to meet capital calls with respect to its undrawn commitments to underlying investments or to preserve or protect the value of its existing investments as of June 2016. As these resolutions were passed at the EGM and SCM, the Company has complied with this undertaking.
1 In respect of a 2017 ZDP Share, the accrued capital entitlement of such 2017 ZDP Share on the 2017 Final Capital Entitlement Date or, if lower, the amount per 2017 ZDP Share to which holders of 2017 ZDP Shares would be entitled and would receive on a winding‐up of the Company.
Investment Policy
5 JPEL Private Equity Limited
ANNUAL REPORT AND FINANCIAL STATEMENTS 30 JUNE 2017
ASSET ALLOCATION The majority of the Company’s portfolio is allocated to buyout funds, and the balance to venture capital, real estate and multi‐style funds.
A buyout fund typically targets the acquisition of a significant portion or majority control of businesses which normally entails a change of ownership. Buyout funds ordinarily invest in more mature companies with established business plans to finance expansions, consolidations, turnarounds and sales, or spinouts of divisions or subsidiaries. A leveraged buyout, commonly referred to as an LBO, is a buyout that uses debt financing to fund a portion of the purchase price of the targeted business.
Venture capital refers to private equity capital typically provided to early‐stage, high‐potential growth companies.
Private Equity Real Estate is an asset class consisting of equity and debt investments in property. Investments typically involve an active management strategy ranging from moderate reposition or releasing of properties to development or extensive redevelopment.
A multi‐style investment strategy refers to fund managers that make investments in companies in various stages of development. A multi‐style manager may make investments in start‐up enterprises, later‐stage venture companies and established businesses – all within the same fund. These investments may involve control positions or may be minority, passive positions.
By investing in a portfolio of private equity funds, the Company is exposed to numerous underlying investments in individual companies, ranging from start‐up ventures to large, multi‐national enterprises. Prior to June 2016, the Manager purchased private equity fund interests and co‐investments in the secondary market to ensure that JPEL’s portfolio contained investments that would be made and exited in different economic cycles.
Prior to June 2016, the Company invested capital not otherwise allocated to private equity into near cash and other investments. The Company, at the Manager’s discretion, invested in a wide variety of investments and other financial instruments.
The Company will not enter into derivative transactions (such as options, futures and contracts for difference) other than for the purposes of efficient portfolio management.
The Company will not take any legal or management control of any underlying company or fund in the Company’s portfolio.
REALISATION OF THE COMPANY’S PORTFOLIO At an Extraordinary General Meeting ("EGM") and a separate class meeting of US$ Equity Shareholders (“Separate Class Meeting”) of the Company which was held on 5 July 2016, Shareholders voted in favour of the resolutions put to Shareholders to amend the Company’s investment policy with effect from the repayment of the 2017 Final Capital Entitlement to the holders of the 2017 ZDP Shares.
Following the repayment to the holders of 2017 ZDP Shares of their 2017 Final Capital Entitlement in October 2017 and change to the Company’s investment policy coming into effect, the Manager will effect an orderly realisation of the investments and other assets comprised in the Company’s portfolio and will seek to realise such investments and assets in order to maximize returns to US$ Equity Shareholders. This will include the Manager exploring the private equity secondary market for the Company’s legacy fund interests within three years from June 2016 as well as holding the direct investment portfolio until maturity, unless the Manager believes that market pricing would be more favourable than realising such investments before their maturity. Conditional upon the resolutions being passed at the EGM and SGM, the Company also undertook that, commencing June 2016, the Company would not make any new investments save for follow‐on investments associated with investments in existence as of June 2016 to meet capital calls with respect to its undrawn commitments to underlying investments or to preserve or protect the value of its existing investments as of June 2016. As these resolutions were passed at the EGM and SCM, the Company has complied with this undertaking.
RISK DIVERSIFICATION The Manager will actively monitor the Company’s portfolio and attempt to mitigate risk primarily through diversification. Not more than 20% of the Company’s Net Asset Value, at the time of investment, is permitted to be invested in any single investment. For the avoidance of doubt, if the Company acquires a portfolio of companies in a single transaction, this limitation shall be applied individually to each of the underlying companies purchased and not to the portfolio as a whole.
Investment Policy continued
6 JPEL Private Equity Limited
ANNUAL REPORT AND FINANCIAL STATEMENTS 30 JUNE 2017
LEVERAGE The Company has the ability to borrow up to 30% of its Total Assets subject to and in accordance with the limitations and conditions in its Articles of Incorporation (“Articles”). As part of its leverage policy, the Company may borrow for short‐term or temporary purposes as is necessary for settlement of transactions, to facilitate the operation of the over‐commitment policy or to meet ongoing expenses. The Directors and the Manager will not incur any short‐term borrowings to facilitate any tender or redemption of Shares1 unless such borrowings have a repayment period of 180 days or less. The Company is indirectly exposed to borrowings to the extent that subsidiaries and underlying funds in its portfolio are themselves leveraged.
1 Shares forming part of each Equity Share Class and/or the 2017 ZDP Shares, as the context may require.
Chairman’s Statement
7 JPEL Private Equity Limited
ANNUAL REPORT AND FINANCIAL STATEMENTS 30 JUNE 2017
During the last twelve months, JPEL has continued to deliver on a number of strategic initiatives.
2017 FISCAL YEAR HIGHLIGHTS During the fiscal year, US$ Equity Share price increased 30.3% and NAV per US$ Equity Share increased
14.1%.
Completed two mandatory redemptions, returning a total of $109.2 million to US$ Equity Shareholders or approximately 21% of prevailing NAV at the time of the initial Mandatory Redemption.
Including the capital returned via the mandatory redemptions, US$ Equity Shareholders have experienced a 35.1% increase in shareholder value during the fiscal year.
Announced the sale of Datamars and Innovia, JPEL’s 2nd and 3rd largest investments at 31 December 2016.
Repaid all outstanding debt drawn under the Lloyds credit facility.
Reduced the size of the Lloyds credit facility from $150 million to $80 million. Subsequent to the period, JPEL further reduced the size of the credit facility from $80 million to $50 million, resulting in aggregate annual savings of $900,000.
Shareholders approved proposals to allow the Company to effect an orderly realisation of its portfolio following the repayment to the 2017 ZDP Shareholders of their Final Capital Entitlement.
NAV AND SHARE PRICE PERFORMANCE During fiscal year 2017, JPEL’s NAV per US$ Equity Share increased by $0.20, or 14.1% to $1.62 and JPEL’s US$ Equity Share price increased 30.3%. The largest positive drivers of the Company’s NAV performance during the fiscal year in order of magnitude were Celerion, Saas Provider, Innovia and Datamars. Subsequent to the period, JPEL’s US$ Equity Share price increased from $1.25875 at 30 June 2017 to $1.2825 on 22 September 2017, representing an increase of 1.89%. On 22 September 2017, JPEL traded at a 22.57% discount to prevailing NAV.
JPEL’s one remaining class of ZDP Shares also performed well during the twelve month period. The NAV of JPEL’s 2017 ZDP Shares rose 8.5% during this period, from 96.08p to 104.23p per share. At 30 June 2017, JPEL’s 2017 ZDP Shares traded at a 1% premium to NAV.
MANDATORY REDEMPTIONS As a reminder, Phase III of the Company’s strategic initiative plan implemented a mandatory redemption facility to allow distributions at prevailing NAVs in accordance with the Company's investment policies, whilst repaying debt and reserving for ZDP repayment. The operating guidelines for Phase III (until the 2017 ZDPs are repaid) are as follows:
The Company will seek to limit its leverage ratio1 to less than 15%.
Based on assumptions for exits, it is the intention of the Company to distribute not less than 50% of realisations from the portfolio to Shareholders by the voluntary operation of its tender facility, less any tender costs, in accordance with the Articles and investment policies (subject to the Company having available cash, being solvent and any other legal and regulatory requirements and the Board exercising its discretion to make tender offers).
Purchases of 15% of US$ Equity Shares may only be made by way of tender offer. If proceeds available for distribution exceed this amount, the Company may make ad hoc purchases of shares in the open market at prevailing market prices (up to a further 14.99%) or pay dividends or capital distributions in accordance with the Articles.
The realisation proceeds not distributed will be used to reduce liabilities and pay costs and expenses, fund portfolio follow‐on investments and undrawn capital commitments.
Pursuant to Phase III of the Company’s Strategic Initiatives, JPEL completed two mandatory redemptions during the fiscal year. In total, JPEL has returned $109.2 million to Shareholders, or approximately 21% of the Company's 30 November 2016 NAV, the prevailing NAV at the time of JPEL’s initial mandatory redemption.
1 Leverage is defined as debt drawn under the Company’s credit facility and Zero Dividend Preference Shares. The Leverage ratio is calculated as leverage divided by total assets.

Chairman’s Statement continued
8 JPEL Private Equity Limited
ANNUAL REPORT AND FINANCIAL STATEMENTS 30 JUNE 2017
MANDATORY REDEMPTIONS continued JPEL will continue to review the level of distributions received from the underlying portfolio and will determine the timing of the next mandatory redemption in due course.
Initial mandatory redemption on 15 December 2016
Returned $19.2 million, (the equivalent of 13,521,066 US$ Equity Shares, or 4% of prevailing US$ Equity Shareholder NAV) or 51.4% of distributions to US$ Equity Shareholders.
Second mandatory redemption on 2 May 2017
Returned $90 million, (the equivalent of approximately 60.8 million US$ Equity Shares, or 18.7% of prevailing US$ Equity Shareholder NAV) or 87% of net distributions to US$ Equity Shareholders.
FURTHER ACTIONS UNDER PHASE III Commencing June 2016, JPEL announced that it would not make any new investments save for follow‐on investments associated with investments in existence as of June 2016 to meet capital calls with respect to its undrawn commitments to underlying investments or to preserve or protect the value of its existing investments as of June 2016. As these resolutions were passed at the 2016 EGM and SCM and the Company has complied with this undertaking.
CAPITAL POSITION JPEL’s capital position has continued to improve during fiscal year 2017.
During the twelve months ended 30 June 2017, the portfolio generated gross distributions of $143.6 million and funded capital calls of $7.3 million1.
During the period, JPEL repaid all outstanding debt under the Company’s credit facility. At the time of publication of this report, JPEL had no outstanding debt under the Company’s credit facility.
During the period, JPEL reduced the size of its credit facility from $150 million to $80 million. Subsequent to the period, JPEL further reduced the size of the credit facility from $80 million to $50 million, resulting in an all‐in annual saving of $900,000.
JPEL’s total leverage ratio2 decreased from 11.3% at 30 June 2016 to 8.7% at 30 June 2017.
On 31 October 2017, JPEL intends to redeem and cancel its 2017 Zero Dividend Preference Share Class (Ticker – LSE: JPSZ). The Final Capital Entitlement of the 2017 ZDP Shares is approximately £32.5 million and will likely be financed by cash on hand and the utilisation of the Company’s low‐cost credit facility. As at 30 June 2017, the 2017 ZDP Shares represented approximately 8.8% of JPEL’s net asset value. The repayment of the 2017 ZDP Shares will further reduce the overall leverage of JPEL and will simplify the Company’s capital structure.
PORTFOLIO HIGHLIGHTS3 On a weighted average basis, JPEL’s top buyout companies are carried at an Enterprise Value / EBITDA multiple of 7.0x with a weighted average Net Debt / EBITDA multiple 1.6x.
Latest twelve month Revenue for JPEL’s top investments grew by a weighted‐average of 3.6%. Latest twelve month EBITDA for JPEL’s top investments grew by a weighted‐average of 12.7%. EBITDA growth in excess of Revenue growth is largely due to increase efficiencies at JPEL’s top companies.
1 Distributions are shown on a cash basis. Distributions from JPEL’s investment in ROC Capital Trust are reflected on the date that JPEL received the distribution from ROC Capital Trust. 2 Leverage is defined as debt drawn under the Company’s credit facility and Zero Dividend Preference Shares. The Leverage ratio is calculated as leverage divided by total assets 3 Analysis based on LTM information on JPEL’s largest buyout investments and as at 30 June 2017. Percentages based on relevant investment value as a % of total value for which information was available. Of JPEL’s top 10 underlying company exposures, 6 companies are classified as traditional buyout and included in this analysis. Information for four of the companies is as of 31 March 2017 and two of the companies as of 31 December 2016.
Chairman’s Statement continued
9 JPEL Private Equity Limited
ANNUAL REPORT AND FINANCIAL STATEMENTS 30 JUNE 2017
DISTRIBUTION ACTIVITY 1
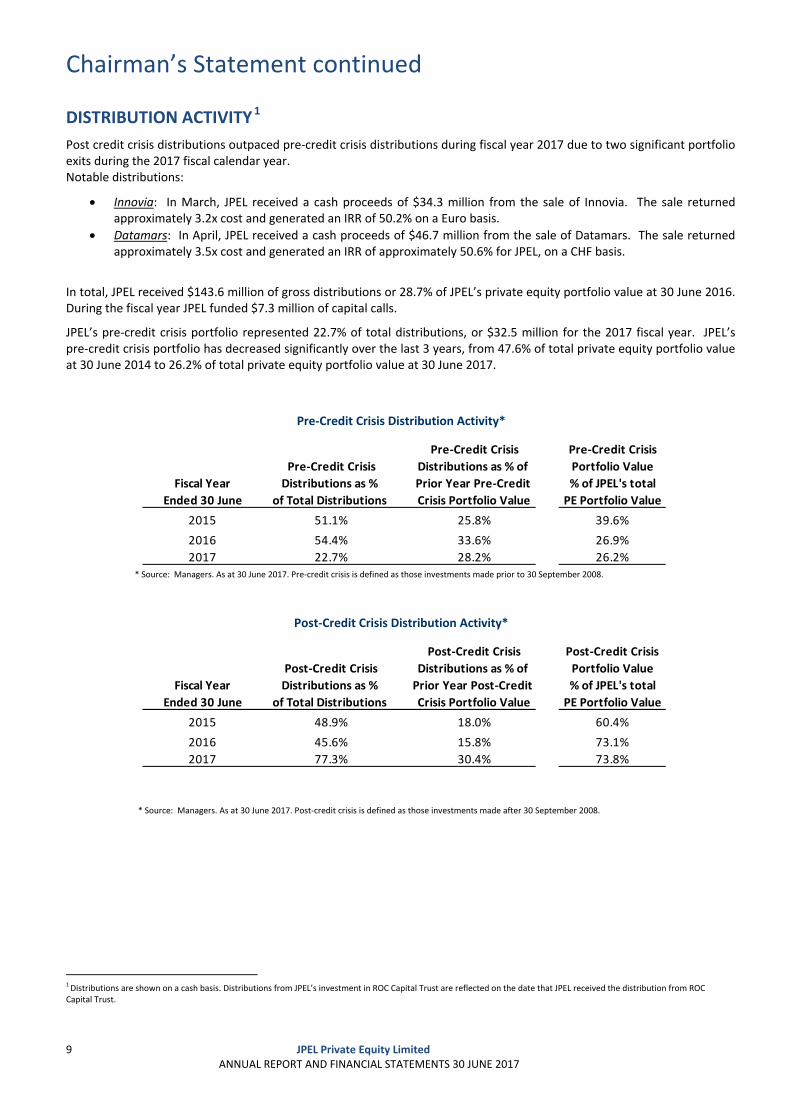
Post credit crisis distributions outpaced pre‐credit crisis distributions during fiscal year 2017 due to two significant portfolio exits during the 2017 fiscal calendar year. Notable distributions:
Innovia: In March, JPEL received a cash proceeds of $34.3 million from the sale of Innovia. The sale returned approximately 3.2x cost and generated an IRR of 50.2% on a Euro basis.
Datamars: In April, JPEL received a cash proceeds of $46.7 million from the sale of Datamars. The sale returned approximately 3.5x cost and generated an IRR of approximately 50.6% for JPEL, on a CHF basis.
In total, JPEL received $143.6 million of gross distributions or 28.7% of JPEL’s private equity portfolio value at 30 June 2016. During the fiscal year JPEL funded $7.3 million of capital calls.
JPEL’s pre‐credit crisis portfolio represented 22.7% of total distributions, or $32.5 million for the 2017 fiscal year. JPEL’s pre‐credit crisis portfolio has decreased significantly over the last 3 years, from 47.6% of total private equity portfolio value at 30 June 2014 to 26.2% of total private equity portfolio value at 30 June 2017.
Pre‐Credit Crisis Distribution Activity*
Pre‐Credit Crisis Pre‐Credit Crisis
Pre‐Credit Crisis Distributions as % of Portfolio Value
Fiscal Year Distributions as % Prior Year Pre‐Credit % of JPEL's total
Ended 30 June of Total Distributions Crisis Portfolio Value PE Portfolio Value
2015 51.1% 25.8% 39.6%
2016 54.4% 33.6% 26.9%
2017 22.7% 28.2% 26.2% * Source: Managers. As at 30 June 2017. Pre‐credit crisis is defined as those investments made prior to 30 September 2008.
Post‐Credit Crisis Distribution Activity*
Post‐Credit Crisis Post‐Credit Crisis
Post‐Credit Crisis Distributions as % of Portfolio Value
Fiscal Year Distributions as % Prior Year Post‐Credit % of JPEL's total
Ended 30 June of Total Distributions Crisis Portfolio Value PE Portfolio Value
2015 48.9% 18.0% 60.4%
2016 45.6% 15.8% 73.1%
2017 77.3% 30.4% 73.8%
* Source: Managers. As at 30 June 2017. Post‐credit crisis is defined as those investments made after 30 September 2008.
1 Distributions are shown on a cash basis. Distributions from JPEL’s investment in ROC Capital Trust are reflected on the date that JPEL received the distribution from ROC Capital Trust.
Chairman’s Statement continued
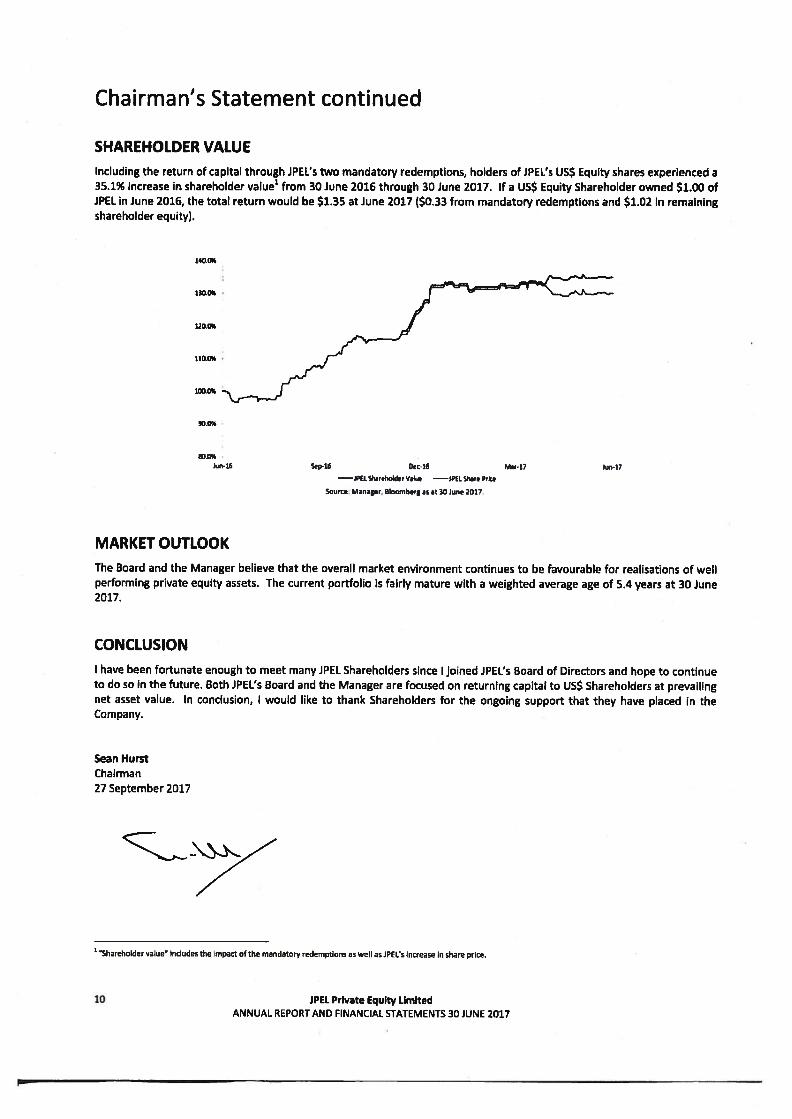
SHAREHOLDER VALUE
Including the return of capital through JPEL’s two mandatory redemptions, holders of JPEL’s US$ Equity shares experienced a35.1% increase in shareholder value1 from 30 June 2016 through 30 June 2017. If a US$ Equity Shareholder owned $1.00 ofJPEL in June 2016, the total return would be $1.35 at June 2017 ($0.33 from mandatory redemptions and $1.02 In remainingshareholder equity).
Sep46 Dec16 Jun-17
—WEL Shar,hddetVakr —JP(L liwe Prce
Source Manager, Bbomberg as at 30 June 2017
MARKET OUTLOOK
The Board and the Manager believe that the overall market environment continues to be favourable for realisations of weltperforming private equity assets. The current portfolio is fairly mature with a weighted average age of 5.4 years at 30 June2017.
CONCLUSION
I have been fortunate enough to meet many JPEL Shareholders since I joined JPEL’s Board of Directors and hope to continueto do so in the future. Both JPEL’s Board and the Manager ate focused on returning capital to US$ Shareholders at prevailingnet asset value. In conclusion, I would like to thank Shareholders for the ongoing support that they have placed in theCompany.
Sean HurstChairman27 September 2017
Sharehoider vaiue inciudes the impact of the mandatory reciemptfons as well as JPft’s increase In share puce.
JPEL Private Equity LimitedANNUAL REPORT AND FINANCIAL STATEMENTS 30 JUNE 2017
140.0%
1300%
120.0%
1000%
900%
900%Jun46
10
Corporate Actions
11 JPEL Private Equity Limited
ANNUAL REPORT AND FINANCIAL STATEMENTS 30 JUNE 2017
2016 CORPORATE ACTIONS On 5 July 2016, JPEL held an Extraordinary General Meeting ("EGM") and the separate class meeting for holders of US$
Equity Shares ("Separate Class Meeting") of the Company. At these meetings, the resolutions put to shareholders to amend the Company's investment policy with effect from the repayment of the 2017 Final Capital Entitlement to the holders of the 2017 ZDP Shares were duly passed.
On 11 October 2016, JPEL published a circular to Shareholders. o The circular contains a notice of AGM and separate class meeting of holders of US$ Equity Shares on 28
October 2016. o The following summarises all of the resolutions the Company is seeking approval for at the Annual General
Meeting. Special Resolutions
1. To renew the Company's authority to make purchases of up to 15 per cent. of each class of its own issued shares pursuant to any proposed Tender Offer.
2. To renew the Company's general authority to make market purchases of up to 14.99 per cent. of each class of its own issued Shares.
3. To renew the disapplication of the pre‐emption rights for up to 10 per cent. of each class of its own issued Shares as set out in the Articles of Incorporation.
4. To adopt new Articles of Incorporation of the Company.
Ordinary Resolutions
5. To approve the appointment of Sean Hurst as a non‐executive independent Director of the Company. 6. To approve and adopt the Annual Report and Financial Statements of the Company for the year ended 30
June 2015. 7. To approve and adopt the Annual Report and Financial Statements of the Company for the year ended 30
June 2016. 8. To re‐elect PricewaterhouseCoopers CI LLP as Auditors to the Company. 9. To re‐authorise the Directors to determine the Auditors' remuneration. 10. To re‐authorise and agree the remuneration of the Directors in accordance with the Articles of Incorporation.
On 28 October 2016, JPEL published a circular to Shareholders. JPEL announced that at the Annual General Meeting
("AGM") of the Company held on 29 July 2015, all special and ordinary resolutions put to shareholders were duly passed except Special Resolution 3.
o The following special resolution was not passed at the Annual General Meeting. 3. To renew the disapplication of the pre‐emption rights for up to 10 per cent. of each class of its own issued
Shares as set out in the Articles of Incorporation.
o The following summarises the special resolution which was approved at the Separate Class Meeting. 1. To approve the proposals in the new Articles of Incorporation which vary the rights of US$ Equity
Shareholders by the inclusion of provisions authorising the Company to redeem some of its issued Equity Shares on a quarterly basis.
On 8 November 2016, JPEL announced the appointment of Sean Hurst as Chairman of the Company with immediate effect.

Corporate Actions continued
12 JPEL Private Equity Limited
ANNUAL REPORT AND FINANCIAL STATEMENTS 30 JUNE 2017
2016 CORPORATE ACTIONS (continued) On 30 November 2016, JPEL announced a capital distribution of $19.2 million (the equivalent of approximately 13.5
million US$ Equity Shares, or 4% of US$ Equity Shareholder NAV) to take place on 15 December 2016. The compulsory redemption of US$ Equity Shares was issued at a price equal to the prevailing NAV per US$ Equity Share of $1.42 as at 31 October 2016 (being the most recent NAV per US$ Equity Share available as of the date of the announcement) for US$ Equity Shareholders on the register of members as at close of business on 14 December 2016. Payments of redemption proceeds were effected either through CREST (in the case of shares held in uncertificated form) or by cheque (in the case of shares held in certificated form) on or around 22 December 2016.
On 15 December 2016, JPEL announced that the partial mandatory redemption of the Company's US$ Equity Share class announced on 30 November 2016 was completed with the redemption of 13,521,066 US$ Equity Shares.
Corporate Actions continued
13 JPEL Private Equity Limited
ANNUAL REPORT AND FINANCIAL STATEMENTS 30 JUNE 2017
2017 CORPORATE ACTIONS
On 17 February 2017, JPEL released an announcement stating that SoftBank Group Corp. ("SoftBank" or "SBG") and Fortress Investment Group LLC ("Fortress") announced on 14 February 2017 that they have entered into a definitive merger agreement under which SoftBank will acquire Fortress for approximately $3.3 billion in cash.* FCF JPEL Management LLC, the investment manager for JPEL Private Equity Limited is an affiliate of Fortress.
* The transaction is subject to approval by Fortress shareholders, certain regulatory approvals and other customary closing conditions.
On 12 April 2017, JPEL announced a capital distribution of $90 million (the equivalent of approximately 60.8 million US$ Equity Shares, or 18.7% of US$ Equity Shareholder NAV). The mandatory redemption of US$ Equity Shares was issued at a price equal to the prevailing NAV per US$ Equity Share of $1.48 as at 31 March 2017 (being the most recent NAV per US$ Equity Share available as of the date of the announcement) for US$ Equity Shareholders on the register of members as at close of business on 28 April 2017. Payments of redemption proceeds were effected either through CREST (in the case of shares held in uncertificated form) or by cheque (in the case of shares held in certificated form) on or around 9 May 2017.
On 2 May 2017, JPEL announced that the partial mandatory redemption of the Company's US$ Equity Share class announced on 12 April 2017 was completed with the redemption of 60,810,726 US$ Equity Shares. Following the redemption, The Company's total capital was 294,024,535 Shares of no par value (excluding treasury shares). The Company's capital consisted of 263,613,782 Shares of no par value (excluding treasury shares) each classified as US$ Equity Shares and 30,410,753 shares of no par value (excluding treasury shares) each classified as 2017 Zero Dividend Preference Shares. The total number of voting rights in the Company following the partial mandatory redemption was 263,613,782 for the US$ Equity Share class and 30,410,753 for the 2017 Zero Dividend Preference share class.
Manager’s Report
14 JPEL Private Equity Limited
ANNUAL REPORT AND FINANCIAL STATEMENTS 30 JUNE 2017
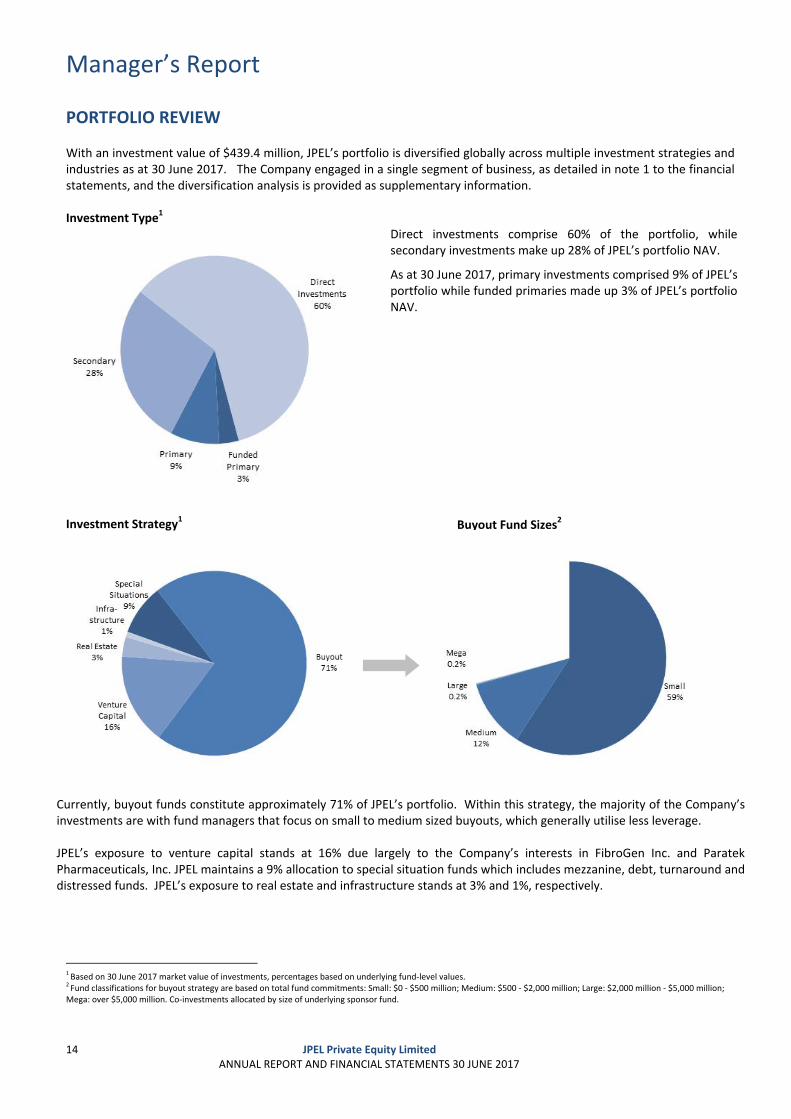
PORTFOLIO REVIEW With an investment value of $439.4 million, JPEL’s portfolio is diversified globally across multiple investment strategies and industries as at 30 June 2017. The Company engaged in a single segment of business, as detailed in note 1 to the financial statements, and the diversification analysis is provided as supplementary information. Investment Type1
Direct investments comprise 60% of the portfolio, while secondary investments make up 28% of JPEL’s portfolio NAV.
As at 30 June 2017, primary investments comprised 9% of JPEL’s portfolio while funded primaries made up 3% of JPEL’s portfolio NAV.
Investment Strategy1
Currently, buyout funds constitute approximately 71% of JPEL’s portfolio. Within this strategy, the majority of the Company’sinvestments are with fund managers that focus on small to medium sized buyouts, which generally utilise less leverage. JPEL’s exposure to venture capital stands at 16% due largely to the Company’s interests in FibroGen Inc. and Paratek Pharmaceuticals, Inc. JPEL maintains a 9% allocation to special situation funds which includes mezzanine, debt, turnaround anddistressed funds. JPEL’s exposure to real estate and infrastructure stands at 3% and 1%, respectively.
1 Based on 30 June 2017 market value of investments, percentages based on underlying fund‐level values. 2 Fund classifications for buyout strategy are based on total fund commitments: Small: $0 ‐ $500 million; Medium: $500 ‐ $2,000 million; Large: $2,000 million ‐ $5,000 million; Mega: over $5,000 million. Co‐investments allocated by size of underlying sponsor fund.
Buyout Fund Sizes2
Manager’s Report continued
15 JPEL Private Equity Limited
ANNUAL REPORT AND FINANCIAL STATEMENTS 30 JUNE 2017
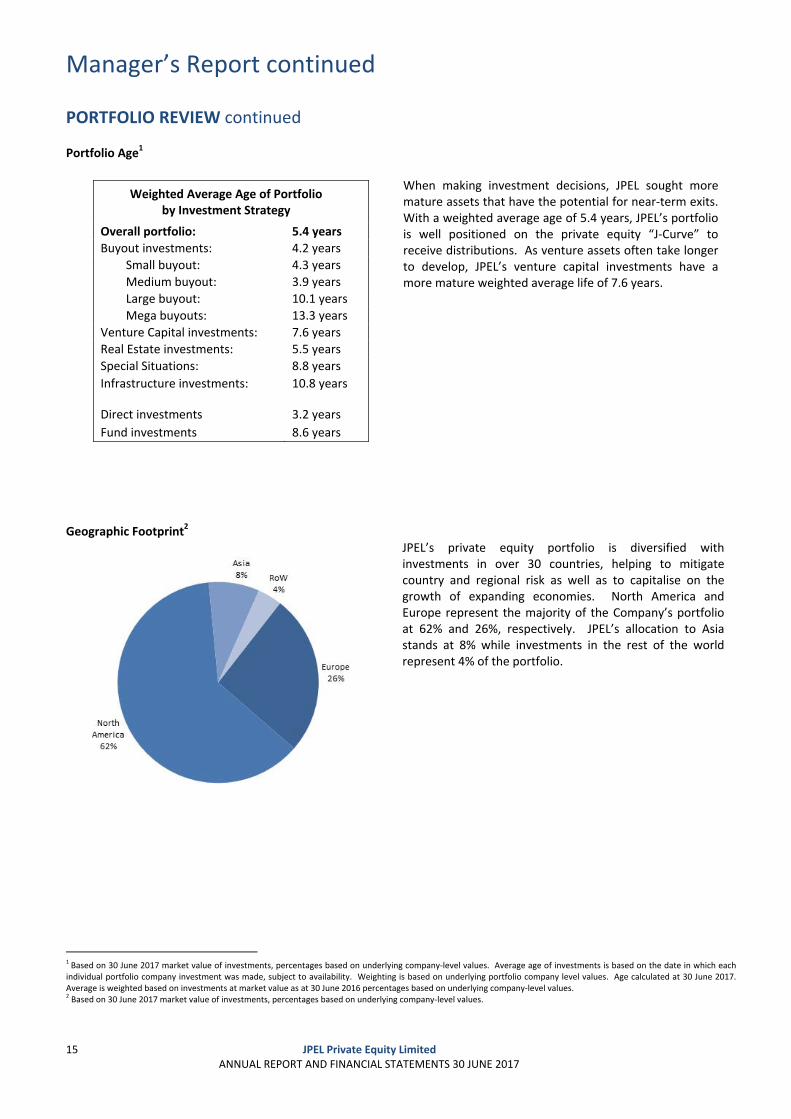
PORTFOLIO REVIEW continued Portfolio Age1
Weighted Average Age of Portfolio by Investment Strategy
Overall portfolio: 5.4 years
Buyout investments: 4.2 years
Small buyout: 4.3 years
Medium buyout: 3.9 years
Large buyout: 10.1 years
Mega buyouts: 13.3 years
Venture Capital investments: 7.6 years
Real Estate investments: 5.5 years
Special Situations: 8.8 years
Infrastructure investments: 10.8 years
Direct investments 3.2 years
Fund investments 8.6 years
When making investment decisions, JPEL sought more mature assets that have the potential for near‐term exits. With a weighted average age of 5.4 years, JPEL’s portfolio is well positioned on the private equity “J‐Curve” to receive distributions. As venture assets often take longer to develop, JPEL’s venture capital investments have a more mature weighted average life of 7.6 years.
Geographic Footprint2
JPEL’s private equity portfolio is diversified with investments in over 30 countries, helping to mitigate country and regional risk as well as to capitalise on the growth of expanding economies. North America and Europe represent the majority of the Company’s portfolio at 62% and 26%, respectively. JPEL’s allocation to Asia stands at 8% while investments in the rest of the world represent 4% of the portfolio.
1 Based on 30 June 2017 market value of investments, percentages based on underlying company‐level values. Average age of investments is based on the date in which each individual portfolio company investment was made, subject to availability. Weighting is based on underlying portfolio company level values. Age calculated at 30 June 2017. Average is weighted based on investments at market value as at 30 June 2016 percentages based on underlying company‐level values. 2 Based on 30 June 2017 market value of investments, percentages based on underlying company‐level values.
Manager’s Report continued
16 JPEL Private Equity Limited
ANNUAL REPORT AND FINANCIAL STATEMENTS 30 JUNE 2017
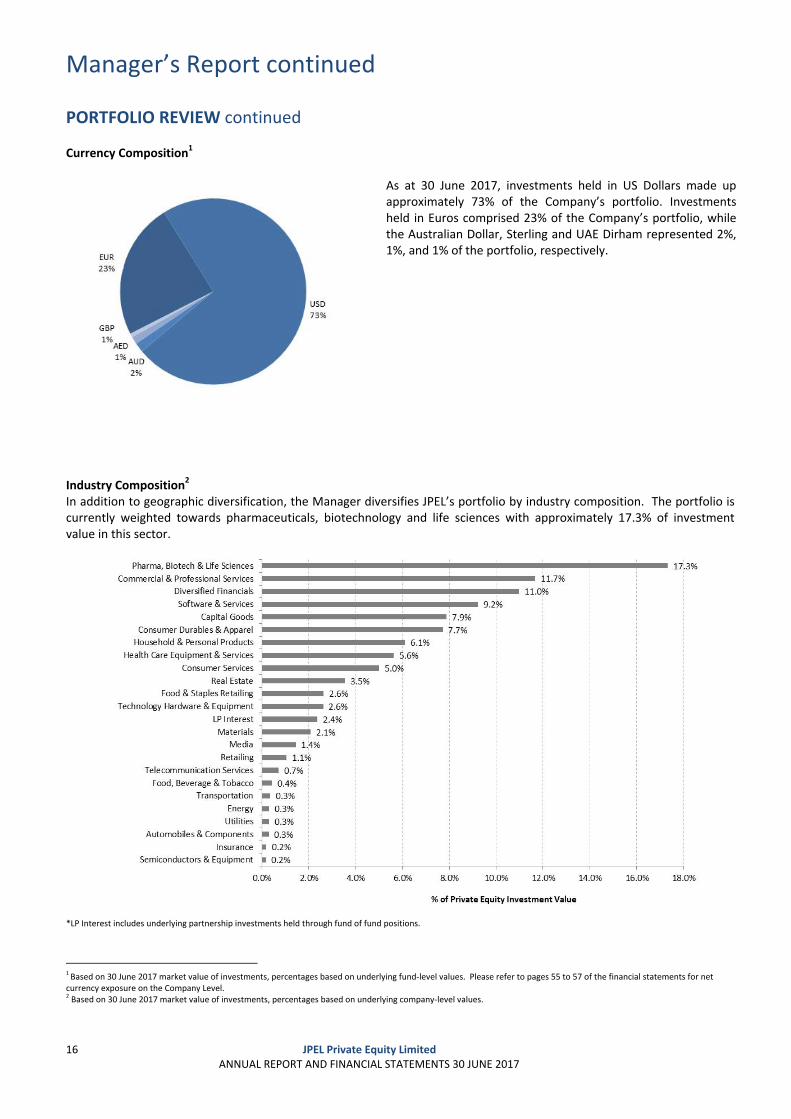
PORTFOLIO REVIEW continued Currency Composition1
As at 30 June 2017, investments held in US Dollars made up approximately 73% of the Company’s portfolio. Investments held in Euros comprised 23% of the Company’s portfolio, while the Australian Dollar, Sterling and UAE Dirham represented 2%, 1%, and 1% of the portfolio, respectively.
Industry Composition2 In addition to geographic diversification, the Manager diversifies JPEL’s portfolio by industry composition. The portfolio is currently weighted towards pharmaceuticals, biotechnology and life sciences with approximately 17.3% of investment value in this sector.
*LP Interest includes underlying partnership investments held through fund of fund positions.
1 Based on 30 June 2017 market value of investments, percentages based on underlying fund‐level values. Please refer to pages 55 to 57 of the financial statements for net currency exposure on the Company Level. 2 Based on 30 June 2017 market value of investments, percentages based on underlying company‐level values.
Manager’s Report continued
17 JPEL Private Equity Limited
ANNUAL REPORT AND FINANCIAL STATEMENTS 30 JUNE 2017
CAPITAL CALLS AND DISTRIBUTIONS
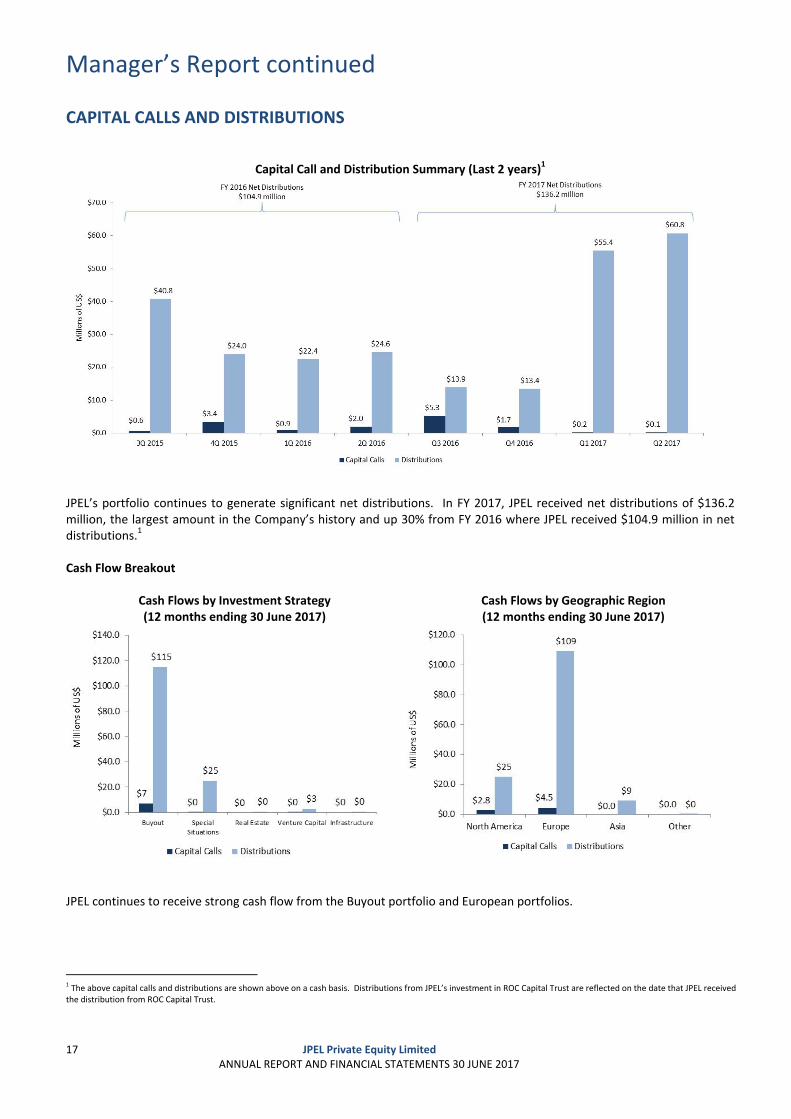
Capital Call and Distribution Summary (Last 2 years)1
JPEL’s portfolio continues to generate significant net distributions. In FY 2017, JPEL received net distributions of $136.2 million, the largest amount in the Company’s history and up 30% from FY 2016 where JPEL received $104.9 million in net distributions.1 Cash Flow Breakout
Cash Flows by Investment Strategy(12 months ending 30 June 2017)
Cash Flows by Geographic Region(12 months ending 30 June 2017)
JPEL continues to receive strong cash flow from the Buyout portfolio and European portfolios.
1 The above capital calls and distributions are shown above on a cash basis. Distributions from JPEL’s investment in ROC Capital Trust are reflected on the date that JPEL received the distribution from ROC Capital Trust.
Manager’s Report continued
18 JPEL Private Equity Limited
ANNUAL REPORT AND FINANCIAL STATEMENTS 30 JUNE 2017
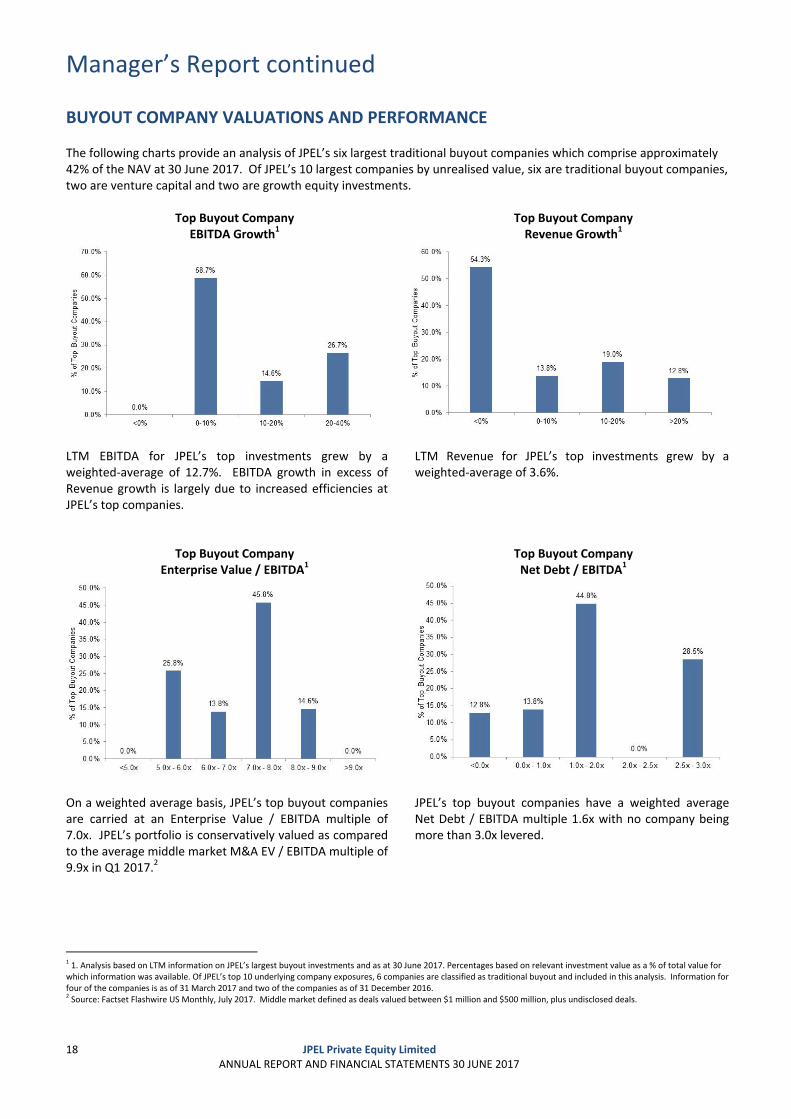
BUYOUT COMPANY VALUATIONS AND PERFORMANCE The following charts provide an analysis of JPEL’s six largest traditional buyout companies which comprise approximately 42% of the NAV at 30 June 2017. Of JPEL’s 10 largest companies by unrealised value, six are traditional buyout companies, two are venture capital and two are growth equity investments.
Top Buyout Company EBITDA Growth1
Top Buyout Company Revenue Growth1
LTM EBITDA for JPEL’s top investments grew by a weighted‐average of 12.7%. EBITDA growth in excess of Revenue growth is largely due to increased efficiencies at JPEL’s top companies.
LTM Revenue for JPEL’s top investments grew by a weighted‐average of 3.6%.
Top Buyout Company Enterprise Value / EBITDA1
Top Buyout Company Net Debt / EBITDA1
On a weighted average basis, JPEL’s top buyout companies are carried at an Enterprise Value / EBITDA multiple of 7.0x. JPEL’s portfolio is conservatively valued as compared to the average middle market M&A EV / EBITDA multiple of 9.9x in Q1 2017.2
JPEL’s top buyout companies have a weighted average Net Debt / EBITDA multiple 1.6x with no company being more than 3.0x levered.
1 1. Analysis based on LTM information on JPEL’s largest buyout investments and as at 30 June 2017. Percentages based on relevant investment value as a % of total value for which information was available. Of JPEL’s top 10 underlying company exposures, 6 companies are classified as traditional buyout and included in this analysis. Information for four of the companies is as of 31 March 2017 and two of the companies as of 31 December 2016. 2 Source: Factset Flashwire US Monthly, July 2017. Middle market defined as deals valued between $1 million and $500 million, plus undisclosed deals.
Manager’s Report continued
19 JPEL Private Equity Limited
ANNUAL REPORT AND FINANCIAL STATEMENTS 30 JUNE 2017
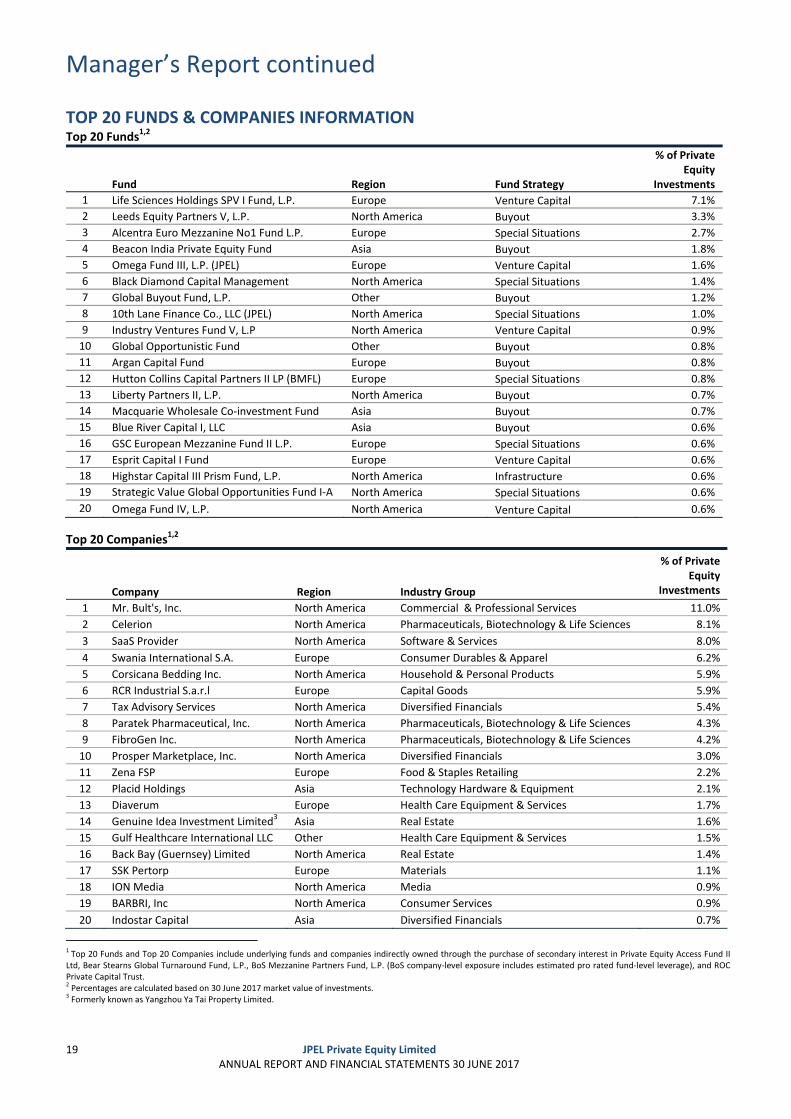
TOP 20 FUNDS & COMPANIES INFORMATION Top20mark Top 20 Funds1,2
Fund Region Fund Strategy
% of Private Equity
Investments
1 Life Sciences Holdings SPV I Fund, L.P. Europe Venture Capital 7.1%
2 Leeds Equity Partners V, L.P. North America Buyout 3.3%
3 Alcentra Euro Mezzanine No1 Fund L.P. Europe Special Situations 2.7%
4 Beacon India Private Equity Fund Asia Buyout 1.8%
5 Omega Fund III, L.P. (JPEL) Europe Venture Capital 1.6%
6 Black Diamond Capital Management North America Special Situations 1.4%
7 Global Buyout Fund, L.P. Other Buyout 1.2%
8 10th Lane Finance Co., LLC (JPEL) North America Special Situations 1.0%
9 Industry Ventures Fund V, L.P North America Venture Capital 0.9%
10 Global Opportunistic Fund Other Buyout 0.8%
11 Argan Capital Fund Europe Buyout 0.8%
12 Hutton Collins Capital Partners II LP (BMFL) Europe Special Situations 0.8%
13 Liberty Partners II, L.P. North America Buyout 0.7%
14 Macquarie Wholesale Co‐investment Fund Asia Buyout 0.7%
15 Blue River Capital I, LLC Asia Buyout 0.6%
16 GSC European Mezzanine Fund II L.P. Europe Special Situations 0.6%
17 Esprit Capital I Fund Europe Venture Capital 0.6%
18 Highstar Capital III Prism Fund, L.P. North America Infrastructure 0.6%
19 Strategic Value Global Opportunities Fund I‐A North America Special Situations 0.6%
20 Omega Fund IV, L.P. North America Venture Capital 0.6%
Top 20 Companies1,2
Company Region Industry Group
% of Private Equity
Investments
1 Mr. Bult's, Inc. North America Commercial & Professional Services 11.0%
2 Celerion North America Pharmaceuticals, Biotechnology & Life Sciences 8.1%
3 SaaS Provider North America Software & Services 8.0%
4 Swania International S.A. Europe Consumer Durables & Apparel 6.2%
5 Corsicana Bedding Inc. North America Household & Personal Products 5.9%
6 RCR Industrial S.a.r.l Europe Capital Goods 5.9%
7 Tax Advisory Services North America Diversified Financials 5.4%
8 Paratek Pharmaceutical, Inc. North America Pharmaceuticals, Biotechnology & Life Sciences 4.3%
9 FibroGen Inc. North America Pharmaceuticals, Biotechnology & Life Sciences 4.2%
10 Prosper Marketplace, Inc. North America Diversified Financials 3.0%
11 Zena FSP Europe Food & Staples Retailing 2.2%
12 Placid Holdings Asia Technology Hardware & Equipment 2.1%
13 Diaverum Europe Health Care Equipment & Services 1.7%
14 Genuine Idea Investment Limited3 Asia Real Estate 1.6%
15 Gulf Healthcare International LLC Other Health Care Equipment & Services 1.5%
16 Back Bay (Guernsey) Limited North America Real Estate 1.4%
17 SSK Pertorp Europe Materials 1.1%
18 ION Media North America Media 0.9%
19 BARBRI, Inc North America Consumer Services 0.9%
20 Indostar Capital Asia Diversified Financials 0.7%
1 Top 20 Funds and Top 20 Companies include underlying funds and companies indirectly owned through the purchase of secondary interest in Private Equity Access Fund II Ltd, Bear Stearns Global Turnaround Fund, L.P., BoS Mezzanine Partners Fund, L.P. (BoS company‐level exposure includes estimated pro rated fund‐level leverage), and ROC Private Capital Trust. 2 Percentages are calculated based on 30 June 2017 market value of investments. 3 Formerly known as Yangzhou Ya Tai Property Limited.
Manager’s Report continued
20 JPEL Private Equity Limited
ANNUAL REPORT AND FINANCIAL STATEMENTS 30 JUNE 2017
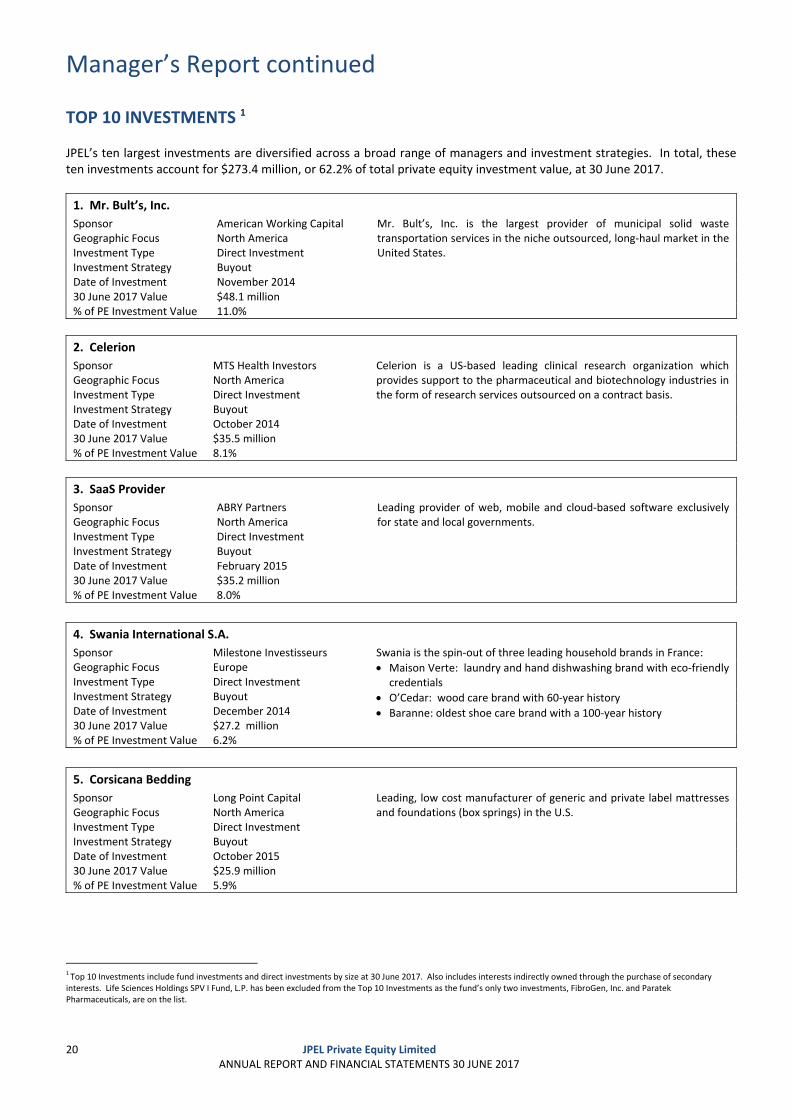
TOP 10 INVESTMENTS 1 JPEL’s ten largest investments are diversified across a broad range of managers and investment strategies. In total, these ten investments account for $273.4 million, or 62.2% of total private equity investment value, at 30 June 2017.
1. Mr. Bult’s, Inc.
Sponsor American Working Capital Mr. Bult’s, Inc. is the largest provider of municipal solid waste transportation services in the niche outsourced, long‐haul market in the United States.
Geographic Focus North America Investment Type Direct Investment Investment Strategy Buyout Date of Investment November 2014 30 June 2017 Value $48.1 million % of PE Investment Value 11.0%
2. Celerion
Sponsor MTS Health Investors Celerion is a US‐based leading clinical research organization which provides support to the pharmaceutical and biotechnology industries in the form of research services outsourced on a contract basis.
Geographic Focus North America Investment Type Direct Investment Investment Strategy Buyout Date of Investment October 2014 30 June 2017 Value $35.5 million % of PE Investment Value 8.1%
3. SaaS Provider
Sponsor ABRY Partners Leading provider of web, mobile and cloud‐based software exclusively for state and local governments. Geographic Focus North America
Investment Type Direct Investment Investment Strategy Buyout Date of Investment February 2015 30 June 2017 Value $35.2 million % of PE Investment Value 8.0%
4. Swania International S.A.
Sponsor Milestone Investisseurs Swania is the spin‐out of three leading household brands in France:
Maison Verte: laundry and hand dishwashing brand with eco‐friendly credentials
O’Cedar: wood care brand with 60‐year history Baranne: oldest shoe care brand with a 100‐year history
Geographic Focus Europe Investment Type Direct Investment Investment Strategy Buyout Date of Investment December 2014 30 June 2017 Value $27.2 million % of PE Investment Value 6.2%
5. Corsicana Bedding
Sponsor Long Point Capital Leading, low cost manufacturer of generic and private label mattresses and foundations (box springs) in the U.S. Geographic Focus North America
Investment Type Direct Investment Investment Strategy Buyout Date of Investment October 2015 30 June 2017 Value $25.9 million % of PE Investment Value 5.9%
1 Top 10 Investments include fund investments and direct investments by size at 30 June 2017. Also includes interests indirectly owned through the purchase of secondary interests. Life Sciences Holdings SPV I Fund, L.P. has been excluded from the Top 10 Investments as the fund’s only two investments, FibroGen, Inc. and Paratek Pharmaceuticals, are on the list.
Manager’s Report continued
21 JPEL Private Equity Limited
ANNUAL REPORT AND FINANCIAL STATEMENTS 30 JUNE 2017
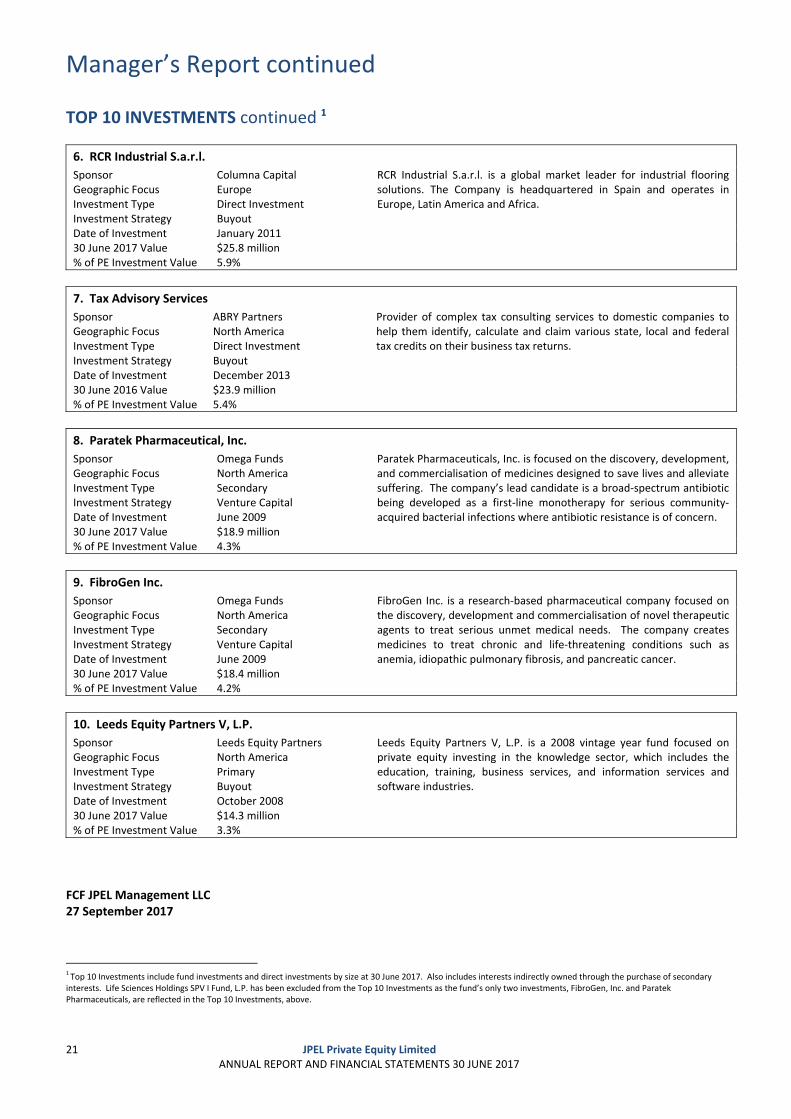
TOP 10 INVESTMENTS continued 1 Top10mark
6. RCR Industrial S.a.r.l.
Sponsor Columna Capital RCR Industrial S.a.r.l. is a global market leader for industrial flooring solutions. The Company is headquartered in Spain and operates in Europe, Latin America and Africa.
Geographic Focus Europe Investment Type Direct Investment Investment Strategy Buyout Date of Investment January 2011 30 June 2017 Value $25.8 million % of PE Investment Value 5.9%
7. Tax Advisory Services
Sponsor ABRY Partners Provider of complex tax consulting services to domestic companies to help them identify, calculate and claim various state, local and federal tax credits on their business tax returns.
Geographic Focus North America Investment Type Direct Investment Investment Strategy Buyout Date of Investment December 2013 30 June 2016 Value $23.9 million % of PE Investment Value 5.4%
8. Paratek Pharmaceutical, Inc.
Sponsor Omega Funds Paratek Pharmaceuticals, Inc. is focused on the discovery, development, and commercialisation of medicines designed to save lives and alleviate suffering. The company’s lead candidate is a broad‐spectrum antibiotic being developed as a first‐line monotherapy for serious community‐acquired bacterial infections where antibiotic resistance is of concern.
Geographic Focus North America Investment Type Secondary Investment Strategy Venture Capital Date of Investment June 2009 30 June 2017 Value $18.9 million % of PE Investment Value 4.3%
9. FibroGen Inc.
Sponsor Omega Funds FibroGen Inc. is a research‐based pharmaceutical company focused on the discovery, development and commercialisation of novel therapeutic agents to treat serious unmet medical needs. The company creates medicines to treat chronic and life‐threatening conditions such as anemia, idiopathic pulmonary fibrosis, and pancreatic cancer.
Geographic Focus North America Investment Type Secondary Investment Strategy Venture Capital Date of Investment June 2009 30 June 2017 Value $18.4 million % of PE Investment Value 4.2%
10. Leeds Equity Partners V, L.P.
Sponsor Leeds Equity Partners Leeds Equity Partners V, L.P. is a 2008 vintage year fund focused on private equity investing in the knowledge sector, which includes the education, training, business services, and information services and software industries.
Geographic Focus North America Investment Type Primary Investment Strategy Buyout Date of Investment October 2008 30 June 2017 Value $14.3 million % of PE Investment Value 3.3%
FCF JPEL Management LLC 27 September 2017
1 Top 10 Investments include fund investments and direct investments by size at 30 June 2017. Also includes interests indirectly owned through the purchase of secondary interests. Life Sciences Holdings SPV I Fund, L.P. has been excluded from the Top 10 Investments as the fund’s only two investments, FibroGen, Inc. and Paratek Pharmaceuticals, are reflected in the Top 10 Investments, above.
Directors’ Report
22 JPEL Private Equity Limited
ANNUAL REPORT AND FINANCIAL STATEMENTS 30 JUNE 2017
INTRODUCTION The Directors present their annual report together with the audited financial statements of JPEL Private Equity Limited (the “Company”) for the year ended 30 June 2017 (the “Financial Year”). The financial summary is set out on page 1. A detailed review of activities is contained in the Manager’s Report on pages 14 to 21.
DIVIDENDS The Directors do not propose the payment of a dividend for the year ended 30 June 2017.
PRINCIPAL ACTIVITY The Company is a closed ended investment fund incorporated as a limited liability company in Guernsey under The Companies (Guernsey) Law, 2008, authorised under The Authorised Closed‐Ended Investment Schemes Rules, 2008 and is regulated by the Guernsey Financial Services Commission.
The Company's primary activity is that of an investment company investing in private equity funds, unquoted and public companies and subsidiaries.
GOING CONCERN The Directors have examined significant areas of possible credit and liquidity risk and have satisfied themselves that no material uncertainties exist. The Directors have taken into consideration the Company’s expected cash flows for a period exceeding twelve months from the date of approval of the financial statements, and have considered outstanding commitments, on‐going fees, and the redemption of the 2017 zero dividend preference shares. Given the change to the Company’s investment policy, its current cash position, and the sum undrawn from the Lloyds facility which has been extended until January 2018 (see note 14 of the audited financial statements for further details on the loan facility), combined with the expected distributions over the same period, the Directors believe the Company has adequate resources to continue in operational existence for a period of at least twelve months from the date of approval of the financial statements. After due consideration of this, the Directors believe it is appropriate to adopt the going concern basis in preparing the financial statements.
CORPORATE GOVERNANCE Principles Statement The Directors are committed to high standards of corporate governance and have made it the Company’s policy to comply with best practice in this area, insofar as the Directors believe it is relevant and appropriate to the Company, and in compliance with the ‘UK Corporate Governance Code’ (i.e. the April 2016 edition of the code of best practice published by the Financial Reporting Council (FRC), in respect of a financial year beginning on or after 17 June 2016). The complete UK Corporate Governance Code can be viewed on the Financial Reporting Council website at http://www.frc.org.uk.
The Company is a member of the Association of Investment Companies (the “AIC”). The Directors have considered the principles and recommendations of the Association of Investment Companies Code of Corporate Governance (“AIC Code”), dated July 2016, by reference to the Association of Investment Companies Corporate Governance Guide for Investment Companies (“AIC Guide”). The AIC Code, as explained by the AIC Guide, addresses all the principles set out in the UK Corporate Governance Code, as well as setting out additional principles and recommendations on issues that are of specific relevance to the Company. The Directors consider reporting against principles and recommendations of the AIC Code, by reference to the AIC Guide (which incorporates the UK Corporate Governance Code), will provide better information to shareholders.
Directors’ Report continued
23 JPEL Private Equity Limited
ANNUAL REPORT AND FINANCIAL STATEMENTS 30 JUNE 2017
CORPORATE GOVERNANCE continued Principles Statement continued The Company has, throughout the financial year, complied with the provisions of the AIC Code and the UK Corporate Governance Code, except for the UK Corporate Governance Code provisions relating to:
• The role of the chief executive; • The appointment of a Senior Independent Director; • Executive Directors’ remuneration; • Appointment and re‐election of Directors; • The need for an internal audit function; and • The whistle blowing policy.
For the reasons set out in the AIC Guide, and in the preamble to the UK Corporate Governance Code, the Board considers the above provisions not to be relevant to the Company because all administrative functions are outsourced to service providers. However, the Board understands its corporate governance responsibilities in relation to bribery, corruption, whistle blowing and cybercrime and as such, the Board reviews the relevant policies of those providers.
All of the Company’s day‐to‐day management and administrative functions are outsourced to third parties, namely the Manager and the Administrator. This means the Company has no internal operations or employees with it being an externally managed investment company and the Directors are all non‐executive. The Company relies on the procedures in place at the Manager and the Administrator for whistle blowing procedures.
The Guernsey Financial Services Commission has a standing Code of Corporate Governance for the Finance Sector that was issued in 2011 (the “Guernsey Code”). The Guernsey Code states that “Companies which report against the UK Corporate Governance Code or the AIC Code are also deemed to comply with the Code”. As a company with a Premium Listing on the London Stock Exchange, the Company is subject to the Disclosure Rules and Transparency Rules and the UK Corporate Governance Code but uses the AIC code instead as a member of the AIC and considers this appropriate. As an AIC member domiciled in Guernsey which reports using the AIC Code, the Company is not required to report separately using the Guernsey Code.
Role of the Board The Board has determined that its role is to consider and determine the following principal matters which it considers are of strategic importance to the Company:
• Review the overall objectives for the Company as described in the Company‘s amended investment policy, the implementation of Phase III of the Company’s Strategy Initiatives and set the Company’s strategy for fulfilling those objectives within an appropriate risk framework;
• Consider any shifts in strategy that it considers may be appropriate in light of market conditions; • Appoint the Manager, Administrator and other appropriately skilled service providers and monitor their
effectiveness through regular reports and meetings;; • Review key elements of the Company’s performance including NAV, portfolio company realisations and payment of
mandatory redemptions; • Review the capital structure of the Company including consideration of an appropriate use of gearing for the
Company; • Continue to review cost‐cutting initiatives; • Periodically meet with shareholders; and • Evaluate its own performance and that of the individual Directors.
Board Decisions At its Board meetings, the Board ensures that all the strategic matters listed under ‘Role of the Board’ are considered and resolved by the Board. While issues associated with implementing the Company’s strategy are generally considered by the Board to be non‐strategic in nature and are delegated either to the Manager or the Administrator, the Board considers that there are implementation matters that are significant enough to be of strategic importance to the Company and should be reserved to the Board.
Directors, Rotation of Directors and Directors Tenure The Directors who served during the year are listed below: Sean Hurst (Chairman, Independent Non‐Executive) (Appointed Director 28 October 2016, Appointed Chairman 8 November 2016) Trevor Ash (Independent Non‐Executive) (Retired as Chairman 8 November 2016, retired as a Director 26 September 2017)
Directors’ Report continued
24 JPEL Private Equity Limited
ANNUAL REPORT AND FINANCIAL STATEMENTS 30 JUNE 2017
CORPORATE GOVERNANCE continued Directors, Rotation of Directors and Directors Tenure continued John Loudon (Independent Non‐Executive) (Appointed 28 April 2005) Christopher Paul Spencer (Independent Non‐Executive) (Appointed 28 April 2005) Anthony Dalwood (Independent Non‐Executive) (Appointed 20 February 2015) Gregory Getschow (Retired as a Director 28 October 2016)
Mr Sean Hurst was appointed as a Non‐Executive Independent Director on 28 October 2016 and as Independent Chairman of the Board with effect from 8 November 2016. He was a Co‐founder, Director and CIO of Albion Asset Management a French regulated asset management company for 4 years. He is an experienced multi‐jurisdictional Director including roles at an AIM‐listed fund and numerous offshore and UCITS hedge funds. In addition to advising companies on launching both offshore and onshore investment funds, Mr. Hurst is a current Non‐Executive Director at ARC Capital Holdings Ltd and the Charity and Investment Merger Arbitrage Fund.
Mr. Trevor Charles Ash was a Non‐Executive Independent Director of the Company. He spent 27 years with the Rothschild Group, retiring in May 1999 as Managing Director of the Guernsey‐based Rothschild Asset Management (C.I.) Limited and Non Executive Director of Rothschild Asset Management Limited in London. He also recently retired as a Non‐Executive Director of N M Rothschild and Sons (C.I.) Limited, the banking arm of the Rothschild Group in the Channel Islands. In retirement Mr. Ash has retained a number of Directorships of the Rothschild Group and joined the Boards of a number of offshore funds managed by groups including Merrill Lynch, Thames River Capital, Dexion Capital Management and ING. Mr. Ash is a Fellow of the Securities Institute of England and Wales. Mr Ash retired as member of the Board 26 September 2017. Mr. John Loudon is a Non‐Executive Independent Director of the Company. He has been Chairman of Caneminster Ltd., a British investment company, since June 1988. Mr. Loudon serves as a director of GEMS Oriental & General Fund II Limited and GEMS Oriental & General Fund III Limited. Previously, Mr. Loudon was a Managing Director of N.M. Rothschild & Sons from 1970 to 1988 and the Chairman of Warrier International Limited from 1988 to 1991. Mr. Loudon also served as a Director of Exel Group plc from 1992 to 2004, XL Capital Ltd from 1992 to 2005 and Derby Trust plc from 1989 to 2003. Mr. Christopher Spencer is a Non‐Executive Independent Director of the Company and Chairman of the Audit Committee. He qualified as a chartered accountant in London in 1975. Following two years in Bermuda he moved to Guernsey where he now holds residency. Mr. Spencer, who specialised in audit and fiduciary work, was Managing Partner/Director of Pannell Kerr Forster (Guernsey) Limited from 1990 until his retirement in May 2000. Mr. Spencer is a member of the AIC Offshore Committee, a past President of the Guernsey Society of Chartered and Certified Accountants and a past Chairman of the Guernsey Branch of the Institute of Directors. Mr. Spencer also sits on the board of directors of John Laing Infrastructure Fund Limited, SQN Asset Finance Income Fund Limited, each of which is listed on the London Stock Exchange and also Summit Germany Limited which is listed on AIM. Mr. Spencer is also a member of the board of directors of a number of unlisted companies, details of which can be found in the latest prospectus of the Company which can be found at the investor section of the Company’s website. Mr. Anthony Dalwood is a Non‐Executive Independent Director of the Company, with effect from 20 February 2015. He was formerly Chairman of SVG Investment Managers and CEO of SVG Advisers, the global private equity funds business and manager of $5b billion in AUM. He established the public equities business for Schroder Ventures (London) Limited. Prior to this he was a Director at UBS Global Asset Management (formerly Phillips & Drew Fund Management) where he was a member of the UK Equity Investment Committee and responsible for managing over £1.5 billion of UK equities. He is currently CEO of Gresham House plc, and a Board director of Branton Capital and the London Pensions Fund Authority. Mr. Dalwood has an honours degree in Economics & Accounting from Bristol University, a degree in Management Studies from Cambridge University (Judge Institute) and is a member of the CFA Institute.
Mr. Gregory Getschow retired as a Director of the Company on 28 October 2016. During his time on the Board of Directors of the Company, Mr. Getschow was also a managing director in the Credit business of Fortress.
The Directors hold no significant shareholdings in any investment in which the Company holds an interest.
Directors’ Report continued
25 JPEL Private Equity Limited
ANNUAL REPORT AND FINANCIAL STATEMENTS 30 JUNE 2017
CORPORATE GOVERNANCE continued Appointment and Rotation
The Directors have the power to appoint any person at any time to the Board in accordance with the Company’s Articles of Incorporation and taking into consideration Guernsey Company Law, the UK Code of Corporate Governance, and the AIC Code of Corporate Governance. Any new Board members must be re‐elected at the next AGM following their appointment. All Non‐Executive Directors are put forward for re‐election on a three year rotational basis. On 28 October 2016, Gregory Getschow retired as a Director and Sean Hurst was appointed to the Board as an Independent Non‐Executive Director.
The UK Corporate Governance Code recommends that Directors should be appointed for a specified period and that non‐executive directors who have served longer than nine years should be subject to annual re‐election. The Board considers that, given its size and the size of the Company, it would not be appropriate for Directors’ appointments to comply with this requirement as all Directors are non‐executive and their respective appointments can be terminated at any time without penalty.
No Director has a service contract with the Company. The Company did not use open advertising to appoint the Directors of the Company and all appointments are subject to re‐election.
The Board recognises the benefits of diversity amongst itself, and all of its service providers with regard to aspects such as, for instance, age, gender, or educational and professional backgrounds. The Board believes the Company has adequate diversity among the service providers to the Company. When engaging any new providers the Board ensures that a diverse group of candidates is considered. There were no new providers engaged during the year.
Board Meetings The Board meets quarterly and as required from time to time to consider specific issues reserved to the Board. At the quarterly meetings it considers papers circulated seven days in advance including reports provided by the Manager and the Administrator. The Manager’s report comments on:
The investment market including recommendations for any changes in strategy that the Manager considers may be appropriate;
Performance of the Company’s portfolio and key asset management initiatives;
Transactional activity undertaken over the previous quarter and being contemplated for the future; and
The Company’s financial position including its relationship with its bankers and lenders.
The Administrator provides a compliance report at each quarterly meeting. These reports enable the Board to assess the success with which the Company’s investment strategy and other associated matters are being implemented and also to consider any relevant risks and how they should properly be managed.
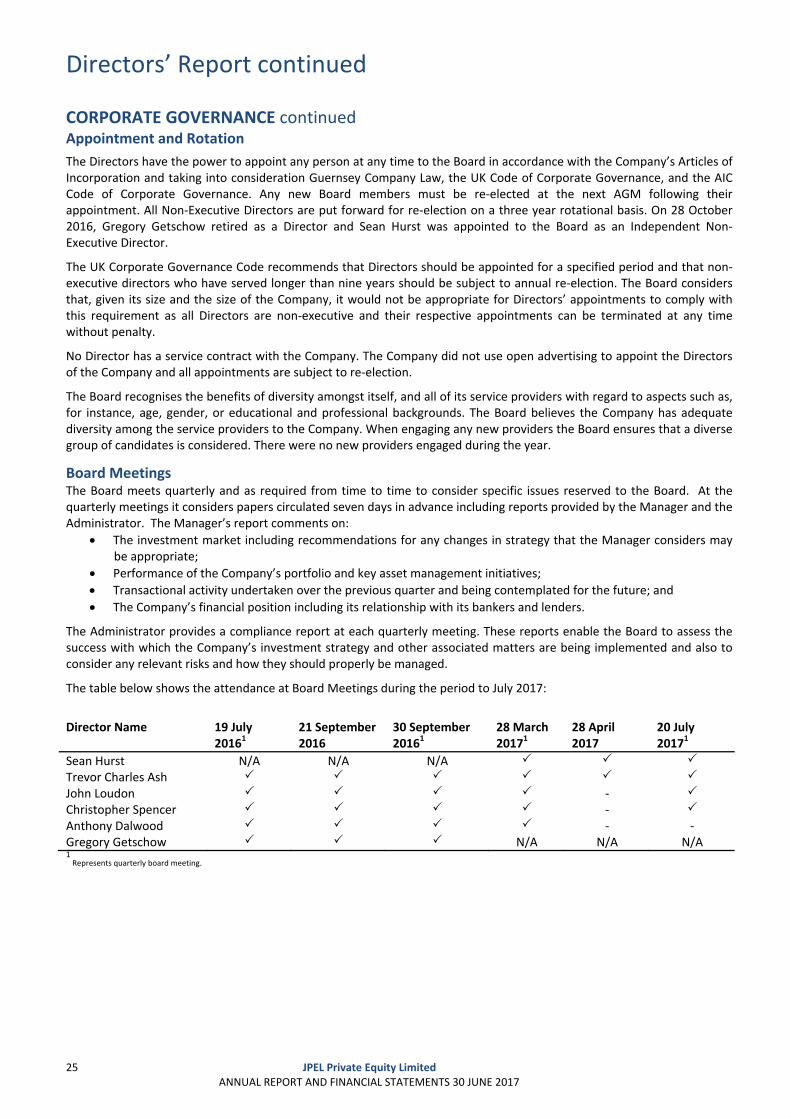
The table below shows the attendance at Board Meetings during the period to July 2017:
Director Name 19 July 20161
21 September 2016
30 September 20161
28 March 20171
28 April 2017
20 July 20171
Sean Hurst N/A N/A N/A
Trevor Charles Ash
John Loudon ‐
Christopher Spencer ‐
Anthony Dalwood ‐ ‐Gregory Getschow N/A N/A N/A1 Represents quarterly board meeting.
Directors’ Report continued
26 JPEL Private Equity Limited
ANNUAL REPORT AND FINANCIAL STATEMENTS 30 JUNE 2017
CORPORATE GOVERNANCE continued Board Meetings continued
In addition to quarterly meetings, the Board has also met on several occasions during the year to approve various corporate actions. The Board also uses these meetings to evaluate its own performance by recognising the strengths and weaknesses of the individual Directors as well as the effectiveness of the Board as a whole. It has not always been possible for all Directors to attend these meetings. The Company maintains liability insurance for its Directors and Officers although the Company has no employees and none of its Directors are executive.
The Chairman is responsible for leadership and ensuring the Board’s effectiveness in all aspects of its role. The Board discusses quarterly the training and development needs of the Directors, and assess whether their balance of skills, experience, diversity, independence and knowledge are sufficient in fulfilling their duties. The Chairman ensures that there is adequate time available for discussion of all agenda items and works with the Board and Manager to promote a culture of openness, support and co‐operation.
The Board has access to accurate, timely and clear information about the Company in order to enable it to discharge its duties. The Company Secretary, Augentius (Guernsey) Limited, ensures that Board procedures are complied with and that good information flows between the Board and the Manager. The Board has the right to access independent, professional advice at the Company’s expense when deemed necessary.
Directors’ Interests Other than Mr. Spencer who, as at 30 June 2017, owns 23,454 US$ Equity Shares, Mr Hurst who, as at 30 June 2017 owns 6,501 US$ Equity Shares and Mr. Dalwood who, as at 30 June 2017, owns 99,646 US$ Equity Shares, no other Director holds directly or indirectly shares in the Company. All Directors are independent of the Company.
Audit Committee The Audit Committee consists of Trevor Ash, John Loudon and Christopher Spencer, who is currently the chairman. All members served on the committee throughout the year. The members have relevant and recent commercial and financial knowledge, and experience to satisfy the provisions of the AIC Code by virtue of their holding or having held various executive and Non‐Executive roles in other financial and asset management organisations. The Board is satisfied that the Audit Committee as a whole has competence relevant to the private equity sector, in which the Company operates. Following Mr. Ash’s retirement as a member of the Board on 26 September 2017, he will be replaced by another Board member.
The Audit Committee operates within clearly defined terms of reference in order to assist the Board in discharging its duties and responsibilities for financial reporting, internal control and the appointment and remuneration of an independent external auditor. In summary, the Audit Committee’s main functions are:
To make recommendations on the appointment of the Company’s external auditors, the scope of the audit, the audit fee, and the tenure of the external auditors and tendering process;
As the day‐to‐day management and administrative functions are outsourced to third parties there is no requirement for an internal audit function. Consequently the Audit Committee reviews and monitors reports on the internal control systems and risk management systems of the third parties on which the Company is reliant;
To review the annual reports and accounts in order to assess whether they represent a fair, balanced, and understandable view of the Company’s position and performance, business model, and strategy;
To act upon any significant financial reporting issues and judgements that are made in connection with the preparation of the Company’s financial statements;
To meet with the external auditor and assess the effectiveness of the entire audit process, and to review the findings of the external auditor, as well as looking at the proposed audit programme;
To monitor the integrity of the semi, and annual, financial statements in order to review the actions and judgements of the Manager, challenging decisions if necessary; and
To continually monitor the independence, objectivity, effectiveness, qualification, and resources of the external auditor.
Directors’ Report continued
27 JPEL Private Equity Limited
ANNUAL REPORT AND FINANCIAL STATEMENTS 30 JUNE 2017
CORPORATE GOVERNANCE continued Report on the Audit Committee’s activities during the year
During the year the Audit Committee discharged its responsibilities under its terms of reference by monitoring the integrity of the financial statements and formal announcements relating to the Company’s financial performance, and reviewing, and challenging where necessary, the actions and judgements of the Manager and any other relevant entities, in relation to the financial statements before submission to the Board, paying particular attention to:
Reviewing the draft 2017 financial statements prior to discussion and approval by the Board, and reviewing the external auditor’s reports, both oral and written thereon;
Receiving and reviewing confirmations of external auditor independence and approving the terms of engagement and proposed audit fees for the 2017 audit. Also recommending the re‐appointment of the external auditor for 2017 and considering future tender requirements.
Critical accounting policies and practices and any changes in them, as they relate to the results of the Company;
Decisions requiring a major element of judgement including the impact of adopting any acceptable alternative accounting treatment;
The extent to which the financial statements are affected by any unusual transactions in the year and how they are disclosed;
Reviewing and understanding the Company’s risk management framework;
The clarity of disclosures;
The going concern assumption;
Compliance with Accounting Standards;
Compliance with Financial Conduct Authority and other legal, regulatory or listing requirements.
During its review of the Company's financial statements for the year ended 30 June 2017, the Audit Committee reviewed the following:
Valuation of investments The Company has interests in various different types of investments including: investments in subsidiaries, investments in unquoted funds, direct investments in unquoted companies and investments in debt securities.
Investments in subsidiaries and investments in unquoted funds are valued at the net asset value as reported by the general partner and then adjusted if necessary. During the year, the Manager adjusted the values of Omega Fund III L.P., Omega Fund IV L.P. and Life Sciences Holdings SPV I Fund L.P. to account for publicly traded positions.
The Company’s debt investments were made in conjunction with a corresponding equity investment and so long as the general partner provides the Company with a positive net asset value for their equity investment, the Company takes the position that the debt investment is not impaired.
Direct investments in unquoted companies are generally valued at fair value as reported by the respective management. To limit any risks that are associated with these valuations they are reviewed by the Manager and then adjusted where necessary. No adjustments were made during the period.
The Audit Committee concluded that the Manager has the appropriate control processes in place, in respect of valuation of investments, and that they are reviewed on a regular basis so that all valuations are reflected at fair value.
The Audit Committee has reviewed the contents of this year’s annual report and financial statements and advised the Board that, in its view, the report is fair, balanced and understandable and provides the information necessary for Shareholders to assess the Company’s position and performance, business model and strategy.
Directors’ Report continued
28 JPEL Private Equity Limited
ANNUAL REPORT AND FINANCIAL STATEMENTS 30 JUNE 2017
CORPORATE GOVERNANCE continued Remuneration Committee
The Board as a whole fulfils the function of a remuneration committee in relation to the setting and periodic review of the fees of the Directors and the Chairman, taking into account, amongst other factors, prevailing market conditions and the need to attract to the Board, and retain thereafter, suitable persons. The Board considers that, given its size and the size of the Company, it would not be appropriate to establish a separate remuneration committee. Directors’ remunerations reflect their duties, responsibilities and the value of their time spent.
Mr. Ash and Mr. Hurst are each entitled to receive Directors fees of £40,000 ($52,100) per annum, Mr. Loudon, Mr. Spencer and Mr. Dalwood are each entitled to receive Directors fees of £30,000 ($39,075) per annum. The cap on total Directors remuneration was unchanged at £250,000 as at 30 June 2017.
During the year no further payments were made to each director for additional services provided.
Mr. Getschow is an employee of Fortress Investment Group LLC, the ultimate parent company of FCF JPEL Management LLC and waived his right to Directors’ fees during his tenure.
Nomination Committee The Board as a whole fulfils the function of a nomination committee. The Board considers that, given its size and the size of the Company, it would not be appropriate to establish a separate nomination committee.
Management Engagement Committee The Board as a whole fulfils the function of a management engagement committee. The Board considers that, given its size and the size of the Company, it would not be appropriate to establish a separate management engagement committee.
The Directors believe that the Manager, a subsidiary of Fortress Investment Group LLC, has performed consistently since being appointed as the Manager of the Company. As such, it is the view of the Independent Directors that it is in the best interests of the Shareholders to continue with the current appointment of the Manager under the terms agreed.
Internal Controls The Directors have reviewed the effectiveness of the Company’s system of internal financial and operating controls during the fiscal year and found they were operating as expected. The Company’s system of internal control is substantially reliant on the Manager’s and the Administrator’s internal controls and their internal audit given all administrative functions are outsourced.
The Board monitors and considers risk management and internal financial and operating controls on a regular basis during the year although such a system can only provide reasonable and not absolute assurance against material misstatement or loss, as it is designed to manage rather than eliminate risk of failure.
The key elements designed to provide effective internal financial and operating controls are as follows: Financial reporting – A regular review of relevant financial data including NAV calculations and performance
projections;
Management and Administration Agreements – Contractual documentation with appropriately regulated entities which clearly describes responsibilities for the two principal service providers;
Management Systems – The Manager’s system of internal controls is based on a formal investment committee and clear lines of responsibility and reporting;
Administrator’s Systems ‐ Augentius (Guernsey) Limited (“Augentius” or the “Administrator”) is part of the largest independent Private Equity and Real Estate Administrator in the world. The Administrator’s systems of internal controls are based on formalised processes tailored specifically to JPEL. In addition, every transaction and report is reviewed by at least two qualified Accountants before release; and
Administrator’s Technology ‐ Augentius uses SunGard Investran as its core accounting system and benefits from structured change control processes and clear audit trail functionality. Investran as a system is recognised as a leading accounting technology for Private Equity.
Additionally, during May 2016, Trevor Ash and Chris Spencer travelled to New York to visit the Manager and performed due diligence on the various systems, processes and controls in place at Fortress.
Directors’ Report continued
29 JPEL Private Equity Limited
ANNUAL REPORT AND FINANCIAL STATEMENTS 30 JUNE 2017
CORPORATE GOVERNANCE continued Internal Controls continued
Administration and company secretarial services have been provided by Augentius, effective 13 August 2012. Consideration was given to the internal controls of the Administrator prior to appointment and will be assessed on an ongoing basis. The Company’s system of internal control is substantially reliant on the Manager’s and Augentius’ internal controls and their internal audit. During the period, an SSAE16 Type II report was completed over internal controls at Augentius for the period ended 30 September 2016. It is the view of the Directors that it is in the best interest of Shareholder’s to continue with the current appointment of the Administrator as all of their duties and responsibilities have been carried out successfully since their appointment.
Principal Financial and Operational risks and Uncertainties The Company, the Company’s investments and the underlying portfolio companies are materially affected by a variety of risks and uncertainties in the global financial markets and economic conditions throughout the world, including those which would threaten its business model, future performance, solvency or liquidity. These financial and operational risks and uncertainties include, but are not limited to, interest rates, currency, investment markets, credit, liquidity, investment managers, valuations, political, and regulatory. These factors are outside the Company’s control and may affect the level and volatility of securities prices, the amount of distributions received and the liquidity and value of investments in the portfolio.
The Company may be unable to mitigate its exposure to these conditions as efforts to manage its exposure may or may not be effective.
Principal financial risks and uncertainties The Board and the Manager consider principal financial risks to comprise market risk (including foreign exchange risk, interest rate risk and other price risk), credit risk and liquidity risk. Please refer to note 3 of the audited financial statements for a more detailed discussion of the principal financial risks and uncertainties, and how they are managed or mitigated.
Principal operational risks and uncertainties Operational risk is the risk of direct or indirect loss arising from a wide variety of causes associated with the processes, technology, and infrastructure supporting the Company’s operations either internally within the Company or externally at the Company’s service providers, and from external factors other than credit, market, and liquidity risks such as those arising from legal and regulatory requirements and generally accepted standards of investment management behaviour. Operational risks arise from all of the Company’s activities.
The Company’s objective is to manage operational risk so as to balance the limiting of financial losses and damage to its reputation, whilst achieving its investment objective of generating returns to investors.
The primary responsibility for the development and implementation of controls over operational risk rests with the Board of Directors. This responsibility is supported by the development of overall standards for the management of operational risk, which encompasses the controls and processes at the service providers and the establishment of service levels with the service providers, in the following areas:
• Requirements for appropriate segregation of duties between various functions, roles and responsibilities; • Requirements for the reconciliation and monitoring of transactions; • Compliance with regulatory and other legal requirements; • Documentation of controls and procedures; • Requirements for the periodic assessment of operational risks faced, and the adequacy of controls and procedures
to address the risks identified; • Contingency plans; • Ethical and business standards; and • Risk mitigation, including insurance where this is effective.
Directors’ Report continued
30 JPEL Private Equity Limited
ANNUAL REPORT AND FINANCIAL STATEMENTS 30 JUNE 2017
CORPORATE GOVERNANCE continued Principal Financial and Operational risks and Uncertainties continued Principal operational risks and uncertainties continued
The Company is also exposed to various other principal risks with respect to its financial assets. A summary of these risks is as follows:
(a) Valuation risk Valuations of the private equity investments incorporated in the Company’s reported Net Asset Value are made, in part, on valuation information provided by the managers of investments in the Company’s portfolio. If other factors lead the Manager to conclude that fair value provided by the underlying managers or general partners does not represent actual fair value, the Manager will adjust the value of the investment from the underlying managers and general partners’ estimate.
(b) Reliance on Manager Quality and execution of management is key to a successful business development. The Company will be relying on the Manager and its ability to evaluate investment opportunities and to further develop the Company’s investments. The Manager exercises a central role in the investment decision process. Accordingly, the returns of the Company will primarily depend on the performance and abilities of the Manager.
(c) Political and /or regulatory risk The Net Asset Value of the Company’s assets may be affected by uncertainties such as international political developments, changes in governmental policies, taxation, restrictions on foreign investment and currency repatriation, currency fluctuations and other developments in the laws and regulations of the countries in which the Company’s assets are invested.
The Directors’ assessment over the adequacy of the controls and processes in place at the service providers with respect to operational and other risks is carried out via regular discussions with the service providers and a review of the Administrator’s SSAE16 report on internal controls. Applying the framework described above, the Board is able to confirm that they have carried out a robust assessment of the principal risks facing the Company, including those which would threaten its business model, future performance, solvency or liquidity.
Manager The Manager’s key responsibilities include proposing an investment strategy to the Board, selecting investments for acquisition and disposal and arranging appropriate lending facilities. The Manager is also responsible for all issues pertaining to asset management. The Directors agree policies with the Manager covering key operational issues.
The Board reviews the performance of the Manager, including evaluation of performance and fees on an annual basis. The Board is satisfied that the continuing appointment of the Manager is in the interest of the Shareholders as a whole. The investment skills, performance, experience, and commitment are the key factors taken into account in reaching this decision.
Alternative Investment Fund Managers Directive (“AIFMD”) The Manager has determined that the Company is out of scope from the full Directive for the following reasons:
• The Company is a Non EU Alternative Investment Fund (Guernsey); • The Company’s investment decisions are made by a Non EU Alternative Investment Fund Manager, FCF JPEL
Management LLC; and • The Company is not currently marketing into the EU.
Directors’ Report continued
31 JPEL Private Equity Limited
ANNUAL REPORT AND FINANCIAL STATEMENTS 30 JUNE 2017
CORPORATE GOVERNANCE continued International Tax Reporting For the purposes of the US Foreign Account Tax Compliance Act (“FATCA”), the Company registered with the US Internal Revenue Service as a Guernsey reporting Foreign Financial Institution and received a Global Intermediary Identification Number (“GIIN”) X7WT1B.00000.LE.831.
The Common Reporting Standard (“CRS”) is a standard developed by the Organisation for Economic Co‐operation and Development (“OECD”) and is a global approach to the automatic exchange of tax information. Guernsey has now adopted the CRS which came into effect on 1 January 2016.
The Company is subject to Guernsey regulations and guidance based on the reciprocal information sharing Inter‐Governmental Agreements (“IGAs”) which Guernsey has entered into with the UK and the US, and the various multilateral or bilateral agreements with other countries which support the CRS. The new CRS regulations superseded the obligations under the UK IGA in respect of reportable UK investors. The first report for CRS was due to be made to the Director of Income Tax by 30 June 2017. The Board has taken the necessary actions to ensure that the Company is compliant with Guernsey regulations and guidance in this regard.
Secretary Augentius (Guernsey) Limited held the office of Company Secretary through 30 June 2017. With effect from 5 December 2016, the registered office of the Company is Ground Floor, Cambridge House, Le Truchot, St Peter Port, Guernsey, GY1 1WD.
Independent Auditor PricewaterhouseCoopers CI LLP was re‐appointed as independent external auditor during the year. The Board has reviewed the effectiveness of the external auditor and considers them to be independent, and is confident they take the necessary steps in order to ensure their continued independence and objectivity. The Board feels the external audit work is done to an excellent standard, is in a timely manner, and any issues are communicated in a clear and concise way in order to gain a prompt result. A resolution to reappoint PricewaterhouseCoopers CI LLP as independent external auditor to the Company will be proposed at the forthcoming Annual General Meeting. PricewaterhouseCoopers CI LLP does not perform any non‐audit services for the Company.
Shareholder Relations Shareholder communications are a high priority for the Board. The Manager produces a monthly fact sheet which is distributed to Shareholders and released to the London Stock Exchange. Members of the Manager’s Investment Committee make themselves available at all reasonable times to meet with principal Shareholders and key sector analysts. Feedback from these sessions is provided by the Manager at the quarterly Board meetings.
In addition, the Board is also kept fully appraised of all market commentary on the Company by the Manager and other professional advisers including the Company’s brokers. Through this process the Board seeks to monitor the views of Shareholders and to ensure that the Company’s communication program is effective.
The Chairman and the Manager will be available during each Annual General Meeting to answer any questions that attending Shareholders may have.
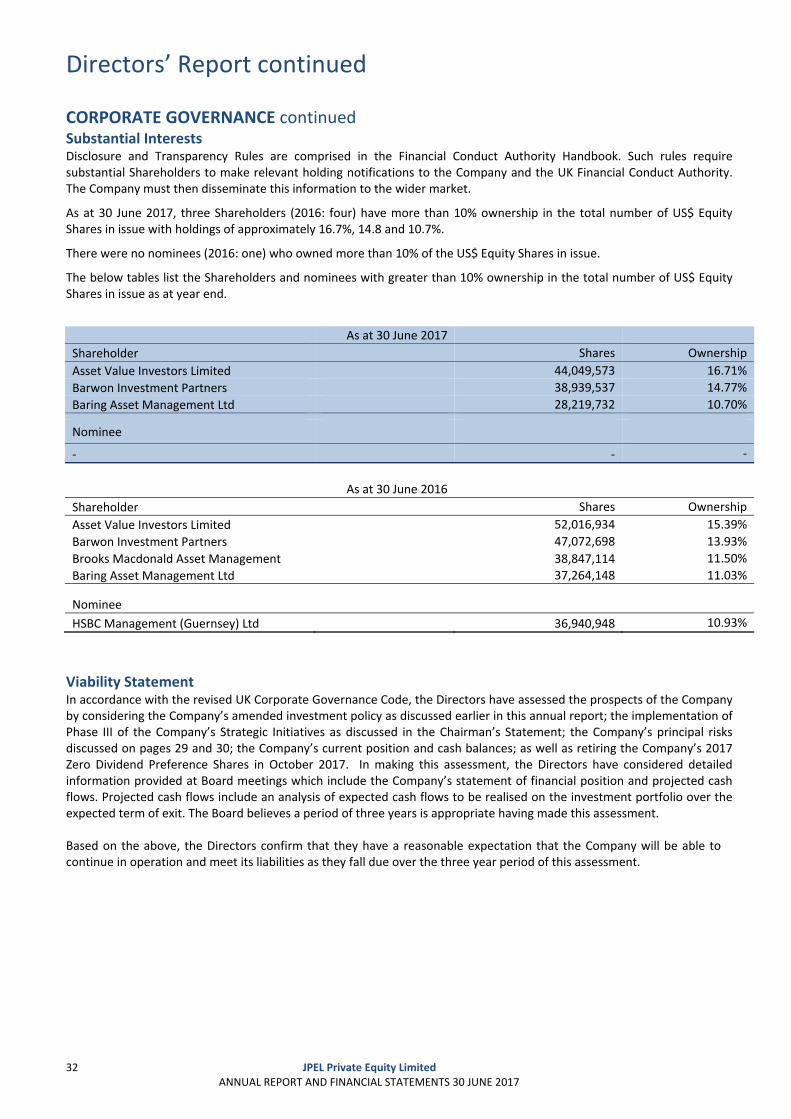
Directors’ Report continued
32 JPEL Private Equity Limited
ANNUAL REPORT AND FINANCIAL STATEMENTS 30 JUNE 2017
CORPORATE GOVERNANCE continued Substantial Interests Disclosure and Transparency Rules are comprised in the Financial Conduct Authority Handbook. Such rules require substantial Shareholders to make relevant holding notifications to the Company and the UK Financial Conduct Authority. The Company must then disseminate this information to the wider market.
As at 30 June 2017, three Shareholders (2016: four) have more than 10% ownership in the total number of US$ Equity Shares in issue with holdings of approximately 16.7%, 14.8 and 10.7%.
There were no nominees (2016: one) who owned more than 10% of the US$ Equity Shares in issue.
The below tables list the Shareholders and nominees with greater than 10% ownership in the total number of US$ Equity Shares in issue as at year end.
As at 30 June 2017
Shareholder Shares Ownership
Asset Value Investors Limited 44,049,573 16.71%
Barwon Investment Partners 38,939,537 14.77%
Baring Asset Management Ltd 28,219,732 10.70%
Nominee
‐ ‐ ‐
As at 30 June 2016
Shareholder Shares Ownership
Asset Value Investors Limited 52,016,934 15.39%
Barwon Investment Partners 47,072,698 13.93%
Brooks Macdonald Asset Management 38,847,114 11.50%
Baring Asset Management Ltd 37,264,148 11.03%
Nominee
HSBC Management (Guernsey) Ltd 36,940,948 10.93%
Viability Statement In accordance with the revised UK Corporate Governance Code, the Directors have assessed the prospects of the Company by considering the Company’s amended investment policy as discussed earlier in this annual report; the implementation of Phase III of the Company’s Strategic Initiatives as discussed in the Chairman’s Statement; the Company’s principal risks discussed on pages 29 and 30; the Company’s current position and cash balances; as well as retiring the Company’s 2017 Zero Dividend Preference Shares in October 2017. In making this assessment, the Directors have considered detailed information provided at Board meetings which include the Company’s statement of financial position and projected cash flows. Projected cash flows include an analysis of expected cash flows to be realised on the investment portfolio over the expected term of exit. The Board believes a period of three years is appropriate having made this assessment. Based on the above, the Directors confirm that they have a reasonable expectation that the Company will be able to continue in operation and meet its liabilities as they fall due over the three year period of this assessment.
Directors’ Report continued
STATEMENT OF THE DIRECTORS’ RESPONSIBILITIESThe Directors are responsible for preparing the Directors’ Report, annual report and financial statements in accordancewith the applicable laws and regulations.
Guernsey company law requires the Directors to prepare financial statements for each financial year. Under that law theyhave elected to prepare the financial statements in accordance with International Financial Reporting Standards (IFRS) andapplicable Guernsey law.
The financial statements are required by law to give a true and fair view of the state of affairs of the Company and of theprofit or loss of the Company for that period.
In preparing those financial statements the Directors are required to:
• Select suitable accounting policies and apply them consistently;• Make judgements and estimates that are reasonable and prudent;• State whether applicable accounting standards have been followed, subject to any material departures disclosed
and explained In the financial statements;• Prepare the financial statements on the going concern basis unless it is inappropriate to presume that the
Company will continue in business; and• Ensure, when taken as a whole, the financial statements are fair, balanced and understandable.
The Directors confirm that they have complied with the above requirements in preparing the financial statements.
The Directors are responsible for keeping proper accounting records which disclose with reasonable accuracy at any timethe financial position of the Company and to enable them to ensure that the financial statements comply with TheCompanies (Guernsey) Law, 2008. They have a general responsibility for taking such steps as are reasonably open to themto safeguard the assets of the Company and to prevent and detect fraud and other irregularities.
The Directors are responsible for the oversight of the maintenance and integrity of the corporate and financial informationin relation to the Company website; the work carried out by the auditors does not involve consideration of these mattersand, accordingly, the auditors accept no responsibility for any changes that may have occurred to the financial statementssince that were initially presented on the website. Legislation in Guernsey governing the preparation and dissemination offinancial statements may differ from legislation in other jurisdictions.
DISCLOSURE OF INFORMATION TO THE AUDITORThe Directors who held office at the date of approval of this Director5’ Report confirm that, so far as they are each aware,there is no relevant audit information of which the Company’s Auditors are unaware; and each Director has taken all thesteps that he ought to have taken as a Director to make himself aware of any relevant audit information and to establishthat the Company’s Auditors are aware of that information.
We also confirm that to the best of our knowledge, in accordance with Disclosure and Transparency Rules 4.1.12:
• The financial statements, prepared in accordance with the applicable set of accounting standards, give a true andfair view of the assets, liabilities, financial position and profit or loss of the Company taken as a whole; and
• The Chairman’s Statement, Corporate Actions, Manager’s Report and Directors’ Report (together referred to asthe “Management Report) include a fair review of the development and performance of the business and theposition of the Company taken as a whole, together with a description of the principal risks and uncertainties thatthey face.
On behalf of the Board
•
Sean Hurst ,/‘ Christopher SpencerDirector Director27 September 2017
33 JPEL Private Equity LimitedANNUAL REPORT AND FINANCIAL STATEMENTS 30 JUNE 2017
INDEPENDENT AUDITOR’S REPORT TO THE MEMBERS OF JPEL PRIVATE
EQUITY LIMITED
34 JPEL Private Equity Limited
ANNUAL REPORT AND FINANCIAL STATEMENTS 30 JUNE 2017
Report on the audit of the financial statements _________________________________________________________________________ Our opinion In our opinion, the financial statements give a true and fair view of the financial position of JPEL Private Equity
Limited (the “Company”) as at 30 June 2017, and of its financial performance and its cash flows for the year then
ended in accordance with International Financial Reporting Standards and have been properly prepared in
accordance with the requirements of The Companies (Guernsey) Law, 2008.
_________________________________________________________________________ What we have audited The Company’s financial statements comprise:
● the statement of financial position as at 30 June 2017;
● the statement of comprehensive income for the year then ended;
● the statement of changes in equity for the year then ended;
● the statement of cash flows for the year then ended; and
● the notes to the financial statements, which include a summary of significant accounting policies.
_________________________________________________________________________ Basis for opinion We conducted our audit in accordance with International Standards on Auditing (“ISAs”). Our responsibilities under
those standards are further described in the Auditor’s responsibilities for the audit of the financial statements
section of our report.
We believe that the audit evidence we have obtained is sufficient and appropriate to provide a basis for our opinion. ________________________________________________________________________________ Independence
We are independent of the Company in accordance with the International Ethics Standards Board for Accountants’
Code of Ethics for Professional Accountants (“IESBA Code”) and SEC Independence Rules. We have fulfilled our
other ethical responsibilities in accordance with the IESBA Code and the SEC Independence Rules. ________________________________________________________________________________ Our audit approach Overview
Materiality Overall materiality was $9.6 million which represents 2.25% of net assets.
Audit scope The Company is incorporated and based in Guernsey. The Company has a number of unconsolidated subsidiaries that are held purely for
the purpose of holding the underlying investment portfolio. Consolidated financial statements are not prepared as the Company is an Investment Entity as defined under IFRS 10 ‘Consolidated Financial Statements’ and therefore the Company presents financial statement on a standalone basis.
We conducted our audit of the financial statements from information provided by Augentius (Guernsey) Limited (the ‘Administrator’) to whom the board of directors has delegated the provision of certain functions. The Company engages FCF JPEL Management LLC (the ‘Manager’) to manage its assets. We also had significant interaction with the Manager in completing aspects of our audit work.
We conducted our audit work in Guernsey, as well as in London with the Administrator and in New York with the Manager. We tailored the scope of our audit taking into account the types of investments within the Company, the accounting processes and controls, and the industry in which the Company operates.
Key audit matter Valuation of the investment portfolio
INDEPENDENT AUDITOR’S REPORT TO THE MEMBERS OF JPEL PRIVATE
EQUITY LIMITED (CONTINUED)
35 JPEL Private Equity Limited
ANNUAL REPORT AND FINANCIAL STATEMENTS 30 JUNE 2017
Audit scope As part of designing our audit, we determined materiality and assessed the risks of material misstatement in the
financial statements. In particular, we considered where the directors made subjective judgements; for example, in
respect of significant accounting estimates that involved making assumptions and considering future events that are
inherently uncertain. As in all of our audits, we also addressed the risk of management override of internal controls,
including among other matters, consideration of whether there was evidence of bias that represented a risk of
material misstatement due to fraud.
We tailored the scope of our audit in order to perform sufficient work to enable us to provide an opinion on the
financial statements as a whole, taking into account the structure of the Company, the accounting processes and
controls, and the industry in which the Company operates.
________________________________________________________________________________ Materiality The scope of our audit was influenced by our application of materiality. An audit is designed to obtain reasonable
assurance whether the financial statements are free from material misstatement. Misstatements may arise due to
fraud or error. They are considered material if individually or in aggregate, they could reasonably be expected to
influence the economic decisions of users taken on the basis of the financial statements.
Based on our professional judgement, we determined certain quantitative thresholds for materiality, including the
overall Company materiality for the financial statements as a whole as set out in the table below. These, together with
qualitative considerations, helped us to determine the scope of our audit and the nature, timing and extent of our
audit procedures and to evaluate the effect of misstatements, both individually and in aggregate on the financial
statements as a whole.
Overall Company materiality Overall materiality: $9,600,000
How we determined it 2.25% of net assets
Rationale for the materiality benchmark We believe that net assets is the most appropriate benchmark as this is the key metric of interest to investors. It is also a generally accepted measure used for companies in this industry.
We agreed with the Audit Committee that we would report to them misstatements identified during our audit above
$480,000, as well as misstatements below that amount that, in our view, warranted reporting for qualitative reasons.
________________________________________________________________________________ Key audit matters Key audit matters are those matters that, in our professional judgment, were of most significance in our audit of the
financial statements of the current period. These matters were addressed in the context of our audit of the financial
statements as a whole, and in forming our opinion thereon, and we do not provide a separate opinion on these
matters.
INDEPENDENT AUDITOR’S REPORT TO THE MEMBERS OF JPEL PRIVATE
EQUITY LIMITED (CONTINUED)
36 JPEL Private Equity Limited
ANNUAL REPORT AND FINANCIAL STATEMENTS 30 JUNE 2017
Key audit matter How our audit addressed the Key audit matter
Valuation of the
investment portfolio The investment portfolio, valued at $439million at year end, is measured at fair value through profit or loss and comprises a diverse portfolio of investments held in subsidiaries, unquoted funds, unquoted companies and debt securities. The investment portfolio represents the most significant balance on the Statement of Financial Position and is the principal driver of the Company’s net asset value (“NAV”). Given the nature of the investments, market data is not always readily available to corroborate the valuations provided by the underlying investee managers / general partners / sponsors or administrators, therefore the valuation of the investment portfolio may be subject to a significant level of judgement, estimation and complexity. For these reasons, the valuation of the investment portfolio has been a key focus of our audit work and is therefore a key audit matter.
We understood and evaluated the Company’s processes, internal controls and methodology applied in valuing the investment portfolio. We met with the Manager to discuss the valuation basis and investment performance during the year and we tailored our approach to testing the valuations accordingly. We performed tests over key controls in order to validate the operating effectiveness of these controls during the year. We assessed the accounting policy applied to investments for compliance with International Financial Reporting Standards and the International Private Equity and Venture Capital Valuation Guidelines. We applied audit methodology to select an appropriate sample of investments (based on materiality and complexity of the valuations), and for the selected sample, we independently obtained and confirmed the investment valuations to the latest available capital account statements / sponsor reports or other form of valuation support received directly from the underlying investee managers / general partners / sponsors or administrators. For those investment valuations included in our sample that are subject to higher levels of judgement and are inherently more complex than a valuation based on a reported NAV received from an underlying general partner / sponsor or administrator, we have assessed the reasonableness of the valuation methodology applied and any assumptions made, understood and corroborated key inputs and rationale, and we have assessed the reliability of the information used in the valuations. We note that despite the higher levels of complexity implicit in certain valuations, all valuations aside from the direct investments in unquoted companies are supported by an independent third party reported valuation. The value of the direct investments in unquoted companies, which are valued by the Manager, amount to $1.4 million at year end. We have reperformed the valuation calculations and confirmed key inputs where practicable, and are satisfied that the immaterial valuation of these unquoted companies is appropriate. We have assessed the quality and the reliability of the information obtained through our confirmation process, as well as the date of the latest available information used to support these valuations at year end. This assessment included a review of the latest audited financial statements, assessment of the appropriateness of the accounting framework under which the valuations are reported, confirmation that the audit opinion is unqualified, as well as a review of the SSAE 16/ISAE 3402 reports or equivalent controls reports for the investment managers/administrators/general partners of the underlying investments, where such financial statements and controls reports were available. Further, we considered the reputability and appropriateness of the confirming parties supplying us with the requested valuation support.
We highlight that in accordance with the investment valuation accounting policy, the Manager estimates fair value using the most recent financial information available at year end. Of the investment balance at year end, 85% is valued using 30 June 2017 valuations, and the remaining 15% is valued using an estimate of value at 30 June 2017. As part of our assessment over the reliability of estimated year end valuations, we performed back testing by way of identifying those investments held in the prior year that were valued based on estimated fair values using pre-30 June reported valuations (as adjusted by the Manager) at 30 June 2016, and we compared the estimated valuations to the final reported valuations that were received by management subsequent to signing the prior year financial statements. No material variances were noted which provides us with comfort over the reliability of estimates and judgements made by the Manager in estimating fair value based on the most recent available information.
We have not identified issues or misstatements that require reporting to the Audit Committee.
INDEPENDENT AUDITOR’S REPORT TO THE MEMBERS OF JPEL PRIVATE
EQUITY LIMITED (CONTINUED)
37 JPEL Private Equity Limited
ANNUAL REPORT AND FINANCIAL STATEMENTS 30 JUNE 2017
Other information The directors are responsible for the other information. The other information comprises the Financial Summary, Historical Performance, Overview and Strategy, Investment Policy, the Chairman’s Statement, the Corporate Actions, the Manager’s Report and the Directors’ Report but does not include the financial statements and our auditor’s report thereon. Other than as specified in our report, our opinion on the financial statements does not cover the other information
and we do not express any form of assurance conclusion thereon.
In connection with our audit of the financial statements, our responsibility is to read the other information identified
above and, in doing so, consider whether the other information is materially inconsistent with the financial
statements or our knowledge obtained in the audit, or otherwise appears to be materially misstated. If, based on the
work we have performed, we conclude that there is a material misstatement of this other information, we are
required to report that fact. We have nothing to report in this regard. ________________________________________________________________________________ Responsibilities of the directors for the financial statements The directors are responsible for the preparation of the financial statements that give a true and fair view in
accordance with International Financial Reporting Standards, the requirements of Guernsey law and for such
internal control as the directors determine is necessary to enable the preparation of financial statements that are free
from material misstatement, whether due to fraud or error.
In preparing the financial statements, the directors are responsible for assessing the Company’s ability to continue as
a going concern, disclosing, as applicable, matters relating to going concern and using the going concern basis of
accounting unless the directors either intend to liquidate the Company or to cease operations, or have no realistic
alternative but to do so.
________________________________________________________________________________
Auditor’s responsibilities for the audit of the financial statements Our objectives are to obtain reasonable assurance about whether the financial statements as a whole are free from
material misstatement, whether due to fraud or error, and to issue an auditor’s report that includes our opinion.
Reasonable assurance is a high level of assurance, but is not a guarantee that an audit conducted in accordance with
ISAs will always detect a material misstatement when it exists. Misstatements can arise from fraud or error and are
considered material if, individually or in aggregate, they could reasonably be expected to influence the economic
decisions of users taken on the basis of these financial statements.
As part of an audit in accordance with ISAs, we exercise professional judgement and maintain professional scepticism
throughout the audit. We also:
● Identify and assess the risks of material misstatement of the financial statements, whether due to fraud or error,
design and perform audit procedures responsive to those risks, and obtain audit evidence that is sufficient and
appropriate to provide a basis for our opinion. The risk of not detecting a material misstatement resulting from
fraud is higher than for one resulting from error, as fraud may involve collusion, forgery, intentional omissions,
misrepresentations, or the override of internal control.
● Obtain an understanding of internal control relevant to the audit in order to design audit procedures that are
appropriate in the circumstances, but not for the purpose of expressing an opinion on the effectiveness of the
Company’s internal control.
● Evaluate the appropriateness of accounting policies used and the reasonableness of accounting estimates and
related disclosures made by the directors.
● Conclude on the appropriateness of the directors’ use of the going concern basis of accounting and, based on the
audit evidence obtained, whether a material uncertainty exists related to events or conditions that may cast
significant doubt on the Company’s ability to continue as a going concern. If we conclude that a material
uncertainty exists, we are required to draw attention in our auditor’s report to the related disclosures in the
financial statements or, if such disclosures are inadequate, to modify our opinion. Our conclusions are based on
the audit evidence obtained up to the date of our auditor’s report. However, future events or conditions may
cause the Company to cease to continue as a going concern.
INDEPENDENT AUDITOR’S REPORT TO THE MEMBERS OF JPEL PRIvATEEQuITY LIMITED (coNTINuED)
• Evaluate the overall presentation, structure and content of the financial statements, including the disclosures,and whether the financial statements represent the underlying transactions and events in a manner that achievesfair presentation.
We communicate with those charged with governance regarding, among other matters, the planned scope and timingof the audit and significant audit findings, including any significant deficiencies in internal control that we identi1’during our audit.
We also provide those charged with governance ts’ith a statement that we have complied with relevant ethicalrequirements regarding independence, and to communicate with them all relationships and other matters that mayreasonably be thought to bear on our independence, and where applicable, related safeguards.
From the matters communicated with those charged with governance, we determine those matters that were of mostsignificance in the audit of the financial statements of the current period and are therefore the key audit matters. Wedescribe these matters in our auditor’s report unless law or regulation precludes public disclosure about the matter orwhen, in extremely rare circumstances, we determine that a matter should not be communicated in our reportbecause the adverse consequences of doing so would reasonably be expected to outweigh the public interest benefitsof such communication.
Report on other legal and regulaCoc requirementsUnder The Companies (Guernsey) Law, 2008 we are required to report to you if, in our opinion:
• we have not received all the information and explanations we require for our audit;• proper accounting records have not been kept; or• the financial statements are not in agreement with the accounting records.
We have no exceptions to report arising from this responsibility.
We have nothing to report in respect of the following matters which we have reviewed:
• the directors’ statement set out on page 22 in relation to going concern. As noted in the directors’ statement, thedirectors have concluded that it is appropriate to adopt the going concern basis in preparing the financialstatements. The going concern basis presumes that the Company has adequate resources to remain in operation,and that the directors intend it to do so, for at least one year from the date the financial statements were signed.As part of our audit we have concluded that the directors’ use of the going concern basis is appropriate. However,because not all future events or conditions can be predicted, these statements are not a guarantee as to theCompany’s ability to continue as a going concern;
• the directors’ statement that they have carried out a robust assessment of the principal risks facing the Companyand the directors’ statement in relation to the longer-term viability of the Company. Our review was substantiallyless in scope than an audit and only consisted of making inquiries and considering the directors’ processsupporting their statements; checking that the statements are in alignment with the relevant provisions of theUK Corporate Governance Code; and considering whether the statements are consistent with the knowledgeacquired by us in the course of performing our audit; and
• the part of the Corporate Governance Statement relating to the Company’s compliance with the ten furtherprovisions of the UK Corporate Governance Code specified for our review.
This report, including the opinion, has been prepared for and only for the members as a body in accordance withSection 262 of The Companies (Guernsey) Law, 2008 and for no other purpose. We do not, in giving this opinion,accept or assume responsibility for pny other purpose or to any other person to whom this report is shown or intowhose hands it mr come save whre expressly agreed by our prior consent in writing.
tL.AJloanne PeacegoodFor and on behalf of PricewaterhouseCoopers CI LLPChartered AccountantsGuernsey, Channel Islands27 September 2017
38 JPEL Private Equity LimitedANNUAL REPORT AND FINANCIAL STATEMENTS 30 JUNE 2017
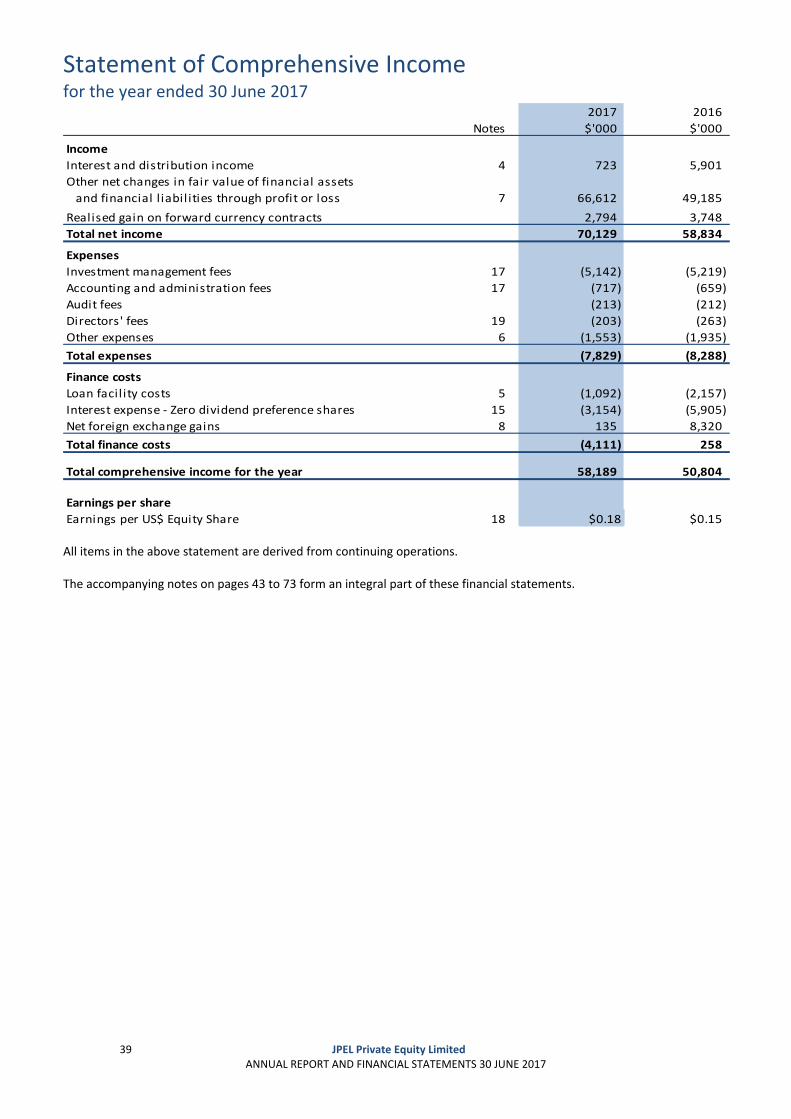
Statement of Comprehensive Income for the year ended 30 June 2017
39 JPEL Private Equity Limited
ANNUAL REPORT AND FINANCIAL STATEMENTS 30 JUNE 2017
2017 2016
Notes $'000 $'000
Income
Interest and distribution income 4 723 5,901
Other net changes in fair value of financial assets
and financial l iabil ities through profit or loss 7 66,612 49,185
Realised gain on forward currency contracts 2,794 3,748
Total net income 70,129 58,834
Expenses
Investment management fees 17 (5,142) (5,219)
Accounting and administration fees 17 (717) (659)
Audit fees (213) (212)
Directors' fees 19 (203) (263)
Other expenses 6 (1,553) (1,935)
Total expenses (7,829) (8,288)
Finance costs
Loan facil ity costs 5 (1,092) (2,157)
Interest expense ‐ Zero dividend preference shares 15 (3,154) (5,905)
Net foreign exchange gains 8 135 8,320
Total finance costs (4,111) 258
Total comprehensive income for the year 58,189 50,804
Earnings per share
Earnings per US$ Equity Share 18 $0.18 $0.15 All items in the above statement are derived from continuing operations. I The accompanying notes on pages 43 to 73 form an integral part of these financial statements.
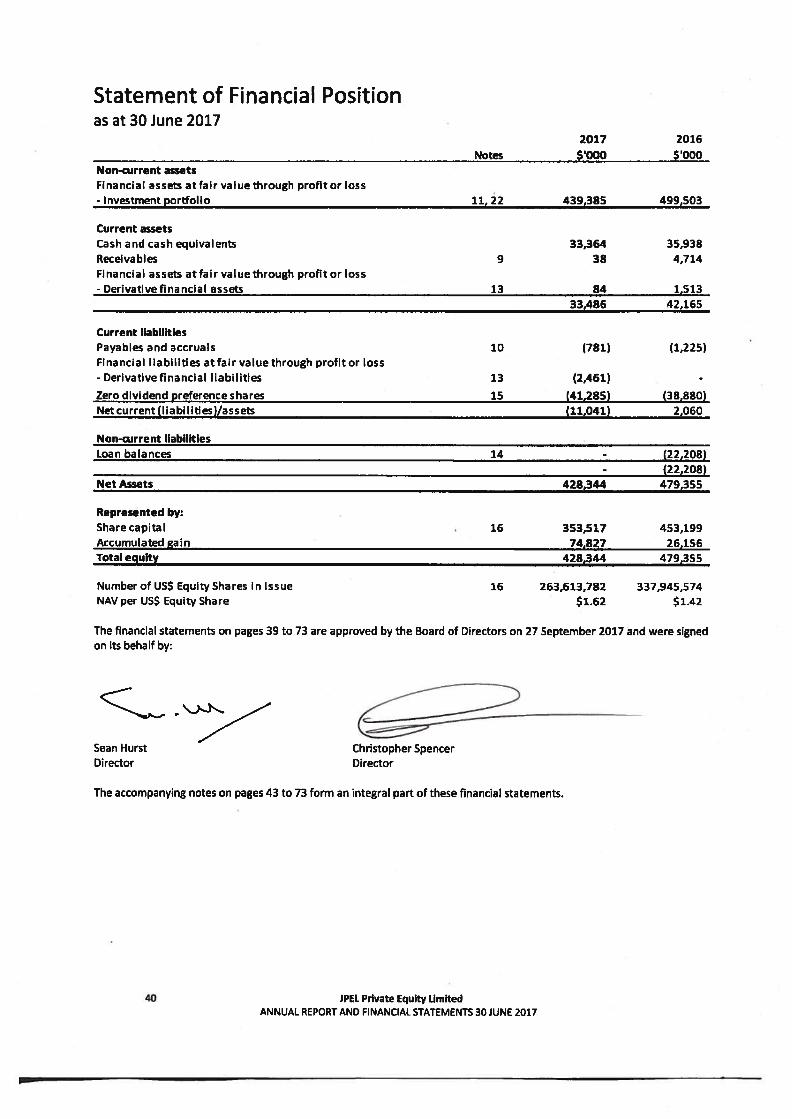
Statement of Financial Positionas at 30 June 2017
2017 2016
Notes $‘OOO $‘OOONon-current assetsFinancial assets atfairvaluethrough profltorloss- Investment portfolio 11, 22 439,385 499,503
Current assetsCash and cash equivalents 33,364 35,938ReceIvables 9 38 4,714Financial assets atfairvaluethrough profit or loss-Derivativefinancial assets 13 84 1,513
33,436 42,165
Current liabilitiesPayables and accruals 10 (781) (1,225)Financial liabilities at fair value through profit or loss- Derivativefinancial liabilities 13 (2,461) -
Zero dividend preference shares 15 (41,285) (38,880)Net current (liabilities)/assets (11,041) 2,060
Non-current liabilitiesLoan balances 14 - (22,208)
- (22,208)Net Assets 428,344 479,355
Represented by:
Share capital 16 353,517 453,199Accumulated gain 74,827 26,156Total equity 428,344 479,355
Number of US$ Equity Shares in issue 16 263,613,782 337,945,574NAV per US$ Equity Share $1.62 $1.42
The financial statements on pages 39 to 73 are approved by the Board of Directors on 27 September 2017 and were signedon its behalf by:
Sean Hurst Christopher SpencerDirector Director
The accompanying notes on pages 43 to 73 form an integral part of these financial statements.
40 JPEL Private Equity LimitedANNUAL REPORT AND FINANCIAL STATEMENTS 30 JUNE 2017
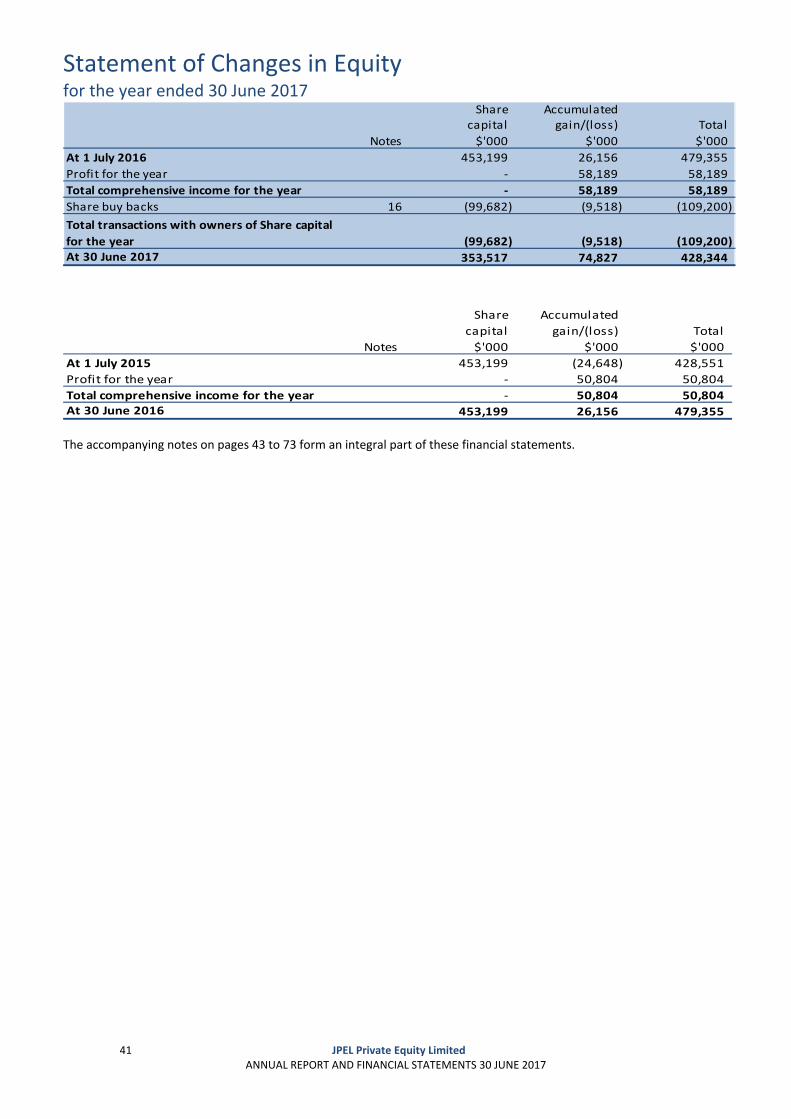
Statement of Changes in Equity for the year ended 30 June 2017
41 JPEL Private Equity Limited
ANNUAL REPORT AND FINANCIAL STATEMENTS 30 JUNE 2017
Share Accumulatedcapital gain/(loss) Total
Notes $'000 $'000 $'000
At 1 July 2016 453,199 26,156 479,355
Profit for the year ‐ 58,189 58,189
Total comprehensive income for the year ‐ 58,189 58,189
Share buy backs 16 (99,682) (9,518) (109,200)
Total transactions with owners of Share capital
for the year (99,682) (9,518) (109,200) At 30 June 2017 353,517 74,827 428,344
Share Accumulated
capital gain/(loss) Total
Notes $'000 $'000 $'000
At 1 July 2015 453,199 (24,648) 428,551
Profit for the year ‐ 50,804 50,804
Total comprehensive income for the year ‐ 50,804 50,804 At 30 June 2016 453,199 26,156 479,355 The accompanying notes on pages 43 to 73 form an integral part of these financial statements.
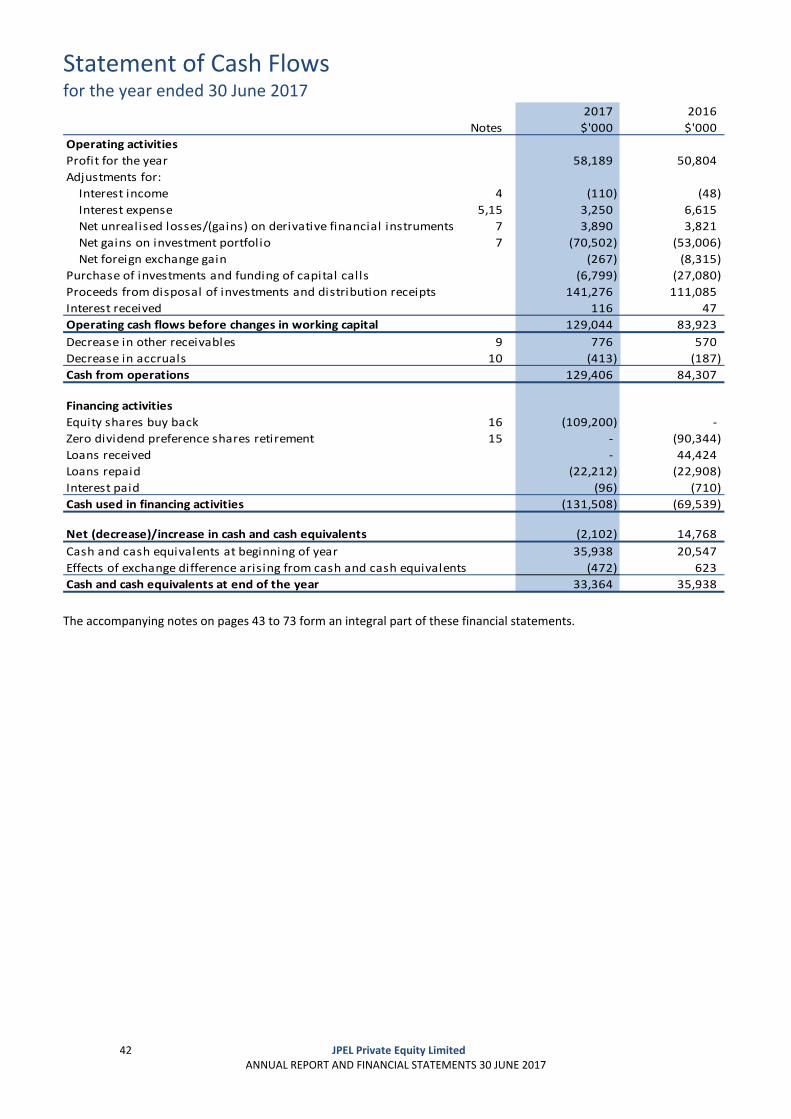
Statement of Cash Flows for the year ended 30 June 2017
42 JPEL Private Equity Limited
ANNUAL REPORT AND FINANCIAL STATEMENTS 30 JUNE 2017
2017 2016
Notes $'000 $'000
Operating activities
Profit for the year 58,189 50,804
Adjustments for:
Interest income 4 (110) (48)
Interest expense 5,15 3,250 6,615
Net unrealised losses/(gains) on derivative financial instruments 7 3,890 3,821
Net gains on investment portfolio 7 (70,502) (53,006)
Net foreign exchange gain (267) (8,315)
Purchase of investments and funding of capital calls (6,799) (27,080)
Proceeds from disposal of investments and distribution receipts 141,276 111,085
Interest received 116 47
Operating cash flows before changes in working capital 129,044 83,923
Decrease in other receivables 9 776 570
Decrease in accruals 10 (413) (187)
Cash from operations 129,406 84,307
Financing activities
Equity shares buy back 16 (109,200) ‐
Zero dividend preference shares retirement 15 ‐ (90,344)
Loans received ‐ 44,424
Loans repaid (22,212) (22,908)
Interest paid (96) (710)
Cash used in financing activities (131,508) (69,539)
Net (decrease)/increase in cash and cash equivalents (2,102) 14,768
Cash and cash equivalents at beginning of year 35,938 20,547
Effects of exchange difference arising from cash and cash equivalents (472) 623
Cash and cash equivalents at end of the year 33,364 35,938 End of statements The accompanying notes on pages 43 to 73 form an integral part of these financial statements.
Notes to the Financial Statements
43 JPEL Private Equity Limited
ANNUAL REPORT AND FINANCIAL STATEMENTS 30 JUNE 2017
1. SIGNIFICANT ACCOUNTING POLICIES JPEL Private Equity Limited (“JPEL” or the “Company”) is a closed ended investment fund incorporated as a limited liability company in Guernsey under The Companies (Guernsey) Law, 2008. As at 30 June 2017, the Company’s capital structure consisted of two classes of shares, US$ Equity Shares and zero dividend preference shares, both of which are listed on the London Stock Exchange.
The primary objective of the Company is to achieve capital growth, with income as a secondary objective, from a diversified portfolio consisting predominantly of private equity limited partnership interests. The Company may also invest directly in private equity investments.
The accounting policies set out below have been applied consistently by the Company to all periods presented in these financial statements.
Statement of compliance The financial statements have been prepared in accordance with International Financial Reporting Standards ("IFRS") issued and adopted by the International Accounting Standards Board (the "IASB") and interpretations issued by the International Financial Reporting Interpretations Committee. They give a true and fair view and are in compliance with applicable legal and regulatory requirements of The Companies (Guernsey) Law, 2008 and the Listing Rules of the UK Listing Authority.
Standards and amendments to existing standards effective for the Company’s annual period beginning on 1 July 2016 that are relevant and have been adopted by the Company
Investment Entities, ‘Applying the Consolidation Exception (Amendments to IFRS 10, IFRS 12 and IAS 28)’ In December 2014, IASB issued the amendments to IFRS 10, IFRS 12 and IAS 28 providing clarification on the application of consolidation exception for investment entities including its subsidiaries.
The amendments clarify that intermediate parent entities which are subsidiaries of investment entities can also avail the exception from preparing consolidated financial statements. The amendments also clarify that a subsidiary that provides services related to the investment activities of its investment entity parent should be consolidated. However, if such subsidiary is also an investment entity, then such subsidiary should also be measured at fair value through profit or loss by the parent investment entity. The amendments now also allow a non‐investment entity parent to retain the fair value measurement applied by the investment entity associate or joint venture to its subsidiaries. An investment entity measuring all of its subsidiaries at fair value will be required to provide the disclosures relating to investment entities as required by IFRS 12, ‘Disclosure of Interests in Other Entities’.
The amendments are effective for annual periods beginning on or after 1 January 2016. The adoption of these amendments did not have a material impact on these financial statements.
Disclosure Initiative (Amendments to IAS 1)
In December 2014, IASB issued the amendments to IAS 1 covering five areas: materiality, disaggregation and subtotals, notes, disclosure of accounting policies, and presentation of other comprehensive income (OCI) arising from investments accounted for under the equity method.
The amendments state that the materiality concept applies to the primary statements, notes and any specific disclosures required by IFRS.
They clarified that line items, in the statement of financial position or in the statement of comprehensive income, can be aggregated or disaggregated as deemed relevant.
They also clarified that entities have flexibility around the structuring of the notes and emphasised that understandability and comparability should be considered when deciding the order of the notes.
They also provided guidance on how to identify significant accounting policies.
The adoption of the amendments did not have a material impact on these financial statements.
Annual Improvements to IFRSs 2012–2014 Cycle
IFRS 7, ‘Financial Instruments: Disclosures’ (i) Servicing contracts The amendment clarifies that a servicing contract that includes a fee can constitute continuing involvement in a financial asset. An entity must assess the nature of the fee and the arrangement against the guidance for continuing involvement in IFRS 7 in order to assess whether the disclosures are required. The assessment of which servicing contracts constitute continuing involvement must be done retrospectively. However, the required disclosures would not need to be provided for any period beginning before the annual period in which the entity first applies the amendments.
Notes to the Financial Statements continued
44 JPEL Private Equity Limited
ANNUAL REPORT AND FINANCIAL STATEMENTS 30 JUNE 2017
1. SIGNIFICANT ACCOUNTING POLICIES continued Statement of compliance continued (ii) Applicability of the amendments to IFRS 7 to condensed interim financial statements The amendment clarifies that the offsetting disclosure requirements do not apply to condensed interim financial statements, unless such disclosures provide a significant update to the information reported in the most recent annual report. This amendment must be applied retrospectively.
These improvements are effective for annual periods beginning on or after 1 January 2016.
The adoption of these standards and amendments did not have a material impact on these financial statements.
New standards and amendments to existing standards that are relevant but have not yet been adopted by the Company A number of new standards, amendments to standards and interpretations in issue are not yet effective for the year ended 30 June 2017, and have not been applied in preparing these financial statements. The Directors are considering the potential effect of the implementation of the new standards.
IFRS 9, ‘Financial Instruments’ (effective for accounting periods beginning on or after 1 January 2018) IFRS 9, ‘Financial instruments’, addresses the classification, measurement and recognition of financial assets and financial liabilities. The complete version of IFRS 9 was issued in July 2014. It replaces the guidance in IAS 39 that relates to the classification and measurement of financial instruments. IFRS 9 retains but simplifies the mixed measurement model and establishes three primary measurement categories for financial assets: amortised cost, fair value through other comprehensive income and fair value through profit or loss. The basis of classification depends on the entity’s business model and the contractual cash flow characteristics of the financial asset. Investments in equity instruments are required to be measured at fair value through profit or loss with the irrevocable option at inception to present changes in fair value in other comprehensive income. There is now a new expected credit losses model that replaces the incurred loss impairment model used in IAS 39.
For financial liabilities there were no changes to classification and measurement except for the recognition of changes in own credit risk in other comprehensive income for liabilities designated at fair value through profit or loss.
IFRS 9 relaxes the requirements for hedge effectiveness by replacing the bright line hedge effectiveness tests. Contemporaneous documentation is still required but is different to that currently prepared under IAS 39.
The standard is not applicable until 1 January 2018 but is available for early adoption. In considering the Company’s business model and the contractual cash flow characteristics of the financial assets, the Board expects to continue measuring loans and receivables at amortised cost, and at fair value through profit or loss all financial assets and liabilities currently held at fair value. In addition the Company does not apply hedge accounting; therefore, IFRS 9 hedge accounting‐related changes are not expected to have an impact on the financial statements.
IFRS 15, ‘Revenue from Contracts with Customers’ (effective for accounting periods beginning on or after 1 January 2018) In May 2014, IASB issued IFRS 15 ‘Revenue from Contracts with Customers’. The core principle of the new Standard is for companies to recognise revenue to depict the transfer of goods or services to customers in amounts that reflect the consideration (that is, payment) to which the Company expects to be entitled in exchange for those goods or services. The new Standard will also result in enhanced disclosures about revenue, provide guidance for transactions that were not previously addressed comprehensively (for example, service revenue and contract modifications) and improve guidance for multiple‐element arrangements.
IFRS 15 is effective for annual periods beginning on or after 1 January 2018. Earlier application is permitted. The Company does not expect to be significantly impacted by IFRS 15 as it recognises its investment income and gains under IAS 39, ‘Financial instruments: Recognition and measurement’.
Disclosure Initiative (Amendments to IAS 7) The IASB has published amendments to IAS 7 'Statement of Cash Flows'. The amendments are intended to clarify IAS 7 with the objective that entities shall provide disclosures that enable users of financial statements to evaluate changes in liabilities arising from financing activities.
To achieve this objective, the IASB requires that the following changes in liabilities arising from financing activities are disclosed (to the extent necessary): (i) changes from financing cash flows; (ii) changes arising from obtaining or losing control of subsidiaries or other businesses; (iii) the effect of changes in foreign exchange rates; (iv) changes in fair values; and (v) other changes.
The amendments state that one way to fulfil the new disclosure requirement is to provide a reconciliation between the opening and closing balances in the statement of financial position for liabilities arising from financing activities.
Notes to the Financial Statements continued
45 JPEL Private Equity Limited
ANNUAL REPORT AND FINANCIAL STATEMENTS 30 JUNE 2017
1. SIGNIFICANT ACCOUNTING POLICIES continued Statement of compliance continued Finally, the amendments state that changes in liabilities arising from financing activities must be disclosed separately from changes in other assets and liabilities. They are effective for annual periods beginning on or after 1 January 2017, with earlier application being permitted. The Directors believe that the adoption of these amendments will not have a material impact on the financial statements of the Company.
There are no other standards, interpretations or amendments to existing standards that are relevant, and that are not yet effective that would be expected to have a significant impact on the Company.
Basis of preparation These financial statements have been prepared on a going concern basis in US Dollars under the historical cost convention except for investments and derivative financial instruments that are measured at fair value with changes in fair value recognised in the statement of comprehensive income. Other financial assets and financial liabilities including receivables, payables, accruals, loans and zero dividend preference shares are stated at amortised cost.
The preparation of financial statements in conformity with IFRS requires management to make judgements, estimates and assumptions that affect the application of policies and the reported amounts of assets and liabilities, income and expenses. The estimates and associated assumptions are based on historical experience and various other factors that are believed to be reasonable under the circumstances, the results of which form the basis of making judgements about the carrying values of assets and liabilities that are not readily apparent from other sources. Actual results may differ from these estimates.
In particular, information about significant areas of estimation uncertainty and critical judgements in applying accounting policies that have the most significant effect on the amounts recognised in the financial statements are described below in Note 2 ‘Key estimates and assumptions’.
These financial statements are the only annual financial statements presented by the Company.
Investment entity The Company has been deemed to meet the definition of an investment entity per IFRS 10 as the following conditions exist:
The Company has obtained funds for the purpose of providing investors with investment management services.
The Company’s business purpose, which was communicated directly to investors, is investing solely for returns from capital appreciation and investment income, through the use of investment vehicles.
The performance of investments made through the investment vehicles are measured and evaluated on a fair value basis.
The Company has more than one investment and more than one investor.
The Company has investors who are not its related parties.
The Company has ownership interests in the form of equity.
Subsidiaries The Company is required to consider all facts and circumstances when assessing whether an entity is an investment entity, including its purpose and design. The absence of any of these typical characteristics, as listed above, does not necessarily disqualify an entity from being classified as an investment entity. The subsidiaries are also deemed to meet the definition of an investment entity per IFRS 10, as they have been formed in connection with JPEL for legal, regulatory, tax or similar business reasons. The subsidiaries do not render investment advisory or management services, or administrative services to any of the investments in the portfolio.
Please refer to note 12 for details of the Company’s subsidiaries.
Notes to the Financial Statements continued
46 JPEL Private Equity Limited
ANNUAL REPORT AND FINANCIAL STATEMENTS 30 JUNE 2017
1. SIGNIFICANT ACCOUNTING POLICIES continued Financial instruments Financial assets and financial liabilities are recognised in the statement of financial position when the Company becomes a party to the contractual provisions of the instrument. Financial assets and financial liabilities are only offset and the net amount reported in the statement of financial position and statement of comprehensive income when there is a currently enforceable legal right to offset the recognised amounts and the Company intends to settle on a net basis or realise the asset and liability simultaneously.
i) Financial assets The classification of financial assets at initial recognition depends on the purpose for which the financial asset was acquired and its characteristics. All financial assets are initially recognised at fair value plus, for an item not at fair value through profit or loss, transaction costs that are directly attributable to its acquisition or issue. All purchases of financial assets are recorded at trade date, being the date on which the Company became party to the contractual requirement of the financial asset. The Company’s financial assets comprise of assets designated as financial assets at fair value through profit or loss and loans and receivables. Unless otherwise indicated the carrying amounts of the Company's financial assets approximate to their fair values.
a) Financial assets at fair value through profit or loss The Company manages its investments with a view to profiting from the receipt of dividends and changes in fair value of equity investments. The Company may also make loan investments and these are designated as financial assets at fair value through profit or loss. Therefore, all quoted investments, unquoted equity investments and debt securities are designated at fair value through profit or loss and subsequently carried in the statement of financial position at fair value. Equity investments at fair value through profit or loss are initially recognised at fair value and related transaction costs are recognised immediately in the statement of comprehensive income within other expenses.
Investments in subsidiaries are valued at the fair value of the Company’s percentage holding based on the net asset values of the subsidiaries. The net asset value of the subsidiaries is based on the fair valuation of the underlying portfolio adjusted for relevant income and expenses. The Company reviews the net asset values of the subsidiaries to make any adjustments in order to obtain the best estimate of fair value. “Other net changes in fair value of financial assets and financial liabilities at fair value through profit or loss” in the statement of comprehensive income include the change in fair value of the subsidiaries.
Investments in funds are recorded at the fair value of the Company’s percentage holding as reported by the general partners of those funds per the capital statement. The underlying investments held by those funds are measured at fair value, which is based on the general partners' estimate. In estimating the fair value of underlying investments the objective of the general partners is to replicate the assumptions and estimates that parties in an arm’s length transaction would make. In arriving at the estimated value of underlying investments, the general partners consider market multiples, net assets, industry benchmarks, prices of recent transactions, negotiated sales prices, projected operational and financial results of the company and discounted cash flow valuations. The Company believes that this value, in most cases, represents fair value as of the relevant statement date, although, if other factors lead the Company to conclude that the value provided by the general partners does not represent fair value, the Directors and Manager will adjust the value of the investment from the general partners’ estimate.
The valuation policies used by many of the private equity general partners and sponsors in undertaking such valuations are generally in line with the recommendations of the International Private Equity and Venture Capital Valuation Guidelines (IPEVCG) or standard industry practice. Changes in fair value are recognised in the statement of comprehensive income under “Other net changes in fair value of financial assets and financial liabilities at fair value through profit or loss”.
Investments made by the Company are generally considered to be long term investments and are not intended to be disposed of on a short term basis. Accordingly, while the valuation at the year end represents the Directors’ best estimate of the realisable amount at the year end they do not necessarily represent the amounts which may eventually be realised from sales or other disposals of investments. The key estimates and assumptions used to arrive at the valuation of unlisted investments are stated in note 2 on pages 50 to 52.
The disclosure requirements in IFRS 13 establish a hierarchal disclosure framework, which prioritises and ranks the level of market price observability used in measuring investments at fair value. Market price observability is impacted by a number of factors, including the type of investment and characteristics specific to the investment.
Notes to the Financial Statements continued
47 JPEL Private Equity Limited
ANNUAL REPORT AND FINANCIAL STATEMENTS 30 JUNE 2017
1. SIGNIFICANT ACCOUNTING POLICIES continued Financial instruments continued i) Financial assets continued
Investments with readily available actively quoted prices or for which fair value can be measured from actively quoted prices generally will have a higher degree of market price observability and a lesser degree of judgement used in measuring fair value.
Investments measured and reported at fair value are classified and disclosed in one of the following categories:
• Level I – Quoted prices are available in active markets for identical investments as of the reporting date. The types of investments that would generally be included in Level I include listed equities and listed or highly liquid derivatives. The Company, to the extent it holds such investments, does not adjust the quoted price for these investments, even in situations where the Company holds a large position and a sale could reasonably impact the quoted price.
• Level II – Pricing inputs other than quoted prices in active markets, which are either directly or indirectly observable as of the reporting date, and fair value is determined through the use of models or other valuation methodologies. The types of investments that would generally be included in this category include corporate bonds and loans, less liquid and restricted equity securities and certain over‐the‐counter derivatives.
• Level III – Pricing inputs are unobservable for the investment and include situations where there is little, if any, market activity for the investment. The inputs into the determination of fair value require significant management judgement or estimation. The types of investments that would generally be included in this category include equity and/or debt securities issued by private entities.
In certain cases, the inputs used to measure fair value may fall into different levels of the fair value hierarchy. In such cases, an investment’s level within the above hierarchy is based on the lowest level of input that is significant to the fair value measurement. The Company’s assessment of the significance of a particular input to the fair value measurement in its entirety requires judgement and considers factors specific to the investment.
b) Loans and receivables These assets are non‐derivative financial assets with fixed or determinable payments that are not quoted in an active market. They principally comprise trade and other receivables. They are initially recognised at fair value plus transaction costs that are directly attributable to the acquisition, and subsequently carried at amortised cost using the effective interest rate method, less provision for impairment.
c) Derivative financial instruments Derivatives are initially recognised at fair value on the date that a derivative contract is entered into and are subsequently re‐measured at their fair values.
The Company’s derivative instruments do not qualify for hedge accounting. Changes in the fair value of any of these derivative instruments are recognised immediately in the statement of comprehensive income within “Other net changes in fair value on financial assets and financial liabilities at fair value through profit and loss” and “Realised gains/(losses) on forward currency contracts”.
The Company’s derivative financial instruments comprise of foreign exchange forward contracts. The fair value of these instruments is based on their quoted price. If a quoted price is not available, then fair value is estimated by discounting the difference between the contractual forward price and the current forward price for the residual maturity of the contract using a risk‐free interest rate.
d) De‐recognition of financial assets A financial asset (in whole or in part) is de‐recognised either:
• When the Company has transferred substantially all the risk and rewards of ownership; or
• When it has neither transferred nor retained substantially all the risk and rewards and when it no longer has control over the asset or a portion of the asset; or
• When the contractual right to receive cash flow has expired; or
• When the Company enters into transactions whereby it transfers assets recognised on its statement of financial position, but retains either all or substantially all of the risks and rewards of the transferred assets or a portion of them. If all or substantially all risks and rewards are retained, then the transferred assets are not de‐recognised.
Notes to the Financial Statements continued
48 JPEL Private Equity Limited
ANNUAL REPORT AND FINANCIAL STATEMENTS 30 JUNE 2017
1. SIGNIFICANT ACCOUNTING POLICIES continued Financial instruments continued ii) Financial liabilities
The classification of financial liabilities at initial recognition depends on the purpose for which the financial liability was issued and its characteristics. All financial liabilities are initially recognised at fair value net of transaction costs incurred. All purchases of financial liabilities are recorded on trade date, being the date on which the Company becomes party to the contractual requirements of the financial liability. Unless otherwise indicated the carrying amounts of the Company’s financial liabilities approximate to their fair values.
a) Financial liabilities measured at amortised cost These include trade payables and other short‐term monetary liabilities, loans and zero dividend preference shares which are initially recognised at fair value and subsequently carried at amortised cost using the effective interest rate method.
b) De‐recognition of financial liabilities A financial liability (in whole or in part) is de‐recognised when the Company has extinguished its contractual obligations, it expires or is cancelled. Any gain or loss on de‐recognition is taken to the statement of comprehensive income.
Cash and cash equivalents Cash comprises deposits with banks. Cash equivalents are short‐term highly liquid investments that are readily convertible within a three month maturity period to known amounts of cash, are subject to an insignificant risk of changes in value and are held for the purpose of meeting short term cash commitments rather than for investment or other purposes.
Zero dividend preference shares Zero dividend preference shares (“ZDP Shares”) are classified as a financial liability in the financial statements.
ZDP shares are initially recognised at their capital entitlement being fair value less issuance costs. Subsequent to the initial recognition, ZDP Shares are carried at amortised cost using the effective interest rate method. Increases in the carrying value of ZDP Shares due to accrued but unpaid interest are recognised in the statement of comprehensive income.
Costs incurred for the issuance of ordinary shares Incremental external costs directly attributable to the equity transaction and costs associated with the establishment of the Company that would otherwise have been avoided are written off against the share capital account.
Earnings per share The Company presents basic and diluted earnings per Equity share data for its participating shares. Basic earnings per share is calculated by dividing the profit or loss attributable to participating Shareholders of the Company by the weighted average number of participating shares outstanding during the year, adjusted for own shares held. Diluted earnings per share is determined by adjusting the profit or loss attributable to participating Shareholders and the weighted average number of participating shares outstanding, adjusted for own shares held, and for the effects of the dilutive potential participating shares of the warrants outstanding. When the basic and diluted earnings per Equity share are the same, only the basic earnings per share are reported.
Treasury shares When share capital recognised as equity is repurchased, the amount of the consideration paid, which includes directly attributable costs, is recognised as a deduction from the share capital account. Repurchased shares are classified as treasury shares. When treasury shares are sold or reissued subsequently, the amount received is recognised as an increase in equity, and the resulting surplus or deficit on the transaction is presented in the share capital account.
Other net changes in fair value of financial assets and financial liabilities through profit or loss “Other net changes in fair value of financial assets and financial liabilities at fair value through profit or loss” includes all realised and unrealised fair value changes and foreign exchange differences, but excludes interest and dividend income. Net realised gains on investments at fair value through profit or loss are recognised when the de‐recognition criteria for financial assets are met. Gain or loss is recognised when persuasive evidence exists, usually in the form of a sale agreement, that the significant risks and rewards of ownership have transferred to the buyer, recovery of the consideration is probable, there is no continuing management involvement with the investment, and the amount of gain or loss can be measured reliably.
Dividend and other distribution income Dividend and other distribution income is measured at the fair value of the consideration received or receivable. Dividends and other distribution income is recognised when persuasive evidence exists, usually in the form of a dividend or distribution notice that payment will be made, and the amount of the dividend or distribution can be measured reliably.
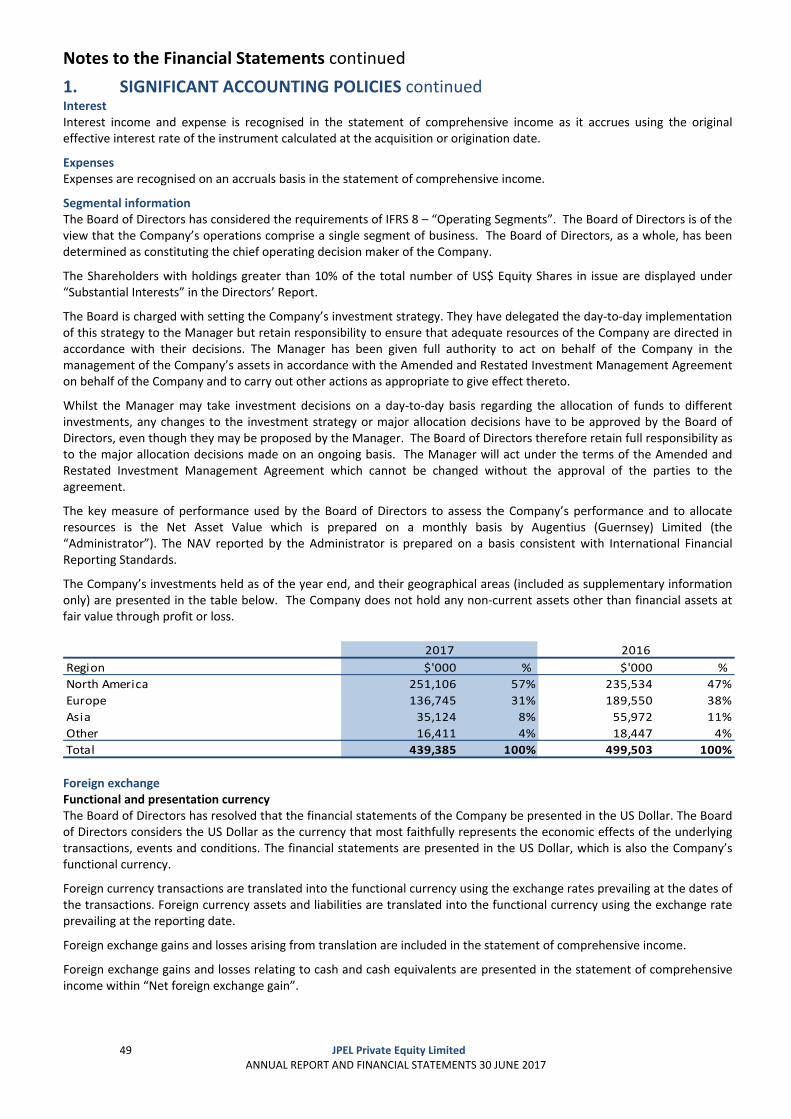
Notes to the Financial Statements continued
49 JPEL Private Equity Limited
ANNUAL REPORT AND FINANCIAL STATEMENTS 30 JUNE 2017
1. SIGNIFICANT ACCOUNTING POLICIES continued Interest Interest income and expense is recognised in the statement of comprehensive income as it accrues using the original effective interest rate of the instrument calculated at the acquisition or origination date.
Expenses Expenses are recognised on an accruals basis in the statement of comprehensive income.
Segmental information The Board of Directors has considered the requirements of IFRS 8 – “Operating Segments”. The Board of Directors is of the view that the Company’s operations comprise a single segment of business. The Board of Directors, as a whole, has been determined as constituting the chief operating decision maker of the Company.
The Shareholders with holdings greater than 10% of the total number of US$ Equity Shares in issue are displayed under “Substantial Interests” in the Directors’ Report.
The Board is charged with setting the Company’s investment strategy. They have delegated the day‐to‐day implementation of this strategy to the Manager but retain responsibility to ensure that adequate resources of the Company are directed in accordance with their decisions. The Manager has been given full authority to act on behalf of the Company in the management of the Company’s assets in accordance with the Amended and Restated Investment Management Agreement on behalf of the Company and to carry out other actions as appropriate to give effect thereto.
Whilst the Manager may take investment decisions on a day‐to‐day basis regarding the allocation of funds to different investments, any changes to the investment strategy or major allocation decisions have to be approved by the Board of Directors, even though they may be proposed by the Manager. The Board of Directors therefore retain full responsibility as to the major allocation decisions made on an ongoing basis. The Manager will act under the terms of the Amended and Restated Investment Management Agreement which cannot be changed without the approval of the parties to the agreement.
The key measure of performance used by the Board of Directors to assess the Company’s performance and to allocate resources is the Net Asset Value which is prepared on a monthly basis by Augentius (Guernsey) Limited (the “Administrator”). The NAV reported by the Administrator is prepared on a basis consistent with International Financial Reporting Standards.
The Company’s investments held as of the year end, and their geographical areas (included as supplementary information only) are presented in the table below. The Company does not hold any non‐current assets other than financial assets at fair value through profit or loss.
Region $'000 % $'000 %
North America 251,106 57% 235,534 47%
Europe 136,745 31% 189,550 38%
Asia 35,124 8% 55,972 11%
Other 16,411 4% 18,447 4%
Total 439,385 100% 499,503 100%
2017 2016
Foreign exchange Functional and presentation currency The Board of Directors has resolved that the financial statements of the Company be presented in the US Dollar. The Board of Directors considers the US Dollar as the currency that most faithfully represents the economic effects of the underlying transactions, events and conditions. The financial statements are presented in the US Dollar, which is also the Company’s functional currency.
Foreign currency transactions are translated into the functional currency using the exchange rates prevailing at the dates of the transactions. Foreign currency assets and liabilities are translated into the functional currency using the exchange rate prevailing at the reporting date.
Foreign exchange gains and losses arising from translation are included in the statement of comprehensive income.
Foreign exchange gains and losses relating to cash and cash equivalents are presented in the statement of comprehensive income within “Net foreign exchange gain”.
Notes to the Financial Statements continued
50 JPEL Private Equity Limited
ANNUAL REPORT AND FINANCIAL STATEMENTS 30 JUNE 2017
1. SIGNIFICANT ACCOUNTING POLICIES continued Foreign exchange continued Foreign exchange gains and losses relating to the financial assets and liabilities carried at fair value through profit or loss are presented in the statement of comprehensive income within “Other net changes in fair value of financial assets and financial liabilities at fair value through profit or loss”.
Taxation The Company falls under the Zero‐Ten Guernsey tax regime and has its investment income assessed for tax at a taxable rate of 0%.
Offsetting Financial instruments are offset and the net amounts reported in the statement of financial position only when there is currently a legally enforceable right to offset the recognised amounts and there is an intention to settle on a net basis, or realise the assets and settle the liability simultaneously.
2. KEY ESTIMATES AND ASSUMPTIONS Estimates and judgements used in preparing the financial information are continually evaluated and are based on historical experience and other factors, including expectations of future events that are believed to be reasonable. The resulting estimates will, by definition, seldom equal the related actual results.
The only estimates and assumptions that have a significant risk of causing a material adjustment to the carrying amounts of assets and liabilities relate to the valuation of unquoted investments.
Valuation of investments The Company has interests in various different types of investments including: investments in subsidiaries, investments in unquoted funds, direct investments in unquoted companies, direct investments in public companies and investments in debt securities. The Company held no investments in public companies or debt securities as at year end.
Investments in subsidiaries Investments in subsidiaries are valued at fair value of the Company's percentage holding, based on the latest available net asset values of the subsidiaries. The Company reviews the net asset values and considers the liquidity of the subsidiaries or its underlying investments, value date of the net asset values and any restrictions on dividends from the subsidiaries. If necessary, the Company makes adjustments to net asset values of the subsidiaries to obtain the best estimate of its fair value.
Investments in unquoted funds The investments in unquoted funds are valued in accordance with IPEVCG as set out in the financial assets policy above. Investments in private equity funds do not have a readily available market and are generally valued based on the fair value of each private equity fund as reported by the respective general partner as per the capital statement, which necessarily incorporates estimates made by those general partners. The Company believes that this value, in most cases, represents fair value as of the relevant statement date, although, if other factors lead the Company to conclude that the value provided by the general partner does not represent fair value, the Directors and Manager will adjust the value of the investment from the general partner's estimate. The Company estimates fair value based on publicly available information and the most recent financial information provided by the general partners, as adjusted for cash flows since the date of the most recent financial information.
Where no valuation is available from the general partner or an independent valuation agent, the Directors and Manager will estimate the fair value in accordance with IPEVCG. The public equity securities known to be owned within the purchased private equity fund are based on the most recent information reported to the Company by the general partners.
Where such securities have publically available stock prices, these are adjusted by applying the appropriate discount to reflect limited marketability and illiquidity.
Direct investments in unquoted companies Direct investments in unquoted companies are generally valued based on the fair value of each investment as reported by the respective management.
Direct investments in unquoted companies where no fair value is being provided to the Company by the management or sponsor are carried at fair value, as estimated by the Directors and Manager. In estimating fair value, the Directors and Manager consider the value assigned to each investment by the lead investor (if any) with which the Company has co‐invested, to the extent known.
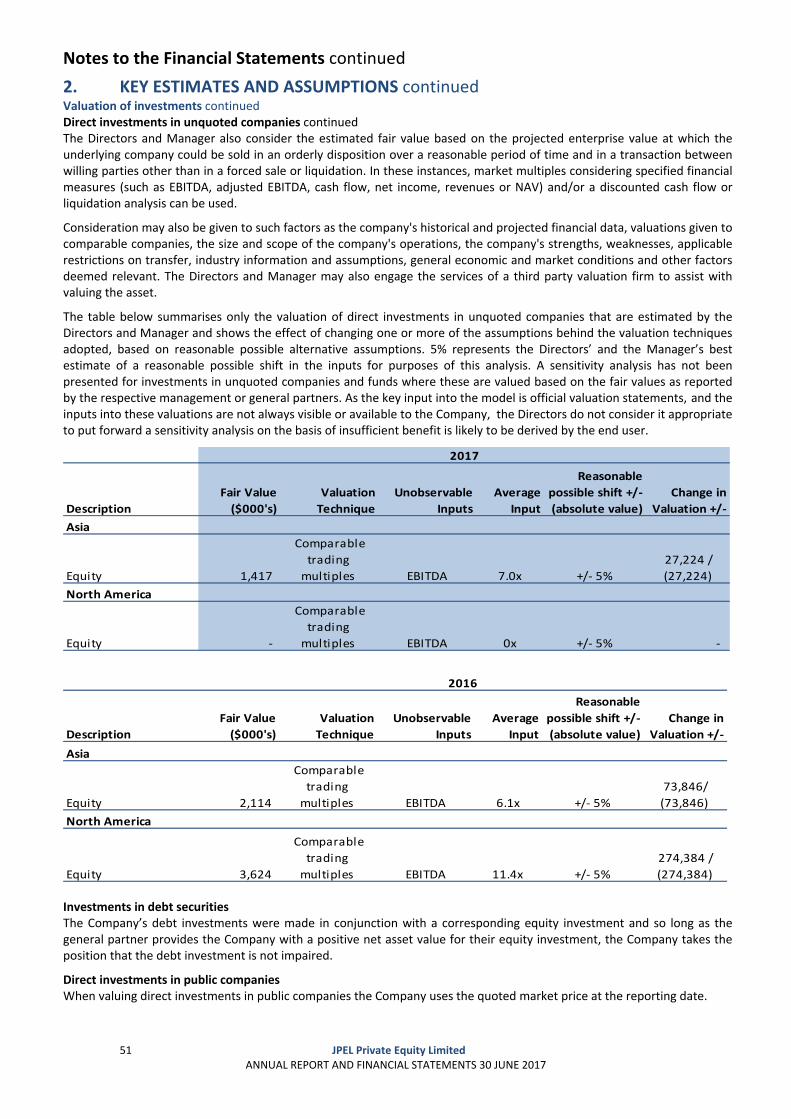
Notes to the Financial Statements continued
51 JPEL Private Equity Limited
ANNUAL REPORT AND FINANCIAL STATEMENTS 30 JUNE 2017
2. KEY ESTIMATES AND ASSUMPTIONS continued Valuation of investments continued Direct investments in unquoted companies continued The Directors and Manager also consider the estimated fair value based on the projected enterprise value at which the underlying company could be sold in an orderly disposition over a reasonable period of time and in a transaction between willing parties other than in a forced sale or liquidation. In these instances, market multiples considering specified financial measures (such as EBITDA, adjusted EBITDA, cash flow, net income, revenues or NAV) and/or a discounted cash flow or liquidation analysis can be used.
Consideration may also be given to such factors as the company's historical and projected financial data, valuations given to comparable companies, the size and scope of the company's operations, the company's strengths, weaknesses, applicable restrictions on transfer, industry information and assumptions, general economic and market conditions and other factors deemed relevant. The Directors and Manager may also engage the services of a third party valuation firm to assist with valuing the asset.
The table below summarises only the valuation of direct investments in unquoted companies that are estimated by the Directors and Manager and shows the effect of changing one or more of the assumptions behind the valuation techniques adopted, based on reasonable possible alternative assumptions. 5% represents the Directors’ and the Manager’s best estimate of a reasonable possible shift in the inputs for purposes of this analysis. A sensitivity analysis has not been presented for investments in unquoted companies and funds where these are valued based on the fair values as reported by the respective management or general partners. As the key input into the model is official valuation statements, and the inputs into these valuations are not always visible or available to the Company, the Directors do not consider it appropriate to put forward a sensitivity analysis on the basis of insufficient benefit is likely to be derived by the end user.
Description
Fair Value
($000's)
Valuation
Technique
Unobservable
Inputs
Average
Input
Reasonable
possible shift +/‐
(absolute value)
Change in
Valuation +/‐
Asia
Equity 1,417
Comparable
trading
multiples EBITDA 7.0x +/‐ 5%
27,224 /
(27,224)
North America
Equity ‐
Comparable
trading
multiples EBITDA 0x +/‐ 5% ‐
2017
Description
Fair Value
($000's)
Valuation
Technique
Unobservable
Inputs
Average
Input
Reasonable
possible shift +/‐
(absolute value)
Change in
Valuation +/‐
Asia
Equity 2,114
Comparable
trading
multiples EBITDA 6.1x +/‐ 5%
73,846/
(73,846)
North America
Equity 3,624
Comparable
trading
multiples EBITDA 11.4x +/‐ 5%
274,384 /
(274,384)
2016
Investments in debt securities The Company’s debt investments were made in conjunction with a corresponding equity investment and so long as the general partner provides the Company with a positive net asset value for their equity investment, the Company takes the position that the debt investment is not impaired.
Direct investments in public companies When valuing direct investments in public companies the Company uses the quoted market price at the reporting date.
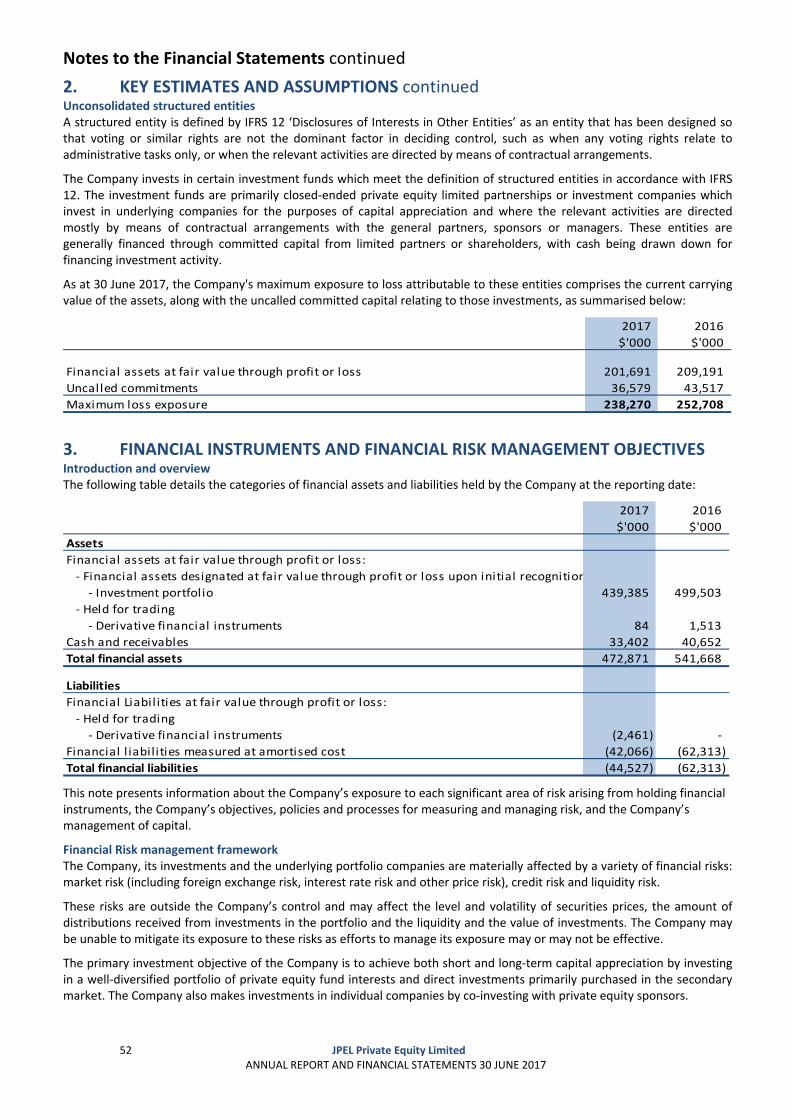
Notes to the Financial Statements continued
52 JPEL Private Equity Limited
ANNUAL REPORT AND FINANCIAL STATEMENTS 30 JUNE 2017
2. KEY ESTIMATES AND ASSUMPTIONS continued Unconsolidated structured entities A structured entity is defined by IFRS 12 ‘Disclosures of Interests in Other Entities’ as an entity that has been designed so that voting or similar rights are not the dominant factor in deciding control, such as when any voting rights relate to administrative tasks only, or when the relevant activities are directed by means of contractual arrangements.
The Company invests in certain investment funds which meet the definition of structured entities in accordance with IFRS 12. The investment funds are primarily closed‐ended private equity limited partnerships or investment companies which invest in underlying companies for the purposes of capital appreciation and where the relevant activities are directed mostly by means of contractual arrangements with the general partners, sponsors or managers. These entities are generally financed through committed capital from limited partners or shareholders, with cash being drawn down for financing investment activity.
As at 30 June 2017, the Company's maximum exposure to loss attributable to these entities comprises the current carrying value of the assets, along with the uncalled committed capital relating to those investments, as summarised below:
2017 2016
$'000 $'000
Financial assets at fair value through profit or loss 201,691 209,191
Uncalled commitments 36,579 43,517
Maximum loss exposure 238,270 252,708
3. FINANCIAL INSTRUMENTS AND FINANCIAL RISK MANAGEMENT OBJECTIVES Introduction and overview The following table details the categories of financial assets and liabilities held by the Company at the reporting date:
2017 2016
$'000 $'000
Assets
Financial assets at fair value through profit or loss:
‐ Investment portfolio 439,385 499,503
‐ Held for trading
‐ Derivative financial instruments 84 1,513
Cash and receivables 33,402 40,652
Total financial assets 472,871 541,668
Liabilities
Financial Liabil ities at fair value through profit or loss:
‐ Held for trading
‐ Derivative financial instruments (2,461) ‐
Financial l iabilities measured at amortised cost (42,066) (62,313)
Total financial liabilities (44,527) (62,313)
‐ Financial assets designated at fair value through profit or loss upon initial recognition
This note presents information about the Company’s exposure to each significant area of risk arising from holding financial instruments, the Company’s objectives, policies and processes for measuring and managing risk, and the Company’s management of capital.
Financial Risk management framework The Company, its investments and the underlying portfolio companies are materially affected by a variety of financial risks: market risk (including foreign exchange risk, interest rate risk and other price risk), credit risk and liquidity risk.
These risks are outside the Company’s control and may affect the level and volatility of securities prices, the amount of distributions received from investments in the portfolio and the liquidity and the value of investments. The Company may be unable to mitigate its exposure to these risks as efforts to manage its exposure may or may not be effective.
The primary investment objective of the Company is to achieve both short and long‐term capital appreciation by investing in a well‐diversified portfolio of private equity fund interests and direct investments primarily purchased in the secondary market. The Company also makes investments in individual companies by co‐investing with private equity sponsors.
Notes to the Financial Statements continued
53 JPEL Private Equity Limited
ANNUAL REPORT AND FINANCIAL STATEMENTS 30 JUNE 2017
3. FINANCIAL INSTRUMENTS AND FINANCIAL RISK MANAGEMENT OBJECTIVES continued Financial Risk management framework continued While the Company intends to make investments that will create long‐term value for Shareholders, the investments made may not appreciate in value and, in fact, may decline in value.
Moreover, the Company’s historical financial performance, in particular its Net Asset Value, reflects unrealised gains on investments as of applicable measurement dates which may never be realised due to many factors, some of which are not in the Company’s control, which may adversely affect the ultimate value realised from the Company’s investments.
The success of any of the investments in the portfolio will depend upon:
• the quality of its management and the management of the portfolio companies in which it invests;
• its ability to select successfully investment opportunities;
• general economic conditions; and
• its ability to liquidate its investments.
The Company can offer no assurance that its investments will generate gains or income or that any gains or income that may be generated on particular investments will be sufficient to offset any losses that may be sustained.
The Company anticipates that the scope of risk management activities it undertakes will vary based on the level and volatility of interest rates and public equity indexes, prevailing foreign currency exchange rates, the type of investments that are made and other changing market conditions. The use of hedging transactions and other derivative instruments to reduce the effects of a decline in the value of a position does not eliminate the possibility of fluctuations in the value of the position or prevent losses if the value of the position declines.
Market risk Market risk embodies the potential for both gains and losses and includes currency risk, interest rate risk and price risk.
The private equity investments held through subsidiaries, private equity funds and direct private equity investments in the Company’s portfolio may be materially affected by conditions in the global financial markets and economic conditions. The capital and credit markets have experienced unprecedented volatility and disruption over recent periods. Uncertainty created by market and economic conditions and a tightening of credit could lead to declines in valuations of equity and debt securities without regard to the underlying financial condition of the issuer in certain cases.
The global financial markets and economic conditions may become dislocated or deteriorate, due to a variety of factors beyond the control of the Company. The general partners of the funds held by the Company may face reduced opportunities to sell and realise value from their existing portfolio companies, and portfolio companies may employ substantial indebtedness that may be difficult to extend or replace and which may magnify the impact of any valuation changes.
In addition, while difficult market conditions may increase opportunities to make certain distressed asset investments, such conditions also increase the risk of default with respect to portfolio companies with debt investments. Such defaults would adversely affect the profitability and net asset values of the investment funds in the Company’s portfolio, and consequently, the profitability, Net Asset Value and share price of the Company. Furthermore, during periods of adverse economic conditions, the Company may have difficulty accessing financial markets, which could make it more difficult or impossible for the Company to obtain funding for additional investments and harm its profitability, Net Asset Value and share price. Deteriorating conditions in the global financial markets, and actions by governments to address them, have created a great deal of uncertainty for the asset management industry, which may adversely affect the Company’s investments, access to financing, competitive landscape and overall performance.
Management of market risks The Company's strategy on the management of market risk is driven by its investment objective. The primary investment objective is to achieve both short and long‐term capital appreciation by investing in a well diversified portfolio of private equity fund interests and direct investments primarily purchased in the secondary market. The Company also makes investments in individual companies by co‐investing with private equity sponsors. These investments are generally illiquid and non‐public, however the Company may at times invest in publicly listed securities. The Company's market risks are managed on an ongoing basis by the Manager and are discussed with the Board of Directors on a quarterly basis.
The Manager works to mitigate risk by building a diversified portfolio, focusing on achieving a balance across managers, investment styles, industrial sectors and geographical focus.
Notes to the Financial Statements continued
54 JPEL Private Equity Limited
ANNUAL REPORT AND FINANCIAL STATEMENTS 30 JUNE 2017
3. FINANCIAL INSTRUMENTS AND FINANCIAL RISK MANAGEMENT OBJECTIVES continued Management of market risks continued The Manager will also seek to invest in funds created during different vintage years to dampen systemic economic conditions that may impact the private equity market in any given year. Details of the nature of the Company’s investment portfolio at the reporting date are disclosed in the Portfolio Review on pages 14 to 16.
The Manager invests on a highly selective basis and seeks opportunities with high quality private equity investment firms that have proven track records and capabilities. The Manager will validate a given firm’s underlying investment thesis and evaluate its ability to successfully invest in private equity prior to proceeding with any investment. In addition, the Company’s secondary investment strategy enables the Manager to evaluate specific private equity assets.
This permits the Manager to diversify its portfolio at the company level as well as the fund manager level and to determine that assets are purchased at valuations acceptable to the Manager. The Manager actively manages the investment portfolio by meeting with private equity sponsors to discuss current and prospective investments.
Exposure to interest rate risk The Company's exposure to the risk of changes in interest rates relates primarily to cash and cash equivalents and floating rate debt obligations. The Company has incurred, and expects to continue to incur, indebtedness to fund its liquidity needs and to potentially leverage certain investments. Due to the foregoing, the Company is, and believes that it will continue to be, exposed to risks associated with movements in prevailing interest rates. An increase in interest rates could make it more difficult or expensive to obtain debt financing, could negatively impact the values of debt securities, and could decrease the returns that investments generate or cause them to generate losses.
The Company is, and believes that it will continue to be, subject to additional risks associated with changes in prevailing interest rates due to the fact that its capital is invested in underlying portfolio companies whose capital structures may have a significant degree of indebtedness. Investments in leveraged companies are inherently more sensitive to declines in revenues, increases in expenses and interest rates and adverse economic, market and industry developments. A leveraged company’s income and net assets also tend to increase or decrease at a greater rate than would be the case if money had not been borrowed. As a result, the risk of loss associated with an investment in a leveraged company is generally greater than for companies with comparably less debt.
The Company’s credit facility is based on the US Dollar London Interbank Offer Rate (LIBOR) or Euro Interbank Offered Rate (EURIBOR) as applicable.
The majority of the Company’s assets are non‐interest bearing, however the assets that do have interest rate exposure are primarily related to investments in mezzanine and special situation private equity funds. In addition, excess cash held by the Company may be invested in short‐term fixed deposit accounts that are rolled over on a weekly basis and are impacted by interest rate fluctuations as such giving the Company variable loans and cash deposits. The Company is therefore not significantly exposed to interest rate risk on its assets and liabilities.
The Company also maintains zero dividend preference shares (“ZDP Shares”) at a fixed rate, and is therefore not impacted by interest rate fluctuations. The market value of the ZDP Shares from time to time will be affected by changes in general interest rates, with upward movements in interest rates likely to lead to reductions in the market value of the ZDP Shares.
Recourse on external borrowings will only be undertaken if the Directors and the Manager consider the prevailing interest rates favourable and that the terms and conditions attaching to such borrowings are acceptable, having regard to the investment objective and policy of the Company.
Such borrowings are also limited in size by the Company’s internal policies. On 5 September 2012, a shareholder resolution was passed amending the Company’s borrowing powers to 30% of Total Assets, as defined in the Company’s Articles of Incorporation. The Company’s overall interest risks and day‐to‐day decision making are managed on an ongoing basis by the Manager in accordance with its internal policies. The Board of Directors are consulted on a quarterly basis, or more frequently as the case may be.
In respect of income‐earning financial assets and interest‐bearing financial liabilities, the following table classifies the financial assets and liabilities by fixed and variable rate instruments.
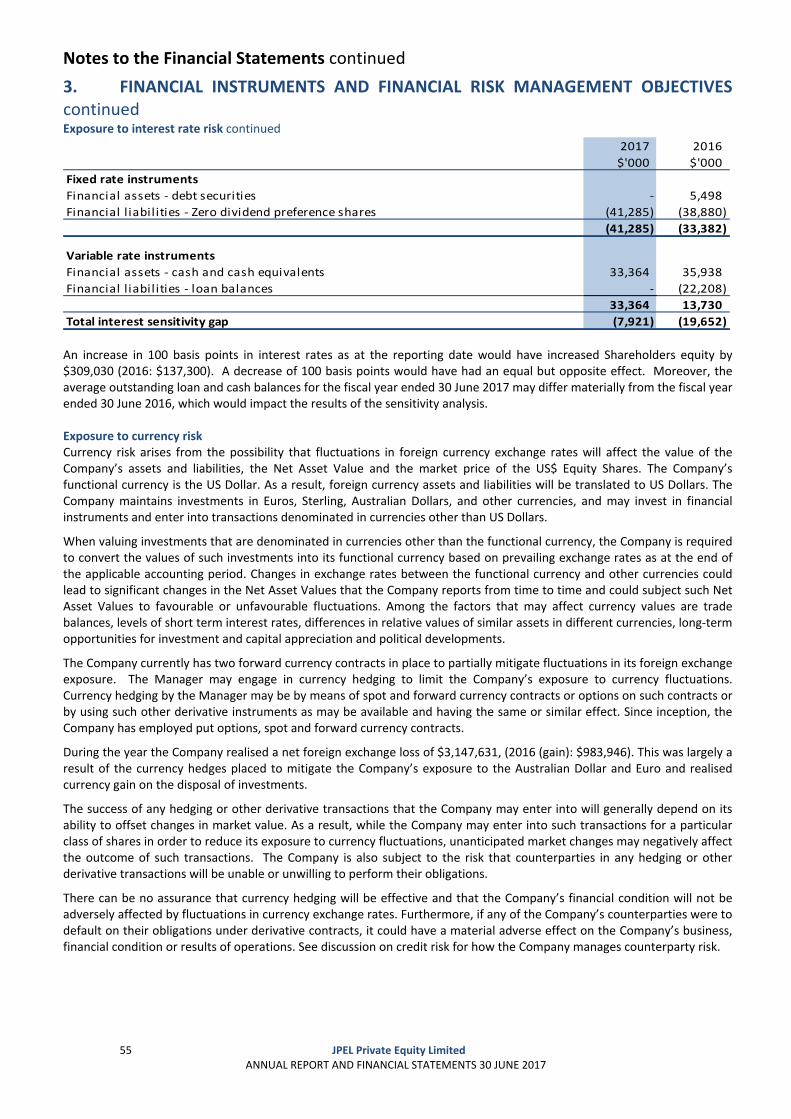
Notes to the Financial Statements continued
55 JPEL Private Equity Limited
ANNUAL REPORT AND FINANCIAL STATEMENTS 30 JUNE 2017
3. FINANCIAL INSTRUMENTS AND FINANCIAL RISK MANAGEMENT OBJECTIVES continued Exposure to interest rate risk continued
2017 2016
$'000 $'000
Fixed rate instruments
Financial assets ‐ debt securities ‐ 5,498
Financial l iabil ities ‐ Zero dividend preference shares (41,285) (38,880)
(41,285) (33,382)
Variable rate instruments
Financial assets ‐ cash and cash equivalents 33,364 35,938
Financial l iabil ities ‐ loan balances ‐ (22,208)
33,364 13,730
Total interest sensitivity gap (7,921) (19,652) An increase in 100 basis points in interest rates as at the reporting date would have increased Shareholders equity by $309,030 (2016: $137,300). A decrease of 100 basis points would have had an equal but opposite effect. Moreover, the average outstanding loan and cash balances for the fiscal year ended 30 June 2017 may differ materially from the fiscal year ended 30 June 2016, which would impact the results of the sensitivity analysis. Exposure to currency risk Currency risk arises from the possibility that fluctuations in foreign currency exchange rates will affect the value of the Company’s assets and liabilities, the Net Asset Value and the market price of the US$ Equity Shares. The Company’s functional currency is the US Dollar. As a result, foreign currency assets and liabilities will be translated to US Dollars. The Company maintains investments in Euros, Sterling, Australian Dollars, and other currencies, and may invest in financial instruments and enter into transactions denominated in currencies other than US Dollars.
When valuing investments that are denominated in currencies other than the functional currency, the Company is required to convert the values of such investments into its functional currency based on prevailing exchange rates as at the end of the applicable accounting period. Changes in exchange rates between the functional currency and other currencies could lead to significant changes in the Net Asset Values that the Company reports from time to time and could subject such Net Asset Values to favourable or unfavourable fluctuations. Among the factors that may affect currency values are trade balances, levels of short term interest rates, differences in relative values of similar assets in different currencies, long‐term opportunities for investment and capital appreciation and political developments.
The Company currently has two forward currency contracts in place to partially mitigate fluctuations in its foreign exchange exposure. The Manager may engage in currency hedging to limit the Company’s exposure to currency fluctuations. Currency hedging by the Manager may be by means of spot and forward currency contracts or options on such contracts or by using such other derivative instruments as may be available and having the same or similar effect. Since inception, the Company has employed put options, spot and forward currency contracts.
During the year the Company realised a net foreign exchange loss of $3,147,631, (2016 (gain): $983,946). This was largely a result of the currency hedges placed to mitigate the Company’s exposure to the Australian Dollar and Euro and realised currency gain on the disposal of investments.
The success of any hedging or other derivative transactions that the Company may enter into will generally depend on its ability to offset changes in market value. As a result, while the Company may enter into such transactions for a particular class of shares in order to reduce its exposure to currency fluctuations, unanticipated market changes may negatively affect the outcome of such transactions. The Company is also subject to the risk that counterparties in any hedging or other derivative transactions will be unable or unwilling to perform their obligations.
There can be no assurance that currency hedging will be effective and that the Company’s financial condition will not be adversely affected by fluctuations in currency exchange rates. Furthermore, if any of the Company’s counterparties were to default on their obligations under derivative contracts, it could have a material adverse effect on the Company’s business, financial condition or results of operations. See discussion on credit risk for how the Company manages counterparty risk.
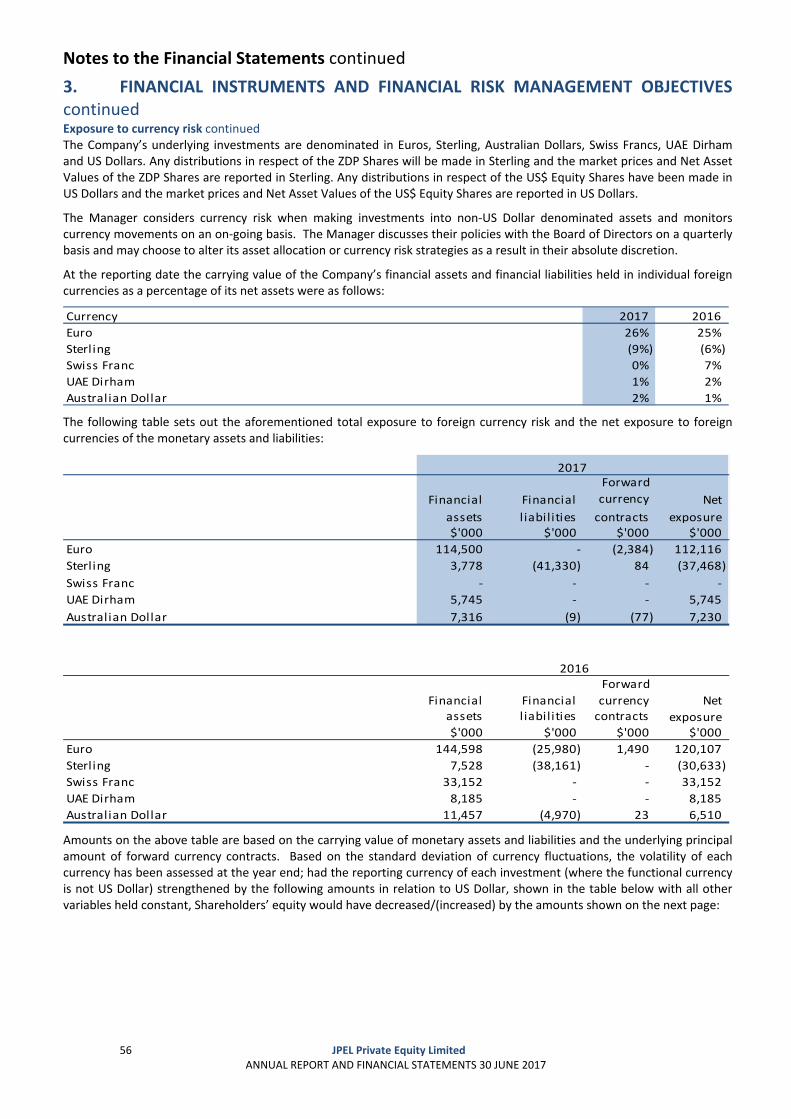
Notes to the Financial Statements continued
56 JPEL Private Equity Limited
ANNUAL REPORT AND FINANCIAL STATEMENTS 30 JUNE 2017
3. FINANCIAL INSTRUMENTS AND FINANCIAL RISK MANAGEMENT OBJECTIVES continued Exposure to currency risk continued The Company’s underlying investments are denominated in Euros, Sterling, Australian Dollars, Swiss Francs, UAE Dirham and US Dollars. Any distributions in respect of the ZDP Shares will be made in Sterling and the market prices and Net Asset Values of the ZDP Shares are reported in Sterling. Any distributions in respect of the US$ Equity Shares have been made in US Dollars and the market prices and Net Asset Values of the US$ Equity Shares are reported in US Dollars.
The Manager considers currency risk when making investments into non‐US Dollar denominated assets and monitors currency movements on an on‐going basis. The Manager discusses their policies with the Board of Directors on a quarterly basis and may choose to alter its asset allocation or currency risk strategies as a result in their absolute discretion.
At the reporting date the carrying value of the Company’s financial assets and financial liabilities held in individual foreign currencies as a percentage of its net assets were as follows:
Currency 2017 2016
Euro 26% 25%
Sterling (9%) (6%)
Swiss Franc 0% 7%
UAE Dirham 1% 2%
Australian Dollar 2% 1%
The following table sets out the aforementioned total exposure to foreign currency risk and the net exposure to foreign currencies of the monetary assets and liabilities:
Financial Financial
Forward
currency Net
assets liabilities contracts exposure$'000 $'000 $'000 $'000
Euro 114,500 ‐ (2,384) 112,116
Sterling 3,778 (41,330) 84 (37,468)
Swiss Franc ‐ ‐ ‐ ‐
UAE Dirham 5,745 ‐ ‐ 5,745
Australian Dollar 7,316 (9) (77) 7,230
Financial Financial
Forward
currency Netassets liabilities contracts exposure$'000 $'000 $'000 $'000
Euro 144,598 (25,980) 1,490 120,107
Sterling 7,528 (38,161) ‐ (30,633)
Swiss Franc 33,152 ‐ ‐ 33,152
UAE Dirham 8,185 ‐ ‐ 8,185
Australian Dollar 11,457 (4,970) 23 6,510
2016
2017
Amounts on the above table are based on the carrying value of monetary assets and liabilities and the underlying principal amount of forward currency contracts. Based on the standard deviation of currency fluctuations, the volatility of each currency has been assessed at the year end; had the reporting currency of each investment (where the functional currency is not US Dollar) strengthened by the following amounts in relation to US Dollar, shown in the table below with all other variables held constant, Shareholders’ equity would have decreased/(increased) by the amounts shown on the next page:
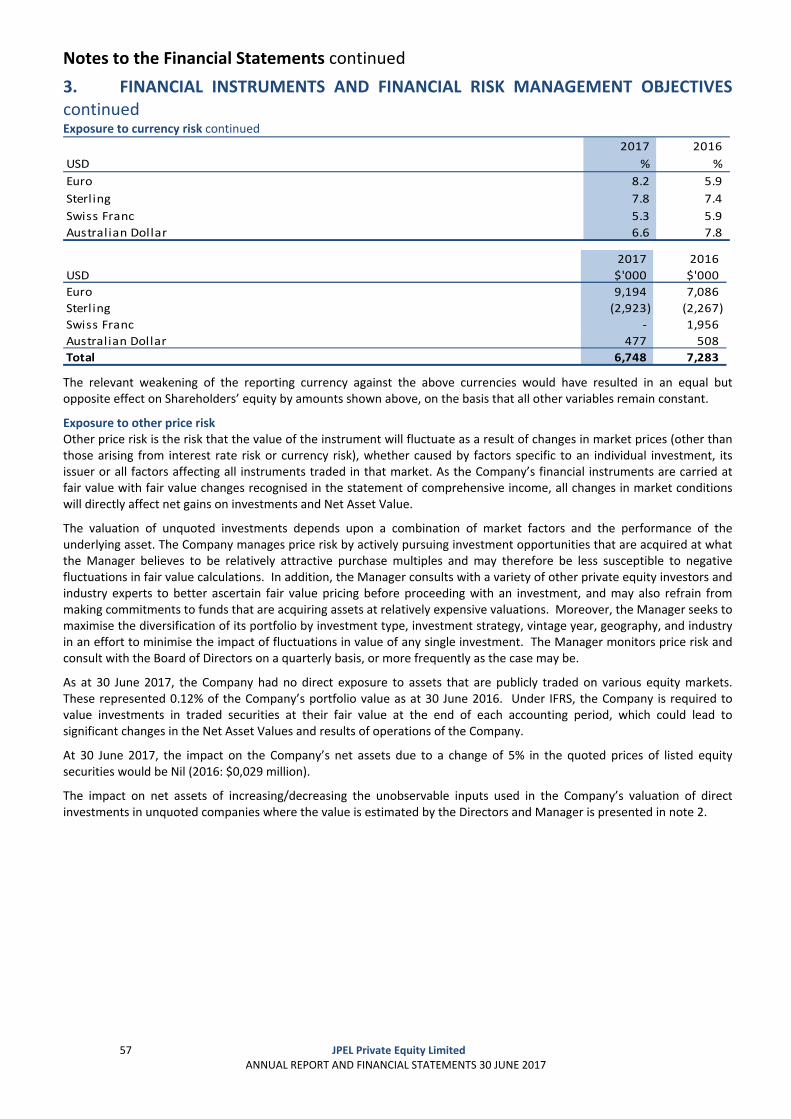
Notes to the Financial Statements continued
57 JPEL Private Equity Limited
ANNUAL REPORT AND FINANCIAL STATEMENTS 30 JUNE 2017
3. FINANCIAL INSTRUMENTS AND FINANCIAL RISK MANAGEMENT OBJECTIVES continued Exposure to currency risk continued
2017 2016
USD % %
Euro 8.2 5.9
Sterling 7.8 7.4
Swiss Franc 5.3 5.9
Australian Dollar 6.6 7.8
2017 2016
USD $'000 $'000
Euro 9,194 7,086
Sterling (2,923) (2,267)
Swiss Franc ‐ 1,956
Australian Dollar 477 508
Total 6,748 7,283
The relevant weakening of the reporting currency against the above currencies would have resulted in an equal but opposite effect on Shareholders’ equity by amounts shown above, on the basis that all other variables remain constant.
Exposure to other price risk Other price risk is the risk that the value of the instrument will fluctuate as a result of changes in market prices (other than those arising from interest rate risk or currency risk), whether caused by factors specific to an individual investment, its issuer or all factors affecting all instruments traded in that market. As the Company’s financial instruments are carried at fair value with fair value changes recognised in the statement of comprehensive income, all changes in market conditions will directly affect net gains on investments and Net Asset Value.
The valuation of unquoted investments depends upon a combination of market factors and the performance of the underlying asset. The Company manages price risk by actively pursuing investment opportunities that are acquired at what the Manager believes to be relatively attractive purchase multiples and may therefore be less susceptible to negative fluctuations in fair value calculations. In addition, the Manager consults with a variety of other private equity investors and industry experts to better ascertain fair value pricing before proceeding with an investment, and may also refrain from making commitments to funds that are acquiring assets at relatively expensive valuations. Moreover, the Manager seeks to maximise the diversification of its portfolio by investment type, investment strategy, vintage year, geography, and industry in an effort to minimise the impact of fluctuations in value of any single investment. The Manager monitors price risk and consult with the Board of Directors on a quarterly basis, or more frequently as the case may be.
As at 30 June 2017, the Company had no direct exposure to assets that are publicly traded on various equity markets. These represented 0.12% of the Company’s portfolio value as at 30 June 2016. Under IFRS, the Company is required to value investments in traded securities at their fair value at the end of each accounting period, which could lead to significant changes in the Net Asset Values and results of operations of the Company.
At 30 June 2017, the impact on the Company’s net assets due to a change of 5% in the quoted prices of listed equity securities would be Nil (2016: $0,029 million).
The impact on net assets of increasing/decreasing the unobservable inputs used in the Company’s valuation of direct investments in unquoted companies where the value is estimated by the Directors and Manager is presented in note 2.
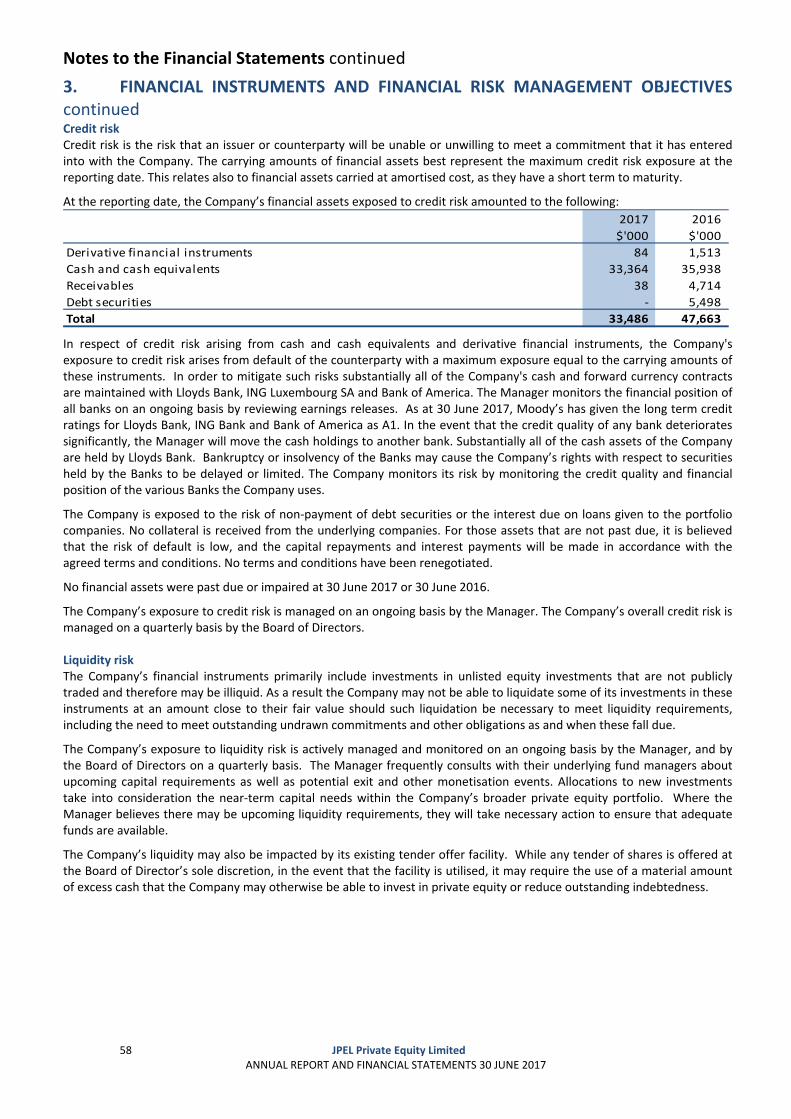
Notes to the Financial Statements continued
58 JPEL Private Equity Limited
ANNUAL REPORT AND FINANCIAL STATEMENTS 30 JUNE 2017
3. FINANCIAL INSTRUMENTS AND FINANCIAL RISK MANAGEMENT OBJECTIVES continued Credit risk Credit risk is the risk that an issuer or counterparty will be unable or unwilling to meet a commitment that it has entered into with the Company. The carrying amounts of financial assets best represent the maximum credit risk exposure at the reporting date. This relates also to financial assets carried at amortised cost, as they have a short term to maturity.
At the reporting date, the Company’s financial assets exposed to credit risk amounted to the following:
2017 2016
$'000 $'000
Derivative financial instruments 84 1,513
Cash and cash equivalents 33,364 35,938
Receivables 38 4,714
Debt securities ‐ 5,498
Total 33,486 47,663
In respect of credit risk arising from cash and cash equivalents and derivative financial instruments, the Company's exposure to credit risk arises from default of the counterparty with a maximum exposure equal to the carrying amounts of these instruments. In order to mitigate such risks substantially all of the Company's cash and forward currency contracts are maintained with Lloyds Bank, ING Luxembourg SA and Bank of America. The Manager monitors the financial position of all banks on an ongoing basis by reviewing earnings releases. As at 30 June 2017, Moody’s has given the long term credit ratings for Lloyds Bank, ING Bank and Bank of America as A1. In the event that the credit quality of any bank deteriorates significantly, the Manager will move the cash holdings to another bank. Substantially all of the cash assets of the Company are held by Lloyds Bank. Bankruptcy or insolvency of the Banks may cause the Company’s rights with respect to securities held by the Banks to be delayed or limited. The Company monitors its risk by monitoring the credit quality and financial position of the various Banks the Company uses.
The Company is exposed to the risk of non‐payment of debt securities or the interest due on loans given to the portfolio companies. No collateral is received from the underlying companies. For those assets that are not past due, it is believed that the risk of default is low, and the capital repayments and interest payments will be made in accordance with the agreed terms and conditions. No terms and conditions have been renegotiated.
No financial assets were past due or impaired at 30 June 2017 or 30 June 2016.
The Company’s exposure to credit risk is managed on an ongoing basis by the Manager. The Company’s overall credit risk is managed on a quarterly basis by the Board of Directors. Liquidity risk The Company’s financial instruments primarily include investments in unlisted equity investments that are not publicly traded and therefore may be illiquid. As a result the Company may not be able to liquidate some of its investments in these instruments at an amount close to their fair value should such liquidation be necessary to meet liquidity requirements, including the need to meet outstanding undrawn commitments and other obligations as and when these fall due.
The Company’s exposure to liquidity risk is actively managed and monitored on an ongoing basis by the Manager, and by the Board of Directors on a quarterly basis. The Manager frequently consults with their underlying fund managers about upcoming capital requirements as well as potential exit and other monetisation events. Allocations to new investments take into consideration the near‐term capital needs within the Company’s broader private equity portfolio. Where the Manager believes there may be upcoming liquidity requirements, they will take necessary action to ensure that adequate funds are available.
The Company’s liquidity may also be impacted by its existing tender offer facility. While any tender of shares is offered at the Board of Director’s sole discretion, in the event that the facility is utilised, it may require the use of a material amount of excess cash that the Company may otherwise be able to invest in private equity or reduce outstanding indebtedness.
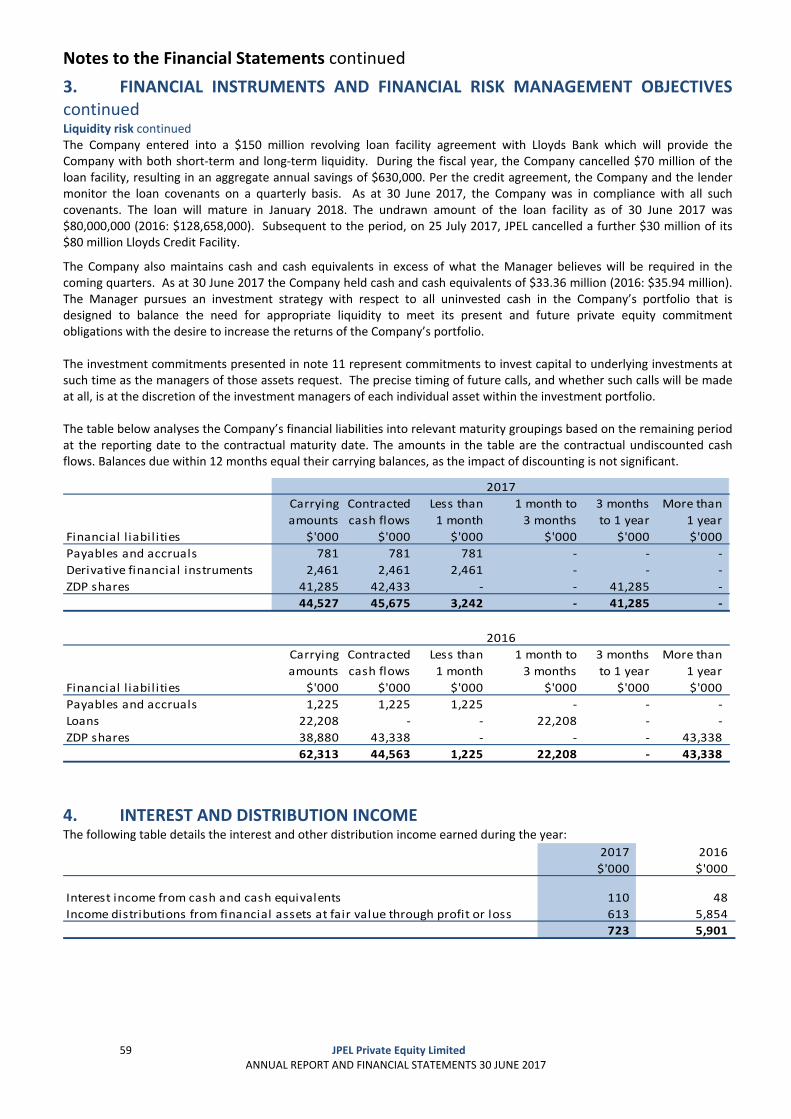
Notes to the Financial Statements continued
59 JPEL Private Equity Limited
ANNUAL REPORT AND FINANCIAL STATEMENTS 30 JUNE 2017
3. FINANCIAL INSTRUMENTS AND FINANCIAL RISK MANAGEMENT OBJECTIVES continued Liquidity risk continued The Company entered into a $150 million revolving loan facility agreement with Lloyds Bank which will provide the Company with both short‐term and long‐term liquidity. During the fiscal year, the Company cancelled $70 million of the loan facility, resulting in an aggregate annual savings of $630,000. Per the credit agreement, the Company and the lender monitor the loan covenants on a quarterly basis. As at 30 June 2017, the Company was in compliance with all such covenants. The loan will mature in January 2018. The undrawn amount of the loan facility as of 30 June 2017 was $80,000,000 (2016: $128,658,000). Subsequent to the period, on 25 July 2017, JPEL cancelled a further $30 million of its $80 million Lloyds Credit Facility.
The Company also maintains cash and cash equivalents in excess of what the Manager believes will be required in the coming quarters. As at 30 June 2017 the Company held cash and cash equivalents of $33.36 million (2016: $35.94 million). The Manager pursues an investment strategy with respect to all uninvested cash in the Company’s portfolio that is designed to balance the need for appropriate liquidity to meet its present and future private equity commitment obligations with the desire to increase the returns of the Company’s portfolio. The investment commitments presented in note 11 represent commitments to invest capital to underlying investments at such time as the managers of those assets request. The precise timing of future calls, and whether such calls will be made at all, is at the discretion of the investment managers of each individual asset within the investment portfolio. The table below analyses the Company’s financial liabilities into relevant maturity groupings based on the remaining period at the reporting date to the contractual maturity date. The amounts in the table are the contractual undiscounted cash flows. Balances due within 12 months equal their carrying balances, as the impact of discounting is not significant.
Carrying Contracted Less than 1 month to 3 months More than
amounts cash flows 1 month 3 months to 1 year 1 year
Financial l iabil ities $'000 $'000 $'000 $'000 $'000 $'000
Payables and accruals 781 781 781 ‐ ‐ ‐
Derivative financial instruments 2,461 2,461 2,461 ‐ ‐ ‐
ZDP shares 41,285 42,433 ‐ ‐ 41,285 ‐
44,527 45,675 3,242 ‐ 41,285 ‐
2017
Carrying Contracted Less than 1 month to 3 months More than
amounts cash flows 1 month 3 months to 1 year 1 year
Financial l iabil ities $'000 $'000 $'000 $'000 $'000 $'000
Payables and accruals 1,225 1,225 1,225 ‐ ‐ ‐
Loans 22,208 ‐ ‐ 22,208 ‐ ‐
ZDP shares 38,880 43,338 ‐ ‐ ‐ 43,338
62,313 44,563 1,225 22,208 ‐ 43,338
2016
4. INTEREST AND DISTRIBUTION INCOME The following table details the interest and other distribution income earned during the year:
2017 2016
$'000 $'000
Interest income from cash and cash equivalents 110 48
Income distributions from financial assets at fair value through profit or loss 613 5,854
723 5,901
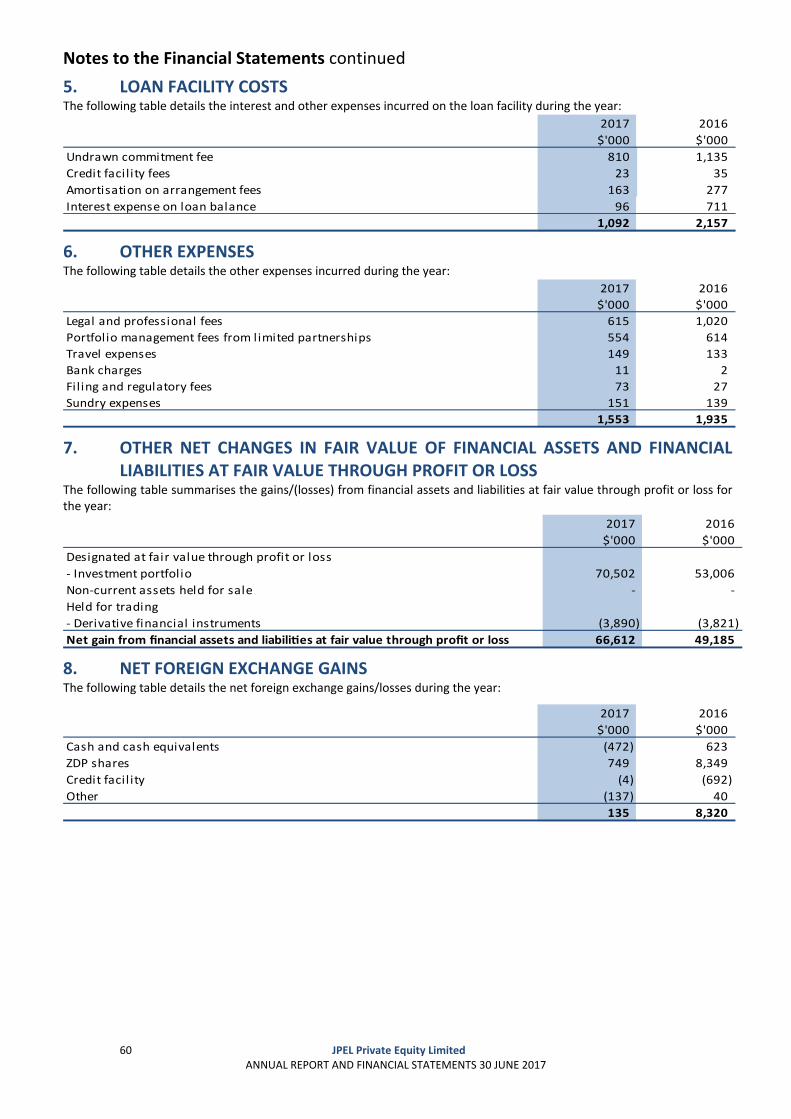
Notes to the Financial Statements continued
60 JPEL Private Equity Limited
ANNUAL REPORT AND FINANCIAL STATEMENTS 30 JUNE 2017
5. LOAN FACILITY COSTS The following table details the interest and other expenses incurred on the loan facility during the year:
2017 2016
$'000 $'000
810 1,135
23 35
163 277
Interest expense on loan balance 96 711
1,092 2,157
Undrawn commitment fee
Amortisation on arrangement fees
Credit facility fees
6. OTHER EXPENSES The following table details the other expenses incurred during the year:
2017 2016
$'000 $'000
Legal and professional fees 615 1,020
Portfolio management fees from l imited partnerships 554 614
Travel expenses 149 133
Bank charges 11 2
Filing and regulatory fees 73 27
Sundry expenses 151 139
1,553 1,935
7. OTHER NET CHANGES IN FAIR VALUE OF FINANCIAL ASSETS AND FINANCIAL LIABILITIES AT FAIR VALUE THROUGH PROFIT OR LOSS
The following table summarises the gains/(losses) from financial assets and liabilities at fair value through profit or loss for the year:
2017 2016
$'000 $'000
Designated at fair value through profit or loss
‐ Investment portfolio 70,502 53,006
Non‐current assets held for sale ‐ ‐
Held for trading
‐ Derivative financial instruments (3,890) (3,821)
Net gain from financial assets and liabili es at fair value through profit or loss 66,612 49,185
8. NET FOREIGN EXCHANGE GAINS The following table details the net foreign exchange gains/losses during the year:
2017 2016
$'000 $'000
Cash and cash equivalents (472) 623
ZDP shares 749 8,349
Credit facil ity (4) (692)
Other (137) 40
135 8,320
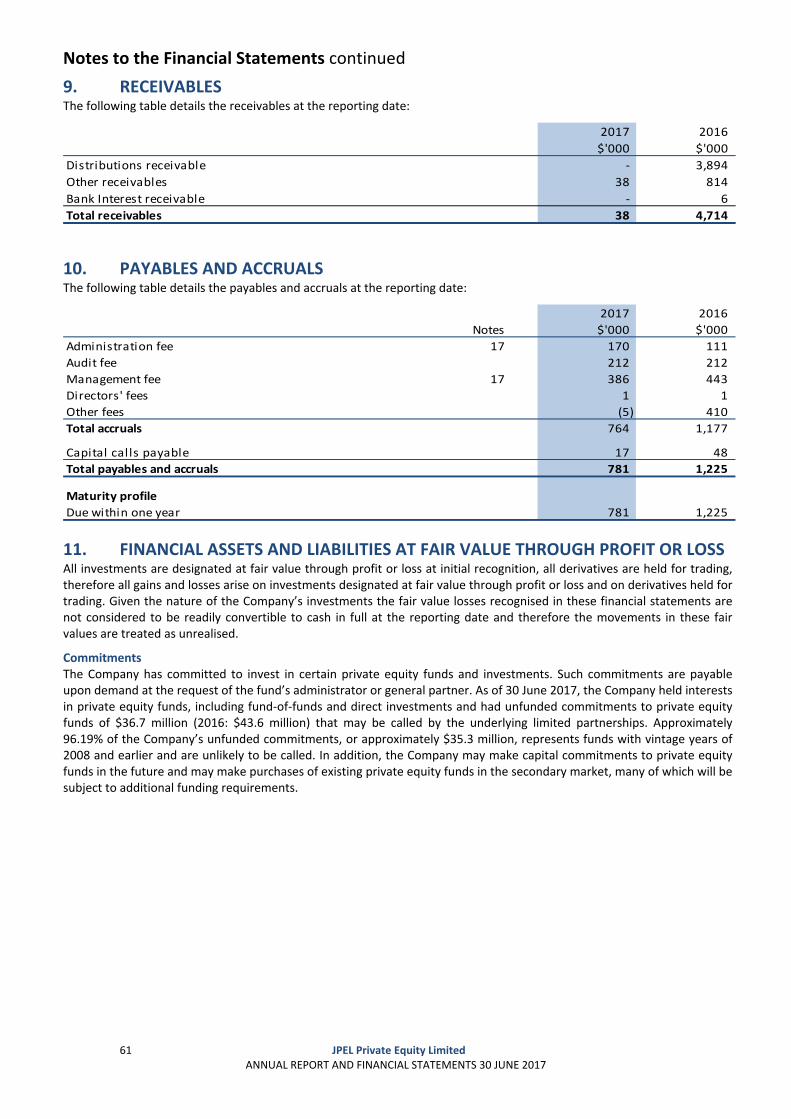
Notes to the Financial Statements continued
61 JPEL Private Equity Limited
ANNUAL REPORT AND FINANCIAL STATEMENTS 30 JUNE 2017
9. RECEIVABLES The following table details the receivables at the reporting date:
2017 2016
$'000 $'000
Distributions receivable ‐ 3,894
Other receivables 38 814
Bank Interest receivable ‐ 6
Total receivables 38 4,714
10. PAYABLES AND ACCRUALS The following table details the payables and accruals at the reporting date:
2017 2016
Notes $'000 $'000
Administration fee 17 170 111
Audit fee 212 212
Management fee 17 386 443
Directors' fees 1 1
Other fees (5) 410
Total accruals 764 1,177
Capital calls payable 17 48
Total payables and accruals 781 1,225
Maturity profile
Due within one year 781 1,225
11. FINANCIAL ASSETS AND LIABILITIES AT FAIR VALUE THROUGH PROFIT OR LOSS All investments are designated at fair value through profit or loss at initial recognition, all derivatives are held for trading, therefore all gains and losses arise on investments designated at fair value through profit or loss and on derivatives held for trading. Given the nature of the Company’s investments the fair value losses recognised in these financial statements are not considered to be readily convertible to cash in full at the reporting date and therefore the movements in these fair values are treated as unrealised.
Commitments The Company has committed to invest in certain private equity funds and investments. Such commitments are payable upon demand at the request of the fund’s administrator or general partner. As of 30 June 2017, the Company held interests in private equity funds, including fund‐of‐funds and direct investments and had unfunded commitments to private equity funds of $36.7 million (2016: $43.6 million) that may be called by the underlying limited partnerships. Approximately 96.19% of the Company’s unfunded commitments, or approximately $35.3 million, represents funds with vintage years of 2008 and earlier and are unlikely to be called. In addition, the Company may make capital commitments to private equity funds in the future and may make purchases of existing private equity funds in the secondary market, many of which will be subject to additional funding requirements.
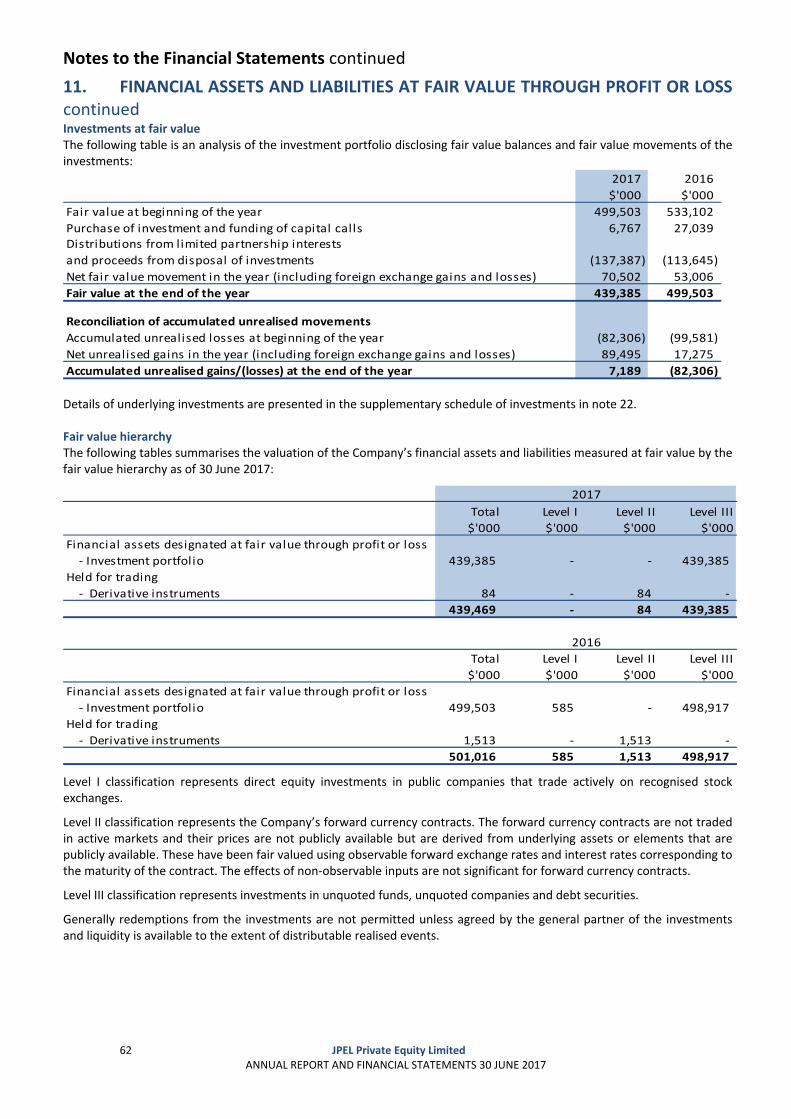
Notes to the Financial Statements continued
62 JPEL Private Equity Limited
ANNUAL REPORT AND FINANCIAL STATEMENTS 30 JUNE 2017
11. FINANCIAL ASSETS AND LIABILITIES AT FAIR VALUE THROUGH PROFIT OR LOSS continued Investments at fair value The following table is an analysis of the investment portfolio disclosing fair value balances and fair value movements of the investments:
2017 2016
$'000 $'000
Fair value at beginning of the year 499,503 533,102
Purchase of investment and funding of capital calls 6,767 27,039
(137,387) (113,645)
Net fair value movement in the year (including foreign exchange gains and losses) 70,502 53,006
Fair value at the end of the year 439,385 499,503
Reconciliation of accumulated unrealised movements
Accumulated unrealised losses at beginning of the year (82,306) (99,581)
89,495 17,275
Accumulated unrealised gains/(losses) at the end of the year 7,189 (82,306)
Distributions from l imited partnership interests
and proceeds from disposal of investments
Net unrealised gains in the year (including foreign exchange gains and losses)
Details of underlying investments are presented in the supplementary schedule of investments in note 22. Fair value hierarchy The following tables summarises the valuation of the Company’s financial assets and liabilities measured at fair value by the fair value hierarchy as of 30 June 2017:
Total
$'000
Level I
$'000
Level II
$'000
Level III
$'000
Financial assets designated at fair value through profit or loss
‐ Investment portfolio 439,385 ‐ ‐ 439,385
Held for trading
‐ Derivative instruments 84 ‐ 84 ‐
439,469 ‐ 84 439,385
Total
$'000
Level I
$'000
Level II
$'000
Level III
$'000
Financial assets designated at fair value through profit or loss
‐ Investment portfolio 499,503 585 ‐ 498,917
Held for trading
‐ Derivative instruments 1,513 ‐ 1,513 ‐
501,016 585 1,513 498,917
2017
2016
Level I classification represents direct equity investments in public companies that trade actively on recognised stock exchanges.
Level II classification represents the Company’s forward currency contracts. The forward currency contracts are not traded in active markets and their prices are not publicly available but are derived from underlying assets or elements that are publicly available. These have been fair valued using observable forward exchange rates and interest rates corresponding to the maturity of the contract. The effects of non‐observable inputs are not significant for forward currency contracts.
Level III classification represents investments in unquoted funds, unquoted companies and debt securities.
Generally redemptions from the investments are not permitted unless agreed by the general partner of the investments and liquidity is available to the extent of distributable realised events.
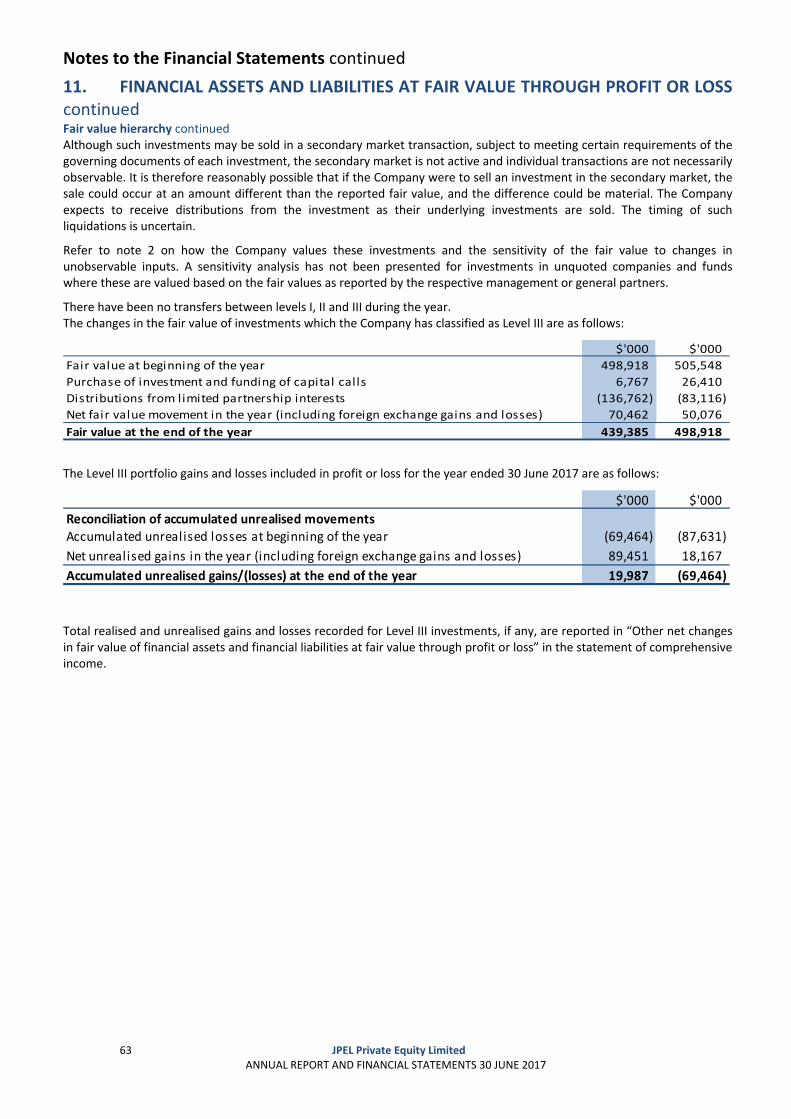
Notes to the Financial Statements continued
63 JPEL Private Equity Limited
ANNUAL REPORT AND FINANCIAL STATEMENTS 30 JUNE 2017
11. FINANCIAL ASSETS AND LIABILITIES AT FAIR VALUE THROUGH PROFIT OR LOSS continued Fair value hierarchy continued Although such investments may be sold in a secondary market transaction, subject to meeting certain requirements of the governing documents of each investment, the secondary market is not active and individual transactions are not necessarily observable. It is therefore reasonably possible that if the Company were to sell an investment in the secondary market, the sale could occur at an amount different than the reported fair value, and the difference could be material. The Company expects to receive distributions from the investment as their underlying investments are sold. The timing of such liquidations is uncertain.
Refer to note 2 on how the Company values these investments and the sensitivity of the fair value to changes in unobservable inputs. A sensitivity analysis has not been presented for investments in unquoted companies and funds where these are valued based on the fair values as reported by the respective management or general partners.
There have been no transfers between levels I, II and III during the year. The changes in the fair value of investments which the Company has classified as Level III are as follows:
$'000 $'000
Fair value at beginning of the year 498,918 505,548
Purchase of investment and funding of capital calls 6,767 26,410
Distributions from l imited partnership interests (136,762) (83,116)
Net fair value movement in the year (including foreign exchange gains and losses) 70,462 50,076
Fair value at the end of the year 439,385 498,918
The Level III portfolio gains and losses included in profit or loss for the year ended 30 June 2017 are as follows:
$'000 $'000
Reconciliation of accumulated unrealised movementsAccumulated unrealised losses at beginning of the year (69,464) (87,631)
89,451 18,167
Accumulated unrealised gains/(losses) at the end of the year 19,987 (69,464)
Net unrealised gains in the year (including foreign exchange gains and losses)
Total realised and unrealised gains and losses recorded for Level III investments, if any, are reported in “Other net changes in fair value of financial assets and financial liabilities at fair value through profit or loss” in the statement of comprehensive income.
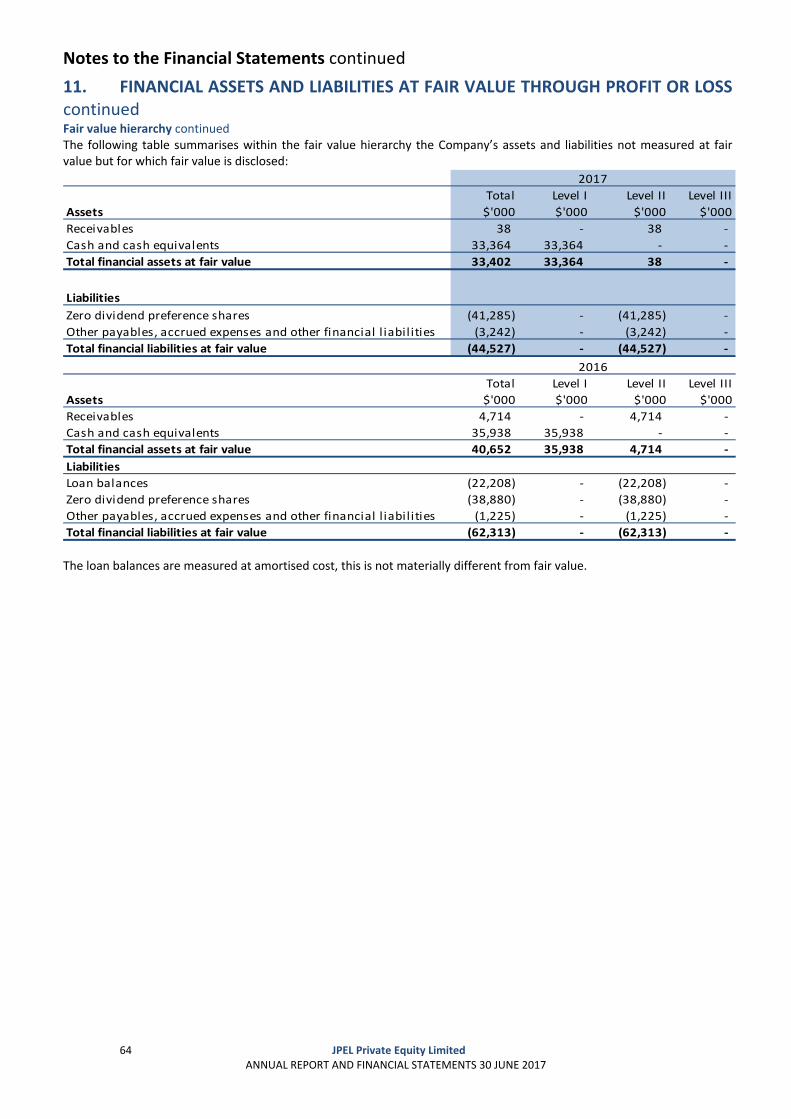
Notes to the Financial Statements continued
64 JPEL Private Equity Limited
ANNUAL REPORT AND FINANCIAL STATEMENTS 30 JUNE 2017
11. FINANCIAL ASSETS AND LIABILITIES AT FAIR VALUE THROUGH PROFIT OR LOSS continued Fair value hierarchy continued The following table summarises within the fair value hierarchy the Company’s assets and liabilities not measured at fair value but for which fair value is disclosed:
Assets
Total
$'000
Level I
$'000
Level II
$'000
Level III
$'000
Receivables 38 ‐ 38 ‐
Cash and cash equivalents 33,364 33,364 ‐ ‐
Total financial assets at fair value 33,402 33,364 38 ‐
Liabilities
Zero dividend preference shares (41,285) ‐ (41,285) ‐
Other payables, accrued expenses and other financial l iabil ities (3,242) ‐ (3,242) ‐
Total financial liabilities at fair value (44,527) ‐ (44,527) ‐
2017
Assets
Total
$'000
Level I
$'000
Level II
$'000
Level III
$'000
Receivables 4,714 ‐ 4,714 ‐
Cash and cash equivalents 35,938 35,938 ‐ ‐
Total financial assets at fair value 40,652 35,938 4,714 ‐
Liabilities
Loan balances (22,208) ‐ (22,208) ‐
Zero dividend preference shares (38,880) ‐ (38,880) ‐
Other payables, accrued expenses and other financial l iabilities (1,225) ‐ (1,225) ‐
Total financial liabilities at fair value (62,313) ‐ (62,313) ‐
2016
The loan balances are measured at amortised cost, this is not materially different from fair value.
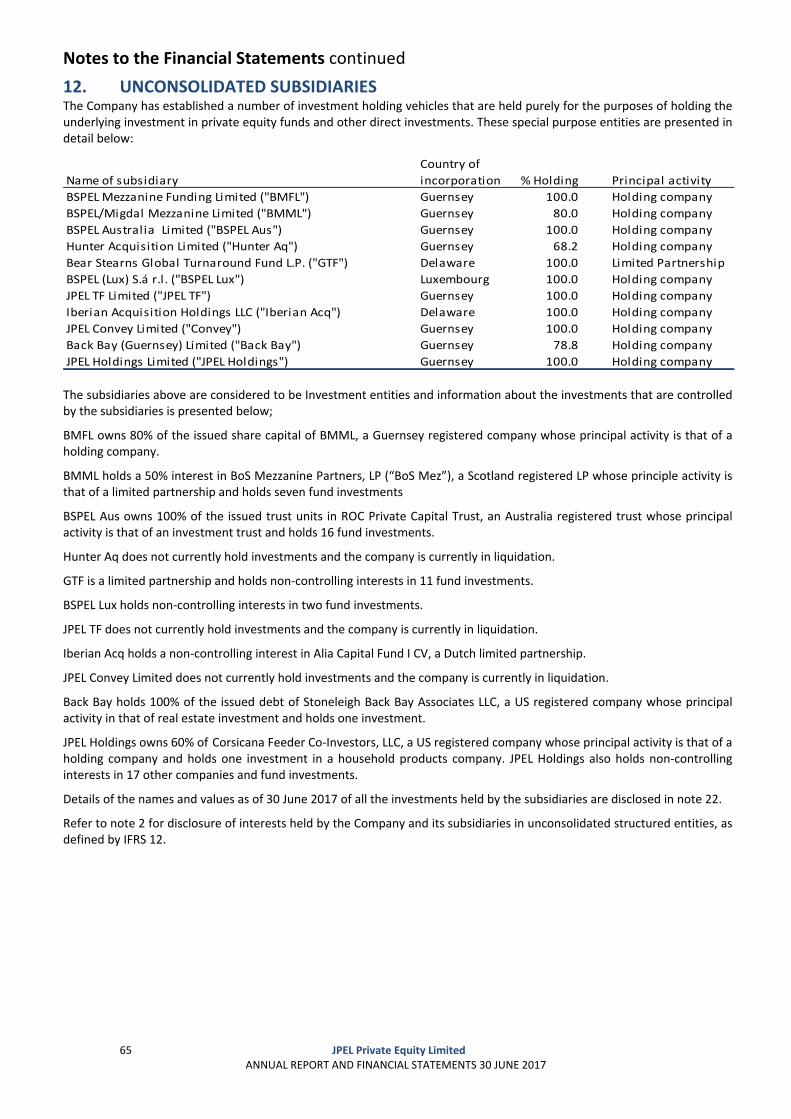
Notes to the Financial Statements continued
65 JPEL Private Equity Limited
ANNUAL REPORT AND FINANCIAL STATEMENTS 30 JUNE 2017
12. UNCONSOLIDATED SUBSIDIARIES The Company has established a number of investment holding vehicles that are held purely for the purposes of holding the underlying investment in private equity funds and other direct investments. These special purpose entities are presented in detail below:
Name of subsidiary
Country of
incorporation % Holding Principal activity
BSPEL Mezzanine Funding Limited ("BMFL") Guernsey 100.0 Holding company
BSPEL/Migdal Mezzanine Limited ("BMML") Guernsey 80.0 Holding company
BSPEL Australia Limited ("BSPEL Aus") Guernsey 100.0 Holding company
Hunter Acquisition Limited ("Hunter Aq") Guernsey 68.2 Holding company
Bear Stearns Global Turnaround Fund L.P. ("GTF") Delaware 100.0 Limited Partnership
BSPEL (Lux) S.á r.l . ("BSPEL Lux") Luxembourg 100.0 Holding company
JPEL TF Limited ("JPEL TF") Guernsey 100.0 Holding company
Iberian Acquisition Holdings LLC ("Iberian Acq") Delaware 100.0 Holding company
JPEL Convey Limited ("Convey") Guernsey 100.0 Holding company
Back Bay (Guernsey) Limited ("Back Bay") Guernsey 78.8 Holding company
JPEL Holdings Limited ("JPEL Holdings") Guernsey 100.0 Holding company
The subsidiaries above are considered to be Investment entities and information about the investments that are controlled by the subsidiaries is presented below;
BMFL owns 80% of the issued share capital of BMML, a Guernsey registered company whose principal activity is that of a holding company.
BMML holds a 50% interest in BoS Mezzanine Partners, LP (“BoS Mez”), a Scotland registered LP whose principle activity is that of a limited partnership and holds seven fund investments
BSPEL Aus owns 100% of the issued trust units in ROC Private Capital Trust, an Australia registered trust whose principal activity is that of an investment trust and holds 16 fund investments.
Hunter Aq does not currently hold investments and the company is currently in liquidation.
GTF is a limited partnership and holds non‐controlling interests in 11 fund investments.
BSPEL Lux holds non‐controlling interests in two fund investments.
JPEL TF does not currently hold investments and the company is currently in liquidation.
Iberian Acq holds a non‐controlling interest in Alia Capital Fund I CV, a Dutch limited partnership.
JPEL Convey Limited does not currently hold investments and the company is currently in liquidation.
Back Bay holds 100% of the issued debt of Stoneleigh Back Bay Associates LLC, a US registered company whose principal activity in that of real estate investment and holds one investment.
JPEL Holdings owns 60% of Corsicana Feeder Co‐Investors, LLC, a US registered company whose principal activity is that of a holding company and holds one investment in a household products company. JPEL Holdings also holds non‐controlling interests in 17 other companies and fund investments.
Details of the names and values as of 30 June 2017 of all the investments held by the subsidiaries are disclosed in note 22.
Refer to note 2 for disclosure of interests held by the Company and its subsidiaries in unconsolidated structured entities, as defined by IFRS 12.
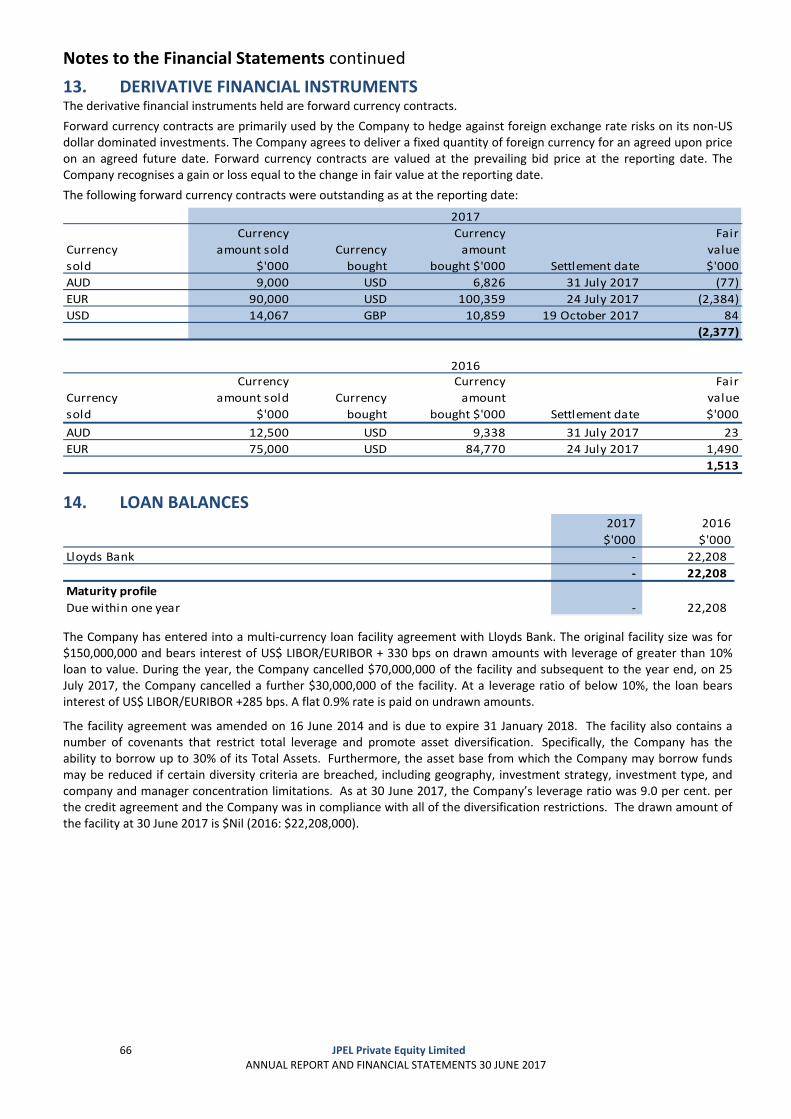
Notes to the Financial Statements continued
66 JPEL Private Equity Limited
ANNUAL REPORT AND FINANCIAL STATEMENTS 30 JUNE 2017
13. DERIVATIVE FINANCIAL INSTRUMENTS The derivative financial instruments held are forward currency contracts.
Forward currency contracts are primarily used by the Company to hedge against foreign exchange rate risks on its non‐US dollar dominated investments. The Company agrees to deliver a fixed quantity of foreign currency for an agreed upon price on an agreed future date. Forward currency contracts are valued at the prevailing bid price at the reporting date. The Company recognises a gain or loss equal to the change in fair value at the reporting date.
The following forward currency contracts were outstanding as at the reporting date:
Currency
sold
Currency
amount sold
$'000
Currency
bought
Currency
amount
bought $'000 Settlement date
Fair
value
$'000
AUD 9,000 USD 6,826 31 July 2017 (77)
EUR 90,000 USD 100,359 24 July 2017 (2,384)
USD 14,067 GBP 10,859 19 October 2017 84
(2,377)
Currency
sold
Currency
amount sold
$'000
Currency
bought
Currency
amount
bought $'000 Settlement date
Fair
value
$'000
AUD 12,500 USD 9,338 31 July 2017 23
EUR 75,000 USD 84,770 24 July 2017 1,490
1,513
2017
2016
14. LOAN BALANCES 2017 2016
$'000 $'000
Lloyds Bank ‐ 22,208
‐ 22,208
Maturity profile
Due within one year ‐ 22,208
The Company has entered into a multi‐currency loan facility agreement with Lloyds Bank. The original facility size was for $150,000,000 and bears interest of US$ LIBOR/EURIBOR + 330 bps on drawn amounts with leverage of greater than 10% loan to value. During the year, the Company cancelled $70,000,000 of the facility and subsequent to the year end, on 25 July 2017, the Company cancelled a further $30,000,000 of the facility. At a leverage ratio of below 10%, the loan bears interest of US$ LIBOR/EURIBOR +285 bps. A flat 0.9% rate is paid on undrawn amounts.
The facility agreement was amended on 16 June 2014 and is due to expire 31 January 2018. The facility also contains a number of covenants that restrict total leverage and promote asset diversification. Specifically, the Company has the ability to borrow up to 30% of its Total Assets. Furthermore, the asset base from which the Company may borrow funds may be reduced if certain diversity criteria are breached, including geography, investment strategy, investment type, and company and manager concentration limitations. As at 30 June 2017, the Company’s leverage ratio was 9.0 per cent. per the credit agreement and the Company was in compliance with all of the diversification restrictions. The drawn amount of the facility at 30 June 2017 is $Nil (2016: $22,208,000).
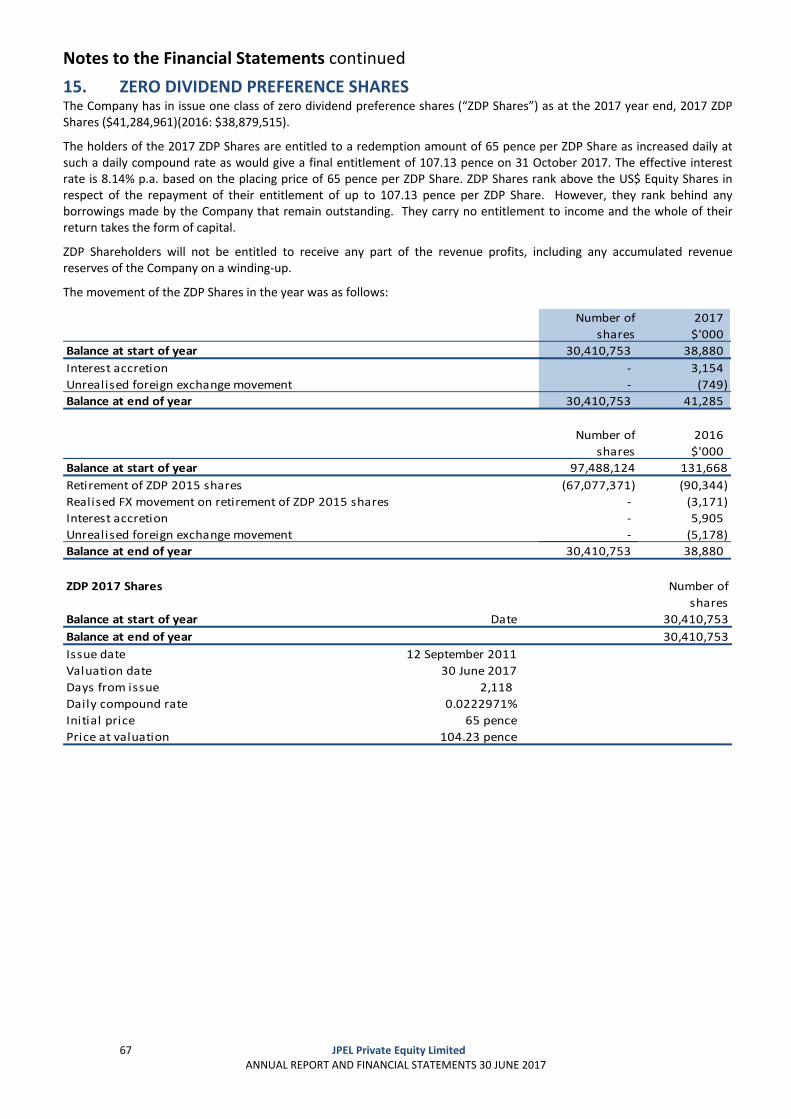
Notes to the Financial Statements continued
67 JPEL Private Equity Limited
ANNUAL REPORT AND FINANCIAL STATEMENTS 30 JUNE 2017
15. ZERO DIVIDEND PREFERENCE SHARES ZDPNOTESTART The Company has in issue one class of zero dividend preference shares (“ZDP Shares”) as at the 2017 year end, 2017 ZDP Shares ($41,284,961)(2016: $38,879,515).
The holders of the 2017 ZDP Shares are entitled to a redemption amount of 65 pence per ZDP Share as increased daily at such a daily compound rate as would give a final entitlement of 107.13 pence on 31 October 2017. The effective interest rate is 8.14% p.a. based on the placing price of 65 pence per ZDP Share. ZDP Shares rank above the US$ Equity Shares in respect of the repayment of their entitlement of up to 107.13 pence per ZDP Share. However, they rank behind any borrowings made by the Company that remain outstanding. They carry no entitlement to income and the whole of their return takes the form of capital.
ZDP Shareholders will not be entitled to receive any part of the revenue profits, including any accumulated revenue reserves of the Company on a winding‐up.
The movement of the ZDP Shares in the year was as follows:
Number of 2017
shares $'000
Balance at start of year 30,410,753 38,880
Interest accretion ‐ 3,154
Unrealised foreign exchange movement ‐ (749)
Balance at end of year 30,410,753 41,285
Number of 2016
shares $'000
Balance at start of year 97,488,124 131,668
Retirement of ZDP 2015 shares (67,077,371) (90,344)
Realised FX movement on retirement of ZDP 2015 shares ‐ (3,171)
Interest accretion ‐ 5,905
Unrealised foreign exchange movement ‐ (5,178)
Balance at end of year 30,410,753 38,880
ZDP 2017 Shares Number of
shares
Balance at start of year Date 30,410,753
Balance at end of year 30,410,753
Issue date 12 September 2011
Valuation date 30 June 2017
Days from issue 2,118
Daily compound rate 0.0222971%
Initial price 65 pence
Price at valuation 104.23 pence
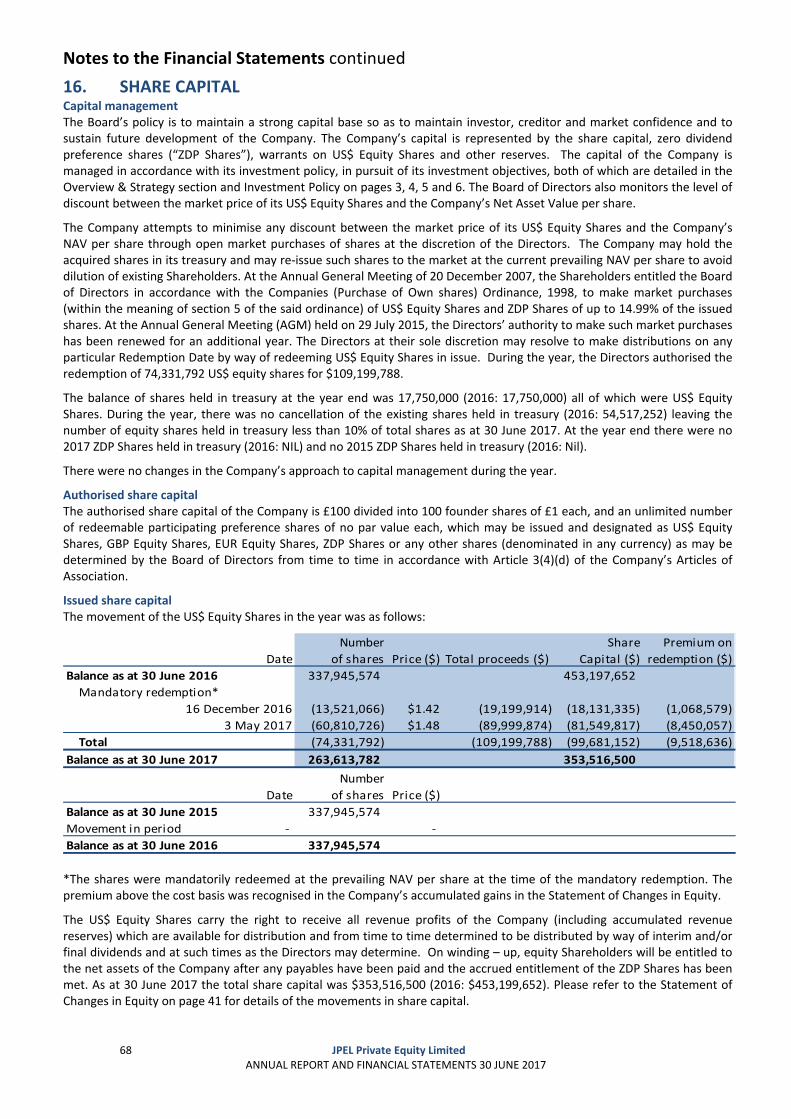
Notes to the Financial Statements continued
68 JPEL Private Equity Limited
ANNUAL REPORT AND FINANCIAL STATEMENTS 30 JUNE 2017
16. SHARE CAPITAL Capital management The Board’s policy is to maintain a strong capital base so as to maintain investor, creditor and market confidence and to sustain future development of the Company. The Company’s capital is represented by the share capital, zero dividend preference shares (“ZDP Shares”), warrants on US$ Equity Shares and other reserves. The capital of the Company is managed in accordance with its investment policy, in pursuit of its investment objectives, both of which are detailed in the Overview & Strategy section and Investment Policy on pages 3, 4, 5 and 6. The Board of Directors also monitors the level of discount between the market price of its US$ Equity Shares and the Company’s Net Asset Value per share.
The Company attempts to minimise any discount between the market price of its US$ Equity Shares and the Company’s NAV per share through open market purchases of shares at the discretion of the Directors. The Company may hold the acquired shares in its treasury and may re‐issue such shares to the market at the current prevailing NAV per share to avoid dilution of existing Shareholders. At the Annual General Meeting of 20 December 2007, the Shareholders entitled the Board of Directors in accordance with the Companies (Purchase of Own shares) Ordinance, 1998, to make market purchases (within the meaning of section 5 of the said ordinance) of US$ Equity Shares and ZDP Shares of up to 14.99% of the issued shares. At the Annual General Meeting (AGM) held on 29 July 2015, the Directors’ authority to make such market purchases has been renewed for an additional year. The Directors at their sole discretion may resolve to make distributions on any particular Redemption Date by way of redeeming US$ Equity Shares in issue. During the year, the Directors authorised the redemption of 74,331,792 US$ equity shares for $109,199,788.
The balance of shares held in treasury at the year end was 17,750,000 (2016: 17,750,000) all of which were US$ Equity Shares. During the year, there was no cancellation of the existing shares held in treasury (2016: 54,517,252) leaving the number of equity shares held in treasury less than 10% of total shares as at 30 June 2017. At the year end there were no 2017 ZDP Shares held in treasury (2016: NIL) and no 2015 ZDP Shares held in treasury (2016: Nil).
There were no changes in the Company’s approach to capital management during the year.
Authorised share capital The authorised share capital of the Company is £100 divided into 100 founder shares of £1 each, and an unlimited number of redeemable participating preference shares of no par value each, which may be issued and designated as US$ Equity Shares, GBP Equity Shares, EUR Equity Shares, ZDP Shares or any other shares (denominated in any currency) as may be determined by the Board of Directors from time to time in accordance with Article 3(4)(d) of the Company’s Articles of Association.
Issued share capital The movement of the US$ Equity Shares in the year was as follows:
Number Share Premium on
Date of shares Price ($) Total proceeds ($) Capital ($) redemption ($)
Balance as at 30 June 2016 337,945,574 453,197,652
Mandatory redemption*
16 December 2016 (13,521,066) $1.42 (19,199,914) (18,131,335) (1,068,579)
3 May 2017 (60,810,726) $1.48 (89,999,874) (81,549,817) (8,450,057)
Total (74,331,792) (109,199,788) (99,681,152) (9,518,636)
Balance as at 30 June 2017 263,613,782 353,516,500
Number
Date of shares Price ($)
Balance as at 30 June 2015 337,945,574
Movement in period ‐ ‐
Balance as at 30 June 2016 337,945,574
*The shares were mandatorily redeemed at the prevailing NAV per share at the time of the mandatory redemption. The premium above the cost basis was recognised in the Company’s accumulated gains in the Statement of Changes in Equity.
The US$ Equity Shares carry the right to receive all revenue profits of the Company (including accumulated revenue reserves) which are available for distribution and from time to time determined to be distributed by way of interim and/or final dividends and at such times as the Directors may determine. On winding – up, equity Shareholders will be entitled to the net assets of the Company after any payables have been paid and the accrued entitlement of the ZDP Shares has been met. As at 30 June 2017 the total share capital was $353,516,500 (2016: $453,199,652). Please refer to the Statement of Changes in Equity on page 41 for details of the movements in share capital.

Notes to the Financial Statements continued
69 JPEL Private Equity Limited
ANNUAL REPORT AND FINANCIAL STATEMENTS 30 JUNE 2017
17. MATERIAL AGREEMENTS On 11 March 2016, JPEL signed an investment management agreement with the Manager, which, other than provisions specifically reflecting the appointment of a new investment manager, is similar to the prior investment management agreement with JPMAM in all material aspects. Accordingly, JPEL has terminated its investment management agreement with JPMAM as of 11 March 2016. With effect from 11 March 2016, JPEL is managed by FCF JPEL Management LLC.
As part of the Fortress Transaction, the investment management team that has been responsible for managing JPEL led by Troy Duncan and Greg Getschow, has transitioned from JPMAM to the Credit business of FIG. There has been no change in the Company’s underlying investment strategy, investment team or investment committee members as a result of the Fortress Transaction.
The Manager, FCF JPEL Management LLC, is entitled to a base management fee, payable monthly in arrears of 1.0% per annum of the Company’s Total Assets. The total management fee due for the year was $5,142,183 (2016: $5,218,823 of which $3,656,332 was paid to JPMAM). The amount payable to the Manager at the end of the year was $386,314 (2016: $443,349).
The Manager is also entitled to a performance fee if the aggregate Net Asset Value of the US$ Equity Shares and the ZDP Shares at the end of the performance period exceeds (i) the aggregate Net Assets at the start of the performance period by more than 8% and (ii) the highest previously recorded aggregate Net Asset Value of Equity and ZDP Shares as at end of performance period of which performance fee was last paid.
The amount of such performance fee will be 7.5% of the total increase in aggregate Net Asset Value above the performance hurdle. The performance fee paid during the year was $NIL (2016: $NIL).
On 8 August 2012, the Guernsey Financial Services Commission approved Augentius (Guernsey) Limited as administrator and company secretary. Augentius (Guernsey) Limited is entitled to an annual fee in respect of accounting, company secretarial, administration and investment tracking services calculated on a flat fee basis of $632,046 per annum. The fee is payable monthly in arrears. Total fees for the year were $717,374 (2016: $714,989). At 30 June 2017 $58,682 (2016: $58,167) was outstanding in respect of administration fees.
On 14 February 2017, Fortress and SoftBank Group Corp, (“SoftBank”) announced that they had entered into a definitive merger agreement under which a limited partnership or other entity (the “Parent”) controlled by SoftBank will acquire Fortress (the “Merger”). The Merger is subject to various closing conditions, and there is no assurance that the Merger will be completed. Following the completion of the Merger, Fortress will operate within SoftBank as an independent business. Fortress’s principals have agreed to continue day‐to‐day management of Fortress, and the Company’s investment advisory arrangement with Fortress is not changing as a result of the Merger. SoftBank and its affiliates have committed to provide sufficient funds to the Parent to complete the Merger. Additional information regarding the Merger is included in the Form 8‐K filed by Fortress with the SEC on 15 February 2017 and the proxy statement pursuant to Section 14(a) of the Securities Exchange Act of 1934, as amended, filed with the SEC on 7 June 2017 (which Form 8‐K and proxy statement do not form part of these financial statements).
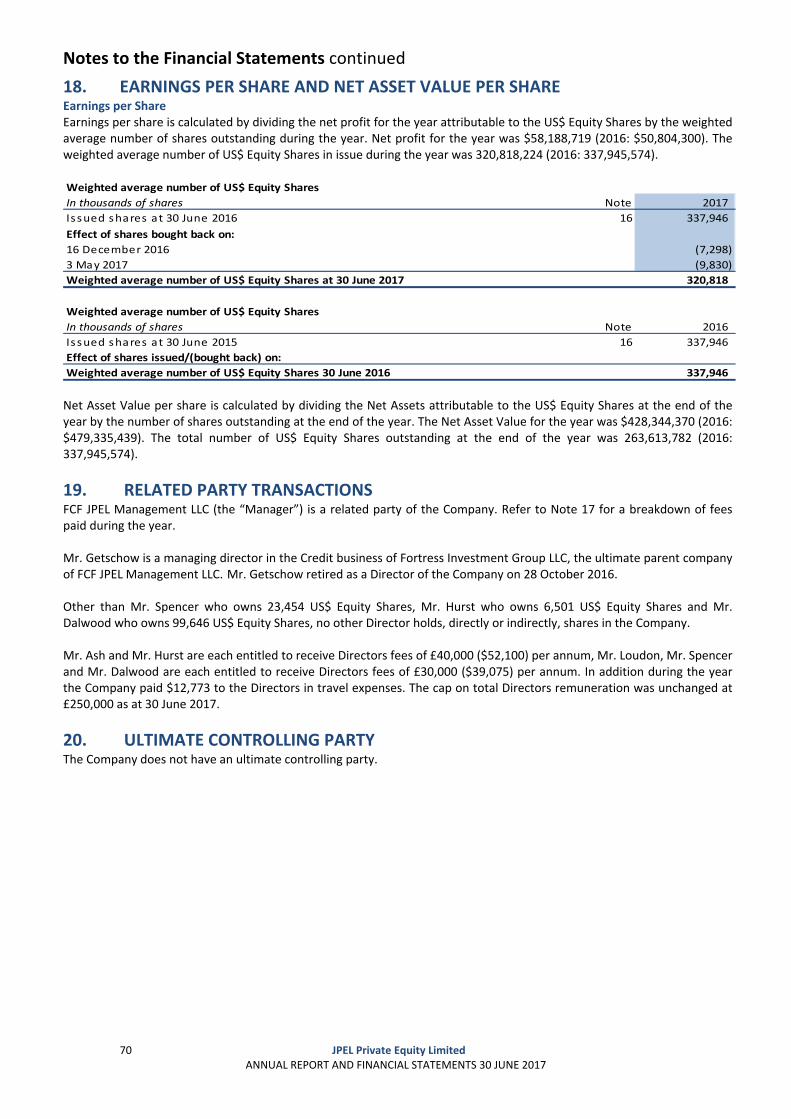
Notes to the Financial Statements continued
70 JPEL Private Equity Limited
ANNUAL REPORT AND FINANCIAL STATEMENTS 30 JUNE 2017
18. EARNINGS PER SHARE AND NET ASSET VALUE PER SHARE Earnings per Share Earnings per share is calculated by dividing the net profit for the year attributable to the US$ Equity Shares by the weighted average number of shares outstanding during the year. Net profit for the year was $58,188,719 (2016: $50,804,300). The weighted average number of US$ Equity Shares in issue during the year was 320,818,224 (2016: 337,945,574).
Weighted average number of US$ Equity Shares
In thousands of shares Note 2017
Issued shares at 30 June 2016 16 337,946
Effect of shares bought back on:
16 December 2016 (7,298)
3 May 2017 (9,830)
Weighted average number of US$ Equity Shares at 30 June 2017 320,818
Weighted average number of US$ Equity Shares
In thousands of shares Note 2016
Issued shares at 30 June 2015 16 337,946
Effect of shares issued/(bought back) on:
Weighted average number of US$ Equity Shares 30 June 2016 337,946
Net Asset Value per share is calculated by dividing the Net Assets attributable to the US$ Equity Shares at the end of the year by the number of shares outstanding at the end of the year. The Net Asset Value for the year was $428,344,370 (2016: $479,335,439). The total number of US$ Equity Shares outstanding at the end of the year was 263,613,782 (2016: 337,945,574).
19. RELATED PARTY TRANSACTIONS FCF JPEL Management LLC (the “Manager”) is a related party of the Company. Refer to Note 17 for a breakdown of fees paid during the year. Mr. Getschow is a managing director in the Credit business of Fortress Investment Group LLC, the ultimate parent company of FCF JPEL Management LLC. Mr. Getschow retired as a Director of the Company on 28 October 2016. Other than Mr. Spencer who owns 23,454 US$ Equity Shares, Mr. Hurst who owns 6,501 US$ Equity Shares and Mr. Dalwood who owns 99,646 US$ Equity Shares, no other Director holds, directly or indirectly, shares in the Company. Mr. Ash and Mr. Hurst are each entitled to receive Directors fees of £40,000 ($52,100) per annum, Mr. Loudon, Mr. Spencer and Mr. Dalwood are each entitled to receive Directors fees of £30,000 ($39,075) per annum. In addition during the year the Company paid $12,773 to the Directors in travel expenses. The cap on total Directors remuneration was unchanged at £250,000 as at 30 June 2017.
20. ULTIMATE CONTROLLING PARTY The Company does not have an ultimate controlling party.

Notes to the Financial Statements continued
71 JPEL Private Equity Limited
ANNUAL REPORT AND FINANCIAL STATEMENTS 30 JUNE 2017
21. POST BALANCE SHEET EVENTS Subsequent to the year end, on 25 July 2017, JPEL cancelled a further $30 million of its $80 million Lloyds Credit Facility resulting in an annual saving of $270,000.
JPEL’s investment in a SaaS Provider has been adjusted to reflect estimated sale proceeds. The sale is expected to close after JPEL’s fiscal year end.
The Directors are not aware of any other post balance sheet events which require disclosure in the financial statements.
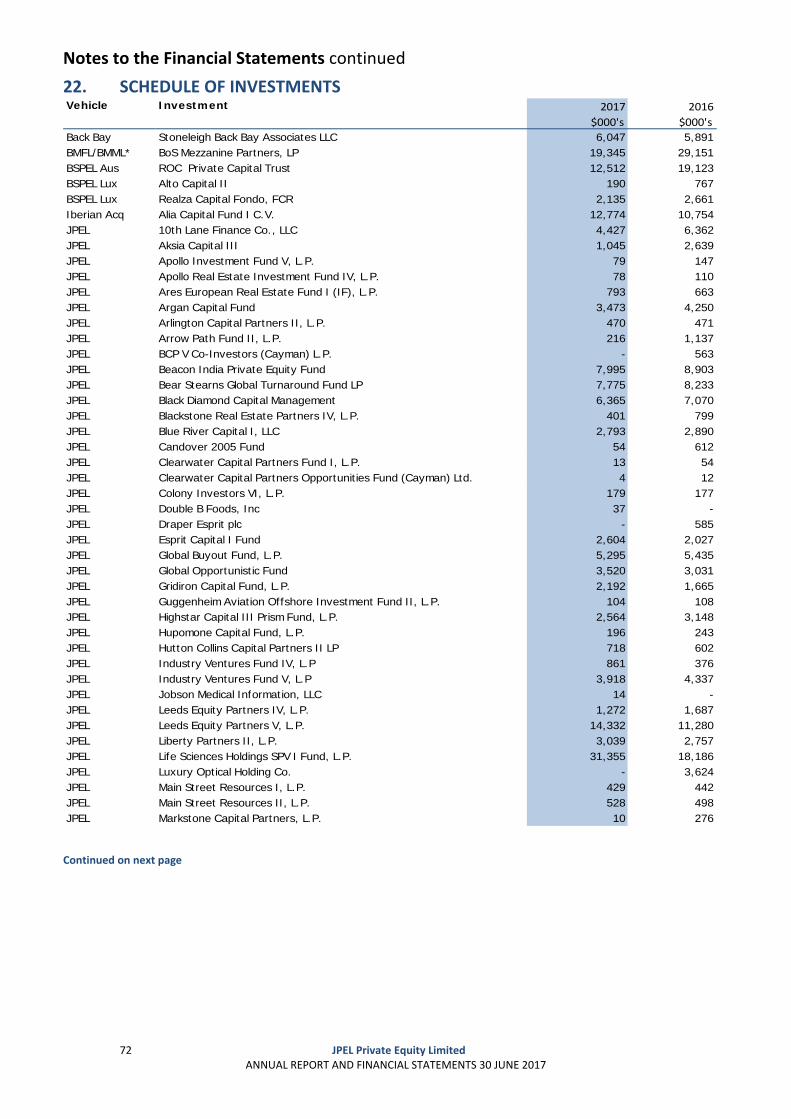
Notes to the Financial Statements continued
72 JPEL Private Equity Limited
ANNUAL REPORT AND FINANCIAL STATEMENTS 30 JUNE 2017
22. SCHEDULE OF INVESTMENTS Investment 2017 2016
$000's $000's
Back Bay Stoneleigh Back Bay Associates LLC 6,047 5,891BMFL/BMML* BoS Mezzanine Partners, LP 19,345 29,151BSPEL Aus ROC Private Capital Trust 12,512 19,123BSPEL Lux Alto Capital II 190 767BSPEL Lux Realza Capital Fondo, FCR 2,135 2,661Iberian Acq Alia Capital Fund I C.V. 12,774 10,754JPEL 10th Lane Finance Co., LLC 4,427 6,362JPEL Aksia Capital III 1,045 2,639JPEL Apollo Investment Fund V, L.P. 79 147JPEL Apollo Real Estate Investment Fund IV, L.P. 78 110JPEL Ares European Real Estate Fund I (IF), L.P. 793 663JPEL Argan Capital Fund 3,473 4,250JPEL Arlington Capital Partners II, L.P. 470 471JPEL Arrow Path Fund II, L.P. 216 1,137JPEL BCP V Co-Investors (Cayman) L.P. - 563JPEL Beacon India Private Equity Fund 7,995 8,903JPEL Bear Stearns Global Turnaround Fund LP 7,775 8,233JPEL Black Diamond Capital Management 6,365 7,070JPEL Blackstone Real Estate Partners IV, L.P. 401 799JPEL Blue River Capital I, LLC 2,793 2,890JPEL Candover 2005 Fund 54 612JPEL Clearwater Capital Partners Fund I, L.P. 13 54JPEL Clearwater Capital Partners Opportunities Fund (Cayman) Ltd. 4 12JPEL Colony Investors VI, L.P. 179 177JPEL Double B Foods, Inc 37 -JPEL Draper Esprit plc - 585JPEL Esprit Capital I Fund 2,604 2,027JPEL Global Buyout Fund, L.P. 5,295 5,435JPEL Global Opportunistic Fund 3,520 3,031JPEL Gridiron Capital Fund, L.P. 2,192 1,665JPEL Guggenheim Aviation Offshore Investment Fund II, L.P. 104 108JPEL Highstar Capital III Prism Fund, L.P. 2,564 3,148JPEL Hupomone Capital Fund, L.P. 196 243JPEL Hutton Collins Capital Partners II LP 718 602JPEL Industry Ventures Fund IV, L.P 861 376JPEL Industry Ventures Fund V, L.P 3,918 4,337JPEL Jobson Medical Information, LLC 14 -JPEL Leeds Equity Partners IV, L.P. 1,272 1,687JPEL Leeds Equity Partners V, L.P. 14,332 11,280JPEL Liberty Partners II, L.P. 3,039 2,757JPEL Life Sciences Holdings SPV I Fund, L.P. 31,355 18,186JPEL Luxury Optical Holding Co. - 3,624JPEL Main Street Resources I, L.P. 429 442JPEL Main Street Resources II, L.P. 528 498JPEL Markstone Capital Partners, L.P. 10 276
Vehicle
Continued on next page
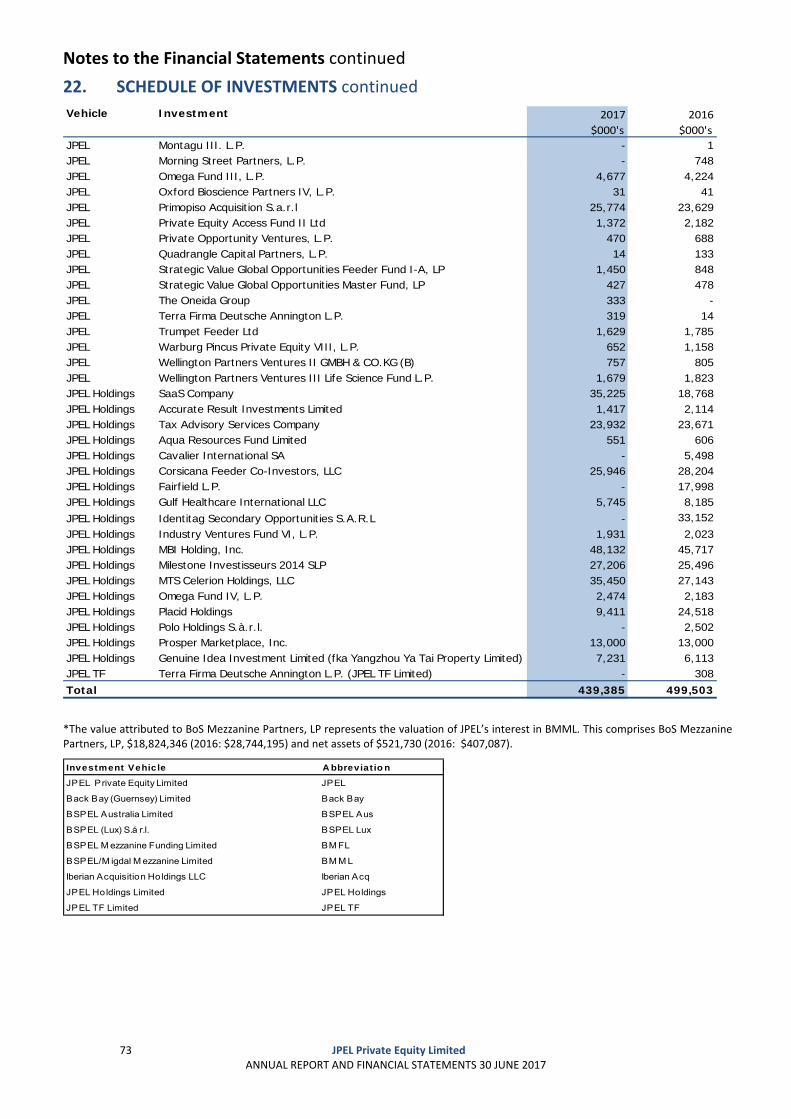
Notes to the Financial Statements continued
73 JPEL Private Equity Limited
ANNUAL REPORT AND FINANCIAL STATEMENTS 30 JUNE 2017
22. SCHEDULE OF INVESTMENTS continued
Investment 2017 2016
$000's $000's
JPEL Montagu III. L.P. - 1JPEL Morning Street Partners, L.P. - 748JPEL Omega Fund III, L.P. 4,677 4,224JPEL Oxford Bioscience Partners IV, L.P. 31 41JPEL Primopiso Acquisition S.a.r.l 25,774 23,629JPEL Private Equity Access Fund II Ltd 1,372 2,182JPEL Private Opportunity Ventures, L.P. 470 688JPEL Quadrangle Capital Partners, L.P. 14 133JPEL Strategic Value Global Opportunities Feeder Fund I-A, LP 1,450 848JPEL Strategic Value Global Opportunities Master Fund, LP 427 478JPEL The Oneida Group 333 -JPEL Terra Firma Deutsche Annington L.P. 319 14JPEL Trumpet Feeder Ltd 1,629 1,785JPEL Warburg Pincus Private Equity VIII, L.P. 652 1,158JPEL Wellington Partners Ventures II GMBH & CO.KG (B) 757 805JPEL Wellington Partners Ventures III Life Science Fund L.P. 1,679 1,823JPEL Holdings SaaS Company 35,225 18,768JPEL Holdings Accurate Result Investments Limited 1,417 2,114JPEL Holdings Tax Advisory Services Company 23,932 23,671JPEL Holdings Aqua Resources Fund Limited 551 606JPEL Holdings Cavalier International SA - 5,498JPEL Holdings Corsicana Feeder Co-Investors, LLC 25,946 28,204JPEL Holdings Fairfield L.P. - 17,998JPEL Holdings Gulf Healthcare International LLC 5,745 8,185JPEL Holdings Identitag Secondary Opportunities S.A.R.L - 33,152JPEL Holdings Industry Ventures Fund VI, L.P. 1,931 2,023JPEL Holdings MBI Holding, Inc. 48,132 45,717JPEL Holdings Milestone Investisseurs 2014 SLP 27,206 25,496JPEL Holdings MTS Celerion Holdings, LLC 35,450 27,143JPEL Holdings Omega Fund IV, L.P. 2,474 2,183JPEL Holdings Placid Holdings 9,411 24,518JPEL Holdings Polo Holdings S.à.r.l. - 2,502JPEL Holdings Prosper Marketplace, Inc. 13,000 13,000JPEL Holdings Genuine Idea Investment Limited (fka Yangzhou Ya Tai Property Limited) 7,231 6,113JPEL TF Terra Firma Deutsche Annington L.P. (JPEL TF Limited) - 308Total 439,385 499,503
Vehicle
*The value attributed to BoS Mezzanine Partners, LP represents the valuation of JPEL’s interest in BMML. This comprises BoS Mezzanine Partners, LP, $18,824,346 (2016: $28,744,195) and net assets of $521,730 (2016: $407,087).
Investment Vehicle A bbreviat io n
JPEL Private Equity Limited JPEL
Back Bay (Guernsey) Limited Back Bay
BSPEL Australia Limited BSPEL Aus
BSPEL (Lux) S.á r.l. BSPEL Lux
BSPEL M ezzanine Funding Limited BM FL
BSPEL/M igdal M ezzanine Limited BM M L
Iberian Acquisition Holdings LLC Iberian Acq
JPEL Holdings Limited JPEL Holdings
JPEL TF Limited JPEL TF
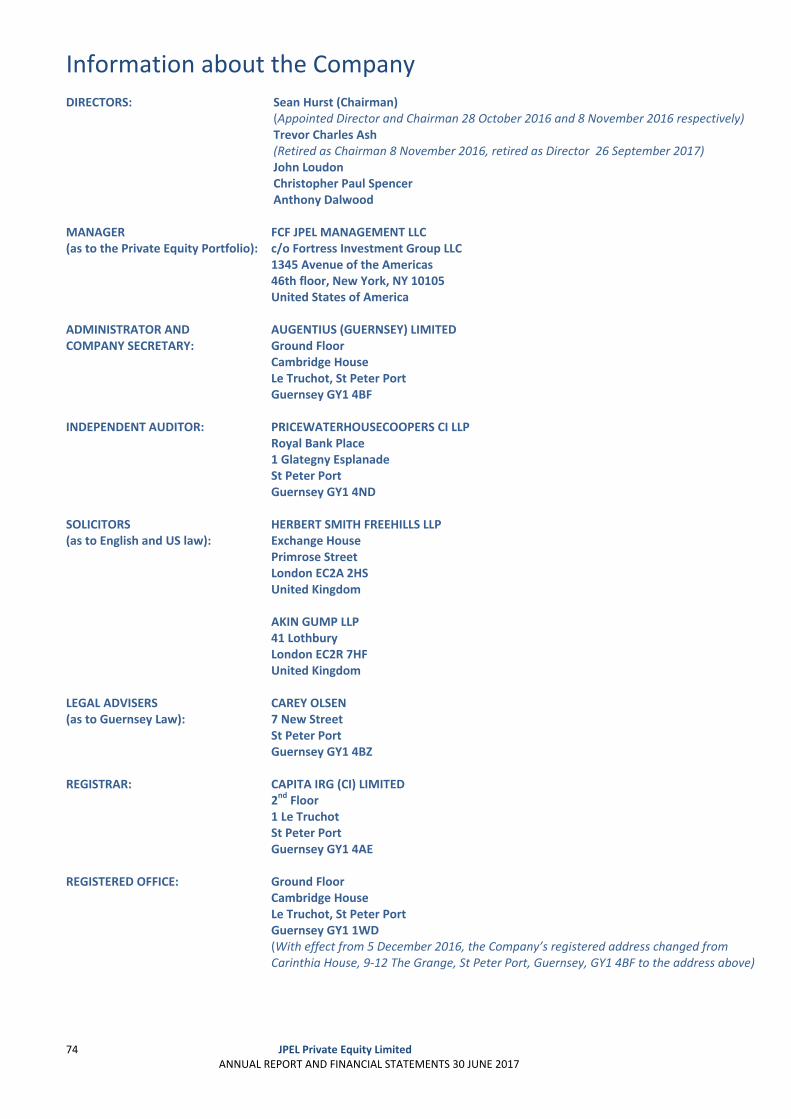
Information about the Company
74 JPEL Private Equity Limited
ANNUAL REPORT AND FINANCIAL STATEMENTS 30 JUNE 2017
DIRECTORS: Sean Hurst (Chairman)(Appointed Director and Chairman 28 October 2016 and 8 November 2016 respectively) Trevor Charles Ash (Retired as Chairman 8 November 2016, retired as Director 26 September 2017) John Loudon Christopher Paul Spencer Anthony Dalwood
MANAGER (as to the Private Equity Portfolio):
FCF JPEL MANAGEMENT LLCc/o Fortress Investment Group LLC 1345 Avenue of the Americas 46th floor, New York, NY 10105 United States of America
ADMINISTRATOR AND COMPANY SECRETARY:
AUGENTIUS (GUERNSEY) LIMITEDGround Floor Cambridge House Le Truchot, St Peter Port Guernsey GY1 4BF
INDEPENDENT AUDITOR: PRICEWATERHOUSECOOPERS CI LLPRoyal Bank Place 1 Glategny Esplanade St Peter Port Guernsey GY1 4ND
SOLICITORS (as to English and US law):
HERBERT SMITH FREEHILLS LLPExchange House Primrose Street London EC2A 2HS United Kingdom AKIN GUMP LLP 41 Lothbury London EC2R 7HF United Kingdom
LEGAL ADVISERS (as to Guernsey Law):
CAREY OLSEN7 New Street St Peter Port Guernsey GY1 4BZ
REGISTRAR: CAPITA IRG (CI) LIMITED2nd Floor 1 Le Truchot St Peter Port Guernsey GY1 4AE
REGISTERED OFFICE: Ground FloorCambridge House Le Truchot, St Peter Port Guernsey GY1 1WD (With effect from 5 December 2016, the Company’s registered address changed from Carinthia House, 9‐12 The Grange, St Peter Port, Guernsey, GY1 4BF to the address above)

JPEL Private Equity Limited Ground FloorCambridge House Le Truchot, St Peter PortGuernsey GY1 1WD